

Synthesis and Spectroelectrochemical Investigation of Anodic Black TiOx Nanotubes


Abstract
:1. Introduction
2. Materials and Methods
2.1. Electrochemical Synthesis of TiO2 Nanotubes
2.2. Electrochemical Reduction of TiO2 Nanotubes
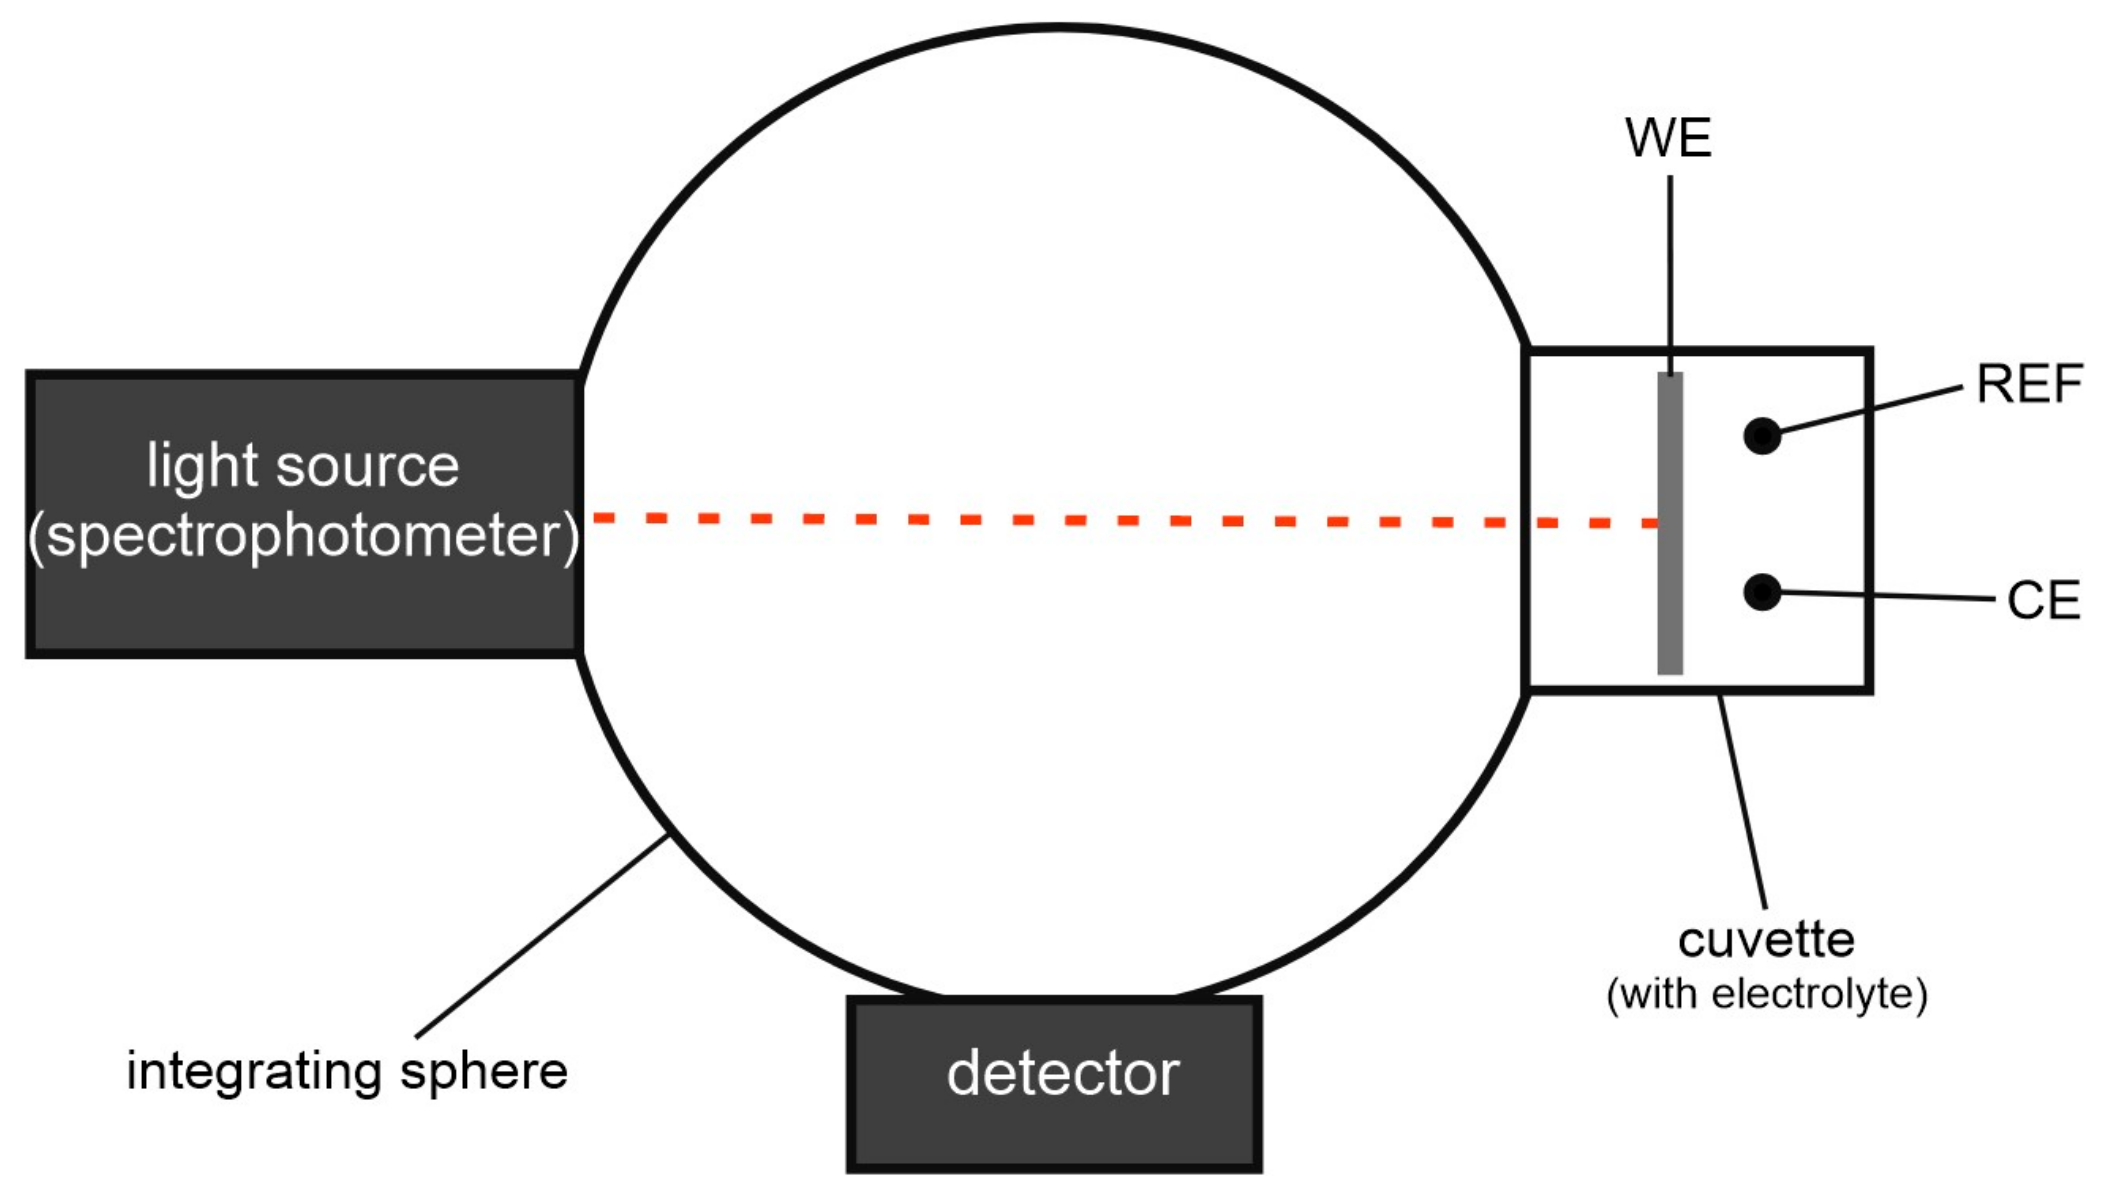
2.3. Spectroelectrochemical and Photoelectrochemical Measurements
3. Results and Discussion
4. Conclusions
Author Contributions
Funding
Data Availability Statement
Acknowledgments
Conflicts of Interest
Appendix A
References
- Liu, Y.; Yang, Y. Recent progress of TiO2-based anodes for Li ion batteries. J. Nanomater. 2016, 2016, 8123652. [Google Scholar] [CrossRef] [Green Version]
- Liu, X.; Carvalho, P.; Getz, M.N.; Norby, T.; Chatzitakis, A. Black anatase TiO2 nanotubes with tunable orientation for high performancesupercapacitors. J. Phys. Chem. C 2019, 123, 21931–21940. [Google Scholar] [CrossRef]
- Plodinec, M.; Grčić, I.; Willinger, M.G.; Hammud, A.; Huang, X.; Panžić, I.; Gajović, A. Black TiO2 nanotube arrays decorated with Ag nanoparticles for enhanced visible-light photocatalytic oxidation of salicylic acid. J. Alloys Compd. 2019, 776, 883–896. [Google Scholar] [CrossRef]
- Li, H.; Chen, Z.; Tsang, C.K.; Li, Z.; Ran, X.; Lee, C.; Nie, B.; Zheng, L.; Hung, T.; Lu, J.; et al. Electrochemical doping of anatase TiO2 in organic electrolytes for high-performance supercapacitors and photocatalysts. J. Mater. Chem. A 2014, 2, 229–236. [Google Scholar] [CrossRef]
- Liu, N.; Schneider, C.; Freitag, D.; Hartmann, M.; Venkatesan, U.; Müller, J.; Spiecker, E.; Schmuki, P. Black TiO2 nanotubes: Cocatalyst-free open-circuit hydrogen generation. Nano Lett. 2014, 14, 3309–3313. [Google Scholar] [CrossRef]
- Liu, N.; Häublein, V.; Zhou, X.; Venkatesan, U.; Hartmann, M.; Mačković, M.; Nakajima, T.; Spiecker, E.; Osvet, A.; Frey, L.; et al. “Black” TiO2 nanotubes formed by high-energy proton implantation show noble-metal- co-catalyst free photocatalytic H2-evolution. Nano Lett. 2015, 15, 6815–6820. [Google Scholar] [CrossRef] [Green Version]
- Chen, X.; Mao, S.S. Titanium dioxide nanomaterials: Synthesis, properties,modifications, and applications. Chem. Rev. 2007, 107, 2891–2959. [Google Scholar] [CrossRef]
- Lopez, T.; Sanchez, E.; Bosch, P.; Meas, Y.; Gomez, R. FTIR and UV-Vis (diffuse reflectance) spectroscopic characterization of TiO2 sol-gel. Mater. Chem. Phys. 1992, 32, 141–152. [Google Scholar] [CrossRef]
- Sulka, G.D.; Kapusta-Kołodziej, J.; Brzózka, A.; Jaskuła, M. Fabrication of nanoporous TiO2 by electrochemical anodization. Electrochim. Acta 2010, 55, 4359–4367. [Google Scholar] [CrossRef]
- Asahi, R.; Taga, Y.; Mannstadt, W.; Freeman, A.J. Electronic and optical properties of anatase TiO2. Phys. Rev. B 2000, 61, 7459–7465. [Google Scholar] [CrossRef]
- Li, Z.; Bian, H.; Xiao, X.; Shen, J.; Zhao, C.; Lu, J.; Li, Y.Y. Defective black TiO2 nanotube arrays for enhanced photocatalytic and photoelectrochemical applications. ACS Appl. Nano Mater. 2019, 2, 7372–7378. [Google Scholar] [CrossRef]
- Liqiang, J.; Honggang, F.; Baiqi, W.; Dejun, W.; Baifu, X.; Shudan, L.; Jiazhong, S. Effects of Sn dopant on the photoinduced charge property and photocatalytic activity of TiO2 nanoparticles. Appl. Catal. B 2006, 62, 282–291. [Google Scholar] [CrossRef]
- Choudhury, B.; Dey, M.; Choudhury, A. Defect generation, d-d transition, and band gap reduction in Cu-doped TiO2 nanoparticles. Int. Nano Lett. 2013, 3, 25. [Google Scholar] [CrossRef] [Green Version]
- Radecka, M.; Wierzbicka, M.; Komornicki, S.; Rekas, M. Influence of Cr on photoelectrochemical properties of TiO2 thin films. Phys. B: Condens. Matter. 2004, 348, 160–168. [Google Scholar] [CrossRef]
- Zhang, X.; Tian, H.; Wang, X.; Xue, G.; Tian, Z.; Zhang, J.; Yuan, S.; Yu, T.; Zou, Z. The role of oxygen vacancy-Ti3+ states on TiO2 nanotubes surface in dye-sensitized solar cells. Mater. Lett. 2013, 100, 51–53. [Google Scholar] [CrossRef]
- Huo, H.; Xu, Z.; Zhang, T.; Xu, C. Ni/CdS/TiO2 nanotube array heterostructures for high performance photoelectrochemical biosensing. J. Mater. Chem. A 2015, 3, 5882–5888. [Google Scholar] [CrossRef]
- Chen, X.; Liu, L.; Huang, F. Black titanium dioxide (TiO2) nanomaterials. Chem. Soc. Rev. 2015, 44, 1861–1885. [Google Scholar] [CrossRef]
- Çakıroğlu, B.; Özacar, M. Efficient chemiluminescence harnessing via slow photons in sensitized TiO2 nanotubes for the photoelectrochemical biosensing. J. Electroanal. Chem. 2020, 878, 114676. [Google Scholar] [CrossRef]
- Wang, B.; Shen, S.; Mao, S.S. Black TiO2 for solar hydrogen conversion. J. Materiomics 2017, 3, 96–111. [Google Scholar] [CrossRef]
- Yang, Y.; Hoffmann, M.R. Synthesis and stabilization of blue-black TiO2 nanotube arrays for electrochemical oxidant generation and wastewater treatment. Environ. Sci. Technol. 2016, 50, 11888–11894. [Google Scholar] [CrossRef] [Green Version]
- Zhang, X.; Hu, W.; Zhang, K.; Wang, J.; Sun, B.; Li, H.; Qiao, P.; Wang, L.; Zhou, W. Ti 3+ self-doped black TiO2 nanotubes with mesoporous nanosheet architecture as efficient solar-driven hydrogenevolution photocatalysts. ACS Sustain. Chem. Eng. 2017, 5, 6894–6901. [Google Scholar] [CrossRef]
- Wang, Z.; Yang, C.; Lin, T.; Yin, H.; Chen, P.; Wan, D.; Xu, F.; Huang, F.; Lin, J.; Xie, X.; et al. H-doped black titania with very high solar absorption and excellent photocatalysis enhanced bylocalized surface plasmon resonance. Adv. Funct. Mater. 2013, 23, 5444–5450. [Google Scholar] [CrossRef]
- Yu, P.Y.; Cardona, M. Fundamentals of Semiconductors; Springer: Berlin/Heidelberg, Germany, 2010. [Google Scholar]
- di Valentin, C.; Pacchioni, G.; Selloni, A. Reduced and n-type doped TiO2 : Nature of Ti3+ species. J. Phys. Chem. C 2009, 113, 20543–20552. [Google Scholar] [CrossRef]
- Fang, W.; Xing, M.; Zhang, J. A new approach to prepare Ti3+ self-doped TiO2 via NaBH4 reduction and hydrochloric acid treatment. Appl. Catal. B 2014, 160–161, 240–246. [Google Scholar] [CrossRef]
- Yin, H.; Lin, T.; Yang, C.; Wang, Z.; Zhu, G.; Xu, T.; Xie, X.; Huang, F.; Jiang, M. Gray TiO2 nanowires synthesized by aluminum-mediated reduction and their excellent photocatalytic activity for water cleaning. Eur. J. Chem. 2013, 19, 13313–13316. [Google Scholar] [CrossRef] [PubMed]
- Meekins, B.H.; Kamat, P.V. Got TiO2 nanotubes? Lithium ion intercalation can boost their photoelectrochemical performance. ACS Nano 2009, 3, 3437–3446. [Google Scholar] [CrossRef]
- Song, W.; Luo, H.; Hanson, K.; Concepcion, J.J.; Brennaman, M.K.; Meyer, T.J. Visualization of cation diffusion at the TiO2 interface in dye sensitized photoelectrosynthesis cells (DSPEC). Energy Environ. Sci. 2013, 6, 1240. [Google Scholar] [CrossRef]
- Blitz, J. Diffuse Reflectance Spectroscopy. In Modern Techniques in Applied Molecular Spectroscopy; Mirabella, F., Ed.; John Wiley Sons Inc.: Hoboken, NJ, USA, 1998; pp. 185–219. [Google Scholar]
- Kortüm, G.; Braun, W.; Herzog, G. Principles and techniques of diffuse-reflectance spectroscopy. Angew. Chem. Int. Ed. 1963, 2, 333–341. [Google Scholar] [CrossRef]
- Christy, A.A.; Kvalheim, O.M.; Velapoldi, R.A. Quantitative analysis in diffuse reflectance spectrometry: A modified Kubelka-Munk equation. Vib. Spectrosc. 1995, 9, 19–27. [Google Scholar] [CrossRef]
- Mishra, V.; Warshi, M.K.; Sati, A.; Kumar, A.; Mishra, V.; Kumar, R.; Sagdeo, P.R. Investigation of temperature-dependent optical properties of TiO2 using diffuse reflectance spectroscopy. SN Appl. Sci. 2019, 1, 241. [Google Scholar] [CrossRef] [Green Version]
- Tauc, J.; Grigorovici, R.; Vancu, A. Optical properties and electronic structure of amorphous germanium. Phys. Status Solidi B 1966, 15, 627–637. [Google Scholar] [CrossRef]
- Zanatta, A.R. Revisiting the optical bandgap of semiconductors and the proposal of a unified methodology to its determination. Sci. Rep. 2019, 9, 11225. [Google Scholar] [CrossRef] [PubMed] [Green Version]
- Pigoń, K.; Ruziewicz, Z. Chemia Fizyczna; Wydawnictwo Naukowe PWN: Warszawa, Poland, 1993. [Google Scholar]
- Mortimer, R.J. Spectroelectrochemistry, Methods and Instrumentation. In Encyclopedia of Spectroscopy and Spectrometry; Elsevier: Amsterdam, The Netherlands, 2018. [Google Scholar]
- Kobielusz, M.; Pilarczyk, K.; Świętek, E.; Szaciłowski, K.; Macyk, W. Spectroelectrochemical analysis of TiO2 electronic states—Implications for the photocatalytic activity of anatase and rutile. Catal. Today 2018, 309, 35–42. [Google Scholar] [CrossRef]
- Świętek, E.; Pilarczyk, K.; Derdzińska, J.; Szaciłowski, K.; Macyk, W. Redox characterization of semiconductors based on electrochemical measurements combined with UV-Vis diffuse reflectance spectroscopy. Phys. Chem. Chem. Phys. 2013, 15, 14256. [Google Scholar] [CrossRef]
- Buchalska, M.; Kobielusz, M.; Matuszek, A.; Pacia, M.; Wojtyła, S.; Macyk, W. On oxygen activation atrutile- and anatase-TiO2. ACS Catal. 2015, 5, 7424–7431. [Google Scholar] [CrossRef]
- Jarosz, M.; Kapusta-Kołodziej, J.; Jaskuła, M.; Sulka, G.D. Effect of different polishing methods on anodic titanium dioxideformation. J. Nanomater. 2015, 2015, 295126. [Google Scholar] [CrossRef] [Green Version]
- Nair, R.V.; Gummaluri, V.S.; Matham, M.V.; Vijayan, C. A review on optical bandgap engineering in TiO2 nanostructures via doping and intrinsic vacancy modulation towards visible light applications. J. Phys. D Appl. Phys. 2022, 55, 313003. [Google Scholar] [CrossRef]
- Jedsukontorn, T.; Ueno, T.; Saito, N.; Hunsom, M. Narrowing band gap energy of defective black TiO2 fabricated by solution plasma process and its photocatalytic activity on glycerol transformation. J. Alloys Compd. 2018, 757, 188–199. [Google Scholar] [CrossRef]
- Khan, M.E.; Khan, M.M.; Min, B.K.; Cho, M.H. Microbial fuel cell assisted band gap narrowed TiO2 for visible light-induced photocatalytic activities and power generation. Sci. Rep. 2018, 8, 1723. [Google Scholar] [CrossRef] [Green Version]
- Naldoni, A.; Allieta, M.; Santangelo, S.; Marelli, M.; Fabbri, F.; Cappelli, S.; Bianchi, C.L.; Psaro, R.; Dal Santo, V. Effect of nature and location of defects on bandgap narrowing in black TiO2 nanoparticles. J. Am. Chem. Soc. 2012, 134, 7600–7603. [Google Scholar] [CrossRef]
- Song, Y.-Y.; Schmuki, P. Modulated TiO2 nanotube stacks and their use in interference sensors. Electrochem. Commun. 2010, 12, 579–582. [Google Scholar] [CrossRef]
- Hagfeldt, A.; Lindström, H.; Södergren, S.; Lindquist, S.-E. Photoelectrochemical studies of colloidal TiO2 films: The effect of oxygen studied by photocurrent transients. J. Electroanal. Chem. 1995, 381, 39–46. [Google Scholar] [CrossRef]
- Tafalla, D.; Salvador, P.; Benito, R.M. Kinetic approach to the photocurrent transients in water photoelectrolysis at n-TiO2 electrodes: II. Analysis of the photocurrent-time dependence. J. Electrochem. Soc. 1990, 137, 1810–1815. [Google Scholar] [CrossRef]
- Rothenberger, G.; Fitzmaurice, D.; Gratzel, M. Spectroscopy of conduction band electrons in transparent metal oxide semiconductor films: Optical determination of the flatband potential of colloidal titanium dioxide films. J. Phys. Chem. 1992, 96, 5983–5986. [Google Scholar] [CrossRef]


| Sample Label | Electrolyte | Voltage (V) | Time (min) |
|---|---|---|---|
| A | Glycerol-H2O (vol. 1:1) + 0.27 wt.% NH4F | 5 | 60 |
| B | Glycerol-H2O (vol. 1:1) + 0.27 wt.% NH4F | 5 | 5 |
| C | Glycerol-H2O (vol. 3:1) + 0.13 wt.% NH4F | 5 | 5 |
| D | Glycerol-H2O (vol. 3:1) + 0.13 wt.% NH4F | 2 | 5 |
| E | Glycerol-H2O (vol. 50:1) + 0.27 wt.% NH4F | 5 | 10 |
| F | Glycerol-H2O (vol. 50:1) + 0.27 wt.% NH4F | 8 | 15 |
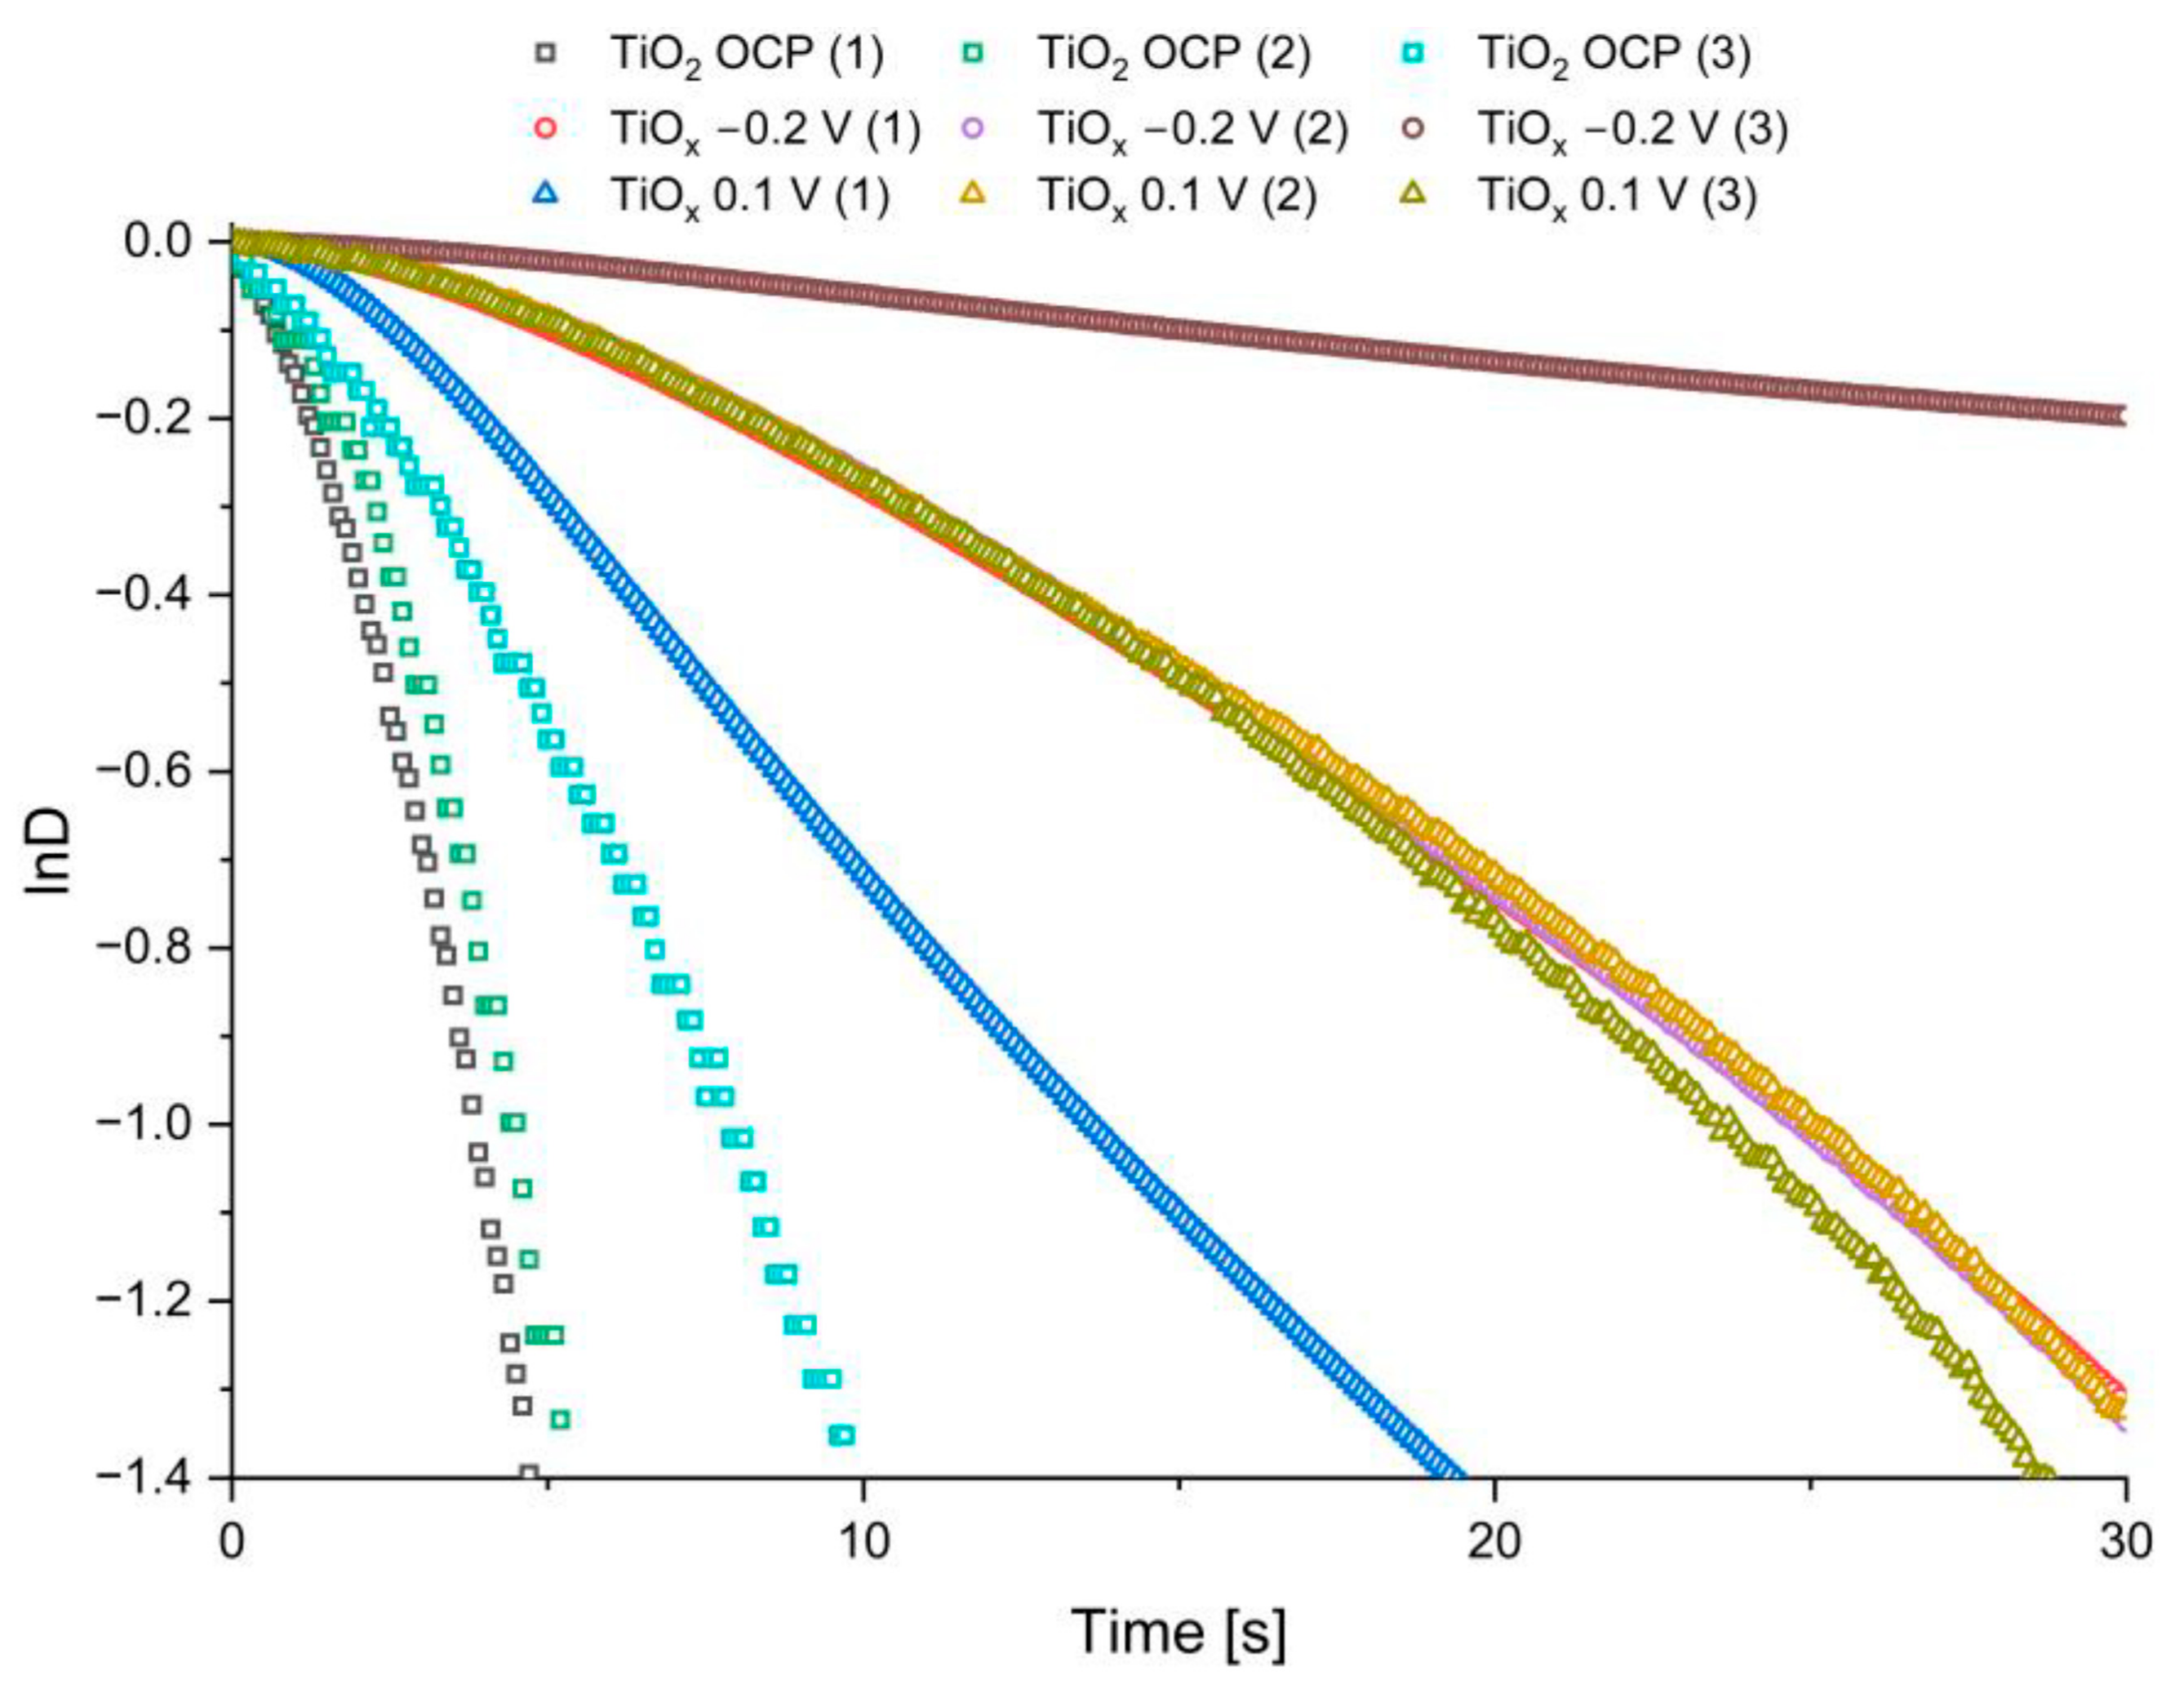
| Shutter Opening Number | τ (s) | ||
|---|---|---|---|
| TiO2 | TiOx (at 1.0 V) | TiOx (at −0.2 V) | |
| 1 | 3.86 | 13.67 | 24.88 |
| 2 | 4.51 | 25.04 | 24.87 |
| 3 | 7.88 | 23.76 | - |
Disclaimer/Publisher’s Note: The statements, opinions and data contained in all publications are solely those of the individual author(s) and contributor(s) and not of MDPI and/or the editor(s). MDPI and/or the editor(s) disclaim responsibility for any injury to people or property resulting from any ideas, methods, instructions or products referred to in the content. |
© 2023 by the authors. Licensee MDPI, Basel, Switzerland. This article is an open access article distributed under the terms and conditions of the Creative Commons Attribution (CC BY) license (https://creativecommons.org/licenses/by/4.0/).
Share and Cite
Kotarba, S.; Sulka, G.D.; Syrek, K. Synthesis and Spectroelectrochemical Investigation of Anodic Black TiOx Nanotubes. Nanomaterials 2023, 13, 931. https://doi.org/10.3390/nano13050931
Kotarba S, Sulka GD, Syrek K. Synthesis and Spectroelectrochemical Investigation of Anodic Black TiOx Nanotubes. Nanomaterials. 2023; 13(5):931. https://doi.org/10.3390/nano13050931
Chicago/Turabian StyleKotarba, Sebastian, Grzegorz D. Sulka, and Karolina Syrek. 2023. "Synthesis and Spectroelectrochemical Investigation of Anodic Black TiOx Nanotubes" Nanomaterials 13, no. 5: 931. https://doi.org/10.3390/nano13050931