
Enhancing the Performance of the Photonic Integrated Sensing System by Applying Frequency Interrogation
 , , , , ,
  and
and
Abstract
:1. Introduction
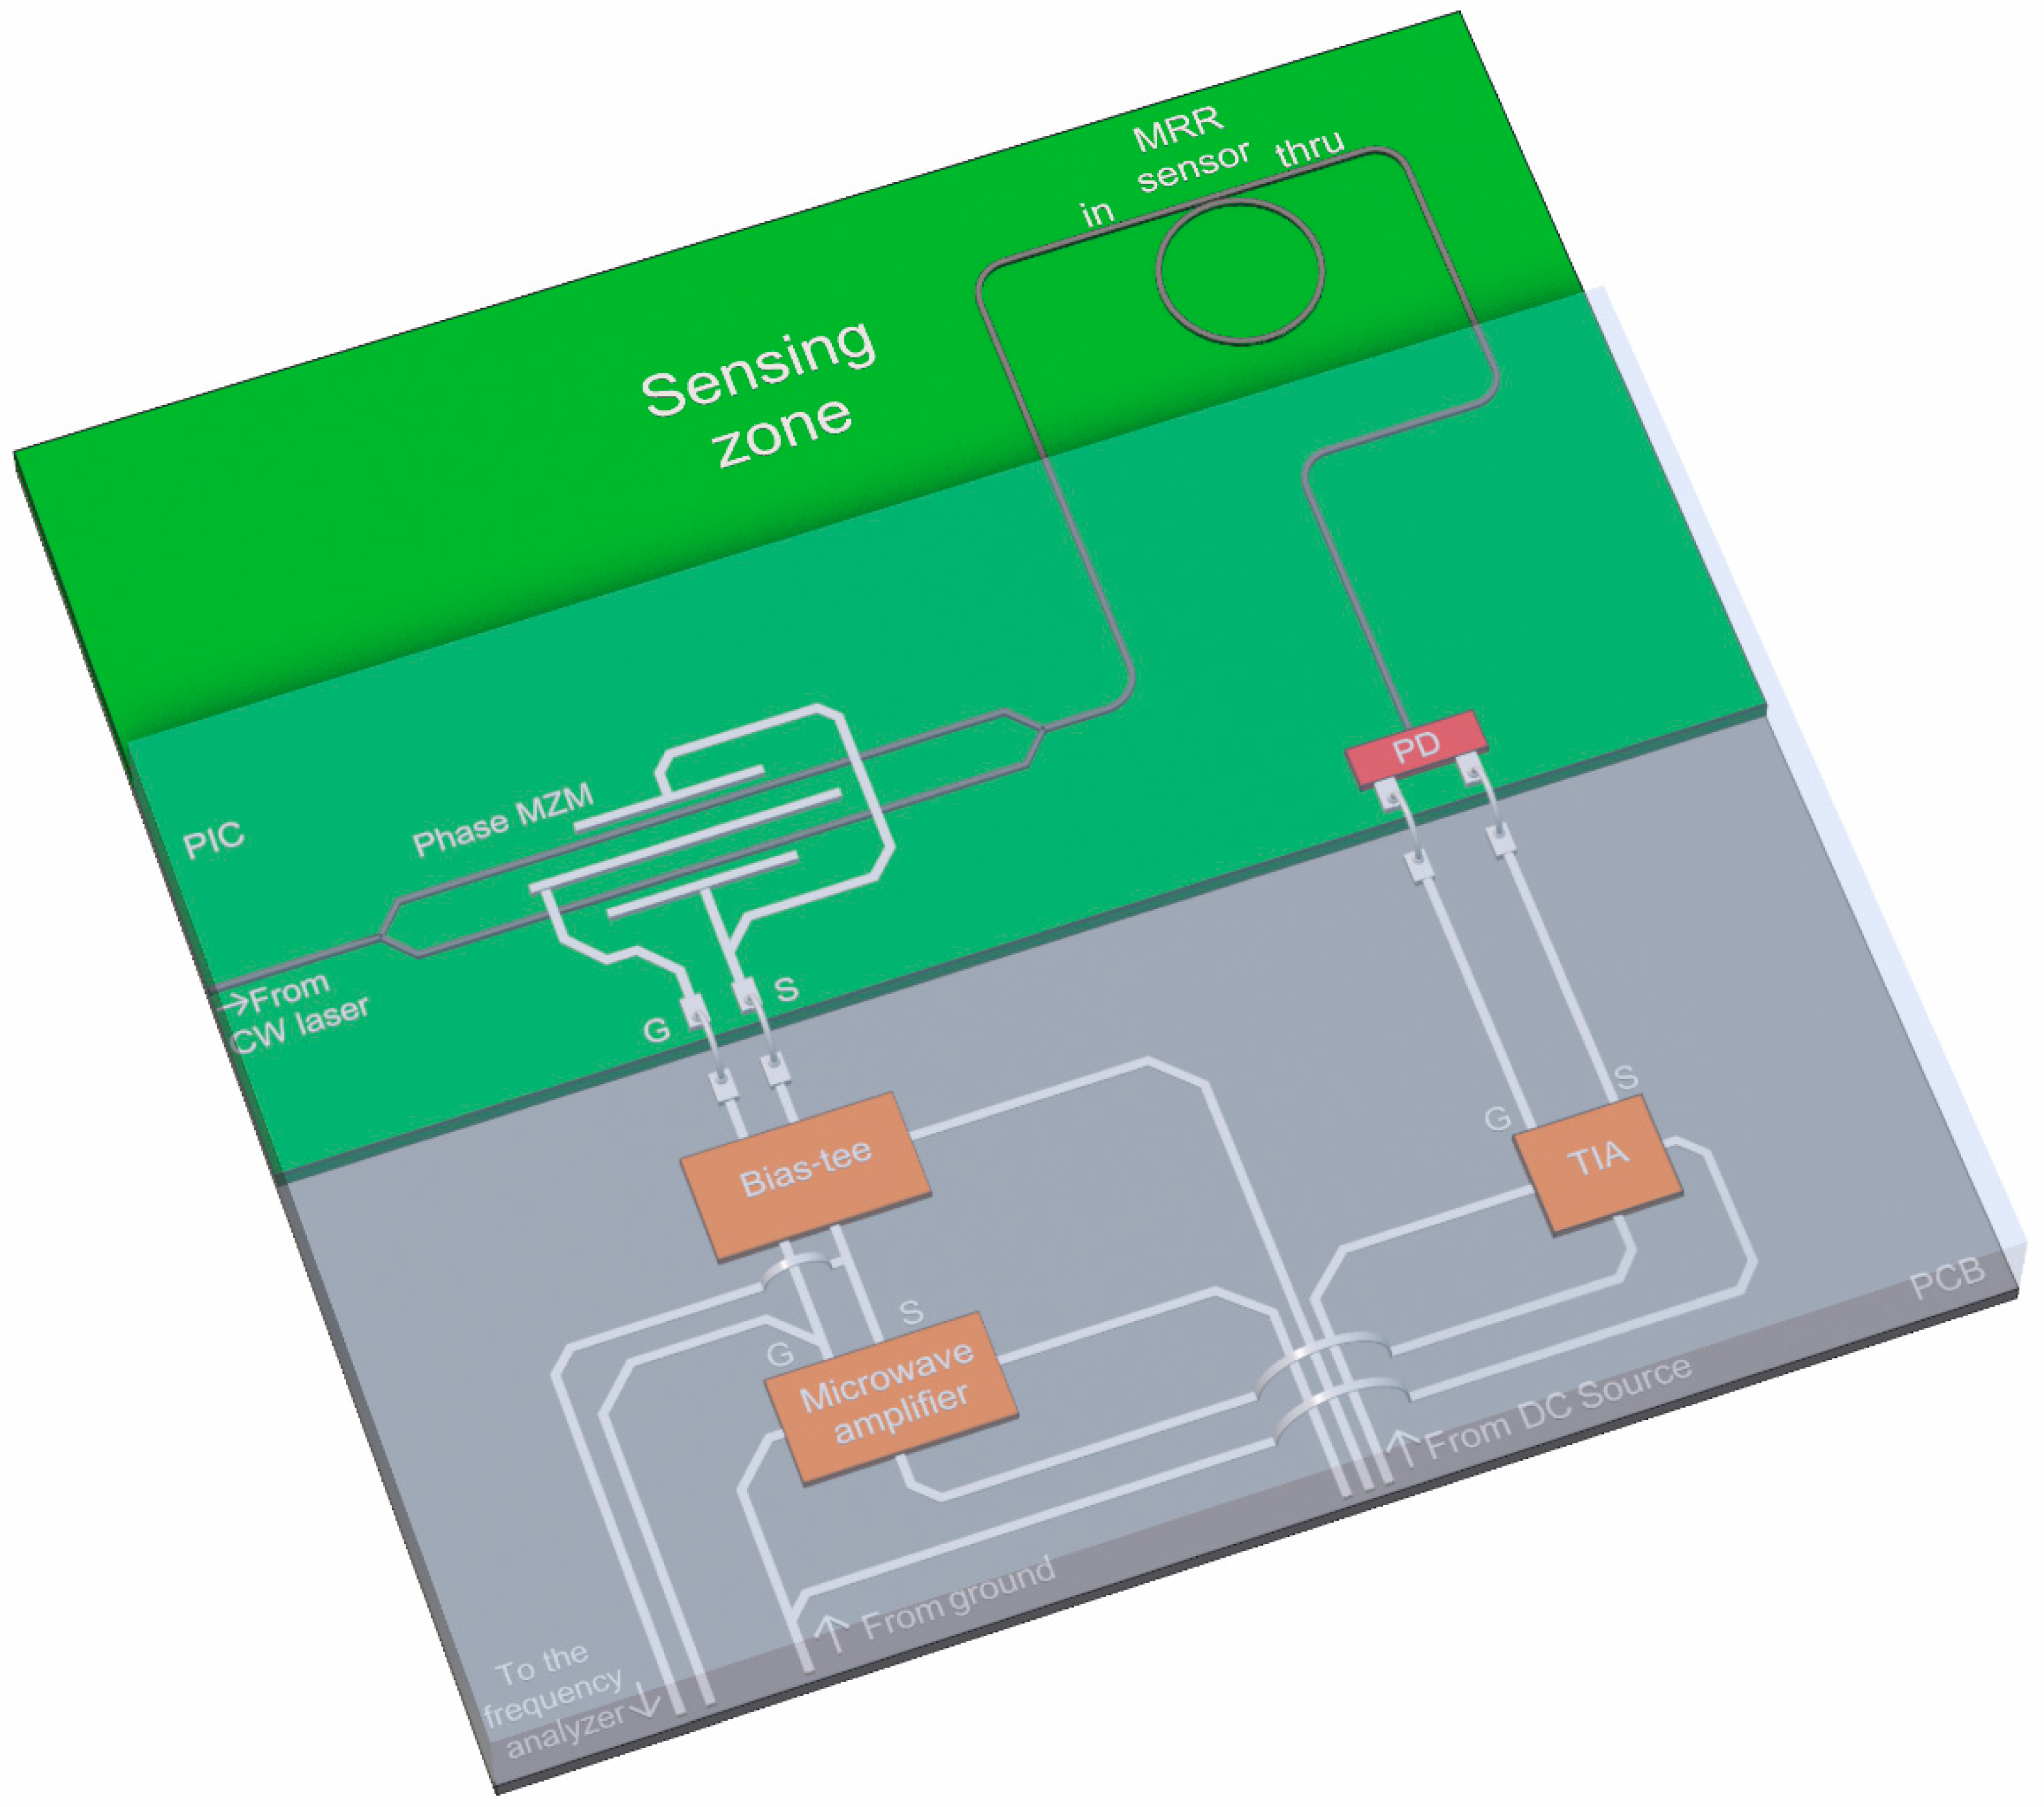
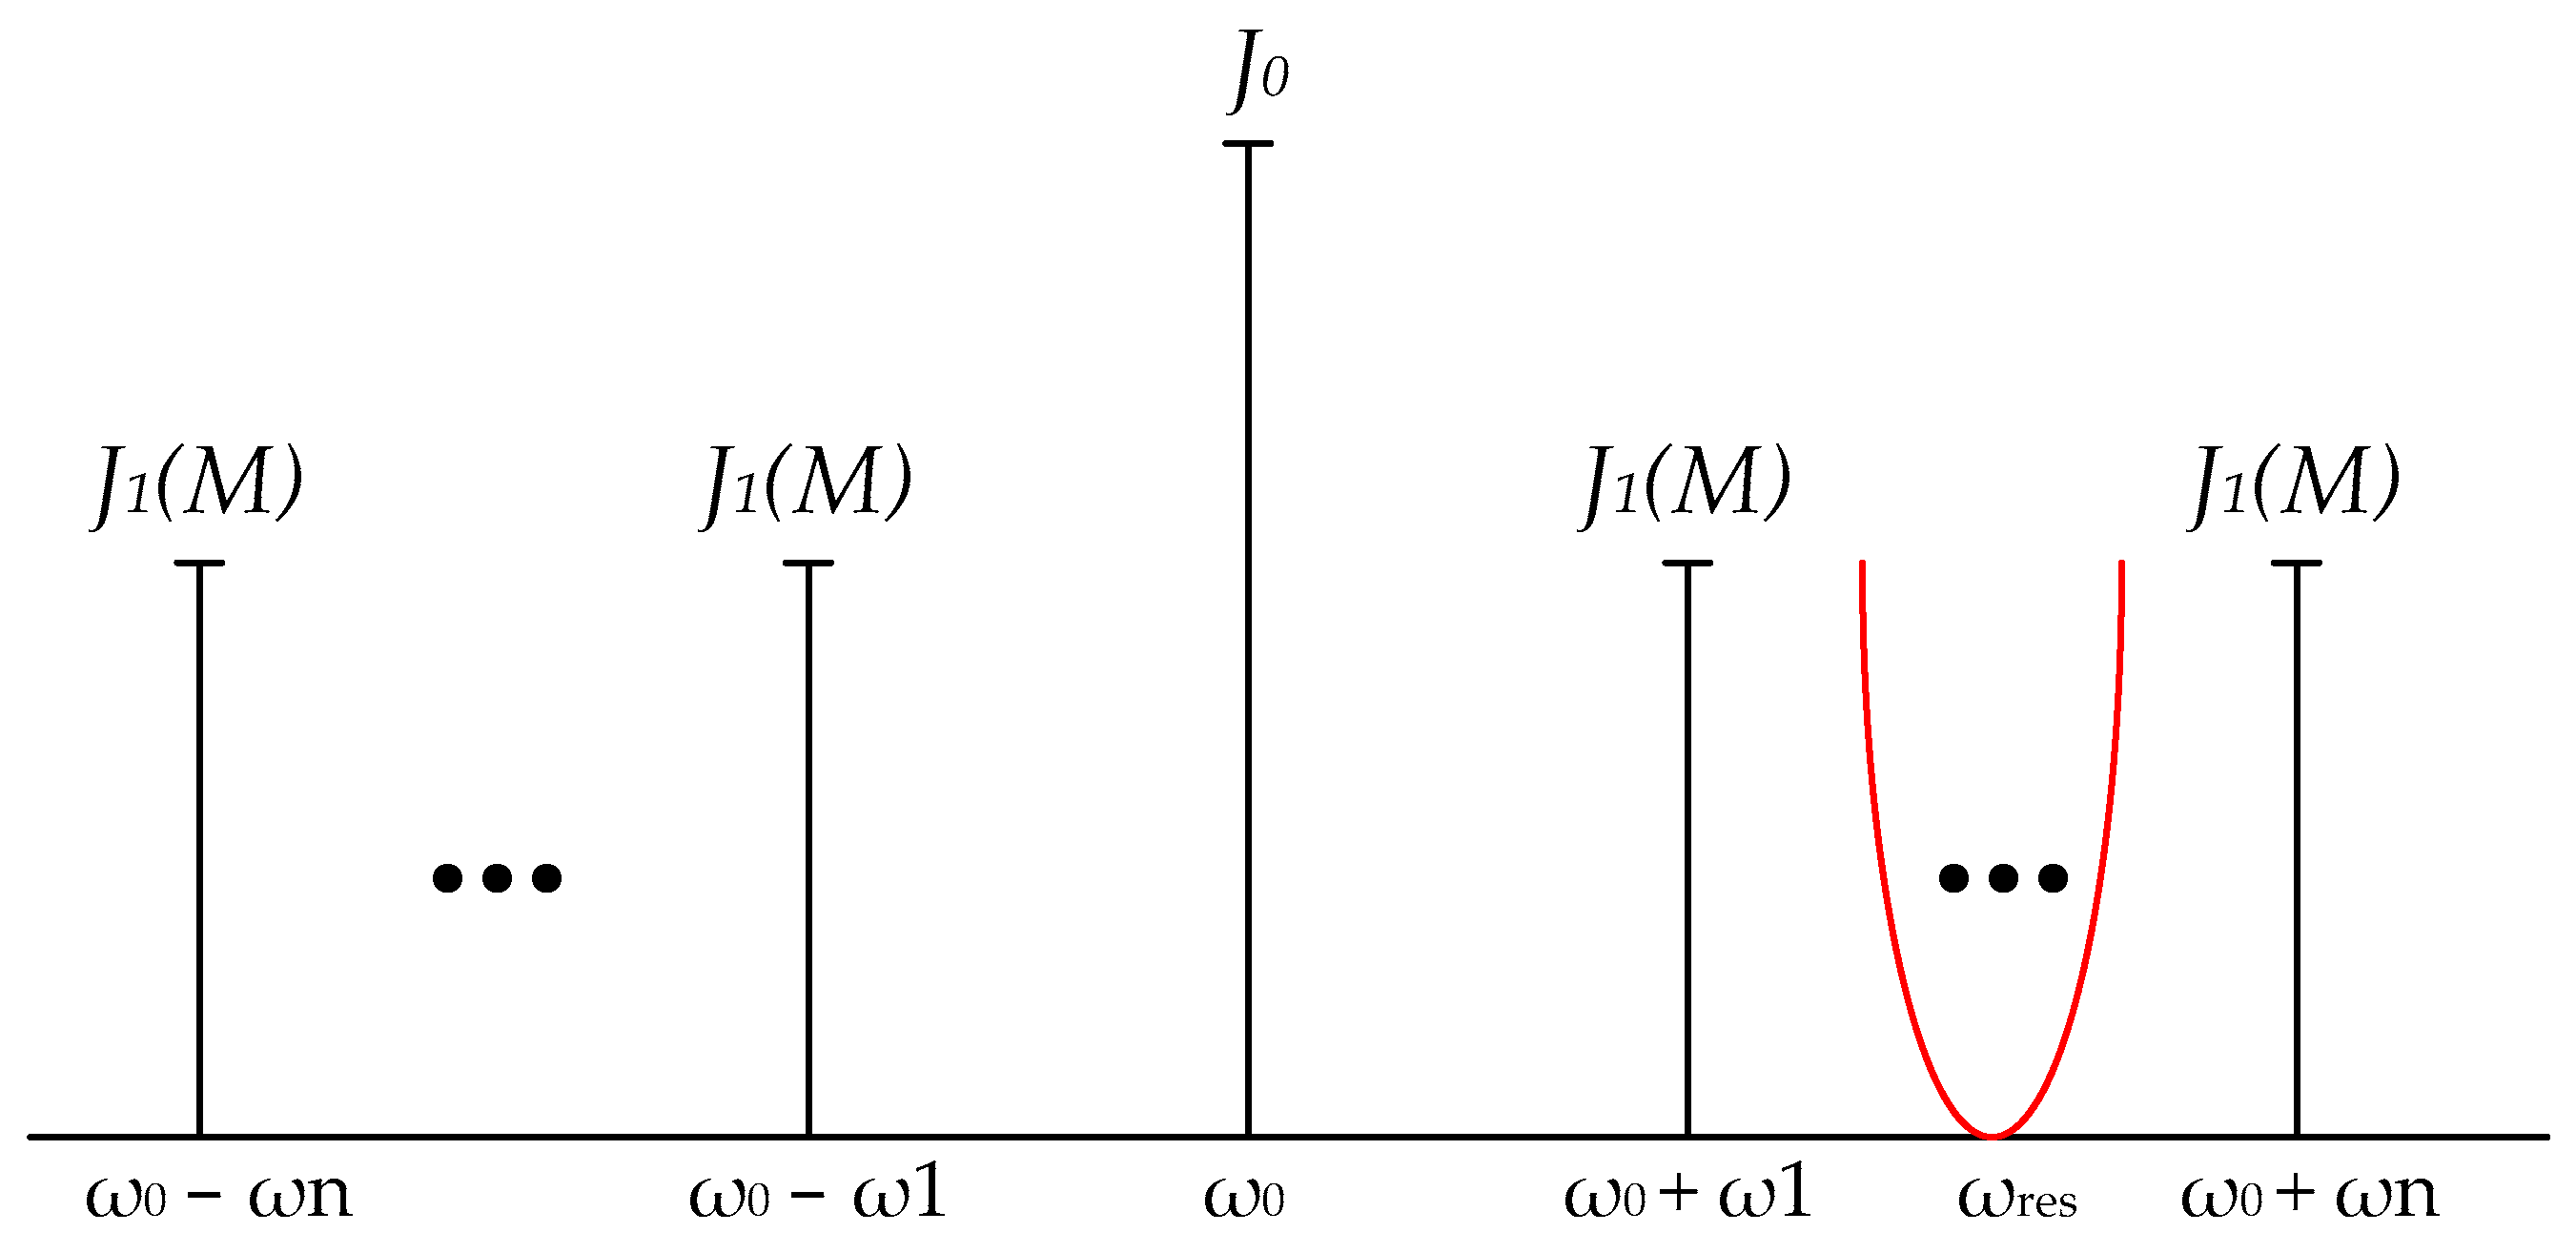
2. Sensing System Principle and Design
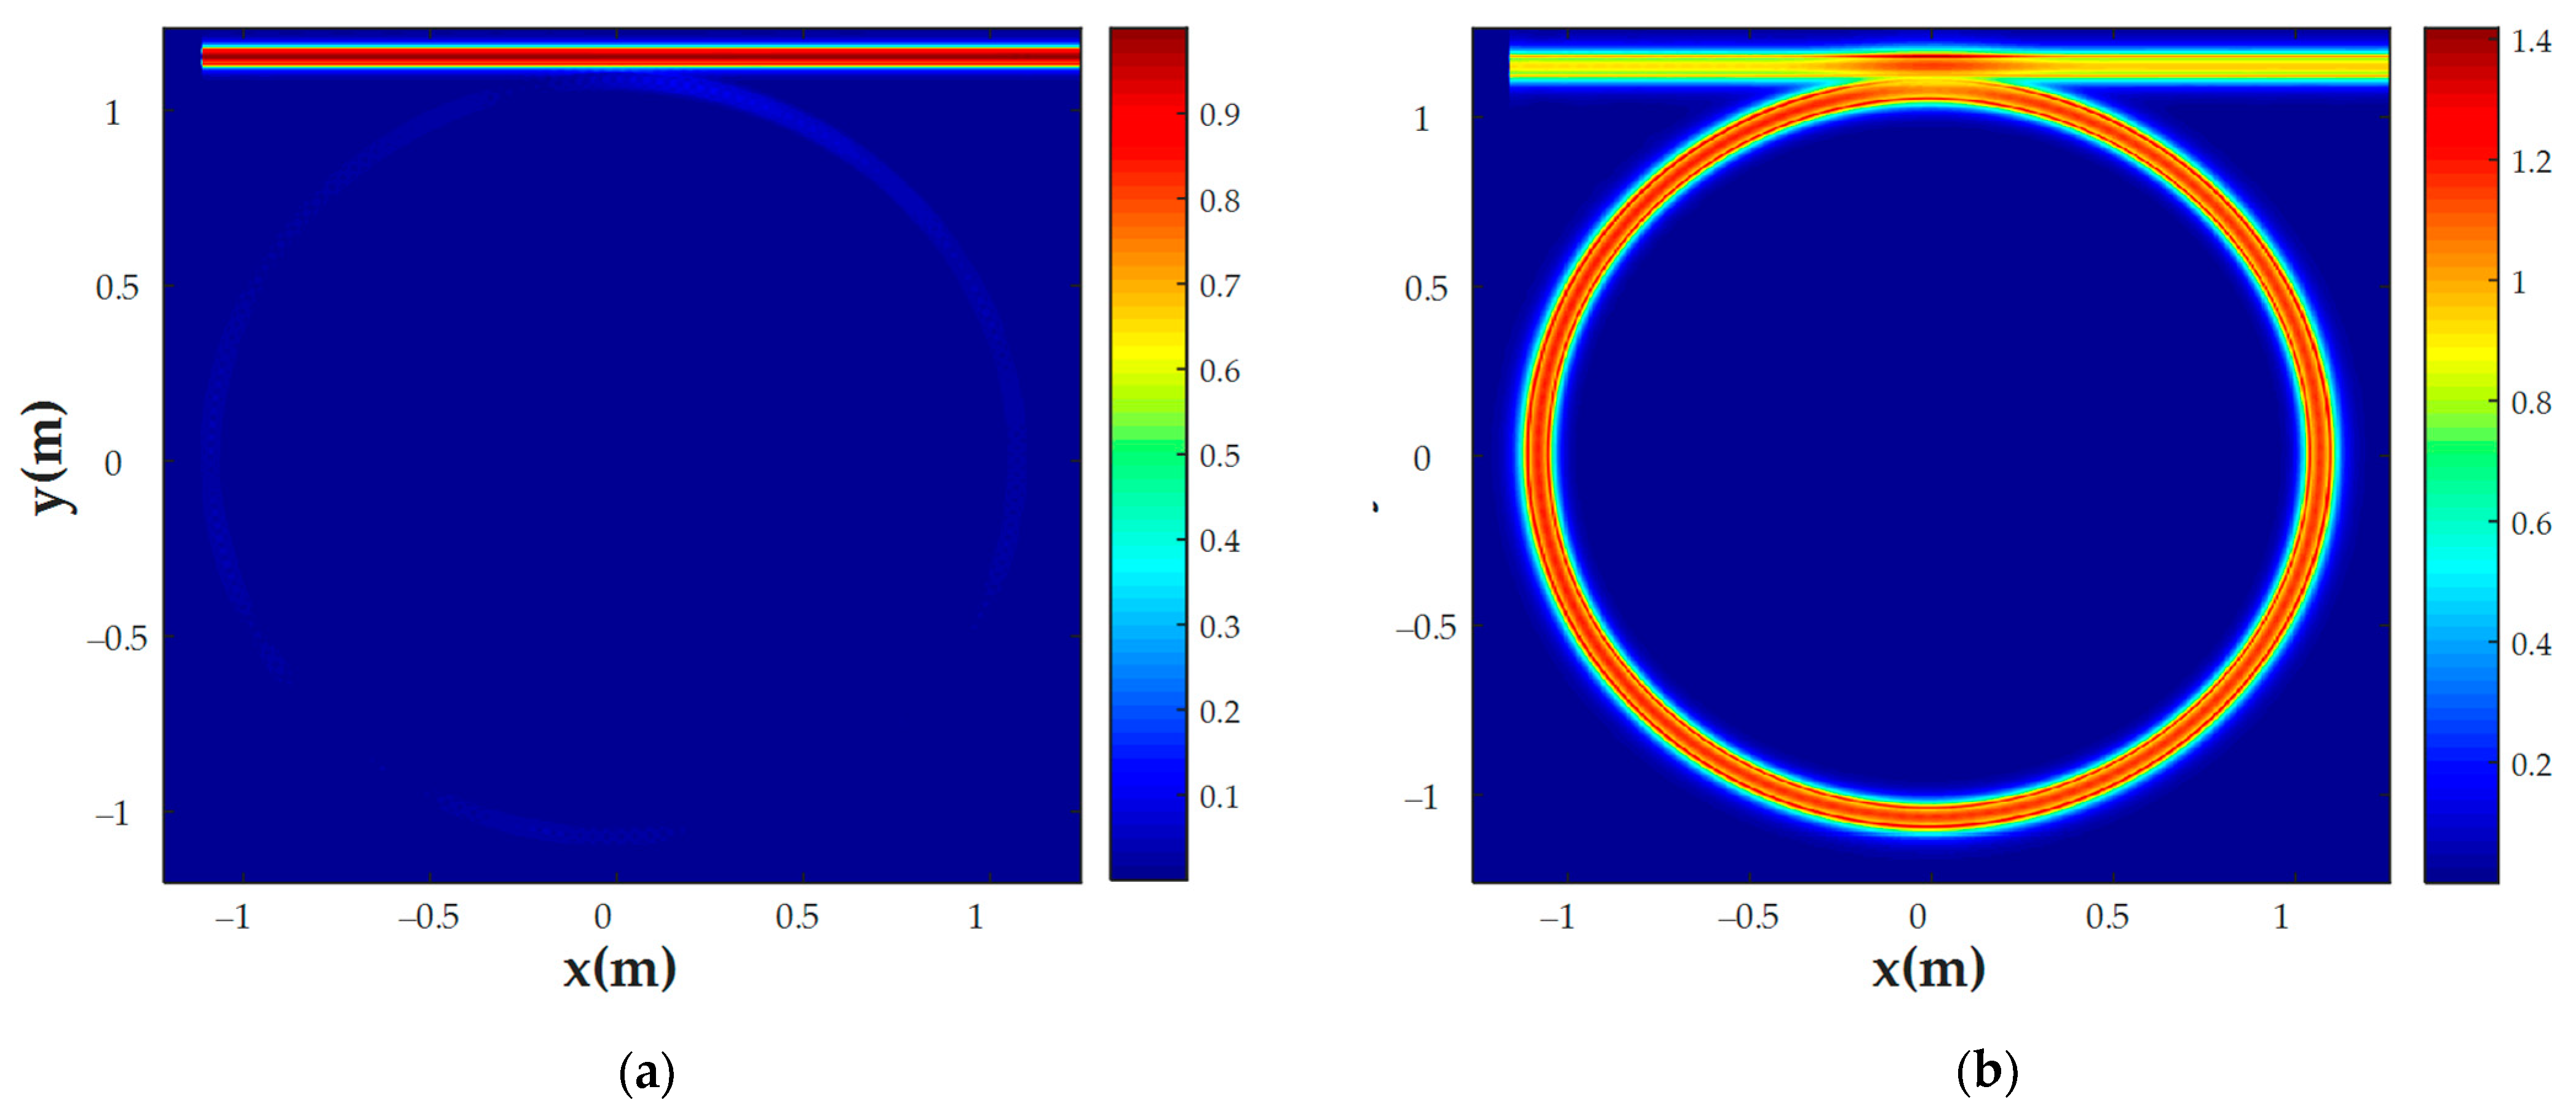
3. MRR-Based Sensor Design and Simulation
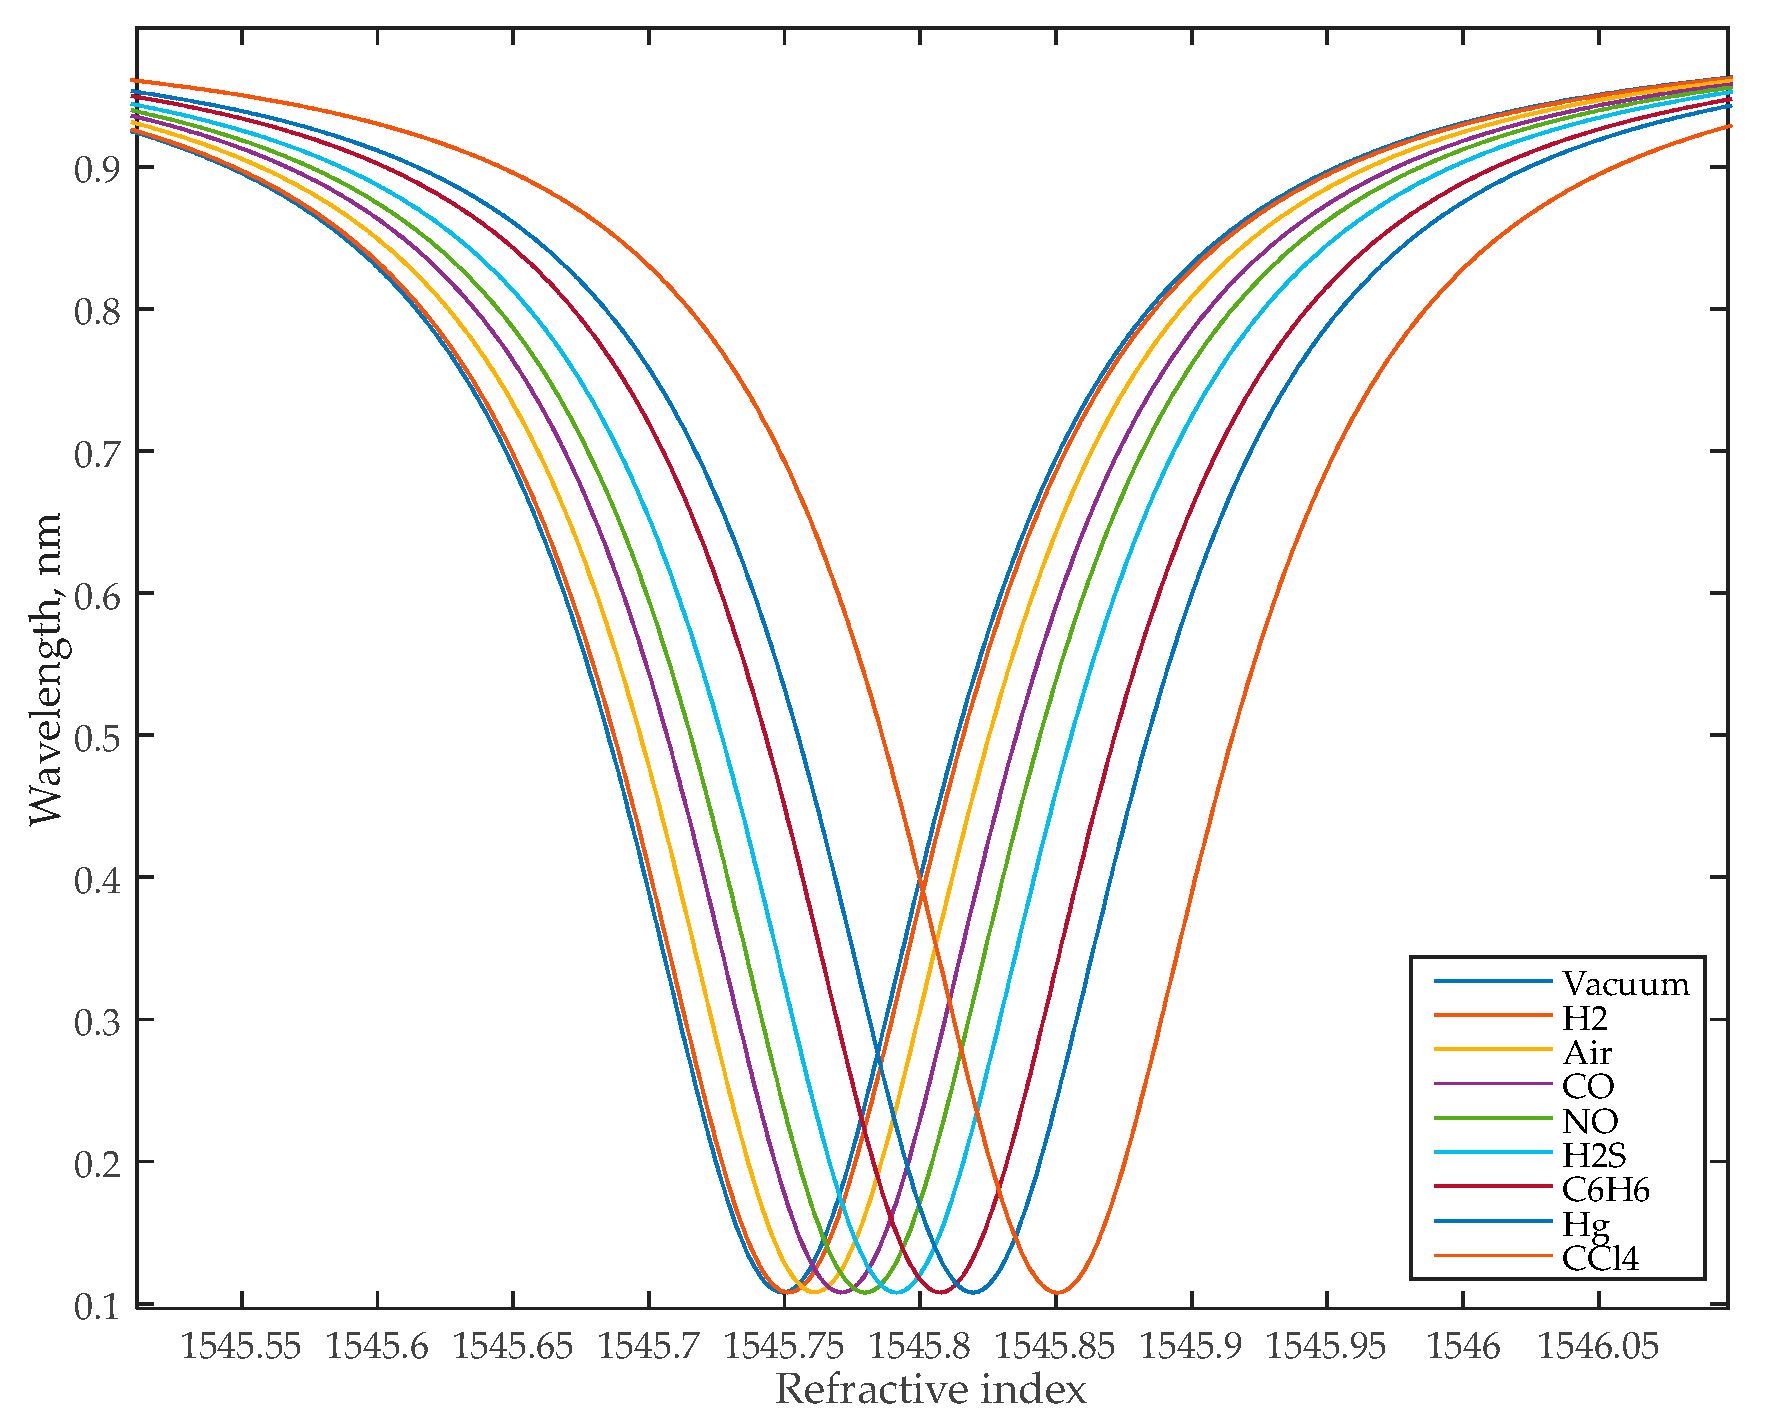
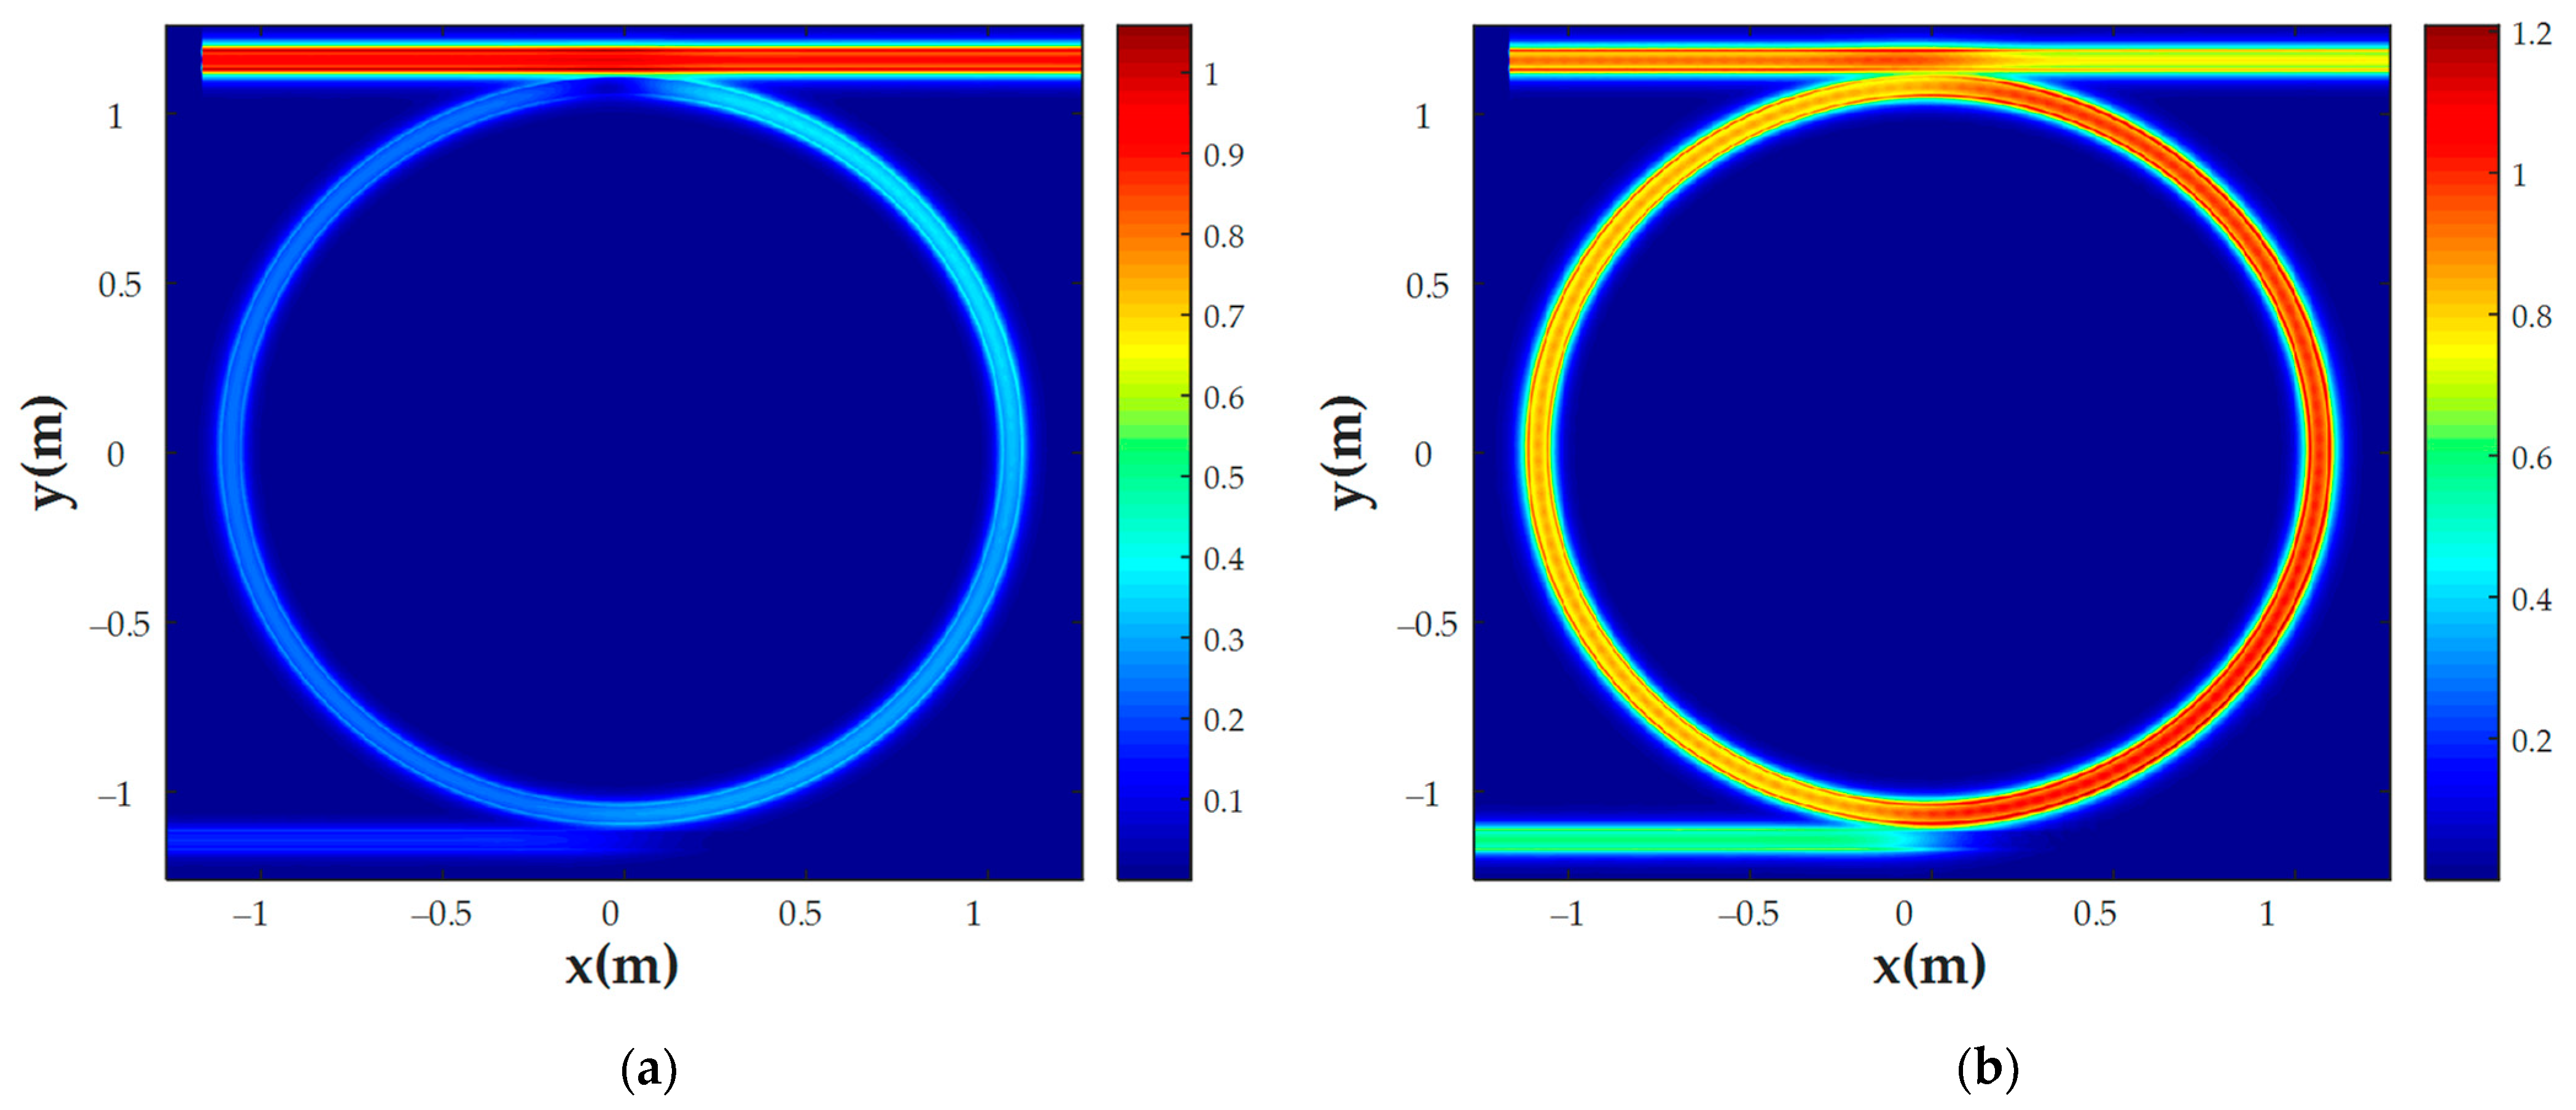
3.1. Add-Drop MRR
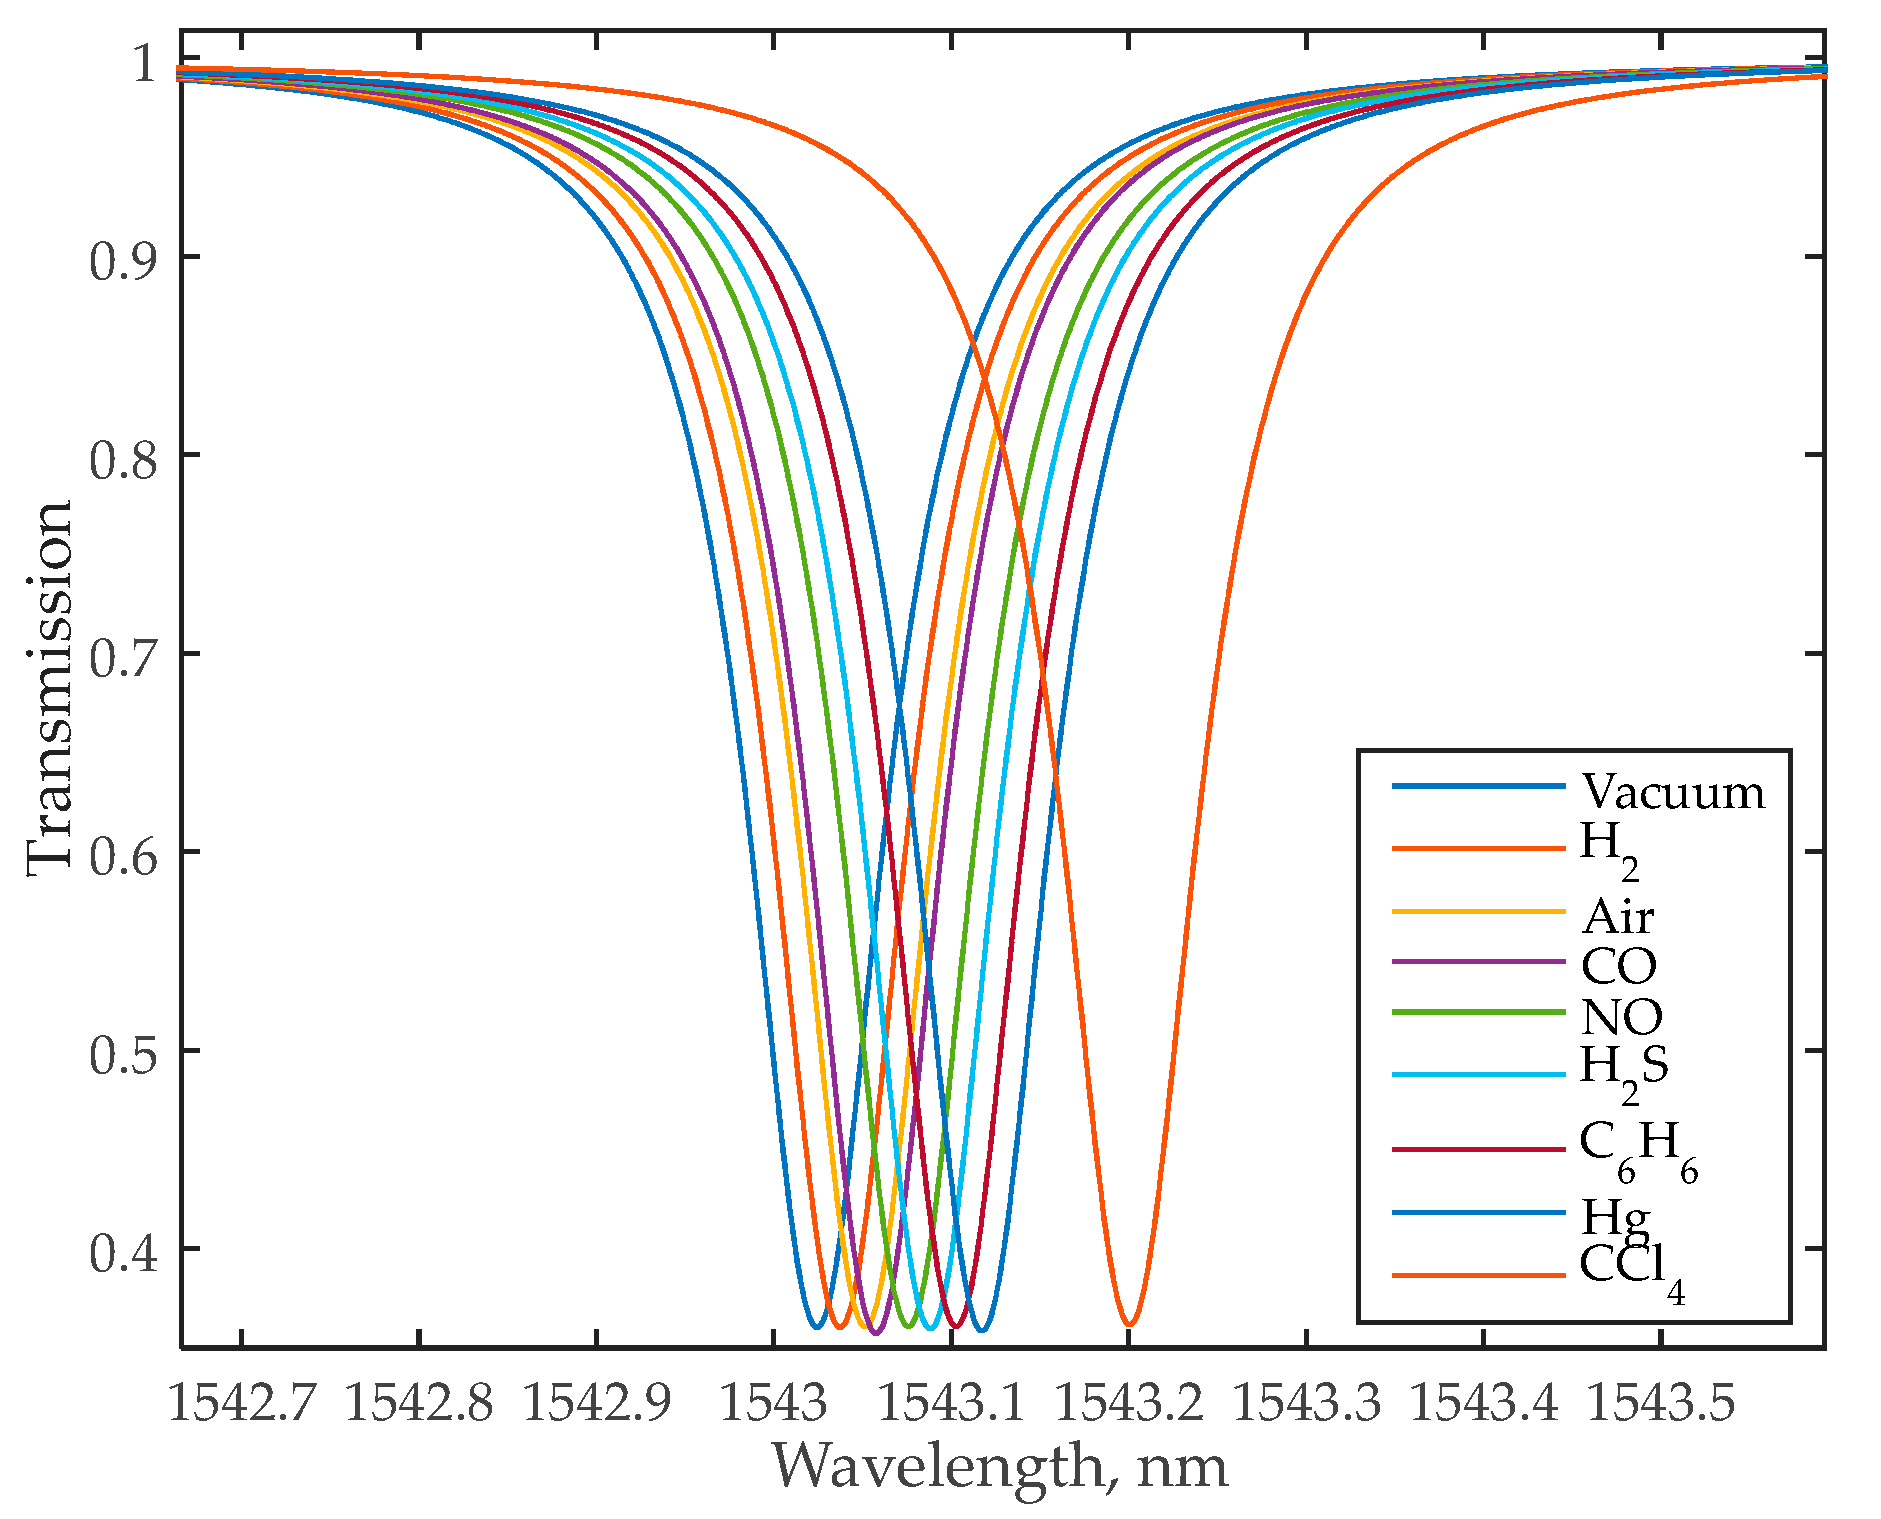
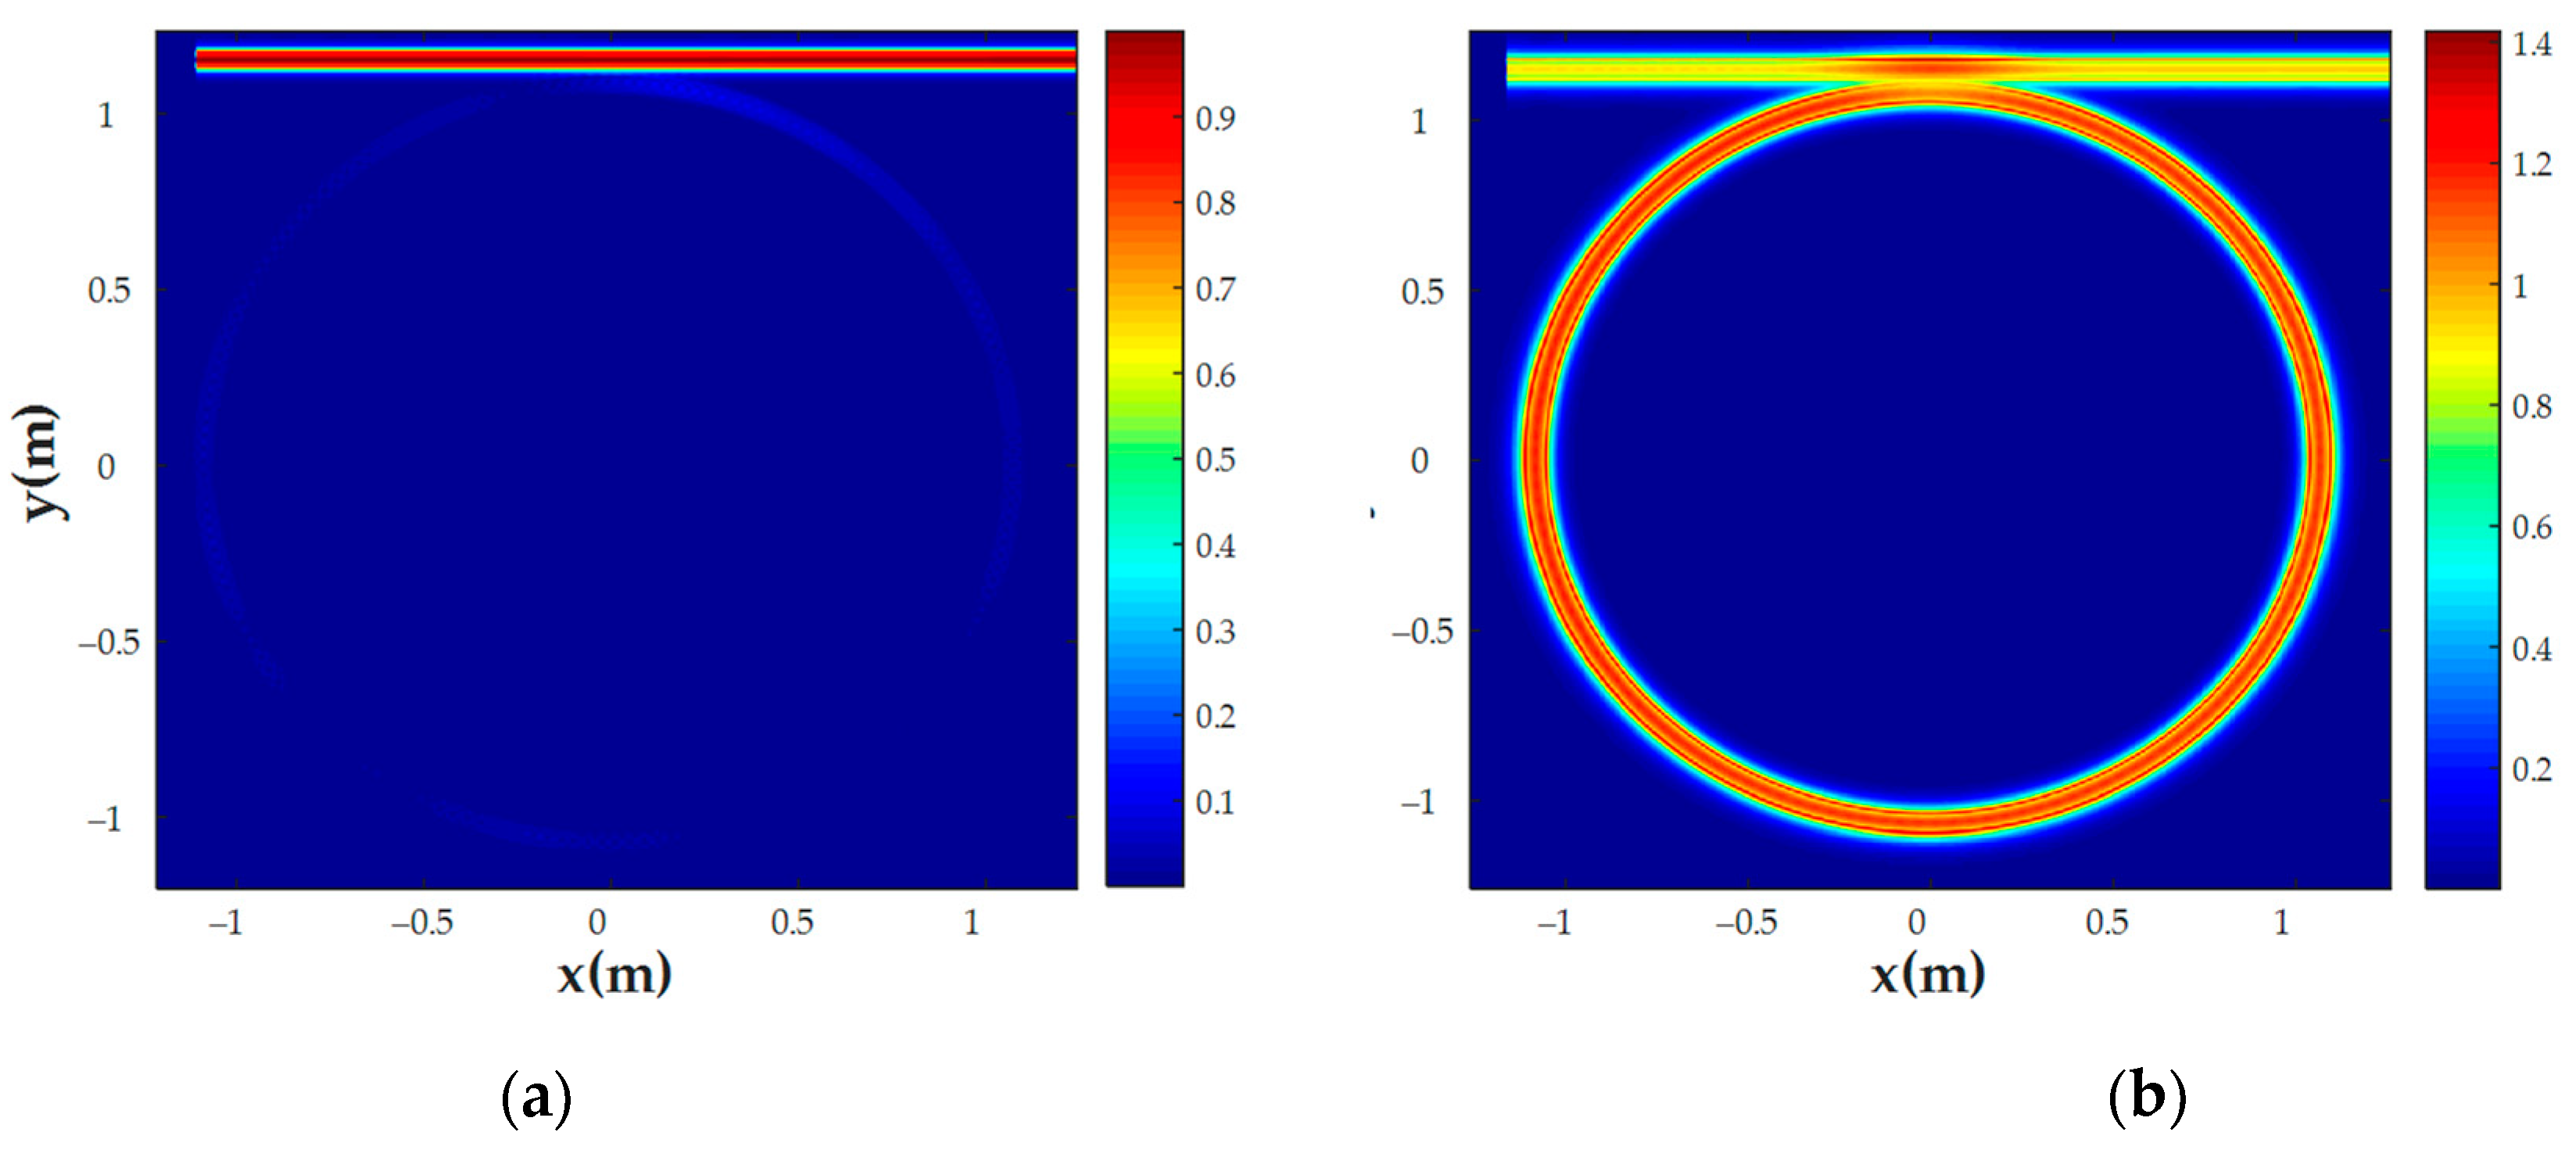
3.2. All-Pass MRR
4. Sensing System Simulation and Performance Analysis
5. Discussion
6. Conclusions
Author Contributions
Funding
Institutional Review Board Statement
Informed Consent Statement
Data Availability Statement
Acknowledgments
Conflicts of Interest
References
- Wang, H.; Ma, J.; Zhang, J.; Feng, Y.; Vijjapu, M.T.; Yuvaraja, S.; Surya, S.G.; Salama, K.N.; Dong, C.; Wang, Y.; et al. Gas Sensing Materials Roadmap. J. Phys. Condens. Matter 2021, 33, 303001. [Google Scholar] [CrossRef] [PubMed]
- Noh, J.-S.; Lee, J.M.; Lee, W. Low-Dimensional Palladium Nanostructures for Fast and Reliable Hydrogen Gas Detection. Sensors 2011, 11, 825–851. [Google Scholar] [CrossRef] [PubMed] [Green Version]
- Yang, G.; Zhang, M.; Dong, D.; Pan, X.; Zhou, Y.; Han, S.-T.; Xu, Z.; Wang, W.; Yan, Y. TiO 2 Based Sensor with Butterfly Wing Configurations for Fast Acetone Detection at Room Temperature. J. Mater. Chem. C 2019, 7, 11118–11125. [Google Scholar] [CrossRef]
- Tai, H.; Wang, S.; Duan, Z.; Jiang, Y. Evolution of Breath Analysis Based on Humidity and Gas Sensors: Potential and Challenges. Sens. Actuators B Chem. 2020, 318, 128104. [Google Scholar] [CrossRef]
- Butt, M.A.; Voronkov, G.S.; Grakhova, E.P.; Kutluyarov, R.V.; Kazanskiy, N.L.; Khonina, S.N. Environmental Monitoring: A Comprehensive Review on Optical Waveguide and Fiber-Based Sensors. Biosensors 2022, 12. [Google Scholar] [CrossRef]
- Wang, Y.; Li, Y.; Liao, C.; Wang, D.N.; Yang, M.; Lu, P. High-Temperature Sensing Using Miniaturized Fiber In-Line Mach–Zehnder Interferometer. IEEE Photon. Technol. Lett. 2010, 22, 39–41. [Google Scholar] [CrossRef]
- Xu, H.; Hafezi, M.; Fan, J.; Migdall, A.; Strouse, G.; Ahmed, Z.; Taylor, J.M. Photonic Temperature Sensor Based on Microring Resonators. In Proceedings of the CLEO: 2013, San Jose, CA, USA, 9–14 June 2013; OSA: San Jose, CA, USA, 2013; p. CM4O.1. [Google Scholar]
- El Shamy, R.S.; Khalil, D.; Swillam, M.A. Mid Infrared Optical Gas Sensor Using Plasmonic Mach-Zehnder Interferometer. Sci Rep 2020, 10, 1293. [Google Scholar] [CrossRef] [Green Version]
- Fabricius, N.; Gauglitz, G.; Ingenhoff, J. A Gas Sensor Based on an Integrated Optical Mach-Zehnder Interferometer. Sensors and Actuators B Chem. 1992, 7, 672–676. [Google Scholar] [CrossRef]
- El Shamy, R.S.; Swillam, M.A.; ElRayany, M.M.; Sultan, A.; Li, X. Compact Gas Sensor Using Silicon-on-Insulator Loop-Terminated Mach–Zehnder Interferometer. Photonics 2021, 9, 8. [Google Scholar] [CrossRef]
- Sun, L.; Semenova, Y.; Wu, Q.; Liu, D.; Yuan, J.; Ma, T.; Sang, X.; Yan, B.; Wang, K.; Yu, C.; et al. High Sensitivity Ammonia Gas Sensor Based on a Silica-Gel-Coated Microfiber Coupler. J. Light. Technol. 2017, 35, 2864–2870. [Google Scholar] [CrossRef]
- Li, D.; Wu, G.; Chen, J.; Yan, S.; Liu, Z.; Xu, F.; Lu, Y. Ethanol Gas Sensor Based on a Hybrid Polymethyl Methacrylate–Silica Microfiber Coupler. J. Light. Technol. 2018, 36, 2031–2036. [Google Scholar] [CrossRef]
- Mi, G.; Horvath, C.; Aktary, M.; Van, V. Silicon Microring Refractometric Sensor for Atmospheric CO2 Gas Monitoring. Opt. Express 2016, 24, 1773. [Google Scholar] [CrossRef] [PubMed]
- Mi, G.; Horvath, C.; Van, V. Silicon Photonic Dual-Gas Sensor for H2 and CO2 Detection. Opt. Express 2017, 25, 16250. [Google Scholar] [CrossRef] [PubMed]
- Yan, H.; Huang, L.; Xu, X.; Chakravarty, S.; Tang, N.; Tian, H.; Chen, R.T. Unique Surface Sensing Property and Enhanced Sensitivity in Microring Resonator Biosensors Based on Subwavelength Grating Waveguides. Opt. Express 2016, 24, 29724. [Google Scholar] [CrossRef] [PubMed] [Green Version]
- Tu, Z.; Gao, D.; Zhang, M.; Zhang, D. High-Sensitivity Complex Refractive Index Sensing Based on Fano Resonance in the Subwavelength Grating Waveguide Micro-Ring Resonator. Opt. Express 2017, 25, 20911. [Google Scholar] [CrossRef] [PubMed]
- Xu, Y.; Fu, C.; Sun, S.; Kong, M. Wide-Range Refractive Index Sensing Relied on Tracking the Envelope Spectrum of a Dispersive Subwavelength Grating Microring Resonator. Optics Laser Technol. 2022, 154, 108304. [Google Scholar] [CrossRef]
- Liu, Y.; Li, Y.; Li, M.; He, J.-J. High-Sensitivity and Wide-Range Optical Sensor Based on Three Cascaded Ring Resonators. Opt. Express 2017, 25, 972. [Google Scholar] [CrossRef]
- Jin, L.; Li, M.; He, J.-J. Highly-Sensitive Silicon-on-Insulator Sensor Based on Two Cascaded Micro-Ring Resonators with Vernier Effect. Optics Commun. 2011, 284, 156–159. [Google Scholar] [CrossRef]
- Liu, C.; Sang, C.; Wu, X.; Cai, J.; Wang, J. Grating Double-Slot Micro-Ring Resonator for Sensing. Optics Commun. 2021, 499, 127280. [Google Scholar] [CrossRef]
- Yuan, G.; Gao, L.; Chen, Y.; Liu, X.; Wang, J.; Wang, Z. Improvement of Optical Sensing Performances of a Double-Slot-Waveguide-Based Ring Resonator Sensor on Silicon-on-Insulator Platform. Optik 2014, 125, 850–854. [Google Scholar] [CrossRef]
- Butt, M.A.; Kazanskiy, N.L.; Khonina, S.N. On-Chip Symmetrically and Asymmetrically Transformed Plasmonic Bragg Grating Formation Loaded with a Functional Polymer for Filtering and CO2 Gas Sensing Applications. Measurement 2022, 201, 111694. [Google Scholar] [CrossRef]
- Das, C.; Mohammad, Z.; Alam, M.M. Optical Hydrogen Gas Sensor Based on Palladium Coated Microring Resonator. In Proceedings of the 2018 International Conference on Innovation in Engineering and Technology (ICIET), Dhaka, Bangladesh, 27–28 December 2018; pp. 1–5. [Google Scholar]
- Eryürek, M.; Karadag, Y.; Taşaltın, N.; Kılınç, N.; Kiraz, A. Optical Sensor for Hydrogen Gas Based on a Palladium-Coated Polymer Microresonator. Sens. Actuators B Chem. 2015, 212, 78–83. [Google Scholar] [CrossRef]
- Yebo, N.A.; Lommens, P.; Hens, Z.; Baets, R. An Integrated Optic Ethanol Vapor Sensor Based on a Silicon-on-Insulator Microring Resonator Coated with a Porous ZnO Film. Opt. Express 2010, 18, 11859. [Google Scholar] [CrossRef] [Green Version]
- Zhang, X.; Li, Z.; Sun, Y.; Tong, K. Simulation of ZnO-Coated SOI Microring Resonant Shift Response to Ethanol and Ammonia. Optik 2014, 125, 2752–2755. [Google Scholar] [CrossRef]
- Yao, J. Microwave Photonic Sensors. J. Light. Technol. 2021, 39, 3626–3637. [Google Scholar] [CrossRef]
- Yao, X.S.; Maleki, L. Optoelectronic Microwave Oscillator. J. Opt. Soc. Am. B 1996, 13, 1725. [Google Scholar] [CrossRef]
- Li, W.; Yao, J. An Optically Tunable Optoelectronic Oscillator. J. Light. Technol. 2010, 28, 2640–2645. [Google Scholar] [CrossRef] [Green Version]
- Wang, Y.; Zhang, J.; Yao, J. An Optoelectronic Oscillator for High Sensitivity Temperature Sensing. IEEE Photon. Technol. Lett. 2016, 28, 1458–1461. [Google Scholar] [CrossRef]
- Zou, X.; Liu, X.; Li, W.; Li, P.; Pan, W.; Yan, L.; Shao, L. Optoelectronic Oscillators (OEOs) to Sensing, Measurement, and Detection. IEEE J. Quantum Electron. 2016, 52, 1–16. [Google Scholar] [CrossRef]
- Zhang, S.; Chen, H.; Fu, H. Fiber-Optic Temperature Sensor Using an Optoelectronic Oscillator. In Proceedings of the 2015 14th International Conference on Optical Communications and Networks (ICOCN), Nanjing, China, 3–5 July 2015; pp. 1–3. [Google Scholar]
- Zhu, Y.; Jin, X.; Chi, H.; Zheng, S.; Zhang, X. High-Sensitivity Temperature Sensor Based on an Optoelectronic Oscillator. Appl. Opt. 2014, 53, 5084. [Google Scholar] [CrossRef]
- Saleh, K.; Bouchier, A.; Merrer, P.H.; Llopis, O.; Cibiel, G. Fiber Ring Resonator Based Opto-Electronic Oscillator: Phase Noise Optimisation and Thermal Stability Study. In Proceedings of the SPIE 7936, RF and Millimeter-Wave Photonics, San Francisco, CA, USA, 22–27 January 2011. [Google Scholar]
- Bogaerts, W.; De Heyn, P.; Van Vaerenbergh, T.; De Vos, K.; Kumar Selvaraja, S.; Claes, T.; Dumon, P.; Bienstman, P.; Van Thourhout, D.; Baets, R. Silicon Microring Resonators. Laser Photon. Rev. 2012, 6, 47–73. [Google Scholar] [CrossRef]
- Chew, S.X.; Yi, X.; Yang, W.; Wu, C.; Li, L.; Nguyen, L.; Minasian, R. Optoelectronic Oscillator Based Sensor Using an On-Chip Sensing Probe. IEEE Photonics J. 2017, 9, 1–9. [Google Scholar] [CrossRef]
- Voronkov, G.; Zakoyan, A.; Ivanov, V.; Iraev, D.; Stepanov, I.; Yuldashev, R.; Grakhova, E.; Lyubopytov, V.; Morozov, O.; Kutluyarov, R. Design and Modeling of a Fully Integrated Microring-Based Photonic Sensing System for Liquid Refractometry. Sensors 2022, 22, 9553. [Google Scholar] [CrossRef] [PubMed]
- Milvich, J.; Kohler, D.; Freude, W.; Koos, C. Integrated Phase-Sensitive Photonic Sensors: A System Design Tutorial. Adv. Opt. Photon. 2021, 13, 584. [Google Scholar] [CrossRef]
- Guha, P.; Ali, S.; Lee, C.; Udrea, F.; Milne, W.; Iwaki, T.; Covington, J.; Gardner, J. Novel Design and Characterisation of SOI CMOS Micro-Hotplates for High Temperature Gas Sensors. Sens. Actuators B Chem. 2007, 127, 260–266. [Google Scholar] [CrossRef]
- Samotaev, N.; Pisliakov, A.; Filipchuk, D.; Etrekova, M.; Biro, F.; Ducso, C.; Bársony, I. SOI Based Micro-Bead Catalytic Gas Sensor. In International Youth Conference on Electronics, Telecommunications and Information Technologies; Velichko, E., Vinnichenko, M., Kapralova, V., Koucheryavy, Y., Eds.; Springer Proceedings in Physics; Springer International Publishing: Cham, Switzerland, 2021; Volume 255, pp. 105–111. ISBN 978-3-030-58867-0. [Google Scholar]
- Lu, C.-C.; Liao, K.-H.; Udrea, F.; Covington, J.A.; Gardner, J.W. Multi-Field Simulations and Characterization of CMOS-MEMS High-Temperature Smart Gas Sensors Based on SOI Technology. J. Micromech. Microeng. 2008, 18, 075010. [Google Scholar] [CrossRef] [Green Version]
- Koushik, K.P.; Malathi, S. Optical Micro-ring Resonator for Detection of Carbon Dioxide Gas. In Emerging Trends in Photonics, Signal Processing and Communication Engineering; Kadambi, G.R., Kumar, P.B., Palade, V., Eds.; Lecture Notes in Electrical Engineering; Springer: Singapore, 2020; Volume 649, pp. 157–161. ISBN 9789811534768. [Google Scholar]
- Peck, E.R.; Huang, S. Refractivity and Dispersion of Hydrogen in the Visible and Near Infrared. J. Opt. Soc. Am. 1977, 67, 1550. [Google Scholar] [CrossRef]
- Ciddor, P.E. Refractive Index of Air: New Equations for the Visible and Near Infrared. Appl. Opt. 1996, 35, 1566. [Google Scholar] [CrossRef]
- Smith, P.L.; Huber, M.C.E.; Parkinson, W.H. Refractivities of H2, He, O2, CO, and Kr for 168 ≤ λ ≤ 288 nm. Phys. Rev. A 1976, 13, 1422–1434. [Google Scholar] [CrossRef]
- Moutzouris, K.; Papamichael, M.; Betsis, S.C.; Stavrakas, I.; Hloupis, G.; Triantis, D. Refractive, Dispersive and Thermo-Optic Properties of Twelve Organic Solvents in the Visible and Near-Infrared. Appl. Phys. B 2014, 116, 617–622. [Google Scholar] [CrossRef]
- Inagaki, T.; Arakawa, E.T.; Williams, M.W. Optical Properties of Liquid Mercury. Phys. Rev. B 1981, 23, 5246–5262. [Google Scholar] [CrossRef]
- Chrostowski, L.; Hochberg, M.E. Silicon Photonics Design; Cambridge University Press: Cambridge, UK, 2015; ISBN 978-1-107-08545-9. [Google Scholar]
- Rahim, A.; Goyvaerts, J.; Szelag, B.; Fedeli, J.-M.; Absil, P.; Aalto, T.; Harjanne, M.; Littlejohns, C.; Reed, G.; Winzer, G.; et al. Open-Access Silicon Photonics Platforms in Europe. IEEE J. Select. Topics Quantum Electron. 2019, 25, 1–18. [Google Scholar] [CrossRef] [Green Version]
- Salzberg, C.D.; Villa, J.J. Infrared Refractive Indexes of Silicon Germanium and Modified Selenium Glass. J. Opt. Soc. Am. 1957, 47, 244. [Google Scholar] [CrossRef]
- Wang, X.; Flueckiger, J.; Schmidt, S.; Grist, S.; Fard, S.T.; Kirk, J.; Doerfler, M.; Cheung, K.C.; Ratner, D.M.; Chrostowski, L. A Silicon Photonic Biosensor Using Phase-Shifted Bragg Gratings in Slot Waveguide. J. Biophoton. 2013. [Google Scholar] [CrossRef]
- Liow, T.Y.; Ang, K.W.; Fang, Q.; Song, J.F.; Xiong, Y.Z.; Yu, M.B.; Lo, G.Q.; Kwong, D.L. Silicon Modulators and Germanium Photodetectors on SOI: Monolithic Integration, Compatibility, and Performance Optimization. IEEE J. Select. Topics Quantum Electron. 2010, 16, 307–315. [Google Scholar] [CrossRef]
- Sana, A.K.; Jun, M.; Yokoyama, S.; Amemiya, Y.; Yokoyama, S. Temperature Dependence of Resonance Characteristics of Silicon Resonators and Thermal Stability Improvement by Differential Operation Method. Jpn. J. Appl. Phys. 2017, 56, 04CC06. [Google Scholar] [CrossRef]
- Tian, X.; Gunawan, G.; Zhou, L.; Li, L.; Nguyen, L.; Minasian, R.; Yi, X. Athermal Microwave Photonic Sensor Based on Single Microring Resonance Assisted by Machine Learning. J. Light. Technol. 2022, 40, 6796–6804. [Google Scholar] [CrossRef]
- Zou, X.; Lu, B.; Pan, W.; Yan, L.; Stöhr, A.; Yao, J. Photonics for Microwave Measurements: Photonics for Microwave Measurements. Laser Photonics Rev. 2016, 10, 711–734. [Google Scholar] [CrossRef] [Green Version]
- Zhao, C.Y.; Zhang, L.; Zhang, C.M. Compact SOI Optimized Slot Microring Coupled Phase-Shifted Bragg Grating Resonator for Sensing. Optics Commun. 2018, 414, 212–216. [Google Scholar] [CrossRef]


| Gas | Chemical Formula | n (RI) |
|---|---|---|
| Vacuum | - | 1.0 |
| Hydrogen | H2 | 1.000132 [43] |
| Air | - | 1.000273 [44] |
| Carbon monoxide | CO | 1.000334 [45] |
| Nitric oxide | NO | 1.000516 [45] |
| Hydrogen sulfide | H2S | 1.000641 [46] |
| Benzene | C6H6 | 1.000788 [46] |
| Mercury vapor | Hg | 1.000933 [47] |
| Carbon tetrachloride | CCl4 | 1.001768 [46] |
| Parameter | Value |
|---|---|
| Outer radius | 11 μm |
| Waveguide height | 0.22 μm |
| Waveguide width | 0.4 μm |
| Gap | 0.16 μm |
| Ambient medium | Vacuum (n = 1.0) |
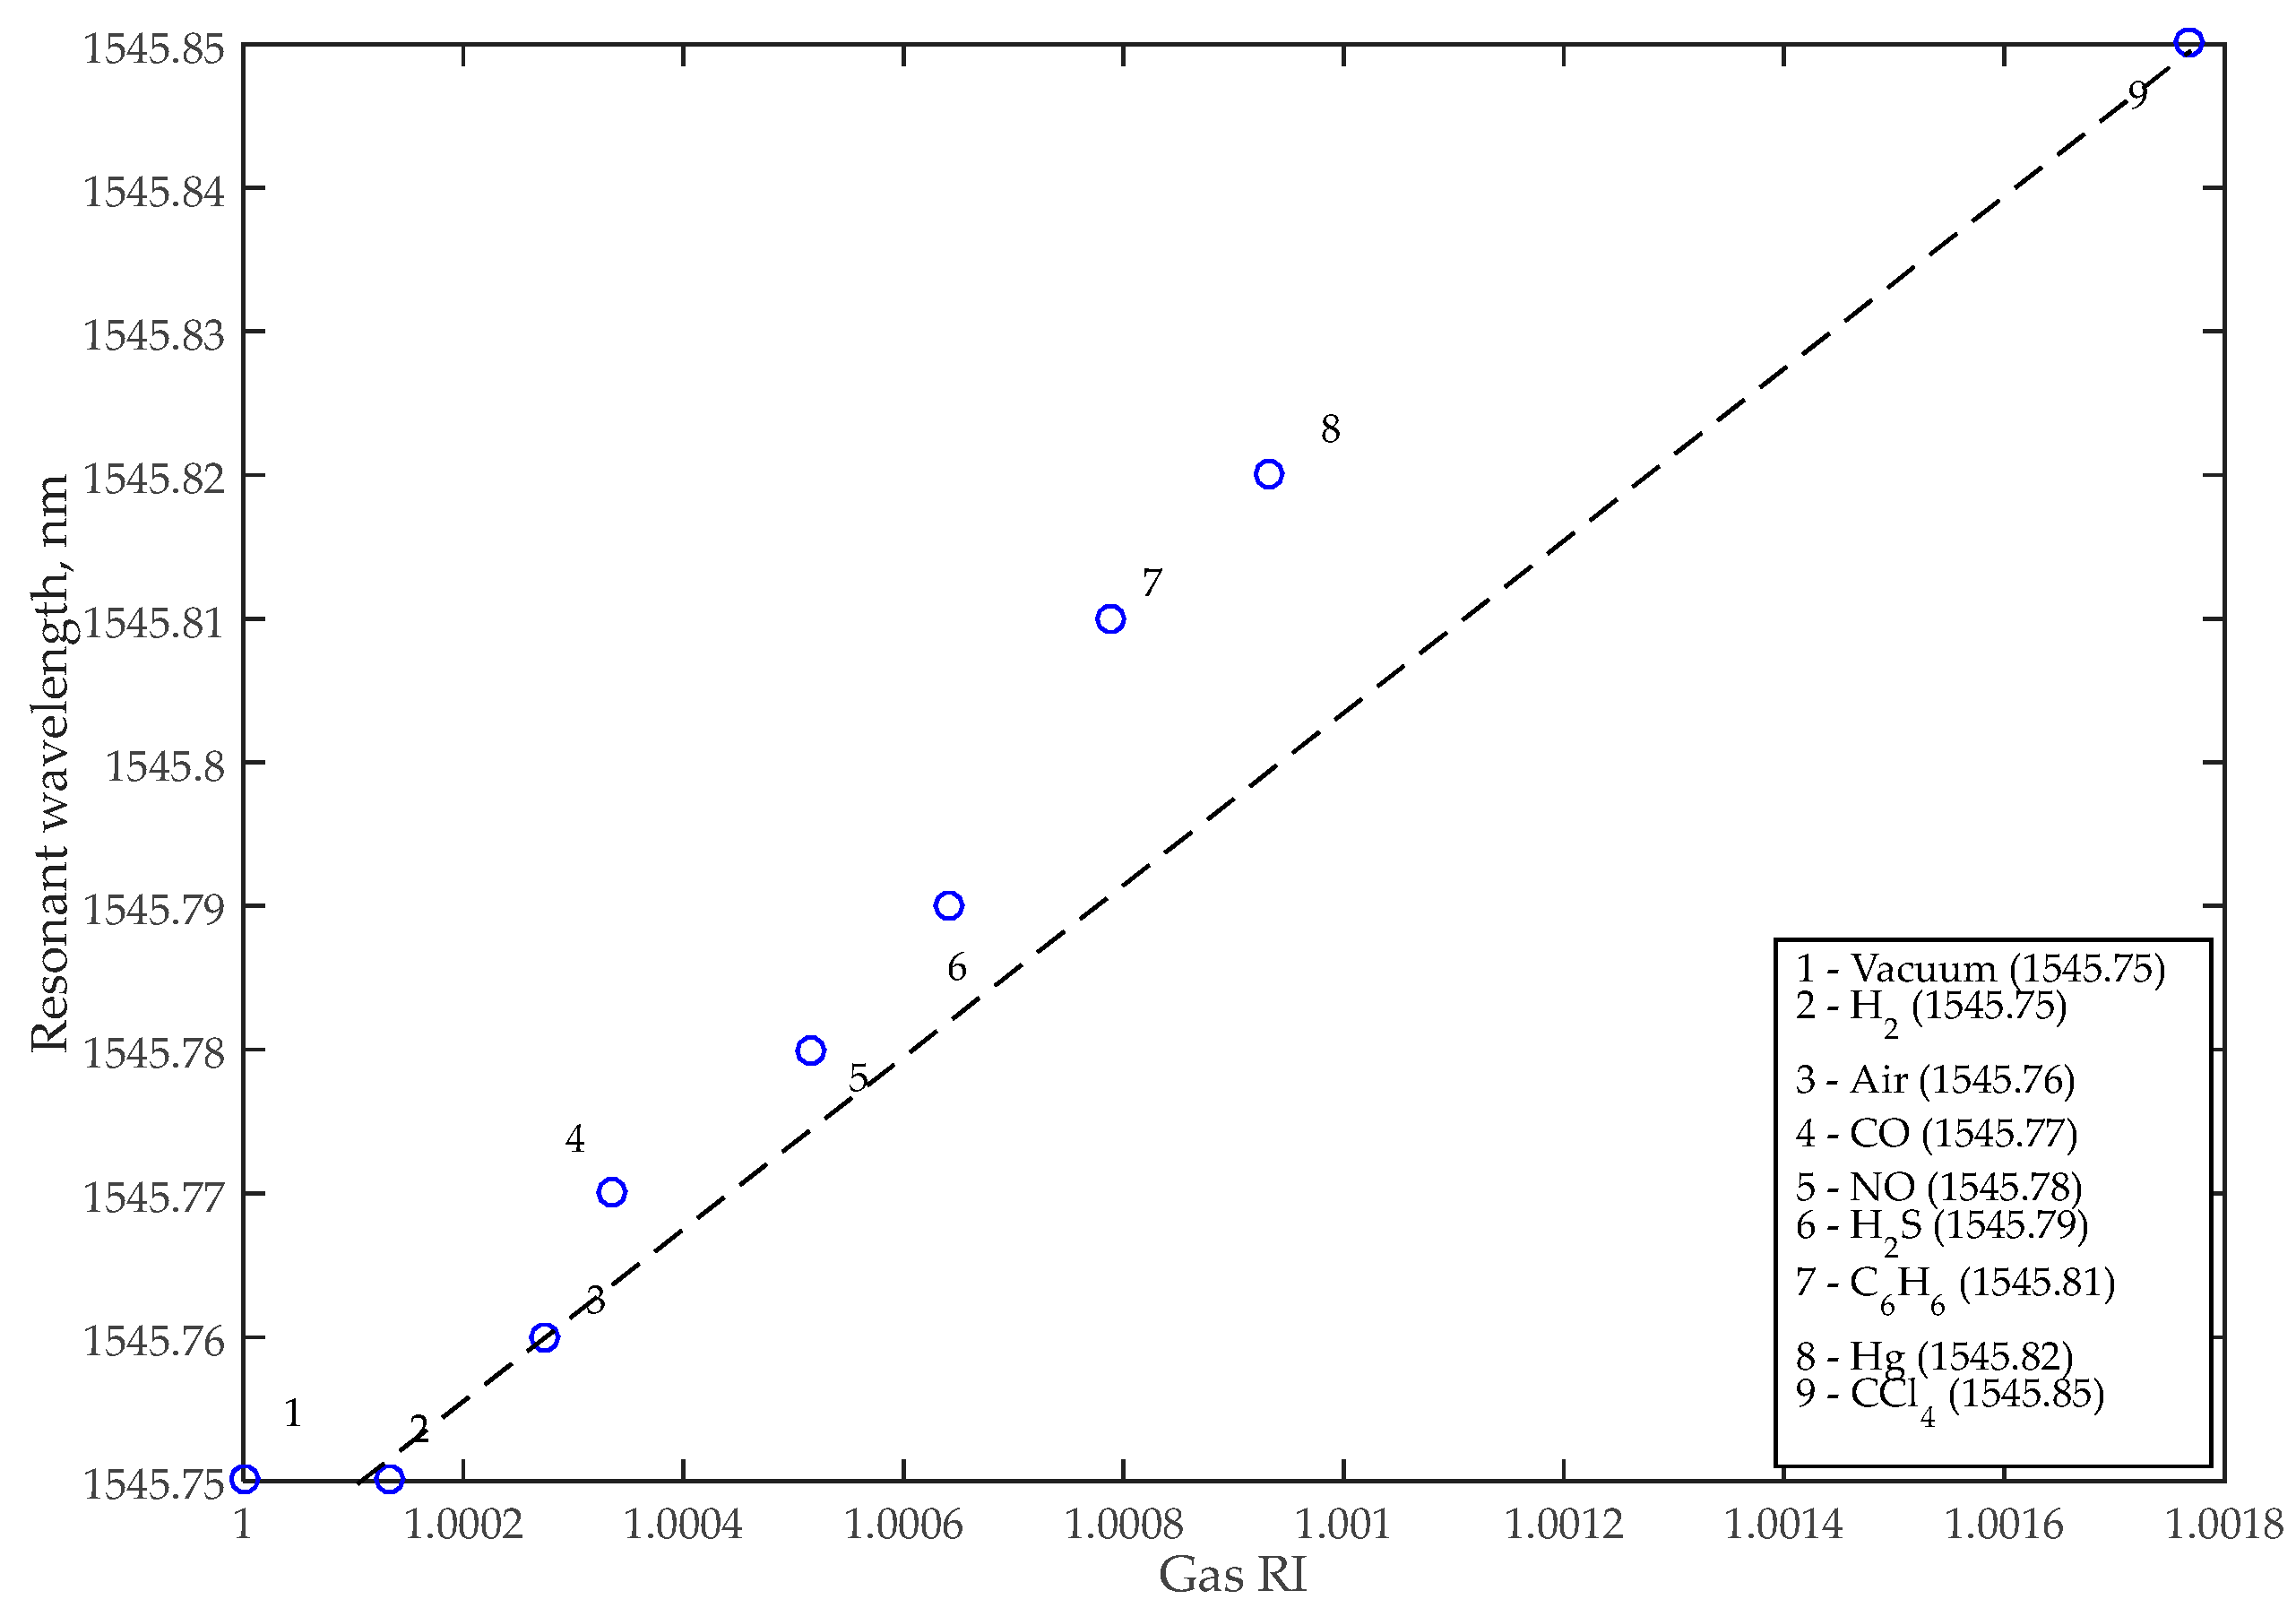
| Gas | Chemical Formula | n | Resonant Wavelength, nm | FWHM, pm | Sensitivity, nm/RIU | Q-Factor | LOD, 10−4 RIU |
|---|---|---|---|---|---|---|---|
| Vacuum | - | 1.0 | 1545.74 | 140 | 56 | 11,040 | 23.34 |
| Hydrogen | H2 | 1.00013 | 1545.75 | ||||
| Air | - | 1.000273 | 1545.76 | ||||
| Carbon monoxide | CO | 1.000334 | 1545.77 | ||||
| Nitric oxide | NO | 1.000516 | 1545.78 | ||||
| Hydrogen sulfide | H2S | 1.000641 | 1545.79 | ||||
| Benzene | C6H6 | 1.000788 | 1545.81 | ||||
| Mercury vapor | Hg | 1.000933 | 1545.82 | ||||
| Carbon tetrachloride | CCl4 | 1.001768 | 1545.85 |
| Gas | Chemical Formula | n | Resonant Wavelength, nm | FWHM, pm | Sensitivity, nm/RIU | Q-Factor | LOD, 10−4 RIU |
|---|---|---|---|---|---|---|---|
| Vacuum | - | 1.0 | 1543.02 | 140 | 100 | 17,140 | 9 |
| Hydrogen | H2 | 1.00013 | 1543.04 | ||||
| Air | - | 1.000273 | 1543.05 | ||||
| Carbon monoxide | CO | 1.000334 | 1543.06 | ||||
| Nitric oxide | NO | 1.000516 | 1543.07 | ||||
| Hydrogen sulfide | H2S | 1.000641 | 1543.09 | ||||
| Benzene | C6H6 | 1.000788 | 1543.10 | ||||
| Mercury vapor | Hg | 1.000933 | 1543.12 | ||||
| Carbon tetrachloride | CCl4 | 1.001768 | 1543.20 |
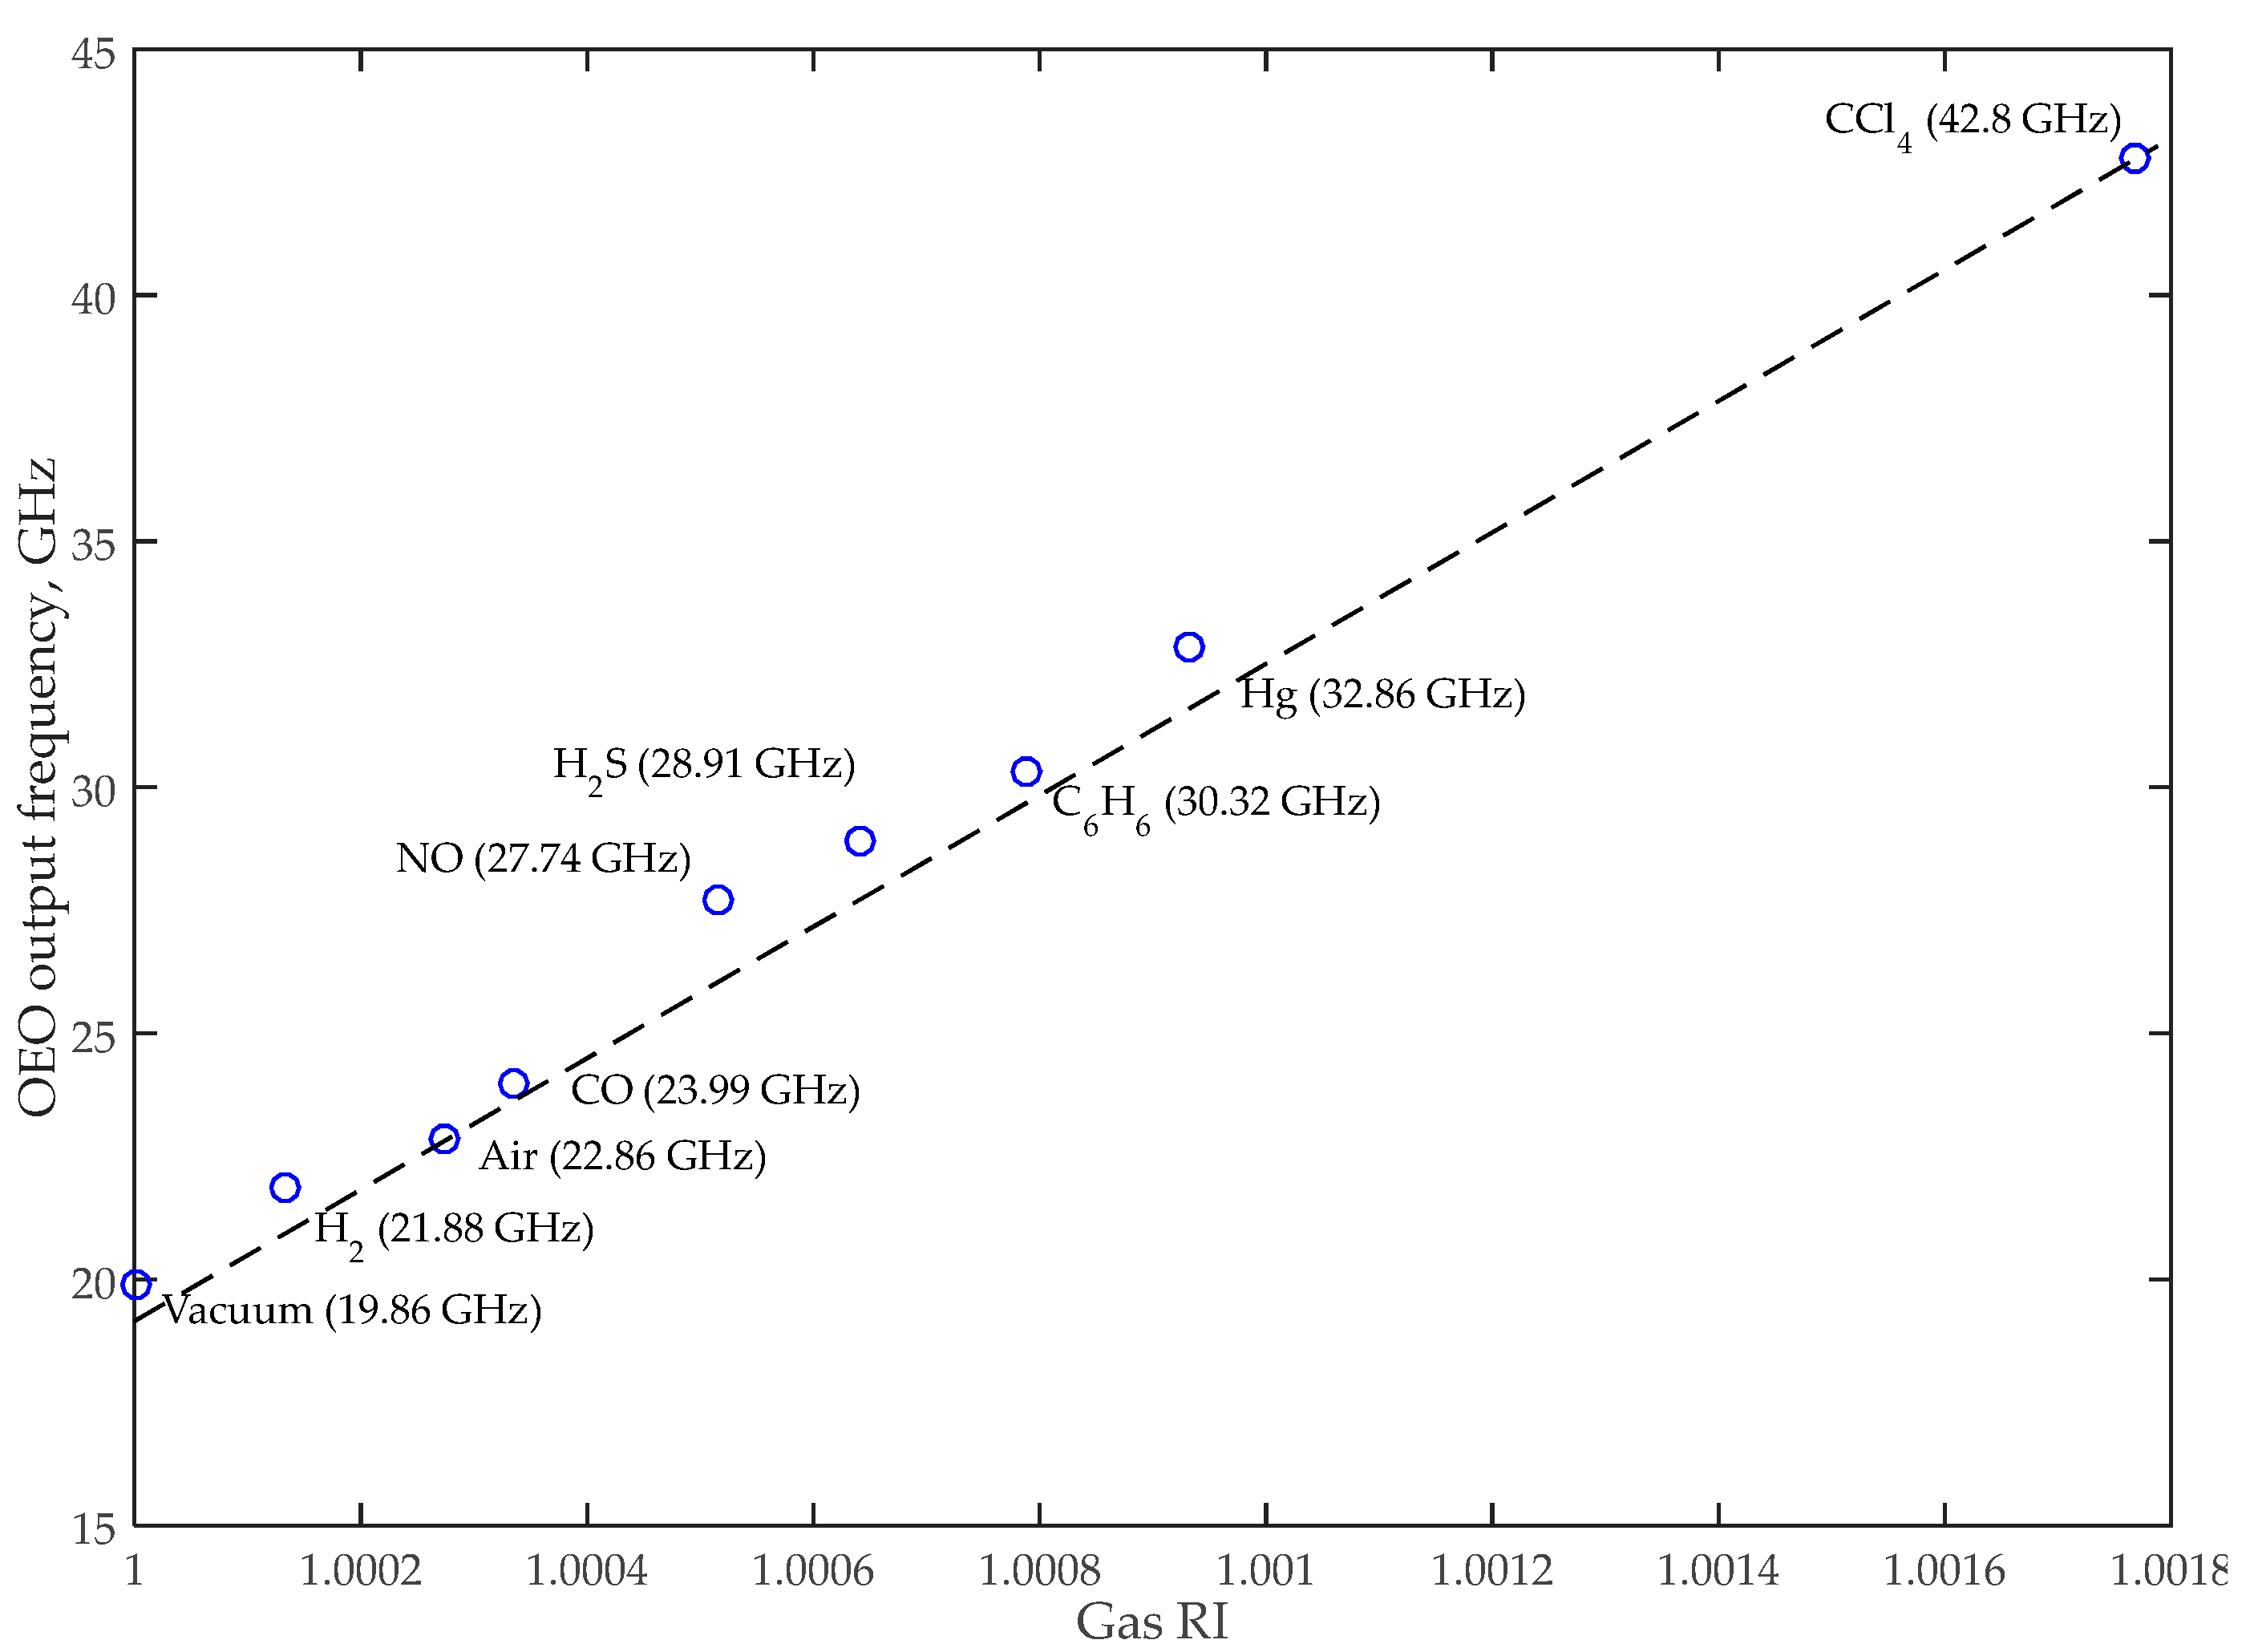
| Gas | Chemical Formula | n | System Sensitivity, GHz/RIU |
|---|---|---|---|
| Vacuum | - | 1.0 | 13,000 |
| Hydrogen | H2 | 1.000132 | |
| Carbon monoxide | CO | 1.000334 | |
| Nitric oxide | NO | 1.000516 | |
| Hydrogen sulfide | H2S | 1.000641 | |
| Benzene | C6H6 | 1.000788 | |
| Mercury vapor | Hg | 1.000933 | |
| Carbon tetrachloride | CCl4 | 1.001768 |
Disclaimer/Publisher’s Note: The statements, opinions and data contained in all publications are solely those of the individual author(s) and contributor(s) and not of MDPI and/or the editor(s). MDPI and/or the editor(s) disclaim responsibility for any injury to people or property resulting from any ideas, methods, instructions or products referred to in the content. |
© 2023 by the authors. Licensee MDPI, Basel, Switzerland. This article is an open access article distributed under the terms and conditions of the Creative Commons Attribution (CC BY) license (https://creativecommons.org/licenses/by/4.0/).
Share and Cite
Voronkov, G.S.; Aleksakina, Y.V.; Ivanov, V.V.; Zakoyan, A.G.; Stepanov, I.V.; Grakhova, E.P.; Butt, M.A.; Kutluyarov, R.V. Enhancing the Performance of the Photonic Integrated Sensing System by Applying Frequency Interrogation. Nanomaterials 2023, 13, 193. https://doi.org/10.3390/nano13010193
Voronkov GS, Aleksakina YV, Ivanov VV, Zakoyan AG, Stepanov IV, Grakhova EP, Butt MA, Kutluyarov RV. Enhancing the Performance of the Photonic Integrated Sensing System by Applying Frequency Interrogation. Nanomaterials. 2023; 13(1):193. https://doi.org/10.3390/nano13010193
Chicago/Turabian StyleVoronkov, Grigory S., Yana V. Aleksakina, Vladislav V. Ivanov, Aida G. Zakoyan, Ivan V. Stepanov, Elizaveta P. Grakhova, Muhammad A. Butt, and Ruslan V. Kutluyarov. 2023. "Enhancing the Performance of the Photonic Integrated Sensing System by Applying Frequency Interrogation" Nanomaterials 13, no. 1: 193. https://doi.org/10.3390/nano13010193