Article

Computational Fracture Modeling for Effects of Healed Crack Length and Interfacial Cohesive Properties in Self-Healing Concrete Using XFEM and Cohesive Surface Technique

1
Institute of Structural Mechanics, Bauhaus University Weimar, 99423 Weimar, Germany
2
School of Engineering, University of Greenwich, London SE10 9LS, UK
*
Author to whom correspondence should be addressed.
Computation 2023, 11(7), 142; https://doi.org/10.3390/computation11070142
Submission received: 30 March 2023 / Revised: 22 June 2023 / Accepted: 6 July 2023 / Published: 16 July 2023
(This article belongs to the Special Issue Application of Finite Element Methods)

Abstract

:
Healing patterns are a critical issue that influence the fracture mechanism of self-healing concrete (SHC) structures. Partial healing cracks could happen even during the normal operating conditions of the structure, such as sustainable applied loads or quick crack spreading. In this paper, the effects of two main factors that control healing patterns, the healed crack length and the interfacial cohesive properties between the solidified healing agent and the cracked surfaces on the load carrying capacity and the fracture mechanism of healed SHC samples, are computationally investigated. The proposed computational modeling framework is based on the extended finite element method (XFEM) and cohesive surface (CS) technique to model the fracture and debonding mechanism of 2D healed SHC samples under a uniaxial tensile test. The interfacial cohesive properties and the healed crack length have significant effects on the load carrying capacity, the crack initiation, the propagation, and the debonding potential of the solidified healing agent from the concrete matrix. The higher their values, the higher the load carrying capacity. The solidified healing agent will be debonded from the concrete matrix when the interfacial cohesive properties are less than 25% of the fracture properties of the solidified healing agent.

1. Introduction

The idea of sustainable composite materials has gained popularity recently, including self-healing concrete (SHC) which became a hot topic due to its ability of automatic crack repairing without human intervention to prolong the service life and reduce the maintenance cost of structures [1]. Many laboratory studies and experiments have been conducted to investigate the fracture of the capsules and the bonding interaction between capsules and the concrete matrix, as well as the healing efficiency and fracture mechanism, such as in [2,3]. However, computational modeling has shown advantages in modeling physical phenomena that are challenging and difficult to investigate experimentally, such as capsular clustering [4]. Most computational modeling in SHC has focused on the investigation of the fracture interaction between capsules and the concrete matrix using a variety of modeling techniques such as cohesive elements, which is based on the cohesive zone model (CZM) [5] and the extended finite element method (XFEM) with a cohesive surface (CS) technique and has shown high accuracy [6,7]. Studying the effects of the healing patterns of cracks on the fracture mechanism is required, especially when it comes to the design of self-healing structures. This is because different healing patterns of cracks could occur depending on many factors, such as the position of the capsules and the viscosity of the healing agent. Nevertheless, sustainable applied loads or quick crack propagation even during normal operational conditions of the structure could lead to partial healing at the crack surface because the capillary force might be insufficient to suck the healing agent from the fractured capsule. Furthermore, there is a possibility that full bonding between the healing agent and crack surfaces is not established because the chemical properties of the healing agent could be changed during the storage or manufacturing process. As a result, the effects of the healing patterns that are represented by the healed crack length and the interfacial cohesive properties between the healing agent and concrete matrix should be considered during the design of self-healing structures to assure the reliability of the healing process. Studying this phenomenon is challenging to investigate experimentally due to the difficulty in obtaining various healing patterns in addition to its high cost. Therefore, in this paper, the advantage of computational modeling will be exploited to study it.
Several computational techniques have been developed to allow for fracture modeling of brittle and quasi-brittle materials [8]. The meshfree method was developed to model discrete cracks via the activation of crack surfaces in individual particles without the prior configuration of crack patterns [9]. It was developed further to geometrically model non-linear problems and 3D models [10,11]. Although the zero thickness cohesive element approach is considered to be the most used fracture modeling approach in the literature, it has several concerns, such as mesh dependency and artificial compliance [12]. Recently, a computational model based on an arbitrary Lagrangian–Eulerian (ALE) formulation has been developed to simulate fracture development in sandwich structures [13]. The internal core is modeled as plane stress triangular elements, while the facesheets are modeled as a one-dimensional Timoshenko beam. In order to predict the direction and displacement of the crack tip front, a suitable fracture criterion and mesh refitting technique are implemented in the moving mesh approach used to analyze the crack growth in the core, although a preexisting crack is inserted in the middle of the core thickness. The suggested method combines ALE formulation with CZM in order to demonstrate the delamination mechanism between the core and the facesheets. The developed model was built with the help of COMSOL Multiphysics software and MATLAB environment. It is worth mentioning that this model needs further development to allow for the initiation of cracks.
The extended finite element method (XFEM) is a powerful, flexible, and promising discrete crack approach that enables crack initiation and propagation without the requirement of re-meshing [8]. Also, it has been proven that the predefined crack path is not necessary in such modeling, as it can predict crack propagation trajectories accurately, meaning that XFEM can be used to model fractures with or without precracks [6,14,15]. Moreover, high accuracy for the modeling fracture in concrete materials [16] has been shown, and it has already been integrated into commercial software like ABAQUS [8]. In addition, XFEM is considered to be the most cost-efficient computational modeling fracture method within continuous and discontinuous methods such as ALE, mesh-refinement-based approaches like the zero thickness cohesive element approach, and moving mesh like phase-field models. This is due to the fact that XFEM only increases the degrees of freedom (DOFs) in the element nodes intersected by the crack without any need for mesh refinement or remeshing [17]. Finding computational fracture simulation that examines the influence of healing patterns on the fracture mechanism of self-healing concrete in the literature is challenging. The key novelty of this study is to computationally investigate the effects of healing patterns represented by the healed crack length and the interfacial cohesive properties on the fracture mechanism of healed SHC samples. The proposed modeling framework in this paper is based on XFEM and CS techniques to model the fracture mechanism and debonding probabilities of the solidified healing agent from the concrete matrix. The computational modeling was conducted for two-dimensional healed SHC samples subjected to uniform displacements applied at both the top and bottom ends.
This paper is presented as follows: Section 2 provides a detailed classification of healing patterns with two main types: geometrical and adhesive. Section 3 explains the proposed framework for computational modeling using XFEM and the CS technique based on the CZM. Section 4 describes the numerical simulations that were performed to study the effects of healing patterns on the overall mechanical strength of the healed concrete samples, including the mesh size analysis and the parametric studies. Section 5 discusses the effects of the interfacial cohesive properties and the healed crack length on the load carrying capacity and the crack pattern of the self-healing concrete based on the obtained results from the numerical simulations. Section 6 summarizes and emphasizes the main conclusions of this research work.

2. Types of Healing Patterns

The releasing process of the healing agent from the microcapsules can generate different patterns of healed cracks. These various healing patterns can range from unhealed to fully healed cracks; see Figure 1. These healing patterns can be classified into two main types: geometrical and adhesive. The first type is geometrical, which represents the length of the healed crack, and is also known as the bonded area in the experimental studies [3]. The second type is adhesive, which represents the interfacial cohesive properties between the solidified healing agent and the concrete crack surfaces and is also known as an adhesive property that might cause an adhesive failure in the experimental studies [18]. The length of the healed crack is dependent on many issues such as the viscosity of the healing agent, the crack width, the applied loads, and the crack propagation. All of these affect the capillary force which drives the healing agent through the cracks. The healed crack length could be less than the crack length or even zero, meaning that the healing agent did not go through the crack at all. Therefore, the healed crack length should be adequate to transfer the stress in the contact zone between the concrete matrix and the solidified healing agent. The interfacial cohesive properties are dependent on the chemical properties of the healing agent and its shelf life. The interfacial cohesive properties could be less than either the cohesive properties of the solidified healing agent or the concrete matrix. Hence, the interfacial cohesive properties should be sufficient to allow for transferring the stress successfully in the interfacial transition zone (itz) between the concrete matrix and the solidified healing agent without permitting debonding.
In order to model these types of healing patterns, the most critical healing patterns were geometrically investigated, as demonstrated in Figure 1. Effects of the healed crack length are geometrically represented in this figure by varying the ratio of the healed crack length (Lh) relative to the whole crack length. However, the effects of the interfacial cohesive properties are represented by varying the ratio of the cohesive properties of the interfacial transition zone (itz) relative to the properties of the solidified healing agent. Based on these observations, a simple procedure to model the effects of the healed crack length and the interfacial cohesive properties can be modeled. In this proposed study, the samples only include a single crack within a concrete matrix, a solidified healing agent, and the contact surfaces between this concrete crack and the solidified healing agent. The length of the solidified healing agent and the interfacial cohesive properties of the contact surfaces will be changed accordingly to represent different degrees of healing patterns. The healed crack length can be varied from zero healing to full healing. These two extreme contrasting scenarios show that the healing agent has never gone through the crack length and has gone through the entire crack length, respectively. The healed crack length (Lh) will be utilized to define the degree of the geometrical healing pattern. The Lh ratio parameter represents the proportion of the actual healed crack length in relation to the total crack length. The range of the Lh ratio can be varied from 100 to 0%; these represent the two extreme limits that represent whether the crack has completely healed or not healed at all, as shown in Figure 1a,h, respectively. The interfacial cohesive properties of the interfacial transition zone (itz) between the solidified healing agent and the concrete crack surfaces will be used to define the degree of the adhesively healing pattern (degree of bonding). The parameter itz ration represents that the interfacial cohesive properties are varied relative to the properties of the solidified healing agent. The range of itz ration can be varied from 100 to 0%. These represent the two extreme limits which represent that the solidified healing agent has complete bonding with the concrete matrix (fully bonded) and zero bonding with the concrete matrix (non-bonded).

3. Computational Modeling Framework

The specimens are modeled as a composite consisting of three components: a concrete matrix, a solidified healing agent, and an interface between them. The concrete matrix and the solidified healing agent are modeled using the extended finite element method (XFEM). The interaction between these two components is simulated by employing the cohesive surface technique (CS), as illustrated in Figure 2. Both techniques that are employed to perform the initiation and propagation of cracks are based on a cohesive zone model (CZM) for fracture modeling. The modeling framework was verified in another study [7], which was shown to be superior in determining the load carrying capability and fracture pattern compared to the zero thickness cohesive element approach.

3.1. The Extended Finite Element Method (XFEM)

The extended finite element method (XFEM), which is based on a local partition of unity, can be described as an expansion of the traditional finite element method. The extended finite element method (XFEM) is considered as an extension of the conventional finite element method based on the concept of partition of unity. This allows the cracks to be represented as local enrichment functions and be easily integrated into a finite element mesh without remeshing during the simulation [19]; see Figure 3. The presence of cracks is depicted through the inclusion of enrichment functions, which are incorporated into the standard displacement interpolation function; see Equation (1) [20]. The black dots denote the enriched nodes, the white dots denote the crack tip enriched node, and the standard nodes are not shown. XFEM has already been integrated into commercial software like Abaqus, making it one of the most promising approaches for fracture modeling [8,21]. However, a more specific description of this method can be found in [19]. In Abaqus, XFEM is defined in the interaction module and is assigned to model the cracks inside the concrete matrix and solidified healing agent.
u = I = 1 N N I x u I + H x a I + α = 1 4 F α ( x ) b I α
NI(x) represents the shape functions, uI is the nodal displacement vector, H(x) is the jump functions such as the Heaviside functions that represent the cracks, aI and bIα are nodal vectors of the enriched degree of freedom, and Fα(x) is the crack tip functions. The first term on the right side is applicable to all nodes within the model, while the second term is specific to nodes whose shape function support intersects the interior of the crack. The third term is solely utilized for nodes whose shape function support intersects the crack tip. This third term is the so-called crack tip enrichment that contains information regarding the analytical solution in linear elastic fracture mechanics. However, linear elastic fracture mechanics cannot properly deal with concrete materials. Thus, the last term on the right hand side has been omitted in this study. Therefore, the crack tip cannot be inside the element but can be located at the element edge instead, as shown in Figure 3. Despite the great advantages of XFEM for fracture modeling, it has a few limitations [21]. Mainly, two limitations should be considered: the first concerns crack propagation near the element edge. The second is about allowing the initiation of multiple cracks in the same enrichment zone. However, there is an option in the Abaqus input file to overcome this limitation; for more details, see [6,21].

3.2. Cohesive Surface Technique (CS)

The cohesive surface technique (CS) is designed to model a zero thickness contact interface between two surfaces based on the traction–separation response [6,21]. The CS technique is employed to model the cohesive contact between the solidified healing agent and the concrete matrix. It is defined in Abaqus as a cohesive surface interaction property and is modeled with pure master–slave roles in the contact formulation. Within this study, the outer surface of the solidified healing agent is designated as a slave surface, while the cracked surface of the concrete matrix is designated as the master surface.

3.3. Cohesive Zone Model (CZM)

The cohesive zone model (CZM) uses a traction–separation law to represent the failure mechanism of cracks and it is applied across the crack surface that links the cohesive traction transmitted by the discontinuity surface to the displacement jump, characterized by the separation vector. The CZM for XFEM is an initially rigid model, see Figure 4, while CZM for CS is initially an elastic model which is represented by the linear zone (linear elastic traction) and the softening zone (damage evolution); see Figure 5. Both models are defined in Abaqus by two criteria: damage initiation and damage evolution. The elastic behavior of a cracked element is expressed in terms of an elastic constitutive matrix that connects normal and shear stresses to normal and shear separations. In the case of 3D, the nominal traction stress vector (t) is composed of three components: tn, ts, and tt, which represent the normal and shear tractions in two directions, respectively. The corresponding separations are denoted by δn, δs, and δt. The elastic behavior can then be written as follows:
t = t n t s t t = K n n 0 0 0 K s s 0 0 0 K t t δ n δ s δ t = K δ
The elastic response is governed by the penalty stiffnesses Knn, Kss, and Ktt, which are calculated as a function of the two adjacent material stiffnesses [22]. These values do not affect the overall specimen stiffness [23], and in this paper, it has been taken as 1 × 10⁶ MPa/mm. Moreover, it has been assumed that the normal and shear penalty stiffnesses are decoupled, meaning that the pure normal opening force of the interface does not produce shear forces, and vice versa [6]. The elastic zone is assumed to be linear by default. However, several damage evolution laws are available for the softening zone, for example, the linear and non-linear traction–separation law [21]. In this paper, the softening is defined as linear which means that a bilinear traction–separation law is used; see Figure 5. The traction–separation behavior is defined within the material properties for XFEM; however, it is defined as part of the interaction properties for the CS technique.

3.3.1. Damage Initiation

Multiple damage initiation criteria are documented in the literature and have already been incorporated into software like Abaqus. These criteria include the maximum separation criterion, quadratic separation criterion, maximum nominal stress criterion, and quadratic stress criterion. The damage will be initiated when the maximal stress exceeds the maximum strength in the case of the stress criterion. In this study, the maximum principal stress damage criterion was used in the case of XFEM. Therefore, a crack may form if the maximal principal stress determined by its integration points matches the requirement of Equation (3). However, the maximum nominal stress damage criterion is used for the CS technique, which means that separation can happen when the maximum nominal traction meets the criterion of Equation (4). A more detailed explanation in this regard can be found in [21].
m a x 0 , σ m a x p s σ * 1
m a x t n t n * , t s t n * , t t t t * = 1
σmaxps is the calculated maximum primary stress, while σ* is the material’s maximum strength. The normal, shear, and tangential components of the interfacial tractions are denoted by n, s, and t, respectively. * denotes the maximum interfacial tractions.

3.3.2. Damage Evolution

The damage evolution involves defining the softening part of the traction–separation law; so, it includes describing the degradation of the cohesive stiffness. D is a scalar damage variable that starts initially from 0 and develops during the loading process until 1. Either the maximal displacement or the fracture energy, which is the area under the curve of the traction–separation law, must be specified in Abaqus [21]. In this study, the fracture energy was used to define the damage evolution with linear softening. In order to characterize the development of damage when both normal and shear separations occur across the interface, effective separation is defined based on the approach described in [24]:
δ m = δ n 2 + δ s 2 + δ t 2
D = δ m * δ m u δ m u δ m 0 δ m * δ m 0
t n = 1 D t ¯ n if   t n 0   t ¯ n if   t n < 0   c o m p r e s s i o n
t s = 1 D t ¯ s
t t = 1 D t ¯ t
δ n ,   δ s ,   a n d   δ t are the normal, shear, and tangential components of the interfacial separation directions, respectively. δ m denotes the effective separation and δ m * is the maximum effective separation during loading. The effective separation just prior to unloading is δ m u , while the effective separation during the initial stages of damage is δ m 0 . In contrast, the elastic traction–separation behavior predicts that for current separations without damage, t ¯ n ,   t ¯ s ,   a n d   t ¯ t are the contact traction components. In order to avoid compressive damage, ⟨⟩ Macaulay brackets are utilized.
The region beneath the curve shown in Figure 5 represents the energy dissipated in order to create a completely separated pair of surfaces, which is referred to as the interface fracture energy. The placement of the interface with respect to the applied load can lead to a mixed-mode propagation response of the cohesive interface for healed cracks. This mixed mode encompasses various energies associated with the capability of debonding in the normal (n) and parallel (s, t) directions to the interface. The maximum fracture separation is subsequently determined using the equation provided in [24]:
δ n * = 2 G n * t n 0
δ s * = 2 G s * t s 0
δ t * = 2 G t * t t 0
It is assumed in this study that the interaction between the energies for each mode (i.e., n, s, and t) complies with the power law fracture criterion [24], as stated by the following:
G n G n * α + G s G s * α + G t G t * α = 1
where the power α is a cohesive property parameter that represents the interaction between modes, and Gn, GS, and Gt are the energy release rates derived from the traction and normal, shear, and tangential displacements during interface opening. The properties G n * ,   G s * ,   a n d   G t * represent the critical interface toughness for each direction. In this research, it is assumed that the critical fracture toughness remains the same in all directions. Additionally, in order to consider the influence of this parameter on the response, a value of α = 1 was employed [24].

4. Numerical Simulations

Two-dimensional specimens were loaded under uniaxial tension from both sides: top and bottom. The specimens represent healed samples with the width of the healed crack being 0.5 mm and variation in the healed crack length ratios: 100%, 75%, 50%, and 25%. The healed length with the smallest healed crack ratio has the smallest healed length which is equal to 25% of the cracked length and vice versa. The dimensions of the sample’s geometry, along with the corresponding boundary conditions, are illustrated in Figure 6. Uniform displacements of 0.5 mm were imposed on both the top and bottom surfaces of the specimens. The simulation was performed using Abaqus/Static, and the samples were meshed with quadrilateral elements (Q4) under the assumption of plane stress state. Every healed specimen was divided into three parts: the top and bottom parts represent the concrete matrix, which is divided by the crack path beforehand, and the middle part represents the solidified healing agent. The three parts of each specimen were modeled via XFEM, which means that there were three enrichment zones, one for each part. The interactions between these parts were modeled via the cohesive surface technique (CS). In order to investigate where the crack would initiate; therefore, a preexisting crack with this type of analysis is not required. Table 1 defines the material properties used in these simulations which are considered by [6,25,26,27]. Their parameters are then represented by Young’s modulus (E), Poisson’s ratio (ν), maximum tensile strength (σ*), and fracture energy (Gf).
In this study, to overcome the numerical convergence issues that occur with such modeling, the viscosity coefficient value was taken as 0.0001 [21]. Also, the initial time increment was chosen to be 1 × 10⁻⁹, and the minimum time increment was 1 × 10⁻¹⁵. Within the step module, the maximum number of cuts (IA) permitted for an increment was modified to 30. More detailed information about modeling implementation in Abaqus can be found in [4].

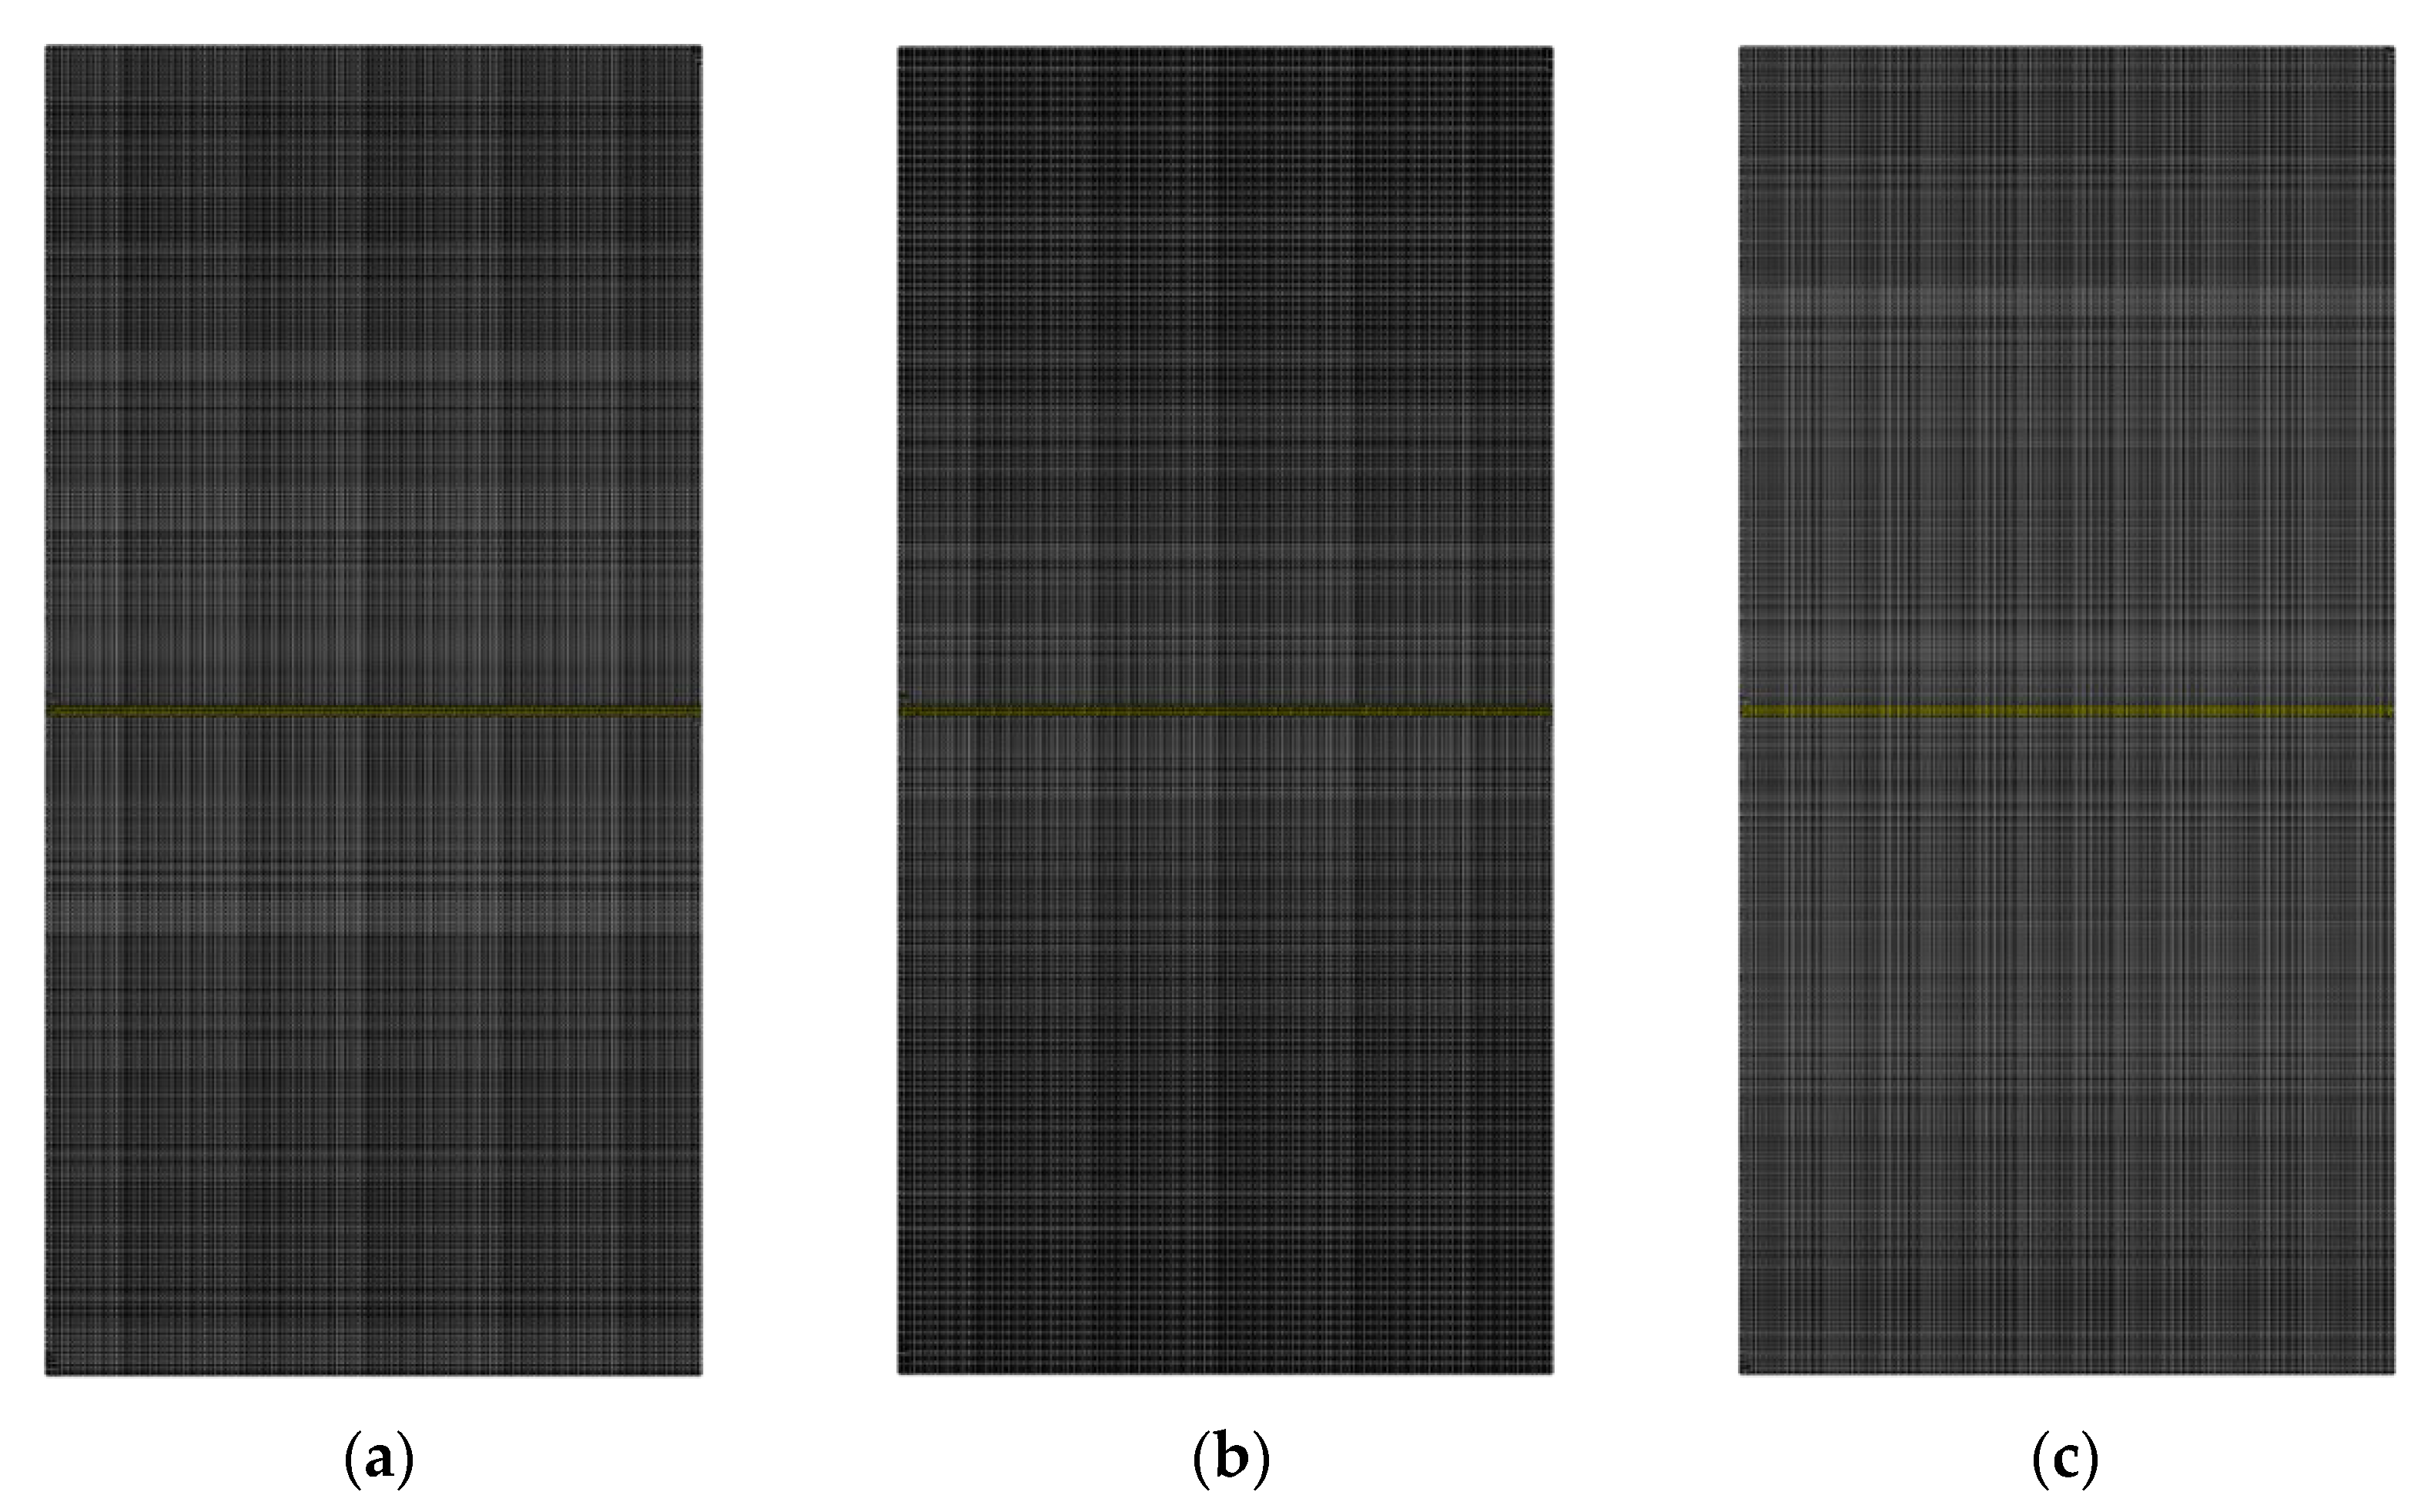
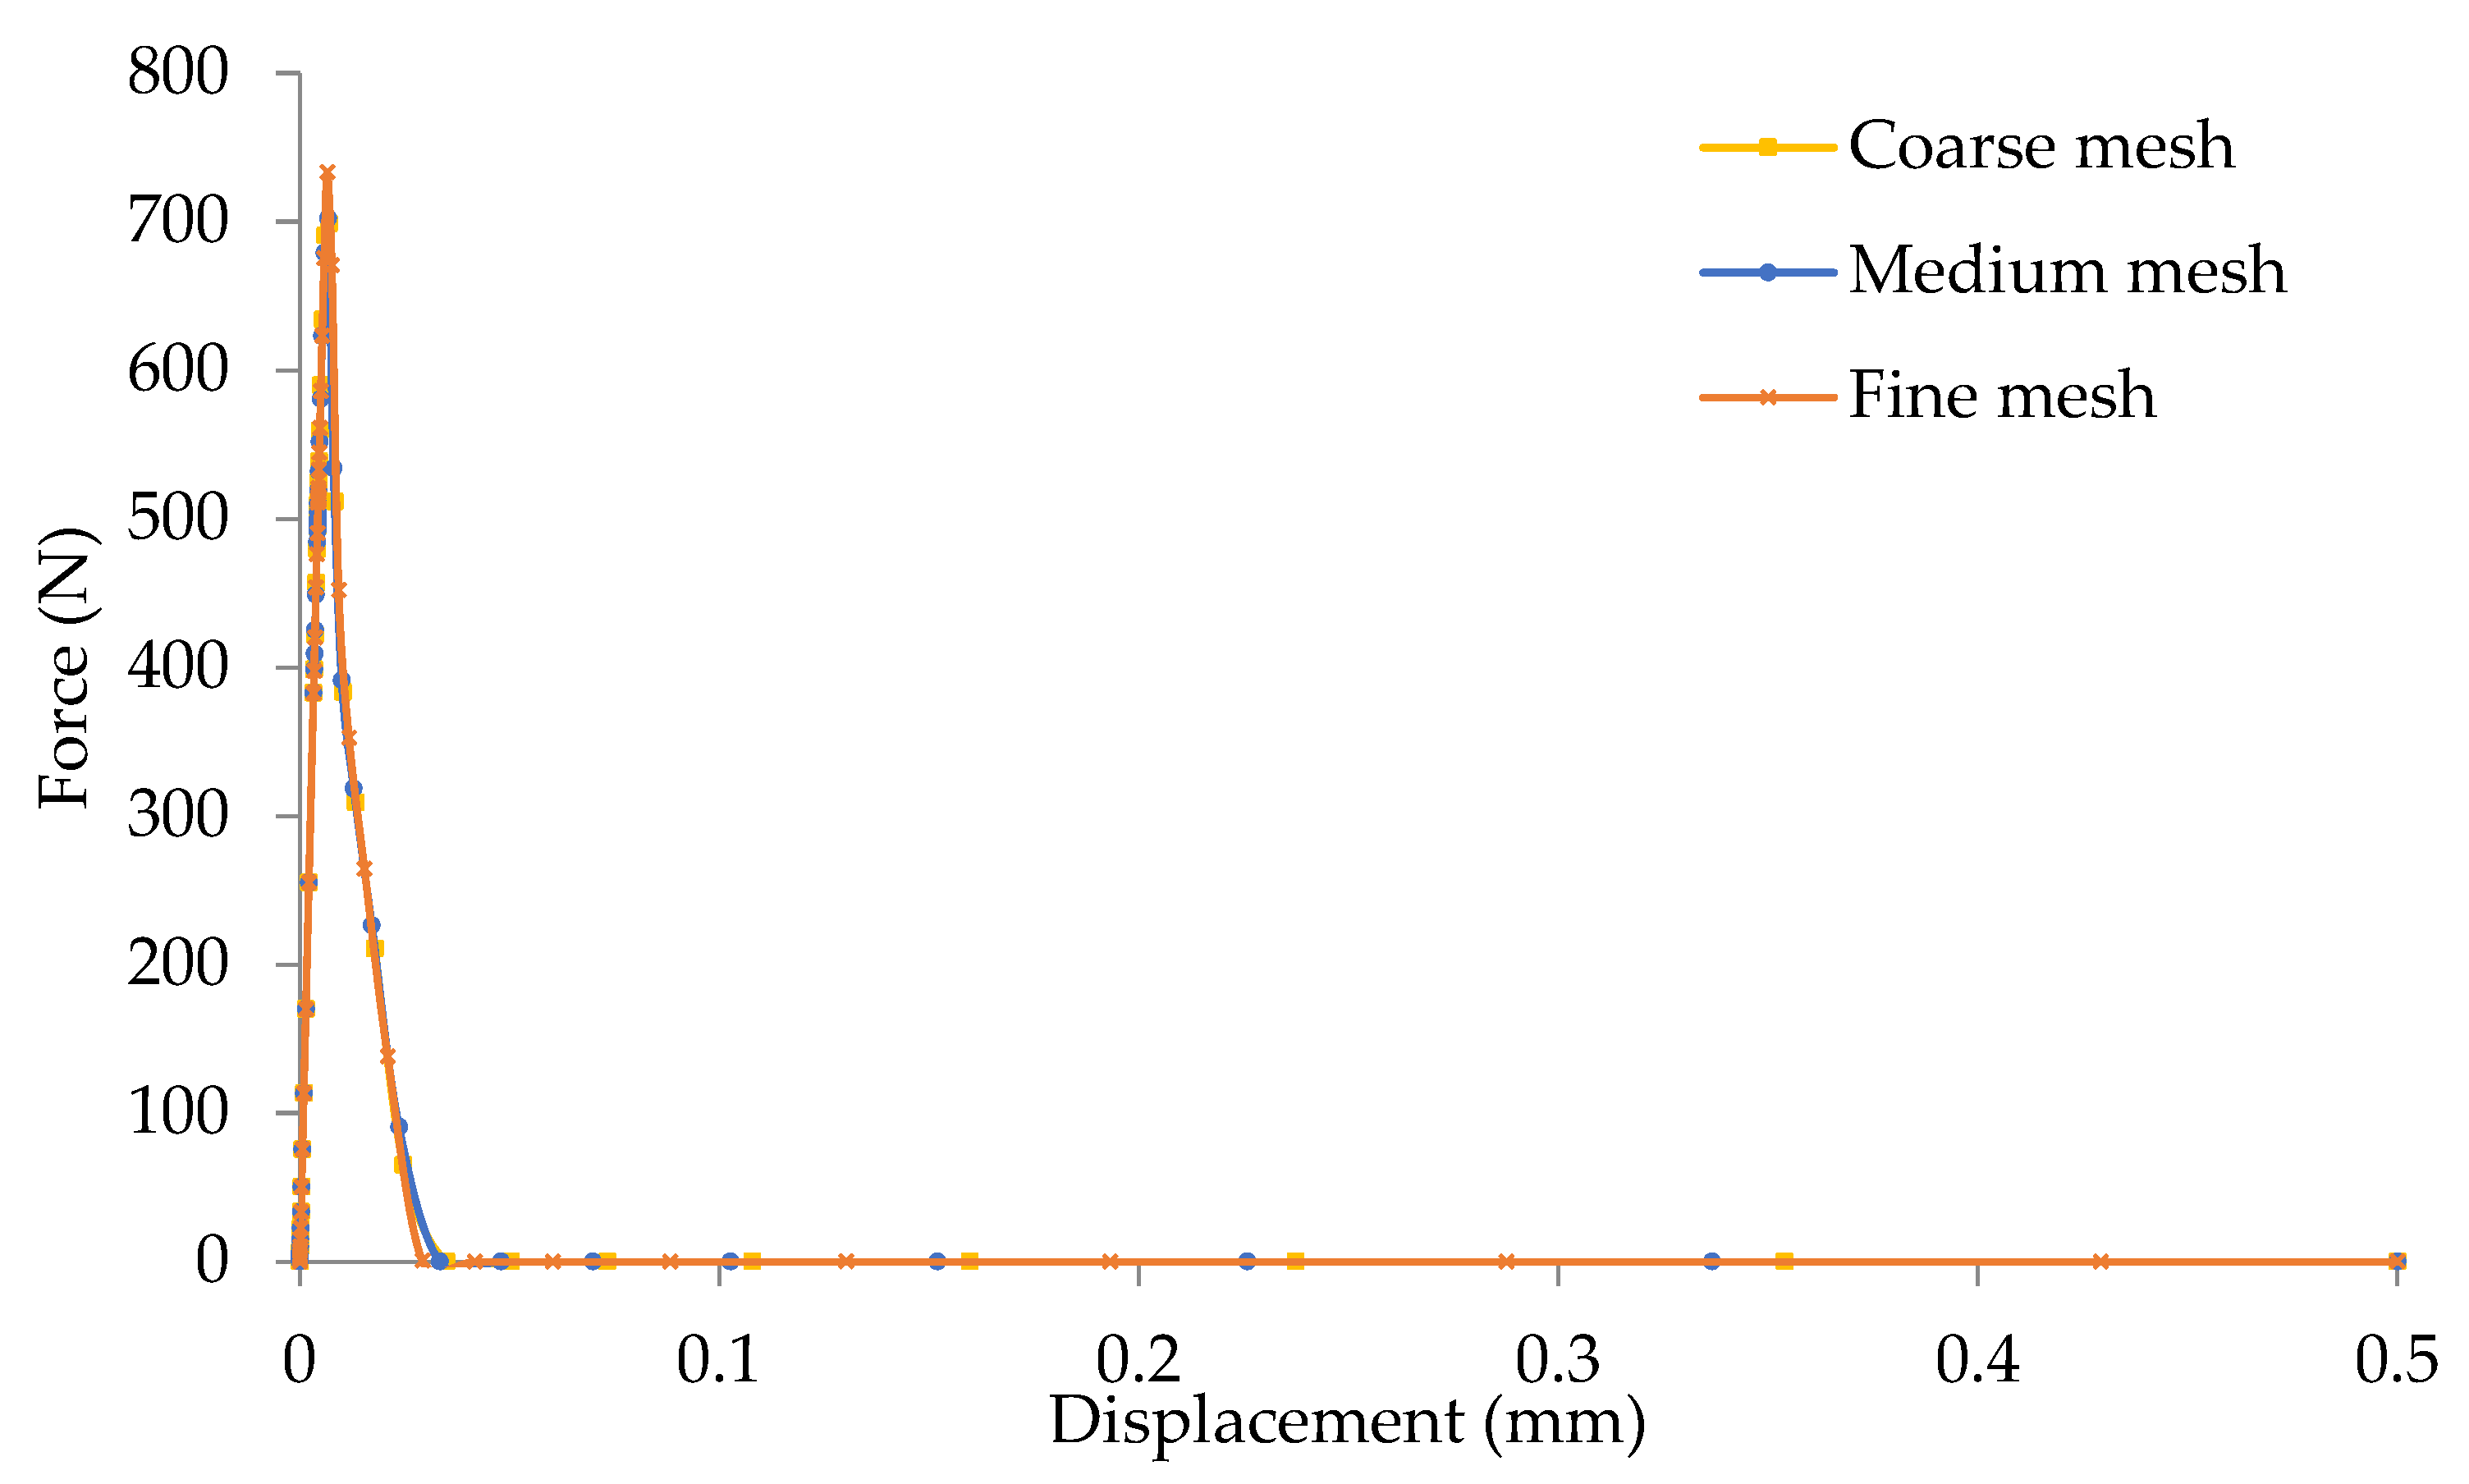
4.1. Mesh Size Analysis

Three distinct mesh densities were conducted in order to determine the level of mesh refinement necessary to achieve trustworthy findings, as illustrated in Figure 7. The coarse mesh had 42,900 elements consisting of 42,400 elements for the concrete matrix and 500 for the healing agent. The medium mesh had 55,600 elements for the concrete matrix and 800 for the healing agent. The fine mesh had 87,750 elements consisting of 86,500 elements for the concrete matrix and 1250 for the healing agent. Figure 8 shows the force displacement curves for each mesh discretization. The force–displacement curves obtained from the medium mesh and fine mesh discretization were highly similar. As a result, the medium mesh discretization was utilized for simultaneously presenting the results in this study.

4.2. Parametric Studies

Parametric studies of four different interfacial fracture properties were performed to study the effects of the interfacial cohesive properties between the solidified healing agent and the cracked surfaces of the concrete specimen on the load carrying capacity of healed specimens with four different healed crack length ratios. The four healed crack length ratios (Lh) ranged from 25% (Lh = 6.25 mm) to 100% (Lh = 25 mm); see Figure 9. Each part was given the values for the material parameters listed in Table 1. The interaction between the solidified healing agent and concrete matrix (i.e., the interfacial transition zone) is defined as a cohesive surface. Only two parameters that represent the cohesive properties of the interfacial transition zone (itz), the maximum interfacial cohesive strength σ* and the interfacial fracture energy Gf, were varied relative to the properties of the solidified healing agent for each simulation, while the other parameters were fixed, i.e., they ranged from 25% (σ* = 9.75 Mpa, Gf = 0.022 N/mm) to 100% (σ* = 39 Mpa, Gf = 0.088 N/mm).

5. Results and Discussion

This section discusses the effects of the interfacial cohesive properties and the healed crack length on the load carrying capacity and the crack pattern of self-healing concrete through the findings from the numerical simulations. It is worth mentioning that the accuracy of the proposed modeling framework was numerically investigated in a previous study [7]. The obtained results were compared with the most used modeling approach in the literature, the zero thickness cohesive element approach, and showed significant accuracy of the proposed model in determining the load carrying capacity and fracture pattern. Also, the crack patterns obtained from this study will be compared with a recent experimental study which had a close sample configuration [3]. It should be noted that to represent the obtained force displacement curves clearly, the maximum range for displacement was adapted to 0.1 mm, as all samples are fractured completely before this value, which can also clearly be noticed in Figure 8.

5.1. Effects of Interfacial Cohesive Properties on the Load Carrying Capacity of SHC

The four specimens with various healed crack length ratios are illustrated in Figure 10, Figure 11, Figure 12 and Figure 13 with the effects of the interfacial cohesive properties (itz) on the load carrying capacity. In these figures, the cohesive strength of the interfacial transition zone (itz) ranges from 9.75 MPa (i.e., 25% of the healing agent strength) to 39 MPa (same as a healing agent) for healed crack length ratios of 100%, 75%, 50%, and 25%. Similarly, the fracture energy of the interfacial zone (itz) ranges from 0.022 N/mm (i.e., 25% of the healing agent fracture energy) to 0.088 N/mm (same as the healing agent). It is clear that the load carrying capacity of the specimen is highly influenced by interfacial cohesive properties. The effects of the interfacial cohesive properties itz on the load carrying capacity of the SHC specimen for the healed crack length ratio of 100% are shown in Figure 10. The maximum load carried by the specimen decreased from 702.1 N for itz = 100% to 360.3 N for itz = 25%. Therefore, it is obvious that the load carrying capacity of the SHC specimen is significantly influenced by the interfacial cohesive characteristics (itz). The same phenomenon can also be found in Figure 11, Figure 12 and Figure 13 for the healed crack length ratios of 75%, 50%, and 25%, respectively. It is clear that a higher maximum load will be achieved when the interfacial cohesive fracture properties have the same values as the healing agent. In other words, the load carrying capacity increases with increasing itz, and vice versa.

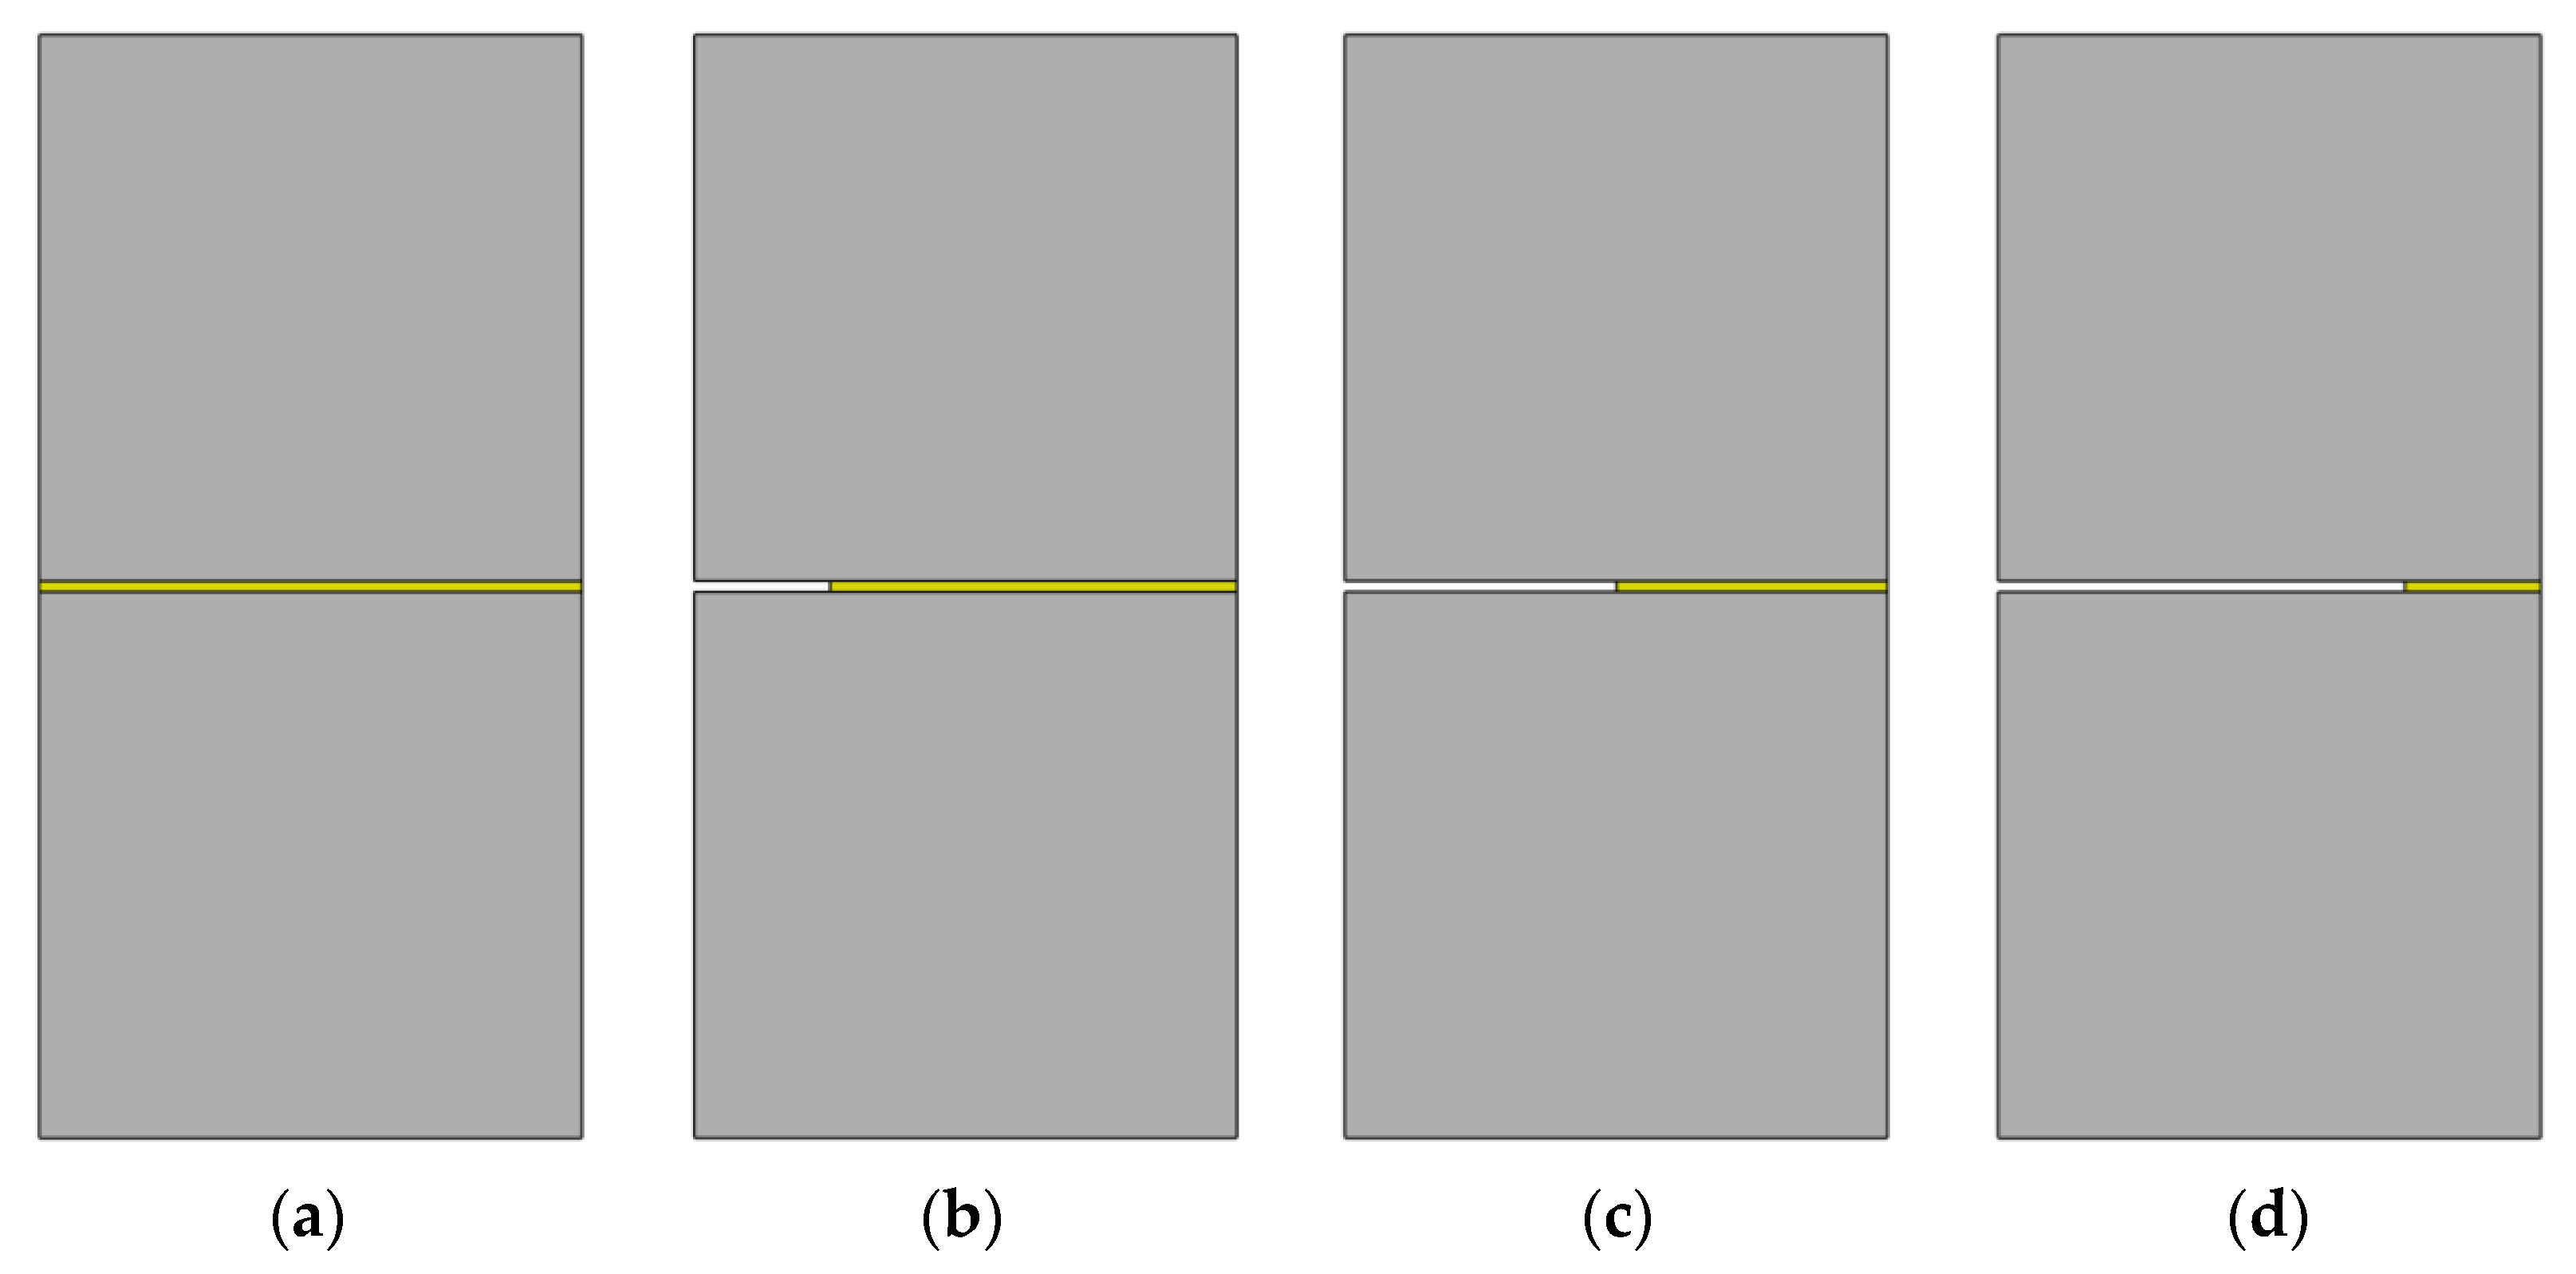
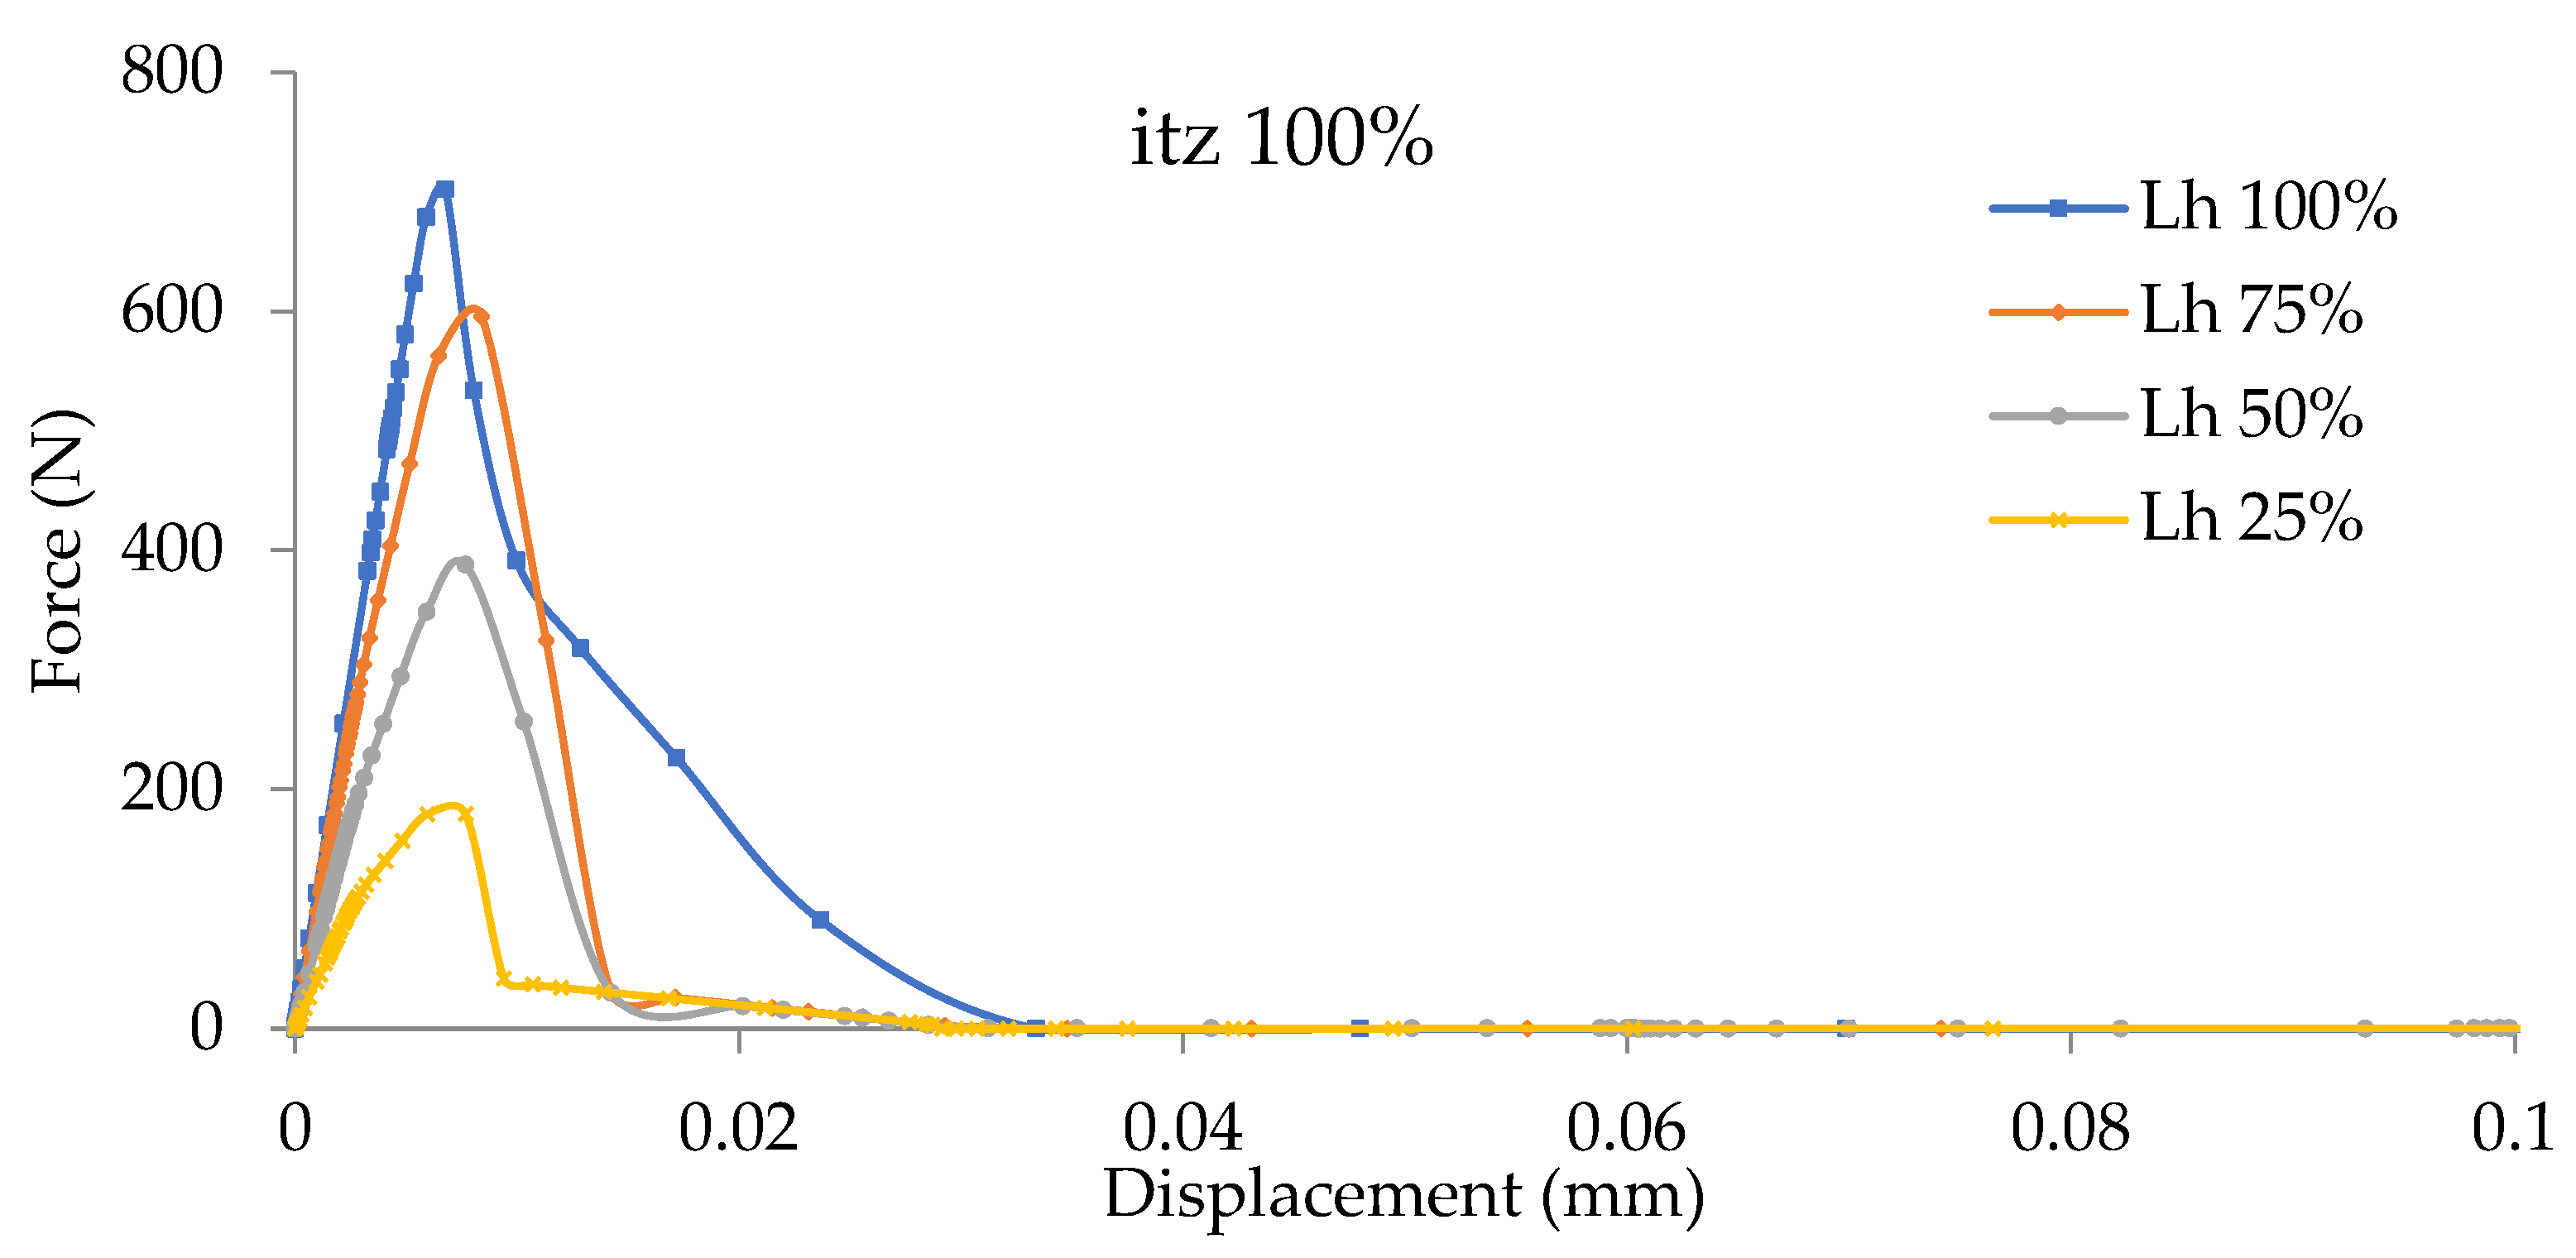
5.2. Effects of the Healed Crack Length on the Load Carrying Capacity of SHC

The four specimens with different interfacial fracture property (itz) ratios are presented in Figure 14, Figure 15, Figure 16 and Figure 17 with the effects of the healed crack length (Lh) on the load carrying capacity shown. It is clear that the load carrying capacity of the specimen is highly influenced by the healed crack length (Lh). The effects of the healed crack length (Lh) on the load carrying capacity of the specimen with the interfacial fracture property ratio of 100% are shown in Figure 14. The maximum load carried by the specimen decreased from 702.1 N for Lh = 100% to 179.6 N for Lh = 25%. Therefore, it is obvious that the load carrying capacity of the SHC specimen is significantly influenced by the healed crack length (Lh). The same phenomenon can also be found in Figure 15, Figure 16 and Figure 17 for the interfacial fracture property ratios of 75%, 50%, and 25%, respectively. It is clear that when the healed crack length is equal to the crack length, then a higher maximum load carrying capacity will be achieved. Consequently, these results show that the higher the Lh, the higher the load carrying capacity, and vice versa.
Figure 18 shows the relationship between the maximum carrying load and the itz percentage of interfacial cohesive properties for different healed crack length ratios. It is clearly shown that a higher percentage of itz increases the maximum load of the specimen that it can withstand. The higher the healed crack length ratio, the higher the maximum carrying load of the specimen.

5.3. Effects of Interfacial Cohesive Properties and the Healed Crack Length on the Crack Pattern

The crack pattern for specimens with healed crack length ratios of 100%, 75%, 50%, and 25% is affected by interfacial cohesive properties (itz), as illustrated, respectively, in Figure 19, Figure 20, Figure 21 and Figure 22. Figure 19 demonstrates the crack patterns propagated in the healed specimens with the healed crack length ratio Lh of 100% associated with variation in the interfacial cohesive property ratios (itz) of 100%, 75%, 50%, and 25%. The specimens with itz of 100% and 75% produced the same crack patterns as the crack initiated and propagated through the concrete matrix only, which can be observed in Figure 19a,b. When the percentage of itz ranges from 0 to 25% of the fracture properties of the solidified healing agent, interfacial cracks occur and the solidified healing agent is debonded from the concrete matrix, as illustrated in Figure 19d. An interesting fracture pattern occurred when itz was 50%, as an interfacial crack was initiated and propagated through the contact surface between the solidified healing agent and the concrete matrix, in addition to another crack initiating and propagating through the concrete matrix, as illustrated in Figure 19c. This means a possibility of developing interfacial cracks and concrete cracks at the same time when the interfacial fracture properties are 50% of the solidified healing agent fracture properties.
Figure 20, Figure 21 and Figure 22 produced the same crack patterns propagated in the healed specimens, with the healed crack length ratios Lh of 75%, 50%, and 25%, respectively, associated with variation in the interfacial fracture ratios (itz) of 100%, 75%, 50%, and 25%. When the percentage of itz to the fracture properties of the solidified healing agent ranged from 100 to 75%, the crack was initiated and propagated through the concrete matrix first; then, the crack moved toward the contact surface between the solidified healing agent and the concrete matrix and became an interfacial crack separating them until the end of the simulation, as illustrated in Figure 20a,b, Figure 21a,b and Figure 22a,b. This means that mixed crack patterns develop when the percentage of Lh ranges from 75 to 25%, with the percentage of itz ranging from 100 to 75%, as the first part is a concrete crack initiated and propagated through the concrete matrix and the second part is an interfacial crack propagated through the interface zone between the healing agent and the concrete matrix. On the contrary, when the percentage of itz ranges from 0 to 25% of the fracture properties of the solidified healing agent, interfacial cracks occur, and the solidified healing agent becomes debonded from the concrete matrix, as illustrated in Figure 20d, Figure 21d and Figure 22d. Another interesting fracture pattern occurred when an itz of 50% as an interfacial crack was initiated and propagated through the contact surface between the solidified healing agent and the concrete matrix, in addition to another crack being initiated and propagated through the concrete matrix, as illustrated in Figure 20c, Figure 21c and Figure 22c. This means a possibility of developing interfacial cracks and concrete cracks at the same time when the interfacial fracture properties are 50% of the solidified healing agent fracture properties.
It is worth mentioning that the obtained crack patterns from this computational study comply with recent experimental data which have a close sample configuration [3]. However, the aim of this experimental study was to develop modified cyanoacrylate (n-CA) with an extended shelf life suitable for self-healing concrete. A series of n-CAs were formed from a commercial Ethyl Cyanoacrylate adhesive mixed with acrylic acid (AA) and nitro-anthraquinone (nAq) in varying ratios. However, these variation ratios to develop modified n-CA led to varying the bond strength, which can represent the variation in interfacial cohesive properties in this study. Also, it was noticed that the actual bonded area of developed modified n-CA was less than the cross section area of the sample, which can be seen to be representing the variation in the healed crack length in this study. In case of using unmodified commercial CA, which can be seen to be representing an itz of 100% in this computational study, the cracks occurred in the concrete matrix only; so, these experimental data confirm the crack patterns obtained in this computational study. Also, in the case of using modified n-CA, which can be seen to be representing the itz ranging between 75 and 25% in this computational study, the cracks occurred at the bonded surface (interfacial cracks); so, these experimental data confirm the crack patterns obtained in this computational study.

6. Conclusions

In this paper, the extended finite element method (XFEM) and cohesive surface (CS) technique were used to study the effects of healing patterns represented by the healed crack length and interfacial cohesive properties on the fracture mechanism of self-healing concrete. Two-dimensional numerical simulations were conducted to examine the effects of the healed crack length and the effects of the interfacial cohesive properties of the interfacial transition zone (itz) between the solidified healing agent and the cracked surfaces of the concrete matrix on the specimen strength and fracture mechanism of the healed specimens. The potential of the fracture and debonding of the solidified healing agent from the concrete matrix was studied numerically under uniform displacements applied on both the top and bottom sides of the specimens. The specimens were modeled as three-phase composite materials composed of a concrete matrix, a solidified healing agent, and contact interface surfaces. The concrete matrix and the solidified healing agent were modeled using XFEM and the contact interfaces between them were modeled via the CS technique. The proposed modeling framework was verified numerically in a previous study and validated experimentally using recent experimental data which had a close sample configuration. The following conclusions are made:
  • The healed crack length (Lh) has a significant role in governing the specimen strength, as the higher the healed crack length ratio, the higher the maximum carrying load capacity of the specimen, and vice versa.
  • The interfacial cohesive properties (itz) between the solidified healing agent and the cracked surfaces of the concrete specimen have a crucial role in determining the load carrying capacity of the specimen. The load carrying capacity increases with increasing itz, and vice versa.
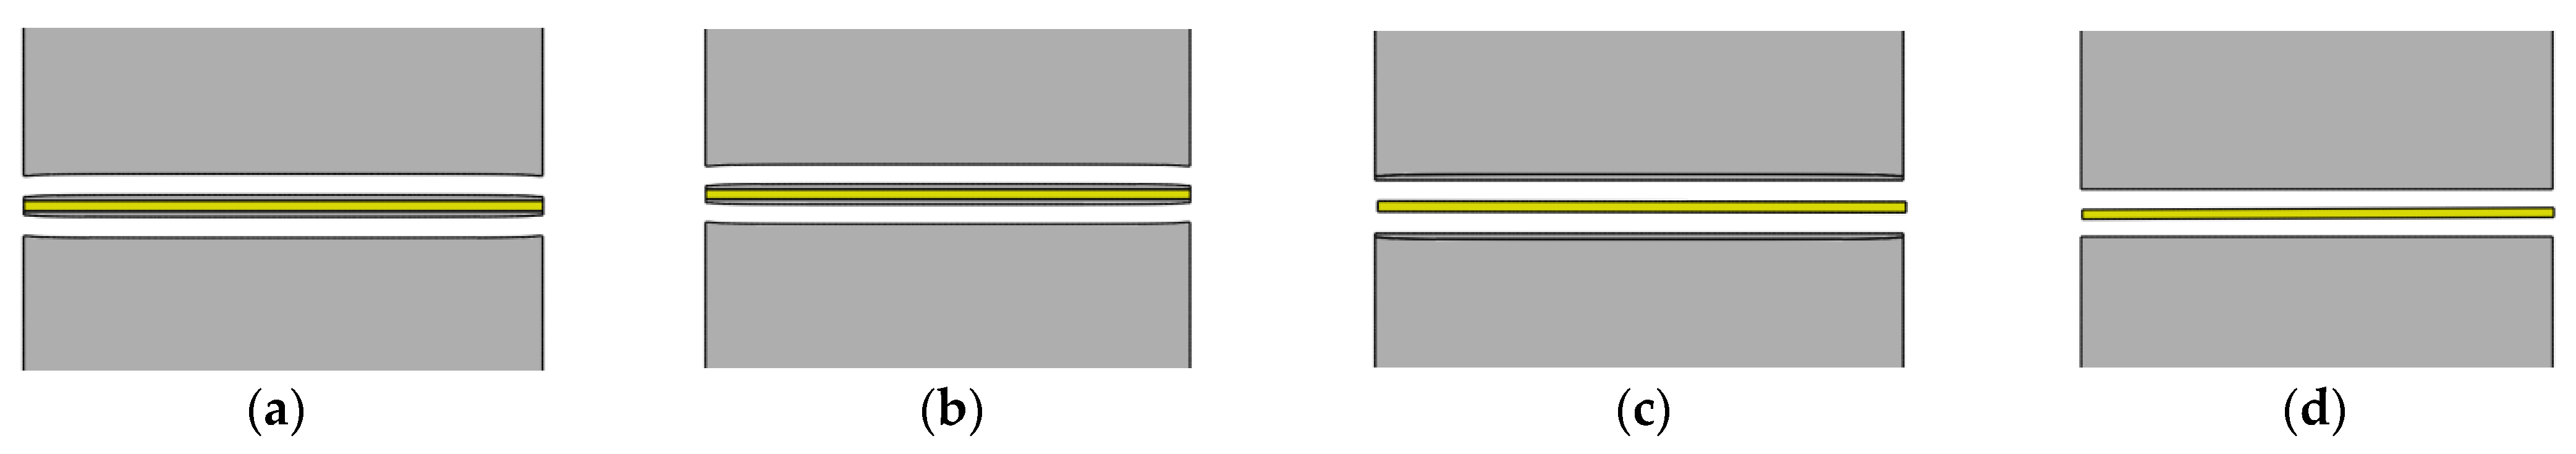
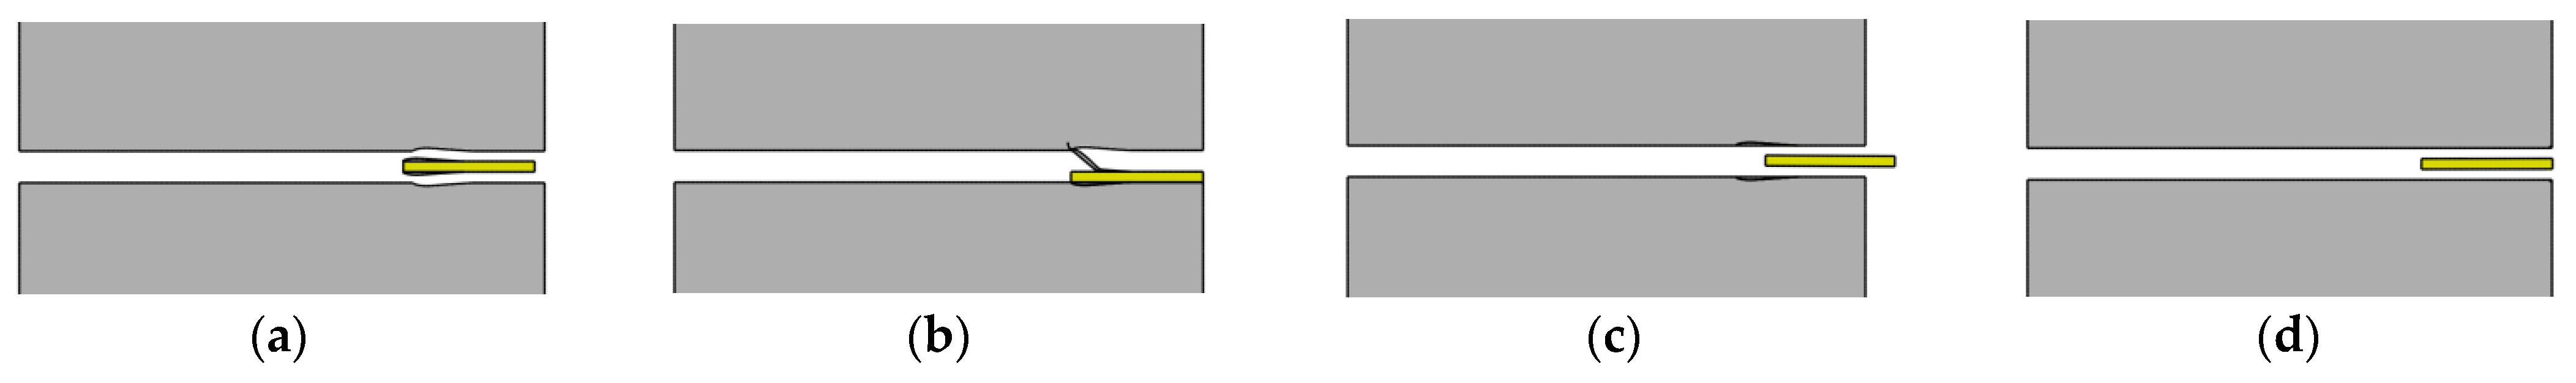
  • The cracks will initiate and propagate through the concrete matrix only when the itz ratio is 75–100% of the fracture properties of the solidified healing agent and the Lh is 100% (equal to the total crack length).
  • Interfacial cracks occur and the solidified healing agent will be debonded from the concrete matrix when the itz ratio is 0–25% of the fracture properties of the solidified healing agent.
  • There is a possibility of developing interfacial cracks and concrete cracks concurrently when the interfacial fracture properties are 50% of the solidified healing agent fracture properties.
  • The mixed crack patterns are developed when the Lh ratio ranges from 75 to 25% and the itz ratio ranges from 100 to 75%. This is because a concrete crack is initiated first and propagates through the concrete matrix, and then an interfacial crack propagates through the interface zone between the healing agent and the concrete matrix.
  • It is not only important to pay much attention to the cohesive properties of the healing agent but also to its viscosity, which is responsible for how far the healing agent will go through the crack length. Therefore the viscosity of the healing agent should be enough to let it cover the whole length of the cracks and give adequate setting time to solidify it, but it should also not flow fluidly, which would allow the spilling over from cracks without healing them due to the late setting time to solidify it.
Future works for this type of simulation should study more complex models, including multiple healed cracks randomly distributed all over the sample. These cracks not necessarily extending to the edges of the sample means that some of these cracks will be started and ended within the concrete matrix. Also, some improvements can be introduced into these models, like including capsules that may be sound or fractured and randomly distributed all over the sample to imitate the reality of SHC members and the healing efficiency. In order to perform these studies, first, it is necessary to investigate the limitation of XFEM, which mainly is allowing multiple cracks within the same enrichment zone which can be overcome by modifying the Abaqus input file.

Author Contributions

Conceptualization; methodology; software; validation; formal analysis; investigation; resources; data curation; writing—original draft preparation; visualization; supervision; project administration, J.H.; writing—review and editing, A.E. All authors have read and agreed to the published version of the manuscript.

Funding

This research received no external funding.

Data Availability Statement

The authors confirm that the data supporting the findings of this study are available within the article.

Conflicts of Interest

The authors declare no conflict of interest.

References

  1. Souradeep, G.; Kua, H.W. Encapsulation technology and techniques in self-healing concrete. J. Mater. Civ. Eng. 2016, 28, 04016165. [Google Scholar] [CrossRef]
  2. Snoeck, D.; Malm, F.; Cnudde, V.; Grosse, C.U.; Van Tittelboom, K. Validation of Self-Healing Properties of Construction Materials through Nondestructive and Minimal Invasive Testing. Adv. Mater. Interfaces 2018, 5, 1800179. [Google Scholar] [CrossRef]
  3. De Nardi, C.; Gardner, D.; Cazzador, G.; Cristofori, D.; Ronchin, L.; Vavasori, A.; Jefferson, T. Experimental investigation of a novel formulation of a cyanoacrylate based adhesive for self-healing concrete technologies. Front. Built Environ. 2021, 7, 660562. [Google Scholar] [CrossRef]
  4. Hanna, J. Computational Modelling for the Effects of Capsular Clustering on Fracture of Encapsulation-Based Self-Healing Concrete Using XFEM and Cohesive Surface Technique. Appl. Sci. 2022, 12, 5112. [Google Scholar] [CrossRef]
  5. Mauludin, L.M.; Zhuang, X.; Rabczuk, T. Computational modeling of fracture in encapsulation-based self-healing concrete using cohesive elements. Compos. Struct. 2018, 196, 63–75. [Google Scholar] [CrossRef]
  6. Gilabert, F.; Garoz, D.; Van Paepegem, W. Macro-and micro-modeling of crack propagation in encapsulation-based self-healing materials: Application of XFEM and cohesive surface techniques. Mater. Des. 2017, 130, 459–478. [Google Scholar] [CrossRef] [Green Version]
  7. Hanna, J. Accurate computational modelling for impacts of microcapsule size and interfacial fracture properties on the fracture of self-healing concrete. Int. J. Hydromechatronics 2022, 5, 397–415, (Scientific Machine Learning: Application in Engineering Science). [Google Scholar] [CrossRef]
  8. Rabczuk, T. Computational methods for fracture in brittle and quasi-brittle solids: State-of-the-art review and future perspectives. ISRN Appl. Math. 2013, 2013, 849231. [Google Scholar] [CrossRef]
  9. Rabczuk, T.; Belytschko, T. Cracking particles: A simplified meshfree method for arbitrary evolving cracks. Int. J. Numer. Methods Eng. 2004, 61, 2316–2343. [Google Scholar] [CrossRef]
  10. Rabczuk, T.; Zi, G.; Bordas, S.; Nguyen-Xuan, H. A geometrically non-linear three-dimensional cohesive crack method for reinforced concrete structures. Eng. Fract. Mech. 2008, 75, 4740–4758. [Google Scholar] [CrossRef]
  11. Rabczuk, T.; Zi, G.; Bordas, S.; Nguyen-Xuan, H. A simple and robust three-dimensional cracking-particle method without enrichment. Comput. Methods Appl. Mech. Eng. 2010, 199, 2437–2455. [Google Scholar] [CrossRef]
  12. Tabiei, A.; Zhang, W. Cohesive element approach for dynamic crack propagation: Artificial compliance and mesh dependency. Eng. Fract. Mech. 2017, 180, 23–42. [Google Scholar] [CrossRef]
  13. Funari, M.F.; Greco, F.; Lonetti, P.; Spadea, S. A numerical model based on ALE formulation to predict crack propagation in sandwich structures. Fract. Struct. Integr. Ten Years ‘Frat. Ed. Integrità Strutt. 2019, 13, 277–293. [Google Scholar] [CrossRef]
  14. Moreno, M.S.; Curiel-Sosa, J.L.; Navarro-Zafra, J.; Vicente, J.M.; Cela, J.L. Crack propagation in a chopped glass-reinforced composite under biaxial testing by means of XFEM. Compos. Struct. 2015, 119, 264–271. [Google Scholar] [CrossRef]
  15. De Cicco, D.; Taheri, F. Delamination buckling and crack propagation simulations in fiber-metal laminates using xFEM and cohesive elements. Appl. Sci. 2018, 8, 2440. [Google Scholar] [CrossRef] [Green Version]
  16. Tang, Y.X.; Chen, H.N. Simulation of crack propagation in concrete based on extended finite element method. Key Eng. Mater. 2018, 783, 165–169. [Google Scholar] [CrossRef]
  17. Cervera, M.; Barbat, G.B.; Chiumenti, M.; Wu, J.Y. A comparative review of XFEM, mixed FEM and phase-field models for quasi-brittle cracking. Arch. Comput. Methods Eng. 2022, 29, 1009–1083. [Google Scholar] [CrossRef]
  18. Aguiar, J.; Gemert, D.v. Advances in adhesion between polymers and concrete. In Proceedings of the ICPIC 2007: 12th International Congress on Polymers in Concrete, Chuncheon, Republic of Korea, 27–28 September 2007. [Google Scholar]
  19. Rabczuk, T.; Song, J.H.; Zhuang, X.; Anitescu, C. Extended Finite Element and Meshfree Methods; Academic Press: Cambridge, MA, USA, 2019. [Google Scholar]
  20. Moës, N.; Dolbow, J.; Belytschko, T. A finite element method for crack growth without remeshing. Int. J. Numer. Methods Eng. 1999, 46, 131–150. [Google Scholar] [CrossRef]
  21. Dassault Systémes Simulia Corp. Abaqus Documentation; Simulia Corp: Johnston, RI, USA, 2017. [Google Scholar]
  22. Dong, B.; Han, N.; Zhang, M.; Wang, X.; Cui, H.; Xing, F. A microcapsule technology based self-healing system for concrete structures. J. Earthq. Tsunami 2013, 7, 1350014. [Google Scholar] [CrossRef]
  23. Edvardsen, C. Water permeability and autogenous healing of cracks in concrete. In Innovation in Concrete Structures: Design and Construction; Thomas Telford Publishing: London, UK, 1999; pp. 473–487. [Google Scholar]
  24. Camanho, P.P.; Dávila, C.G. Mixed-Mode Decohesion Finite Elements for the Simulation of Delamination in Composite Materials; NASA/TM-2002–211737; NASA: Washington, DC, USA, 2002. [Google Scholar]
  25. Mauludin, L.M.; Oucif, C. The effects of interfacial strength on fractured microcapsule. Front. Struct. Civ. Eng. 2019, 13, 353–363. [Google Scholar] [CrossRef]
  26. Quayum, M.S.; Zhuang, X.; Rabczuk, T. Computational model generation and RVE design of self-healing concrete. Front. Struct. Civ. Eng. 2015, 9, 383–396. [Google Scholar] [CrossRef]
  27. Tu, L.; Kruger, D. Engineering properties of epoxy resins used as concrete adhesives. Mater. J. 1996, 93, 26–35. [Google Scholar]
Figure 1. The geometrical representation of various healing patterns ranging from fully healed to non-healed (ah).
Computation 11 00142 g001
Figure 2. The modeling techniques.
Computation 11 00142 g002
Figure 3. Crack with enriched elements.
Computation 11 00142 g003
Figure 4. Initially rigid traction–separation law for XFEM.
Computation 11 00142 g004
Figure 5. Initially elastic traction–separation law for CS.
Computation 11 00142 g005
Figure 6. Specimens’ geometry dimensions and modeling techniques.
Computation 11 00142 g006
Figure 7. Three distinct examples of discretization for the meshes: (a) coarse mesh (42,900 elements), (b) medium mesh (56,400 elements), and (c) fine mesh (87,750 elements).
Computation 11 00142 g007
Figure 8. Force displacement curves from three distinct examples of discretization.
Computation 11 00142 g008
Figure 9. Healed samples with different healed crack length Lh ratios: (a) Lh 100% (Lh = 25 mm), (b) Lh 75% (Lh = 18.75 mm), (c) Lh 50% (Lh = 12.5 mm), and (d) Lh 25% (Lh = 6.25 mm).
Computation 11 00142 g009
Figure 10. Force displacement curves of healed crack length ratio Lh of 100% with different itz ratios.
Computation 11 00142 g010
Figure 11. Force displacement curves of healed crack length ratio Lh of 75% with different itz ratios.
Computation 11 00142 g011
Figure 12. Force displacement curves of healed crack length ratio Lh of 50% with different itz ratios.
Computation 11 00142 g012
Figure 13. Force displacement curves of healed crack length ratio Lh of 25% with different itz ratios.
Computation 11 00142 g013
Figure 14. Force displacement curves of interfacial cohesive ratio itz of 100% with different Lh ratios.
Computation 11 00142 g014
Figure 15. Force displacement curves of interfacial cohesive ratio itz of 75% with different Lh ratios.
Computation 11 00142 g015
Figure 16. Force displacement curves of interfacial cohesive ratio itz of 50% with different Lh ratios.
Computation 11 00142 g016
Figure 17. Force displacement curves of interfacial cohesive ratio itz of 25% with different Lh ratios.
Computation 11 00142 g017
Figure 18. Effects of the healed crack length ratio Lh and the itz percentage on the maximum load.
Computation 11 00142 g018
Figure 19. Crack pattern of Lh of 100% specimen with different itz ratios. (a) itz = 100%; (b) itz = 75%; (c) itz = 50%; and (d) itz = 25%.
Computation 11 00142 g019
Figure 20. Crack pattern of Lh of 75% specimen with different itz ratios. (a) itz = 100%; (b) itz = 75%; (c) itz = 50%; and (d) itz = 25%.
Computation 11 00142 g020
Figure 21. Crack pattern of Lh of 50% specimen with different itz ratios. (a) itz = 100%; (b) itz = 75%; (c) itz = 50%; and (d) itz = 25%.
Computation 11 00142 g021
Figure 22. Crack pattern of Lh of 25% specimen with different itz ratios. (a) itz = 100%; (b) itz = 75%; (c) itz = 50%; and (d) itz = 25%.
Computation 11 00142 g022
Table 1. Properties of materials.
MaterialE
(MPa)
νσ*
(MPa)
Gf
(N/mm)
Concrete25,0000.23.50.055
Healing agent (solidified)34000.38390.088
Interface--VariesVaries
Disclaimer/Publisher’s Note: The statements, opinions and data contained in all publications are solely those of the individual author(s) and contributor(s) and not of MDPI and/or the editor(s). MDPI and/or the editor(s) disclaim responsibility for any injury to people or property resulting from any ideas, methods, instructions or products referred to in the content.

