1. Introduction
The weight minimization of truss structures, as an all-encompassing optimization task which indirectly incorporates manufacturing, transportation, and lifecycle costs, has been an active field of research in the last two decades. Owing to the economic implications that this category of engineering optimization has on society, several so-called gradient-based optimization methodologies, which function by using the derivative information of the search space, were employed early on in the field. With the recent introduction of metaheuristic search methodologies, however, which function as global stochastic optimization methods, engineers can now more fully explore the truss design space more efficiently and propose a dichotomy of optimized designs to be scrutinized for feasibility later. Metaheuristics generally divide the optimization process into two phases: exploration and exploitation. This typically involves the population of solution candidates to heuristically navigate themselves, either searching in their local vicinity or with larger strides, efficiently. Research trend in the field is currently focused on developing these heuristic paradigms to produce lighter-weight trusses with fewer structural evaluations (computational effort). The objective, therefore, is to propose algorithms which respond to these very pressing needs.
1.1. Related Work
There exists a rich body of literature involving the use of metaheuristic algorithms for truss optimization problems. The No Free Lunch (NFL) Theorem proposed by Wolpert et al. [
1] explicitly states that no single metaheuristic is capable of solving all optimization problems with an equal level of effectiveness. This implies that every optimization problem needs to be recognized as belonging to a distinct problem category with a set of well-suited optimization methodologies associated with it [
2].
A number of MH algorithms have been used for truss optimization problems by various authors over the years. For instance, Lee and Geem implemented the Harmony Search (HS) algorithm for the weight minimization of truss structures with continuous variables [
3]. Sonmez adopted the Artificial Bee Colony (ABC) optimizer for structural optimization with continuous and discrete variables [
4,
5]. Degertekin and Hayalioglu investigated the applicability of the Teaching Learning Based Optimizer (TLBO) [
6]. Bekdas et al. recognized the feasibility of the Flower Pollination Algorithm (FPA) for its robust global and local search aspects in structural design [
7]. Kaveh and Bakshoopri presented the Cuckoo Search (CS) algorithm in the context of truss sizing optimization [
8]. Kaveh and Khayatazad employed the so-called Ray Optimizer (RO) algorithm for the weight minimization of truss structures [
9]. A Cultural Algorithm (CA) was successfully implemented for the optimal design of truss structures with stress and deflection constraints by Jalili and Hosseinzadeh [
10]. Similarly, Kaveh and Mahdavi showcased the robustness of the Colliding Bodies Optimizer (CBO) for truss design problems [
11]. Recently published studies in the field include Kaveh and Bakshoopri [
12] and Kooshkbaghi and Kaveh [
13] with their implementation of the Water Evaporation Optimizer (WEO) and the Artificial Coronary Circulation Systems (ACCS) algorithms, respectively, for sizing optimization of truss structures. Ozbasaran and Yildirim evaluated the performance of the Crow Search Algorithm (CSA) for the weight minimization of truss structures [
14]. Degertekin et al. [
15] adopted the recently proposed Heat Transfer Search (HTS) algorithm for the sizing optimization of truss structures. Azizi et al. considered the utilization of the Material Generation Algorithm (MGA) for the optimum design of truss structures [
16]. Furthermore, Bodalal (present author) [
17] presented a critical analysis of the recently developed Political Optimizer (PO) algorithm for the weight minimization of both medium- and large-sized structural systems.
Hybridized/modified algorithms that attempted to compensate for the shortcomings of direct MH implementations naturally followed over the years. Recognizing this fact, a hybridized PSO, ACO, and HS algorithm (HPSACO) was presented by Kaveh et al. in the hopes of improving structural design results further [
18]. Khatibinia and Yazdani proposed the Accelerated Multi-Gravitational Search Algorithm (AMGSA) to overcome the performance issues of the conventional Gravitational Search Algorithm (GSA) [
19]. Kaveh et al. developed an Improved Ray Optimizer (IRO) algorithm to further enhance designs yielded from the previous direct RO implementation study [
20]. A hybrid Imperialist Competitive Algorithm (ICA) and Harris Hawk Optimizer (HHO) was developed by Kaveh et al. (ICHHO) to improve the structural results reported in an earlier ICA truss optimization paper [
21]. Jafari et al. hybridized the standard PSO with CA to propose the Particle Swarm Optimizer Cultural (PSOC) algorithm in the hopes of yielding a more harmonized balance between exploration and exploitation [
22].
It is therefore apparent from the aforementioned studies that the implementation of newer metaheuristics is directly associated with improved optimization methodologies developed afterwards since the strengths and weaknesses become clear as a consequence.
1.2. Motivation and Contribution
Recently, a newly developed swarm-based metaheuristic optimizer, called the Marine Predators Algorithm (MPA), was proposed by Faramarzi et al. in 2020 [
23]. MPA is inspired by the efficient foraging strategies of marine predators in oceanic environments. Search agents are modeled as marine prey (food), while the best-performing solution in the population acts as the marine predator (hunter). Faramarzi et al. [
23] evaluated the efficiency of MPA with 29 function benchmarks, three classical engineering problems, and two real-world problems. Results revealed the superiority of MPA over all contemporary algorithms in comparison. As a result, MPA was seen by many researchers as a promising solution technique. This led to MPA’s utilization for many challenging engineering optimization problems. Notable examples from literature include the parameter extraction of single/double diode PV modules [
24], image feature selection [
25], fan control scheduling for ventilation purposes [
23], CNC lathe machine optimization [
26], COVID-19 detection/image classification [
27], and antenna design [
28].
The primary purpose of this study (therefore) is to extend the application of the recently developed Marine Predators Algorithm to the weight minimization of truss structures. Six challenging truss benchmarks (three normal-sized and three large-scale) are consequently optimized to test the efficiency of MPA. The proposed algorithm was selected because it efficiently incorporates both Lévy and Brownian motion models into its solution updating methodology. Several studies related to structural optimization (and other similarly challenging problems) have repeatedly underscored the effectiveness of the Lévy flight/walk motion model to escape local optima (this is especially the case for constrained, multi-model optimization problems). Notable articles in the field include the implementation of the Cuckoo Search (CS) algorithm by Kaveh and Bakshoopri [
8] for truss optimization. Inherent to the algorithm was the Lévy motion model, and conclusions were made favoring the motion pattern for truss optimization. A similar conclusion was reached with implementing the Dragonfly Algorithm (DA) by Jawad et al. for truss weight minimization [
29]. Lévy flight techniques (intrinsic to DA operations) proved crucial to the algorithm’s excellent performance, allowing it to reach global truss solutions with the least computational effort. The results were furthermore corroborated with a similar metaheuristic truss optimization study conducted by Etaati et al. [
30]. Along those lines, other studies related to the field have also reported the advantage that Lévy-based MH algorithms possess over other techniques for truss optimization problems (see Refs. [
31,
32,
33,
34,
35]). Based on the conclusions made by a sample of studies related to the field, MPA (with its basic Lévy motion position updating scheme) is expected to perform exceptionally well when applied to the challenging truss optimization problem. The testing of MPA in this study is therefore justified from a literature review perspective.
Furthermore, in recognition of the need for researchers to have better A.I. optimization methodologies at their disposal, the author noticed a research gap where no study, as of the time of this writing, has ever attempted to quantitatively determine the correct value of algorithmic “exploration” and “exploitation” for truss optimization problems. Given the ever-increasing involvement of AI-based methods in structural engineering and the weaknesses of conventional analytical techniques currently at our disposal, the importance of having a basic numerical estimation for the combination of these two schemes will immensely aid future researchers in the field whenever they develop new algorithms. Truss optimization problems are well-known for being highly non-linear, non-convex, and multimodal design problems with respect to their design variables [
36]. Problem complexity is further compounded by the hundreds, if not thousands, of design constraints imposed by dint of the various construction/building codes typically required by government organizations. The sizing optimization of truss structures (by definition) involves selecting the appropriate cross-sectional areas of truss members to minimize structural weight, all the while conforming to the predefined design constraints in the form of stress and deflection limitations. Optimized cross-sectional areas are consequently required to be selected from a practical range usually preordained by commercial section availability. Fabrication constraints, as they are commonly called, are thus an added computational challenge to the algorithm and take the form of decision variable limitations. Furthermore, the truss optimization problem is notorious for its high computational cost. Objective function evaluations necessarily involve the simultaneous solution of thousands of force-displacement equations using matrix operations. This differentiates structural optimization problems from other simpler engineering design tasks where the objective function estimation process does not require lengthy computation (see Refs. [
37,
38,
39]). In order to reduce the amount of time required to obtain optimized solutions, MH algorithms that efficiently navigate the challenging design search space with the least amount of structural analysis are therefore highly sought after. The truss sizing problem, as a result, continues to be an active research problem solved by many researchers in the field [
40,
41,
42]. From the above discussion, it becomes clear that the sizing optimization of truss structures provides a particularly challenging optimization problem in which the MH exploration–exploitation tradeoff trend can be thoroughly investigated. That is in addition to the fact that most studies in the field usually only consider final results such as optimized weights, standard deviations, and convergence speeds. However, no discussions or calculations are made to justify the reported results in light of the two fundamental metaheuristic search concepts mentioned earlier: exploration and exploitation. To fill this gap, the computational behavior of MPA, used as a base algorithm in this work (and justified in the previous paragraph), is analyzed using a novel dimension-wise diversity index (previously developed by Morales-Castañeda et al. [
43]). Metaheuristic search aspects can subsequently be easily adjusted to these newly found values and theoretically achieve comparable optimization performance.
The contributions of this study can be summarized as follows:
- (1)
A novel application of MPA for structural optimization problems is presented.
- (2)
Six challenging truss benchmarks (including three real-sized structures) are optimized using the proposed technique.
- (3)
For the first time in the field, a numerical quantification of the proper balance between metaheuristic exploration vs. exploitation for truss optimization problems is presented.
- (4)
Finally, a critical assessment of MPA is conducted in light of the detailed findings reported in the study (exploration-exploitation balance, optimization trend, and statistical results).
The rest of this paper is organized as follows:
Section 2 formulates the truss sizing problem.
Section 3 explains the working principle of the MPA algorithm.
Section 4 describes the software implementation of MPA for truss sizing optimization.
Section 5 presents the methodology for quantifying the exploration vs. exploitation balance.
Section 6 compares MPA results with those of other optimizers in literature.
Section 7 summarizes MPA performance in relation to the truss optimization results. Finally, some concluding remarks/recommendations are made in
Section 8.
2. Problem Formulation
The sizing optimization of truss structures can be regarded as the problem of selecting the appropriate cross-sectional areas of structural members (with the goal of minimizing structural weight) while conforming to the pre-imposed design constraints in the form of stress and deflection limitations. Mathematically, this can be expressed as:
Subject to constraints:
where
W denotes the overall truss weight,
NE denotes the number of structural elements,
d is the number of truss sizing variables,
represents the mass density of the structural material,
denotes the truss member length,
is the cross-sectional area of the
ith member, and
,
, and
represent the normal stress, buckling stress, and nodal displacement for the
ith member,
kth compressive element, and
jth node, respectively.
Multiple constraint-handling methodologies have recently been proposed to convert constrained problems into unconstrained ones. Readers are encouraged to read Coello Coello [
44] for a more in-depth discussion on this matter. Nevertheless, in structural design, the objective function formulation for the truss optimization problem saw few changes over the years. Studying the research trend shows the adoption of three main types of objective function formulations: (1) Fitness functions with static penalty factors [
45]. (2) Fitness function with dynamic penalty factors [
46]. (3) Fitness function with relaxed penalty factors [
47]. Of the three, formulations 2 and 3 are the most adopted, and their effects have been shown to differ only slightly (among themselves) on overall algorithmic performance [
48]. Consequently, a quantitative comparison between different MH algorithms using the aforementioned formulations is justified. In this work, in order to efficiently handle the design constraints outlined in Equation (3), formulation 3 is adopted, and the total number of evaluated constraint violations
m for a given truss design are first normalized and then subsequently merged into a single variable V, which represents the total penalized value of the structure. This is mathematically shown as follows [
17]:
where
NN and
NC are the
number of nodes and the
number of compressive members, respectively. Constraints violations with values greater than zero are accounted for, while those less than that are neglected.
It therefore follows that the ultimate form of the penalized fitness function F
p minimized in this study is as follows [
17]:
where the variables
α and
β in Equation (5) are the penalty scaling factor and penalty exponent, respectively, the value of which is kept as one (part of the relaxed objective function scheme) [
17]. This allows the algorithm to freely search the computational domain, unimpeded. Global optimum truss weights, when obtained, would either have zero constraint violations or be so small that they could be regarded as negligible.
3. Marine Predators Algorithm (MPA)
3.1. Inspiration
The Marine Predators Algorithm (MPA) is a recently developed swarm-based metaheuristic optimizer that mathematically models the efficient foraging strategies of Marine Predators (MP) in oceanic environments. The term “marine predator” typically describes aquatic creatures, such as sharks, whales, dolphins, and swordfish, i.e., fish that eat other fish. While searching for prey (food), MPs generally adopt one of two motion models: (1) Lévy motion or (2) Brownian motion. MPs constantly switch between the two motion patterns based on “encounter policies.” Simply put, if an MP finds itself in an area of sea with a low/patchy concentration of prey, it starts moving around in a Lévy fashion. Conversely, if abundant prey is present (high concentration), Brownian motion is preferred. Therefore, MPs successfully forage by constantly alternating between Lévy and Brownian motion based on prey concentration in their local area.
Numerous mathematical models have been developed to predict the exact moment at which MPs change motion patterns. The best technique developed so far is by relating it to something called the “velocity ratio” (represented as ). It is reasoned that depending on the speed of the prey versus that of an MP, a switch in motion type will occur to minimize both the time and effort involved in encountering it. From the above discussion, three different MP hunting tactics (in relation to the “velocity ratio”) can be summarized as follows:
This scenario occurs when the intended prey is much faster than the predator (). In this case, MPs hunt by not moving at all. This is logical since the probability that the prey will pass your field of view is high.
This scenario occurs when the velocities of prey and predator are equal (). In this case, marine predators adopt the opposite foraging tactic of their prey, i.e., if the intended prey is moving in a Brownian fashion (randomly), the predators move with Levy motion.
This scenario occurs when prey move slower than predators (
). In this scenario, marine predators must actively search for their food, and the much slower prey are often concentrated in swarms. This dictates the MP adopt the Levy flight/walk foraging mechanism, i.e., deeply search nearby areas with small steps and explore other areas with “relocations” until the prey swarm is found.
Figure 1 graphically summarizes the three foraging scenarios described earlier for greater clarity.
One last observation related to MP behavior is their sudden switch of motion patterns (Lévy flight/walk or Brownian motion) when in the immediate proximity of “natural environmental barriers” such as eddy currents or Fish Aggregating Devices (FADs). Predators were found to change tactics depending on the type of obstruction.
3.2. Mathematical Formulation
As mentioned earlier, one of the primary purposes of this study is to extend the application of the recently developed Marine Predators Algorithm (MPA) to the weight minimization of truss structures. As such, MPA operation in relation to the inspiration section described earlier is presented here. Similar to other MH algorithms, MPA divides the optimization process into exploration and exploitation. However, unlike other algorithms, it transitions from pure exploration to pure exploitation with an intermediate stage comprised of 50% exploration and 50% exploitation. The following is an overview of how MPA operates:
The algorithm’s optimization sequence begins by randomly generating the initial population of search agents. Fitness functions are subsequently estimated, and the best-performing solution serves as the marine predator, while the remaining solutions act as prey. Now that the search space has multiple prey and one MP (the best solution), the hunt for the global optimum begins. The three encounter policies (based on velocity ratios) described earlier are modelled in MPA by dividing the optimization process into three equal phases. In the first third, solution candidates (prey) update their positions with respect to the MP (best solution) in a Brownian fashion. In the second phase, solution candidates are divided in half, and each half has its position vectors updated either in a Lévy or Brownian manner in relation to the top solution. Finally, in the last third of iterations, the MP has its position vector multiplied by the Levy operator, and the prey update their solutions based on it. While this all happens, the best-performing solution is constantly updated for every iterative cycle. Overall, MPA is a relatively simple metaheuristic, with only a few performance parameters to be considered.
The following subsections represent a clear and concise mathematical derivation of all MPA mathematical procedures discussed earlier.
3.2.1. Initialization
The MPA optimization cycle begins by uniformly distributing the population of search agents over the computational domain using Equation (6).
where
and
are vectors representing the lower and upper design variable bounds, respectively,
is a vector of random numbers uniformly generated between [0, 1], and ⊗ is an operator indicative of entry-wise multiplication. The best-performing solution in the population is denoted by
, and all solution candidates update their positions with respect to it.
3.2.2. Optimization Scenarios
The MPA algorithm models the three “encounter policies” discussed earlier by dividing the entire optimization process into three equal parts. In all phases, candidate solutions update their position vectors with reference to the “best solution.” Therefore, the vector is key to MPA. The three phases, along with their details, are discussed below:
The first third of iterations models the high velocity ratio scenario (γ ≥ 10) where prey move faster than predators. In the algorithm, this is mathematically modelled as follows:
where
is the updated solution vector,
P is a constant scaling factor, which is considered here an algorithmic parameter, and
is a vector of random numbers generated according to Brownian motion. The vector
is multiplied by
(marine prey), since fast prey usually display random motion. Readers interested in the probabilistic governing equation for
are referred to reference [
23] for more information.
Serving as an intermediate stage from mere exploration to mere exploitation, phase II of MPA maps the behavior of marine predators according to the unit velocity ratio scenario (γ = 1). Observations have shown that both predators and prey are searching for their food, and therefore, they adopt the opposite strategies of each other. This is modelled with half the prey population updating their positions according to Lévy strategy and the other half according to Brownian motion, i.e., 50% exploration and 50% exploitation. Mathematically, this is written as follows:
For the First Half of the Population (Exploitation):where
is a vector of random numbers based on the Lévy distribution [
23].
For the Second Half of the Population (Exploration):
where
CF is a control parameter that dictates the step size length of predator motion.
The final third of MPA iterations simulates the low velocity ratio scenario (γ ≤ 0.1) and serves as a pure exploitation phase. This can be mathematically formulated as follows:
Search agents update their positions around “top predators” in this phase, and therefore, the refinement of solutions is conducted after exploring the search space for 2/3 of the iterations.
Finally, to account for the unusual activity of MPs when confronted with FADs, the population of solution candidates is allowed to update their position vectors according to a predefined probability factor assigned by the user. One of two equations is executed, and they are mathematically presented as follows:
where FADs is the user-defined probability factor,
is a binary vector,
r is a random number between [0, 1], and rand1 and rand2 are subscripts indicating random prey 1 and randomly selected prey 2. This additional step occurs for every computational cycle and can be regarded as a measure to prevent the population from being snarled into local optima. The pseudocode of the proposed MPA algorithm is depicted in
Figure 2.
4. Software Implementation for the MPA Truss Optimization Problem
This section presents the step-by-step software implementation sequence for solving the truss sizing optimization problem. The steps carried out by the algorithm are outlined below:
- Step (1)
Initialize MPA control parameters: Set values for Population Size (PopSize), Scaling Factor (P), Fish Aggregating Devices (FADs), and Maximum Number of Iterations (MaxIt). Iteration counter value initialized to zero (it = 0).
- Step (2)
Load truss benchmark data: Information such as nodal coordinates, member connectivity, material properties, loading conditions, and design variable groupings for a particular structural problem are initialized in this step.
- Step (3)
Generate randomized truss designs: Using Equation (6), a pool of random truss solutions is generated. Solution vectors represent truss cross-sectional area values. Each design variable value corresponds to the area of a particular set of truss members.
- Step (4)
Evaluate the objective function values: The objective function values for all truss designs are evaluated in this step. Initialized designs are analyzed using well-known Finite Element Method process (namely, direct stiffness method). Member stresses and nodal deflections are subsequently estimated and compared to their pre-defined limits (see Equation (4)).
- Step (5)
Determine “Top Predator”: The truss with the lowest weight (best solution) is assigned as the “Elite Predator.” All other solutions update their position values based on it.
- Step (6)
Main MPA Optimization Sequence Begins: Based on the three MP hunting scenarios discussed earlier, new truss designs are generated from Equation (7) to (9) or (11). This step is applied to all members of the population.
- Step (7)
Exploration through FADs: Newer truss designs are generated through Equation (12)
- Step (8)
Objective Function Evaluation: Newly generated truss designs have their objective functions evaluated in this step. A greedy selection is performed, whereby old and new solutions are compared. Those solutions exhibiting lower truss weights are adopted, and heavier ones are discarded.
- Step (9)
Check Stopping Criteria: If the number of iterations exceeds the maximum pre-defined limit (MaxIt), stop the program and display the best truss design. Otherwise, return to step 5.
5. Quantification of the Exploration–Exploitation Balance
In the field of metaheuristic optimization, there is a general consensus that for an algorithm to achieve satisfactory computational performance for a given optimization task, knowledge of the correct balance between exploration and exploitation is a necessary pre-requisite. The question that naturally arises when tackling the problem of truss optimization is:
“What is the correct balance between an algorithm’s global and local search aspects that will yield appropriate results for truss optimization problems?”
For many years, this has been an open question in the field, and no attempt has yet been made to provide a quantitative answer to this straightforward yet crucial question. As mentioned earlier, one of the main contributions of this study, in addition to implementing MPA for truss sizing optimization, is to give a percentile quantity for the proper amount of exploration and exploitation required for structural sizing problems.
To that end, a very recent study conducted by Morales-Castañeda et al. [
43] has extended the concept of a dimension-wise diversity index in an attempt to numerically quantify algorithmic “exploration” and “exploitation.” In their methodology, the distance between search agents from their median (
on a dimension-wise basis) is utilized to estimate the diversity among solution candidates for any single iteration. As the population of search agents come together, the diversity decreases, and vice versa. Population diversity, therefore, is defined as follows:
where
denotes the median of
jth dimension for the entire population and
is the
jth design variable of search agent “
i.”
To simplify matters for readers, Equation (13) estimates the average diversity for all members of the population in a single dimension, while Equation (14) provides the average diversity for the entire population across all dimensions. It is worth mentioning here that the values of both equations are computed for every iteration.
After completing the entire optimization process, the percentage of exploration and exploitation for every iteration is computed as follows,
where
represents the maximum diversity obtained in the optimization process and
is the dimension-wise population diversity at iteration
t. Averaging the entire results of exploration and exploitation for every iteration gives us the required balance of intensification and diversification for the problem.
The provided quantities of both “exploration” and “exploitation,” estimated earlier, are expected to serve as a preliminary rule-of-thumb for any future algorithms specifically developed to tackle structural optimization problems. By adopting the diversity methodology presented in this study, researchers can easily adjust their algorithms to these average exploration/exploitation values and (in theory) achieve comparable structural optimization performance. The findings in that regard are expected to dramatically reduce both the time and effort involved in producing better structural optimization techniques.
For more information, readers are referred to reference [
43] for an in-depth explanation of the diversity index and its application to estimate metaheuristic exploration vs. exploitation.
6. Numerical Examples
Six classical truss benchmarks (three medium-sized and three large-scale) were selected from literature to test MPA efficiency. The adopted benchmarks along with their loading conditions are listed below:
A 10-bar planar truss subjected to two independent loading scenarios,
A 60-bar planar truss ring subjected to three loading conditions,
A 120-bar spatial truss dome with a single loading condition,
A 272-bar electric transmission tower with twelve loading conditions,
A 26-storey, 942-bar truss tower subjected to a single loading condition,
A 62-storey, 4666-bar truss tower with three loading conditions.
The example problems listed above were selected for testing MPA performance based on three criteria: (1) truss type (small or large), (2) solution instances in the literature, and (3) number of design constraints. For criterion 1, both medium- and large-scale trusses were chosen from the literature to account for the various sizes of structures in daily practice. The underlying logic is the crucial necessity of testing MPA robustness for all structural problem types. Criterion 2 was considered in order to ensure the existence of sufficient comparative studies to validate MPA results (i.e., an ample amount of studies in previous works dealing with the benchmarks provides MPA with the necessary number of comparative solutions to draw clear conclusions regarding its performance). Finally, for Criterion 3, the benchmarks containing the greatest number of design constraints were selected to fully challenge MPA’s operation principle. The number of design constraints automatically translates to the number of nodes and structural members a truss possesses. Basically, the greater the number of design constraints a problem has, the more difficult it is to optimize. The benchmarks employed and chosen in this study, therefore, represent a compromise between all three aforementioned selection criteria.
MPA has three control parameters that require tuning before optimization. The parameters are PopSize (Population Size), P (scaling factor), and FADs (Fish Aggregating Devices). Following a detailed sensitivity analysis in which the “one-parameter-at-a-time” methodology was employed (further details are available in ref. [
17]), a combination of
15 for PopSize, 0.1 for FADs, and 0.3 for P was found appropriate for optimal MPA performance. Unless stated otherwise, this combination of parameter values will be used for all benchmarks investigated. The Maximum Number of Iterations (MaxIt), which governs the upper limit of objective function evaluations, was kept as a user-defined variable best adjusted according to the optimization problem. This has been done in full conformity with literary practice in the field. The methodology of arriving at suitable stopping criteria for the different truss benchmarks solved in this study involves testing various MaxIt values (typically adopted from a range) and seeing what value provides the best algorithmic performance with the least amount of computational effort (further details are available in Refs. [
4,
5,
7,
17]). This way, algorithms having different computational budgets (fitness calls vs. iterations) are accounted for, and MHs requiring more iterations to achieve good results naturally perform poorly in terms of convergence speeds. The maximum number of MPA function evaluations (MaxFE) and computational budget, therefore, can be estimated from MaxIt using the following relation:
. It should be noted that in some instances, MPA converges well before reaching the MaxFE limit. Accurate function evaluation values are therefore reported with the help of incremental counters added to the original MATLAB code (accurate computational convergence speeds are thus reported). Using the above-described methodology, a fair algorithmic comparison is achieved in terms of computational speed.
Finally, in implementing MPA, 20 independent runs (as justified by ref. [
49]) were conducted for each benchmark. The best design, the average, the worst, the standard deviation (SD), and the number of function evaluations (NFE) are reported and compared with other optimizers published in literature. To avoid additional computational complexity, the baseline reference results used for comparative purposes were not produced in a system with the same computational configuration (i.e., comparative results were quoted from the literature). Every effort was made, nonetheless, to simulate (as much as possible) the computing conditions and practices followed by those in the field. The Friedman ranking test was also conducted for every truss benchmark solved. Winners and losers are drawn based on three important algorithmic categories: (1) Best Weight, (2) Average Weight, and (3) Number of Function Evaluations. This way, the proposed method was tested against other algorithms based on solution quality, robustness, and speed. MPA was executed using MATLAB, and all runs were carried out on a personal laptop with a 1.8 GHz Intel Corei5 processor and 4 GB of RAM.
6.1. A 10-Bar Planar Truss Structure
The first benchmark considered in this study is the 10-bar planar truss structure (shown in
Figure 3). Two independent loading scenarios were investigated: Case I uses values of P
1 = 100 kips (445 kN) and P
2 = 0, whereas Case II uses values of P
1 = 150 kips (667 kN) and P
2 = 50 kips (222.5 kN). Further details regarding the material properties, design constraints, and cross-sectional area bounds for the truss are conveniently summarized in
Table 1. In total, the problem has 32 non-linear design constraints (10 tension, 10 compression, and 12 displacement constraints).
Table 2 and
Table 4 compare the results found by MPA against other studies for Cases I and II of the benchmark, respectively. Following a thorough test with various MaxIt values, a stopping criterion of 350 iterations (10,500 function evaluations) was set for MPA to solve both cases of the benchmark. Tabulated results reveal MPA produces the lightest structural designs (5060.859 Ib and 4677.00 Ib) with the least computational effort (9570 and 9720 function evaluations) for both scenarios investigated. Moreover, the two corresponding optimization runs recorded a CPU time of 3.45 s. In total, MPA results were compared with eight other metaheuristic algorithms for Case I and nine other algorithms for Case II. On average, MPA showed a 50.64% reduction in computational effort over all other algorithms for Case I and a 51.41% reduction for Case II of the benchmark (about half). In terms of solution robustness, MPA was superior to all previously published algorithms, with the exception of the ACCS optimizer implemented by Kooshkbaghi and Kaveh [
13] for Case II of the benchmark, where a slightly lower standard deviation was reported over MPA. Nonetheless, the difference is so insignificant as to make the algorithms similar in that respect.
Table 3 and
Table 5 show the Friedman rank test results for Cases I and II of the 10-bar truss benchmark. Results show MPA ranking first in all three algorithmic categories tested in this study.
Studying MPA exploration vs. exploitation tradeoff trends for both Cases I and II of the benchmark, an approximate value of 10% exploration and 90% exploitation was reported.
Figure 4 visually depicts the symmetric tradeoff between the two aforementioned search schemes. A closer look at the figure shows that as exploration decreases throughout the optimization process, there is an equal and corresponding increase in exploitation (perfectly symmetrical). Moreover, the rough tradeoff spikes in the figure indicate MPA’s constant reliance on Lévy operators and FADs to produce good results beyond its current neighborhood.
Finally, the estimated values of exploration vs. exploitation show that MPA is, in essence, an “exploitation-dominated” metaheuristic. This completely contradicts the widely held belief that a robust exploration-dominated algorithm is preferred for truss optimization problems. The significance of having an initial estimate of exploration and exploitation for truss optimization problems is that future researchers can use the values to adjust their algorithms to produce similar results.
6.2. A 60-Bar Planar Truss Structure
The 60-bar planar truss structure is schematically shown in
Figure 5. The inner and outer radii of the ring are Ri = 90 in (2.28 m) and Ro = 100 in (2.54 m), respectively. Three loading conditions are considered to act simultaneously on the structure (further details are available in ref. [
13]), and
Table 6 conveniently lists the adopted design parameters for the truss. A total of 168 non-linear design constraints are imposed on the structure (120 tension/compression and 48 node displacements) for every independent loading condition.
Table 7 lists and compares the results obtained by MPA with other methods quoted from literature. A stopping criterion of 800 iterations (24,000 function evaluations) was deemed suitable for the benchmark. Among feasible solutions, MPA achieves the lightest structural design (309.00 Ib) with the least computational effort (23,970 function evaluations). Other algorithms showcasing more lightweight designs, such as the Method of Centers and Force Formulation (MC-FF) algorithm proposed by Farshi and Alinia-Ziazi [
55], were found to have constraint violations and are therefore infeasible. Moreover, the final weight reported by MFUD [
56], although lighter than MPA, lacked all important statistical data to make a fair comparison.
Figure 6 shows the comparison between existing and allowable stresses estimated for the optimal 60-bar truss design produced by MPA. All stress values are clearly shown to be within their predefined limits.
Table 8 presents the Friedman rank test results for the 60-bar planar truss structure. Results show that MPA ranks first in the “average weight” and “convergence speed” categories. Overall, a rank of 1.6667 was achieved by the proposed method for all three categories (therefore outperforming all the rest). MPA is thus the clear winner for this normal-sized benchmark. Finally, it is worth noting that in all statistical aspects, MPA’s worst run outperformed the best results achieved by both CPM-GA [
57] and APM-GA [
57]. Meanwhile, the best combination of average exploration and exploitation for MPA’s best run was found to be 10.56% and 89.43%, respectively, as shown in
Figure 7.
6.3. A 120-Bar Spatial Dome Structure
The third benchmark considered in this study is the 120-bar truss dome (shown in
Figure 8). A single loading scenario comprised of asymmetrical vertical forces is assumed to act on the structure as follows: −13.49 kips for node 1, −6.744 kips for nodes 2 through 14, and −2.248 kips for the rest of the nodes.
Table 9 conveniently summarizes the structural parameters related to the truss, and the allowable stresses for every member
are estimated according to the provisions laid down by AISC-ASD [
22], briefly described below:
Here,
is calculated according to the slenderness ratio
λi and is estimated as follows [
22]:
where
E represents Young’s Modulus,
the material Yield Stress,
Cc is the slenderness ratio dividing the elastic and inelastic regions
, and
λi is the truss member slenderness ratio
. The effective length factor (
k) is assumed to be 1.0 for the truss member pin-pin scenario, while
denotes the radius of gyration. The benchmark has 387 non-linear design constraints (240 tension/compression and 147 displacement constraints).
The results obtained by MPA and several other optimization techniques are shown in
Table 10. A Maximum Iteration value of 425 (12,750 function evaluations) was used as a stopping criterion. The proposed method obtained a final weight of 33,249.46 lbs. in exactly 12,630 function evaluations. No constraint violations were reported, as depicted in
Figure 11. A look at the tabulated results shows MPA outperforming all ten algorithms used to solve the benchmark. The only method yielding similar truss weight was the Hybrid Imperialist-Competitive Harris Hawk Optimizer (ICHHO) developed by Kaveh et al. [
21]. However, upon closer inspection, the algorithm proved insufficient in other essential aspects such as computational effort and solution robustness. Quantitatively, MPA was observed to require 2370 fewer function evaluations (15.80% reduction) over ICHHO. Moreover, inspecting the weight yielded by MPA’s worst run, it was found to be lighter than the best designs proposed by CBO [
59], CSA [
53], ICA [
21], and HHO [
21] with, once again, fewer computational efforts. The convergence history for the 120-bar truss benchmark is shown in
Figure 9. The algorithm shows a sharp reduction in optimized weight prior reaching the 100 iteration mark. Beyond that, refinements to optimized solutions occur at a slower pace. No significant difference is apparent between MPA’s best and worst runs. Overall, a nearly similar convergence profile is apparent for the two. This indicates excellent solution robustness by MPA. The Friedman rank test results for the 120-bar truss structure are shown in
Table 11. The results indicate that MPA achieved first place in all important algorithmic metrics.
The tradeoff convergence trend for the 120-bar truss dome shows no new aspects to it. A symmetrical tradeoff between exploitation and exploration occurs throughout the optimization process, with a sharp reduction in exploration ability after 100 iterations as shown in
Figure 10. Consequently, the average exploration drops from its usual value of 9% to 7.74%. This may be attributable to MPA concentrating on one region of the search space after initial exploration. The rough trend, with occasional spikes in diversity, seems to be a common feature innate to the proposed algorithm. It is clear that this can only be found during the second and third divisions (Phase II and III) of MPA. The Lévy strategy, in addition to the added explorative search achieved through FADs, is absolutely crucial to MPA’s excellent performance as a structural optimizer.
Figure 9.
Convergence history for the 120-bar spatial truss dome.
Figure 9.
Convergence history for the 120-bar spatial truss dome.
Figure 11.
Comparison of permissible and existing restrictions for the 120-bar dome truss. (a) Displacement in the X-direction. (b) Displacement in the Y-direction. (c) Displacement in the Z-direction. (d) Element Stresses.
Figure 11.
Comparison of permissible and existing restrictions for the 120-bar dome truss. (a) Displacement in the X-direction. (b) Displacement in the Y-direction. (c) Displacement in the Z-direction. (d) Element Stresses.
6.4. A 272-Bar Transmission Tower
The 272-bar electric transmission tower, schematically depicted in
Figure 12, is presented as the fourth optimization benchmark and the first large-scale structure investigated in this study. The truss was initially introduced by Kaveh and Massoudi [
60] as a multi-objective optimization benchmark, but was later adopted for single-objective truss optimization problems by Kaveh and Zaerreza [
61] and Sarjamei et al. [
62] to minimize structural volume. Twelve loading conditions are considered to act simultaneously on the tower and are summarized in reference [
49]. Moreover, the 272 bars comprising the structure were split into 28 distinct design variables by dint of structural symmetry (member groupings can be found in ref. [
49]). Finally,
Table 12 conveniently lists the structural parameters related to the benchmark, and 559 non-linear design constraints (559 × 12 = 6708 design constraints for all 12 loading conditions) are considered.
Table 13 compares the results obtained by MPA with those obtained by three other metaheuristic optimizers (found after an extensive search through literature). A stopping criterion of 1000 iterations (30,000 function evaluations) was found suitable as a compromise between solution quality and computational speed (i.e., anything greater than 1000 iterations yielded no improvement to the MPA solution and only unnecessarily added further computational effort). Looking at the tabulated results, the proposed algorithm achieves the lightest structure with a final volume of 1,168,039.233 cm
3 with no stress or displacement constraint violations. In terms of computational effort, MPA has fallen short in comparison to other algorithms. However, upon closer examination, it is clear that the lower computational effort reported by these algorithms is due to their premature convergence. MPA’s excellent Lévy motion strategy prevented this outcome for itself.
Figure 13a shows the convergence trend for the MPA optimizer. It can be seen that the improvement of solutions slows down in the second-third of iterations (i.e., Phase II). Possible explanations include the redundancy of having an “exploration” activity after Phase I of the algorithm (which is already entirely dedicated to exploring the search space).
Table 14 provides the results of the Friedman rank test for the 272-bar truss, with values showing MPA ranking first in all metrics except for the “number of function evaluations” category. Overall, however, MPA ranked first on an average rank basis. This statistically showcases MPA’s superiority over other algorithms that have attempted to solve the benchmark in the literature.
Finally, the exploration vs. exploitation values reported by MPA’s best run revealed a drop in exploration activity from 7.74% for the 120-bar benchmark to just 5.68% for the 272-bar truss. This shows that as the size and complexity of the structure increase, MPA’s reliance on exploitation increases. Furthermore, the Lévy flight/walk motion model, represented by the sharp spikes in the tradeoff curves shown in
Figure 13b, served as an added diversification measure later in the optimization run. In that regard, promising areas of the search space were first identified through Brownian motion, and improved values were yielded after that through intense exploitation.
6.5. A 26-Story, 942-Bar Truss Tower
The 942-bar spatial truss tower is schematically shown in
Figure 14. This benchmark is widely regarded as a challenging high-dimensional optimization problem commonly used in studies investigating metaheuristic robustness.
Table 15 conveniently summarizes the structural design parameters used for the truss, and references [
17,
63] detail the member groupings, loading conditions, and design constraints inherent to the structure. Finally, the benchmark has 1896 non-linear design constraints (1884 tension/compression and 12 displacement).
Table 16 lists the results obtained by MPA along with the results of a sample of other previously published studies. For optimal MPA performance, 1600 iterations (48,000 FEs) were deemed suitable. Among the displayed weights, MPA yielded the lightest structural design (135,364.167 Ib) with the least computational effort (38,880 function evaluations).
Figure 15a shows the convergence history of the 942-bar truss. Numerically, MPA demonstrated a 30.2% reduction in computational effort over the Jaya Algorithm (JA) [
64], a 27.21% reduction over IS-JA [
64], a 22.24% reduction over FA [
65], and a 74.08% decrease over ES [
66]. A closer inspection of tabulated results, however, shows that the Improved Grey Wolf Optimizer (IGWO) proposed by Kaveh and Zakian [
63] required only 28,000 function evaluations to converge (much less than the 38,880 required by MPA). Nonetheless, the final weight yielded by IGWO is heavier in comparison and therefore does not represent optimality. The Freidman rank test results statistically confirm the observations made earlier, where MPA ranks first in the “best weight” and “average weight” categories (
Table 17). IGWO, however, ranks first in the “number of evaluations” category, and MPA obtains third place. Averaging the obtained ranks over all three categories, it becomes clear that MPA is the winner for this large-scale truss benchmark.
Studying the intensification vs. diversification tradeoff trend for this large-scale benchmark in
Figure 15b clearly shows a metaheuristic that is exploitation-dominated. A decrease in exploration activity by 1% was noted over the previous 120-bar benchmark. It appears that as the size and complexity of the optimized structure increase, MPA’s reliance on Lévy operators (instead of pure exploration) to escape local optima increases.
6.6. A 62-Story, 4666-Bar Spatial Truss Tower
The final benchmark considered in this study is the 4666-bar truss tower (shown in
Figure 17). 238 design variables represent the 4666 members that makeup the structure (details available in ref. [
69]). The lower and upper limits of sizing variables are set at 1 in
2 and 300 in
2, respectively. Allowable member stresses are limited to ±25,000 psi. Moreover, nodal displacement values are limited to ±37.5 in (±92.25 cm) for the top four nodes of the structure, and the elastic modulus of steel (E = 10,000 ksi) was used. Therefore, 9344 non-linear design constraints are imposed on the structure (9332 tension/compression and 12 displacement constraints). Three loading categories are considered for this structure:
Load_1: A vertical load of 6 kips (26.69 kN) acting on all free nodes
Load_2: Both left and right side nodes of the tower have a 1-kip (44.48 kN) load acting in the X-direction
Load_3: Both front and back side nodes of the tower have a 1-kip (44.48 kN) load acting in the Y-direction
Using Load_1, Load_2, and Load_3 described earlier, three independent loading conditions are furthermore considered to act in the following manner:
Load_1 acting alone
Load_1 and Load_2 acting together
Load_1, Load_2, and Load_3 all considered simultaneously
Table 18 compares the results provided by MPA against the few algorithms in the literature that attempted to solve the benchmark. After a careful investigation, an upper iteration limit of 1500 (45,000 function evaluations) was found suitable for yielding the best MPA optimization results with the least amount of computational effort. In full adherence to literary practice, the final volume of the optimized structure (in cubic inches) will be reported rather than structural weight. A look at tabulated results shows MPA yielding the best-optimized design with a total volume of 15,544,283 in
3 (254.72 m
3) in exactly 42,290 function evaluations.
Figure 16a shows the MPA convergence history for the current benchmark. Although MPA required greater computational effort to arrive at its final solution (relative to the presented algorithms), the dramatic reduction in total truss volume more than justifies the algorithm’s lack of computational speed. Simply put, previous algorithms that attempted to tackle the benchmark, although quicker than MPA, all prematurely converged to a local optimum. It is also worth pointing out that the worst run produced by MPA considerably outperformed the best runs of SAND [
69], TLBO [
70], iPSO [
70], ISA [
70], and IFSA [
70]. The Friedman rank test results for the 4666-bar truss are shown in
Table 19. Tabulated values confirm MPA’s strength in finding the minimum truss volume with excellent solution robustness. MPA ranked first in the “optimized volume” and “average volume” categories, while 5th place was achieved for the function evaluation category. Overall, MPA obtained an average rank of 2.333 (second place) among all relevant statistical metrics, while IFSA obtained the first position.
Table 20 reports the optimized 238 design variables produced by MPA.
A look at the exploration vs. exploitation tradeoff balance in
Figure 16b shows a diversity trend similar to that depicted by the previous benchmark (942-bar truss). Average exploration and exploitation quantities are also similar, hovering around 7% for exploration and 93% for exploitation. It seems that robust exploitation capabilities ensure excellent results for large-scale truss structures.
Figure 17.
Schematic layout of the 62-story, 4666-bar truss tower.
Figure 17.
Schematic layout of the 62-story, 4666-bar truss tower.
7. Overview of MPA Structural Optimization Performance
This section summarizes MPA performance in relation to the diversity analysis and truss optimization results presented earlier. Overall, MPA showed excellent optimization capabilities when applied to structural optimization. However, some shortcomings were manifest, especially regarding large-scale truss optimization. The following points summarize the core findings of this study:
For normal-sized truss structures (10-bar, 60-bar, and 120-bar trusses), MPA yielded the lightest truss designs with the least amount of computational effort. Excellent solution robustness was also observed by dint of the lower average and standard deviation values for the 20 independent runs conducted. The Friedman ranking results numerically showcased this observation with the proposed algorithm achieving first place in all categories. Furthermore, in some instances, MPA’s worst run outperformed the best runs reported by other recently proposed algorithms.
For the large-scale truss structures (272-bar, 942-bar, and 4666-bar structures), MPA still displayed excellent results. However, it was observed that more objective function evaluations were required for convergence. Nevertheless, the dramatically reduced weights produced by the algorithm fully compensates for it. Again, the Friedman rank results quantify this observation. In terms of algorithmic robustness, MPA showed either as-good-as or better performance than the other algorithms used to solve the benchmarks.
The proper combination of exploration and exploitation required to achieve MPA results varied by a number of degrees from one benchmark to another. However, the variation was mostly confined to a range of 6~9% for exploration and 90~93% for exploitation. Ignoring these slight discrepancies nonetheless, it can be concluded that the correct amount of exploration and exploitation that any algorithm should possess to produce good results is around 10% exploration and 90 % exploitation. Therefore, an exploitation-dominated metaheuristic is expected to perform better than those that are more exploration-oriented.
The incorporation of both Brownian and Lévy motion models as random number generators allowed MPA to both explore and exploit various areas of the design space thoroughly. The diversity spikes in the exploration vs. exploitation tradeoff figures visually show this. The incorporation of the Lévy flight/walk model in existing or new metaheuristic algorithms as an added exploitation tactic is, therefore, recommended.
8. Conclusions
In this study, the optimal design of truss structures is considered (for the first time) using the newly developed Marine Predators Algorithm (MPA). Six challenging structural benchmarks were selected from literature to investigate MPA performance.
Results show MPA is particularly suited for the medium-sized truss structure category, where optimal results were achieved with the least amount of computational effort. In contrast, for the large-scale benchmarks, MPA was shown to require a greater number of function evaluations to converge (relative to other methods). Nevertheless, the much lighter truss designs produced by the algorithm completely justified the slower performance. The experimental sections repeatedly emphasized this for the 272-bar, 942-bar, and 4666-bar truss towers. In addition, studying the diversity of MPA candidate solutions across the search space indicated the dominance of the Lévy motion strategy. This scheme allowed MPA to avoid being snarled into local optima. This was especially useful given the challenging multi-modal nature of the design search space associated with structural optimization problems. Therefore, the notion that Lévy-based MH algorithms are well suited for truss optimization problems was verified in this study. Similarly, owing to its robust Brownian-motion exploration mechanisms, the proposed algorithm successfully located promising regions of the search space, which only enhanced solution quality and stability. This observation was found to hold true for all the benchmarks considered.
Moreover, for the first time in the field, a numerical assessment of MPA’s exploration to exploitation balance (in the context of truss optimization) was conducted. Results show that a combination of 10% exploration and 90% exploitation is favored for truss optimization problems. Therefore, exploitation is more important than exploration for structural optimization tasks.
In conclusion, the excellent performance of MPA along with its relatively few performance parameters make it a robust optimization metaheuristic when applied to truss sizing problems. Readers are encouraged to extend the application of MPA to other structural optimization tasks, such as frames, plates, shells, etc.
Author Contributions
Conceptualization, R.B.; Visualization, R.B.; Software, R.B.; Formal Analysis, R.B.; Writing—original draft preparation, R.B.; Funding acquisition, R.B.; Supervision, F.S.; Project Administration, F.S.; Data curation, F.S.; Writing—review and editing, F.S. All authors have read and agreed to the published version of the manuscript.
Funding
This research received no external funding.
Data Availability Statement
MPA code and truss data will be provided upon request.
Acknowledgments
The authors wish to extend their heartfelt gratitude to Seyedali Mirjalili—Center for Artificial Intelligence Research and Optimization, University of Torrens Australia, Sydney, Australia, for his useful comments and help in improving the overall quality of the manuscript.
Conflicts of Interest
The authors declare no conflict of interest.
References
- Wolpert, D.H.; Macready, W.G. No free lunch theorems for optimization. IEEE Trans. Evol. Comput. 1997, 1, 67–82. [Google Scholar] [CrossRef]
- Le, T.; Bui, D.-K.; Ngo, T.D.; Nguyen, Q.-H.; Nguyen-Xuan, H. A novel hybrid method combining electromagnetism-like mechanism and firefly algorithms for constrained design optimization of discrete truss structures. Comput. Struct. 2019, 212, 20–42. [Google Scholar] [CrossRef]
- Lee, K.S.; Geem, Z.W. A new structural optimization method based on the harmony search algorithm. Comput. Struct. 2004, 82, 781–798. [Google Scholar] [CrossRef]
- Sonmez, M. Artificial Bee Colony algorithm for optimization of truss structures. Appl. Soft Comput. 2011, 11, 2406–2418. [Google Scholar] [CrossRef]
- Sonmez, M. Discrete optimum design of truss structures using artificial bee colony algorithm. Struct. Multidiscip. Optim. 2011, 43, 85–97. [Google Scholar] [CrossRef]
- Degertekin, S.; Hayalioglu, M. Sizing truss structures using teaching-learning-based optimization. Comput. Struct. 2013, 119, 177–188. [Google Scholar] [CrossRef]
- Bekdaş, G.; Nigdeli, S.M.; Yang, X.-S. Sizing optimization of truss structures using flower pollination algorithm. Appl. Soft Comput. 2015, 37, 322–331. [Google Scholar] [CrossRef]
- Kaveh, A.; Bakhshpoori, T. Optimum design of space trusses using cuckoo search algorithm with levy flights. Iran J. Sci. Tech. 2013, 37, 1–15. [Google Scholar]
- Kaveh, A.; Khayatazad, M. Ray optimization for size and shape optimization of truss structures. Comput. Struct. 2013, 117, 82–94. [Google Scholar] [CrossRef]
- Jalili, S.; Hosseinzadeh, Y. A Cultural Algorithm for Optimal Design of Truss Structures. Lat. Am. J. Solids Struct. 2015, 12, 1721–1747. [Google Scholar] [CrossRef]
- Kaveh, A.; Mahdavi, V. Colliding Bodies Optimization method for optimum design of truss structures with continuous variables. Adv. Eng. Softw. 2014, 70, 1–12. [Google Scholar] [CrossRef]
- Kaveh, A.; Bakhshpoori, T. A new metaheuristic for continuous structural optimization: Water evaporation optimization. Struct. Multidiscip. Optim. 2016, 54, 23–43. [Google Scholar] [CrossRef]
- Kooshkbaghi, M.; Kaveh, A. Sizing Optimization of Truss Structures with Continuous Variables by Artificial Coronary Circulation System Algorithm. Iran. J. Sci. Technol. Trans. Civ. Eng. 2020, 44, 1–20. [Google Scholar] [CrossRef]
- Ozbasaran, H.; Yildirim, M.E. Truss-sizing optimization attempts with CSA: A detailed evaluation. Soft Comput. 2020, 24, 16775–16801. [Google Scholar] [CrossRef]
- Degertekin, S.; Lamberti, L.; Hayalioglu, M. Heat Transfer Search Algorithm for Sizing Optimization of Truss Structures. Lat. Am. J. Solids Struct. 2017, 14, 373–397. [Google Scholar] [CrossRef]
- Azizi, M.; Shishehgarkhaneh, M.B.; Basiri, M. Optimum design of truss structures by Material Generation Algorithm with discrete variables. Decis. Anal. J. 2022, 3, 100043. [Google Scholar] [CrossRef]
- Awad, R. Sizing optimization of truss structures using the political optimizer (PO) algorithm. Structures 2021, 33, 4871–4894. [Google Scholar] [CrossRef]
- Kaveh, A.; Talatahari, S. Particle swarm optimizer, ant colony strategy and harmony search scheme hybridized for optimization of truss structures. Comput. Struct. 2009, 87, 267–283. [Google Scholar] [CrossRef]
- Khatibinia, M.; Yazdani, H. Accelerated multi-gravitational search algorithm for size optimization of truss structures. Swarm Evol. Comput. 2018, 38, 109–119. [Google Scholar] [CrossRef]
- Kaveh, A.; Ghazaan, M.I.; Bakhshpoori, T. An improved ray optimization algorithm for design of truss structures. Period. Polytech. Civ. Eng. 2013, 57, 97. [Google Scholar] [CrossRef]
- Kaveh, A.; Rahmani, P.; Eslamlou, A.D. An efficient hybrid approach based on Harris Hawks optimization and imperialist competitive algorithm for structural optimization. Eng. Comput. 2021, 38, 1555–1583. [Google Scholar] [CrossRef]
- Jafari, M.; Salajegheh, E.; Salajegheh, J. Optimal design of truss structures using a hybrid method based on particle swarm optimizer and cultural algorithm. Structures 2021, 32, 391–405. [Google Scholar] [CrossRef]
- Faramarzi, A.; Heidarinejad, M.; Mirjalili, S.; Gandomi, A.H. Marine Predators Algorithm: A nature-inspired metaheuristic. Expert Syst. Appl. 2020, 152, 113377. [Google Scholar] [CrossRef]
- El Sattar, M.A.; Al Sumaiti, A.; Ali, H.; Diab, A.A.Z. Marine predators algorithm for parameters estimation of photovoltaic modules considering various weather conditions. Neural Comput. Appl. 2021, 33, 11799–11819. [Google Scholar] [CrossRef]
- Elminaam, D.S.A.; Nabil, A.; Ibraheem, S.A.; Houssein, E.H. An Efficient Marine Predators Algorithm for Feature Selection. IEEE Access 2021, 9, 60136–60153. [Google Scholar] [CrossRef]
- Kumar, S.; Yildiz, B.S.; Mehta, P.; Panagant, N.; Sait, S.M.; Mirjalili, S.; Yildiz, A.R. Chaotic Marine Predators Algorithm for Global Optimization of Real-World Engineering Problems; Elsevier B.V.: Amsterdam, The Netherlands, 2023; Volume 261. [Google Scholar] [CrossRef]
- Sahlol, A.T.; Yousri, D.; Ewees, A.A.; Al-Qaness, M.A.A.; Damasevicius, R.; Elaziz, M.A. COVID-19 image classification using deep features and fractional-order marine predators algorithm. Sci. Rep. 2020, 10, 1–15. [Google Scholar] [CrossRef] [PubMed]
- Owoola, E.O.; Xia, K.; Ogunjo, S.; Mukase, S.; Mohamed, A. Advanced Marine Predator Algorithm for Circular Antenna Array Pattern Synthesis. Sensors 2022, 22, 5779. [Google Scholar] [CrossRef]
- Jawad, F.K.; Mahmood, M.; Wang, D.; Al-Azzawi, O.; Al-Jamely, A. Heuristic dragonfly algorithm for optimal design of truss structures with discrete variables. Structures 2021, 29, 843–862. [Google Scholar] [CrossRef]
- Etaati, B.; Dehkordi, A.A.; Sadollah, A.; El-Abd, M.; Neshat, M. A Comparative State-of-the-Art Constrained Metaheuristics Framework for TRUSS Optimisation on Shape and Sizing. Math. Probl. Eng. 2022, 2022, 1–13. [Google Scholar] [CrossRef]
- Cui, Y.; Shi, R.; Dong, J. CLTSA: A Novel Tunicate Swarm Algorithm Based on Chaotic-Lévy Flight Strategy for Solving Optimization Problems. Mathematics 2022, 10, 3405. [Google Scholar] [CrossRef]
- Aydogdu, I.; Carbas, S.; Akin, A. Effect of Levy Flight on the discrete optimum design of steel skeletal structures using metaheuristics. Steel Compos. Struct. 2017, 24, 93–112. [Google Scholar] [CrossRef]
- Kaveh, A.; Hosseini, S.M. Improved Bat Algorithm Based on Doppler Effect for Optimal Design of Special Truss Structures. J. Comput. Civ. Eng. 2022, 36, 04022028. [Google Scholar] [CrossRef]
- Aydoğdu, I.; Akın, A.; Saka, M. Design optimization of real world steel space frames using artificial bee colony algorithm with Levy flight distribution. Adv. Eng. Softw. 2016, 92, 1–14. [Google Scholar] [CrossRef]
- Tzanetos, A.; Blondin, M. A qualitative systematic review of metaheuristics applied to tension/compression spring design problem: Current situation, recommendations, and research direction. Eng. Appl. Artif. Intell. 2023, 118, 105521. [Google Scholar] [CrossRef]
- Kaveh, A.; Hamedani, K.B.; Hamedani, K.B.; Kamalinejad, M. Improved Arithmetic Optimization Algorithm for Structural Optimization With Frequency Constraints. Int. J. Optim. Civ. Eng. 2021, 11, 55. Available online: https://www.researchgate.net/publication/356414964 (accessed on 28 March 2023).
- Tzanetos, A.; Dounias, G. Sonar inspired optimization (SIO) in engineering applications. Evol. Syst. 2020, 11, 531–539. [Google Scholar] [CrossRef]
- Zhao, Y.; Leng, L.; Qian, Z.; Wang, W. A Discrete Hybrid Invasive Weed Optimization Algorithm for the Capacitated Vehicle Routing Problem. Procedia Comput. Sci. 2016, 91, 978–987. [Google Scholar] [CrossRef]
- Tsai, C.-H.; Lin, Y.-D.; Yang, C.-H.; Wang, C.-K.; Chiang, L.-C.; Chiang, P.-J. A Biogeography-Based Optimization with a Greedy Randomized Adaptive Search Procedure and the 2-Opt Algorithm for the Traveling Salesman Problem. Sustainability 2023, 15, 5111. [Google Scholar] [CrossRef]
- Goodarzimehr, V.; Topal, U.; Das, A.K.; Vo-Duy, T. Bonobo optimizer algorithm for optimum design of truss structures with static constraints. Structures 2023, 50, 400–417. [Google Scholar] [CrossRef]
- Kaveh, A.; Rad, A.S. Metaheuristic-based optimal design of truss structures using algebraic force method. Structures 2023, 50, 1951–1964. [Google Scholar] [CrossRef]
- Altay, O.; Cetindemir, O.; Aydogdu, I. Size optimization of planar truss systems using the modified salp swarm algorithm. Eng. Optim. 2023, 1–17. [Google Scholar] [CrossRef]
- Morales-Castañeda, B.; Zaldívar, D.; Cuevas, E.; Fausto, F.; Rodríguez, A. A better balance in metaheuristic algorithms: Does it exist? Swarm Evol. Comput. 2020, 54, 100671. [Google Scholar] [CrossRef]
- Coello, C.A.C. Theoretical and numerical constraint-handling techniques used with evolutionary algorithms: A survey of the state of the art. Comput. Methods Appl. Mech. Eng. 2002, 191, 1245–1287. [Google Scholar] [CrossRef]
- Rajeev, S.; Krishnamoorthy, C.S. Discrete Optimization of Structures Using Genetic Algorithms. J. Struct. Eng. 1992, 118, 1233–1250. [Google Scholar] [CrossRef]
- Kaveh, A.; Hamedani, K.B.; Kamalinejad, M. An enhanced Forensic-Based Investigation algorithm and its application to optimal design of frequency-constrained dome structures. Comput. Struct. 2021, 256, 106643. [Google Scholar] [CrossRef]
- Jawad, F.K.; Ozturk, C.; Dansheng, W.; Mahmood, M.; Al-Azzawi, O.; Al-Jemely, A. Sizing and layout optimization of truss structures with artificial bee colony algorithm. Structures 2021, 30, 546–559. [Google Scholar] [CrossRef]
- Mei, L.; Wang, Q. Structural Optimization in Civil Engineering: A Literature Review. Buildings 2021, 11, 66. [Google Scholar] [CrossRef]
- Kaveh, A.; Akbari, H.; Hosseini, S.M. Plasma generation optimization: A new physically-based metaheuristic algorithm for solving constrained optimization problems. Eng. Comput. 2020, 38, 1554–1606. [Google Scholar] [CrossRef]
- Camp, C.V.; Farshchin, M. Design of space trusses using modified teaching–learning based optimization. Eng. Struct. 2014, 62-63, 87–97. [Google Scholar] [CrossRef]
- Kaveh, A.; Bakhshpoori, T.; Afshari, E. An efficient hybrid Particle Swarm and Swallow Swarm Optimization algorithm. Comput. Struct. 2014, 143, 40–59. [Google Scholar] [CrossRef]
- Kaveh, A.; Zolghadr, A. Cyclical Parthenogenesis Algorithm: A new meta-heuristic algorithm. Asian J. Civ. Eng. 2017, 18, 673–701. [Google Scholar]
- Javidi, A.; Salajegheh, E.; Salajegheh, J. Enhanced crow search algorithm for optimum design of structures. Appl. Soft Comput. 2019, 77, 274–289. [Google Scholar] [CrossRef]
- Talatahari, S.; Kheirollahi, M.; Farahmandpour, C.; Gandomi, A.H. A multi-stage particle swarm for optimum design of truss structures. Neural Comput. Appl. 2013, 23, 1297–1309. [Google Scholar] [CrossRef]
- Farshi, B.; Alinia-Ziazi, A. Sizing optimization of truss structures by method of centers and force formulation. Int. J. Solids Struct. 2010, 47, 2508–2524. [Google Scholar] [CrossRef]
- Patnaik, S.N.; Gendy, A.S.; Berke, L.; Hopkins, D.A. Modified fully utilized design (MFUD) method for stress and displacement constraints. Int. J. Numer. Methods Eng. 1998, 41, 1171–1194. [Google Scholar] [CrossRef]
- Barbosa, H.J.; Lemonge, A.C. A new adaptive penalty scheme for genetic algorithms. Inf. Sci. 2003, 156, 215–251. [Google Scholar] [CrossRef]
- Makris, P.A.; Provatidis, C.G. Weight minimisation of displacement-constrained truss structures using a strain energy criterion. Comput. Methods Appl. Mech. Eng. 2002, 191, 2187–2205. [Google Scholar] [CrossRef]
- Kaveh, A.; Mahdavi, V. Colliding bodies optimization: A novel meta-heuristic method. Comput. Struct. 2014, 139, 18–27. [Google Scholar] [CrossRef]
- Kaveh, A.; Massoudi, M.S. Multi-objective optimization of structures using Charged System Search. Sci. Iran 2014, 21, 1845–1860. [Google Scholar]
- Kaveh, A.; Zaerreza, A. Shuffled shepherd optimization method: A new Meta-heuristic algorithm. Eng. Comput. 2020, 37, 2357–2389. [Google Scholar] [CrossRef]
- Sarjamei, S.; Massoudi, M.S.; Esfandi Sarafraz, M. Gold Rush Optimization Algorithm. Iran Univ. Sci. Technol. 2021, 11, 291–327. [Google Scholar]
- Kaveh, A.; Zakian, P. Improved GWO algorithm for optimal design of truss structures. Eng. Comput. 2018, 34, 685–707. [Google Scholar] [CrossRef]
- Kaveh, A.; Hosseini, S.M.; Zaerreza, A. Improved Shuffled Jaya algorithm for sizing optimization of skeletal structures with discrete variables. Structures 2021, 29, 107–128. [Google Scholar] [CrossRef]
- Talatahari, S.; Gandomi, A.H.; Yun, G.J. Optimum design of tower structures using Firefly Algorithm. Struct. Des. Tall Spéc. Build. 2014, 23, 350–361. [Google Scholar] [CrossRef]
- Hasançebi, O. Adaptive evolution strategies in structural optimization: Enhancing their computational performance with applications to large-scale structures. Comput. Struct. 2008, 86, 119–132. [Google Scholar] [CrossRef]
- Erbatur, F. On efficient use of simulated annealing in complex structural optimization problems. Acta Mech. 2002, 157, 27–50. [Google Scholar] [CrossRef]
- Rahami, H.; Kaveh, A.; Aslani, M.; Najian Asl, R. A hybrid modified genetic-nelder mead simplex algorithm for large-scale truss optimization. Int. J. Optim. Civ. Eng. 2011, 1, 29–46. [Google Scholar]
- Wang, Q.; Arora, J.S. Optimization of large-scale truss structures using sparse SAND formulations. Int. J. Numer. Methods Eng. 2006, 69, 390–407. [Google Scholar] [CrossRef]
- Mortazavi, A. Large-scale structural optimization using a fuzzy reinforced swarm intelligence algorithm. Adv. Eng. Softw. 2020, 142, 102790. [Google Scholar] [CrossRef]
Figure 1.
Typical foraging tactics of marine predators in oceanic environments.
Figure 1.
Typical foraging tactics of marine predators in oceanic environments.
Figure 2.
Pseudocode of the MPA algorithm.
Figure 2.
Pseudocode of the MPA algorithm.
Figure 3.
Schematic of the 10-bar planar truss structure.
Figure 3.
Schematic of the 10-bar planar truss structure.
Figure 4.
Exploration to exploitation tradeoff trend for the 10-bar planar truss structure. (a) Case I and (b) Case II.
Figure 4.
Exploration to exploitation tradeoff trend for the 10-bar planar truss structure. (a) Case I and (b) Case II.
Figure 5.
Schematic of the 60-bar planar truss structure (not drawn to scale).
Figure 5.
Schematic of the 60-bar planar truss structure (not drawn to scale).
Figure 6.
Stress constraint values estimated for the optimized 60-bar planar truss structure.
Figure 6.
Stress constraint values estimated for the optimized 60-bar planar truss structure.
Figure 7.
Exploration to exploitation tradeoff trend for the 60-bar planar truss.
Figure 7.
Exploration to exploitation tradeoff trend for the 60-bar planar truss.
Figure 8.
Schematic of the 120-bar spatial truss dome. (a) Front View; (b) Top View.
Figure 8.
Schematic of the 120-bar spatial truss dome. (a) Front View; (b) Top View.
Figure 10.
Exploration to exploitation tradeoff trend for the 120-bar truss dome.
Figure 10.
Exploration to exploitation tradeoff trend for the 120-bar truss dome.
Figure 12.
Schematic of the 272-bar electric transmission tower (a) Isometric View; (b) Front View.
Figure 12.
Schematic of the 272-bar electric transmission tower (a) Isometric View; (b) Front View.
Figure 13.
(a) Convergence history for the 272-bar truss tower. (b) Exploration to exploitation tradeoff trend for the 272-bar truss tower.
Figure 13.
(a) Convergence history for the 272-bar truss tower. (b) Exploration to exploitation tradeoff trend for the 272-bar truss tower.
Figure 14.
Schematic of the 942-bar truss tower (a) Isometric View; (b) Front View; (c) Top View.
Figure 14.
Schematic of the 942-bar truss tower (a) Isometric View; (b) Front View; (c) Top View.
Figure 15.
(a) Convergence history for the 942-bar truss tower. (b) Exploration to exploitation tradeoff trend for the 942-bar truss tower.
Figure 15.
(a) Convergence history for the 942-bar truss tower. (b) Exploration to exploitation tradeoff trend for the 942-bar truss tower.
Figure 16.
(a) Convergence history for the 4666-bar truss structure. (b) Exploration to exploitation tradeoff trend for the 4666-bar truss tower.
Figure 16.
(a) Convergence history for the 4666-bar truss structure. (b) Exploration to exploitation tradeoff trend for the 4666-bar truss tower.
Table 1.
Structural parameters for the 10-bar planar truss [
4,
17].
Table 1.
Structural parameters for the 10-bar planar truss [
4,
17].
| Property | Value |
|---|
| Material Density | 0.1 Ib/in3 |
| Young’s Modulus | 10,000 ksi |
| Number of Area Groups | 10 |
| Maximum Normal Stresses | ±25 ksi |
| Maximum Nodal Displacements (x, y) | ±2 in. |
| Range of Cross-sectional Areas | 0.1~35.0 in2 |
Table 2.
Optimized result comparison for the 10-bar planar truss (Case I).
Table 2.
Optimized result comparison for the 10-bar planar truss (Case I).
| Design Variable (in2) | (ABC-AP) [4] | (TLBO) [6] | (mTLBO) [50] | (HPSSO) [51] | (WEO) [12] | (CPA) [52] | (CSA) [53] | (ECSA) [53] | This Study |
|---|
| (MPA)Best | (MPA)Worst |
|---|
| A1 | 30.548 | 30.4286 | 30.6684 | 30.53838 | 30.5755 | 30.5022 | 33.6116 | 30.5096 | 30.5066 | 30.629 |
| A2 | 0.100 | 0.1000 | 0.1000 | 0.1 | 0.1000 | 0.1000 | 0.1478 | 0.1000 | 0.1 | 0.10997 |
| A3 | 23.180 | 23.2436 | 23.1584 | 23.15103 | 23.3368 | 23.2170 | 22.9345 | 23.2253 | 23.1736 | 23.023 |
| A4 | 15.218 | 15.3677 | 15.2226 | 15.20566 | 15.1497 | 15.2204 | 13.9637 | 15.2315 | 15.2499 | 15.3 |
| A5 | 0.100 | 0.1000 | 0.1000 | 0.1 | 0.1000 | 0.1001 | 0.1050 | 0.1000 | 0.1 | 0.1 |
| A6 | 0.551 | 0.5751 | 0.5421 | 0.548897 | 0.5276 | 0.5587 | 0.3611 | 0.5517 | 0.5558 | 0.54452 |
| A7 | 7.463 | 7.4404 | 7.4654 | 7.465322 | 7.4458 | 7.4548 | 7.9202 | 7.4561 | 7.4566 | 7.4722 |
| A8 | 21.058 | 20.9665 | 21.0255 | 21.06437 | 20.9892 | 21.0371 | 22.0883 | 21.0276 | 21.0229 | 21.018 |
| A9 | 21.501 | 21.5330 | 21.4660 | 21.52935 | 21.5236 | 21.5295 | 19.6785 | 21.5239 | 21.5494 | 21.544 |
| A10 | 0.100 | 0.1000 | 0.1000 | 0.1 | 0.1000 | 0.1002 | 0.1041 | 0.1000 | 0.1 | 0.10001 |
| Weight (Ib) | 5060.88 | 5060.96 | 5060.97 | 5060.86 | 5060.99 | 5060.92 | 5095.40 | 5060.91 | 5060.859 | 5061.86 |
| Avg. Weight (Ib) | N/A | 5062.08 | 5064.808 | 5062.28 | 5062.09 | 5062.45 | 5290.79 | 5063.41 | 5061.12 | - |
| St. Deviation (Ib) | N/A | 0.79 | 6.3707 | 4.325 | 2.05 | 3.77 | 125.89 | 5.43 | 0.304 | - |
| Con. Violation | None | None | None | None | None | None | None | None | None | None |
| No. of Evaluations | 500,000 | 16,872 | 13,767 | 14,118 | 19,540 | 23,700 | 18,706 | 16,401 | 9570 | 9810 |
| Avg. Exploration | -- | -- | -- | -- | -- | -- | -- | -- | 9.93% | -- |
| Avg. Exploitation | -- | -- | -- | -- | -- | -- | -- | -- | 90.06% | -- |
Table 3.
Friedman rank test results for the 10-bar planar truss (Case I).
Table 3.
Friedman rank test results for the 10-bar planar truss (Case I).
| Category | (ABC-AP) [4] | (TLBO) [6] | (mTLBO) [50] | (HPSSO) [51] | (WEO) [12] | (CPA) [52] | (CSA) [53] | (ECSA) [53] | This Study |
|---|
| (MPA)Best | (MPA)Worst |
|---|
| Friedman Rank (Weight) | 3 | 6 | 7 | 2 | 8 | 5 | 9 | 4 | 1 | -- |
| Friedman Rank (Avg.) | 9 | 2 | 7 | 4 | 3 | 5 | 8 | 6 | 1 | -- |
| Friedman Rank (NFE) | 9 | 5 | 2 | 3 | 7 | 8 | 6 | 4 | 1 | -- |
| Averaged Rank | 7 | 4.333 | 5.333 | 3 | 6 | 6 | 7.6667 | 4.6667 | 1 | -- |
Table 4.
Optimized result comparison for the 10-bar planar truss (Case II).
Table 4.
Optimized result comparison for the 10-bar planar truss (Case II).
| Design Variable (in2) | (ABC-AP) [4] | (MSPSO) [54] | (TLBO) [6] | (WEO) [12] | (PGO) [49] | (ACCS) [13] | (ICA) [21] | (HHO) [21] | (ICHHO) [21] | This Study |
|---|
| (MPA)Best | (MPA)Worst |
|---|
| A1 | 23.4692 | 23.4432 | 23.524 | 23.5804 | 23.5326 | 23.522 | 23.9224 | 24.335 | 23.4119 | 23.4469 | 23.580 |
| A2 | 0.1005 | 0.1000 | 0.1000 | 0.1003 | 0.1000 | 0.1 | 0.1 | 0.1 | 0.1 | 0.10002 | 0.1243 |
| A3 | 25.2393 | 25.3718 | 25.441 | 25.1582 | 25.0068 | 25.364 | 25.6412 | 22.188 | 25.0207 | 25.3183 | 25.199 |
| A4 | 14.354 | 14.1360 | 14.479 | 14.1801 | 14.4241 | 14.503 | 15.0520 | 17.095 | 14.4040 | 14.3490 | 14.295 |
| A5 | 0.1001 | 0.1000 | 0.1000 | 0.1002 | 0.1000 | 0.1 | 0.1 | 0.1 | 0.1 | 0.10003 | 0.1001 |
| A6 | 1.9701 | 1.9699 | 1.995 | 1.9708 | 1.9721 | 1.97 | 1.9690 | 2.0380 | 1.9727 | 1.96979 | 1.9679 |
| A7 | 12.4128 | 12.4335 | 12.334 | 12.4511 | 12.4286 | 12.417 | 12.2295 | 13.095 | 12.4683 | 12.40842 | 12.429 |
| A8 | 12.8925 | 13.0173 | 12.689 | 12.9349 | 12.8215 | 12.938 | 12.4021 | 13.06 | 12.9778 | 12.92012 | 12.919 |
| A9 | 20.3343 | 20.2717 | 20.354 | 20.3595 | 20.4603 | 20.058 | 19.9683 | 19.778 | 20.3544 | 20.27331 | 20.309 |
| A10 | 0.1000 | 0.1000 | 0.1000 | 0.1001 | 0.1000 | 0.1 | 0.1029 | 0.1018 | 0.1 | 0.10001 | 0.1015 |
| Weight (Ib) | 4677.077 | 4677.26 | 4678.31 | 4677.31 | 4677.17 | 4677.267 | 4680.14 | 4714.56 | 4677.50 | 4677.00 | 4679.22 |
| Avg. Weight (Ib) | N/A | 4681.45 | 4680.12 | 4679.06 | 4677.88 | 4677.909 | 4756.29 | 5024.08 | 4682.84 | 4677.81 | - |
| St. Deviation (Ib) | N/A | 2.19 | 1.016 | 2.07 | 0.72 | 0.455 | 97.273 | 649.89 | 3.816 | 0.58 | - |
| Con. Violation | None | None | None | None | None | None | None | None | None | None | None |
| No. of Evaluations | 500,000 | 25,000 | 14,857 | 19,890 | 17,580 | 12,000 | 20,000 | 20,000 | 20,000 | 9720 | 9840 |
| Avg. Exploration | -- | -- | -- | -- | -- | -- | -- | -- | -- | 6.87% | -- |
| Avg. Exploitation | -- | -- | -- | -- | -- | -- | -- | -- | -- | 93.12% | -- |
Table 5.
Friedman rank test results for the 10-bar planar truss (Case II).
Table 5.
Friedman rank test results for the 10-bar planar truss (Case II).
| Category | (ABC-AP) [4] | (MSPSO) [54] | (TLBO) [6] | (WEO) [12] | (PGO) [49] | (ACCS) [13] | (ICA) [21] | (HHO) [21] | (ICHHO) [21] | This Study |
|---|
| (MPA)Best | (MPA)Worst |
|---|
| Friedman Rank (Weight) | 2 | 4 | 8 | 6 | 3 | 5 | 9 | 10 | 7 | 1 | -- |
| Friedman Rank (Avg.) | 10 | 6 | 5 | 4 | 2 | 3 | 8 | 9 | 7 | 1 | -- |
| Friedman Rank (NFE) | 10 | 9 | 3 | 5 | 4 | 2 | 7 | 7 | 7 | 1 | -- |
| Averaged Rank | 7.333 | 6.333 | 5.333 | 5 | 3 | 3.333 | 8 | 8.6667 | 7 | 1 | -- |
Table 6.
Structural parameters for the 60-bar planar truss ring [
13].
Table 6.
Structural parameters for the 60-bar planar truss ring [
13].
| Property | Value |
|---|
| Material Density | 0.1 Ib/in3 |
| Young’s Modulus | 10,000 ksi |
| Number of Area Groups | 25 |
| Maximum Normal Stresses | ±10 ksi |
| Maximum Nodal Displacements (x, y) | ±1.75 in. (Node 4), ±2.75 in. (Node 19), ±2.25 in. (Node 13) |
| Range of Cross-sectional Areas | 0.5 ~ 4 in2 |
Table 7.
Optimized result comparison for the 60-bar planar truss.
Table 7.
Optimized result comparison for the 60-bar planar truss.
| Design Variable (in2) | (MFUD) [56] | (SECr) [58] | (CPM-GA) [57] | (APM-GA) [57] | (MC-FF) [55] | (ACCS) [13] | This Study |
|---|
| (MPA)Best | (MPA)Worst |
|---|
| A1 (M1, M13) | N/A | 2.027 | 1.1906 | 1.1202 | 2.0273 | 2.1405 | 2.02824 | 1.98861 |
| A2 (M2, M14) | N/A | 0.5 | 2.2771 | 2.0219 | 0.5000 | 0.5068 | 1.77589 | 0.54147 |
| A3 (M3, M15) | N/A | 1.907 | 0.6055 | 0.5088 | 1.7781 | 1.6508 | 1.77589 | 1.90366 |
| A4 (M4, M16) | N/A | 1.826 | 1.5733 | 1.7273 | 1.7775 | 1.7615 | 1.66753 | 1.78047 |
| A5 (M5, M17) | 0.59 | 0.633 | 1.3753 | 1.5205 | 0.5793 | 0.5949 | 0.57721 | 0.52531 |
| A6 (M6, M18) | N/A | 1.846 | 0.5087 | 0.5264 | 1.8305 | 1.8235 | 1.96150 | 2.09292 |
| A7 (M7, M19) | N/A | 1.841 | 1.9340 | 1.9032 | 1.7947 | 1.7580 | 1.87626 | 2.18541 |
| A8 (M8, M20) | N/A | 1.005 | 2.0528 | 2.1275 | 0.9830 | 0.9732 | 1.00689 | 1.07834 |
| A9 (M9, M21) | N/A | 1.847 | 1.2390 | 0.9882 | 1.9031 | 2.0860 | 1.78673 | 1.56056 |
| A10 (M10, M22) | 1.84 | 1.885 | 1.8196 | 2.0528 | 1.9497 | 1.9542 | 1.85856 | 1.61833 |
| A11 (M11, M23) | N/A | 0.5 | 1.6393 | 2.0528 | 0.5000 | 0.5154 | 0.50000 | 0.50001 |
| A12 (M12, M24) | N/A | 2.025 | 0.5264 | 0.7243 | 2.0135 | 2.0438 | 2.02047 | 2.01238 |
| A13 (M25, M37) | N/A | 1.25 | 2.1979 | 1.9604 | 1.2441 | 1.2434 | 1.24579 | 1.26097 |
| A14 (M26, M38) | N/A | 1.022 | 1.2346 | 1.2302 | 1.0156 | 1.0397 | 1.01628 | 1.08643 |
| A15 (M27, M39) | 0.77 | 0.752 | 1.0498 | 0.9970 | 0.6896 | 0.7461 | 0.70831 | 0.59603 |
| A16 (M28, M40) | N/A | 0.771 | 0.7595 | 0.6056 | 0.7233 | 0.6563 | 0.81626 | 0.82665 |
| A17 (M29, M41) | N/A | 0.928 | 0.6143 | 0.7287 | 1.0578 | 0.9692 | 1.08483 | 1.15086 |
| A18 (M30, M42) | N/A | 1.128 | 1.1202 | 1.0938 | 1.1226 | 1.1296 | 1.12470 | 1.14790 |
| A19 (M31, M43) | N/A | 1.144 | 1.1158 | 1.1158 | 1.1512 | 1.1599 | 1.14808 | 1.13739 |
| A20 (M32, M44) | N/A | 0.922 | 1.1554 | 1.1686 | 1.0664 | 0.9638 | 0.98191 | 1.03903 |
| A21 (M33, M45) | N/A | 1.046 | 1.1862 | 1.0674 | 1.0467 | 1.0646 | 1.04983 | 1.06522 |
| A22 (M34, M46) | N/A | 0.75 | 1.0718 | 1.0630 | 0.7039 | 0.7414 | 0.75463 | 0.62340 |
| A23 (M35, M47) | N/A | 1.024 | 0.7903 | 0.5879 | 1.0280 | 1.0623 | 1.03862 | 1.00742 |
| A24 (M36, M48) | N/A | 1.252 | 1.2654 | 1.0674 | 1.2588 | 1.2694 | 1.25500 | 1.23458 |
| A25 (M49~M60) | 1.16 | 1.151 | 1.2698 | 1.2698 | 1.1475 | 1.1673 | 1.14838 | 1.13372 |
| Weight (Ib) | 308.07 | 309.58 | 315.480 | 311.876 | 308.59 | 309.894 | 309.00 | 310.587 |
| Avg. Weight (Ib) | N/A | N/A | 337.339 | 333.0190 | N/A | 310.714 | 309.74 | - |
| St. Deviation (Ib) | N/A | N/A | N/A | N/A | N/A | 0.772 | 0.411 | - |
| Con. Violation | Unknown | 2.6 × 10⁻³ | None | None | 0.10 × 10⁻³ | None | None | None |
| No. of Evaluations | N/A | N/A | 800,000 | 800,000 | N/A | 72,900 | 23,970 | 24,390 |
| Avg. Exploration | -- | -- | -- | -- | -- | -- | 10.56% | -- |
| Avg. Exploitation | -- | -- | -- | -- | -- | -- | 89.43% | -- |
Table 8.
Friedman rank test results for the 60-bar planar truss.
Table 8.
Friedman rank test results for the 60-bar planar truss.
| Category | (MFUD) [56] | (SECr) [58] | (CPM-GA) [57] | (APM-GA) [57] | (MC-FF) [55] | (ACCS) [13] | This Study |
|---|
| (MPA)Best | (MPA)Worst |
|---|
| Friedman Rank (Weight) | 1 | 4 | 7 | 6 | 2 | 5 | 3 | -- |
| Friedman Rank (Avg.) | 6 | 6 | 4 | 3 | 6 | 2 | 1 | -- |
| Friedman Rank (NFE) | 6 | 6 | 3.5 | 3.5 | 6 | 2 | 1 | -- |
| Averaged Rank | 4.333 | 5.333 | 4.8333 | 4.16667 | 4.6667 | 3 | 1.6667 | -- |
Table 9.
Structural parameters for the 120-bar spatial truss [
22,
53].
Table 9.
Structural parameters for the 120-bar spatial truss [
22,
53].
| Property | Value |
|---|
| Material Density | 0.288 Ib/in3 |
| Young’s Modulus | 30,450 ksi |
| Yield Stress | 58.0 ksi |
| Number of Area Groups | 7 |
| Maximum Nodal Displacements (x, y, z) | ±0.1969 in. |
| Range of Cross-sectional Areas | 0.775~20.0 in2 |
Table 10.
Optimized result comparison for the 120-bar spatial dome truss.
Table 10.
Optimized result comparison for the 120-bar spatial dome truss.
| Design Variable (in2) | (CBO) [59] | (HPSSO) [51] | (WEO) [12] | (CPA) [52] | (PGO) [49] | (CSA) [53] | (ECSA) [53] | (ICA) [21] | (HHO) [21] | (ICHHO) [21] | This Study |
|---|
| (MPA)Best | (MPA)Worst |
|---|
| A1 | 3.0273 | 3.024139 | 3.0243 | 3.0250 | 3.0245 | 3.0232 | 3.0241 | 3.0278 | 3.1121 | 3.0241 | 3.0242452 | 3.0252388 |
| A2 | 15.1724 | 14.78086 | 14.7943 | 14.6168 | 14.8288 | 14.6467 | 14.7998 | 14.8336 | 12.9862 | 14.8763 | 14.789522 | 14.521904 |
| A3 | 5.2342 | 5.052164 | 5.0618 | 5.0201 | 5.0714 | 4.9639 | 5.0779 | 5.3251 | 4.9064 | 5.0091 | 5.0775395 | 5.0819089 |
| A4 | 3.119 | 3.136943 | 3.1358 | 3.1404 | 3.1351 | 3.1426 | 3.1358 | 3.1231 | 3.2861 | 3.1324 | 3.1364955 | 3.1411414 |
| A5 | 8.1038 | 8.500353 | 8.4870 | 8.5653 | 8.4556 | 8.6401 | 8.4737 | 8.1941 | 9.0996 | 8.4874 | 8.4769851 | 8.5270232 |
| A6 | 3.4166 | 3.288777 | 3.2886 | 3.3648 | 3.2959 | 3.3005 | 3.2819 | 3.4141 | 3.8406 | 3.2991 | 3.2836077 | 3.4203555 |
| A7 | 2.4918 | 2.49688 | 2.4967 | 2.4975 | 2.4965 | 2.4991 | 2.4964 | 2.4914 | 2.7655 | 2.4972 | 2.4964922 | 2.4946859 |
| Weight (Ib) | 33,286.3 | 33,250.05 | 33,250.24 | 33,256.39 | 33,250.15 | 33,257.16 | 33,249.50 | 33,271.03 | 33,899.53 | 33,249.46 | 33,249.46 | 33,256.99 |
| Avg. Weight (Ib) | 33,398.5 | 33,260.700 | 33255.55 | 33,281.73 | 33,252.72 | 33,512.27 | 33,251.02 | 33,345.10 | 35,222.81 | 33,259.49 | 33,250.97 | - |
| St. Deviation (Ib) | 67.09 | 10.49 | 8.07 | 16.45 | 2.76 | 255.23 | 3.22 | 66.30 | 1039.02 | 8.29 | 1.62 | - |
| Con. Violation | None | None | None | None | None | None | None | None | None | None | None | None |
| No. of Evaluations | 14,960 | 13,422 | 19,510 | 22,980 | 17,790 | 25,019 | 13,582 | 15,000 | 15,000 | 15,000 | 12,630 | 12,630 |
| Avg. Exploration | -- | -- | -- | -- | -- | -- | -- | -- | -- | -- | 7.74% | -- |
| Avg. Exploitation | -- | -- | -- | -- | -- | -- | -- | -- | -- | -- | 92.25% | -- |
Table 11.
Friedman rank test results for the 120-bar spatial dome truss.
Table 11.
Friedman rank test results for the 120-bar spatial dome truss.
| Category | (CBO) [59] | (HPSSO) [51] | (WEO) [12] | (CPA) [52] | (PGO) [49] | (CSA) [53] | (ECSA) [53] | (ICA) [21] | (HHO) [21] | (ICHHO) [21] | This Study |
|---|
| (MPA)Best | (MPA)Worst |
|---|
| Friedman Rank (Weight) | 10 | 4 | 6 | 7 | 5 | 8 | 3 | 9 | 11 | 1.5 | 1.5 | -- |
| Friedman Rank (Avg.) | 9 | 6 | 4 | 7 | 3 | 10 | 2 | 8 | 11 | 5 | 1 | -- |
| Friedman Rank (NFE) | 4 | 2 | 9 | 10 | 8 | 11 | 3 | 6 | 6 | 6 | 1 | -- |
| Averaged Rank | 7.6667 | 4 | 6.333 | 8 | 5.333 | 9.6667 | 2.6667 | 7.6667 | 9.333 | 4.16667 | 1.16667 | -- |
Table 12.
Structural parameters for the 272-bar transmission tower [
49].
Table 12.
Structural parameters for the 272-bar transmission tower [
49].
| Property | Value |
|---|
| Material Density | N/A (assumed as 7850 kg/m3) |
| Young’s Modulus | 2 × 10⁸ kPa |
| Number of Area Groups | 28 |
| Maximum Normal Stresses | ±275,000 kPa |
| Maximum Nodal Displacements (x, y) | ±100 mm in x and y; ±20 mm (Node 1, 2, 11, 20, and 29) |
| Range of Cross-sectional Areas | 1000~16,000 mm2 |
Table 13.
Optimized result comparison for the 272-bar truss tower.
Table 13.
Optimized result comparison for the 272-bar truss tower.
| Design Variable (mm2) | (SSOA) [61] | (PGO) [49] | (GRO) [62] | This Study |
|---|
| (MPA)Best | (MPA)Worst |
|---|
| A1 | 1000.5510 | 1000.6591 | 1000.0002 | 1000.0188 | 1000.0517 |
| A2 | 1240.0130 | 1216.9322 | 1239.9505 | 1207.5918 | 1165.5132 |
| A3 | 2491.8710 | 2445.0689 | 2491.8674 | 2467.4672 | 2454.4865 |
| A4 | 1017.8290 | 1000.0000 | 1017.6729 | 1004.5014 | 1014.3719 |
| A5 | 9618.8090 | 9580.2369 | 9618.8241 | 9561.3973 | 9563.4297 |
| A6 | 1000.0000 | 1000.0184 | 1000.0000 | 1000.0000 | 1000.0386 |
| A7 | 12,063.8160 | 12,259.5226 | 12,063.8293 | 12,269.641 | 11,820.495 |
| A8 | 1001.7770 | 1001.5883 | 1001.1048 | 1000.0097 | 1001.0916 |
| A9 | 1000.1880 | 1000.2804 | 1000.0001 | 1000.5054 | 1002.8344 |
| A10 | 1000.4570 | 1000.0297 | 1000.0007 | 1000.0401 | 1000.0000 |
| A11 | 10,217.0220 | 10,615.8809 | 10,217.0688 | 10,272.846 | 10,634.671 |
| A12 | 1000.0640 | 1000.1339 | 1000.0000 | 1000.0000 | 1000.0000 |
| A13 | 1000.0150 | 1000.0249 | 1000.0001 | 1000.0000 | 1000.0223 |
| A14 | 1000.0050 | 1000.1262 | 1000.0001 | 1001.0886 | 1000.0908 |
| A15 | 9320.5490 | 9118.9367 | 9321.0719 | 9313.4094 | 9567.7133 |
| A16 | 1000.0280 | 1000.0014 | 1000.0000 | 1000.0044 | 1000.0000 |
| A17 | 1000.3070 | 1000.0000 | 1000.0042 | 1000.0006 | 1000.0630 |
| A18 | 1002.5180 | 1000.0000 | 1000.0004 | 1000.0032 | 1000.0152 |
| A19 | 8389.8090 | 8541.0887 | 8389.6996 | 8602.1100 | 8808.2140 |
| A20 | 1000.8140 | 1000.1291 | 1000.0000 | 1000.0000 | 1000.0001 |
| A21 | 1000.0040 | 1000.0000 | 1000.0000 | 1000.0023 | 1000.0626 |
| A22 | 1003.2880 | 1000.0000 | 1000.0000 | 1000.0035 | 1000.0688 |
| A23 | 7982.2590 | 7988.3355 | 7982.2199 | 8009.0987 | 7773.3430 |
| A24 | 1000.4450 | 1000.0001 | 1000.0000 | 1000.0000 | 1000.0023 |
| A25 | 1000.5910 | 1000.0000 | 1000.0000 | 1000.0308 | 1000.0000 |
| A26 | 1000.0530 | 1000.0307 | 1000.0009 | 1000.0006 | 1000.0410 |
| A27 | 7504.2980 | 7656.6655 | 7504.2977 | 7559.0113 | 7585.2953 |
| A28 | 1000.0760 | 1000.0000 | 1000.0007 | 1000.0000 | 1000.0000 |
| Volume (cm3) | 1,168,200.62 | 1,168,113.56 | 1,168,069.326 | 1,168,039.233 | 1,168,459.394 |
| Avg. Volume (cm3) | 1,168,668.720 | 1,168,793.420 | 1,168,701.004 | 1,168,209.147 | - |
| St. Deviation (cm3) | 310.76 | 771.54 | 339.2781 | 117.1291 | - |
| Con. Violation | None | None | None | None | None |
| No. of Evaluations | 14,020 | 23,920 | 23,000 | 29,670 | 29,670 |
| Avg. Exploration | -- | -- | -- | 5.68% | -- |
| Avg. Exploitation | -- | -- | -- | 93.15% | -- |
Table 14.
Friedman rank test results for the 272-bar truss tower.
Table 14.
Friedman rank test results for the 272-bar truss tower.
| Category | (SSOA) [61] | (PGO) [49] | (GRO) [62] | This Study |
|---|
| (MPA)Best | (MPA)Worst |
|---|
| Friedman Rank (Volume) | 4 | 3 | 2 | 1 | -- |
| Friedman Rank (Avg.) | 2 | 4 | 3 | 1 | -- |
| Friedman Rank (NFE) | 1 | 3 | 2 | 4 | -- |
| Averaged Rank | 2.333 | 3.333 | 2.333 | 2 | -- |
Table 15.
Structural parameters for the 942-bar spatial truss tower [
17,
63].
Table 15.
Structural parameters for the 942-bar spatial truss tower [
17,
63].
| Property | Value |
|---|
| Material Density | 0.1 Ib/in3 |
| Young’s Modulus | 10,000 ksi |
| Number of Area Groups | 59 |
| Maximum Normal Stresses | ±25 ksi |
| Maximum Nodal Displacements (x, y, z) | ±15.0 in. (4 top nodes) |
| Range of Cross-sectional Areas | 0.1~200 in2 |
Table 16.
Optimized result comparison for the 26-story, 942-bar truss tower.
Table 16.
Optimized result comparison for the 26-story, 942-bar truss tower.
| Design Variable (in2) | (SA) [67] | (ES) [66] | (GNMS) [68] | (FA) [65] | (GWO) [63] | (IGWO) [63] | (JA) [64] | (IS-JA) [64] | This Study |
|---|
| (MPA)Best | (MPA)Worst |
|---|
| A1 | 1 | 1.02 | 2.786 | N/A | 1.4245 | 4.2489 | 1 | 1 | 1.57037 | 2.1571 |
| A2 | 1 | 1.037 | 1.357 | N/A | 2.1232 | 1.7702 | 1 | 1 | 1.12206 | 1.78726 |
| A3 | 3 | 2.943 | 5.036 | N/A | 2.1749 | 1.5892 | 3 | 4 | 3.54765 | 1.61278 |
| A4 | 1 | 1.92 | 2.24 | N/A | 2.3746 | 1.5235 | 2 | 2 | 2.60205 | 2.11236 |
| A5 | 1 | 1.025 | 1.223 | N/A | 1.0000 | 1.0265 | 1 | 1 | 1.21885 | 1.43314 |
| A6 | 17 | 14.961 | 14.958 | N/A | 17.5705 | 15.3979 | 16 | 15 | 13.6201 | 14.6095 |
| A7 | 3 | 3.074 | 2.957 | N/A | 3.3655 | 2.8825 | 3 | 3 | 4.02917 | 2.75545 |
| A8 | 7 | 6.78 | 10.904 | N/A | 19.1722 | 6.9912 | 8 | 6 | 1.21197 | 3.16720 |
| A9 | 20 | 18.58 | 14.418 | N/A | 12.8837 | 11.2039 | 7 | 6 | 4.05446 | 8.59093 |
| A10 | 1 | 2.415 | 3.709 | N/A | 2.6161 | 2.7262 | 17 | 28 | 10.5447 | 10.5975 |
| A11 | 8 | 6.584 | 5.708 | N/A | 3.9268 | 8.1921 | 1 | 5 | 1.20188 | 1.44824 |
| A12 | 7 | 6.291 | 4.926 | N/A | 4.7984 | 6.2178 | 6 | 7 | 5.56403 | 5.87840 |
| A13 | 19 | 15.383 | 14.175 | N/A | 12.4939 | 16.5585 | 16 | 16 | 12.8569 | 13.1467 |
| A14 | 2 | 2.1 | 1.904 | N/A | 1.0000 | 2.3668 | 2 | 2 | 2.68949 | 2.96611 |
| A15 | 5 | 6.021 | 2.81 | N/A | 1.6022 | 4.1519 | 5 | 5 | 4.30342 | 4.43618 |
| A16 | 1 | 1.022 | 1 | N/A | 1.0000 | 1.2370 | 1 | 1 | 2.60398 | 1.99889 |
| A17 | 22 | 23.099 | 18.807 | N/A | 16.8974 | 22.3006 | 22 | 22 | 22.0078 | 20.4121 |
| A18 | 3 | 2.889 | 2.615 | N/A | 2.5670 | 2.9996 | 3 | 3 | 3.03439 | 3.11877 |
| A19 | 9 | 7.96 | 12.533 | N/A | 6.3981 | 7.7559 | 9 | 9 | 6.91035 | 11.5399 |
| A20 | 1 | 1.008 | 1.131 | N/A | 1.1522 | 1.1283 | 1 | 1 | 1.01338 | 1.82290 |
| A21 | 34 | 28.548 | 30.512 | N/A | 29.0131 | 28.2646 | 28 | 29 | 28.9839 | 28.5157 |
| A22 | 3 | 3.349 | 3.346 | N/A | 3.5656 | 3.1924 | 4 | 5 | 3.22886 | 3.11393 |
| A23 | 19 | 16.144 | 17.045 | N/A | 17.4563 | 16.3965 | 15 | 18 | 15.3133 | 17.4940 |
| A24 | 27 | 24.822 | 18.079 | N/A | 21.3364 | 22.6095 | 29 | 26 | 21.6239 | 20.8702 |
| A25 | 42 | 38.401 | 39.272 | N/A | 19.0983 | 40.0759 | 40 | 40 | 32.6892 | 27.2972 |
| A26 | 1 | 3.787 | 2.606 | N/A | 11.6687 | 5.3549 | 3 | 3 | 8.29315 | 8.81768 |
| A27 | 12 | 12.32 | 9.83 | N/A | 7.2854 | 9.2695 | 11 | 13 | 8.17984 | 8.60813 |
| A28 | 16 | 17.036 | 13.113 | N/A | 13.2728 | 15.0911 | 16 | 15 | 13.0383 | 11.4355 |
| A29 | 19 | 14.733 | 13.69 | N/A | 10.9616 | 14.0704 | 15 | 16 | 14.1649 | 16.3599 |
| A30 | 14 | 15.031 | 16.978 | N/A | 16.9994 | 15.1962 | 18 | 17 | 16.6373 | 17.8619 |
| A31 | 42 | 38.597 | 37.601 | N/A | 51.2551 | 37.1490 | 36 | 38 | 35.1591 | 33.5007 |
| A32 | 4 | 3.511 | 3.06 | N/A | 3.5553 | 3.1643 | 4 | 3 | 3.68495 | 3.28520 |
| A33 | 4 | 2.997 | 5.511 | N/A | 10.7749 | 3.4414 | 2 | 4 | 4.13725 | 2.32115 |
| A34 | 4 | 3.06 | 1.801 | N/A | 2.2552 | 2.2813 | 3 | 3 | 3.37235 | 2.83088 |
| A35 | 1 | 1.086 | 1.157 | N/A | 2.8847 | 1.0166 | 1 | 1 | 1.11879 | 1.67923 |
| A36 | 1 | 1.462 | 1.242 | N/A | 1.4999 | 1.4089 | 1 | 1 | 1.00314 | 1.06030 |
| A37 | 62 | 59.433 | 62.774 | N/A | 74.8387 | 59.6649 | 55 | 62 | 55.7636 | 52.5650 |
| A38 | 3 | 3.632 | 3.328 | N/A | 4.4502 | 3.3173 | 3 | 3 | 3.29766 | 3.28016 |
| A39 | 2 | 1.887 | 4.237 | N/A | 4.5565 | 2.0249 | 2 | 2 | 1.97339 | 1.74477 |
| A40 | 4 | 4.072 | 1.72 | N/A | 1.6472 | 2.3953 | 3 | 3 | 3.15345 | 3.35289 |
| A41 | 1 | 1.595 | 1.015 | N/A | 1.6962 | 1.0554 | 1 | 1 | 1.29984 | 2.45128 |
| A42 | 2 | 3.671 | 5.643 | N/A | 1.0000 | 1.2294 | 3 | 8 | 1.15024 | 1.86427 |
| A43 | 77 | 79.511 | 78.009 | N/A | 72.9916 | 79.5798 | 79 | 69 | 74.6142 | 72.6401 |
| A44 | 3 | 3.394 | 3.221 | N/A | 3.3433 | 3.2875 | 3 | 5 | 3.12527 | 3.36496 |
| A45 | 2 | 1.581 | 3.593 | N/A | 1.9913 | 1.9028 | 2 | 1 | 1.84162 | 1.52823 |
| A46 | 3 | 4.204 | 4.767 | N/A | 2.3226 | 3.2460 | 3 | 5 | 3.51918 | 3.20781 |
| A47 | 2 | 1.329 | 1.153 | N/A | 1.1452 | 1.0277 | 1 | 1 | 1.85418 | 2.33929 |
| A48 | 3 | 2.242 | 2.17 | N/A | 1.0000 | 1.0898 | 1 | 1 | 2.84824 | 2.36750 |
| A49 | 100 | 96.886 | 99.641 | N/A | 96.6037 | 93.8836 | 100 | 76 | 85.7870 | 85.9449 |
| A50 | 4 | 3.71 | 4.147 | N/A | 4.0309 | 3.0634 | 3 | 3 | 3.27166 | 3.85777 |
| A51 | 1 | 1.055 | 2.16 | N/A | 1.8735 | 1.7246 | 1 | 7 | 1.37781 | 3.54393 |
| A52 | 4 | 4.566 | 4.15 | N/A | 4.7339 | 3.9313 | 4 | 5 | 3.94006 | 3.99825 |
| A53 | 6 | 9.606 | 11.207 | N/A | 10.6370 | 8.1063 | 11 | 18 | 8.68285 | 14.3438 |
| A54 | 3 | 2.984 | 11.09 | N/A | 3.4612 | 9.8391 | 3 | 16 | 9.78548 | 5.11418 |
| A55 | 49 | 45.917 | 35.95 | N/A | 44.5447 | 42.7529 | 42 | 57 | 43.2339 | 44.0755 |
| A56 | 1 | 1 | 2.194 | N/A | 1.2428 | 1.1219 | 1 | 1 | 1.34639 | 1.03085 |
| A57 | 62 | 62.426 | 66.171 | N/A | 76.1124 | 63.0179 | 68 | 51 | 57.5432 | 53.3872 |
| A58 | 1 | 2.977 | 3.34 | N/A | 11.4119 | 2.6542 | 5 | 7 | 5.47976 | 1.36417 |
| A59 | 3 | 1 | 4.053 | N/A | 4.7082 | 1.6685 | 1 | 4 | 1.75849 | 9.18944 |
| Weight (Ib) | 143,436 | 141,241 | 142,296 | 138,878 | 147,841.7416 | 136,311.1322 | 139,028.798 | 138,688.913 | 135,364.167 | 137,370.837 |
| Avg. Weight (Ib) | N/A | N/A | N/A | 139,682 | 165,168.9424 | 137,453.6697 | 182,562.693 | 142,903.207 | 136,198.032 | - |
| St. Deviation (Ib) | N/A | N/A | N/A | 1098 | 5392.7272 | 673.8566 | 42,037.068 | 3171.403 | 538.65 | - |
| Con. Violation | None | None | None | N/A | None | None | None | None | None | None |
| No. of Evaluations | 39,834 | 150,000 | N/A | 50,000 | 28,000 | 28,000 | 55,700 | 53,420 | 38,880 | 38,880 |
| Avg. Exploration | -- | -- | -- | -- | -- | -- | -- | -- | 6.808% | -- |
| Avg. Exploitation | -- | -- | -- | -- | -- | -- | -- | -- | 93.19% | -- |
Table 17.
Friedman rank test results for the 26-story, 942-bar truss tower.
Table 17.
Friedman rank test results for the 26-story, 942-bar truss tower.
| Category | (SA) [67] | (ES) [66] | (GNMS) [68] | (FA) [65] | (GWO) [63] | (IGWO) [63] | (JA) [64] | (IS-JA) [64] | This Study |
|---|
| (MPA)Best | (MPA)Worst |
|---|
| Friedman Rank (Volume) | 8 | 6 | 7 | 4 | 9 | 2 | 5 | 3 | 1 | -- |
| Friedman Rank (Avg.) | 8 | 8 | 8 | 3 | 5 | 2 | 6 | 4 | 1 | -- |
| Friedman Rank (NFE) | 4 | 8 | 9 | 5 | 1.5 | 1.5 | 7 | 6 | 3 | -- |
| Averaged Rank | 6.6667 | 7.333 | 8 | 4 | 5.16667 | 1.8333 | 6 | 4.333 | 1.6667 | -- |
Table 18.
Optimized result comparison for the 4666-bar large-scale truss structure.
Table 18.
Optimized result comparison for the 4666-bar large-scale truss structure.
| Result | (SAND) [69] | (TLBO) [70] | (iPSO) [70] | (ISA) [70] | (IFSA) [70] | This Study |
|---|
| (MPA)Best | (MPA)Worst |
|---|
| Volume (in3) | 21,387,963 | 26,008,542 | 25,917,009 | 25,310,333 | 21,378,918 | 15,544,283 | 19,874,604 |
| Avg. Volume (in3) | N/A | 26,113,952 | 26,439,196 | 25,922,724 | 21,496,622 | 17,285,800 | -- |
| St. Deviation (in3) | N/A | 38,279 | 536,852 | 112,587 | 37,001 | 1,128,612 | -- |
| Con. Violation | None | None | None | None | None | None | None |
| No. of Evaluations | N/A | 26,290 | 24,185 | 20,585 | 16,230 | 43,290 | 43,830 |
| Avg. Exploration | -- | -- | -- | -- | -- | 6.73% | -- |
| Avg. Exploitation | -- | -- | -- | -- | -- | 93.26% | -- |
Table 19.
Friedman rank test results for the 4666-bar large-scale truss structure.
Table 19.
Friedman rank test results for the 4666-bar large-scale truss structure.
| Category | (SAND) [69] | (TLBO) [70] | (iPSO) [70] | (ISA) [70] | (IFSA) [70] | This Study |
|---|
| (MPA)Best | (MPA)Worst |
|---|
| Friedman Rank (Volume) | 3 | 6 | 5 | 4 | 2 | 1 | -- |
| Friedman Rank (Avg.) | 6 | 4 | 5 | 3 | 2 | 1 | -- |
| Friedman Rank (NFE) | 6 | 4 | 3 | 2 | 1 | 5 | -- |
| Averaged Rank | 5 | 4.6667 | 4.333 | 3 | 1.6667 | 2.333 | -- |
Table 20.
Optimal member area values for the 62-story, 4666-bar truss tower (in2).
Table 20.
Optimal member area values for the 62-story, 4666-bar truss tower (in2).
| No. | Area | No. | Area | No. | Area | No. | Area | No. | Area | No. | Area | No. | Area |
|---|
| 1 | 20.116 | 35 | 4.0431 | 69 | 4.6718 | 103 | 31.611 | 137 | 69.883 | 171 | 6.3133 | 205 | 10.028 |
| 2 | 1.1044 | 36 | 2.5941 | 70 | 37.776 | 104 | 92.135 | 138 | 3.5365 | 172 | 16.933 | 206 | 1.4531 |
| 3 | 38.866 | 37 | 45.979 | 71 | 164.90 | 105 | 3.5218 | 139 | 3.3469 | 173 | 4.6768 | 207 | 23.367 |
| 4 | 140.56 | 38 | 187.59 | 72 | 13.761 | 106 | 9.1029 | 140 | 1.9430 | 174 | 21.105 | 208 | 1.3975 |
| 5 | 3.9739 | 39 | 14.837 | 73 | 4.1036 | 107 | 2.5971 | 141 | 24.326 | 175 | 1.8693 | 209 | 2.9333 |
| 6 | 150.30 | 40 | 17.633 | 74 | 1.1231 | 108 | 37.163 | 142 | 2.2586 | 176 | 3.2983 | 210 | 7.4084 |
| 7 | 3.8956 | 41 | 4.3084 | 75 | 58.021 | 109 | 11.487 | 143 | 3.0357 | 177 | 4.2365 | 211 | 1.0309 |
| 8 | 30.660 | 42 | 53.899 | 76 | 4.9744 | 110 | 13.662 | 144 | 5.1336 | 178 | 5.8717 | 212 | 14.039 |
| 9 | 23.570 | 43 | 2.4716 | 77 | 7.6378 | 111 | 17.818 | 145 | 1.2681 | 179 | 7.2094 | 213 | 8.6079 |
| 10 | 77.925 | 44 | 4.2946 | 78 | 2.2080 | 112 | 1.3829 | 146 | 1.8152 | 180 | 12.048 | 214 | 3.9626 |
| 11 | 20.792 | 45 | 1.1999 | 79 | 38.300 | 113 | 2.7507 | 147 | 4.4062 | 181 | 22.809 | 215 | 9.5471 |
| 12 | 106.82 | 46 | 17.418 | 80 | 2.9000 | 114 | 14.723 | 148 | 48.337 | 182 | 1.5512 | 216 | 1.1346 |
| 13 | 16.210 | 47 | 20.569 | 81 | 52.340 | 115 | 82.270 | 149 | 3.5121 | 183 | 16.340 | 217 | 1.0745 |
| 14 | 1.7330 | 48 | 33.796 | 82 | 130.54 | 116 | 12.746 | 150 | 8.4996 | 184 | 5.1433 | 218 | 1.8914 |
| 15 | 177.18 | 49 | 194.11 | 83 | 16.638 | 117 | 1.9196 | 151 | 11.821 | 185 | 38.897 | 219 | 8.5074 |
| 16 | 166.84 | 50 | 4.3325 | 84 | 27.689 | 118 | 1.1833 | 152 | 7.6146 | 186 | 1.0967 | 220 | 4.7592 |
| 17 | 20.859 | 51 | 8.5119 | 85 | 1.3209 | 119 | 27.909 | 153 | 3.8642 | 187 | 11.433 | 221 | 1.0713 |
| 18 | 1.5684 | 52 | 1.0001 | 86 | 7.6958 | 120 | 1.0118 | 154 | 2.3644 | 188 | 1.1006 | 222 | 6.2481 |
| 19 | 14.149 | 53 | 25.585 | 87 | 10.040 | 121 | 1.1175 | 155 | 1.3693 | 189 | 2.9465 | 223 | 16.682 |
| 20 | 28.801 | 54 | 1.0897 | 88 | 10.579 | 122 | 3.0358 | 156 | 3.4809 | 190 | 1.0002 | 224 | 25.669 |
| 21 | 1.5801 | 55 | 11.126 | 89 | 34.231 | 123 | 3.3329 | 157 | 4.9570 | 191 | 11.338 | 225 | 16.837 |
| 22 | 42.627 | 56 | 29.010 | 90 | 3.4340 | 124 | 14.835 | 158 | 8.8991 | 192 | 23.480 | 226 | 2.9196 |
| 23 | 1.9921 | 57 | 7.9625 | 91 | 20.351 | 125 | 25.896 | 159 | 72.112 | 193 | 13.680 | 227 | 5.4858 |
| 24 | 1.0028 | 58 | 11.438 | 92 | 71.286 | 126 | 90.783 | 160 | 13.667 | 194 | 2.7432 | 228 | 1.7650 |
| 25 | 3.1229 | 59 | 5.7067 | 93 | 102.65 | 127 | 2.1534 | 161 | 6.6525 | 195 | 30.816 | 229 | 7.9808 |
| 26 | 134.74 | 60 | 178.61 | 94 | 2.6283 | 128 | 7.2467 | 162 | 1.0295 | 196 | 15.207 | 230 | 6.1468 |
| 27 | 183.90 | 61 | 13.874 | 95 | 18.130 | 129 | 11.357 | 163 | 16.426 | 197 | 17.854 | 231 | 3.4042 |
| 28 | 5.1044 | 62 | 3.0329 | 96 | 1.3578 | 130 | 65.825 | 164 | 3.4988 | 198 | 22.070 | 232 | 2.7263 |
| 29 | 11.801 | 63 | 19.366 | 97 | 9.9382 | 131 | 3.6184 | 165 | 25.416 | 199 | 3.0214 | 233 | 1.2352 |
| 30 | 4.5574 | 64 | 20.707 | 98 | 1.1636 | 132 | 6.8587 | 166 | 1.1646 | 200 | 1.1445 | 234 | 7.9640 |
| 31 | 44.651 | 65 | 8.8305 | 99 | 5.2479 | 133 | 2.9426 | 167 | 6.5469 | 201 | 19.085 | 235 | 7.0577 |
| 32 | 1.5231 | 66 | 16.572 | 100 | 1.7846 | 134 | 2.8983 | 168 | 15.840 | 202 | 37.360 | 236 | 2.5718 |
| 33 | 10.636 | 67 | 3.8128 | 101 | 5.0023 | 135 | 3.6839 | 169 | 4.1320 | 203 | 27.566 | 237 | 6.0137 |
| 34 | 1.2642 | 68 | 2.8722 | 102 | 7.6903 | 136 | 15.625 | 170 | 68.855 | 204 | 1.1956 | 238 | 34.052 |
| Disclaimer/Publisher’s Note: The statements, opinions and data contained in all publications are solely those of the individual author(s) and contributor(s) and not of MDPI and/or the editor(s). MDPI and/or the editor(s) disclaim responsibility for any injury to people or property resulting from any ideas, methods, instructions or products referred to in the content. |
© 2023 by the authors. Licensee MDPI, Basel, Switzerland. This article is an open access article distributed under the terms and conditions of the Creative Commons Attribution (CC BY) license (https://creativecommons.org/licenses/by/4.0/).


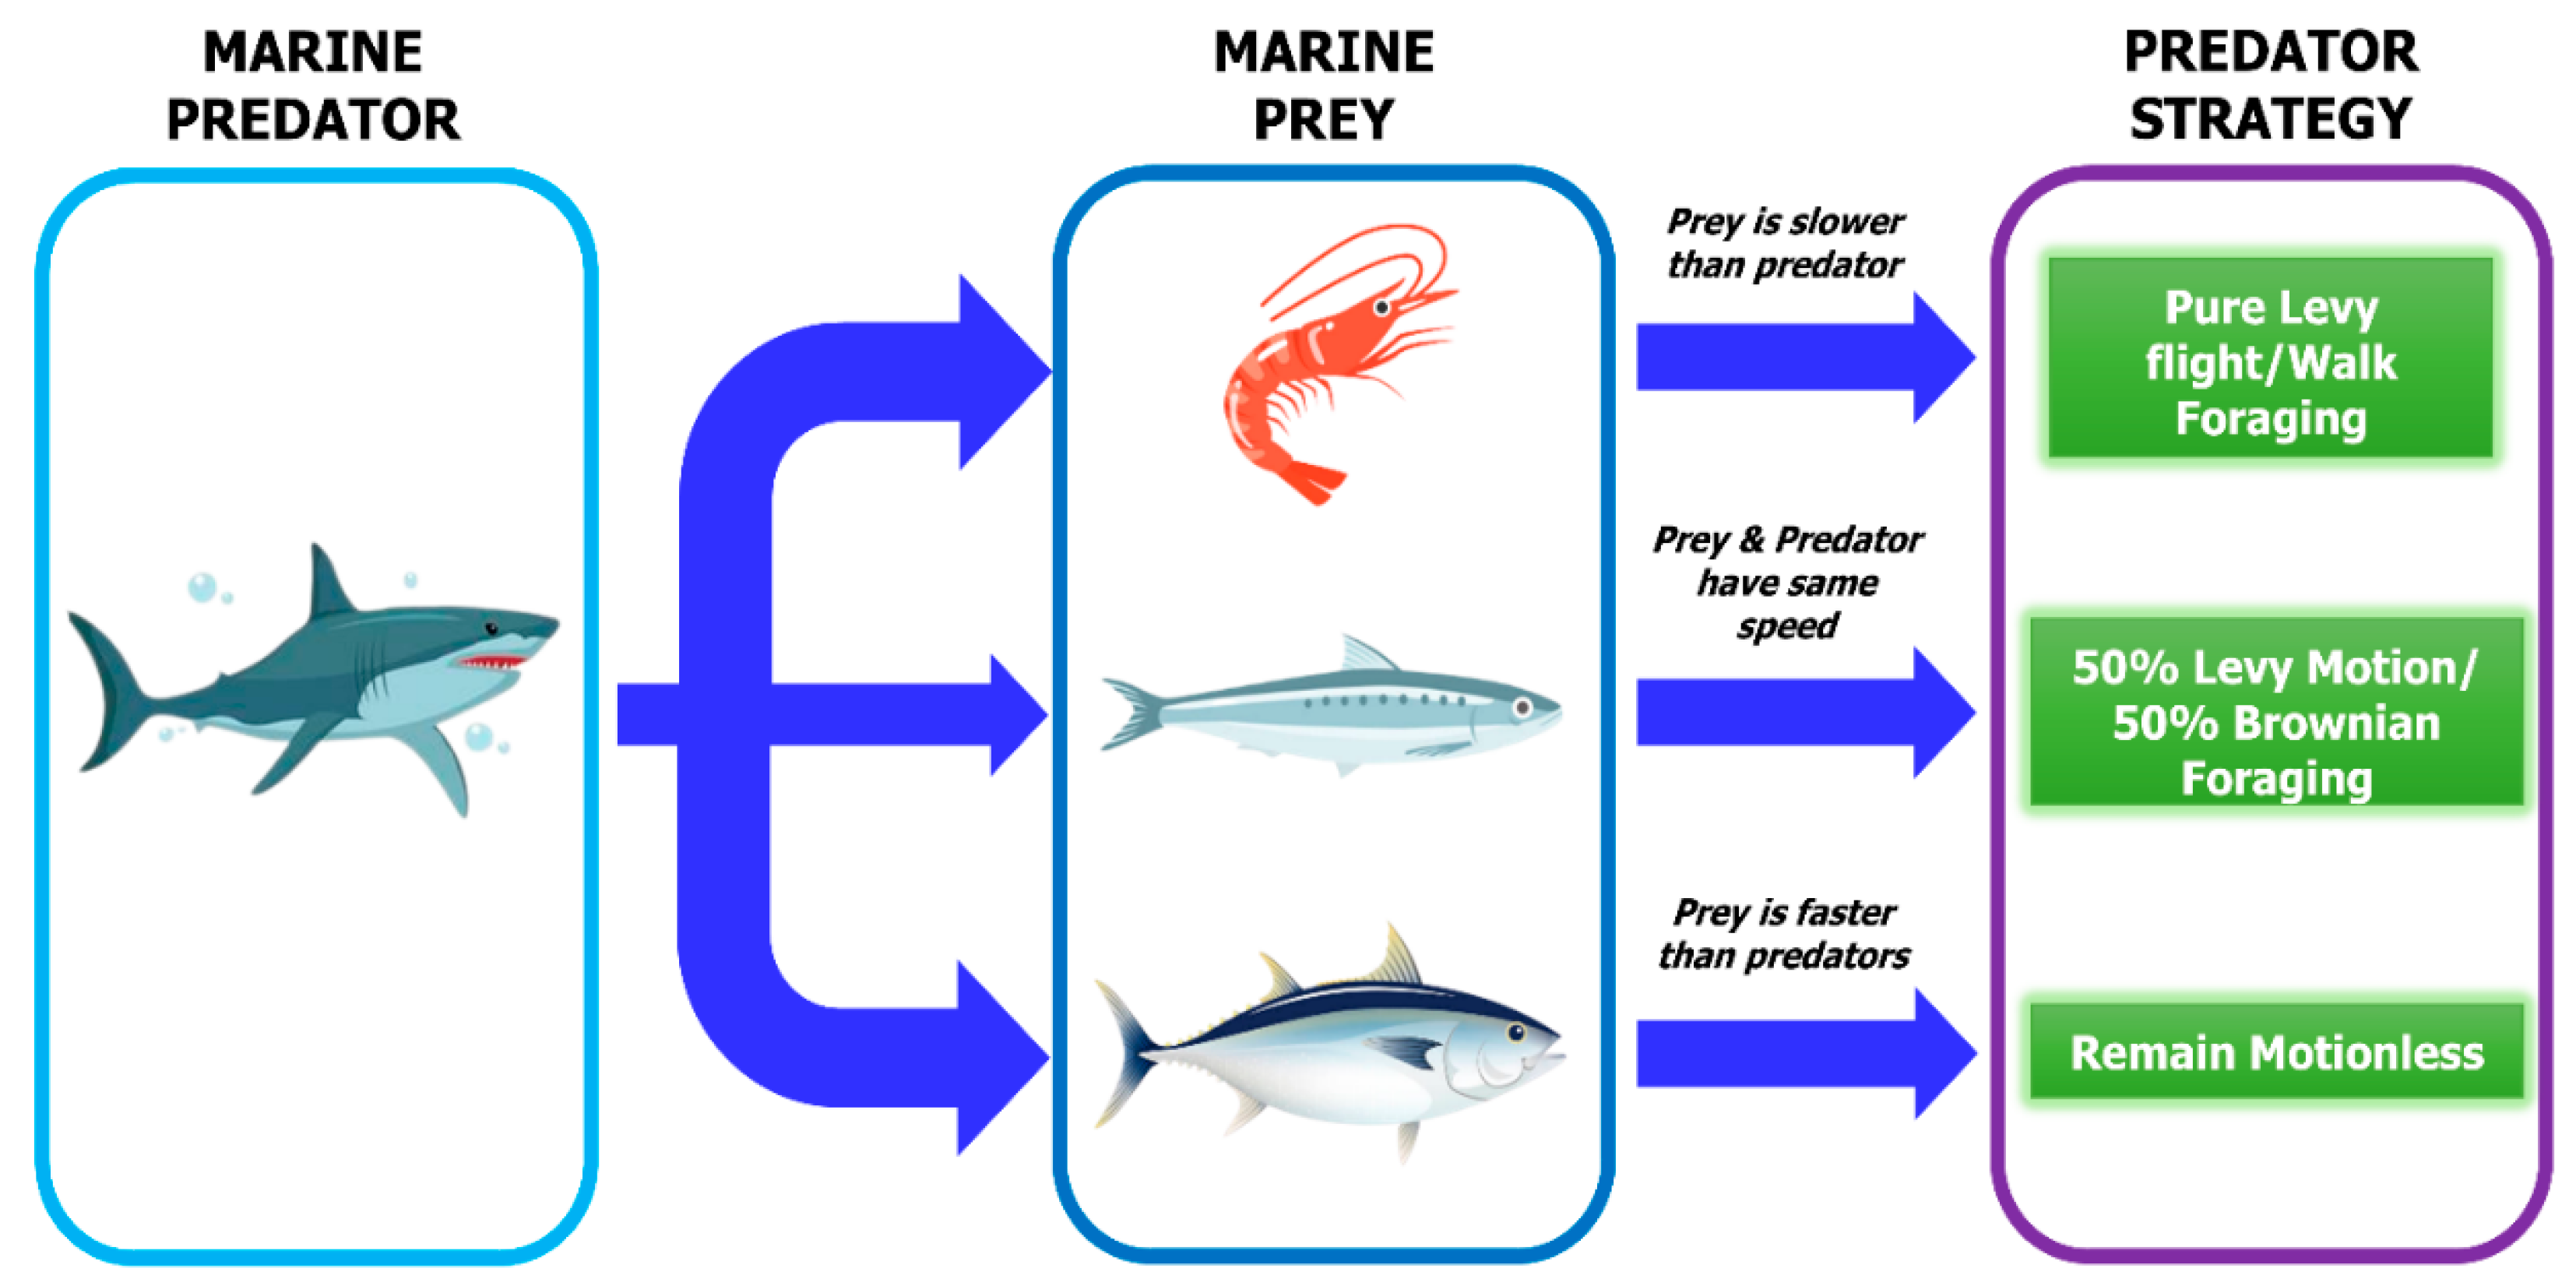
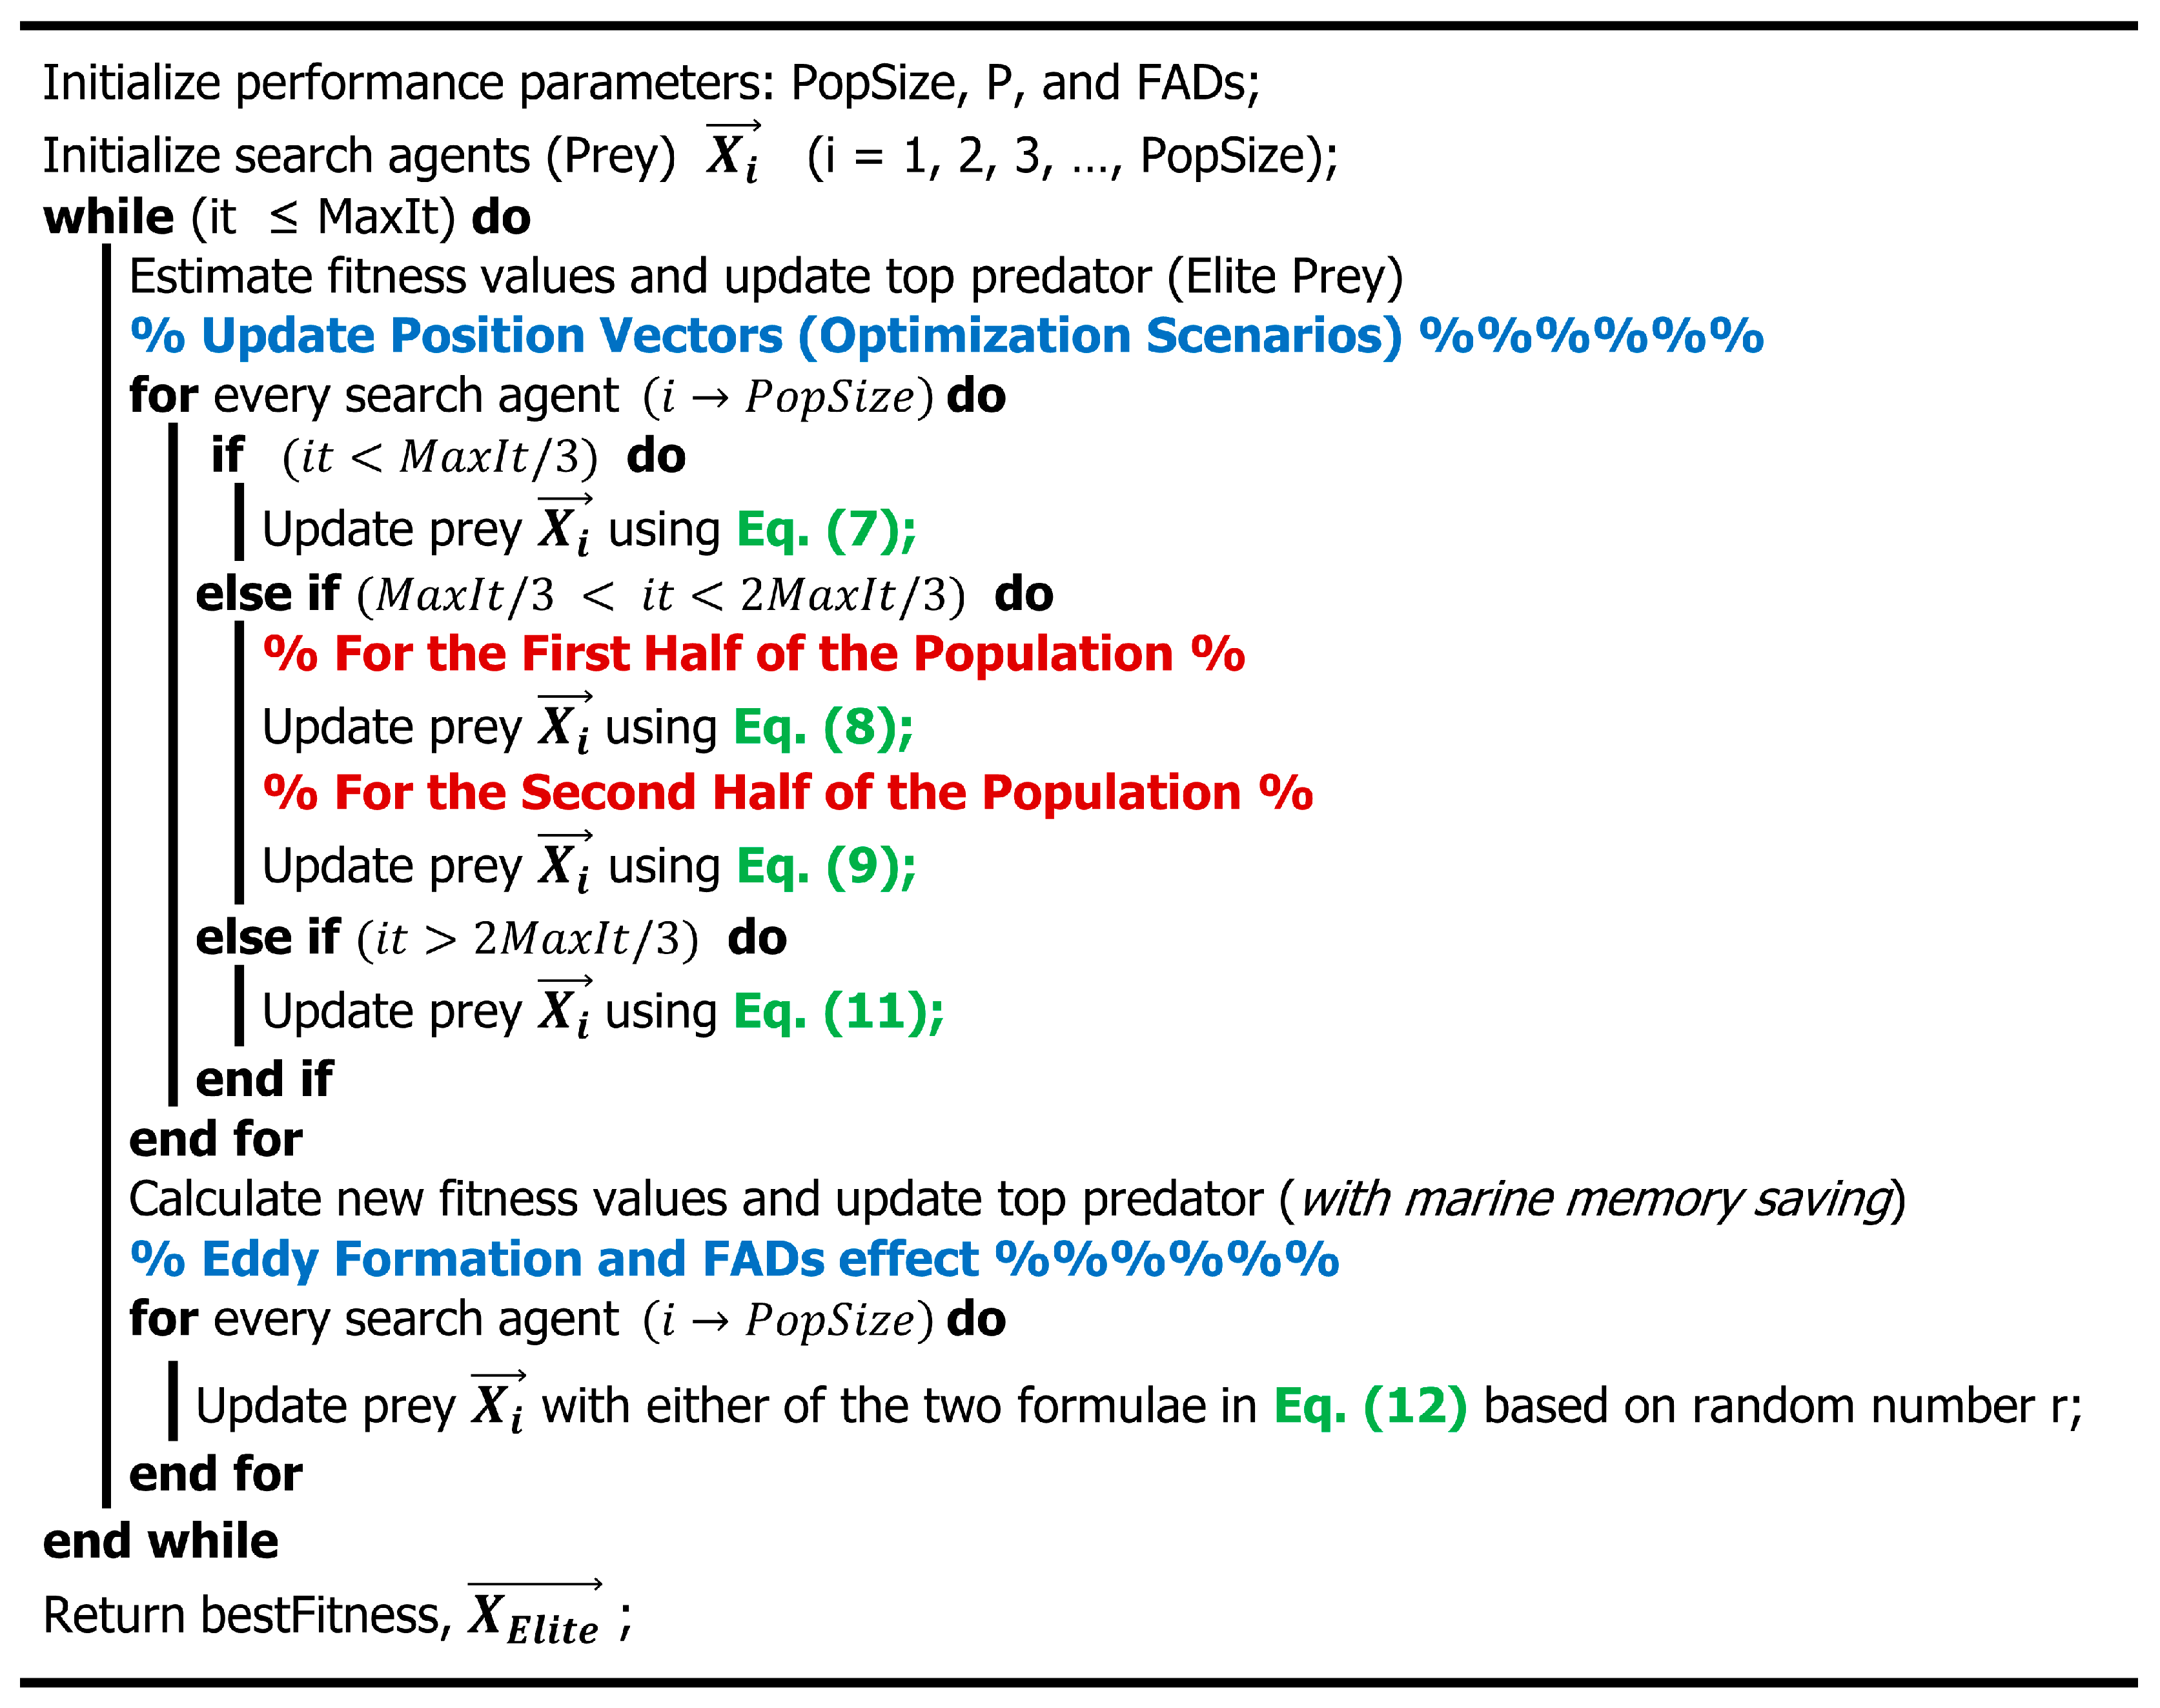
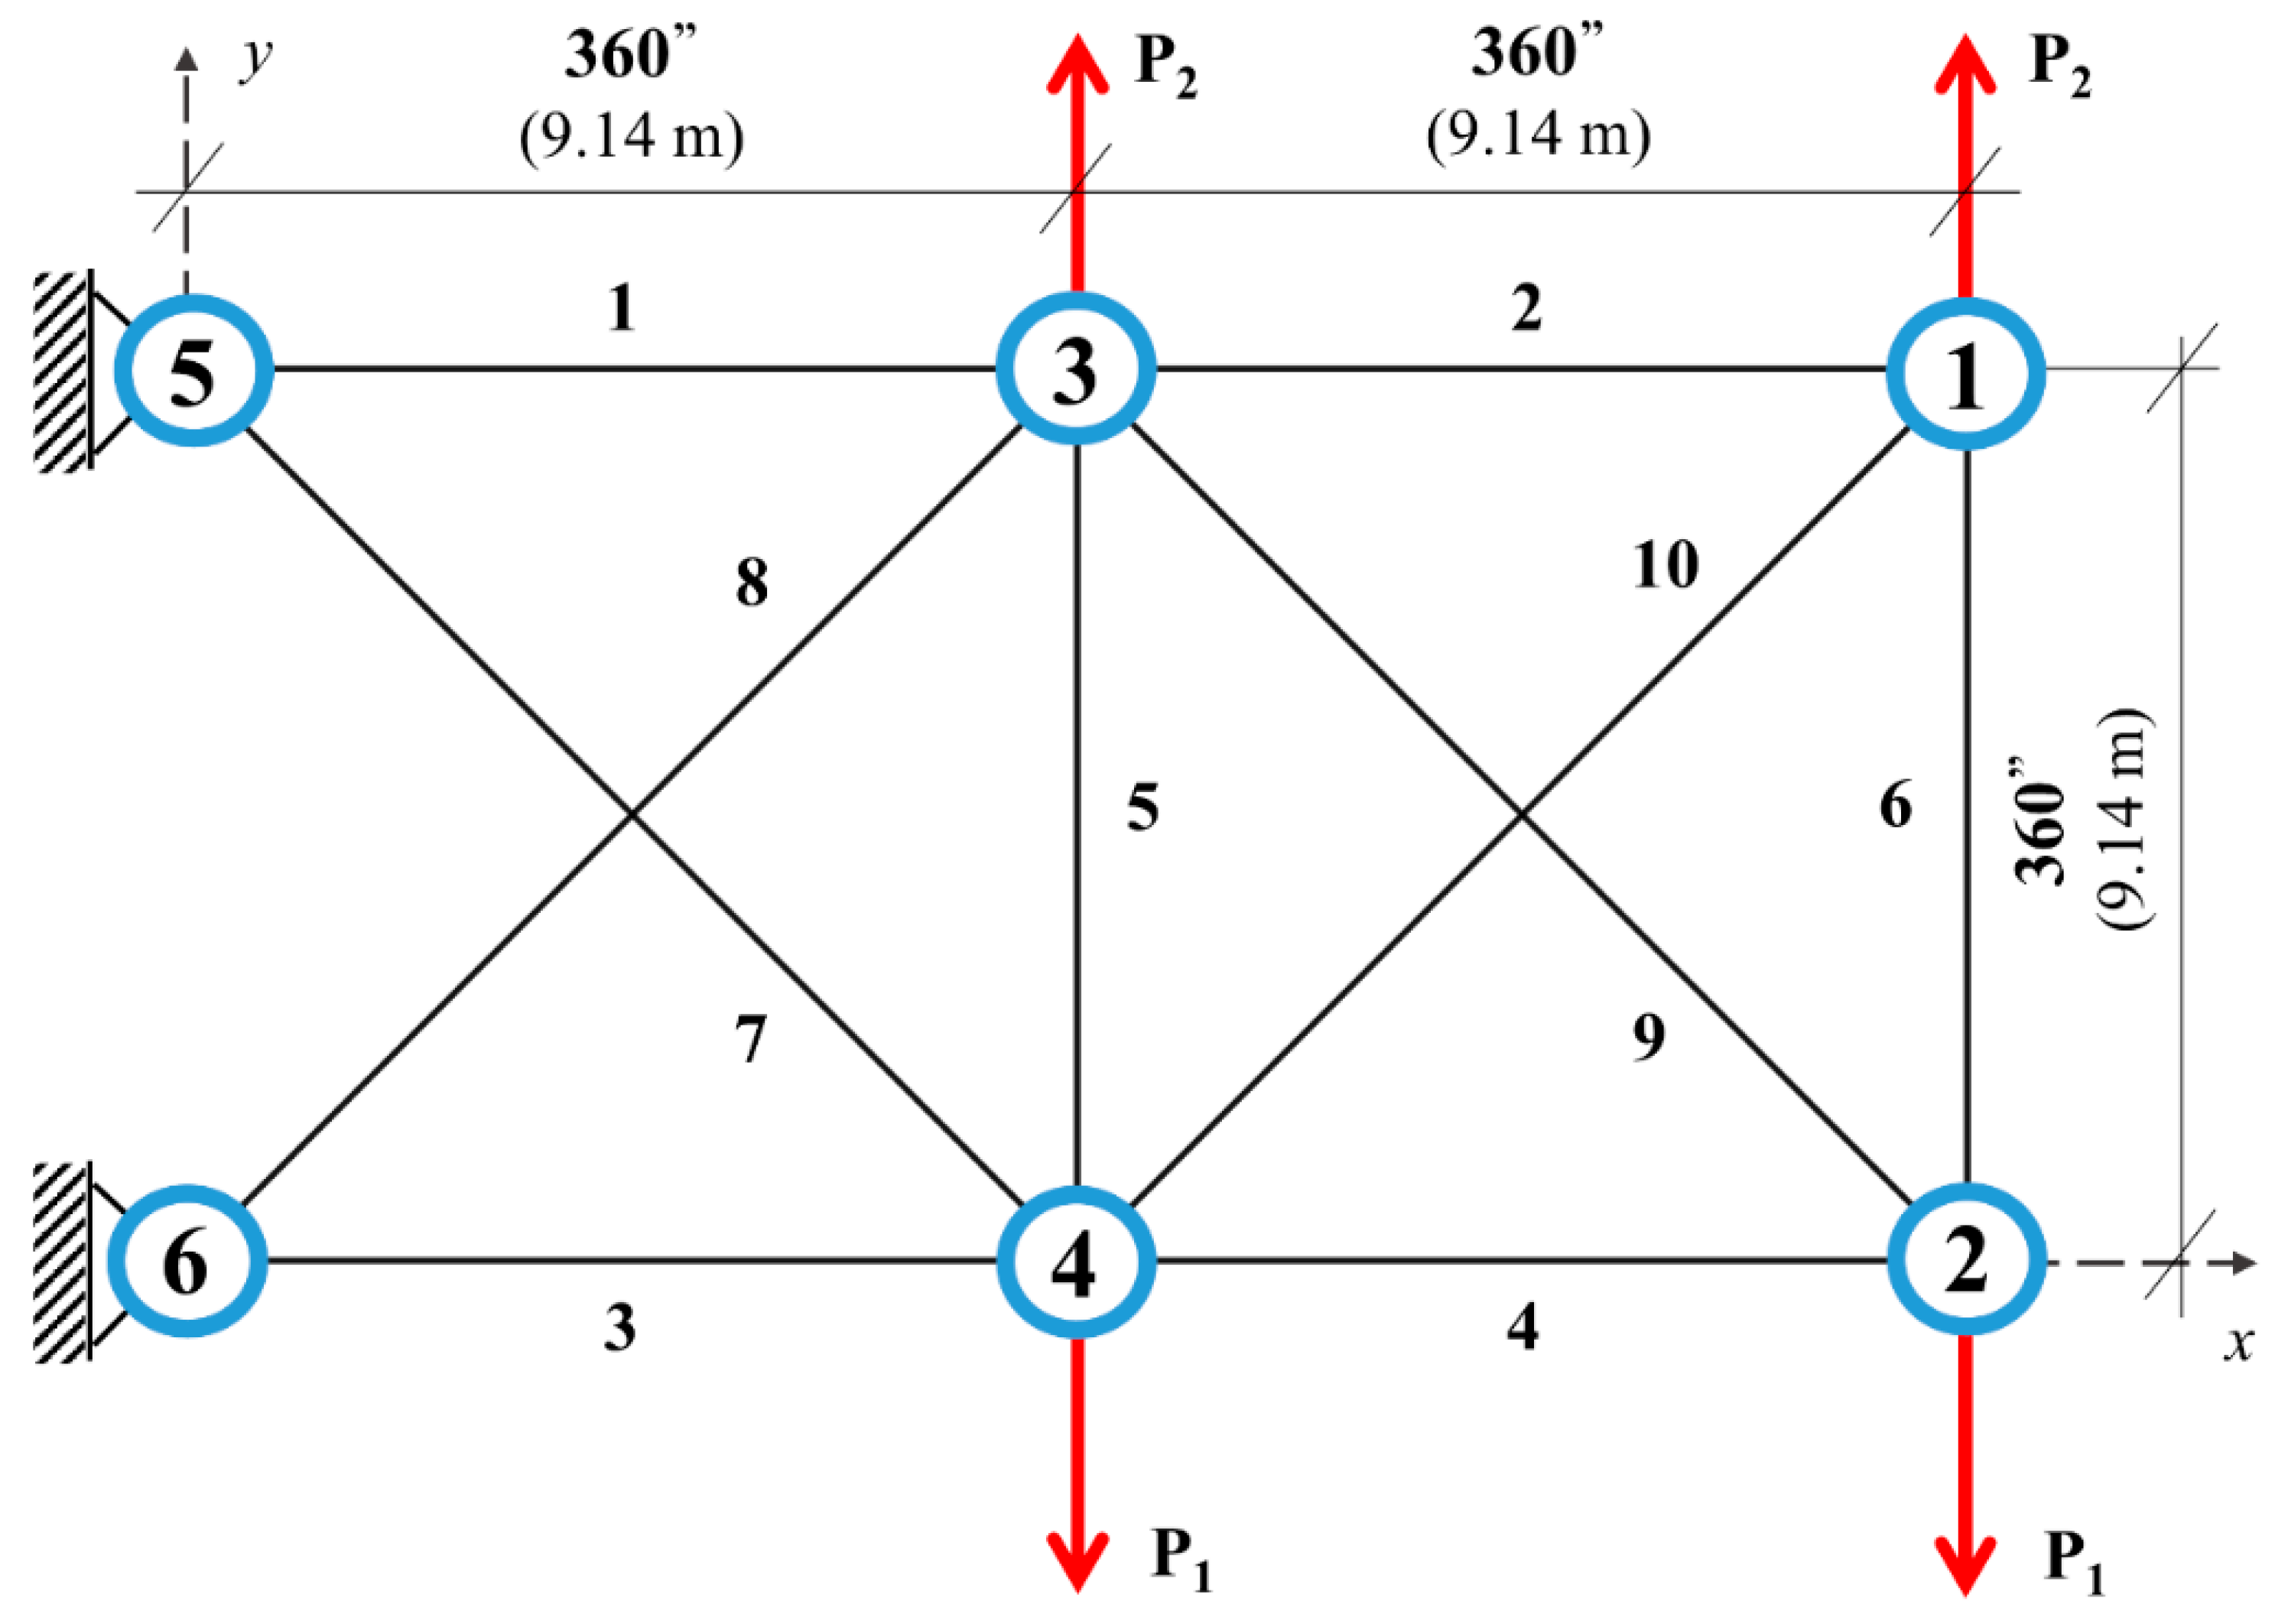
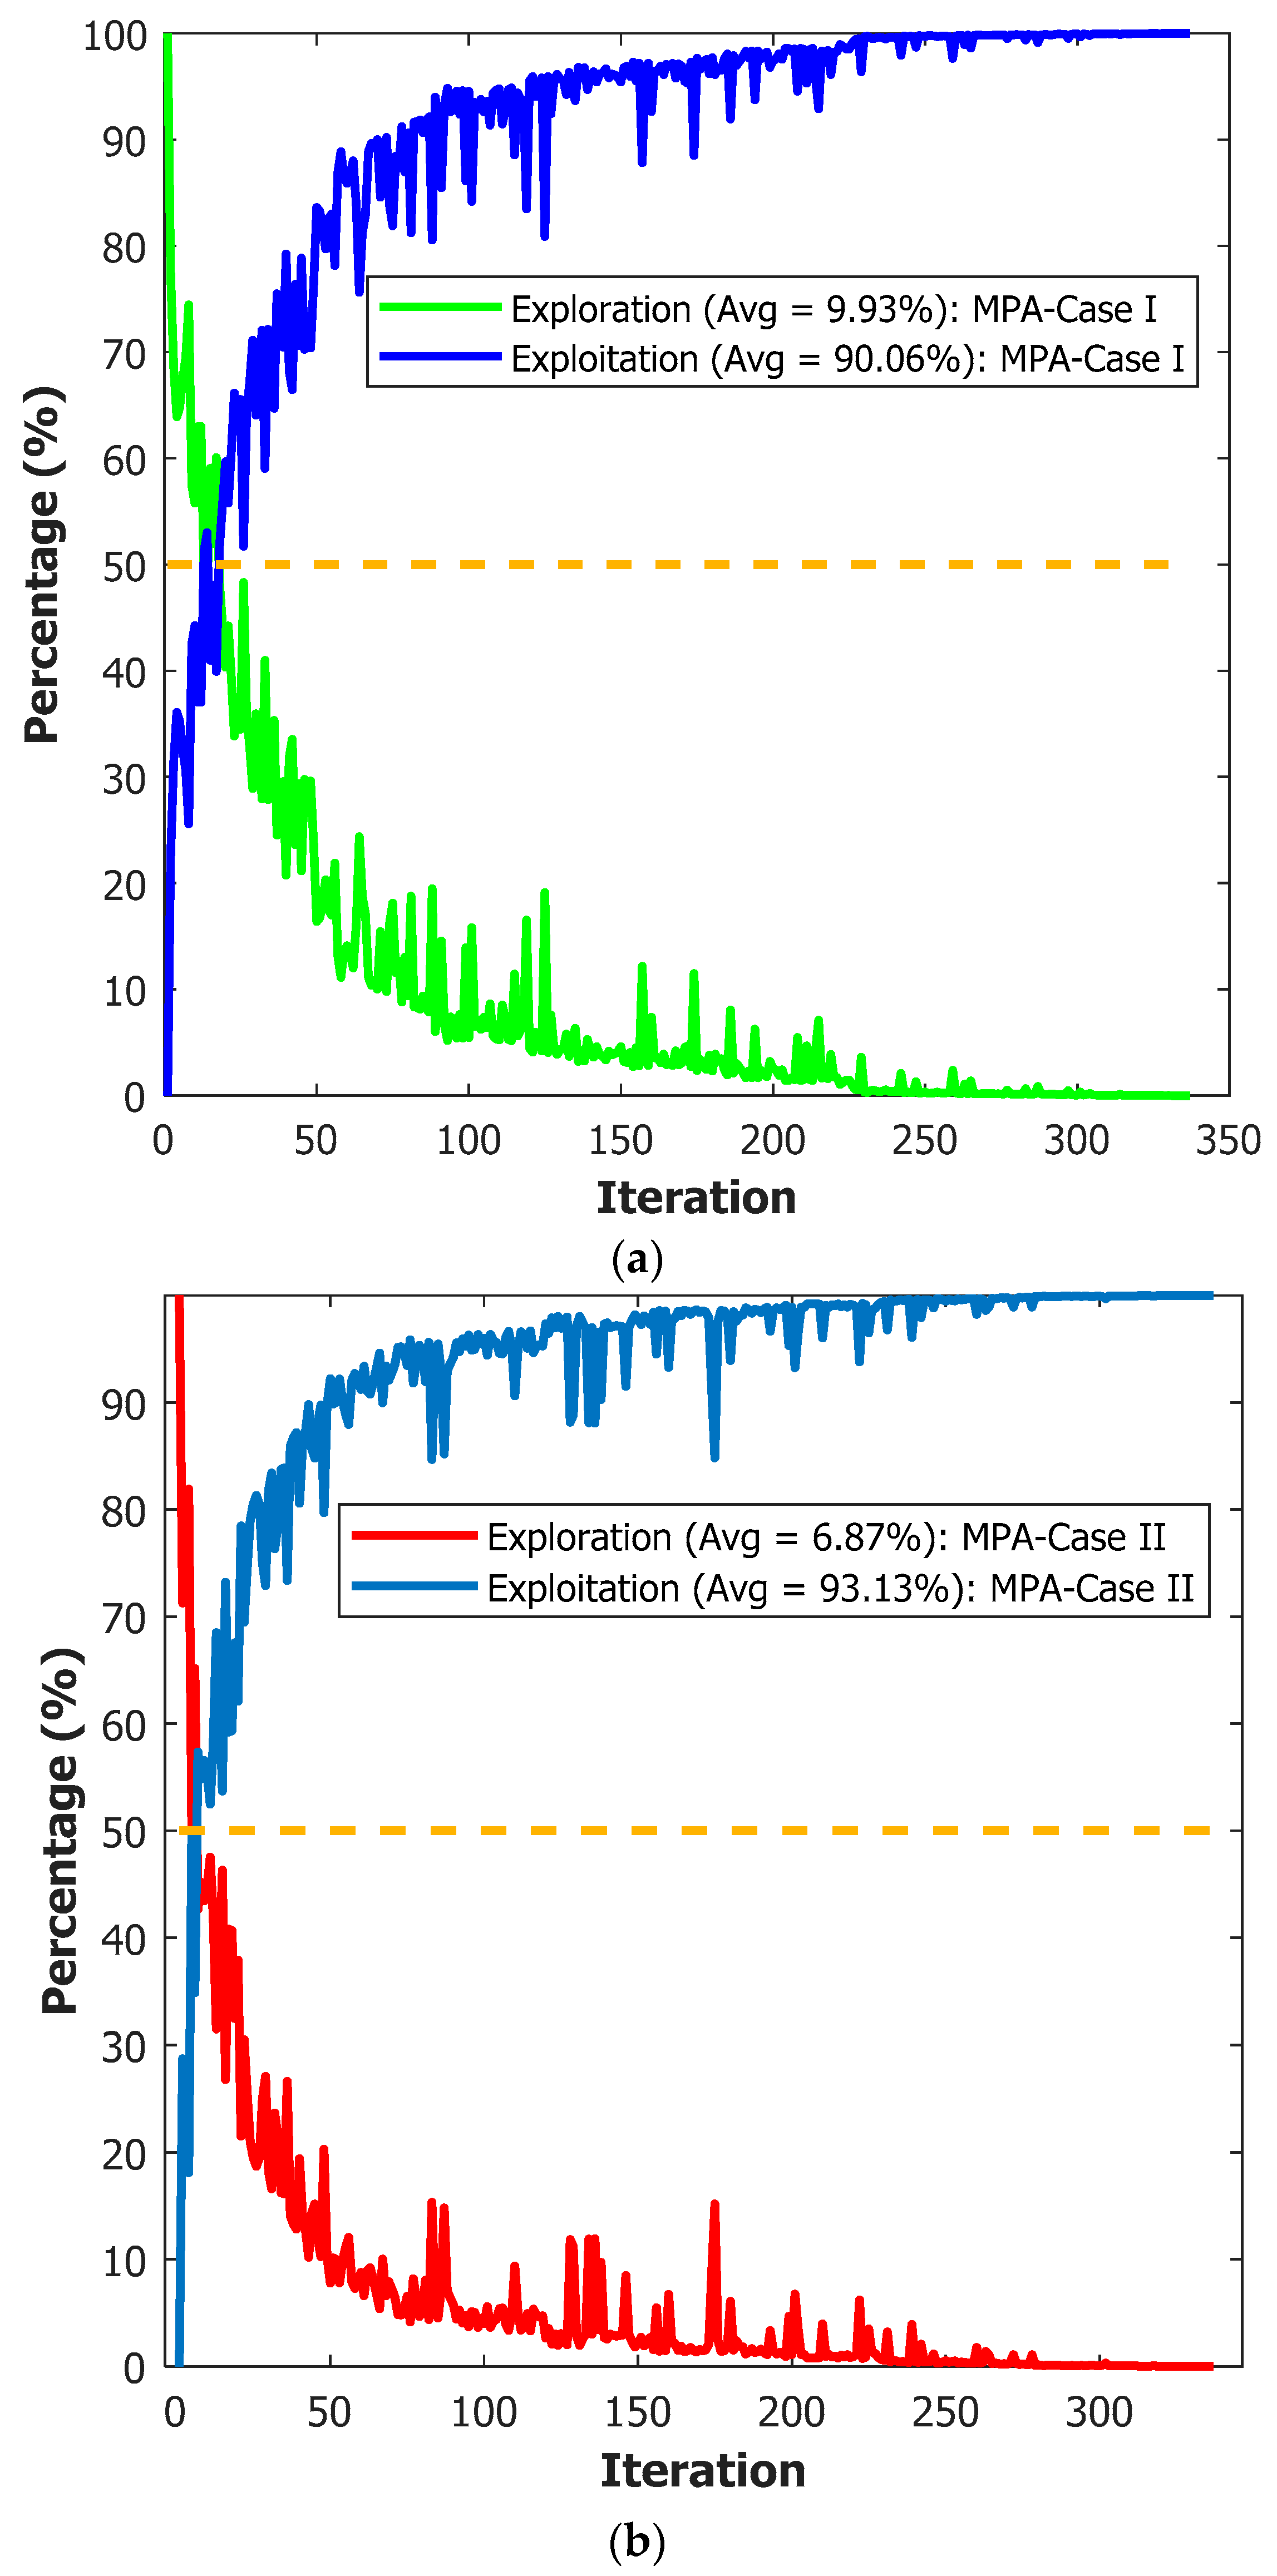
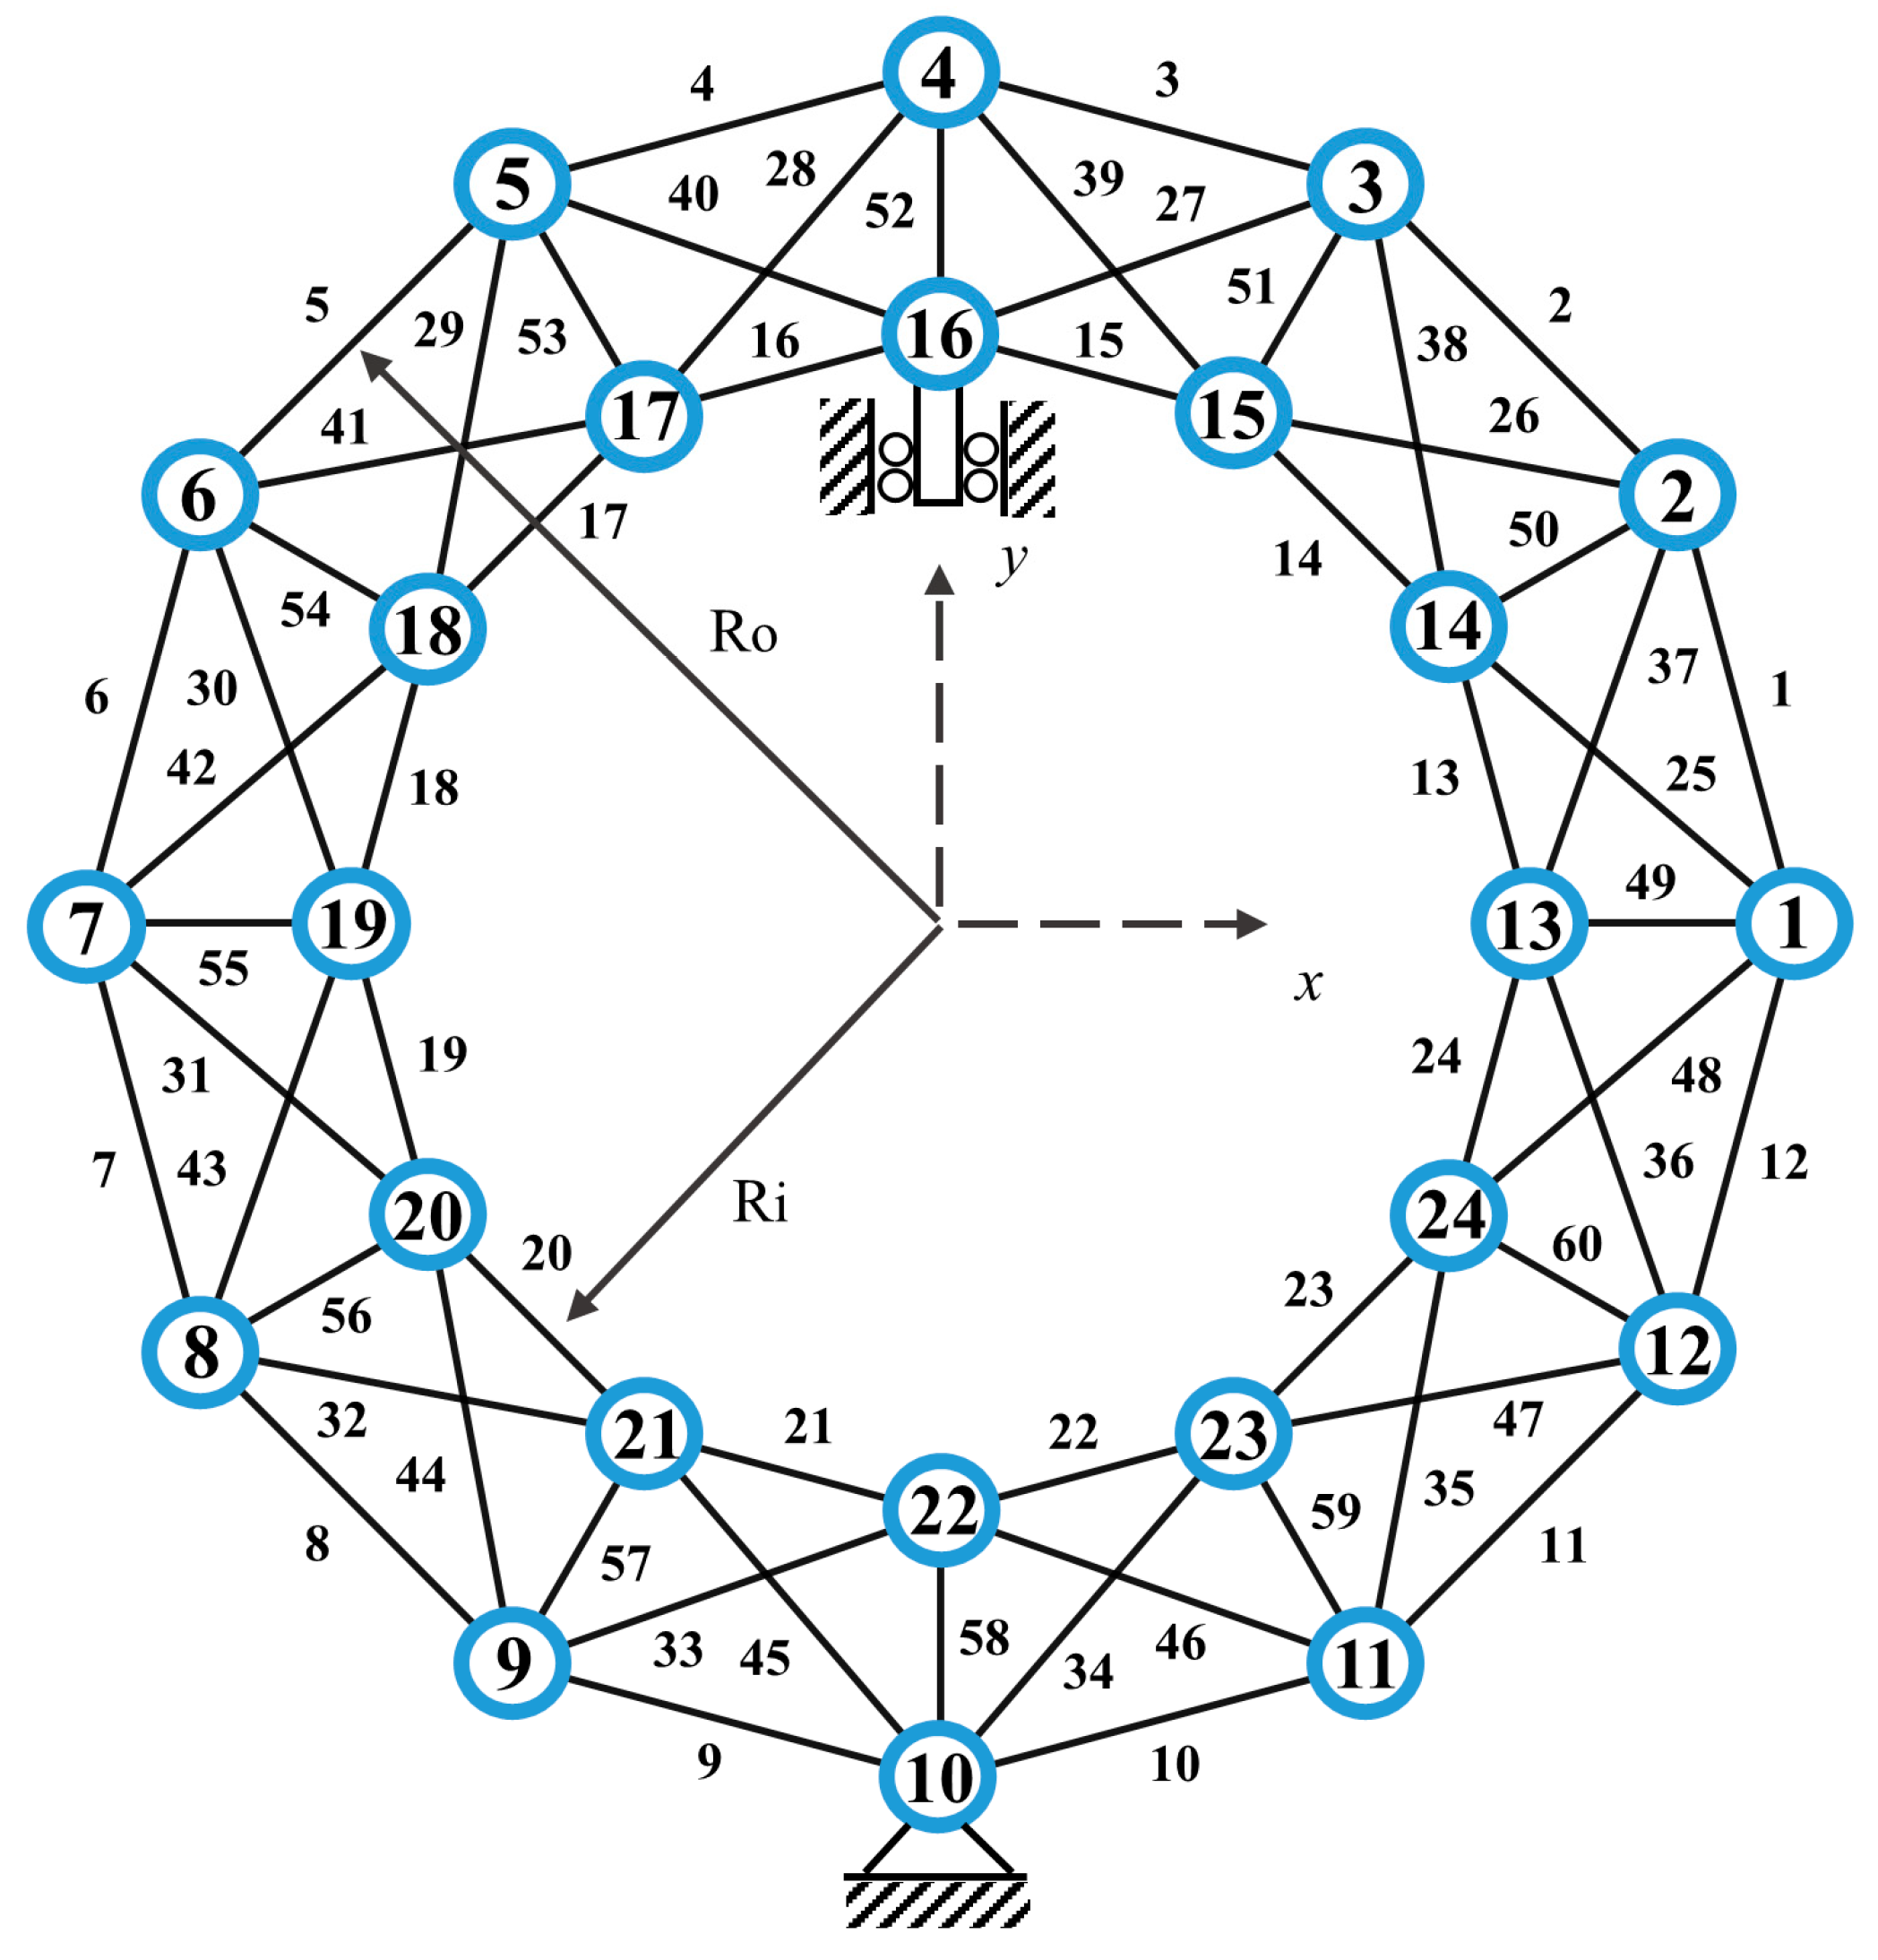
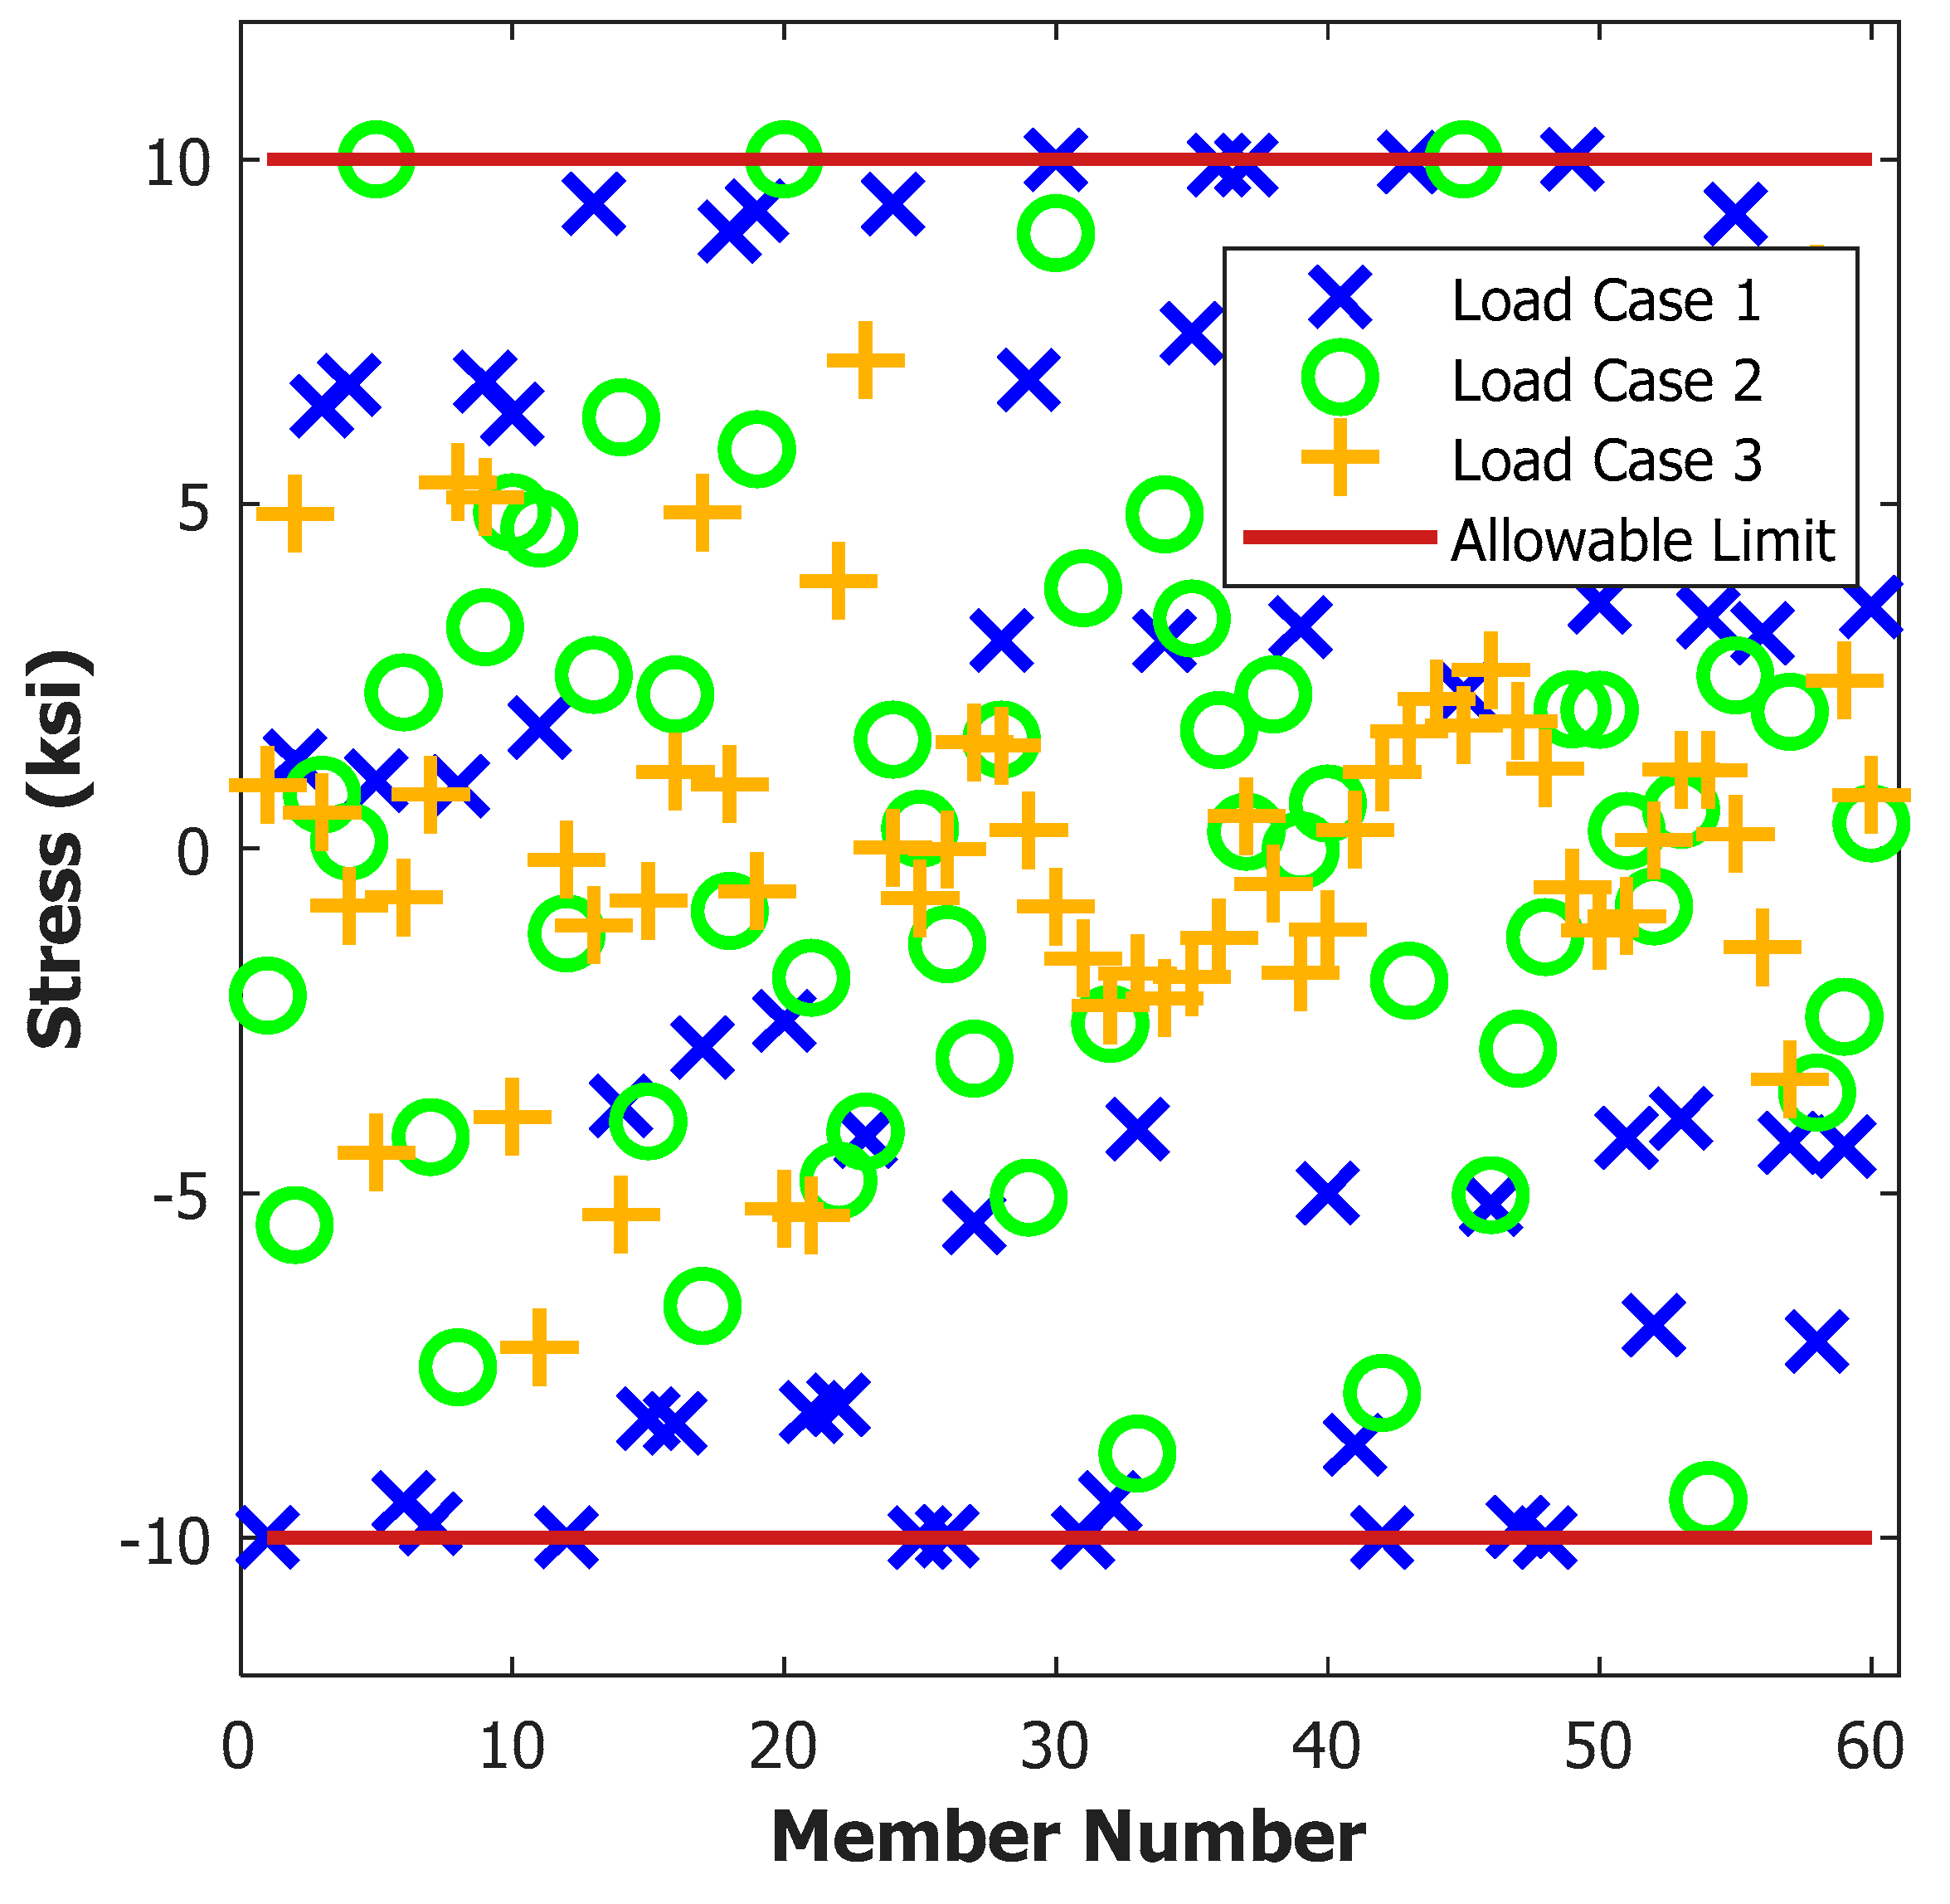
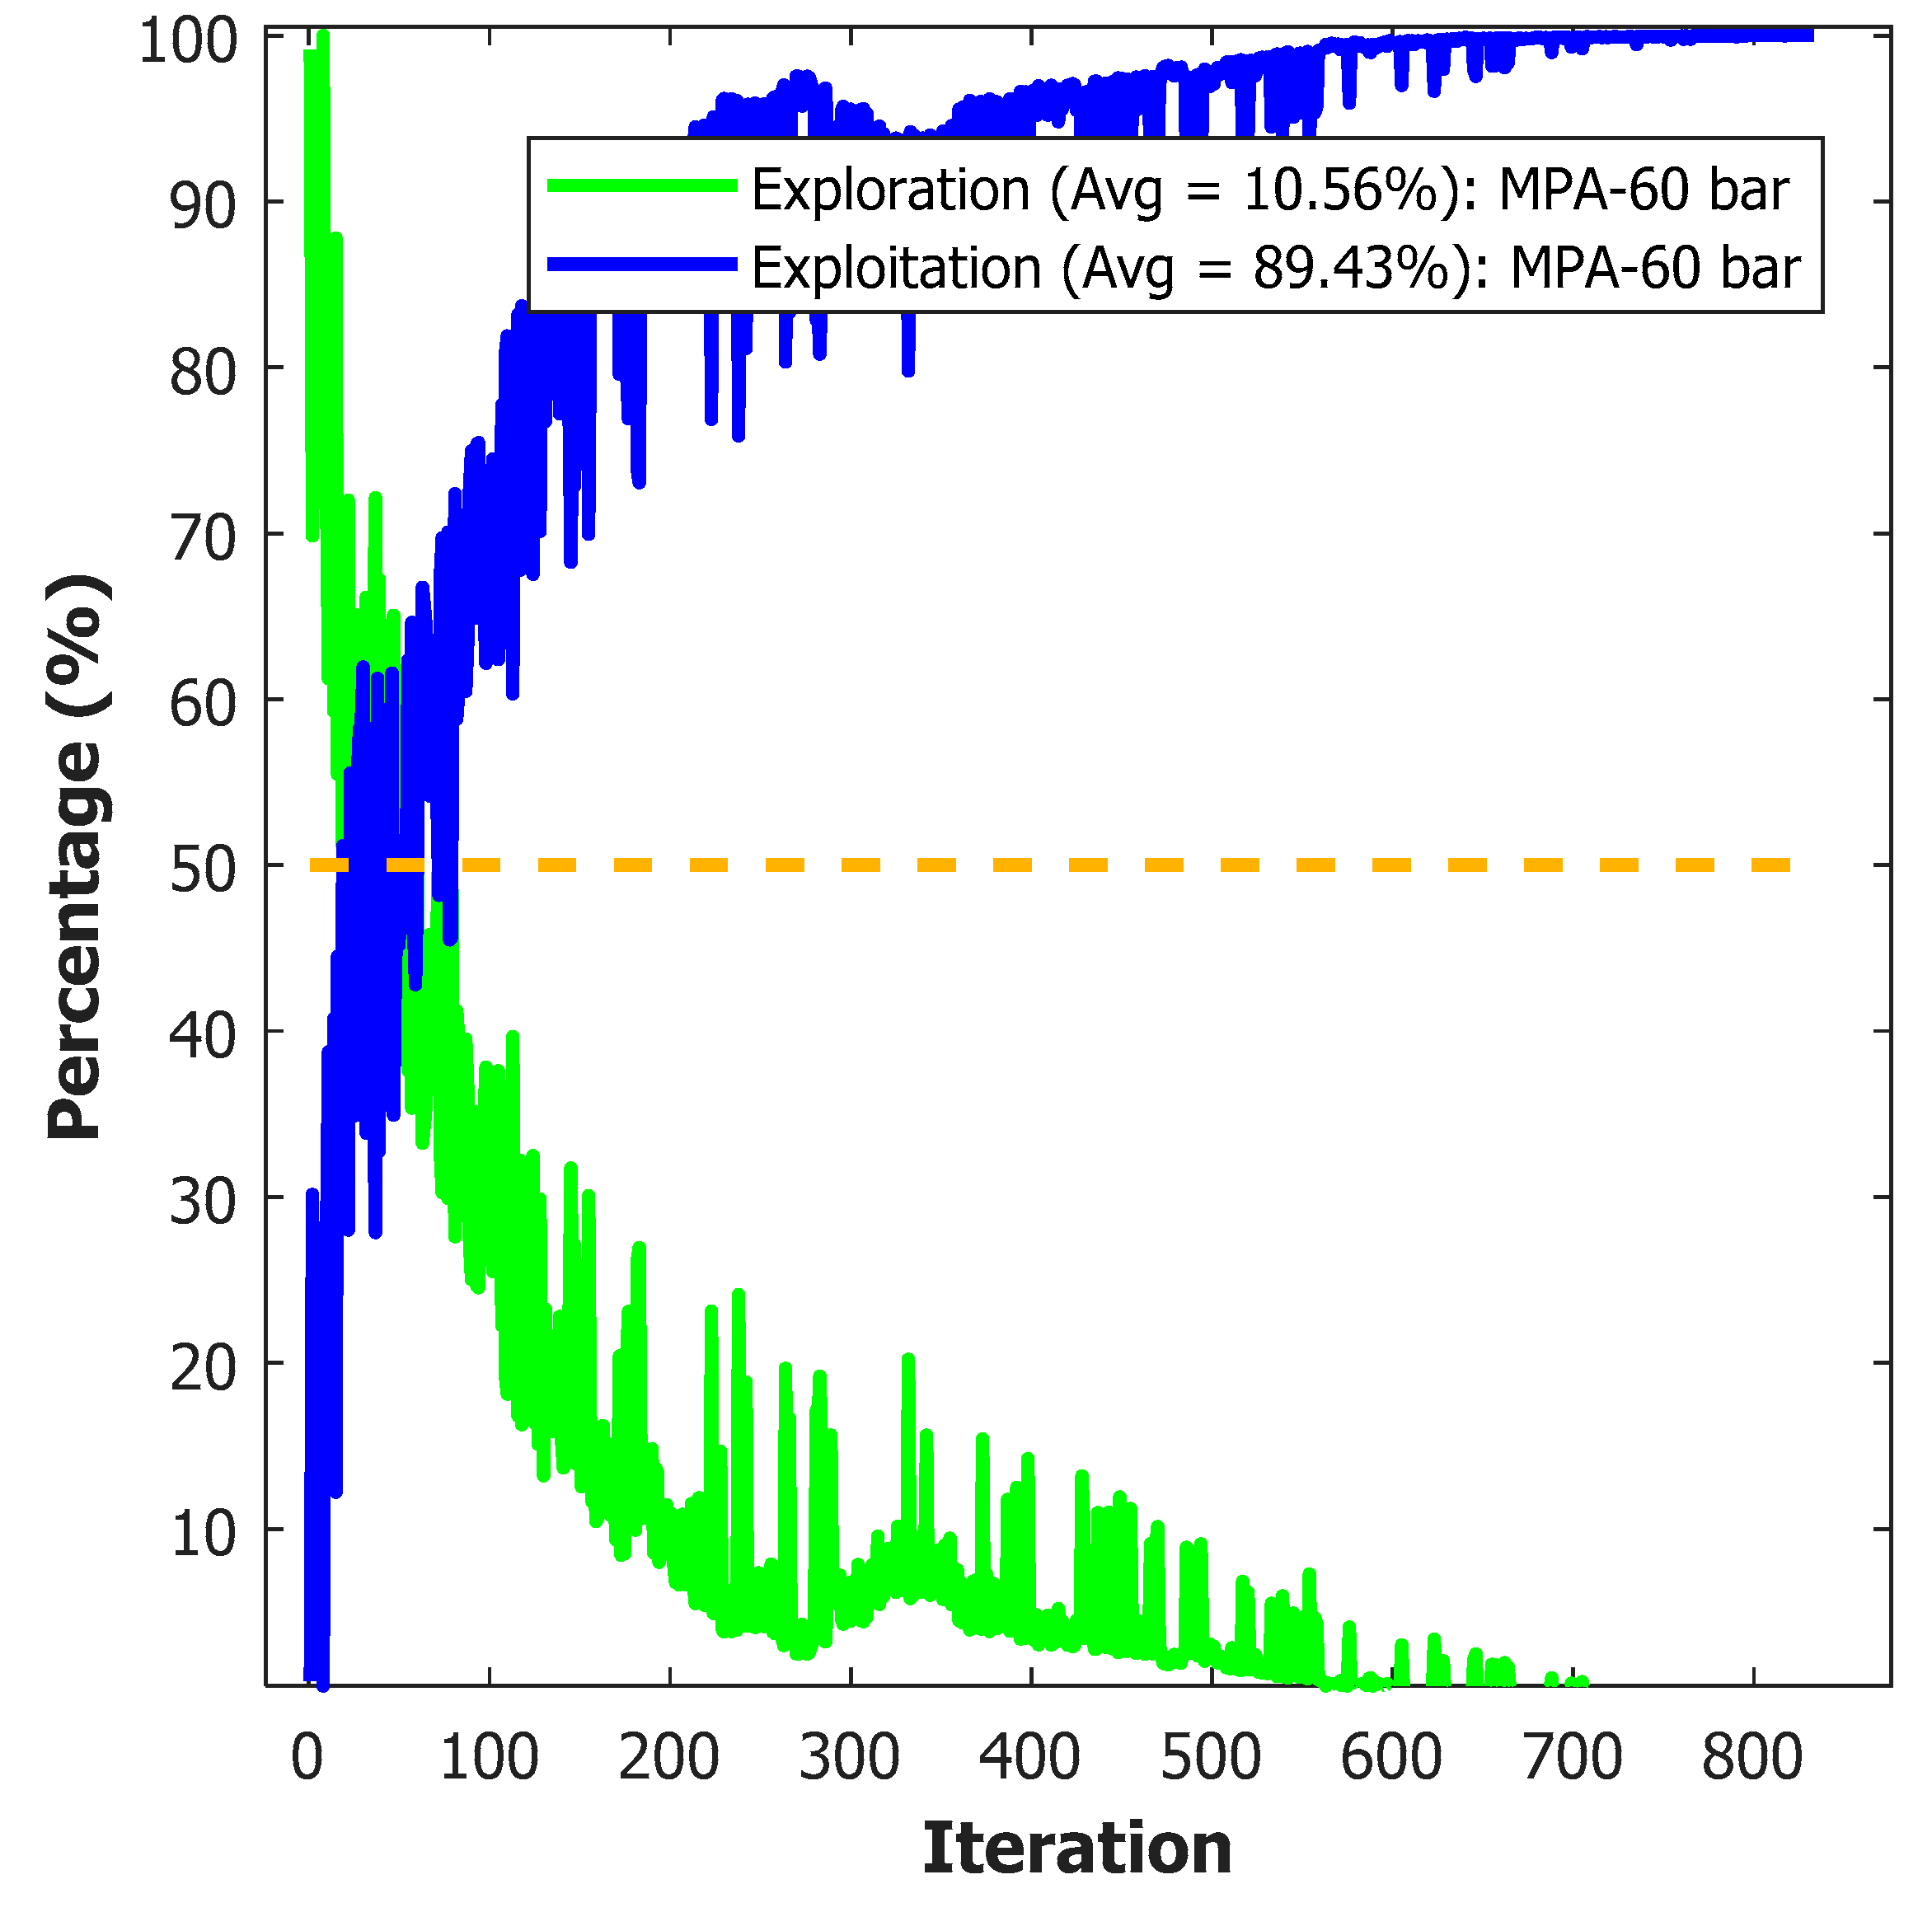
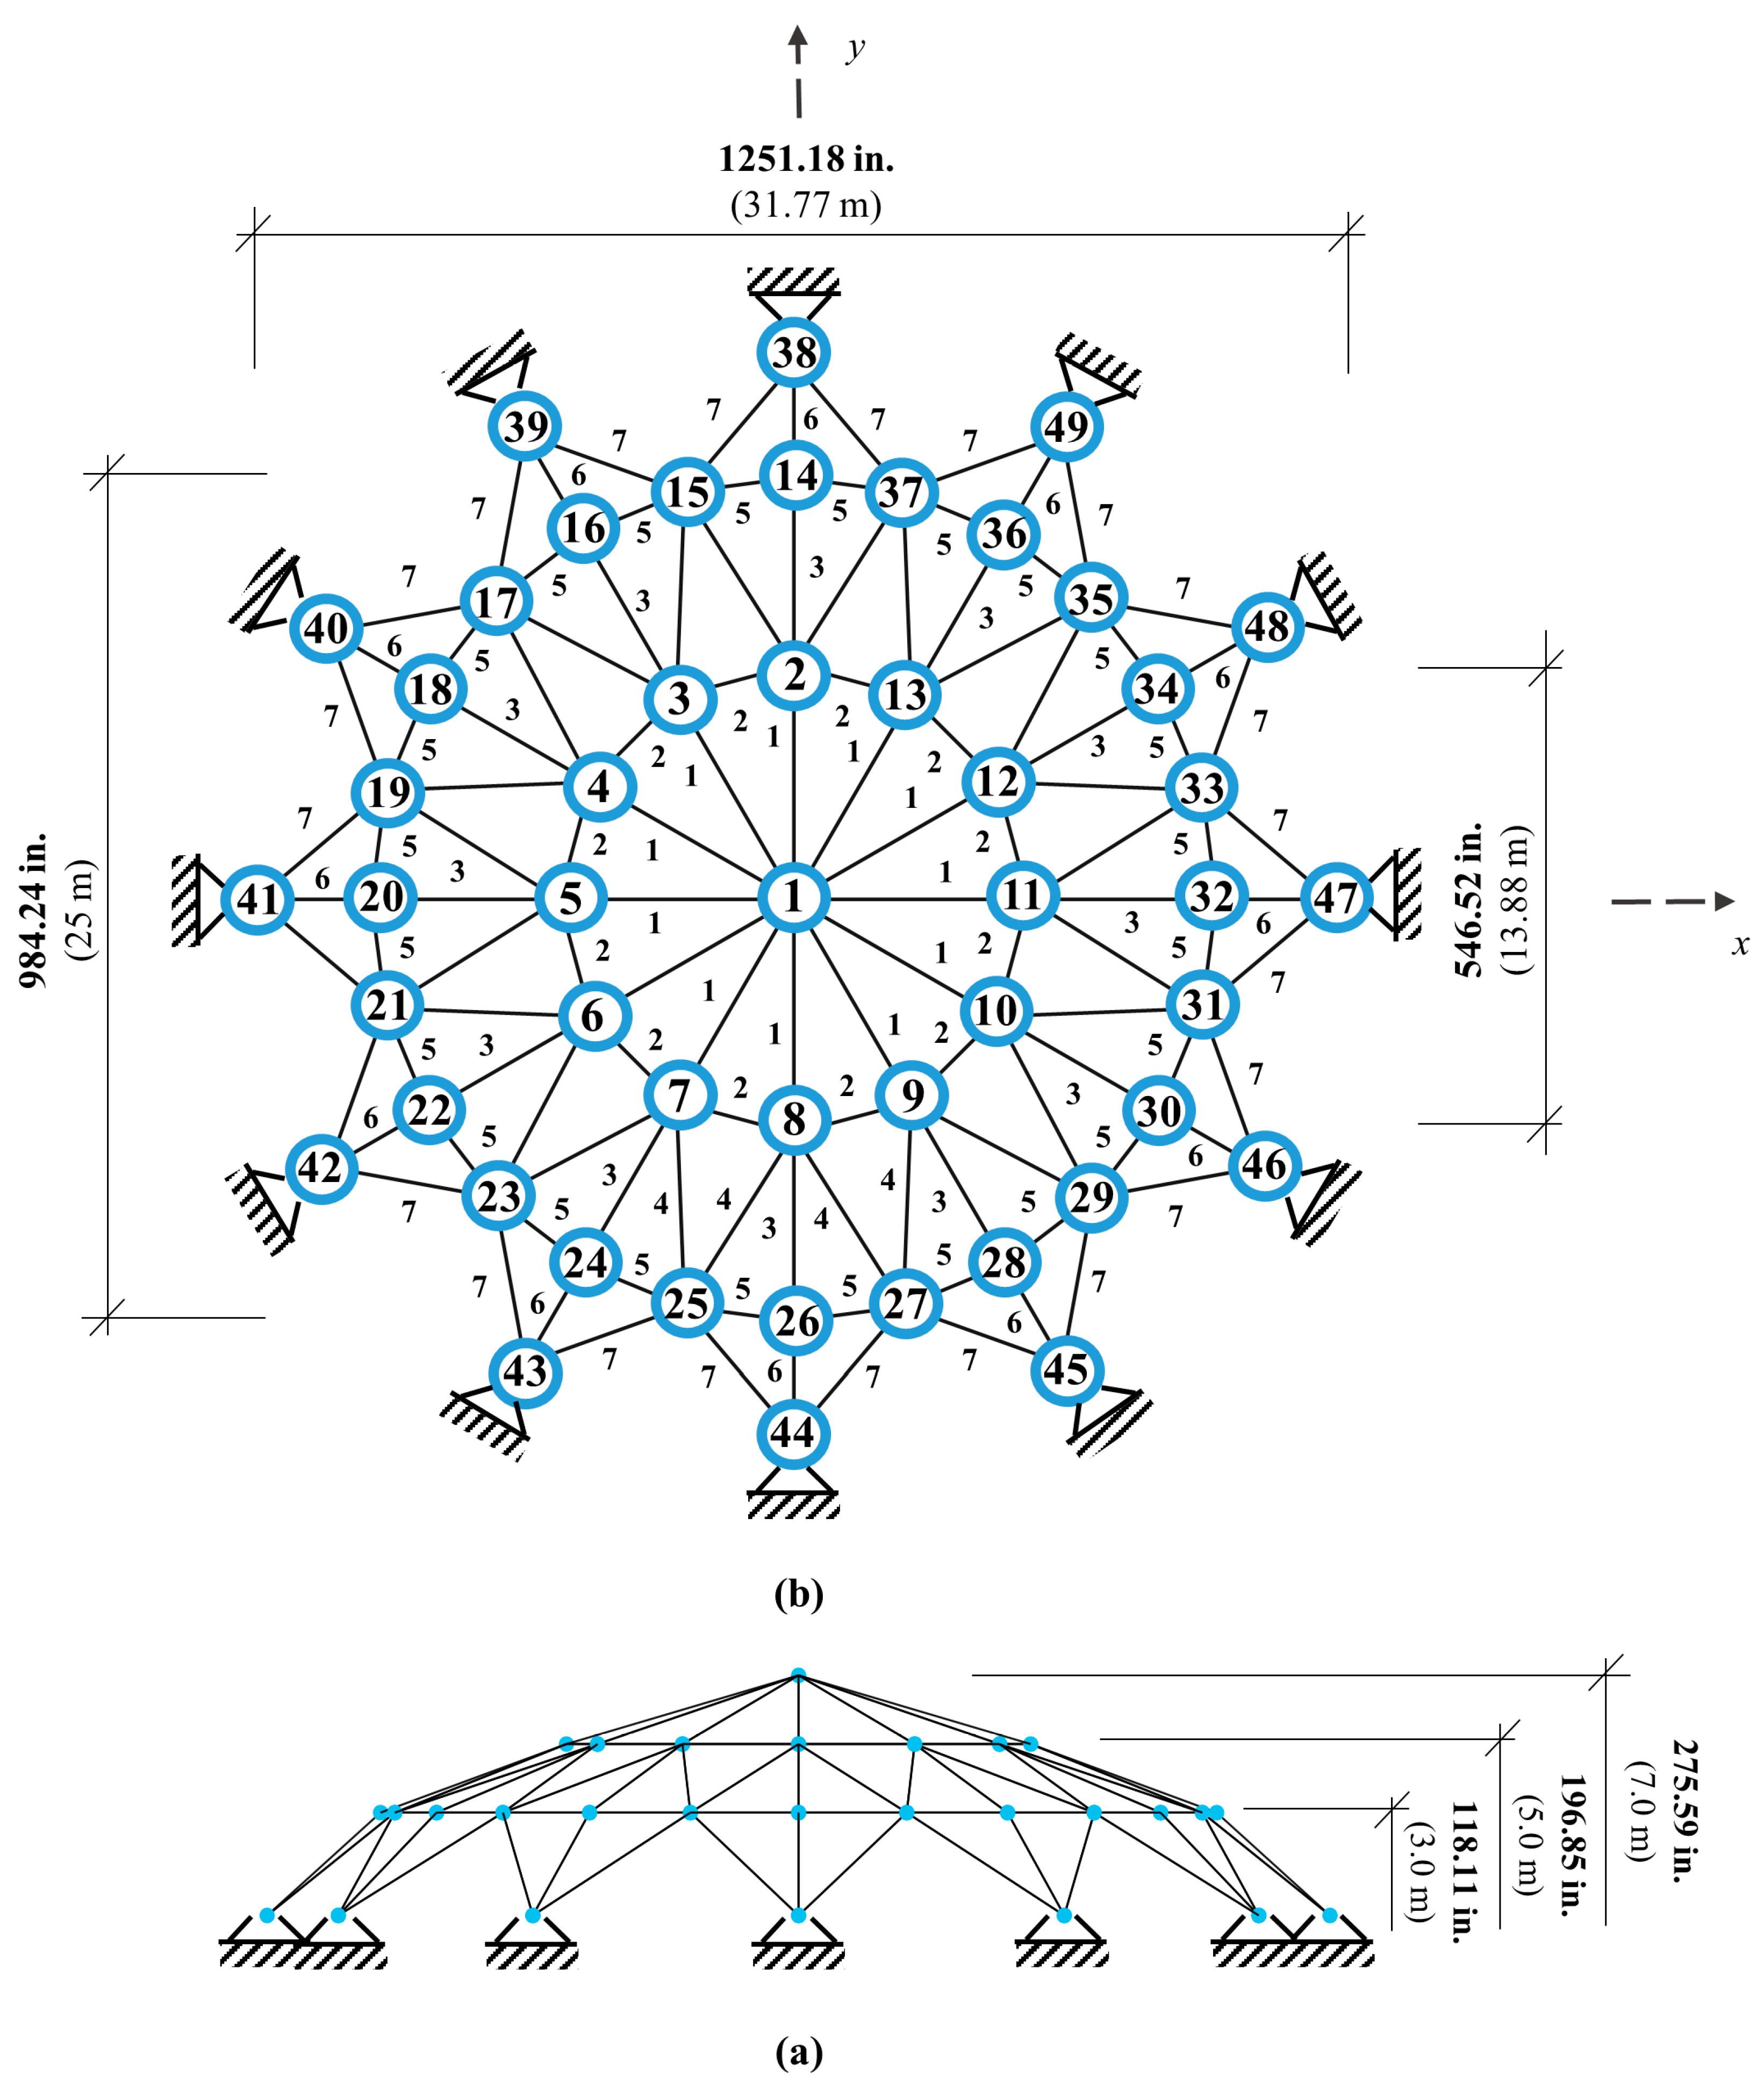
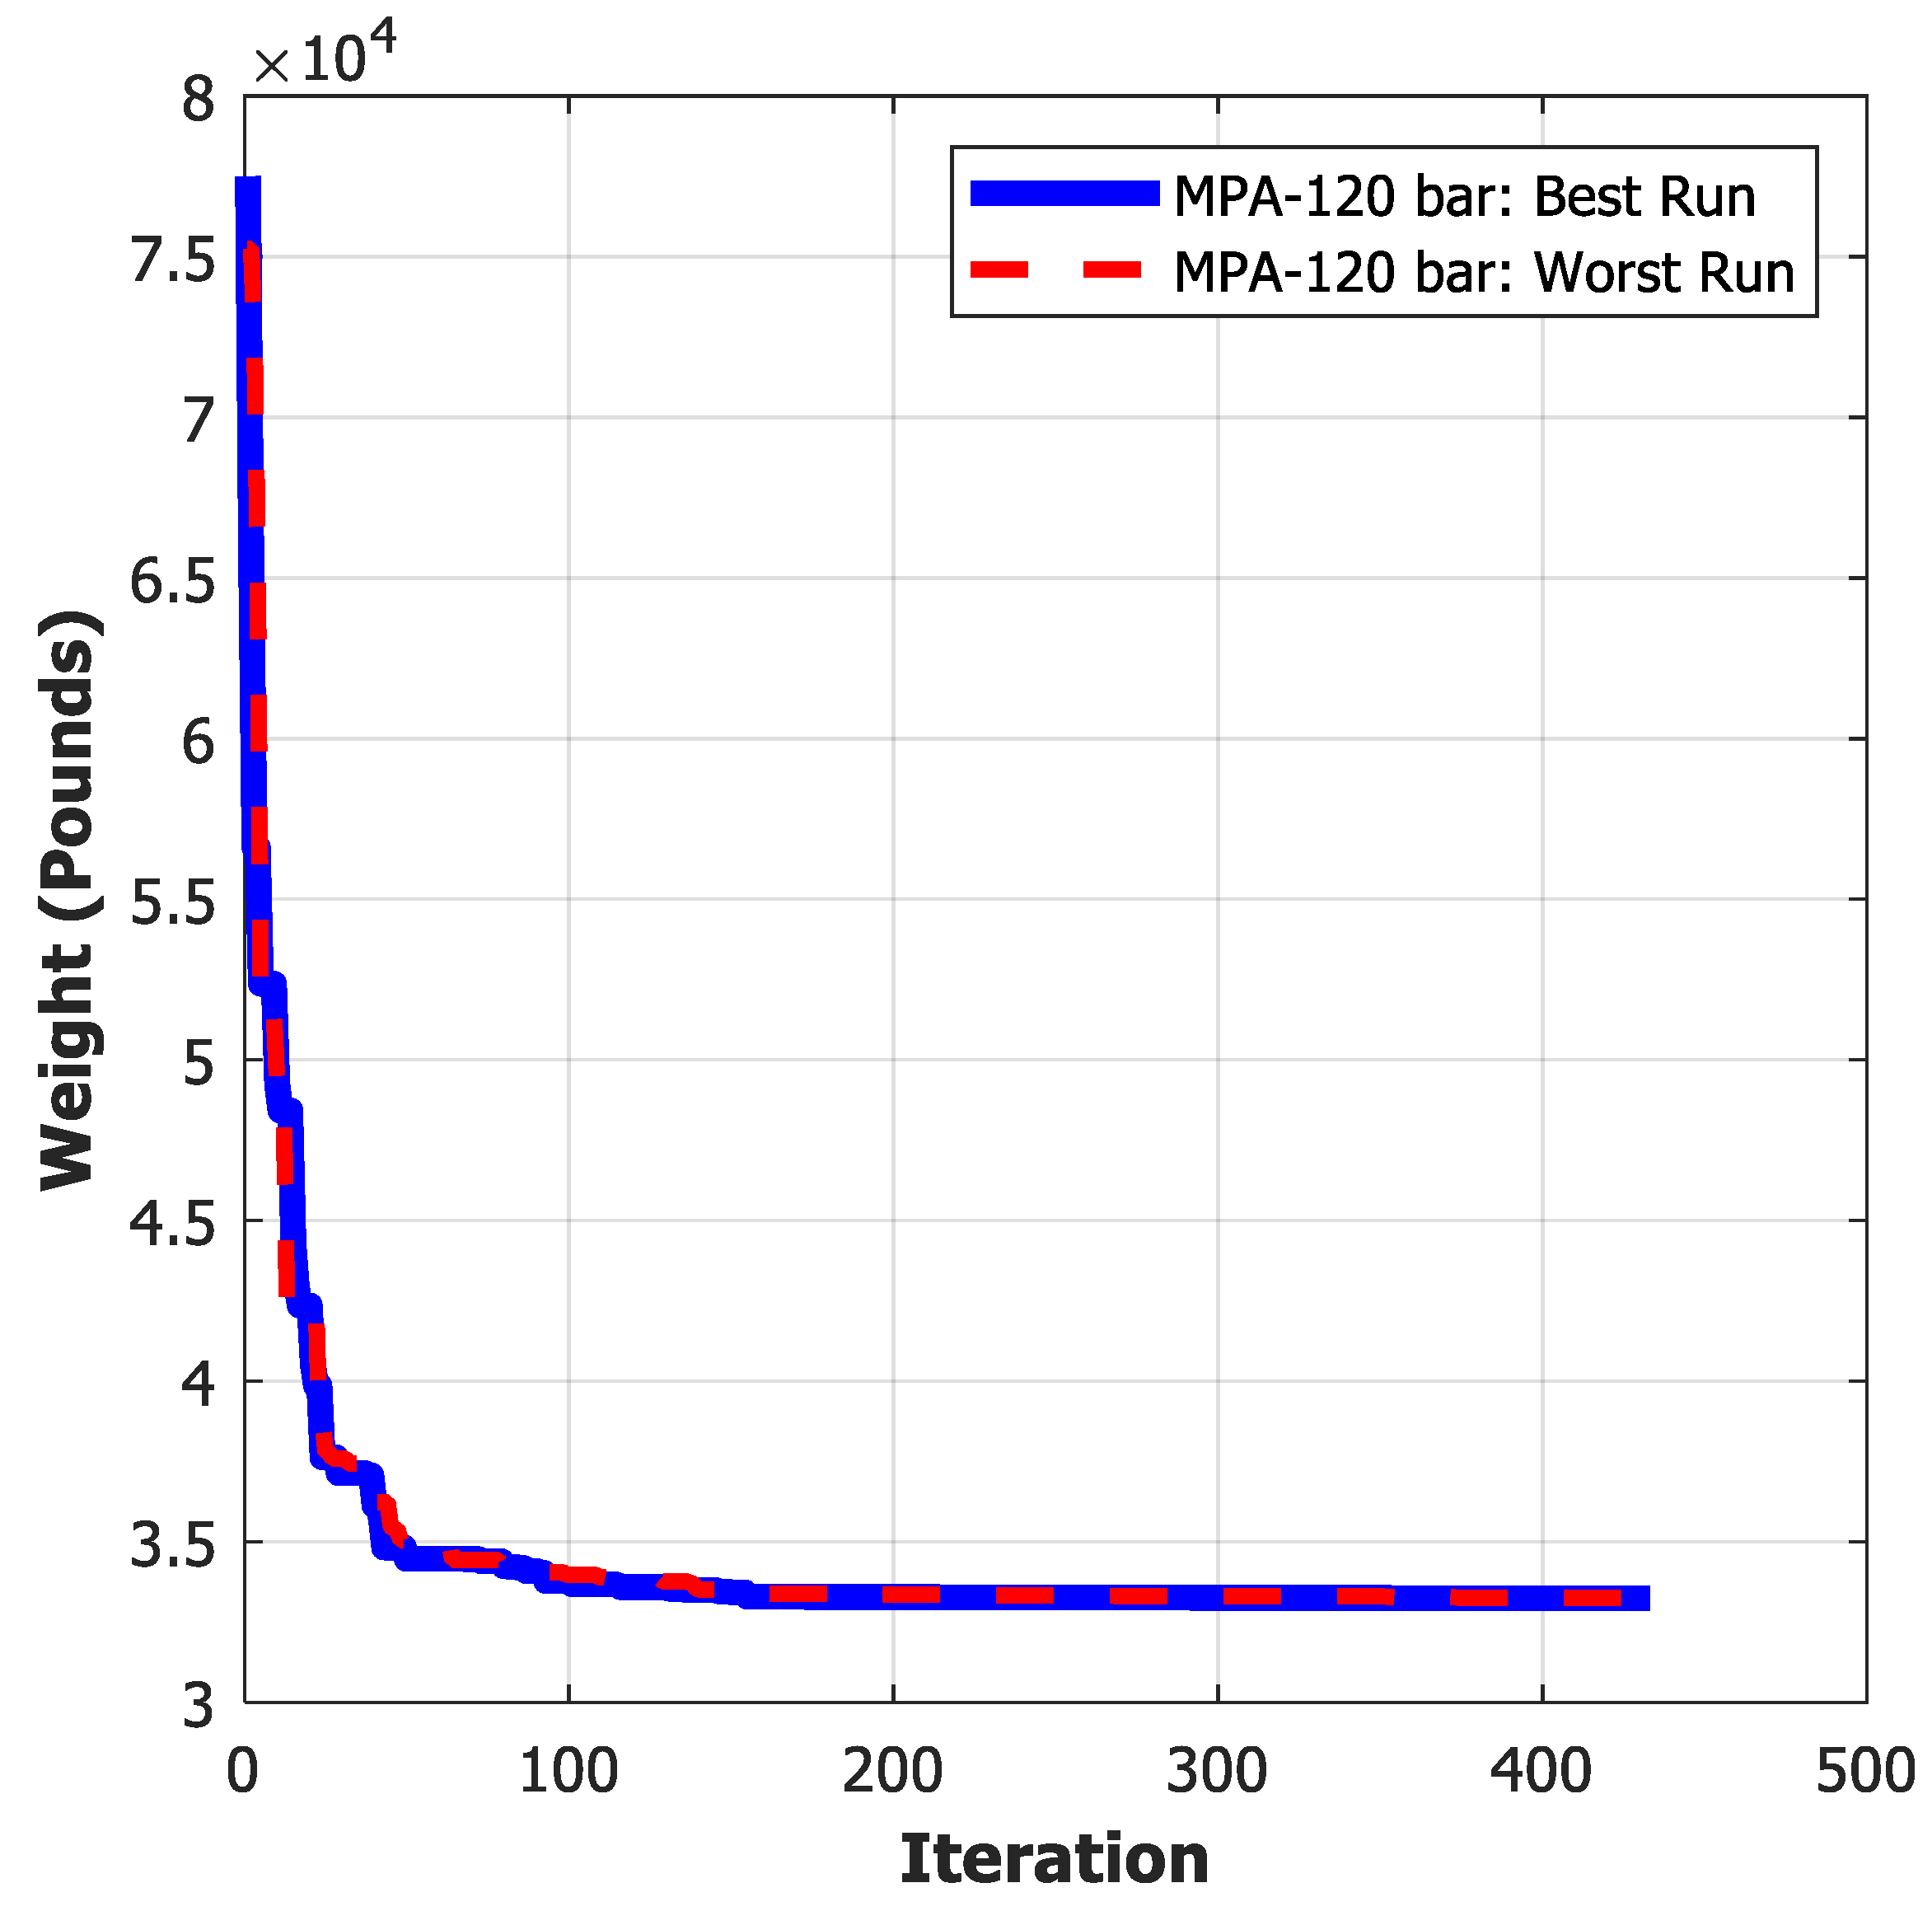
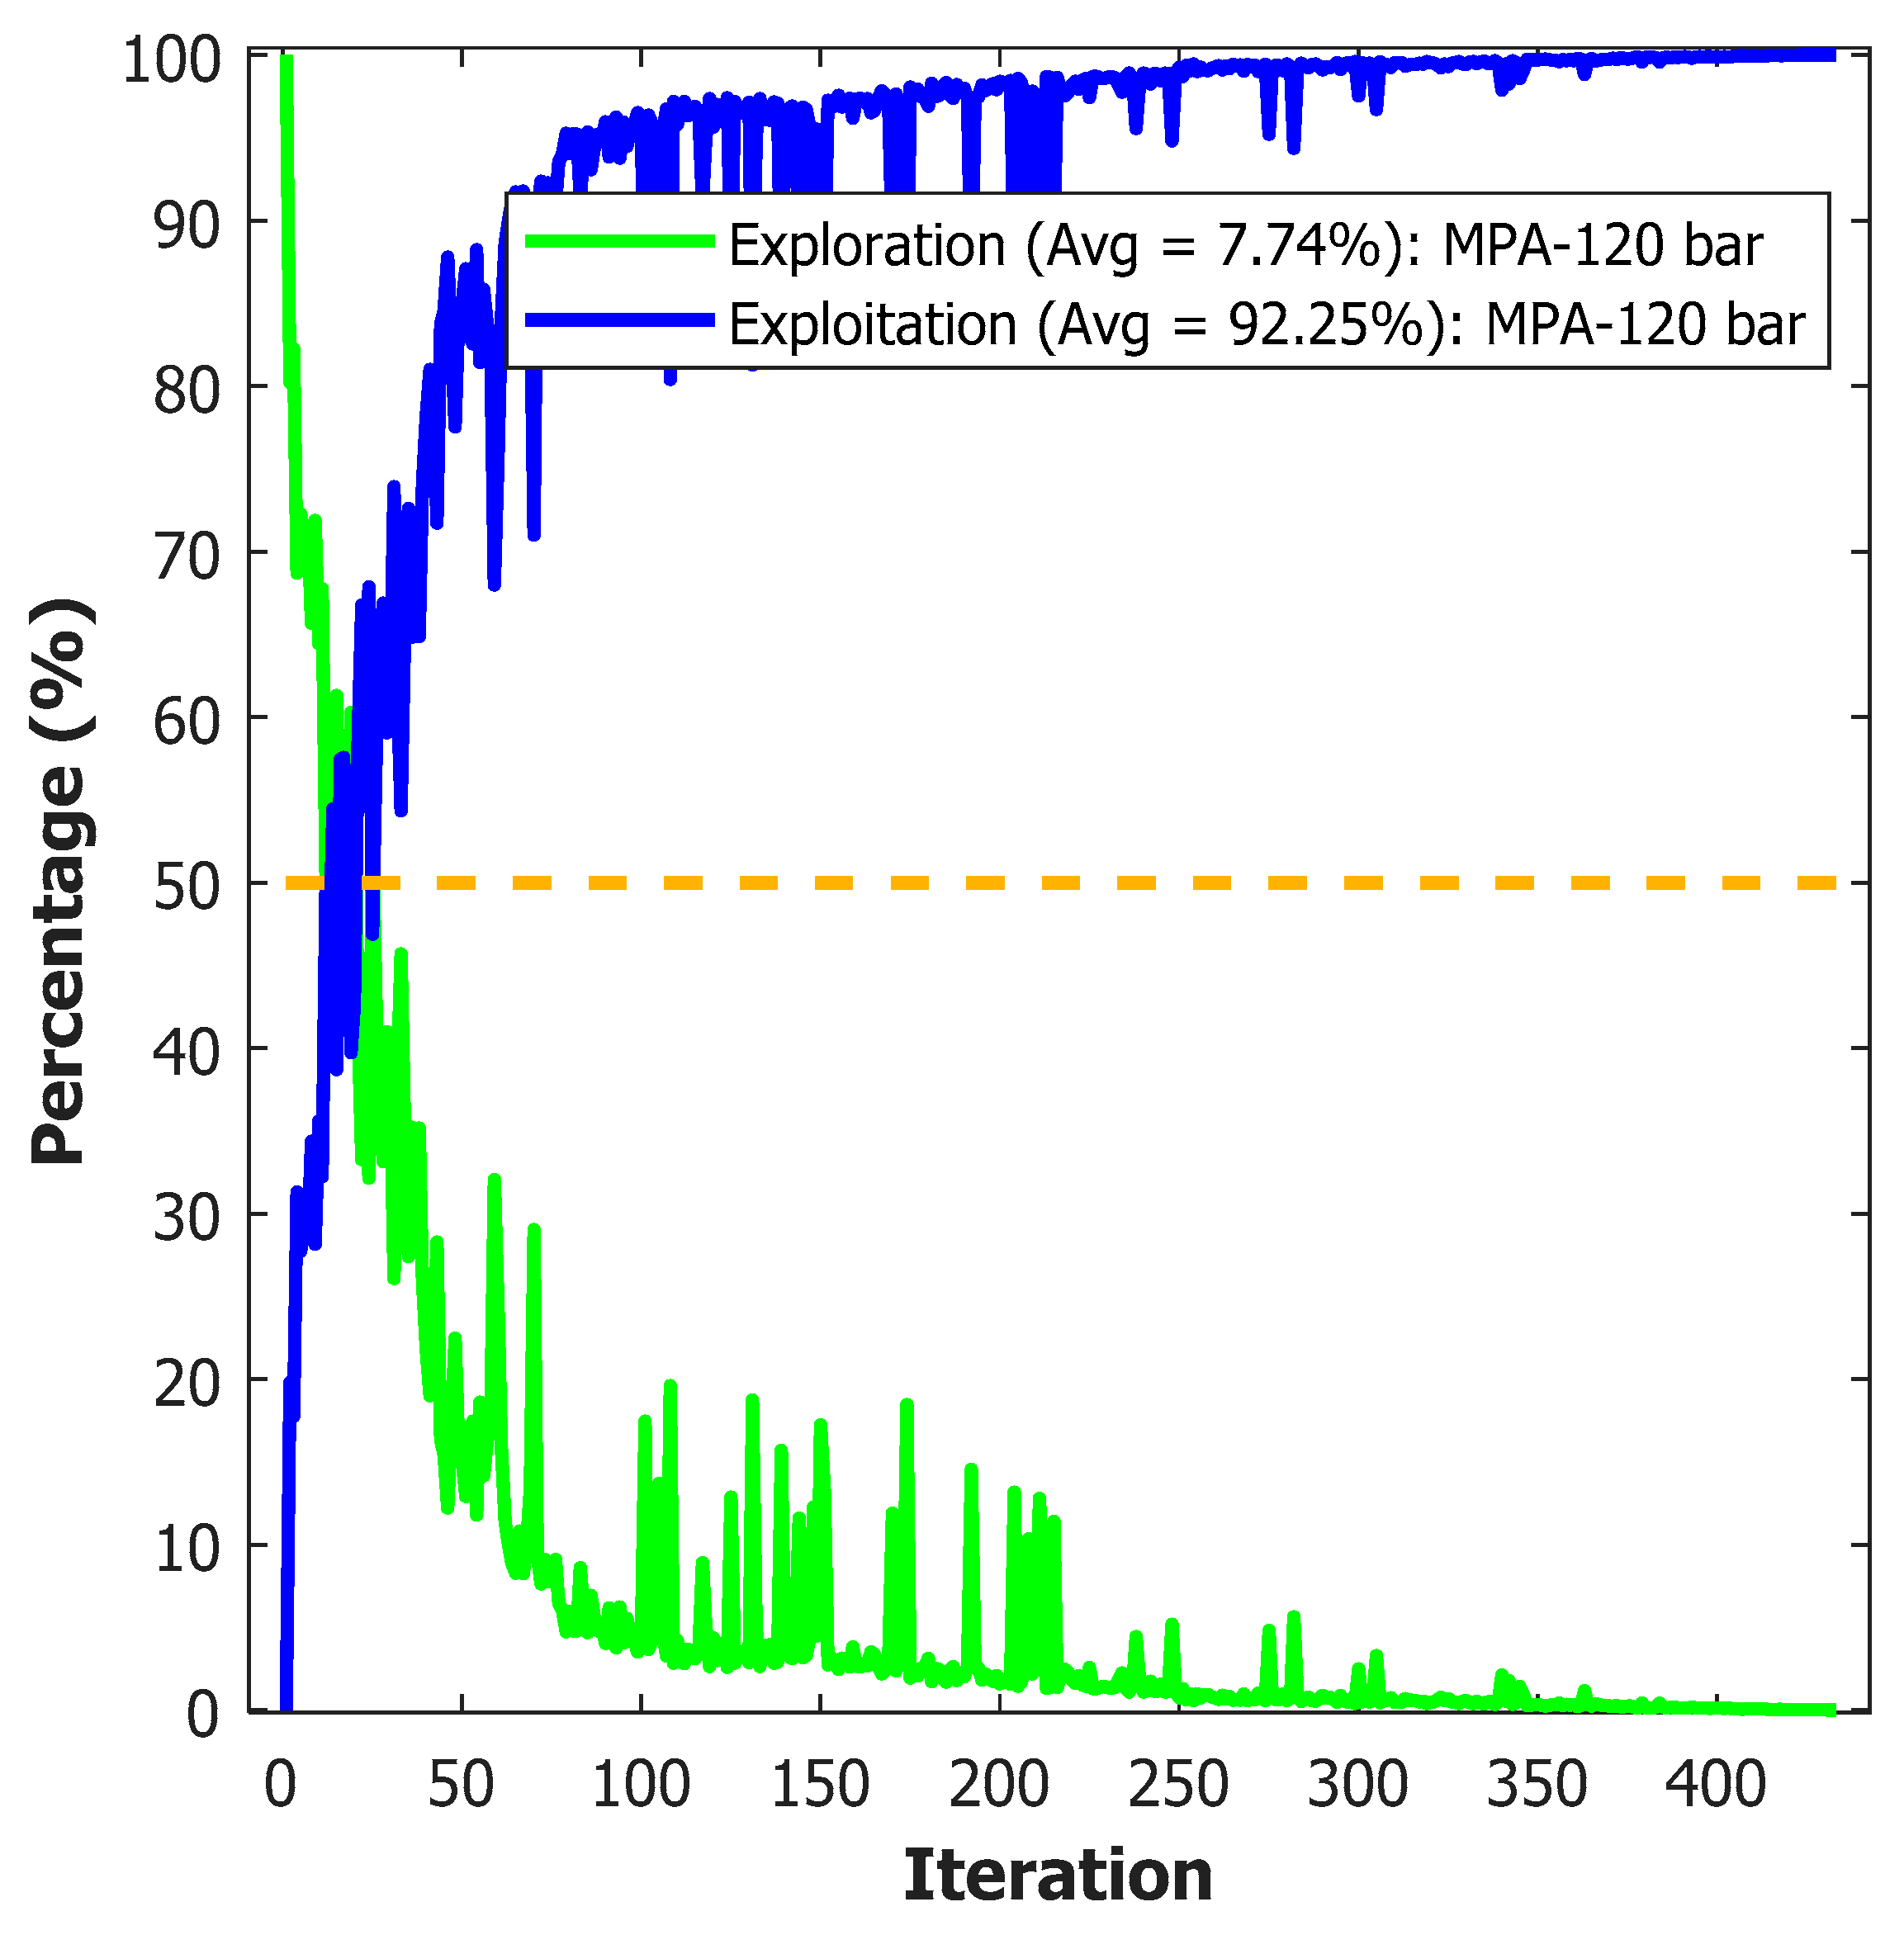
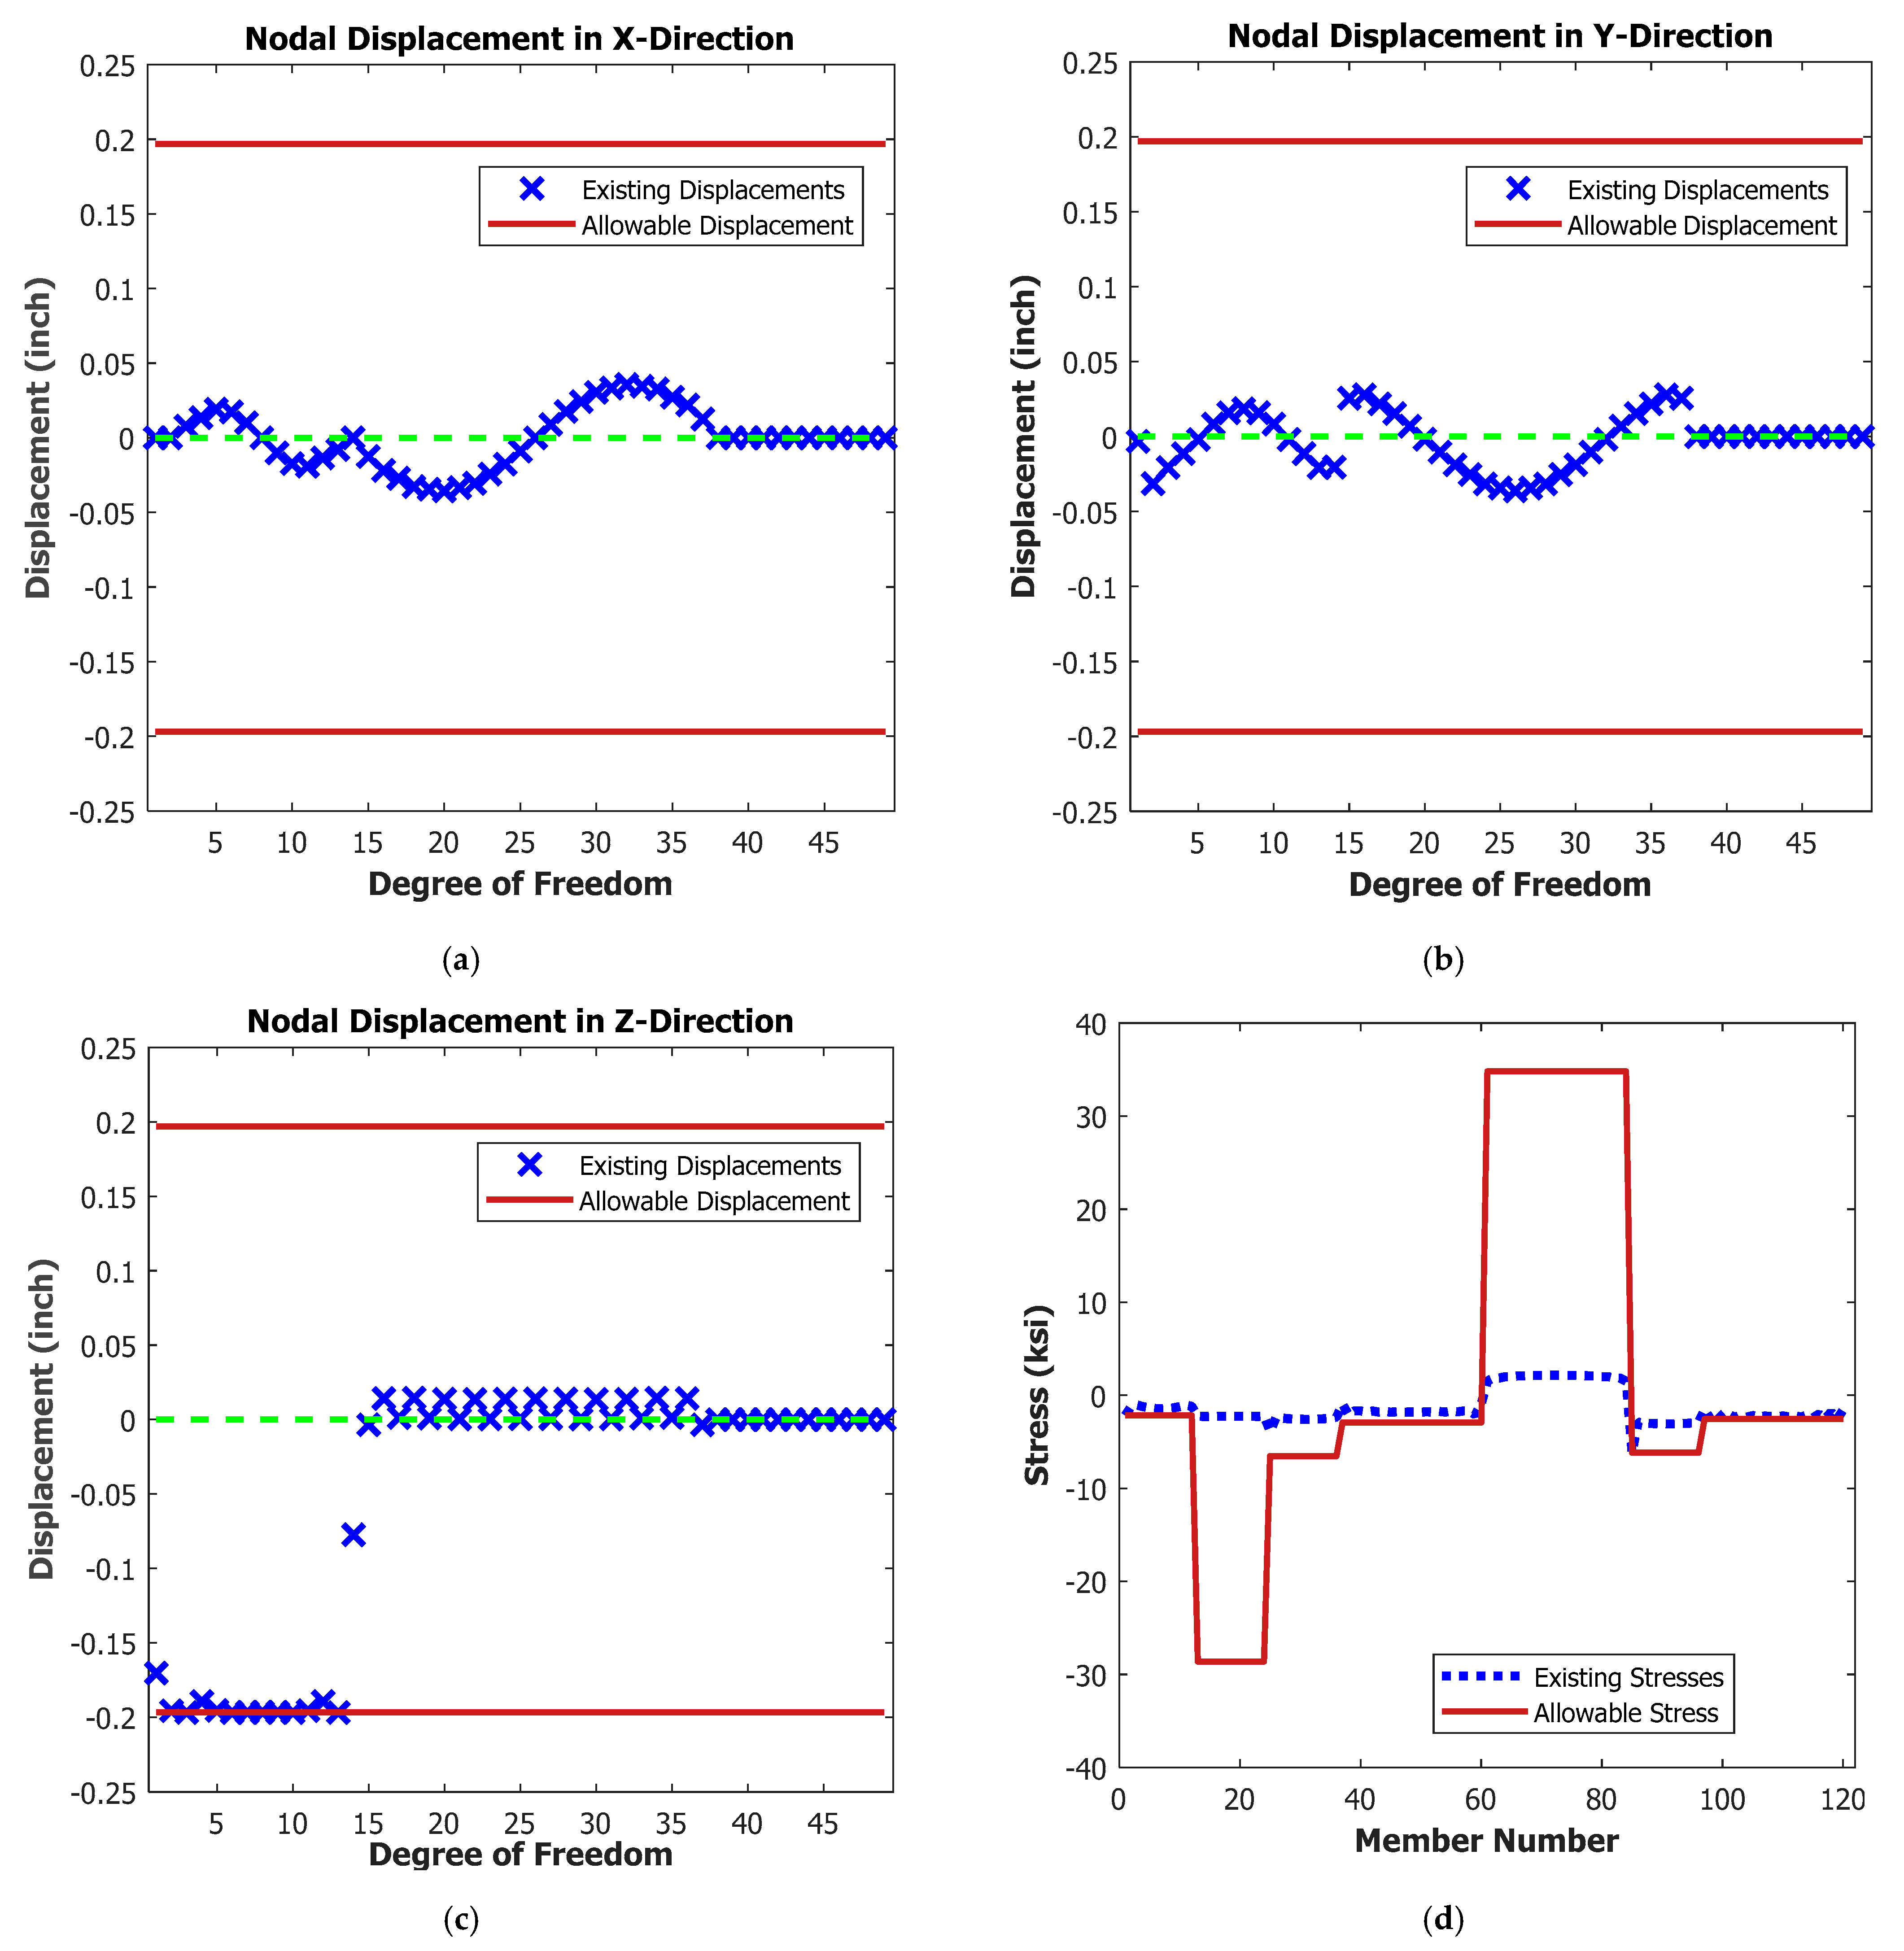
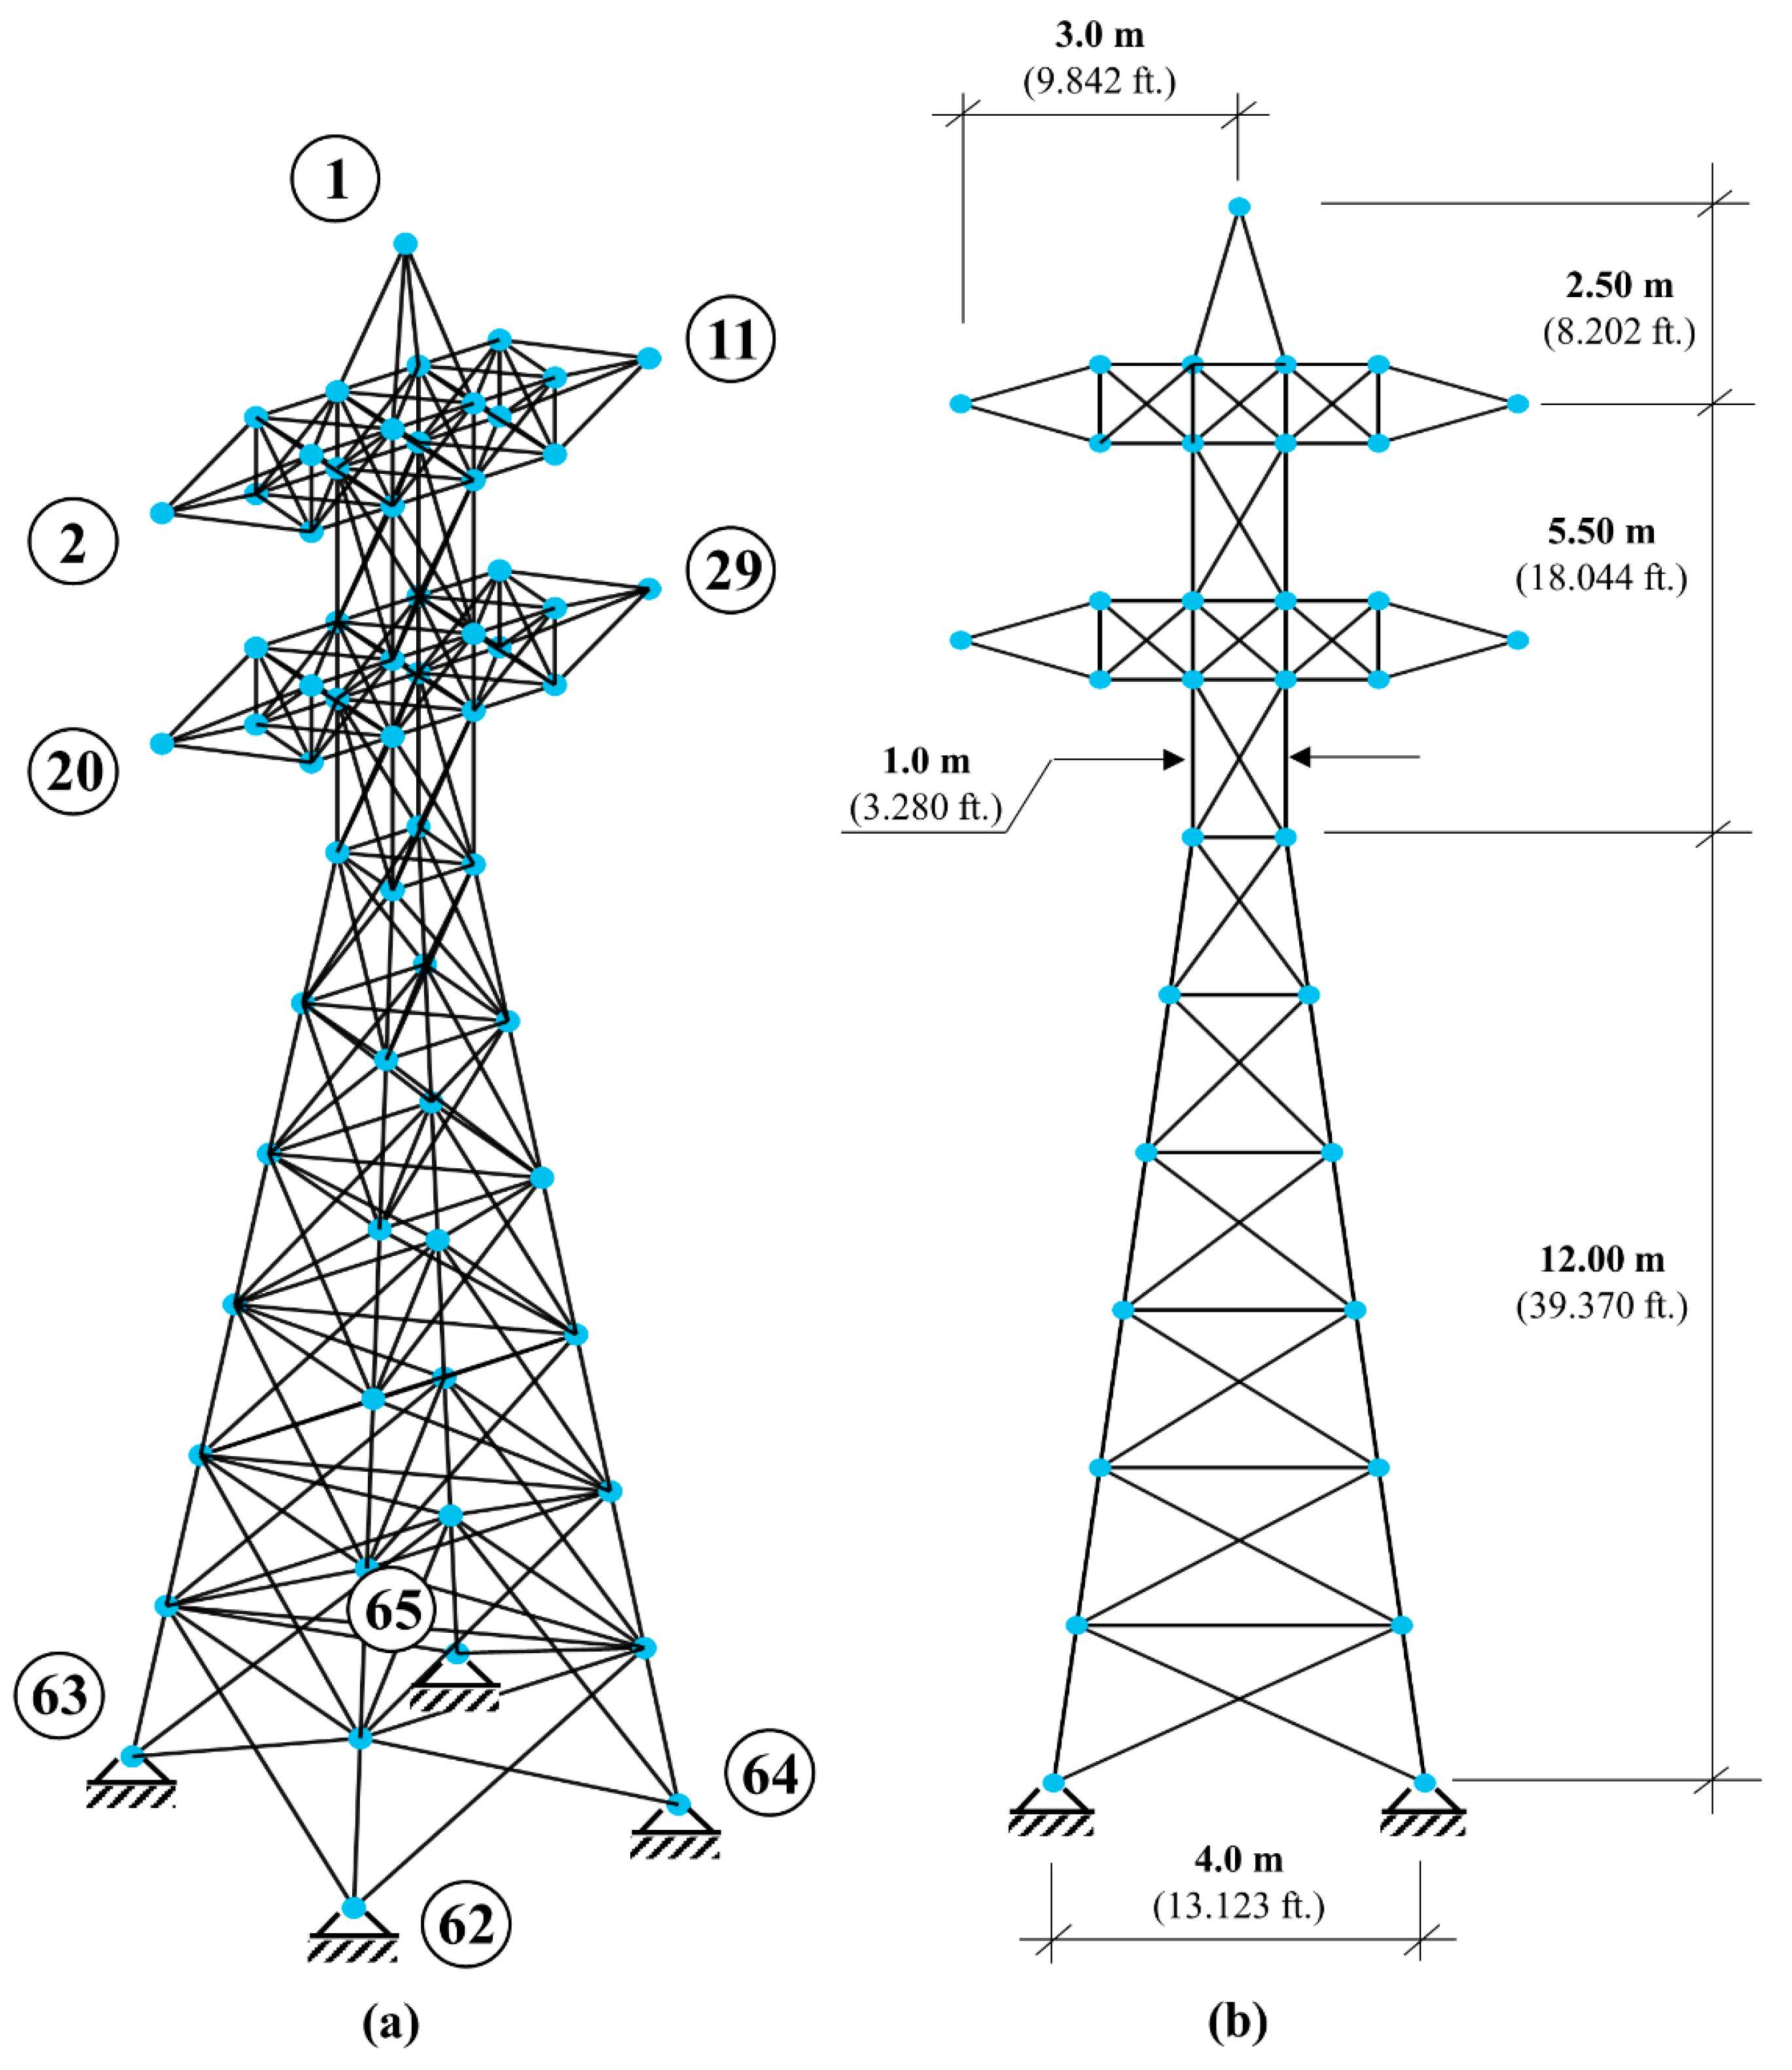
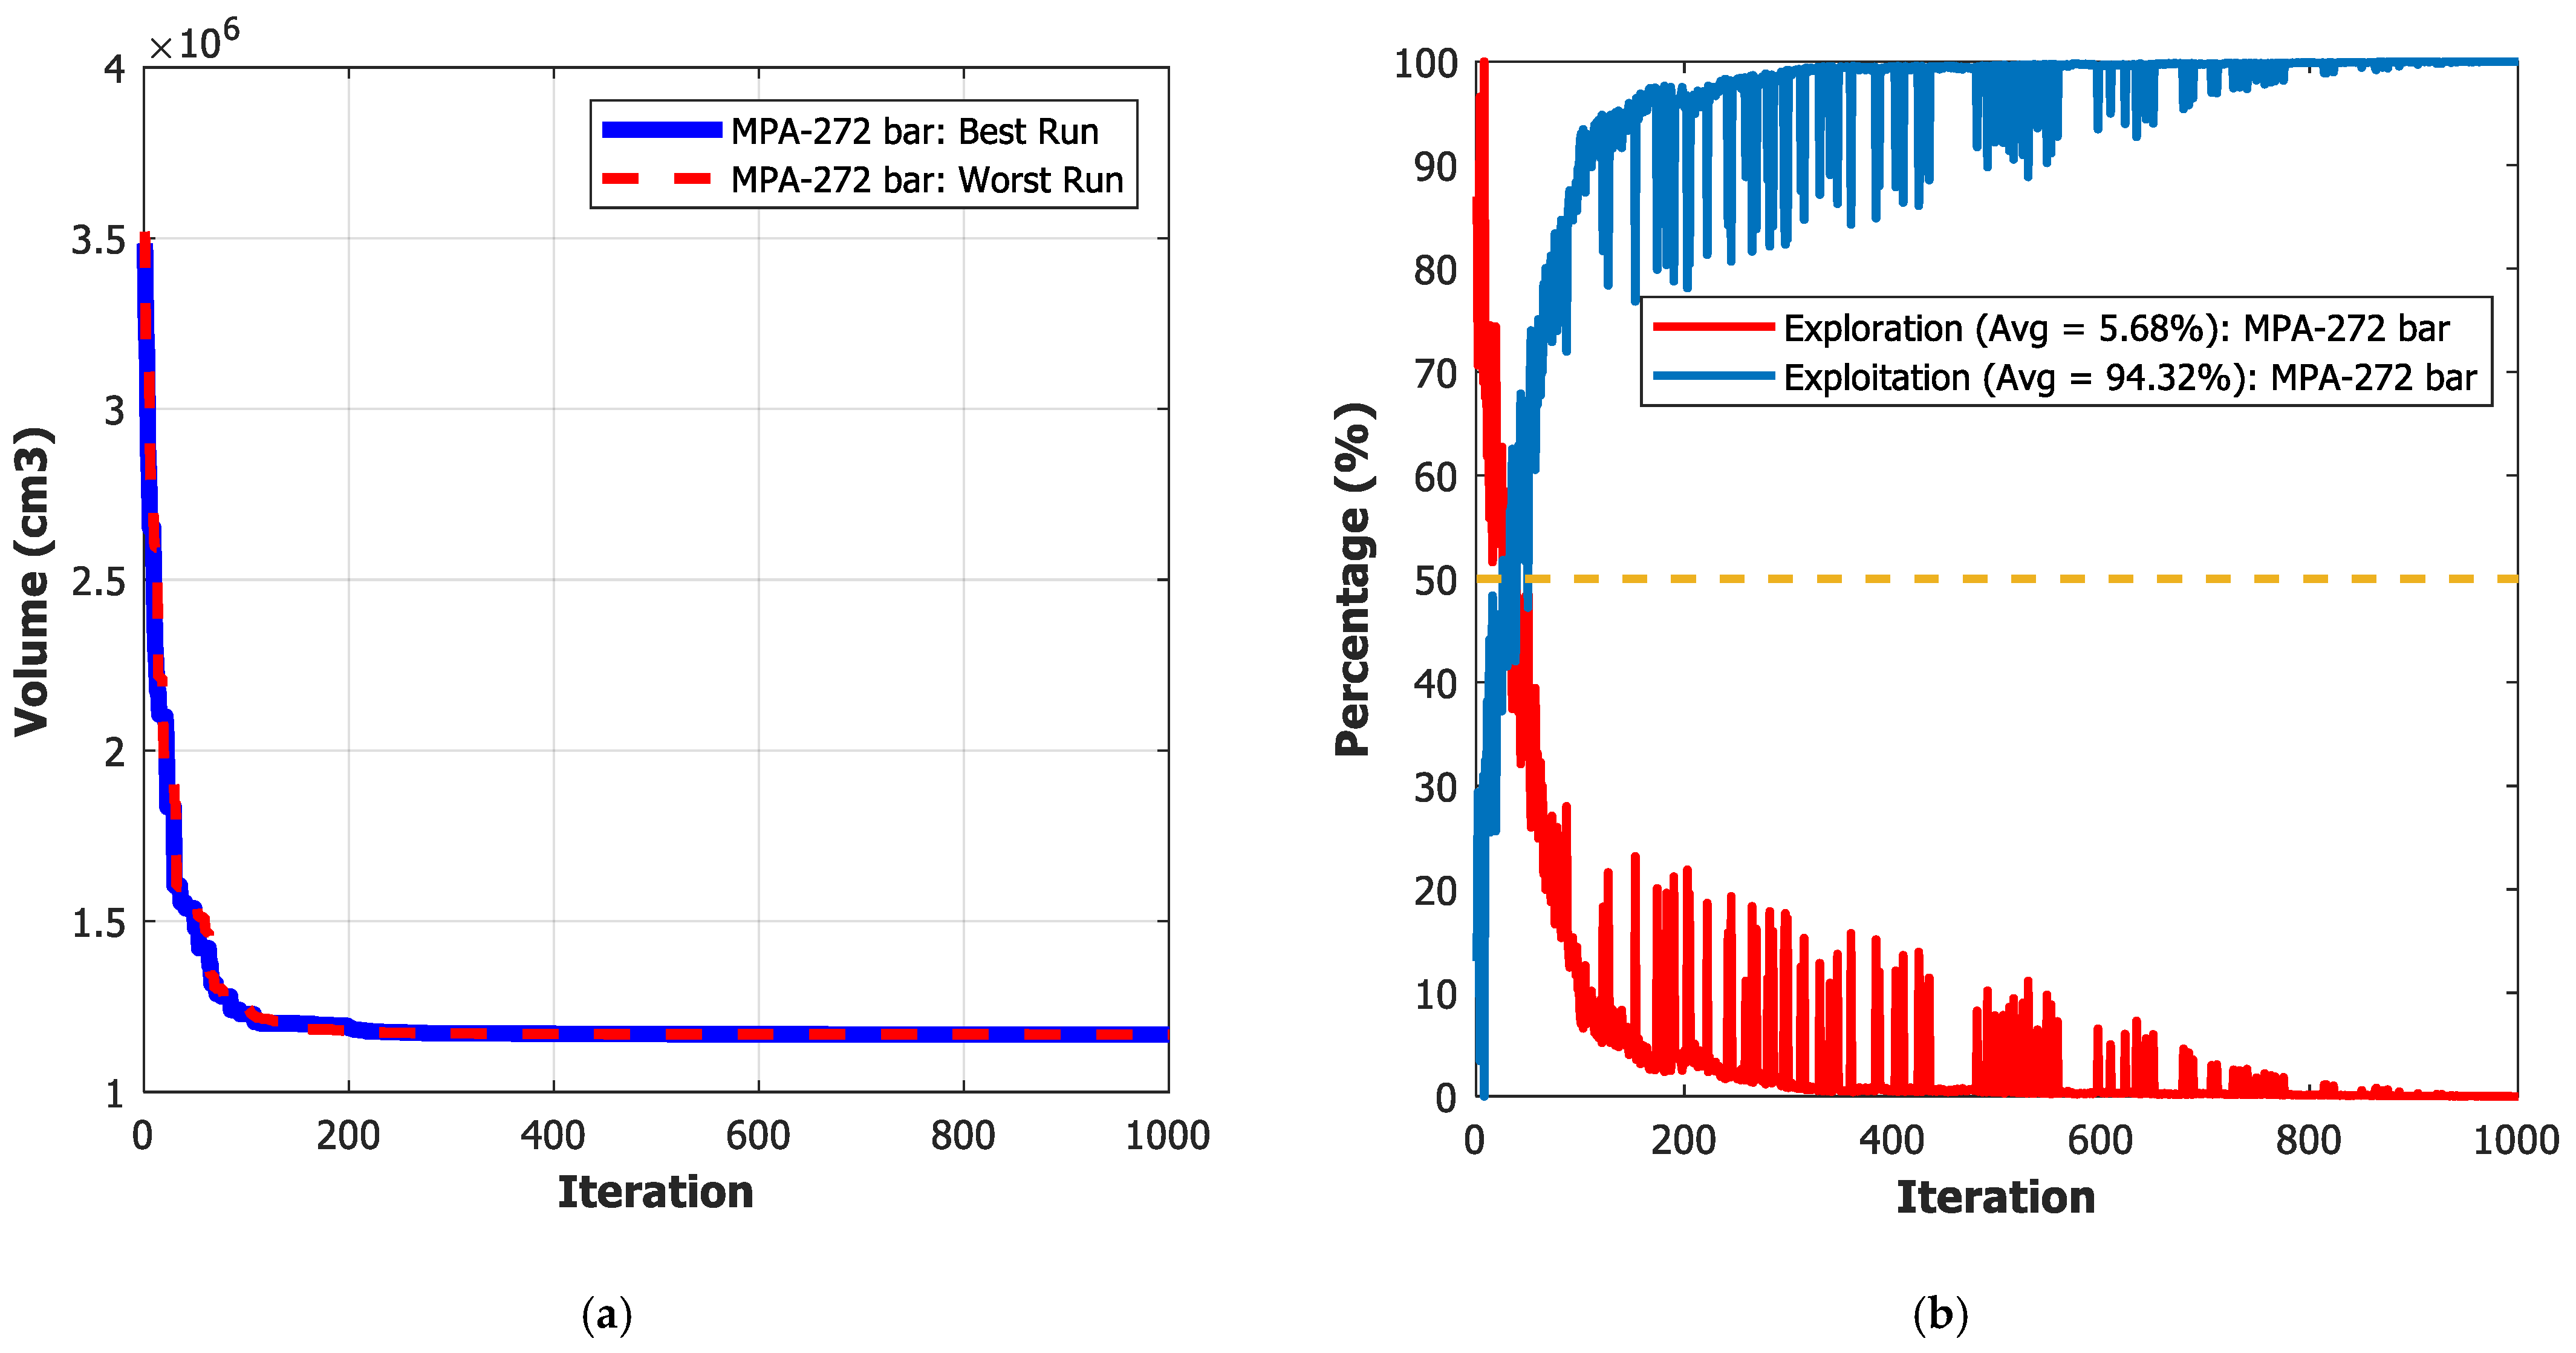
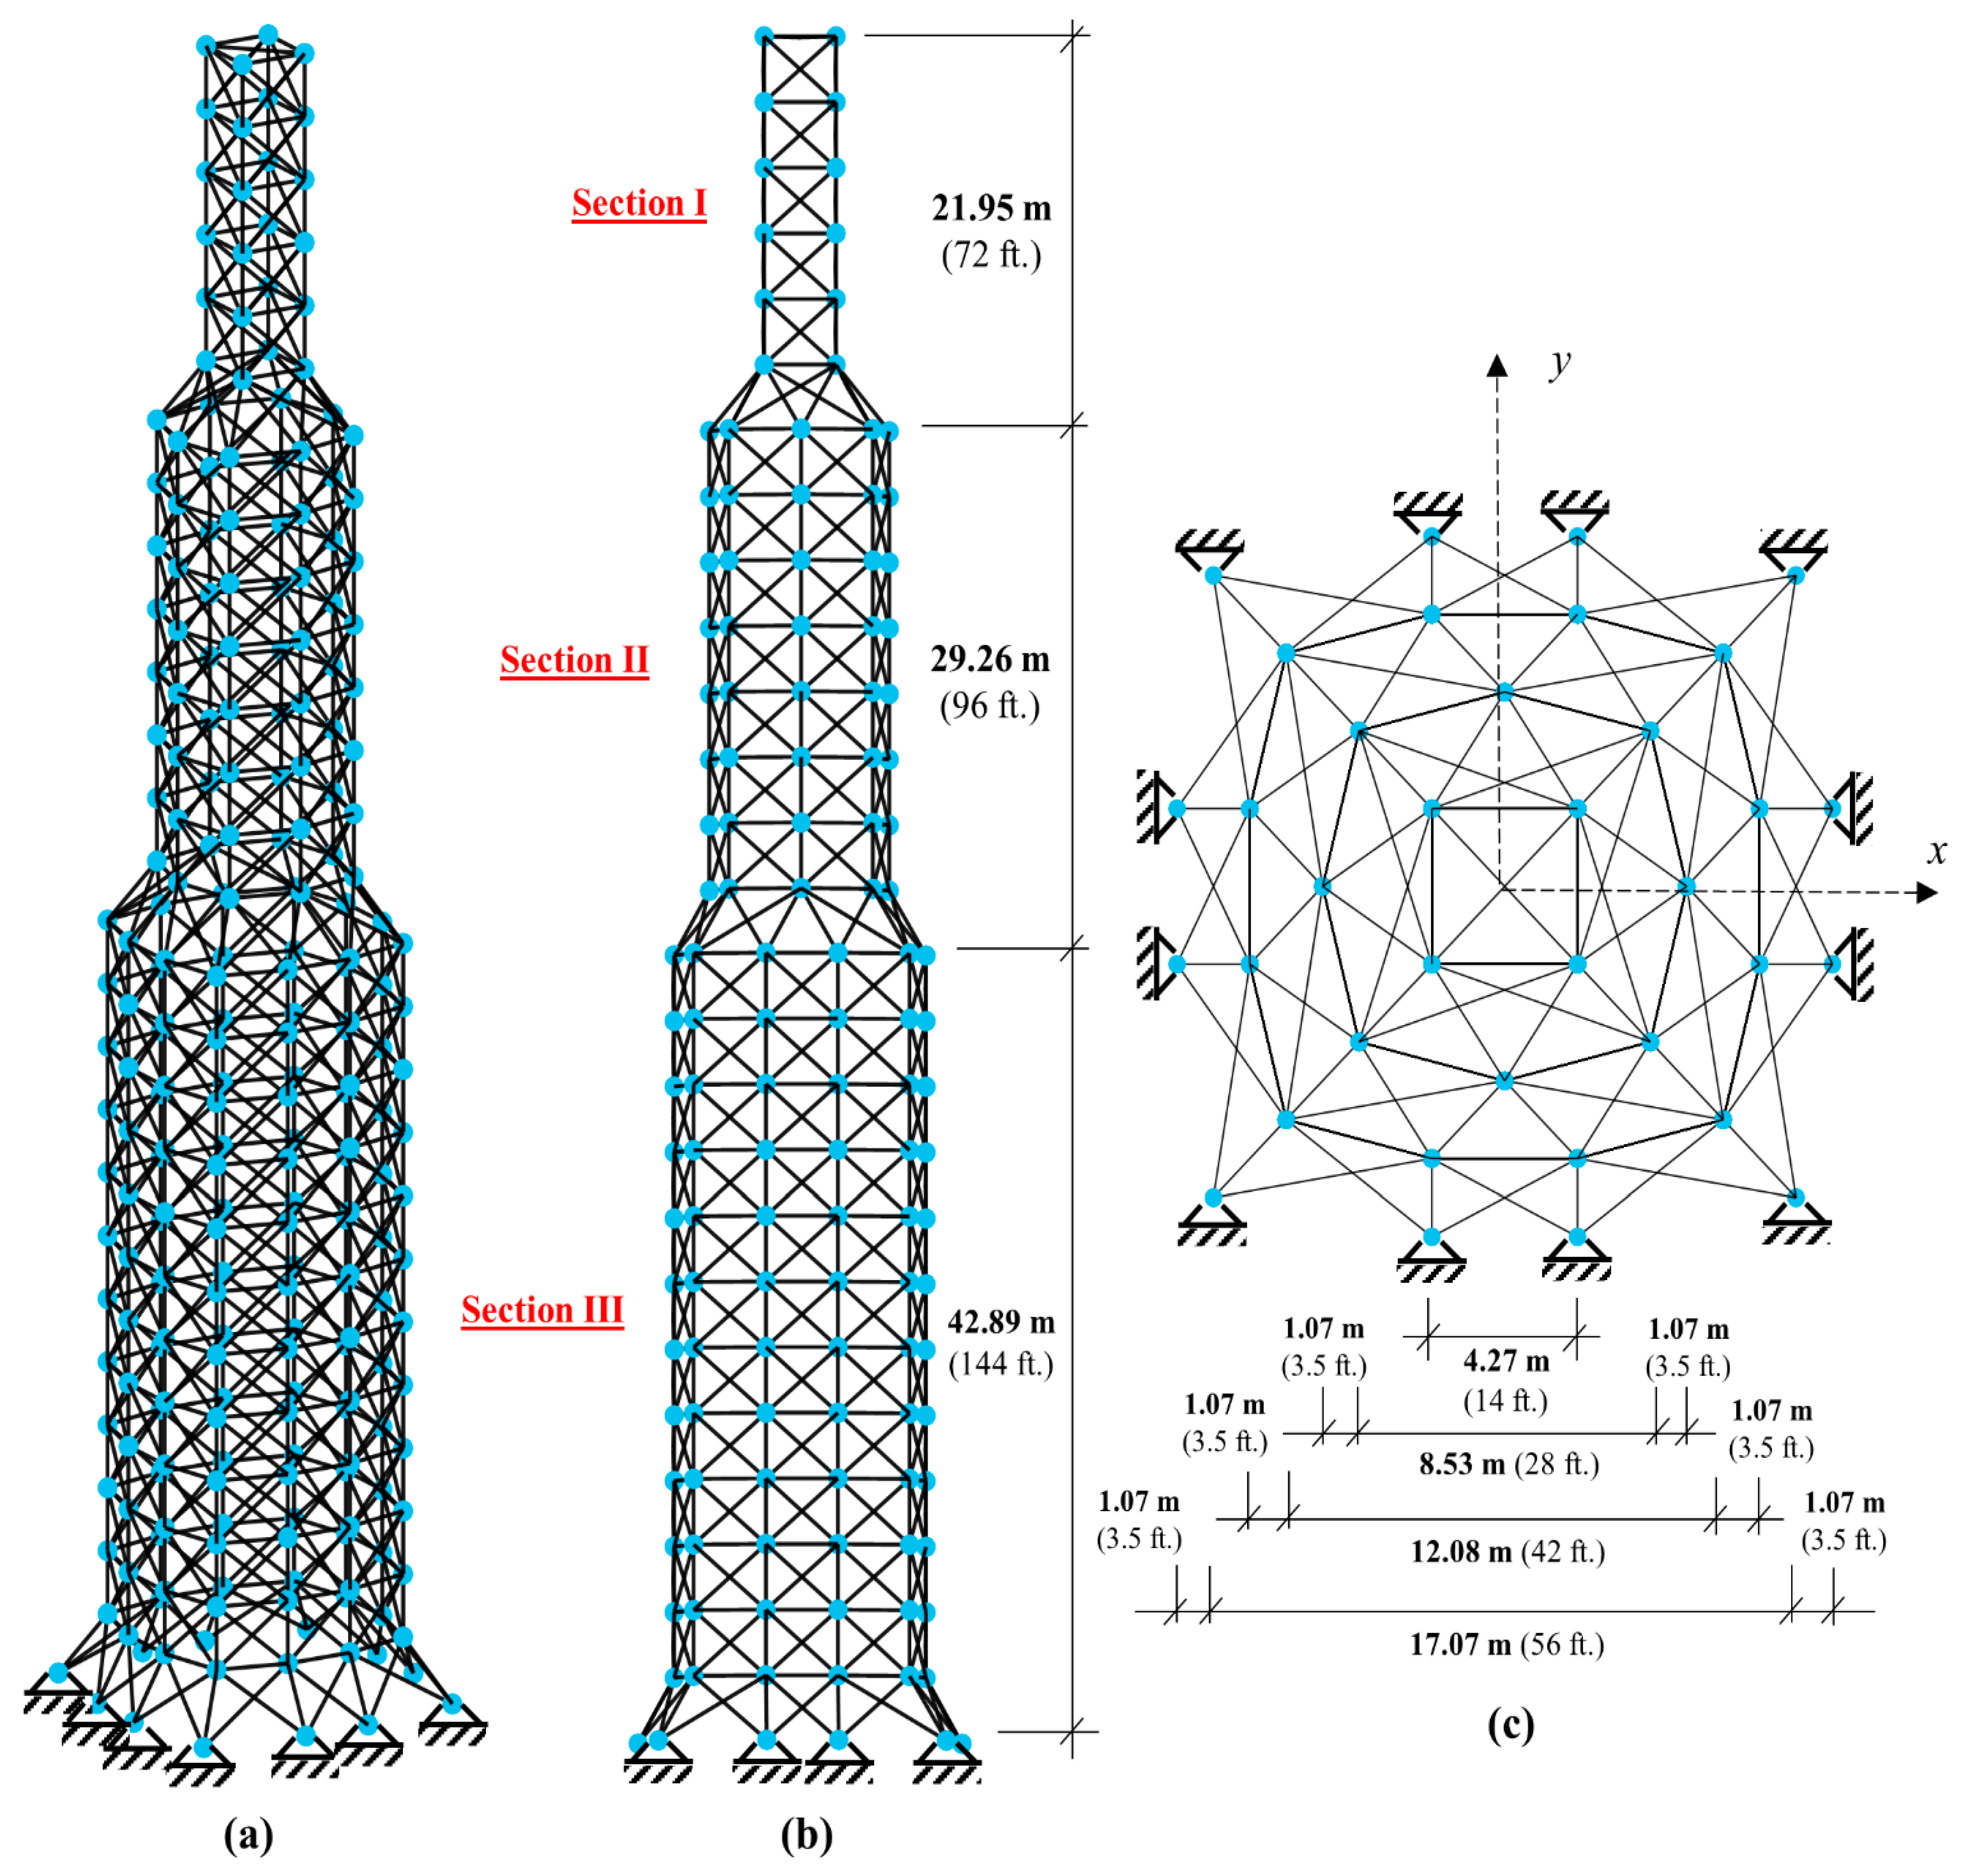
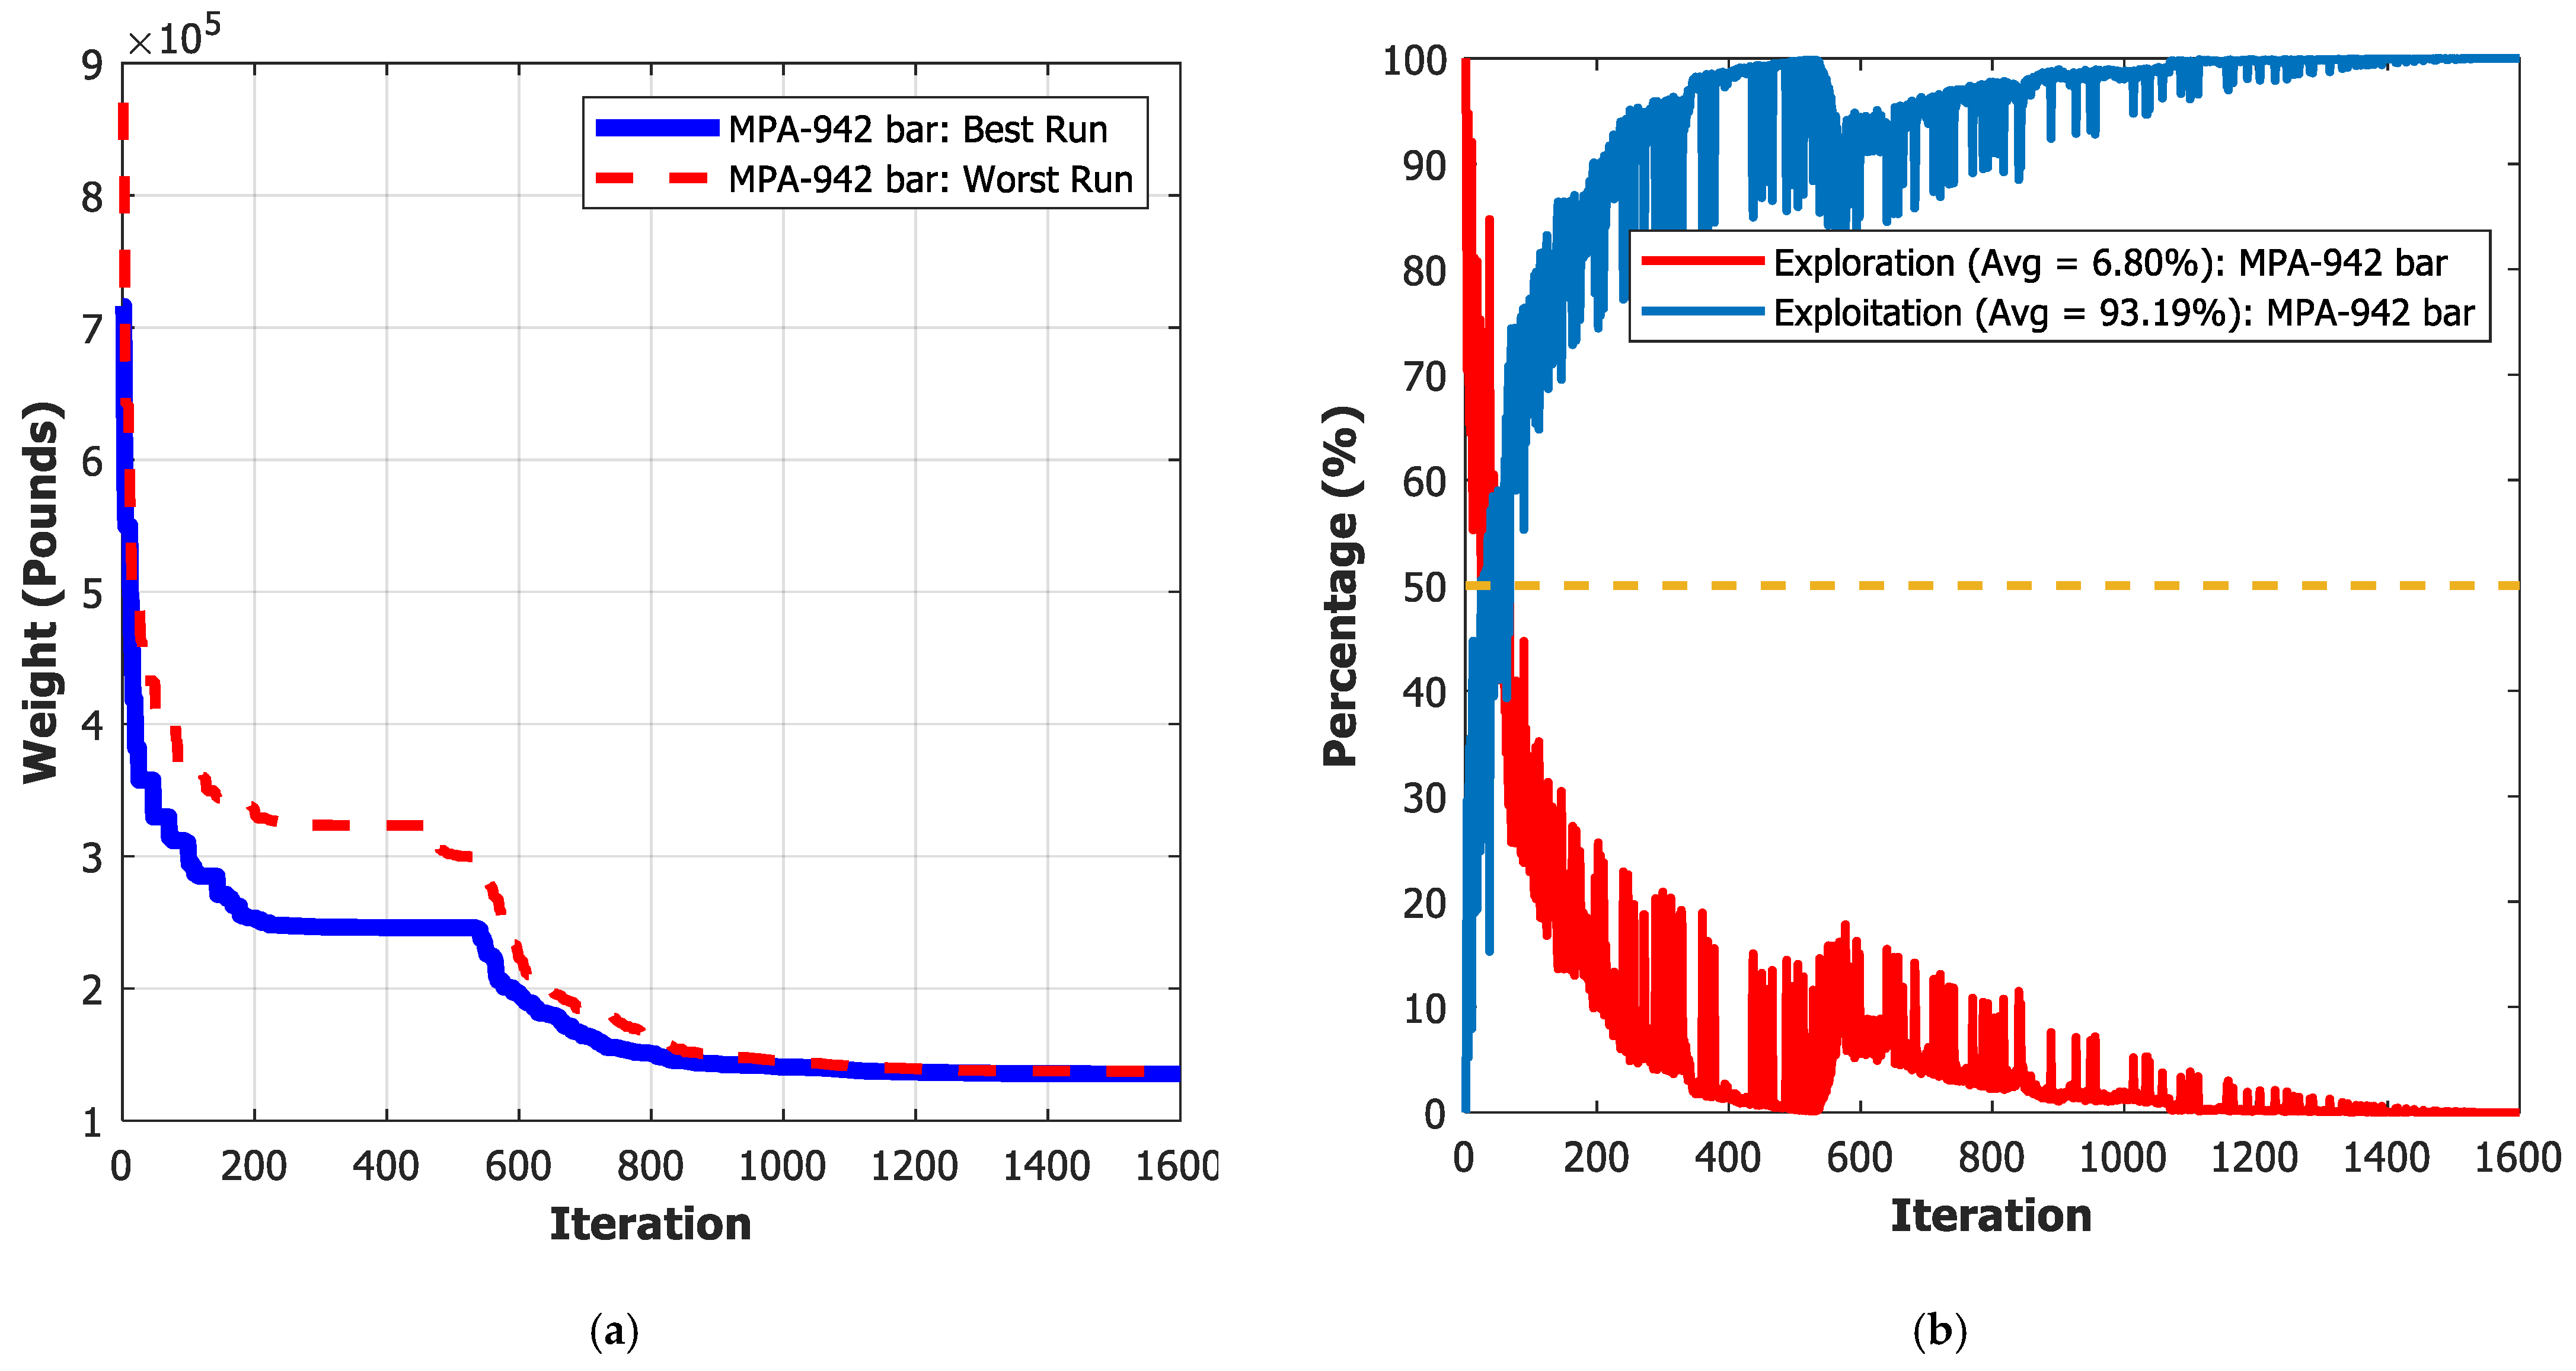
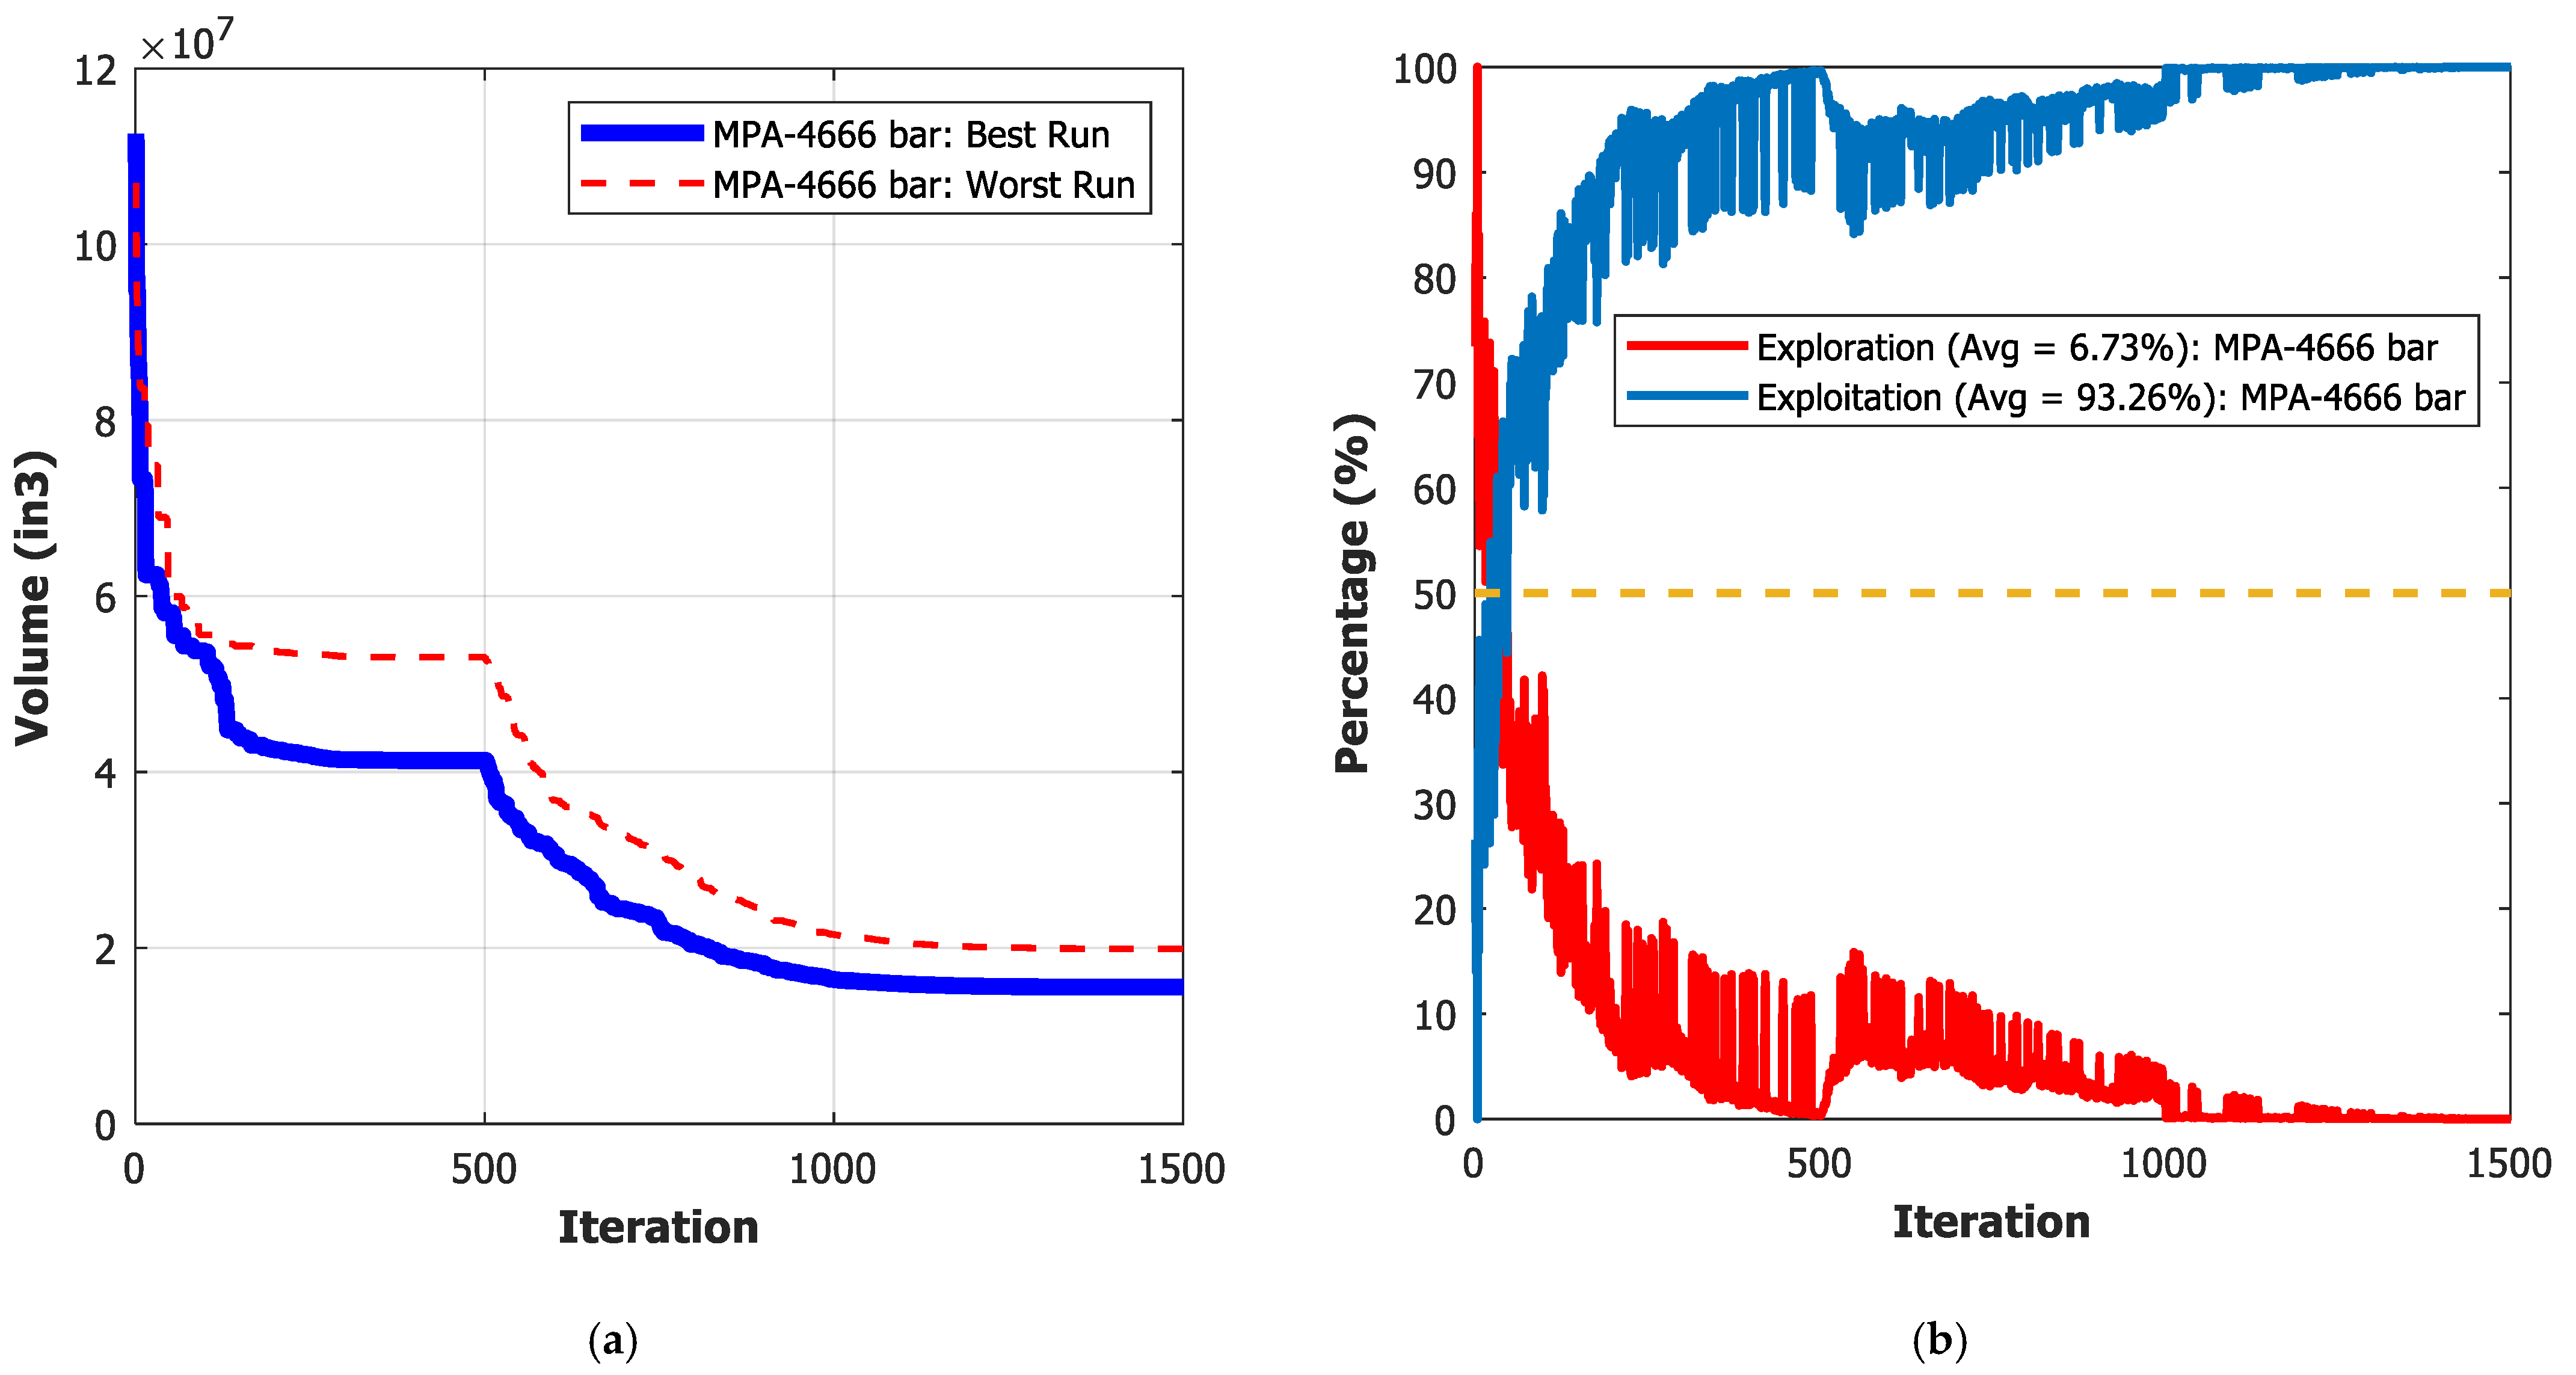
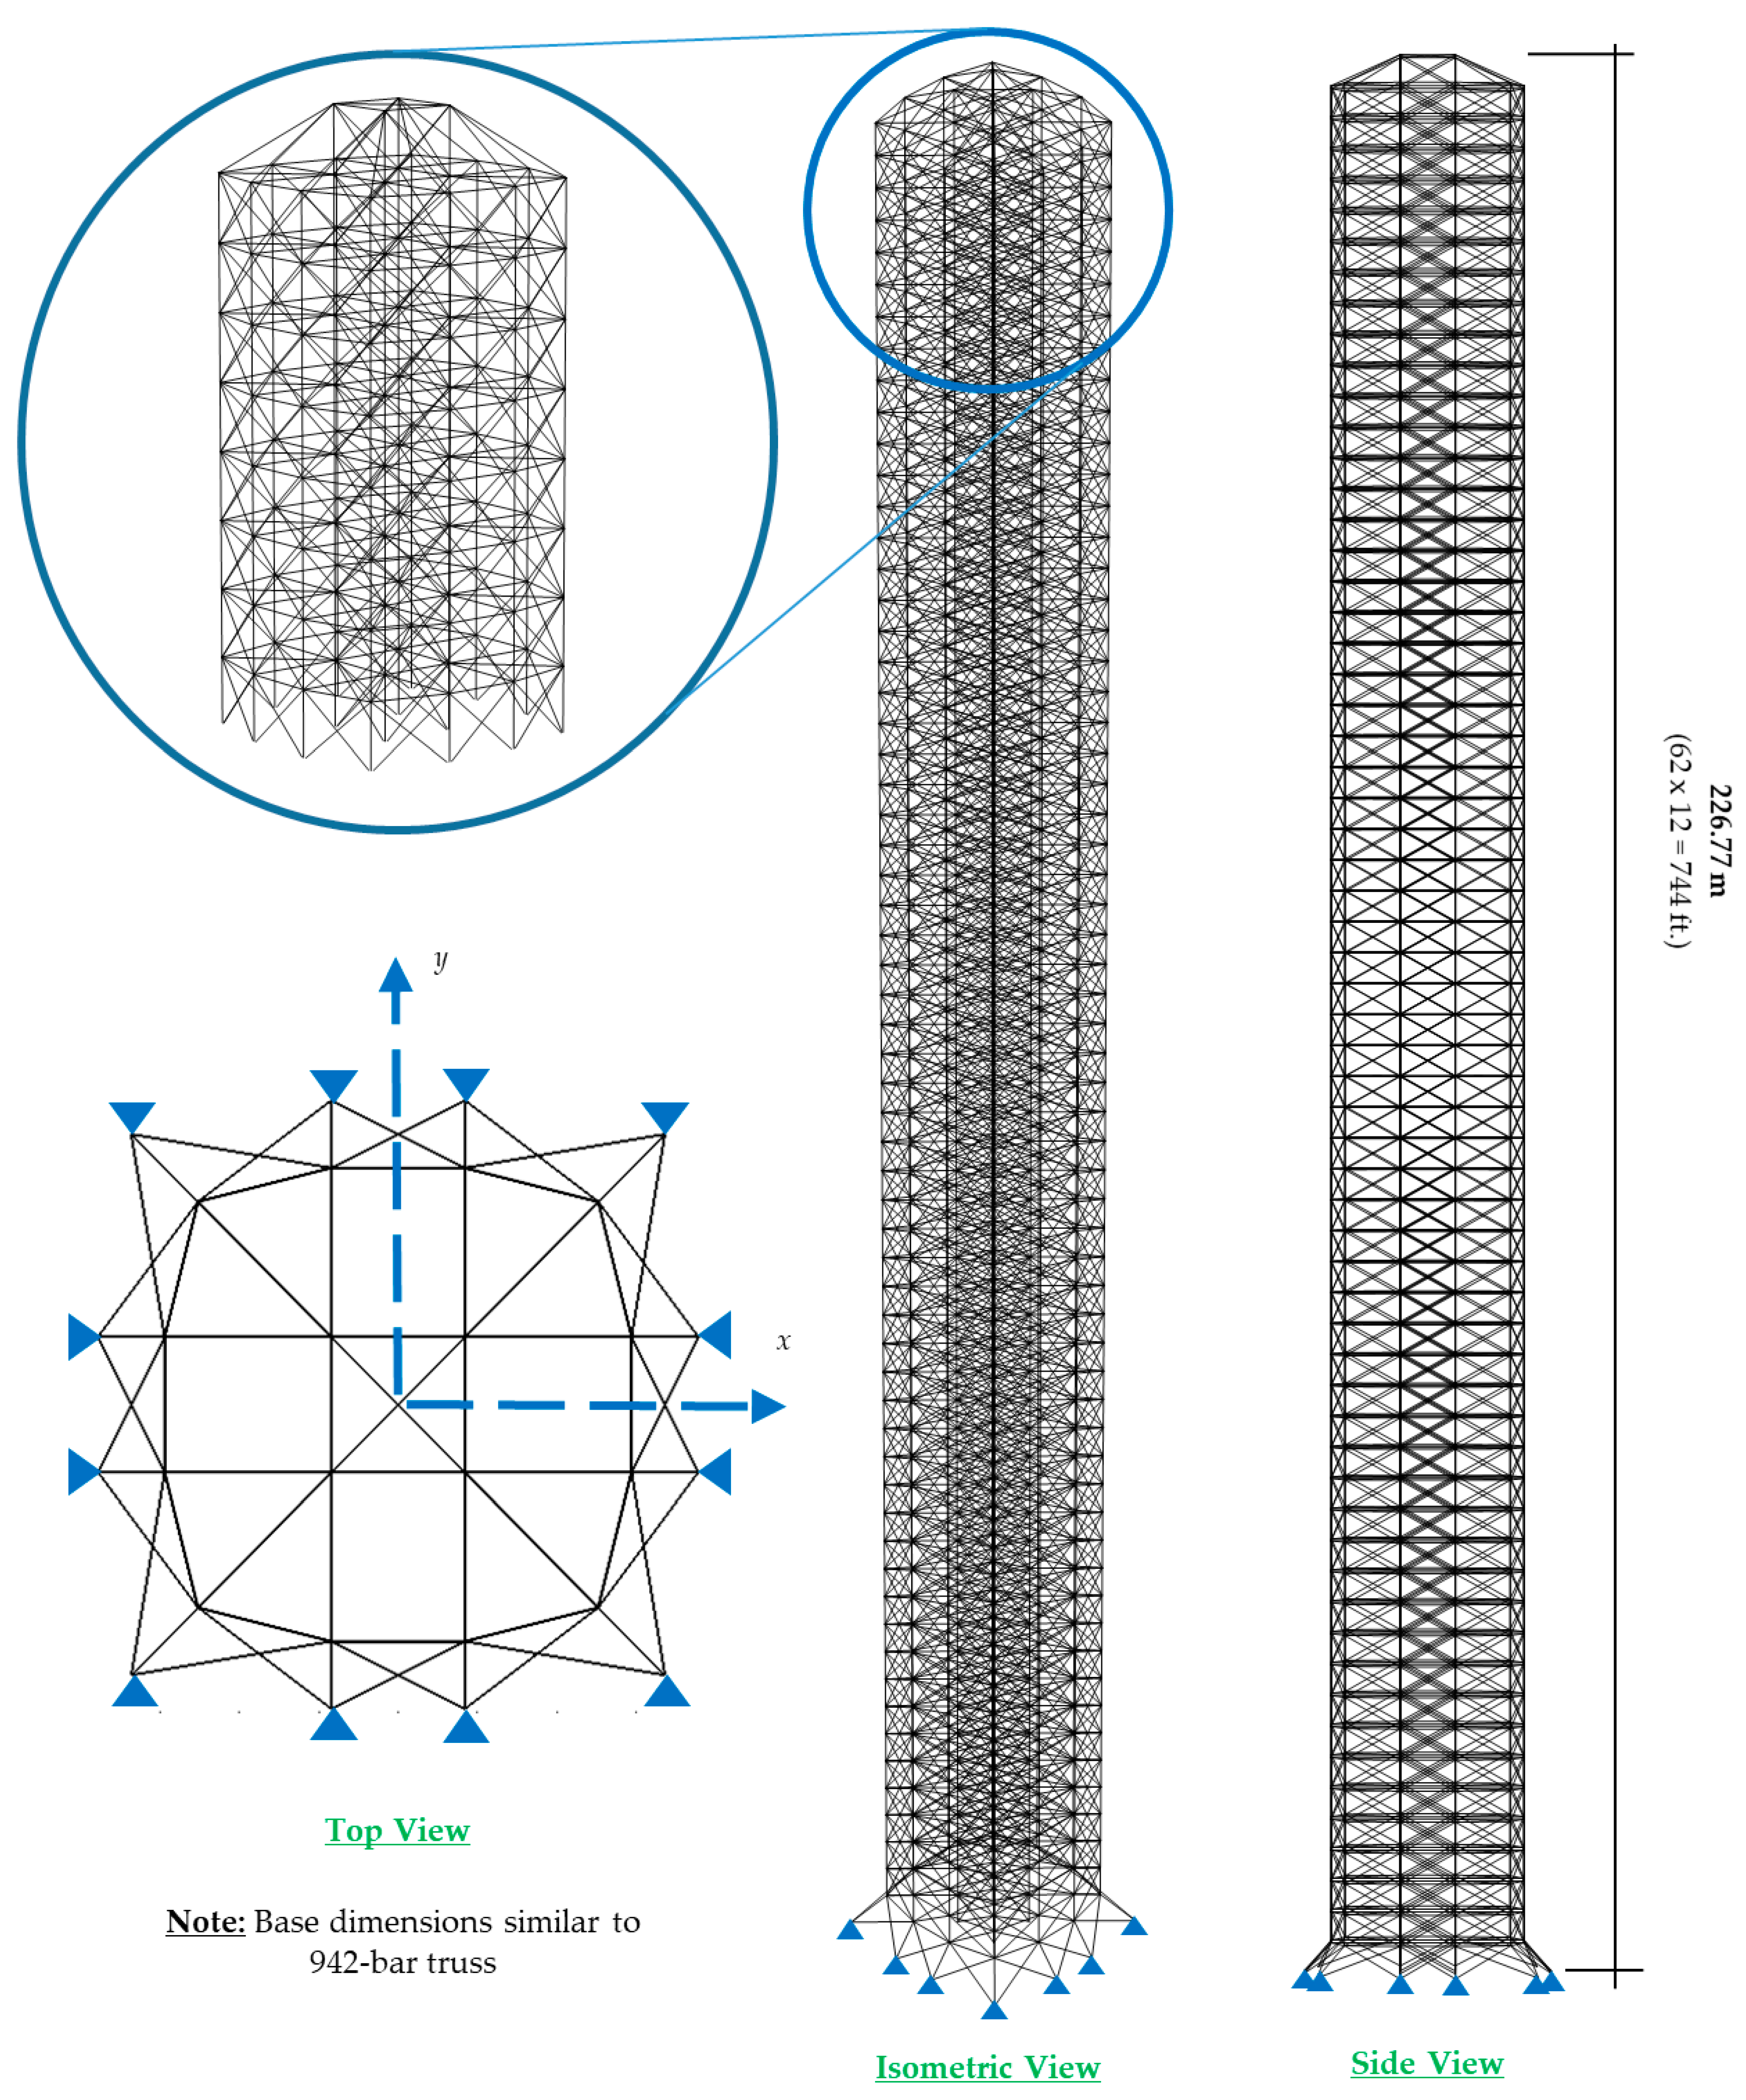