Article

An Improved Multilabel k-Nearest Neighbor Algorithm Based on Value and Weight

1
College of Information Engineering, Zhejiang University of Technology, Hangzhou 323000, China
2
College of Engineering, Lishui University, Lishui 323000, China
*
Author to whom correspondence should be addressed.
Computation 2023, 11(2), 32; https://doi.org/10.3390/computation11020032
Submission received: 28 December 2022 / Revised: 7 February 2023 / Accepted: 10 February 2023 / Published: 13 February 2023
(This article belongs to the Special Issue Intelligent Computing, Modeling and its Applications)

Abstract

:
Multilabel data share important features, including label imbalance, which has a significant influence on the performance of classifiers. Because of this problem, a widely used multilabel classification algorithm, the multilabel k-nearest neighbor (ML-kNN) algorithm, has poor performance on imbalanced multilabel data. To address this problem, this study proposes an improved ML-kNN algorithm based on value and weight. In this improved algorithm, labels are divided into minority and majority, and different strategies are adopted for different labels. By considering the label of latent information carried by the nearest neighbors, a value calculation method is proposed and used to directly classify majority labels. Additionally, to address the misclassification problem caused by a lack of nearest neighbor information for minority labels, weight calculation is proposed. The proposed weight calculation converts distance information with and without label sets in the nearest neighbors into weights. The experimental results on multilabel datasets from different benchmarks demonstrate the performance of the algorithm, especially for datasets with high imbalance. Different evaluation metrics show that the results are improved by approximately 2–10%. The verified algorithm could be applied to a multilabel classification of various fields involving label imbalance, such as drug molecule identification, building identification, and text categorization.

1. Introduction

The task of classification is of great interest in machine learning research. Conventional classification is dominated by binary and multiclass classifications wherein each instance is associated with one class in its label set. With the advent of the big data era, an increasing number of multilabel tasks emerge, and multilabel classification has gained increasing attention in recent years [1,2,3,4,5,6,7]. Conventional binary and multiclass classifications are fundamentally different from multilabel classifications because, in the latter, each instance is associated with a group of labels. For instance, in the case of drug target prediction, targets can correspond to multiple drug molecules as each drug molecule can correspond to multiple targets [8]. However, a multilabel classification problem exists in the fields of text categorization [9,10], disease diagnosis [11], and image recognition [12], among others [13]. Generally, multilabel data impair the classification performance compared with the data of multiclass classification [14,15].
Multilabel classification can be divided into two approaches according to different processing strategies [16]. These approaches are the problem transformation algorithm (represented by label power (LP) [17] and binary relevance (BR) [18]) and the algorithm adaptive method (represented by ranking support vector machine [19] and multilabel k-nearest neighbor (ML-kNN) algorithm [20]). The problem transformation algorithm aims to convert multilabel classification into single-label classification through stacking classifiers, and the classification result depends on the classifier’s design. However, in the problem transformation algorithm, the size of the classifier dramatically increases, but the classifier performance decreases when classifiers process the increasing amount and complexity of data. The algorithm adaptive method adjusts existing multiclass classification algorithms to address the multilabel classification problem and can flexibly perform multilabel classification [21]. Thus, the algorithm adaptive method has recently received considerable attention.
In multilabel problems, a class with a larger number of instances could be defined as a majority class, corresponding to the majority label. In contrast, a class with a smaller number of instances could be defined as a minority class, corresponding to the minority label [22]. In multilabel data, an imbalance often occurs between the minority and majority labels. Therefore, multilabel classification algorithms face a challenge in that existing methods cannot be directly used as a solution to address an imbalanced problem in multilabel classification. When classifying a test instance with a minority label, most of its nearest neighbors may be unlabeled, and the classification will give the test instance a negative bias. Hence, the overall performance of the classification is affected. As a widely used algorithm, ML-kNN has many improved algorithms. However, existing ML-kNN-based algorithms have poor classification performance when classifying imbalanced multilabel datasets, and the results tend to become a majority label in multilabel classification. Therefore, the classifier should be redesigned to be able to classify imbalanced data.
In this paper, an improved ML-kNN algorithm is proposed on the basis of value and weight (hereafter called VWML-kNN) to address the imbalanced multilabel problem. The proposed algorithm divides labels into majority and minority labels and uses different classification strategies for different labels. Unlike conventional ML-kNN-based methods, the value of an instance in VWML-kNN is obtained by comprehensively considering the label distribution of nearest neighbors and the classification of majority labels by computing a new maximum a posteriori (MAP) from the obtained values. Then, VWML-kNN calculates the distances between labeled and unlabeled nearest neighbors and converts these distances into different weights. Finally, the weight and new MAP are combined to classify minority labels. The experimental results on multilabel datasets from different benchmarks show that their performances are improved by the VWML-kNN, especially for datasets with high imbalance.

2. Related Work

This section outlines the development of multilabel classification methods, especially ML-kNN-based methods.
Godbole et al. [17] proposed a problem transformation algorithm called LP. Specifically, LP converts a multilabel dataset into a new multiclass dataset, regarding each distinct label combination (or label set) as a class. It can improve classification accuracy but may exacerbate the label imbalance problem, resulting in overfitting. An effective multilabel classification method, called ML-kNN, was proposed by Zhang et al. [20]. ML-kNN assumes that the final classification results of the data with similar characteristics are also related to the label of instances with similar characteristics. It is the first lazy learning method based on a conventional kNN method that considers the label selection information of the k-nearest neighbors (kNN) of one instance. It also uses the highest MAP to adaptively adjust the decision boundary for each new instance. However, most multilabel classifiers perform poorly in minority-class classification problems in imbalanced datasets. Younes et al. [23] proposed a generalization of an ML-kNN algorithm called DML-kNN. Unlike ML-kNN, DML-kNN considers the dependencies between labels and accounts for all labels in the neighborhood rather than the assigned nearest neighbor label to calculate the MAP. Cheng et al. [24] proposed a multilabel classification method called instance-based learning and logistic regression (IBLR) based on label correlation and dependency. Moreover, in IBLR, interdependencies between labels can be captured, and model- and similarity-based inferences for multilabel classification can be combined. An MLCWkNN algorithm is proposed in [25] based on the Bayesian theorem. The linear weighted sum of the kNN is calculated using the least squares error to determine the approximate query instance. The weight is adaptively determined by quadratic programming. IMLLA, proposed by Zhang et al. [26], is a new multilabel lazy learning approach. It first identifies neighbor instances in each possible label in the training set for each test data. Finally, the classifier classifies a label counting vector, which is generated from neighboring instances. Reyes et al. [27] proposed a filter-based feature weighting lazy algorithm to enhance the performance of multilabel classification. In this algorithm, weights can be optimized by heuristic learning. Zeng et al. [28] proposed an improved ML-kNN algorithm by fusing nearest neighbor classification. On the basis of the ML-kNN algorithm, the influence of nearest and k neighbors of unclassified instances is considered in this algorithm. Vluymans et al. [29] proposed a new nearest neighbor-based multilabel method. A fuzzy rough set theory is adopted to construct a new nearest neighbor label set, which summarizes the information included in the label sets of neighbors. Wang et al. [30] proposed a locally adaptive ML-kNN (LAML-kNN) method to address the local difference of instances. LAML-kNN considers local differences to modify a posterior probability expression to adjust the decision boundary.
Multi-label data are generally imbalanced. However, the above algorithms do not consider the impact of this imbalance when classifying data, resulting in poor classification performance on the multilabel data.

3. Methods

This section introduces the measurement indicators for evaluating the degree of multilabel imbalanced data and explains the proposed VWML-kNN algorithm. Then, the evaluation metrics and datasets of the experiments are discussed.

3.1. Related Definitions

In the area of multilabel imbalanced problems, the imbalance ratio per label (IR) and mean imbalance ratio (MeanIR) are regarded as measurement indicators to distinguish whether a label is a majority or a minority [31].
Let multilabel dataset D = {(Xi, Li) | 0 ≤ i ≤ n, LiY}, where Xi and Li represent the i-th instance of the dataset and the label set of Xi, respectively. Here, Y represents the label set of the dataset:
h ( y ,   L i ) = { 1 , y L i 0 , y L i
Then, the IR can be defined as
IR ( y ) = arg max y = Y 1 Y | Y | ( i = 1 | D | h ( y , L i ) ) i = 1 | D | h ( y , L i )
The average level of the imbalance in the dataset is defined as MeanIR, which also represents the mean of all labels’ IR and can be calculated as
MeanIR = 1 | Y | y = Y 1 Y | Y | ( I R ( y ) )
According to IR and MeanIR, majority and minority labels can be defined as follows: when the IR of y is lower than the MeanIR, y is defined as a majority label; otherwise, it is defined as a minority label.

3.2. Proposed Algorithm

The VWML-kNN algorithm can be divided into two phases: value calculation and weight conversion.
Let a multilabel dataset D = {(x1, Y1), (x2, Y2), …, (xm, Yq)}, where D can be divided into instance set X and label set Y. For instance xi, Yi is the label set of xi, yijYi, yij ∈ {1, 0}. If the value of Yij is 1, it implies that xi contains label j and the kNNs of xi are N(xi). Therefore, the number of the nearest neighbors of xi with or without label j can be counted in advance, as expressed in Equation (4).
C j ( x ) = x i N ( x ) ( y j ( x i ) )
where the value of yj(x) can be 1 or 0.
The prior probability in Equations (5) and (6) can be evaluated from the training data:
P ( y j = 1 ) = s + i = 1 m y j ( x j ) s 2 + m
P ( C j ( x i ) | y j = 0 ) = s + κ j [ r ] s × ( K + 1 ) + r = 0 K κ j [ r ]
where s is the smoothing factor and is generally regarded as 1.
In ML-kNN, the calculation formulas of the MAP are expressed in Equations (7) and (8):
P ( C j ( x i ) | y j = 1 ) = s + κ j [ r ] s × ( K + 1 ) + r = 0 K κ j [ r ]
P ( C j ( x i ) | y i = 0 ) = s + κ j [ r ] s × ( K + 1 ) + r = 0 K κ j [ r ]
In Equation (9), kj[r] calculates the number of training data with label j and r nearest neighbors with yi. In Equation (10), kj[r] calculates the number of training data without label j and r nearest neighbors with yi. The initial value of kj[r] and kj[r] is 0, and the maximum value of kj[r] and kj[r] is K:
κ j [ r ] = i = 1 m y i Y i · C j ( x ) = r ( 0 r k )
In practical applications, due to the imbalanced characteristics of data, few nearest neighbors exist with minority label y of the test instance with minority label y, which may lead to misclassification. Therefore, this paper proposes a value calculation that uses a value to calculate the MAP so that the classifier can focus on minority labels, improving its performance.
Value calculation: hj[z] calculates the value of training data with label j and z nearest neighbors with j. In the training datasets, if a training instance has label j and z nearest neighbors with j, then hj[z] = hj[z] + 1 and h’j[z] = h’j[z] −1. If a training instance does not have label j and has z nearest neighbors with j, then h’j[z] = h’j[z] + 1 and hj[z] = hj[z] − 1. The initial values of both hj[z] and h’j[z] are 0. When the calculated value of hj[z] or h’j[z] is less than 0, the value of hj[z] or hj[z] is set to 0. Therefore, we use hj[z] and hj[z], rather than kj[r] and kj[r], to calculate the MAP, as expressed in Equation (8).
P ( C j ( x i ) | y j = 1 ) = s + h j [ z ] s × ( K + 1 ) + r = 0 K h j [ z ]
P ( C j ( x i ) | y j = 0 ) = s + h j [ z ] s × ( K + 1 ) + r = 0 K h j [ z ]
The majority of labels have enough prior information about whether the test instance contains label y can be directly determined by the new MAP. The minority labels require additional information to classify the test instance because of insufficient prior information. During the classification, we adopt different strategies for majority and minority labels. For each nearest neighbor instance of the test instances, the closer the distance of the neighbor instance, the greater the similarity. We proposed a weight conversion strategy based on this theory.
Weight transform: first, the nearest neighbors of the test instance are divided into ConSet and NconSet whether they have label y or not. Specifically, ConSet contains the nearest neighbors that have the label y, whereas NconSet contains the nearest neighbors without the label y. Furthermore, the distance between the set and test instance is calculated. To convert the distance into a weight, an appropriate function should be selected. Through experiments, the Gaussian function was found to be a suitable weight transform function. In the Gaussian function, the change rate of the weight is gradual. During the conversion, the weight will not become that large when the distance is quite small, while the weight will not become 0 when the distance is large. The Gaussian function is defined as follows:
w = a × e ( s , d ) 2 2 b 2
where (s, d′) defines the distance between the set and the test instance, b represents the standard deviation, and a is generally regarded as 1.
Therefore, the decision function of the minority label can be obtained, as expressed in Equation (14):
y j ( x ) = arg max j { 0 , 1 } ( t K × w + ( 1 t K ) P ( y j ) P ( C j ( x i ) | y j ) )
If j = 1, this implies that the test instance contains minority label j. Otherwise, the test instance does not contain minority label j. Here, w represents the weight after distance conversion and t represents the proportion of weight in the decision function.
Substituting the weights into Equation (14) yields Equation (15):
y j ( x ) = arg max j { 0 , 1 } ( t K × a × e ( s , d ) 2 b 2 + ( 1 t K ) P ( y j ) P ( C j ( x ) | y j ) )
The pseudocode of Algorithm 1 of VWML-kNN is presented as follows.
Algorithm 1: VWML-kNN
Input: A multi-label dataset D, test instance x
1. For i = 1 to m do:
2. Identify k nearest neighbors N(xi) of xi
3. end for
4. For j = 1 to q do:
5. Calculate the IR and MeanIR according to Equations (1) and (3)
6. Estimate the prior probabilities P(yj= 1) and P(yj= 0) according to Equations (5) and (6)
7. If the label j of xi is 1 (yij = 1) and xi has z nearest neighbors containing label j
8. hj[z] = hj[z] + 1 and hj[z] = hj[z]−1
9. Else h’j[z] = hj[z] + 1 and hj[z] = hj[z]−1
10. end for
11. Identify k nearest neighbors N(x) of x
12. For j = 1 to q do:
13. Calculate Cj(x) according to Equation (4)
14. Calculate the hj[z] and h’j[z] of x according to step 7 to step 9
15. If j = = majority label, return y according to Equations (11) and (12)
16. If j = = minority label, calculate the distance (s, d′) between NconSet and x.
17. Convert distance to weight according to Equation (13)
18. Return y according to Equation (15)
19. end for
20. end
As shown in the pseudocode, from step 1 to step 10, prior information within the training dataset is calculated. In steps 12–14, the value of each unknown instance is obtained by calculating the label distribution of the nearest neighbors. In steps 16–17, when classifying the minority label, the weights between the unknown instance and different label sets of nearest neighbors are calculated. Finally, the test instance is classified using the new decision function.

3.3. Evaluation Metrics

Generally, the evaluation method of the performance of multilabel classifiers has three forms: example-, label-, and ranking-based methods [32]. Among them, the ranking-based evaluation method is the most suitable for evaluating the performance of different algorithms because it could better reflect the correct classification of majority and minority labels. Therefore, Hamming loss, ranking loss, and one error are selected as evaluation metrics to achieve an effective evaluation [33].
Hamming loss is the most popular multilabel evaluation metric and evaluates the number of times instances are misclassified. The smaller the metric value, the better the classification performance and the smaller the difference between the predicted results and the real label:
Hamming   loss = 1 m i = 1 m | Y i Δ Z i | | Y |
In Equation (9), m denotes the number of instances, Yi represents the predicted label set of unknown instance x, Zi represents the true label set of x, Y is the number of labels, and Δ represents the symmetric difference.
The ranking loss measures the average fraction of label pairs, which are reversely ordered for the instance. The lower the ranking loss, the better the performance of the classifiers:
Ranking   Loss = 1 m i = 1 m 1 | Y i |   | Y i ¯ | | { ( y 1 , y 2 ) | r a n k ( x i , y 1 ) r a n k ( x i , y 2 ) ,   ( y 1 , y 2 ) Y i × Y i ¯ } |
where Y i ¯ denotes the complementary set of Yi.
Finally, one error indicates the number of times a top-ranked label is not in the true label set:
One   error   ( f ) = 1 m i = 1 m g ( ( arg max f ( x i , y ) Y i )
g ( x ) = { 0 , y Y i 1 , y Y i

3.4. Datasets

In Table 1, three benchmark multilabel datasets of varying sizes and fields were selected as experimental datasets: Enron, Corel5k, and yeast [34]. Enron is a dataset based on rebels, including 500,000 real-world emails from 150 employees of Enron. This dataset has no labeling information but can be used for internal threat detection based on text and social network analysis. Corel5k contains a total of 5000 pictures collected by Corel, covering multiple themes such as dinosaurs, cars, beaches, etc. Yeast consists of micro-array expression data, as well as phylogenetic profiles of yeast.
The performance of the classifier is related to not only the number of labels but also the characteristics of the dataset [35]. To show the different characteristics of the dataset, Card, TCS [36], and Dens are introduced as the measurement of the datasets. Card indicates the mean number of labels for each instance and is defined in Equation (20); Dens measures the density of labels, defined in Equation (21); and TCS evaluates the complexity of the dataset and is defined in Equation (22). A larger value implies a higher complexity of the dataset, which increases the difficulty of the prediction of the correct classification result for the classifier:
Card ( D ) = 1 m i = 1 m | Y i | ,
Dens ( D ) = 1 q 1 m i = 1 m | Y i | ,
TCS ( D ) = log ( f × q × l s ) ,
where m and f represent the numbers of instances and input features, respectively. Furthermore, q and ls represent the numbers of labels and different label sets, respectively.

4. Results and Discussion

This section first investigates the optimal parameters of the VWML-kNN. Then, different multilabel classification algorithms are compared to demonstrate the effectiveness of VWML-kNN.

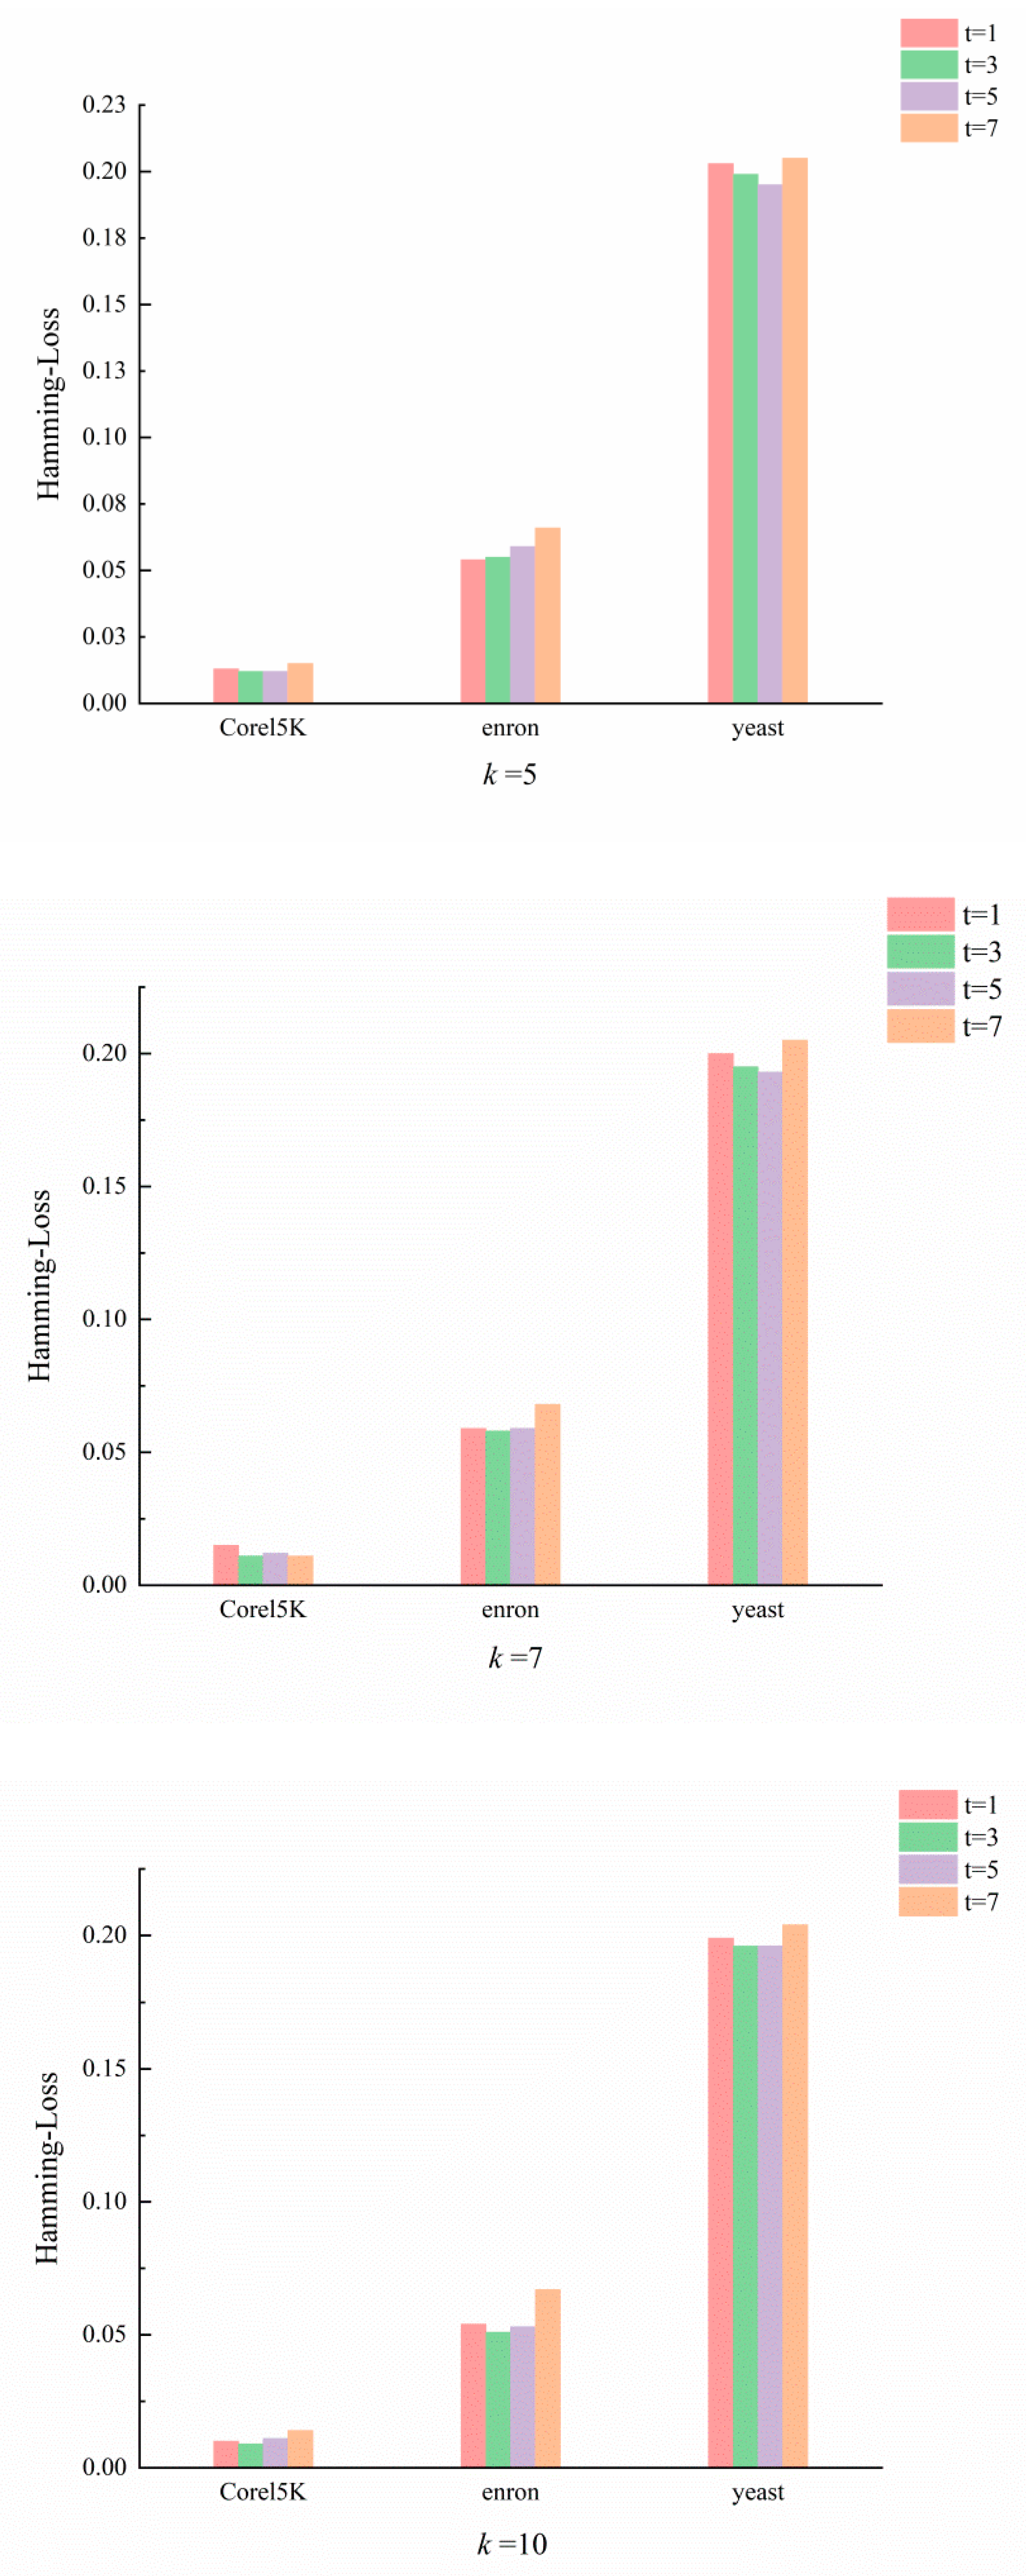
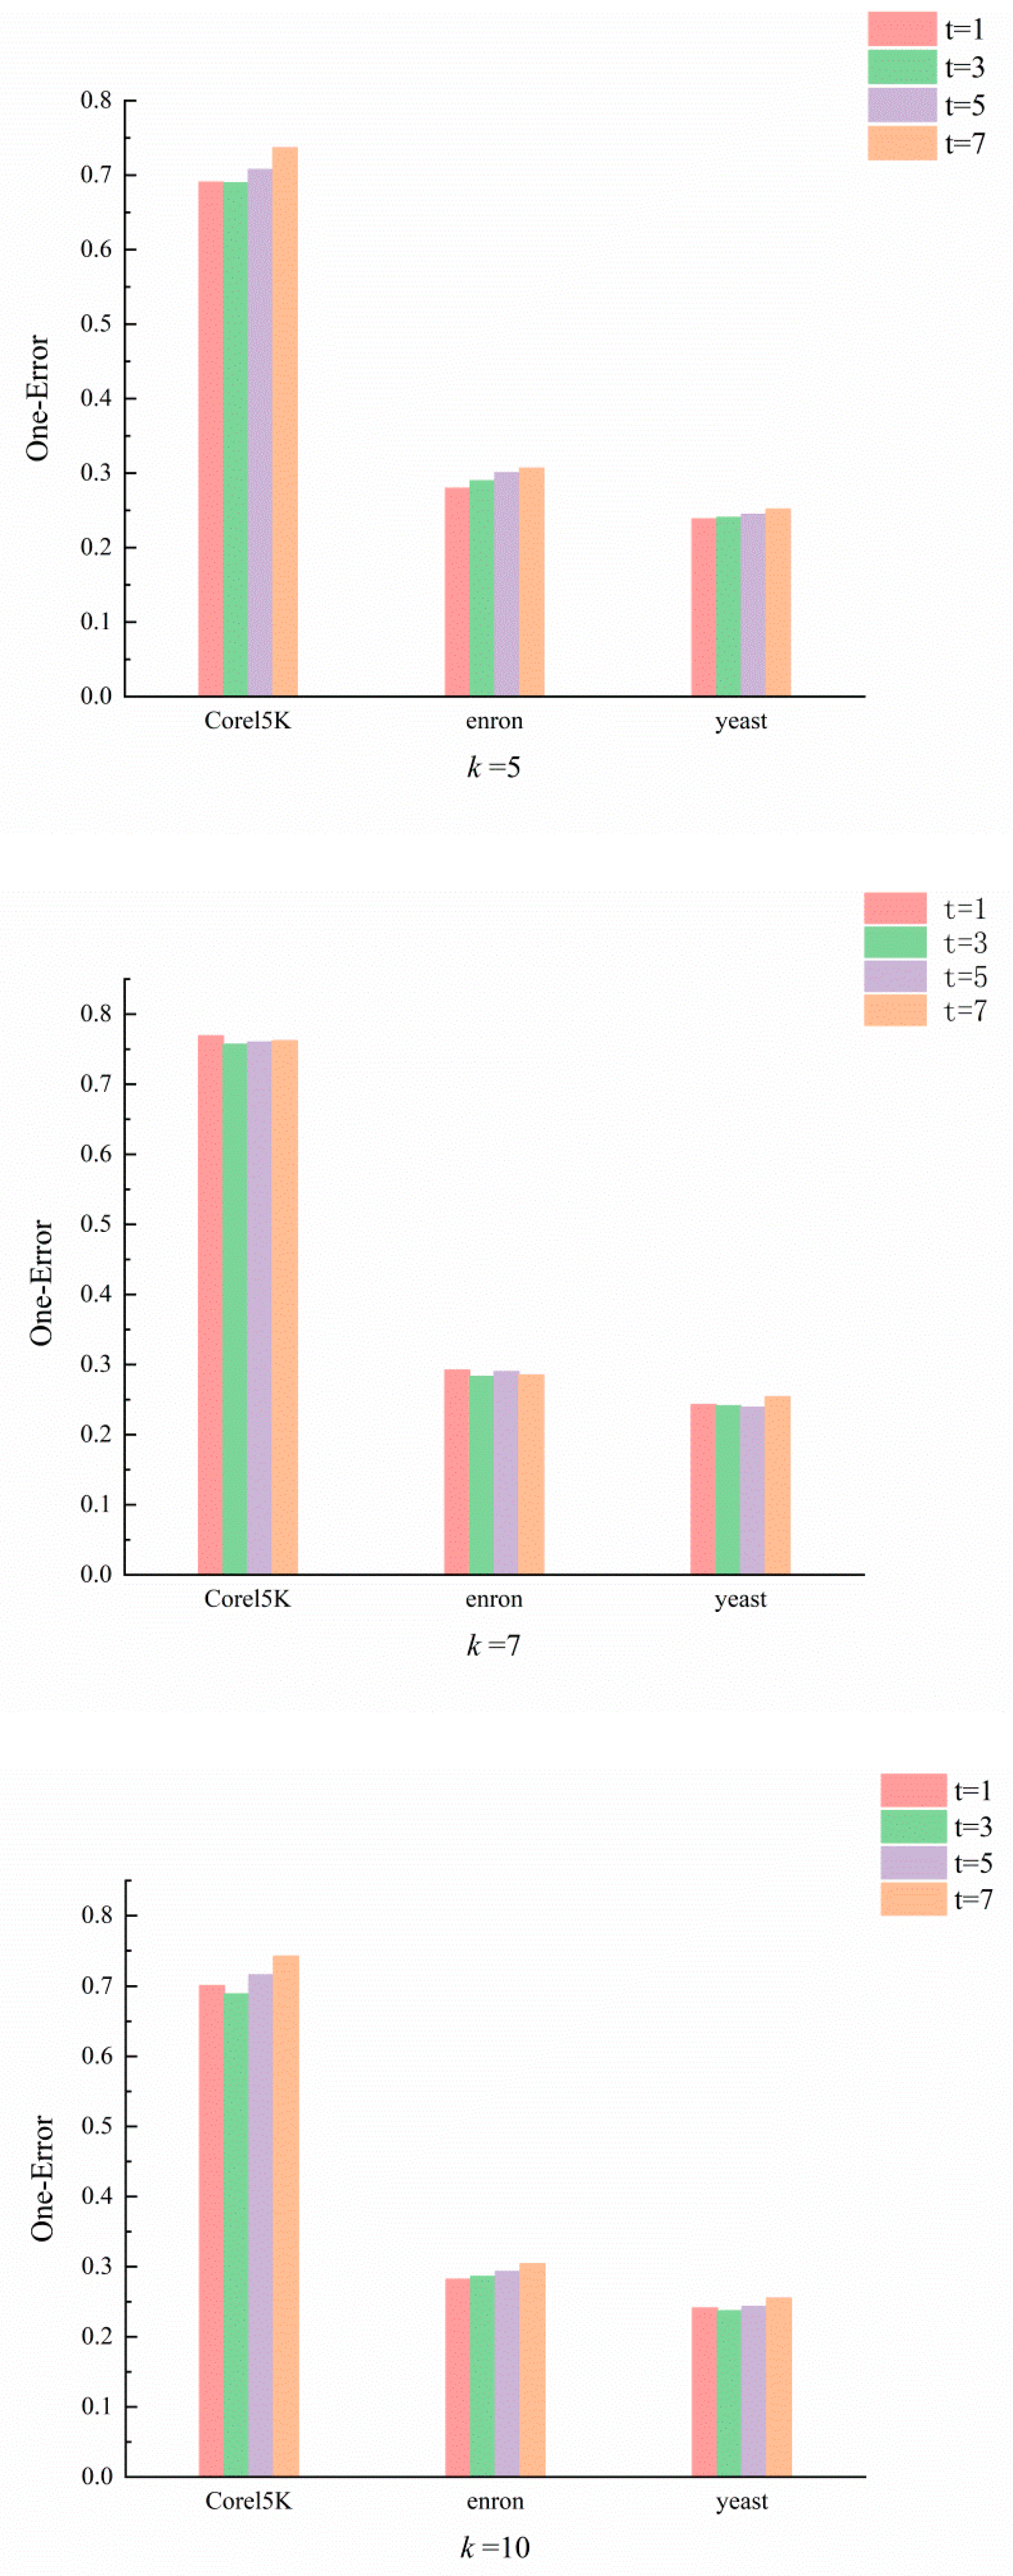
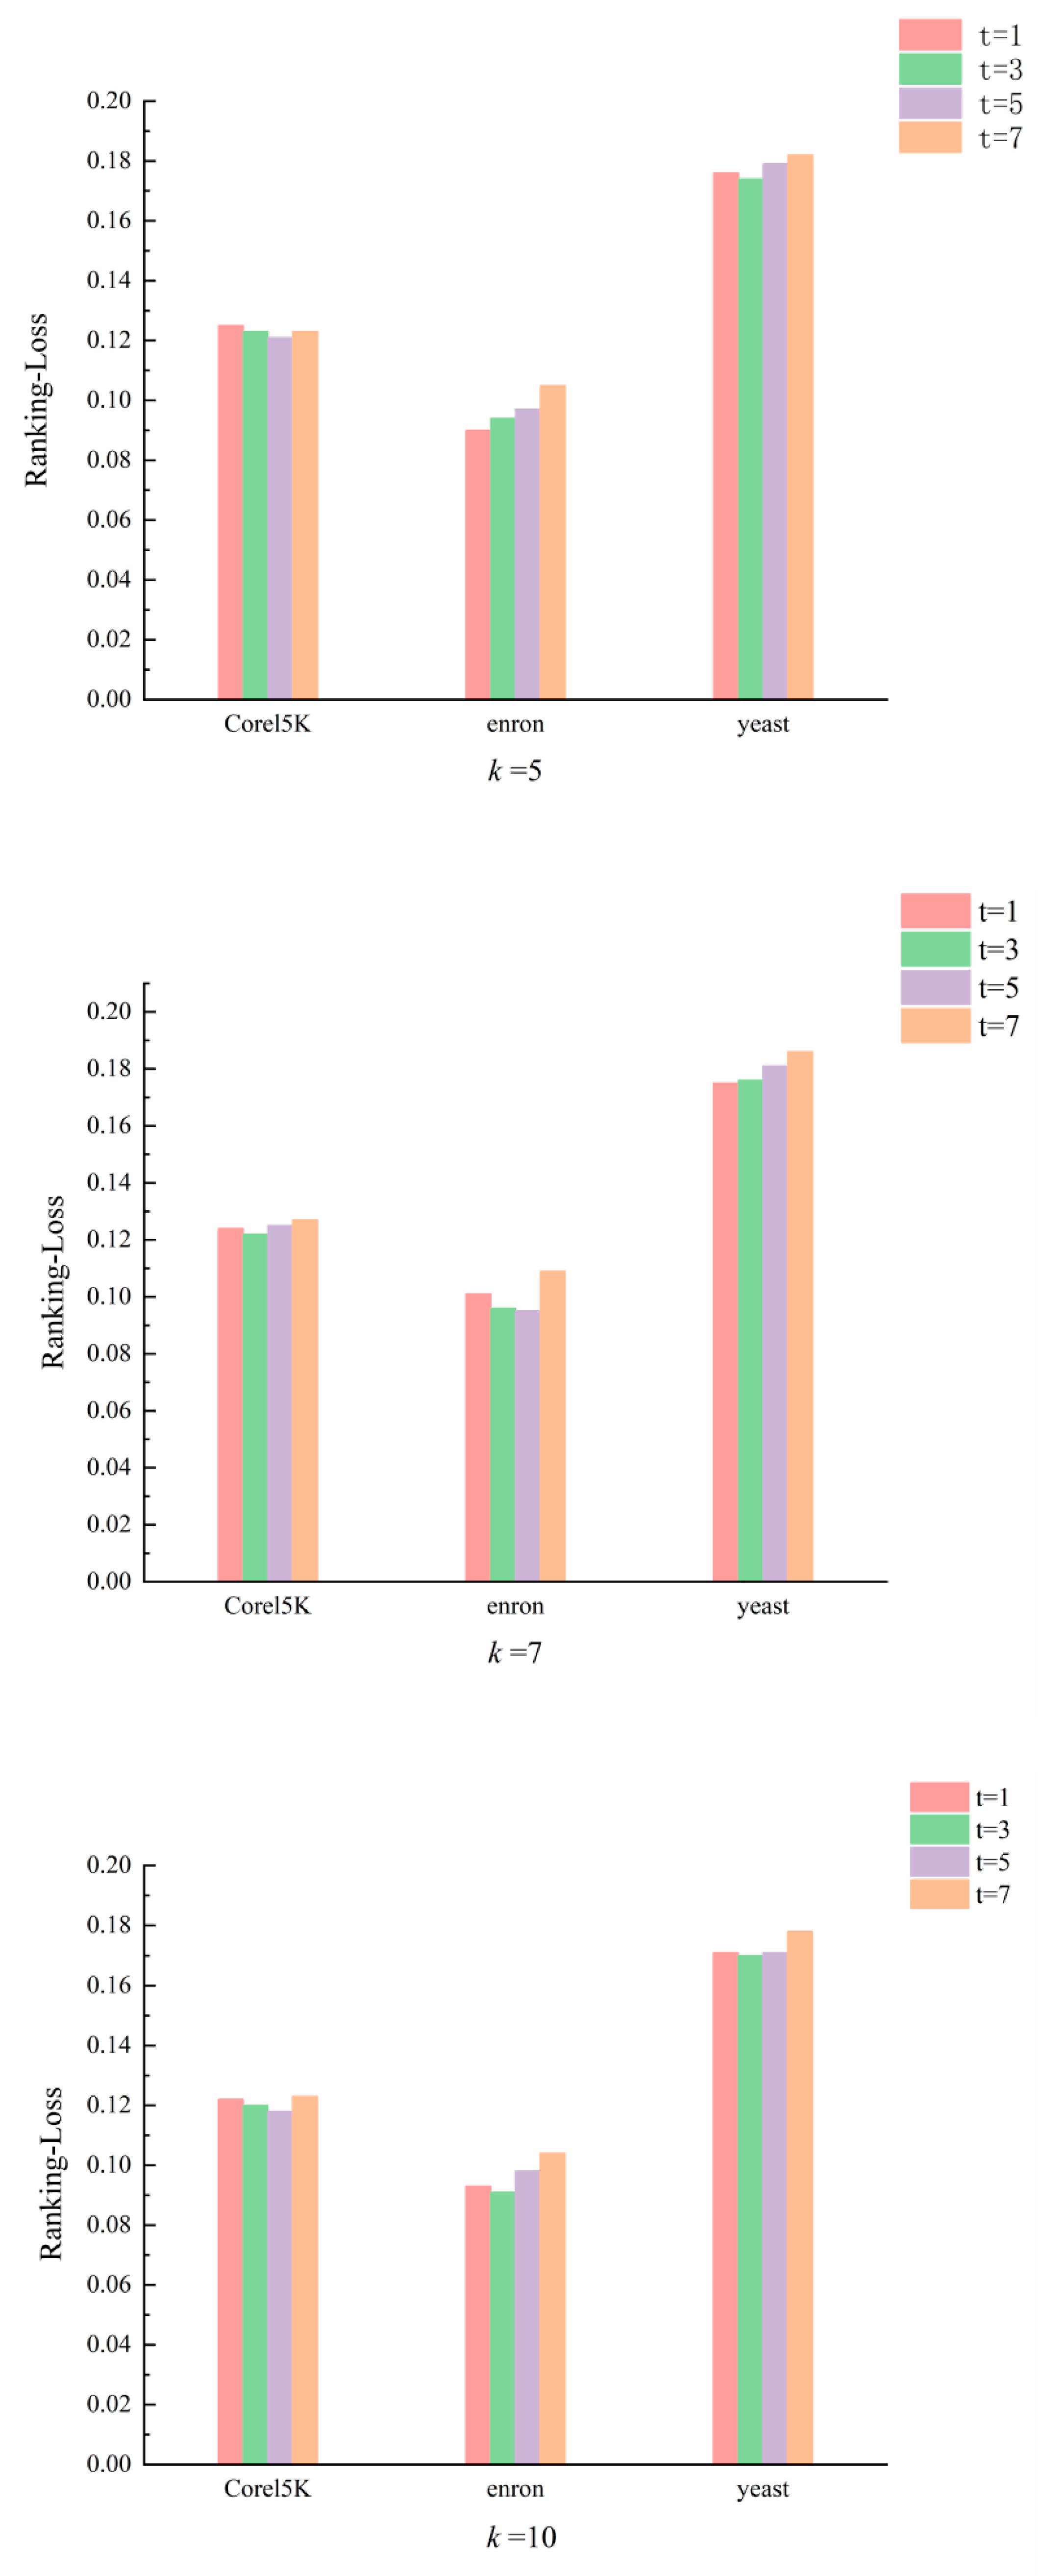
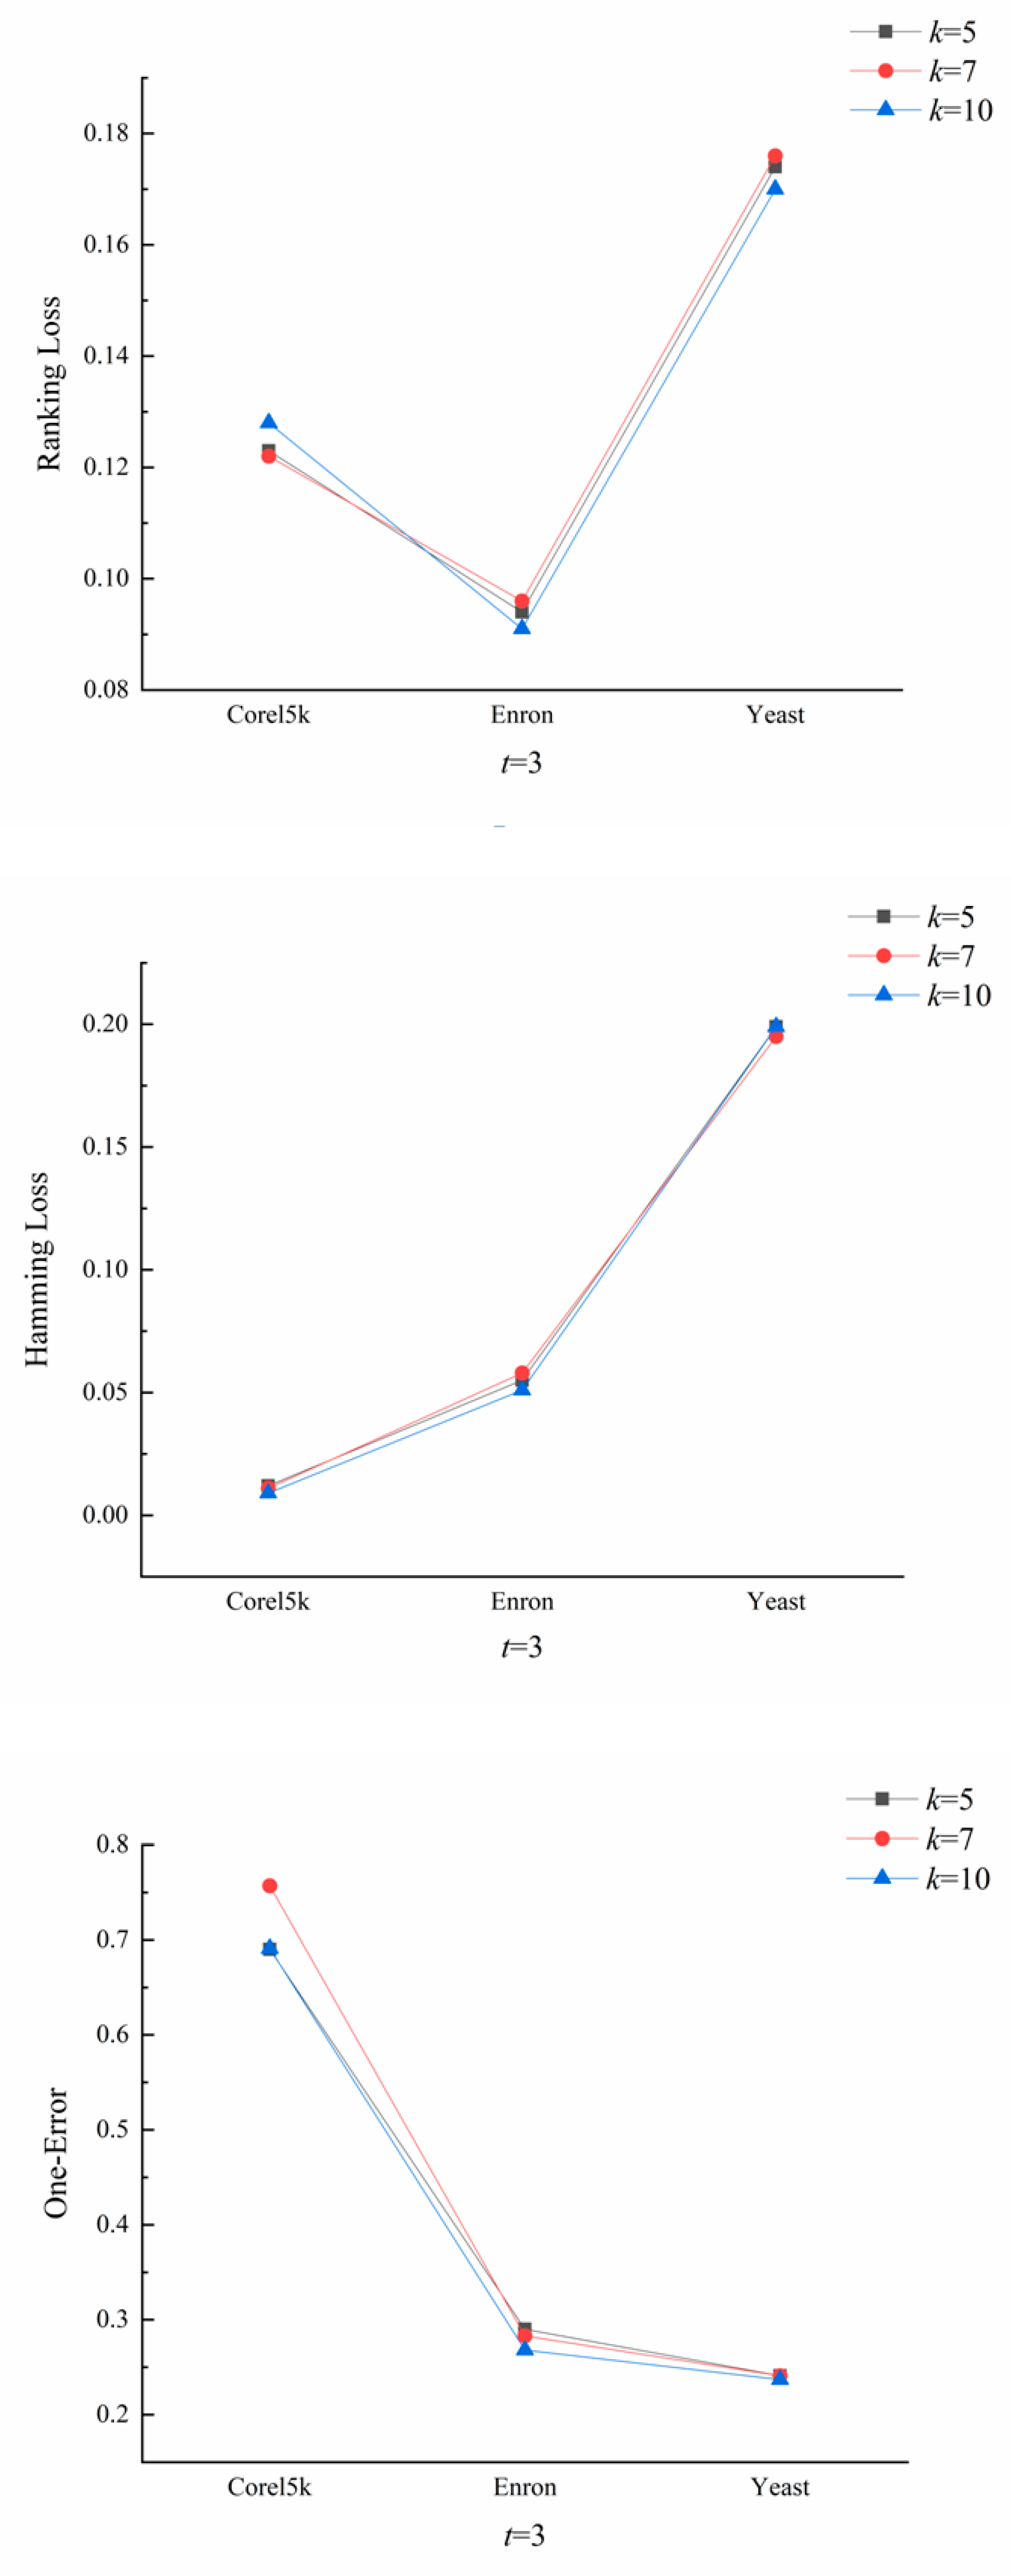
4.1. Optimal Values of k and t

Parameters k and t of VWML-kNN directly influence the performance of classifiers. Thus, the optimal values of k and t should be explored. Specifically, k is the number of neighbors, and t is the proportion of weights in the decision function. When the value of k is high, the classification performance is affected by imbalanced data. When the value of k is low, the presence of outliers can lead to poor classification performance. When t is high, the influence of the MAP of the nearest instances is ignored. When t is lower, minority label instances at the decision boundary have poor classification performance. By changing the values of k and t, we explored the better parameters of VWML-kNN and analyzed the influence of different parameters. In our experiments, t was set to 1, 3, 5, and 7, and k was set to 5, 7, and 10 in each dataset. Other parameters in the algorithm were selected as default parameters. A 10-fold cross-validation was used in this experiment. A total of 10 experiments were performed on each dataset, and the results were averaged.
Figure 1, Figure 2, Figure 3 and Figure 4 present the change in each evaluation metric with different parameter values of k and t on different datasets. Among the experimental results, an overall superior performance is achieved when k = 10 and t = 3 because of its lowest value of evaluation metrics on these datasets. Unlike k = 10, the experimental results are influenced to a greater extent by the imbalanced characteristic of the data. Intuitively, when t = 1 or t = 7, the classification result is not good enough. This is due to the existence of two types of extreme instances in the dataset. We found that instances in the dataset that are quite close or far away both lead to the large weight difference between instances that contain labels and those that do not contain labels. If the instances are quite close, when t = 7, latent information such as the label distribution cannot be acquired, resulting in poor classification accuracy. If they are quite far from each other, when t = 1, the MAP accounts for a large proportion of the decision function, resulting again in poor classification accuracy.

4.2. Experiments and Analysis

To demonstrate the effectiveness of VWML-kNN in multilabel classification learning, its performance was compared with that of four representative multilabel classification algorithms—LAML-kNN [30], DML-kNN [23], ML-kNN [20], and BR [18] discussed in the related work. The k value of each algorithm was set to 10, and all other parameters were set to their defaults. In VWML-kNN, t was set to 3. A 10-fold cross-validation method was adopted in this study, and 10 sets of experiments were conducted on each dataset, with the results averaged.
Table 2, Table 3 and Table 4 present the experimental results assessed with the Hamming loss, ranking loss, and one-error metrics, respectively (the optimal results are set in bold typeface). As shown in Table 2, the two metrics of VWML-kNN are better than those of the other algorithms on the Enron dataset. Although the performance of VWML-kNN ranks second in the one-error metric on the Enron dataset, it only differs by 0.004 from the best performing algorithm, LAML-kNN (0.013 higher than the third-ranked ML-kNN algorithm). Generally, VWML-kNN has better classification performance on the Enron dataset. As presented in Table 3, VWML-kNN performs better than the other algorithms in all evaluation metrics on the yeast dataset. Particularly, in the one-error metric, VWML-kNN performs much better than other algorithms, scoring 0.015 higher than the second-ranked LAML-kNN algorithm. VWML-kNN also has the best performance in both Hamming loss and ranking loss for the yeast dataset, but it has the second best performance in the one-error metric, scoring 0.002 lower than ML-kNN. Overall, the experimental results clearly indicate that VWML-kNN achieved the optimal results for most of the datasets and is more stable than the other algorithms. Moreover, it is found that the VWML-kNN algorithm has better performance on the datasets with higher MeanIR and TCS values. This implies that VWML-kNN is more suitable for datasets with higher imbalance.
Therefore, the experimental results demonstrate that VWML-kNN can effectively classify imbalanced multilabel data and has the best performance among the selected multilabel classification algorithms.

5. Conclusions

This paper established an algorithm for the classification of imbalanced multilabel data. Labels were divided into minority and majority labels, and different strategies for different labels were adopted. A value calculation was proposed to determine the value of labels to calculate the value of the MAP. In the classification of minority labels, the nearest neighbors of the test instance were divided into sets with and without labels. Because of a lack of prior information on minority labels, the algorithm calculated the distances between the test instance and different nearest neighbor sets and converted these distances into weights of nearest neighbor instances with and without labels. Finally, the MAPs of the value calculation and weights were combined to classify the minority label. The results of a series of experiments conducted on different datasets demonstrate the ability of the established algorithm to classify imbalanced multilabel data. The results indicate that our proposed VWML-kNN achieves outstanding results on datasets with high TCS and high MeanIR. Therefore, the proposed algorithm can be applied to the multilabel classification of various fields that involve label imbalance, such as drug molecule identification, building identification, and text categorization. The VWML-kNN also has some limitations. For example, the calculation method of the distance could be improved from the ordinary Euclidean metric. Moreover, the features are not sufficiently fused in the VWML-kNN. In the future, the authors will plan in-depth studies on multilabel imbalanced classification, especially on the relationships within labels.

Author Contributions

Conceptualization, Z.W. and P.Z.; methodology, Z.W. and H.X.; software, H.X.; validation, Z.W., H.X. and P.Z.; formal analysis, Z.W. and H.X.; investigation, Z.W. and H.X; resources, H.X. and G.X.; data curation, H.X.; writing—original draft preparation, Z.W. and H.X; writing—review and editing, H.X., P.Z. and G.X.; visualization, Z.W.; supervision, G.X.; project administration, P.Z. and G.X.; funding acquisition, Z.W., P.Z. and G.X. All authors have read and agreed to the published version of the manuscript.

Funding

This research was funded by the Science and Technology Key Research Planning Project of Zhejiang Province, China, under Grant no. 2021C03136; the Lishui Major Research and Development Program, China, under Grant no. 2019ZDYF03; the Postdoctoral Research Program of Zhejiang University of Technology under Grant no. 236527; and the Public Welfare Technology Application Research Program Project of Lishui, China, under Grant no. 2022GYX12.

Institutional Review Board Statement

Not applicable.

Informed Consent Statement

Not applicable.

Data Availability Statement

The datasets used for the experiments conducted in this paper can be found in the Mulan repository (http://mulan.sourceforge.net/datasets-mlc.html, URL accessed on 28 June 2021).

Conflicts of Interest

The authors declare no conflict of interest.

References

  1. Qian, W.; Huang, J.; Wang, Y.; Xie, Y. Label distribution feature selection for multi-label classification with rough set. Int. J. Approx. Reason. 2021, 128, 32–35. [Google Scholar] [CrossRef]
  2. Maser, M.; Cui, A.; Ryou, S.; Delano, T.; Yue, Y.; Reisman, S. Multilabel Classification Models for the Prediction of Cross-Coupling Reaction Conditions. J. Chem. Inf. Model. 2021, 61, 156–166. [Google Scholar] [CrossRef]
  3. Bashe, A.; Mclaughlin, R.J.; Hallam, S.J. Metabolic pathway inference using multi-label classification with rich pathway features. PLoS Comput. Biol. 2020, 16, e1008174. [Google Scholar]
  4. Che, X.; Chen, D.; Mi, J.S. A novel approach for learning label correlation with application to feature selection of multi-label data. Inf. Sci. 2019, 512, 795–812. [Google Scholar] [CrossRef]
  5. Huang, M.; Sun, L.; Xu, J.; Zhang, S. Multilabel Feature Selection Using Relief and Minimum Redundancy Maximum Relevance Based on Neighborhood Rough Sets. IEEE Access 2020, 8, 62011–62031. [Google Scholar] [CrossRef]
  6. Chen, Z.M.; Wei, X.S.; Jin, X.; Guo, Y.W. Multi-label image recognition with joint class-aware map disentangling and label correlation embedding. In Proceedings of the 2019 IEEE International Conference on Multimedia and Expo, Shanghai, China, 8–12 July 2019; pp. 622–627. [Google Scholar]
  7. Ben-Cohen, A.; Zamir, N.; Ben-Baruch, E.; Friedman, I.; Zelnik-Manor, L. Semantic Diversity Learning for Zero-Shot Multi-Label Classification. In Proceedings of the IEEE/CVF International Conference on Computer Vision (ICCV), Montral, QC, Canada, 10–17 October 2021; pp. 640–650. [Google Scholar]
  8. Yu, G.; Domeniconi, C.; Rangwala, H.; Zhang, G.; Yu, Z. Transductive multi-label ensemble classification for protein function prediction. In Proceedings of the 18th ACM SIGKDD International Conference on Knowledge Discovery and Data Mining, Beijing, China, 12–16 August 2018; pp. 1077–1085. [Google Scholar]
  9. Maltoudoglou, L.; Paisios, A.; Lenc, L.; Martinek, J.; Kral, P.; Papadopoulos, H. Well-calibrated confidence measures for multi-label text classification with a large number of labels. Pattern Recognit. 2022, 122, 108271. [Google Scholar] [CrossRef]
  10. Maragheh, H.K.; Gharehchopogh, F.S.; Majidzadeh, K.; Sangar, A.B. A new hybrid based on long short-term memory network with spotted hyena optimization algorithm for multi-label text classification. Mathematics 2022, 10, 488. [Google Scholar] [CrossRef]
  11. Bhusal, D.; Panday, S.P. Multi-label classification of thoracic diseases using dense convolutional network on chest radiographs. arXiv 2022, arXiv:2202.03583. [Google Scholar]
  12. Xu, H.; Cai, Z.; Li, W. Privacy-preserving mechanisms for multi-label image recognition. ACM Trans. Knowl. Discov. Data 2022, 16, 1–21. [Google Scholar] [CrossRef]
  13. García-Pedrajas, N.E. ML-k’sNN: Label Dependent k Values for Multi-Label k-Nearest Neighbor Rule. Mathematics 2023, 11, 275. [Google Scholar]
  14. Crammer, K.; Singer, Y. On the algorithmic implementation of multiclass kernel-based vector machines. J. Mach. Learn. Res. 2002, 2, 265–292. [Google Scholar]
  15. Gao, B.B.; Zhou, H.Y. Learning to Discover Multi-Class Attentional Regions for Multi-Label Image Recognition. IEEE Trans. Image Process. 2021, 30, 5920–5932. [Google Scholar] [CrossRef] [PubMed]
  16. Wu, C.W.; Shie, B.E.; Yu, P.S.; Tseng, V.S. Mining top-K high utility itemset. In Proceedings of the 18th ACM SIGKDD International Conference on Knowledge Discovery and Data Mining, Beijing, China, 12–16 August 2012; pp. 78–86. [Google Scholar]
  17. Godbole, S.; Sarawag, S.I. Discriminative methods for multi-labeled classification. In Proceedings of the Pacific-Asia Conference on Knowledge Discovery and Data Mining, Sydney, Australia, 26–28 May 2004; pp. 22–30. [Google Scholar]
  18. Boutell, M.R.; Luo, J.; Shen, X.; Brown, C.M. Learning multi-label scene classification. Pattern Recognit. 2004, 37, 1757–1771. [Google Scholar] [CrossRef]
  19. Elisseeff, A.E.; Weston, J. A kernel method for multi-labelled classification. In Proceedings of the 14th International Conference on Neural Information Processing Systems: Natural and Synthetic, Vancouver, BC, Canada, 3–8 December 2001; pp. 681–687. [Google Scholar]
  20. Zhang, M.L.; Zhou, Z.H. ML-KNN: A lazy learning approach to multi-label learning. Pattern Recognit. 2007, 40, 2038–2048. [Google Scholar] [CrossRef] [Green Version]
  21. Zhang, M.; Zhou, Z. A Review on Multi-Label Learning Algorithms. IEEE Trans. Knowl. Data Eng. 2014, 26, 1819–1837. [Google Scholar] [CrossRef]
  22. Li, J.; Li, P.; Hu, X.; Yu, K. Learning common and label-specific features for multi-Label classification with correlation information. Pattern Recognit. 2022, 121, 108259. [Google Scholar] [CrossRef]
  23. Younes, Z.; Abdallah, F.; Denoeu, T.X. Multi-label classification algorithm derived from k-nearest neighbor rule with label dependencies. In Proceedings of the 2008 16th European Signal Processing Conference, Lausanne, Switzerland, 25–29 August 2008; pp. 1–5. [Google Scholar]
  24. Cheng, W.; Hüllermeier, E. Combining instance-based learning and logistic regression for multilabel classification. Mach. Learn. 2009, 76, 211–225. [Google Scholar] [CrossRef]
  25. Xu, J. Multi-label weighted k-nearest neighbor classifier with adaptive weight estimation. In Proceedings of the 18th International Conference on Neural Information Processing, Shanghai, China, 13–17 November 2011; pp. 79–88. [Google Scholar]
  26. Zhang, M. An Improved Multi-Label Lazy Learning Approach. J. Comput. Res. Dev. 2012, 49, 2271–2282. [Google Scholar]
  27. Reyes, O.; Morell, C.; Ventura, S. Evolutionary feature weighting to improve the performance of multi-label lazy algorithms. Integr. Comput. Aided Eng. 2014, 21, 339–354. [Google Scholar] [CrossRef]
  28. Zeng, Y.; Fu, H.M.; Zhang, Y.P.; Zhao, X.Y. An Improved ML-kNN Algorithm by Fusing Nearest Neighbor Classification. DEStech Trans. Comput. Sci. Eng. 2017, 1, 193–198. [Google Scholar] [CrossRef]
  29. Vluymans, S.; Cornelis, C.; Herrera, F.; Saeys, Y. Multi-label classification using a fuzzy rough neighborhood consensus. Inf. Sci. 2018, 433–434, 96–114. [Google Scholar] [CrossRef]
  30. Wang, D.; Wang, J.; Hu Fei Li, L.; Zhang, X. A Locally Adaptive Multi-Label k-Nearest Neighbor Algorithm. In Proceedings of the Pacific-Asia conference on knowledge discovery and data mining, Melbourne, Australia, 3–6 June 2018; pp. 81–93. [Google Scholar]
  31. Charte, F.; Rivera, A.; Del Jesus, M.J. Addressing imbalance in multilabel classification: Measures and random resampling algorithms. Neurocomputing 2015, 163, 3–16. [Google Scholar] [CrossRef]
  32. Madjarov, G.; Kocev, D.; Gjorgjevikj, D.; Dzeroski, S. An extensive experimental comparison of methods for multi-label learning. Pattern Recognit. 2012, 45, 3084–3104. [Google Scholar] [CrossRef]
  33. Charte, F.; Rivera, A.; Del Jesus, M.J.; Herrera, F. Dealing with difficult minority labels in imbalanced multilabel data sets. Neurocomputing 2019, 326, 39–53. [Google Scholar] [CrossRef]
  34. Tsoumakas, G.; Spyromitros-Xioufis, E.; Vilcek, J.; Vlahavas, I. Mulan: A java library for multi-label learning. J. Mach. Learn. Res. 2011, 12, 2411–2414. [Google Scholar]
  35. Zhou, S.; Li, X.; Dong, Y.; Xu, H. A Decoupling and Bidirectional Resampling Method for Multilabel Classification of Imbalanced Data with Label Concurrence. Sci. Program. 2020, 2020, 8829432. [Google Scholar] [CrossRef]
  36. Charte, F.; Rivera, A.; Del Jesus, M.J.; Herrera, F. Concurrence among imbalanced labels and its influence on multilabel resampling algorithms. In Proceedings of the International Conference on Hybrid Artificial Intelligence Systems, Salamanca, Spain, 11–13 June 2014; pp. 110–121. [Google Scholar]
Figure 1. Hamming loss for different values of k and t in different datasets. Different colors represent different values of t.
Computation 11 00032 g001
Figure 2. One-error for different values of k and t in different datasets. Different colors represent different values of t.
Computation 11 00032 g002
Figure 3. Ranking loss for different values of k and t in different datasets. Different colors represent different values of t.
Computation 11 00032 g003
Figure 4. The results of different evaluation metrics in different datasets when t = 3.
Computation 11 00032 g004
Table 1. Description of the three benchmarking datasets.
DatasetInstancesLabelsDensCardMeanIRTCS
Enron1702530.0643.37873.95317.503
Corel5k50003740.0093.522189.56820.200
Yeast2417140.3034.2407.20012.560
Table 2. Experimental results from different multilabel classification methods on the Enron dataset.
AlgorithmHlossRlossO-e
BR0.0560.1680.453
LAML-kNN0.0520.0920.264
DML-kNN0.0530.0930.285
ML-kNN0.0530.0930.281
VWML-kNN0.0510.0910.268
Table 3. Experimental results from different multilabel classification methods on the Corel5k dataset.
AlgorithmHlossRlossO-e
BR0.0110.1460.742
LAML-kNN0.0100.1290.706
DML-kNN0.0100.1320.732
ML-kNN0.0090.1340.727
VWML-kNN0.0090.1280.691
Table 4. Experimental results from different multilabel classification methods on the yeast dataset.
AlgorithmHlossRlossO-e
BR0.2030.2050.240
LAML-kNN0.2010.1700.241
DML-kNN0.2030.1720.242
ML-kNN0.2010.1700.235
VWML-kNN0.1990.1700.237
Disclaimer/Publisher’s Note: The statements, opinions and data contained in all publications are solely those of the individual author(s) and contributor(s) and not of MDPI and/or the editor(s). MDPI and/or the editor(s) disclaim responsibility for any injury to people or property resulting from any ideas, methods, instructions or products referred to in the content.

