
Analyzing the Passenger Waiting Tolerance during Urban Rail Transit Service Interruption: Using Stated Preference Data in Chongqing, China


Abstract
:1. Introduction
2. Literature Review
3. Behavioral Investigation and Analysis
3.1. Questionnaire Design
3.2. Investigation Process
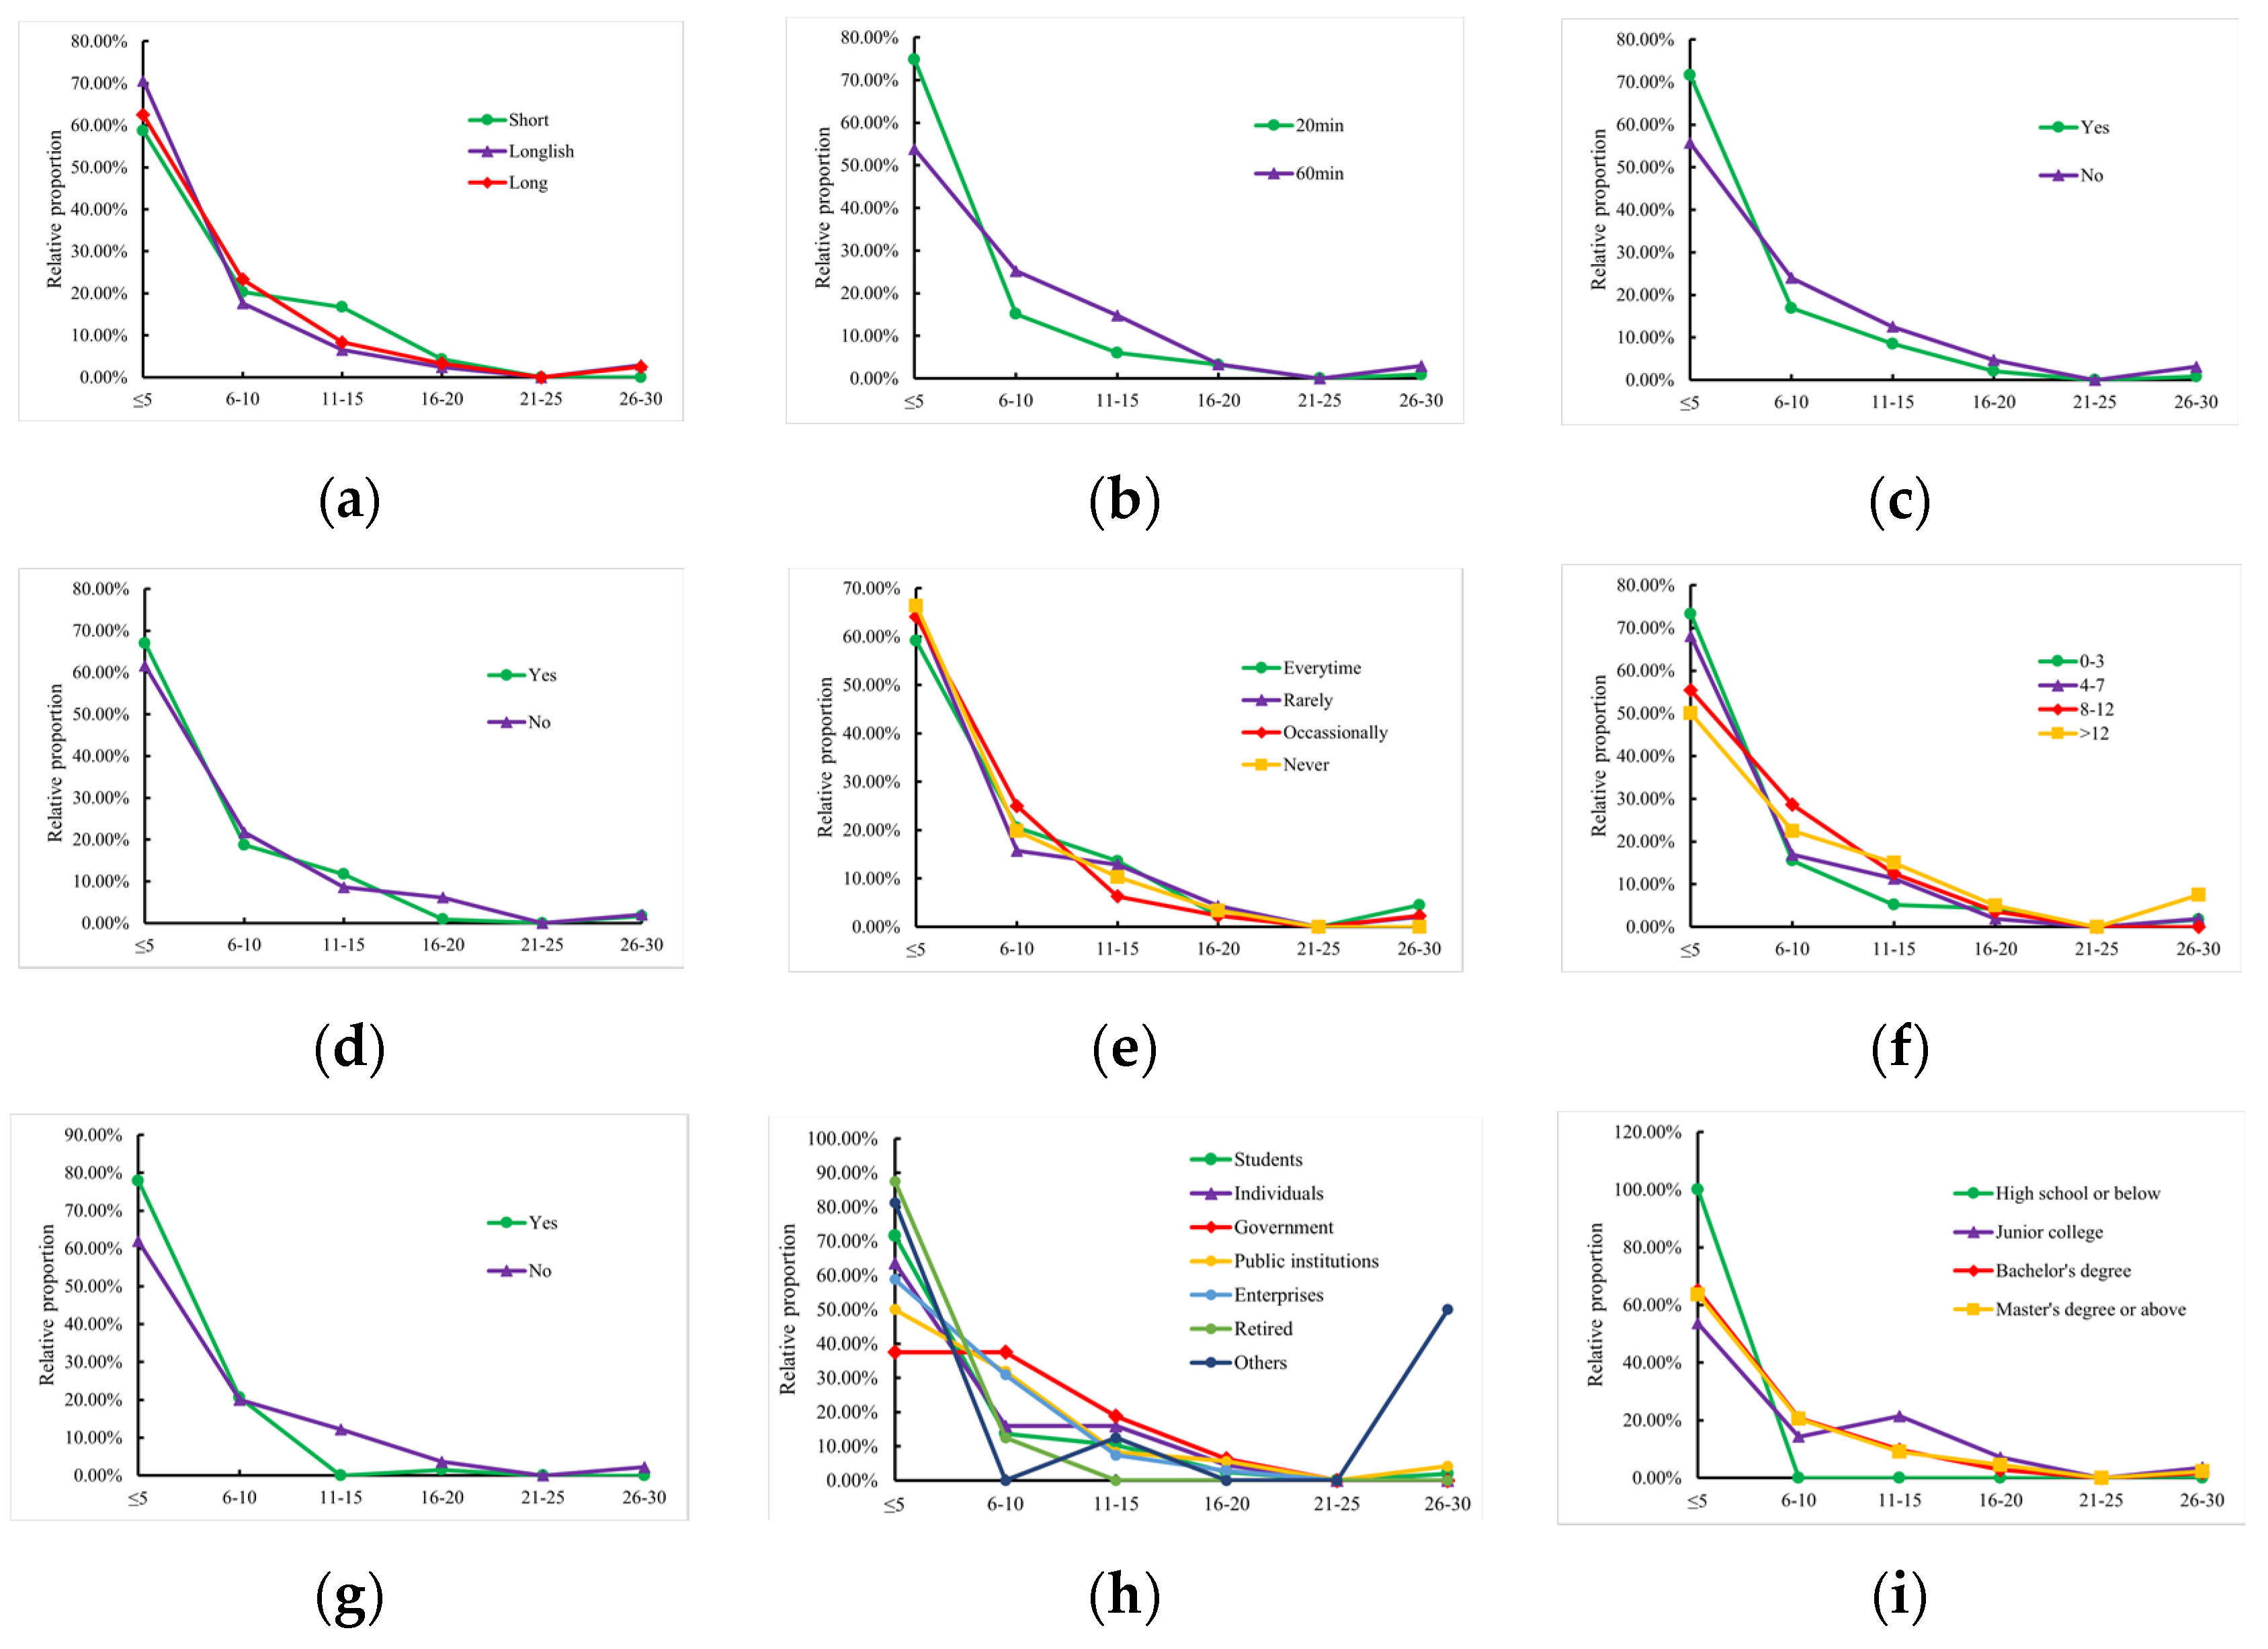
3.3. Statistical Analysis
4. Modeling of the Passenger Waiting Tolerance during URT Interruptions
4.1. Symbol Description
4.2. Model Construction
4.3. Model Estimation
5. Results and Discussion
5.1. Basic Data
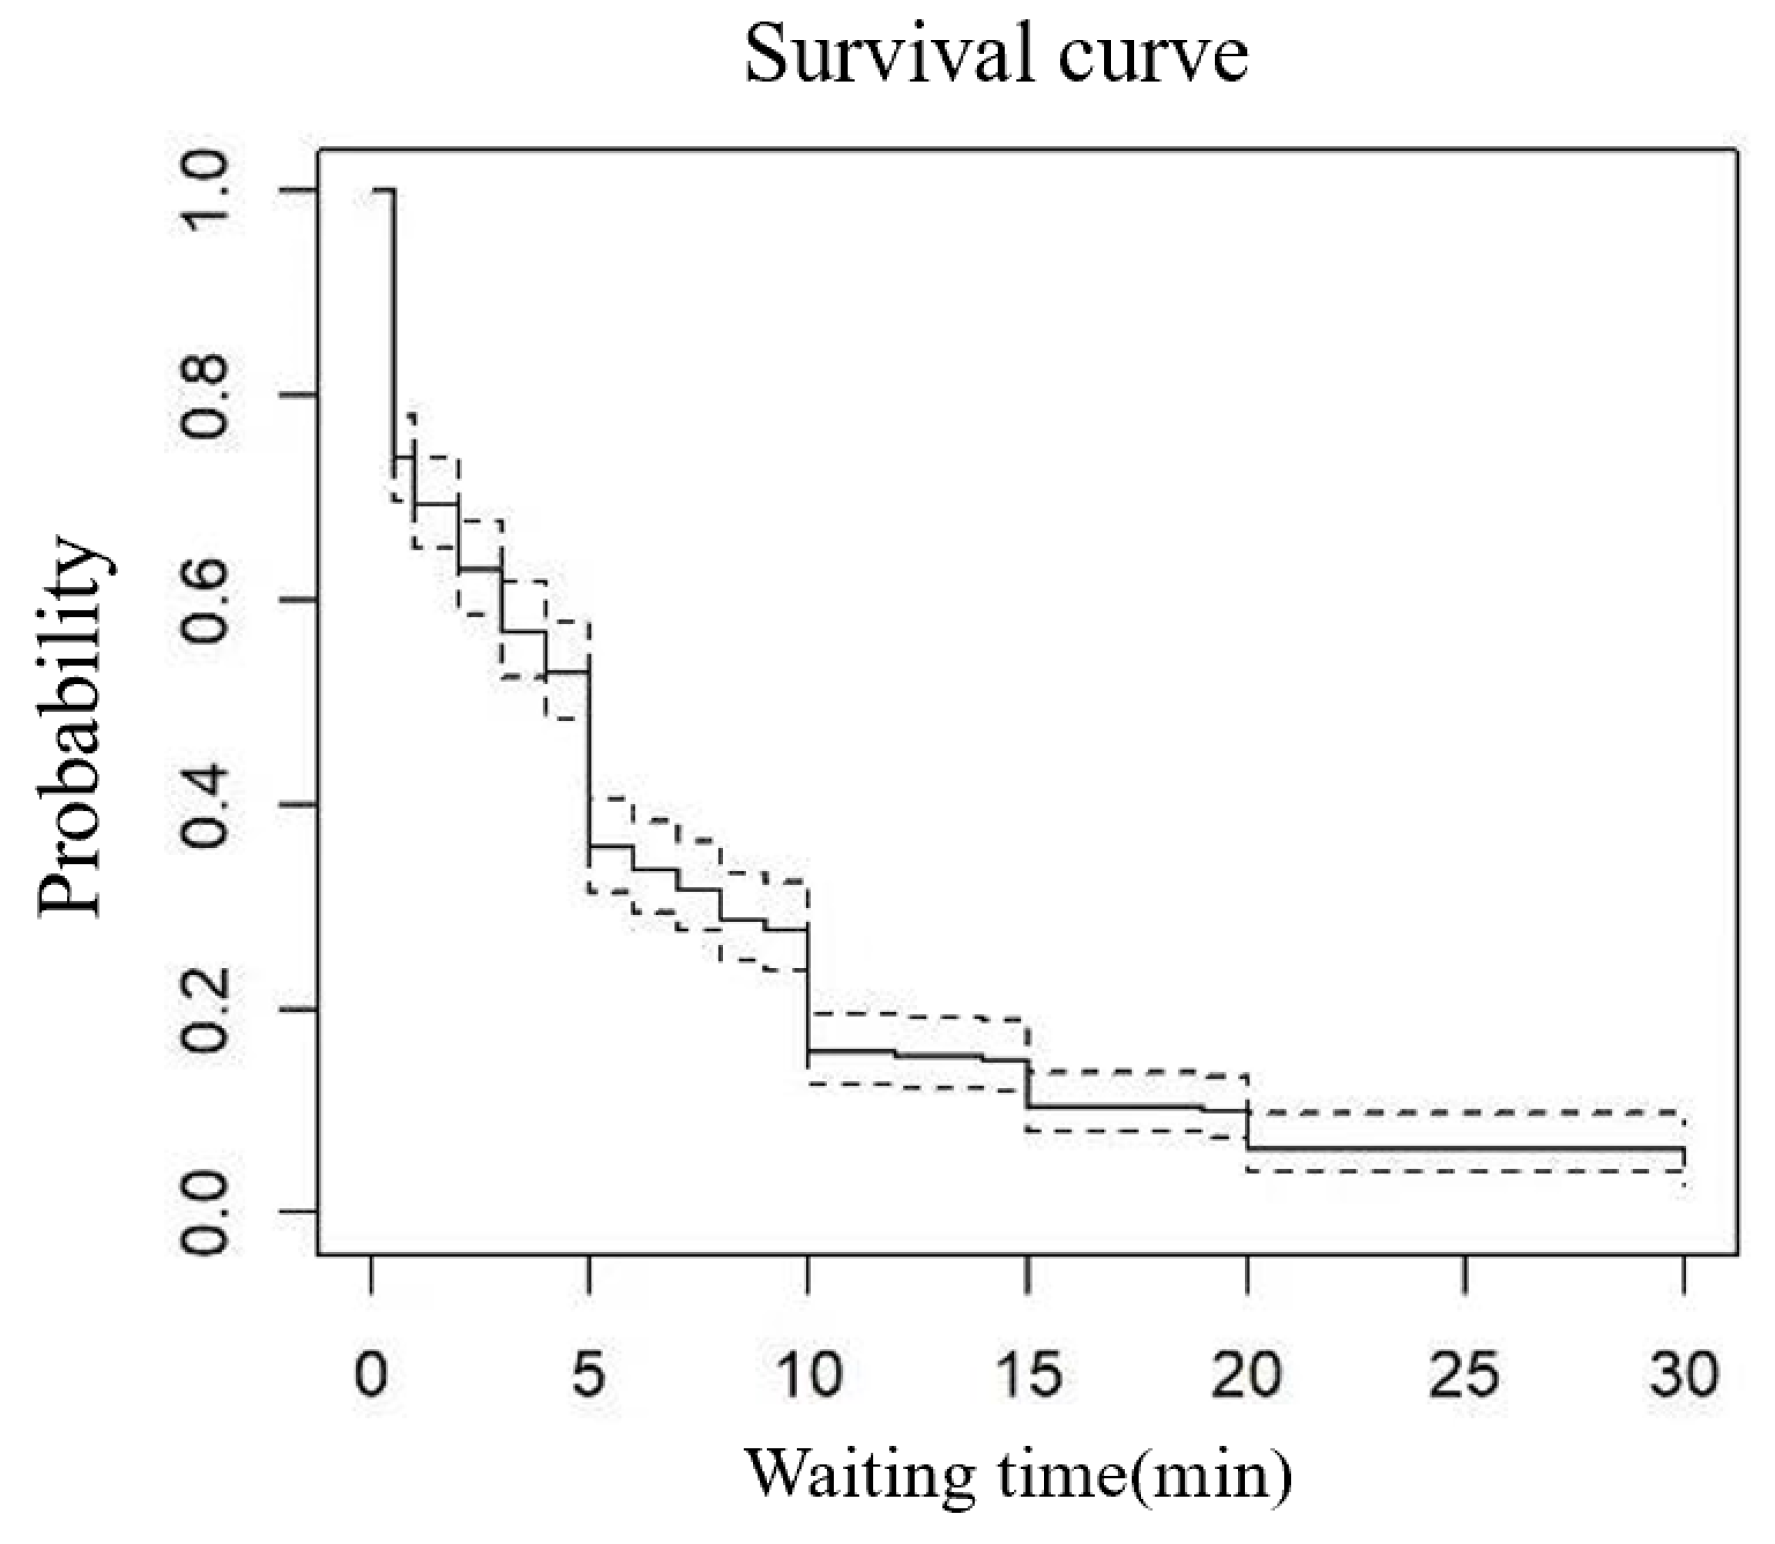
5.2. Model Result
5.3. Discussion
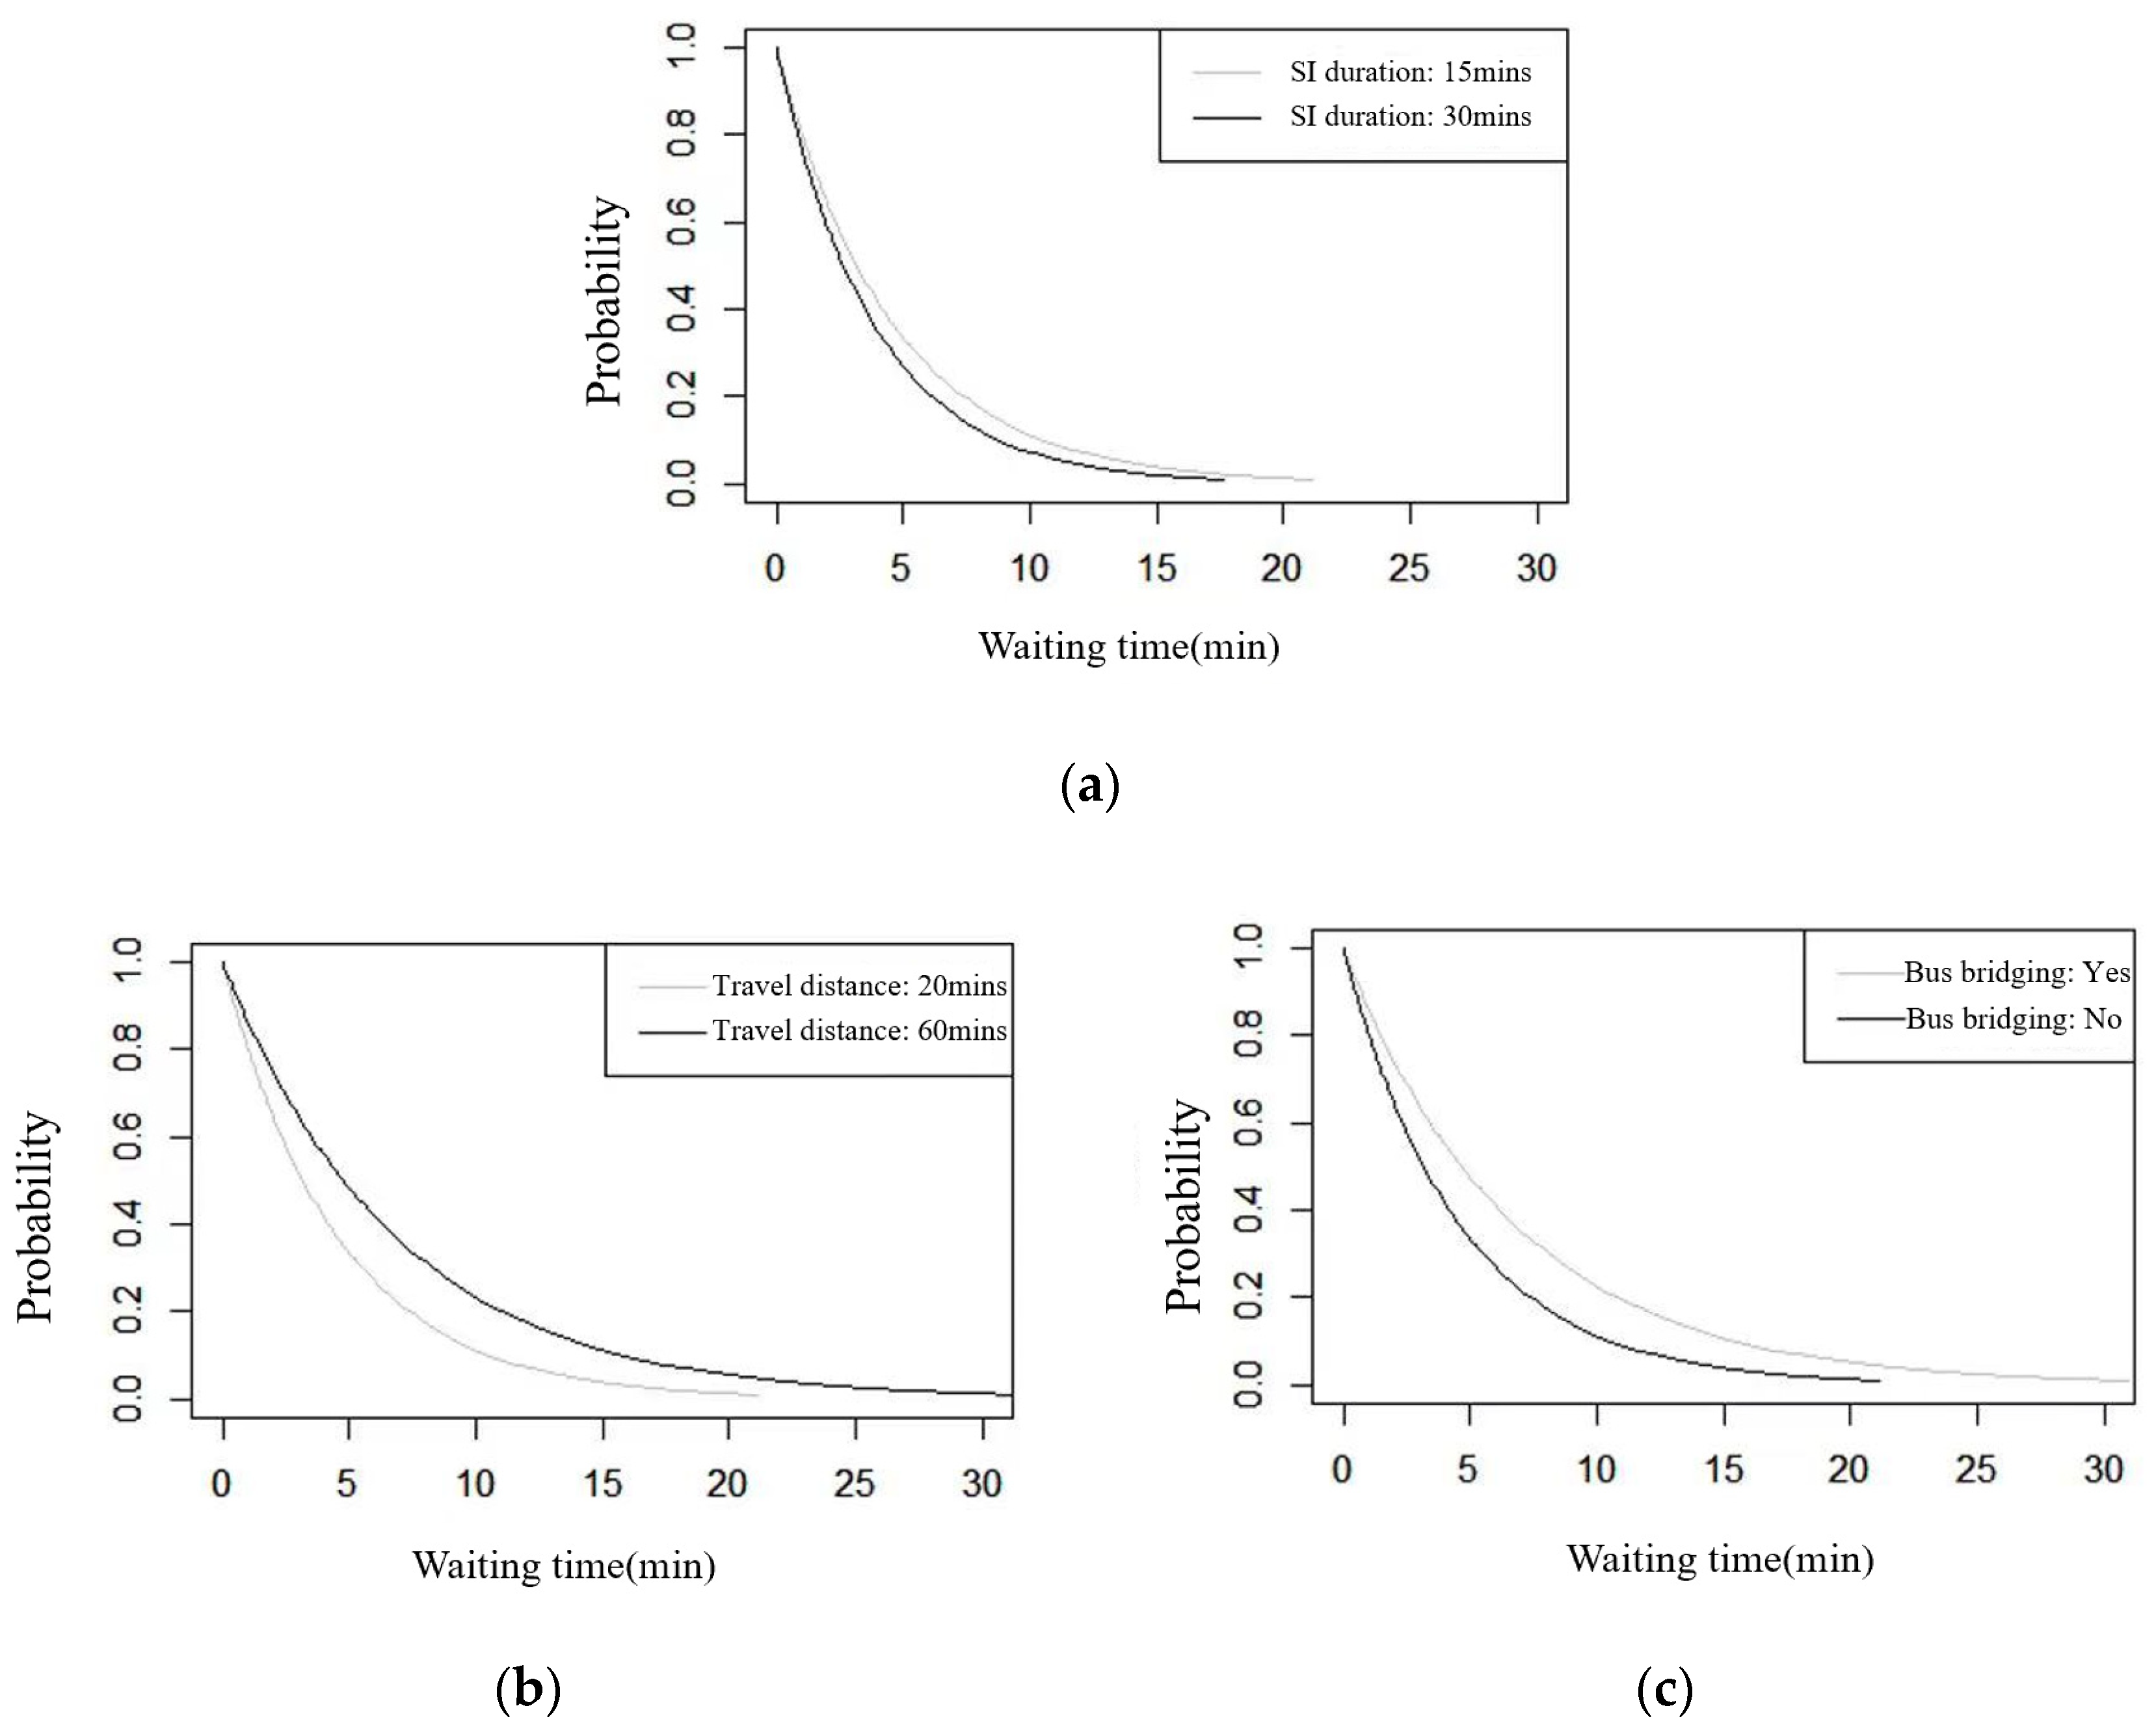
5.4. Policy Analysis
6. Conclusions
Author Contributions
Funding
Data Availability Statement
Conflicts of Interest
Appendix A
References
- Li, B.; Yao, E.; Yamamoto, T.; Tang, Y.; Liu, S. Exploring Behavioral Heterogeneities of Metro Passenger’s Travel Plan Choice under Unplanned Service Disruption with Uncertainty. Transp. Res. Part A Policy Pract. 2020, 141, 294–306. [Google Scholar] [CrossRef]
- Lin, T.Y.-T. Transit User Mode Choice Behaviour in Response to TTC Rapid Transit Service Disruption; University of Toronto: Toronto, ON, Canada, 2017. [Google Scholar]
- Saberi, M.; Ghamami, M.; Gu, Y.; Shojaei, M.H.; Fishman, E. Understanding the Impacts of a Public Transit Disruption on Bicycle Sharing Mobility Patterns: A Case of Tube Strike in London. J. Transp. Geogr. 2018, 66, 154–166. [Google Scholar] [CrossRef]
- Nazem, M.; Lomone, A.; Chu, A.; Spurr, T. Analysis of Travel Pattern Changes Due to a Medium-Term Disruption on Public Transit Networks Using Smart Card Data. Transp. Res. Procedia 2018, 32, 585–596. [Google Scholar] [CrossRef]
- Nguyen-Phuoc, D.Q.; Currie, G.; De Gruyter, C.; Young, W. Transit User Reactions to Major Service Withdrawal—A Behavioural Study. Transp. Policy 2018, 64, 29–37. [Google Scholar] [CrossRef]
- Nguyen-Phuoc, D.Q.; Currie, G.; De Gruyter, C.; Young, W. How Do Public Transport Users Adjust Their Travel Behaviour If Public Transport Ceases? A Qualitative Study. Transp. Res. Part F Traffic Psychol. Behav. 2018, 54, 1–14. [Google Scholar] [CrossRef]
- Adelé, S.; Tréfond-Alexandre, S.; Dionisio, C.; Hoyau, P.-A. Exploring the Behavior of Suburban Train Users in the Event of Disruptions. Transp. Res. Part F Traffic Psychol. Behav. 2019, 65, 344–362. [Google Scholar] [CrossRef]
- Rahimi, E.; Shamshiripour, A.; Shabanpour, R.; Mohammadian, A.; Auld, J. Analysis of Transit Users’ Waiting Tolerance in Response to Unplanned Service Disruptions. Transp. Res. Part D Transp. Environ. 2019, 77, 639–653. [Google Scholar] [CrossRef]
- Rahimi, E.; Shamshiripour, A.; Shabanpour, R.; Mohammadian, A.; Auld, J. Analysis of Transit Users’ Response Behavior in Case of Unplanned Service Disruptions. Transp. Res. Rec. J. Transp. Res. Board 2020, 2674, 258–271. [Google Scholar] [CrossRef]
- Li, J.; Wang, X. Multimodal Evacuation after Subway Breakdown: A Modeling Framework and Mode Choice Behavior. Transp. Res. Interdiscip. Perspect. 2020, 6, 100177. [Google Scholar] [CrossRef]
- Li, B.; Yao, E.; Yamamoto, T.; Huan, N.; Liu, S. Passenger Travel Behavior Analysis under Unplanned Metro Service Disruption: Using Stated Preference Data in Guangzhou, China. J. Transp. Eng. Part A Syst. 2020, 146, 04019069. [Google Scholar] [CrossRef]
- Liu, T.; Ma, Z.; Koutsopoulos, H.N. Unplanned Disruption Analysis in Urban Railway Systems Using Smart Card Data. Urban Rail Transit 2021, 7, 177–190. [Google Scholar] [CrossRef]
- Wang, X.; Li, J.; Yu, R. Modeling Disruption Durations of Subway Service via Random Survival Forests: The Case of Shanghai. J. Transp. Saf. Secur. 2023, 15, 215–237. [Google Scholar] [CrossRef]
- Cong, C.; Li, X.; Yang, S.; Zhang, Q.; Lu, L.; Shi, Y. Impact Estimation of Unplanned Urban Rail Disruptions on Public Transport Passengers: A Multi-Agent Based Simulation Approach. Int. J. Environ. Res. Public Health 2022, 19, 9052. [Google Scholar] [CrossRef]
- Valsalan, N.; Haritha, P.C.; Anjaneyulu, M.V.L.R. Travelers’ Response to Network Disruptions in Ernakulam City. In Recent Advances in Transportation Systems Engineering and Management: Select Proceedings of CTSEM 2021; Springer: Singapore, 2023; pp. 885–899. [Google Scholar]
- Pender, B.; Currie, G.; Delbosc, A.; Shiwakoti, N. Addressing Passenger Needs during Unexpected Rail Disruptions—An Internationa Survey. In Proceedings of the WCTR, Rio de Janeiro, Brazil, 15–18 July 2013; pp. 1–20. [Google Scholar]
- Dell’Olio, L.; Ibeas, A.; Barreda, R.; Sañudo, R. Passenger Behavior in Trains during Emergency Situations. J. Saf. Res. 2013, 46, 157–166. [Google Scholar] [CrossRef]
- Murray-Tuite, P.; Wernstedt, K.; Yin, W. Behavioral Shifts after a Fatal Rapid Transit Accident: A Multinomial Logit Model. Transp. Res. Part F Traffic Psychol. Behav. 2014, 24, 218–230. [Google Scholar] [CrossRef]
- Pnevmatikou, A.M.; Karlaftis, M.G.; Kepaptsoglou, K. Metro Service Disruptions: How Do People Choose to Travel? Transportation 2015, 42, 933–949. [Google Scholar] [CrossRef]
- Golshani, N.; Shabanpour, R.; Mohammadian, A.; Auld, J.; Ley, H. Evacuation Decision Behavior for No-Notice Emergency Events. Transp. Res. Part D Transp. Environ. 2019, 77, 364–377. [Google Scholar] [CrossRef]
- Sun, J. The Statistical Analysis of Interval-Censored Failure Time Data; Springer: New York, NY, USA, 2006. [Google Scholar]
- Saikia, R.; Pratim, M. A Review on Accelerated Failure Time Models. Int. J. Stat. Syst. 2017, 12, 311–322. [Google Scholar]
- Pender, B.; Currie, G.; Shiwakoti, N.; Delbosc, A. Economic Viability of Bus Bridging Reserves for Fast Response to Unplanned Passenger Rail Disruption. Transp. Res. Rec. J. Transp. Res. Board 2019, 2537, 13–22. [Google Scholar] [CrossRef]
- Gu, W.; Liu, Y.; Ji, Y.; Zhang, H.M.; Zheng, Y. Optimizing Bus Bridging Strategies during Metro Disruptions Considering Bridging Time and Passenger Delays. In CICTP 2017: Transportation Reform and Change—Equity, Inclusiveness, Sharing, and Innovation, Proceedings of the 17th COTA International Conference of Transportation Professionals, Shanghai, China, 7–9 July 2017; American Society of Civil Engineers: Reston, VA, USA, 2018; pp. 1694–1705. [Google Scholar]
- Zheng, Y.J.; Gu, W.; Ji, Y.X.; Zhang, H.J. Optimizing a Bus Bridging Strategy Considering Efficiency and Equity. Jiaotong Yunshu Xitong Gongcheng Yu Xinxi/J. Transp. Syst. Eng. Inf. Technol. 2019, 19, 94–101. [Google Scholar] [CrossRef]
- Wang, Y.; Guo, J.; Currie, G.; Ceder, A.; Dong, W.; Pender, B. Bus Bridging Disruption in Rail Services With Frustrated and Impatient Passengers. IEEE Trans. Intell. Transp. Syst. 2014, 15, 2014–2023. [Google Scholar] [CrossRef]


| Author | Location | Study Focus | Study Method | |||||||||
|---|---|---|---|---|---|---|---|---|---|---|---|---|
| Traveler’s Response | Impact Analysis | Mode Shift/Choice | Waiting Tolerance | Disruption Duration | SA | DCM | AFT | RSF | MAS | CN | ||
| Lin, 2017 [2] | Toronto, Canada | √ | √ | |||||||||
| Saberi et al., 2018 [3] | London, UK | √ | √ | |||||||||
| Nazem et al., 2018 [4] | Montreal, Canada | √ | √ | |||||||||
| Nguyen-Phuoc et al., 2018 [5] | Melbourne, Australia | √ | √ | |||||||||
| Nguyen-Phuoc et al., 2018 [6] | Melbourne, Australia | √ | √ | |||||||||
| Adelé et al., 2019 [7] | Paris, France | √ | √ | |||||||||
| Rahimi et al., 2019 [8] | Chicago, USA | √ | √ | |||||||||
| Rahimi et al., 2020 [9] | Chicago, USA | √ | √ | |||||||||
| Li and Wang, 2020 [10] | Shanghai, China | √ | √ | |||||||||
| Li et al., 2020 [11] | Guangzhou, China | √ | √ | |||||||||
| Liu et al., 2021 [12] | / | √ | √ | |||||||||
| Wang et al., 2022 [13] | Shanghai, China | √ | √ | |||||||||
| Cong et al., 2022 [14] | Ningbo, China | √ | √ | |||||||||
| Valsalan et al., 2023 [15] | Ernakulam, India | √ | √ | |||||||||
| Factors | Level |
|---|---|
| Travel period | Morning peak/Evening peak/Flat peak |
| Weather | Sunny/ Rainy |
| Location of passengers | Yes (0/½/¾)/No |
| Travel distance | 20 min/60 min |
| Bus bridging | Yes/No |
| Interruption information accuracyService interruption duration | Clear/Unclear |
| 15 min/30 min/60 min |
| No. | A | B | C | D | E | F | G |
|---|---|---|---|---|---|---|---|
| 1 | 1 | 1 | 1 | 1 | 1 | 1 | 1 |
| 2 | 1 | 1 | 1 | 2 | 1 | 2 | 3 |
| 3 | 1 | 1 | 2 | 1 | 2 | 2 | 2 |
| 4 | 1 | 1 | 2 | 2 | 2 | 1 | 1 |
| 5 | 1 | 2 | 1 | 1 | 2 | 1 | 1 |
| 6 | 1 | 2 | 1 | 2 | 2 | 2 | 2 |
| 7 | 1 | 2 | 2 | 1 | 1 | 2 | 3 |
| 8 | 1 | 2 | 2 | 2 | 1 | 1 | 1 |
| 9 | 2 | 1 | 1 | 1 | 1 | 2 | 1 |
| 10 | 2 | 1 | 2 | 2 | 2 | 2 | 1 |
| 11 | 2 | 2 | 1 | 2 | 2 | 1 | 3 |
| 12 | 2 | 2 | 2 | 1 | 1 | 1 | 2 |
| 13 | 3 | 1 | 1 | 2 | 1 | 1 | 2 |
| 14 | 3 | 1 | 2 | 1 | 2 | 1 | 3 |
| 15 | 3 | 2 | 1 | 1 | 2 | 2 | 1 |
| 16 | 3 | 2 | 2 | 2 | 1 | 2 | 1 |
| Question | Answer |
|---|---|
| Gender | ○ Male ○ Female |
| Age | ○ Under 18 ○18–30 ○31–40 ○40–50 ○50–60 ○ Over 60 |
| Occupation | ○ Students ○ Individual professionals ○ Government personnel ○ Public institution personnel ○ Enterprise personnel ○ Retirees |
| Education level | ○ High school or below ○ Junior college ○ Undergraduate ○ Master’s degree or above |
| Income (CNY/mo) | ○ Less than 3000 ○3000–5000 ○5000–8000 ○8000–12,000 ○ More than 12,000 |
| Question | Answer |
|---|---|
| Whether to pay attention to real-time operational information | ○Always ○ Rarely ○Occasionally ○Never |
| Number of times taken by rail transit in the last week | ○0–3 times ○3–7 times ○8–12 times○ More than 12 times |
| Whether the service has been interrupted | ○ Yes ○ No |
| Attribute | Category | Frequency | Proportion (%) |
|---|---|---|---|
| Gender | Male | 156 | 36.8 |
| Female | 272 | 64.2 | |
| Age | <18 | 0 | 0 |
| 18 to 30 | 292 | 68.9 | |
| 31 to 40 | 76 | 17.9 | |
| 41 to 50 | 48 | 11.3 | |
| 51 to 60 | 12 | 2.8 | |
| >60 | 0 | 0 | |
| Occupation | Students | 204 | 47.2 |
| Individual professionals | 44 | 12.3 | |
| Government personnel | 16 | 20.8 | |
| Public institution personnel | 72 | 16.0 | |
| Enterprise personnel | 68 | 17.0 | |
| Retirees | 8 | 2.8 | |
| Other | 16 | 2.8 | |
| Education level | High school or below | 4 | 0.9 |
| Junior college | 28 | 6.6 | |
| Undergraduate | 352 | 82.1 | |
| Master’s degree or above | 44 | 11.3 | |
| Income (CNY/mo) | <3000 | 188 | 44.3 |
| 3000–5000 | 60 | 14.2 | |
| 5001–8000 | 84 | 19.8 | |
| 8001–12,000 | 48 | 11.3 | |
| >12,000 | 48 | 11.3 |
| Symbol | Definition |
|---|---|
| T | Random time variable |
| F(t) | Cumulative distribution function |
| f(t) | Probability density function |
| h(t) | Risk function |
| S(t) | Survival function |
| Variable | Pearson Chi-Square Value | Degrees of Freedom | Progressive Significance (Bilateral) |
|---|---|---|---|
| Service interruption duration | 16.035 | 8 | 0.042 |
| Travel period | 15.405 | 8 | 0.052 |
| Weather | 3.874 | 4 | 0.423 |
| Location of passengers | 2.302 | 4 | 0.680 |
| Travel distance | 22.931 | 4 | 0.000 |
| Bus bridging | 13.472 | 4 | 0.009 |
| Information accuracy | 10.794 | 4 | 0.029 |
| Information usage | 11.545 | 12 | 0.048 |
| Travel frequency | 25.741 | 12 | 0.012 |
| Service interruption experience | 12.903 | 4 | 0.012 |
| Gender | 9.841 | 4 | 0.043 |
| Age | 29.067 | 12 | 0.004 |
| Occupation | 40.223 | 24 | 0.020 |
| Education level | 85.958 | 51 | 0.002 |
| Income | 28.775 | 16 | 0.026 |
| Variable | Variable Types | Variable Coding |
|---|---|---|
| Service interruption duration | Multiple | 1: 15 min, 2: 30 min, 3: 60 min |
| Travel period | Multiple | 1: morning peak, 2: evening peak, 3: flat peak |
| Weather | Binary | 1: sunny, 2: heavy rain |
| Location of passengers | Binary | 1: in-station; 2: out-station |
| Travel distance | Binary | 1: 20 min, 2: 60 min |
| Bus bridging | Binary | 1: yes; 2: no |
| Information accuracy | Binary | 1: yes; 2: no |
| Information usage | Multiple | 1: every time, 2: rarely, 3: occasionally, 4: never |
| Travel frequency | Multiple | 1: 0–3 times, 2: 4–7 times, 3: 8–12 times, 4: 12 times or more |
| Service interruption experience | Binary | 1: yes; 2: no |
| Gender | Binary | 1: male, 2: female |
| Age | Multiple | 1: <18, 2: 18–30, 3: 31–40, 4: 41–50, 5: 51–60, 6: >60 |
| Occupation | Multiple | 1: students, 2: individuals, 3: government, 4: public institutions, 5: enterprises, 6: retired, 7: others |
| Education level | Multiple | 1: high school or below, 2: junior college, 3: bachelor’s degree, 4: master’s degree or above |
| Income | Multiple | 1: Below 3000, 2: 3000–5000, 3: 5000–8000, 4: 8000–12,000, 5: 12,000 and above |
| Parameters | Value | Exp | z | p |
|---|---|---|---|---|
| Service interruption duration | 0.012 | 0.988 | 3.93 | 0.000 |
| Travel distance | 0.407 | 0.666 | 3.78 | 0.000 |
| Bus bridging | 0.384 | 0.681 | 3.14 | 0.002 |
| Information accuracy | 0.239 | 0.787 | 2.27 | 0.023 |
| Information usage | 0.145 | 1.156 | 2.54 | 0.011 |
| Travel frequency | 0.050 | 1.051 | 3.01 | 0.003 |
| Service interruption experience | 0.823 | 0.439 | 5.36 | 0.000 |
| Occupation_2 | 0.179 | 0.836 | 0.87 | 0.383 |
| Occupation_3 | 0.690 | 1.995 | 2.18 | 0.029 |
| Occupation_4 | 0.059 | 1.060 | 0.38 | 0.071 |
| Occupation_5 | 0.025 | 0.975 | 0.16 | 0.087 |
| Occupation_6 | 1.168 | 0.311 | 1.95 | 0.051 |
| Occupation_7 | 0.954 | 0.385 | 2.72 | 0.007 |
| Education level_2 | 0.304 | 1.356 | 0.41 | 0.067 |
| Education level_3 | 0.522 | 0.593 | 0.66 | 0.051 |
| Education level_4 | 0.766 | 0.465 | 0.94 | 0.035 |
| Passenger | #1 | #2 | #3 | #4 | #5 | #6 |
|---|---|---|---|---|---|---|
| SI duration | 15 min | 30 min | 15 min | 15 min | 15 min | 15 min |
| Travel distance | 20 min | 20 min | 20 min | 60 min | 20 min | 20 min |
| Bus bridging | Yes | Yes | Yes | Yes | Yes | No |
| Information accuracy | Yes | Yes | No | No | No | No |
| Information usage | Occasionally | Occasionally | Occasionally | Occasionally | Occasionally | Occasionally |
| Travel frequency | 0–3 times/wk | 0–3 times/wk | 0–3 times/wk | 0–3 times/wk | 0–3 times/wk | 0–3 times/wk |
| SI experience | Yes | Yes | Yes | Yes | Yes | Yes |
| Occupation | Government | Government | Government | Government | Government | Government |
| Education level | Undergraduate | Undergraduate | Undergraduate | Undergraduate | Undergraduate | Undergraduate |
Disclaimer/Publisher’s Note: The statements, opinions and data contained in all publications are solely those of the individual author(s) and contributor(s) and not of MDPI and/or the editor(s). MDPI and/or the editor(s) disclaim responsibility for any injury to people or property resulting from any ideas, methods, instructions or products referred to in the content. |
© 2023 by the authors. Licensee MDPI, Basel, Switzerland. This article is an open access article distributed under the terms and conditions of the Creative Commons Attribution (CC BY) license (https://creativecommons.org/licenses/by/4.0/).
Share and Cite
Li, B.; Ye, Z.; Li, J.; Shao, S.; Wang, C. Analyzing the Passenger Waiting Tolerance during Urban Rail Transit Service Interruption: Using Stated Preference Data in Chongqing, China. Computation 2023, 11, 33. https://doi.org/10.3390/computation11020033
Li B, Ye Z, Li J, Shao S, Wang C. Analyzing the Passenger Waiting Tolerance during Urban Rail Transit Service Interruption: Using Stated Preference Data in Chongqing, China. Computation. 2023; 11(2):33. https://doi.org/10.3390/computation11020033
Chicago/Turabian StyleLi, Binbin, Zhefan Ye, Jue Li, Siyuan Shao, and Chenlu Wang. 2023. "Analyzing the Passenger Waiting Tolerance during Urban Rail Transit Service Interruption: Using Stated Preference Data in Chongqing, China" Computation 11, no. 2: 33. https://doi.org/10.3390/computation11020033