Article

Evaluating the Performance of Multiple Sequence Alignment Programs with Application to Genotyping SARS-CoV-2 in the Saudi Population

Computer Science Department, College of Computer and Information Sciences, Imam Mohammad Ibn Saud Islamic University, Riyadh 11564, Saudi Arabia
*
Author to whom correspondence should be addressed.
Computation 2023, 11(11), 212; https://doi.org/10.3390/computation11110212
Submission received: 8 September 2023 / Revised: 12 October 2023 / Accepted: 24 October 2023 / Published: 1 November 2023
(This article belongs to the Special Issue 10th Anniversary of Computation—Computational Biology)

Abstract

:
This study explores the accuracy and efficiency of multiple sequence alignment (MSA) programs, focusing on Clustal Ω , MAFFT, and MUSCLE in the context of genotyping SARS-CoV-2 for the Saudi population. Our results indicate that MAFFT outperforms the others, making it an ideal choice for large-scale genomic analyses. The comparative performance of MSAs assembled using MergeAlign demonstrates that MAFFT and MUSCLE consistently exhibit higher accuracy than Clustal Ω in both reference-based and consensus-based approaches. The evaluation of genotyping effectiveness reveals that the addition of a reference sequence, such as the SARS-CoV-2 Wuhan-Hu-1 isolate, does not significantly affect the alignment process, suggesting that using consensus sequences derived from individual MSA alignments may yield comparable genotyping outcomes. Investigating single-nucleotide polymorphisms (SNPs) and mutations highlights distinctive features of MSA programs. Clustal Ω and MAFFT show similar counts, while MUSCLE displays the highest SNP count. High-frequency SNP analysis identifies MAFFT as the most accurate MSA program, emphasizing its reliability. Comparisons between Saudi and global SARS-CoV-2 populations underscore regional genetic variations. Saudis exhibit consistently higher frequencies of high-frequency SNPs, attributed to genetic similarity within the population. Transmission dynamics analysis reveals a higher frequency of co-mutations in the Saudi dataset, suggesting shared evolutionary patterns. These findings emphasize the importance of considering regional diversity in genetic analyses.

1. Introduction

Severe acute respiratory syndrome coronavirus 2 (SARS-CoV-2), the virus that causes COVID-19, has had a devastating impact on the world, with over 600 million cases and 6.4 million deaths reported as of 4 August 2023. The virus is highly contagious and can cause a range of mild to severe symptoms.
Genotyping SARS-CoV-2 is the process of identifying genetic variations in the virus. This information can be used to track the spread of the virus, identify new variants, and develop vaccines and treatments. Multiple sequence alignment (MSA) programs are essential tools for genotyping SARS-CoV-2. MSA programs align the genomes of multiple virus samples to identify genetic variations. However, different MSA programs can produce different results, making it important to evaluate their performance before using them for genotyping. This study evaluates the performance of three MSA programs for genotyping SARS-CoV-2: Clustal Ω , MAFFT, and MUSCLE. The best-performing MSA program is then applied to genotype SARS-CoV-2 samples from the Saudi population.
The next subsections discuss the general background, problem statement, and research questions for this study. The general background section provides an overview of alignment and MSA programs, genotyping, and genotyped SARS-CoV-2 for the Saudi population. The problem statement section narrowly focuses on the specific problem or research gap that this study addresses by identifying the challenges or limitations that exist in the current methods of genotyping SARS-CoV-2 for the Saudi population. Lastly, the research questions section poses specific the research questions and hypotheses that this study seeks to answer, as well as the significant implications of this work.

1.1. General Background

Alignment is the process of aligning sequences to identify regions of similarities and differences [1]. Various Multiple Sequence Alignment (MSA) programs have been proposed to solve alignment challenges. Notably, Clustal Ω , introduced in 2011, represents a progressive algorithm and is the latest variation of the Clustal family programs [2]. Similarly, MAFFT, introduced in 2002, is recognized as a fast MSA program due to its use of FFT to identify homologous regions rapidly [3]. MUSCLE, introduced in 2004, operates as an iterative method [4]. In a prior study [5], the authors suggested that assembling independent MSA solutions into one can provide enhanced accuracy. A limited number of works have explored assembled MSA solutions, with MergeAlign being considered [6]. Additional information on MSA programs can be found in [7].
Genotyping is a crucial avenue for comprehending virus evolution and transmission. It involves aligning genetic sequences to identify differences, including mutations and single-nucleotide polymorphisms (SNPs). Mutations, as broader alterations in the DNA sequence, may encompass single-nucleotide changes (SNPs), insertions, deletions, or structural modifications. SNPs are specific instances of mutations involving the replacement of a single nucleotide at a defined position. To analyze and compare mutations, including SNPs, across individuals, a reference sequence is typically incorporated into the sequence set for alignment. Methods for selecting a reference sequence vary, and may involve choosing a well-known correct sequence or establishing a consensus from the set of previous examples. In certain cases, researchers might use region-specific references that better represent the viral strains circulating in a particular geographic area.
In the context of genotyping SARS-CoV-2, several studies have been published. These studies typically rely on using a single MSA program and selecting the SARS-CoV-2 Wuhan-Hu-1 isolate (GenBank sequence accession NC 045512.2) as a reference sequence. In the study by Yin et al. [8], SARS-CoV-2 was genotyped for 33 countries, excluding Saudi Arabia, using Clustal Ω . This method demonstrated that genome SNPs can effectively track and monitor the transmission of SARS-CoV-2, linking them to geographic and temporal infectious clusters. Another study [9] genotyped 10,664 sequences for 73 countries, including Saudi Arabia. The focus of the study was to investigate SARS-CoV-2 for the population of India. They used Clustal Ω for alignment and identified SNPs, including unique ones for each country; notably, they used consensus sequences as a reference instead of the SARS-CoV-2 Wuhan-Hu-1 isolate. In their research, they found twelve SNPs for Saudis; however, the number of sequences per country was not reported. There have been previous works focusing specifically on Saudis, all of which used the MSA program and utilized the SARS-CoV-2 Wuhan-Hu-1 isolate as a reference. These include one that genotyped 164 sequences with the Clustal Ω program and a selected reference sequence [10]. Another study genotyped only three sequences for Saudis [11], while a third genotyped sequences for multiple countries, including 149 sequences for Saudis, using only the MAFFT program [12].

1.2. Problem Statement

Despite the existence of various MSA programs, none provides an optimal MSA solution. From a computer science perspective, it has been proven that MSA is an NP-hard optimization problem [13]. Thus, finding an optimal MSA solution is not feasible, and most current MSA programs use heuristic approaches to develop near-optimal solutions. Due to their heuristic nature, it is challenging to determine whether one solution is better than another without testing them on a targeted dataset. As reported in several studies [7,14], there is no guarantee that a perfectly optimized MSA program will be the best for all types of alignment in bioinformatics. In [5], the authors suggested that assembling independent MSA solutions into one MSA solution can boost accuracy. Therefore, MSA programs need to be benchmarked for the specific dataset being used. Previous studies have benchmarked MSA programs on various types of datasets [7,15,16]. In the context of genotyping SARS-CoV-2, the majority of the documented findings predominantly depend on a single MSA program.
In this study, we concentrate on genotyping SARS-CoV-2 within the Saudi population. To analyze and compare mutations, including SNPs, across individuals, a reference sequence is generally included in the sequence set before conducting alignments. The Wuhan-Hu-1 isolate has commonly served as a reference sequence for comparing mutations across individuals, particularly those from diverse populations. On the other hand, a consensus sequence is the preferred reference when conducting a study in a specific geographic area, especially in cases where there is a lack of widely recognized regional references. The authors of [17] have suggested that switching to a consensus sequence as a reference can offer important advantages over the continued use of the current reference.
There are limited studies on genotyping SARS-CoV-2 within the Saudi population with a sufficiently large number of sequences. The number of sequences profoundly influences the interpretation and significance of identified SNPs. With only a few sequences, the detected SNPs may lack representativeness or reliability. Conversely, a larger number of sequences can yield a more robust and comprehensive understanding of genetic variations within a population, enhancing confidence in the reported SNPs and facilitating the discovery of rare ones.
The work in [9] reports some SNPs for Saudis but does not specify the number of sequences used. The maximum number of sequences used was in [10], where they genotyped 164 sequences. There are more than five times the reported sequences for the Saudi population. In addition to the limited number of sequences used, only one MSA program is employed, such as Clustal Ω in [10] or the MAFFT program in [12]. All the previous studies did not investigate what is the genetic relationships and transmission dynamics of Saudi SARS-CoV-2 and how it is. differ from the global SARS-CoV-2 dataset.

1.3. Research Questions and Significance of the Study

This study aims to address the following key aspects when evaluating MSA programs and genotyping SARS-CoV-2 for the Saudi population:
  • How do individual MSAs, specifically Clustal Ω , MAFFT, and MUSCLE, compare in terms of accuracy and efficiency?
  • What is the comparative performance of MSAs assembled using MergeAlign against individual MSA solutions?
  • How does a reference sequence such as the SARS-CoV-2 Wuhan-Hu-1 isolate compare with consensus sequences in terms of their effectiveness for genotyping?
  • How many SNPs and mutations occur specifically within the coding regions of the Saudi SARS-CoV-2 dataset, and how does this compare with results published globally?
  • How do the genetic relationships and transmission dynamics of the Saudi SARS-CoV-2 dataset differ from the global SARS-CoV-2 dataset?
This study holds significant implications for the fields of genomics and virology, and addresses key aspects involved in the evaluation of Multiple Sequence Alignment (MSA) programs and genotyping of SARS-CoV-2 for the Saudi population. By meticulously comparing the accuracy and efficiency of individual MSAs, specifically, Clustal Ω , MAFFT, and MUSCLE, alongside assessing the performance of the assembled MSA solutions using MergeAlign, this research offers valuable insights for researchers seeking to select optimal alignment strategies. Furthermore, this study explores the comparative effectiveness of reference sequences such as the SARS-CoV-2 Wuhan-Hu-1 isolate against consensus sequences in the genotyping process. A focused analysis within coding regions of the Saudi SARS-CoV-2 dataset reveals the occurrence of Single-Nucleotide Polymorphisms (SNPs) and mutations, providing insights into potential functional implications. Additionally, the global comparative genotyping aspect can enhance the understanding of regional genetic variations and contribute to a broader knowledge base of SARS-CoV-2 genomics. Overall, the outcomes of this research have wide-ranging applications in genomics, and can guide future research directions while informing public health strategies, particularly in the context of emerging viruses. In addition, this research holds great significance in that it reveals unique genetic traits and transmission dynamics in Saudi SARS-CoV-2 data that are distinct from the global dataset. This understanding provides crucial insights into how the virus adapts and spreads within the Saudi population. Moreover, the discovery of frequent genetic variations linked to its evolution can enrich our comprehension of SARS-CoV-2 diversity, benefiting targeted interventions, surveillance efforts, and the development of tailored vaccines for Saudi Arabia.

2. Methodology

This section outlines the methodology employed for the genotyping of SARS-CoV-2 genomes for the Saudi population and the subsequent analysis of transmission behaviors. We first prepared the dataset to ensure data integrity and relevance. Then, we selected a reference sequence for the multiple sequence alignment (MSA) and an MSA for genotyping. We used a genotyping program to identify mutations and single nucleotide polymorphisms (SNPs, which are a type of mutation) in the SARS-CoV-2 genome. Next, we tracked transmission clusters and virus spread. Finally, we evaluated the methodology’s accuracy and efficiency using performance evaluation metrics and described the hardware and software configurations used in the experiments. This methodology is designed to be robust and efficient, providing valuable insights into the epidemiology of SARS-CoV-2 in Saudi Arabia. Figure 1 depicts the pipeline for both approaches.
Table 1 lists all of the abbreviations used in this paper, along with their definitions. This makes it easy for readers to look up and understand any abbreviations that they come across while reading the paper.

2.1. Dataset and Preprocessing

Complete SARS-CoV-2 sequences from infected Saudis were downloaded from the GISAID database on 16 January 2021 [18]. There were a total of 912 complete genome sequences. The length of the sequences ranged from 29,300 to 30,643, with an average length of 29,882. We relied on the GISAID database for SARS-CoV-2 genotyping because it is the largest and most comprehensive database of SARS-CoV-2 genome sequences GISAID is a global initiative that provides open access to SARS-CoV-2 genomic data. The database is updated regularly with new sequences from all over the world.
Complete sequences refer to entire viral genomes without missing regions. This ensures that the analysis encompasses the entire genetic makeup of the virus. High-coverage sequences have sufficient depth of sequencing, meaning that each position in the genome has been sequenced multiple times. High coverage helps to reduce errors and uncertainties in the sequencing data. The emphasis is on complete and high-coverage sequences to ensure the accuracy and reliability of the genotyping process, allowing researchers to identify all of the genetic variants in the virus. This is important for tracking the evolution of the virus and for developing effective vaccines and diagnostic tests. Therefore, in this study we only considered the complete and high coverage sequences [19], which were only 746 of the 912 sequences.
Removing sequences that contain ‘NNNNN’, where ‘N’ indicates uncertainty about the correct base, is done for several reasons, First, ‘NNNNN’ typically represents regions of uncertainty in the sequencing data. Removing such sequences helps to maintain the overall quality of the dataset. Second, genotyping requires precise information about the viral genome. Sequences with ambiguous bases can introduce uncertainties, affecting the accuracy of genotyping results. Third, the removal of sequences with ambiguous bases ensures a more robust analysis. It allows researchers to focus on sequences with clear and reliable information, leading to more accurate genotyping outcomes. Therefore, in this study we consider only sequences without ‘NNNNN’, after which the number of sequences shrinks again to 641.
Table 2 describes the raw dataset and the dataset after preprocessing by using only complete and high coverage sequences and filtering out any sequences that contained ‘NNNNN’.

2.2. Reference Sequence Selection Approaches

Adding a reference sequence before alignment is standard in SARS-CoV-2 genotyping for alignment standardization, variant identification, comparative analysis, and annotation. The reference provides a standardized baseline, aiding in consistent and accurate alignment. It serves as a baseline for identifying genetic variants, enabling mutations to be pinpointed. A common reference allows easy comparison between different samples, aiding in the identification of genomic differences. Reference-based genotyping facilitates annotation and interpretation of genomic variations by determining the functional significance of mutations in relation to known genomic features
The selection of the reference sequence depends on the specific study. Because the scope of this study focuses on genotyping SARS-CoV-2 for the Saudi population, there are two major approaches to selecting the reference sequence: the Wuhan-Hu-1 reference sequence, and regional reference.

2.2.1. Reference-Based Approach

The first approach is to use the Wuhan-Hu-1 Reference Genome (GenBank accession number: NC-045512.2) [20]. This reference sequence is the genetic makeup of the first identified isolate of SARS-CoV-2 in Wuhan, China. It served as a benchmark for early genomic studies of the virus [8,21]. In this study, we set the reference sequence to be the Wuhan-Hu-1 Reference Genome, which is considered the most common reference sequence. We refer to this approach of selecting reference sequences in the paper as the reference-based approach. We conducted the reference-based approach to enable a comparison between results for the Saudi population and those published for the global population.

2.2.2. Consensus-Based Approach

The second approach is to use a regional references. In certain cases, researchers might use region-specific reference sequences that better represent the viral strains circulating in a particular geographic area. This approach acknowledges that the virus can exhibit regional variations and mutations, with a locally relevant reference sequence enhancing the accuracy and applicability of genotyping efforts. Because the primary focus of this study is the Saudi population, we consider this approach.
To select the regional reference, we followed the same method described in [21] for genotyping SARS-CoV-2 in the Indian population. This method is based on finding a consensus sequence, a sequence that is created by combining and averaging the sequences of many different individuals to be as accurate as possible. First, various multiple sequence alignment (MSA) programs are used to create different consensus sequences. Next, the consensus sequence of the MSA solution that is as accurate as possible is used as the reference sequence. The accuracy of a consensus sequence is measured by a consensus score [22]. We refer to this approach for selecting a consensus sequence from a specific region as the consensus-based approach. Further details regarding the creation and evaluation of consensus sequences follow below.
In their paper titled “Is it time to change the reference genome?” [17], Ballouz et al. argued that it may be time to switch from using the current human reference genome to a consensus reference genome. This change would make the reference genome more representative of the human population as a whole than the current reference genome, which is based on a single individual. The authors contend that switching to a consensus reference genome would offer several advantages, including improved accuracy of variant calling, reduced false positives, and improved interpretation of genetic data. Overall, the authors make a convincing case that it may be time to switch to using a consensus reference genome. Therefore, in this study we compare and contrast the reference-based approach and the consensus-based approach in the context of genotyping SARS-CoV-2 for the Saudi population.

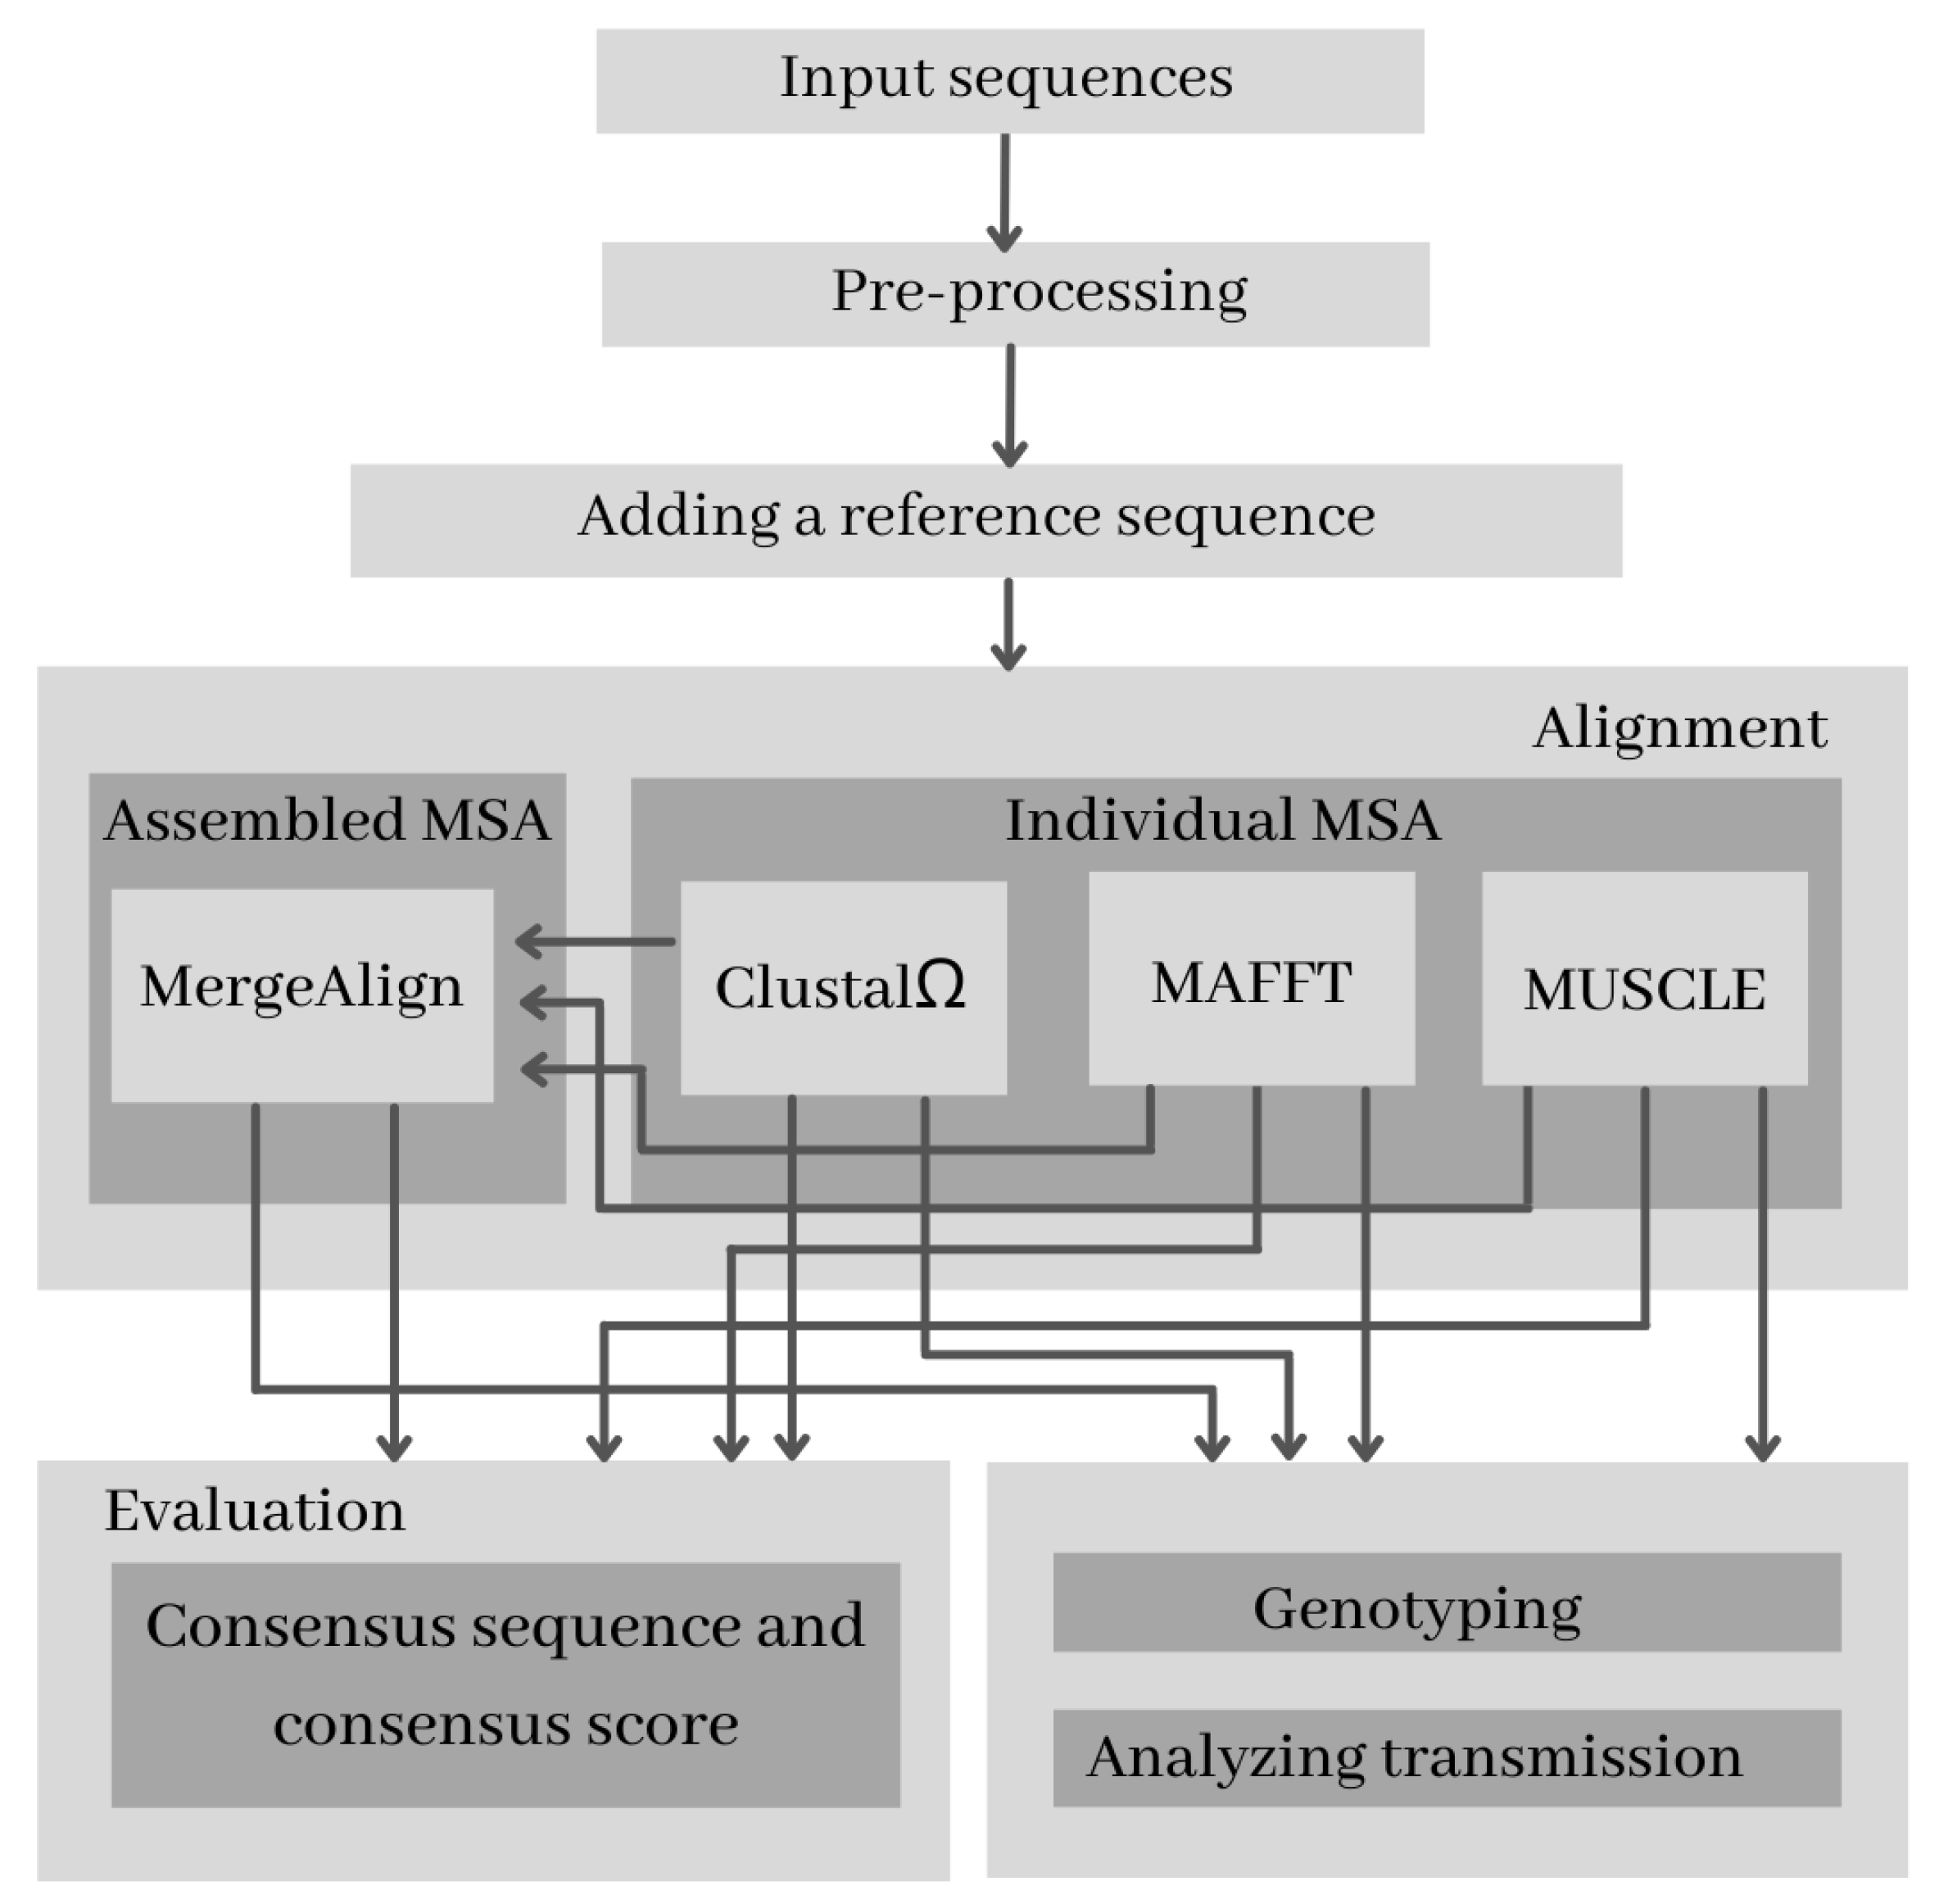
2.3. Alignment Selection Approaches

Sequence alignment is a fundamental step in genotyping SARS-CoV-2, providing valuable insights into genetic diversity, variants, transmission patterns, and population-specific adaptations. To genotype SARS-CoV-2, we must identify regions of similarity and difference among the genomes of various virus samples. This involves aligning sequences from multiple samples and comparing them. Alignment is the process of arranging two or more sequences to maximize their similarity.
The alignment process utilizes various programs that consider the similarity of individual nucleotides and the overall structure of sequences. With the sequences aligned, regions of similarity and difference can be identified. Similar regions are likely crucial for viral function, while differing regions may be associated with mutations affecting transmissibility, virulence, or immune system evasion.
In the context of genotyping SARS-CoV-2, two alignment approaches are employed: individual MSA alignment and assembled MSA alignment. The individual MSA approach relies on a single MSA alignment program, while the assembled MSA approach combines alignments from multiple individual MSA programs. However, when only an individual MSA program is used, the rationale behind the specific program selection remains unclear. Conversely, when employing an assembled MSA program, it is unclear how the assembled MSA compares to individual MSA alignment. Furthermore, the construction process of the assembled MSA alignment from a set of individual MSA alignments lacks clarity.
In this study, we aim to address these gaps by thoroughly investigating both alignment approaches.

2.3.1. Individual MSA Alignment

In accordance with [21], we individually aligned the dataset sequences using three MSA programs: Clustal Ω [2], MAFFT [3], and MUSCLE [4]. We chose these three programs because they are widely used and have been shown to be effective for aligning SARS-CoV-2 genomes.
Clustal Ω is a progressive MSA program that uses a guide tree to align the sequences. The guide tree is a phylogenetic tree that shows the evolutionary relationships between the sequences. Clustal Ω first aligns the two most closely related sequences, then iteratively aligns the remaining sequences to the aligned pair. While Clustal Ω is a very accurate MSA program, it can be slow to align large datasets, and is known to be sensitive to the order in which the sequences are input.
MAFFT is a fast and accurate MSA program that uses a variety of heuristics to improve performance. MAFFT is known to be robust to the order in which the sequences are input. MAFFT uses a variety of alignment strategies, including pairwise alignment, progressive alignment, and iterative refinement. MAFFT uses a variety of scoring schemes to evaluate different alignments.
MUSCLE is a fast and accurate MSA program that uses a progressive alignment approach. MUSCLE is known to be robust to the order in which the sequences are input. MUSCLE uses a variety of heuristics to improve performance, such as distance estimation using k-mer counting and tree-dependent restricted partitioning.
In summary, Clustal Ω is known for its accuracy and progressive alignment strategy with HMMs, while MAFFT is renowned for its speed, scalability, and diverse programs for different sequence characteristics. Finally, MUSCLE is recognized for its accuracy, efficiency, and iterative refinement for optimal alignments.
The choice of which MSA program to use often depends on the specific characteristics of the dataset and the goals of the analysis. Researchers may select the program that best suits their requirements in terms of accuracy, speed, and ability to handle specific types of sequences. Despite the published work in genotyping SARS-CoV-2 using these MSA programs, none of the studies have addressed this question.

2.3.2. Assembled MSA Alignment

Assembled MSA Alignment refers to methods that combine or merge the results of individual MSA Alignments into a single, comprehensive alignment. These methods take outputs from different MSA programs and integrate them, leveraging the strengths of each program to potentially improve the overall accuracy and coverage of the alignment. Therefore, assembled MSA alignment is anticipated to yield superior results compared to the best individual MSA alignment [5]. While there are a limited number of MSA programs that offer an assembled MSA alignment from multiple MSA alignments, in this study we leverage the MergeAlign program [6] for the assembly process.
MergeAlign is a dynamic programming program that constructs a consensus alignment from multiple input MSA alignments. It has several advantages, including accuracy, robustness to noise and errors, and scalability to align large datasets. We chose the MergeAlign program because it has been shown to be effective for generating assembled MSA solutions for genomes.

2.4. Genotyping

When aligning a sequence with a reference sequence, the identification of single nucleotide polymorphisms (SNPs) or mutations involves recognizing character changes between the two sequences. According to [23], the key distinction between an SNP and a mutation lies in their frequency. Mutations typically occur less than 1% of the time, while SNPs occur more than 1% of the time.
In this study, we present the count of identified SNPs and mutations comprising two components: all SNPs and mutations, and high-frequency SNPs. We investigate both the entire genomic regions, more specifically concentrating on coding regions for each of these aspects.
Concerning high-frequency SNPs, we classified them into two types, those occurring more than 5% of the time and those occurring more than 10% of the time. We provide this comprehensive information to enable valid comparisons with published works in different regions and globally, as ours is the first study to extensively focus on the Saudi population.
The collection of all SNP and mutation pairs discovered between a specific sequence and the reference sequence is termed the SNP profile. This SNP profile essentially represents the genotype of the virus. Analyzing SNP profiles is crucial for studying transmission, as it helps identify highly frequent SNPs and allows for comparisons with globally reported SNP profiles [8]. Genotyping can be used to identify new variants of SARS-CoV-2. New variants can arise when the virus mutates. Certain mutations can make the virus more transmissible, more virulent, or more resistant to vaccines and treatments. By genotyping SARS-CoV-2 samples, researchers can identify new variants early on and take steps to mitigate their impact.
In our study, both the reference-based and consensus-based approaches were employed for genotyping. For each approach, we genotyped all three MSA solutions produced by each individual MSA program in addition to the MergeAlign solution.

2.5. Analyzing Transmissions

The transmission behavior of a virus can be learned by investigating the relationships between the SNP profiles of infected genomes in depth.
Let A and B be two SNP profiles for two sequences. Similarly to [8], the directed Jaccard distance D J ( A , B ) of two SNP profiles A and B can be used as a measure of their mutual relationship, as follows:
D J ( A , B ) = A B A B A B , if A B A A B A B A B , if A B B
The directed Jaccard distance ( D J ) calculates the relationship between two sequences based on their SNP profiles; D J ( A , B ) is positive if B is a descendant of A and negative if A is a descendant of B.
If a sequence has many descendants in the MSA solution, then it is conferred with high transmissibility.
The Clustal Ω program was employed with the reference sequence to align the global dataset [8]. Therefore, we utilized the SNP profiles resulting from the Clustal Ω solution in our reference-based approach for a fair comparison between previously published works and our study of the Saudi population.

2.6. Performance Evaluation Metrics

In the performance evaluation process, we considered the computational resources, including the Execution Time (EX) and the maximum RAM usage during the program’s runtime (MAX RAM). Additionally, we took into account the level of accuracy using the consensus score
In the evaluation of Execution Time (EX), we calculated the execution time of the program from when the program starts running until the end in seconds.
For the evaluation of Maximum RAM usage (MAX RAM), we determined the percentage of used RAM by subtracting the available memory from the total memory, then dividing by the total memory and multiplying by 100.
M A X R A M = t o t a l m e m o r y a v a i l a b l e m e m o r y t o t a l m e m o r y × 100
In our evaluation of accuracy, we used the consensus score [22], which is a minimization function. Let A be an MSA solution represented in an K × L matrix and let A [ ] [ j ] be an arbitrary column of A. Then, the character x j is called the j t h consensus-character ( x j = x j ) when
x j = a r g m i n x j A [ ] [ j ] i = 1 K d ( x j , A i j ) ,
where d ( ) is a consensus-error function. The concatenation of the consensus characters provides the consensus sequence. Hence, the goal is to find an alignment that minimizes the consensus error across all columns. The cost f ( A ) is defined as follows:
f ( A ) = j = 1 L i = 1 K d ( x j , A i j ) .
For any given two characters x and y, let the consensus error function d ( x , y ) be defined as follows.
d ( x , y ) = 2 x y , ( x , y ) × 1.5 x = OR y = , ( x , y ) ( , ) 0 o t h e r w i s e

2.7. k-Tuple Size Selection

The k-th parameter in MSA programs represents the size of the k-tuple, which is a sequence of k consecutive characters in a sequence. Multiple Sequence Alignment (MSA) programs utilize k-tuples to identify similar sequences and align them.
The significance of the k-tuple size (k) in MSA programs such as Clustal Ω , MAFFT, and MUSCLE is crucial for determining how the programs identify and align sequences. The role of the k-tuple size across these programs involves a trade-off between sensitivity and specificity. Smaller values of k enhance sensitivity to local similarities, while larger values improve specificity by considering broader regions. Researchers often experiment with different values of k to find an optimal setting based on the nature of the sequences being aligned and the specific goals of the analysis.
The choice of the k-tuple size influences the computational efficiency of the alignment process. Larger k values generally lead to faster computations, but may sacrifice sensitivity to fine-scale sequence features.
Notably, the use of the k value may vary among programs. Clustal Ω and MUSCLE directly utilizes the k-tuple algorithm, while MAFFT incorporates two filtering steps, first through the FFT program and second through the k-tuple (similar to other programs).
In this study, we investigate the impact of the k-tuple size on the efficiency of Clustal Ω , MAFFT, and MUSCLE considering k values of 4 , 6 , 8 , 10 . For comparison with other published works on SARS-CoV-2 genotyping and transmission behavior in the Saudi population, we selected k = 6 .

2.8. Experimental Environment

To conduct the experiments, we set the system configuration as follows: a PC with the Ubuntu 20.10 operating system running on VMware on a 64-bit Windows 10 platform. The specified RAM memory for Ubuntu was 16 GB. For implementation, we employed Python version 3.9 and the Biopython version 1.78 libraries [24].
In the case of MSA programs, we ran Clustal Ω version 1.2.4 [2], MAFFT version 7 [3], and MUSCLE version 5 [4]. The default parameters were used, except for Clustal Ω , where we modified the k value in the k-tuple from 4 to 6 to maintain uniformity with MAFFT and MUSCLE.

3. Results and Discussion

This section presents the following two parts: (i) evaluating the performance of MSA programs and (ii) genotyping SARS-CoV-2 for the Saudi population.

3.1. Evaluating the Performance of MSA Programs

In this section, we present an evaluation of the performance of MSA programs while considering their utilization of computational resources, assessing accuracy levels, and examining the influence of k-tuple size selection.

3.1.1. Computational Resources Usage

We have examined the performance of each individual MSA program (Clustal Ω , MUSCLE, MAFFT) and the assembled MSA program (MergeAlign) from a computational perspective. Table 3 displays the calculated execution time and the percentage of maximum RAM usage for each MSA program.
MAFFT stands out as the fastest program among the three individual programs, completing an MSA solution in approximately 4.7 minutes. It is 99.85% and 99.70% faster than Clustal Ω and MUSCLE, respectively. Additionally, MAFFT exhibits the lowest percentage of maximum RAM usage, consuming 85% and 88.55% less memory than Clustal Ω and MUSCLE, respectively.
Conversely, Clustal Ω is the slowest program, taking around 51 h to produce an MSA solution. MUSCLE, on the other hand, has the highest maximum RAM usage at 81.2 % .
The assembled MSA solution by MergeAlign appears computationally economical, taking 1.6 min and utilizing only 17.9 % of maximum RAM. As the assembled MSA solution requires individual MSA solutions initially, the overall time is influenced by the slowest individual MSA program.
MAFFT’s speed is attributed to its use of the FFT program, streamlining the entire process. The FFT output identifies similar subsequences between pairs of sequences, and operates on these subsequences rather than the entire sequence lengths. In light of MAFFT’s superior speed and minimal RAM usage, we compared the remaining programs relative to it; refer to Table 4.
Our findings underscore significant differences among MSA programs in terms of time and space. MAFFT is recommended, especially when dealing with large DNA datasets such as those for SARS-CoV-2.

3.1.2. Accuracy of MSA Programs

In our investigation, we examined the impact of selecting the MSA program on the resulting MSA solution. As expected, the assembled solution using MergeAlign demonstrated the highest accuracy score in both reference-based and consensus-based approaches, while both MAFFT and MUSCLE exhibited accuracy levels similar to MergeAlign. Clustal Ω , traditionally used as the standard MSA program, was surprisingly outperformed by MAFFT and MUSCLE, with MAFFT being 5.4% more accurate and MUSCLE being 5% more accurate in both the reference-based and consensus-based approaches. The computed consensus scores for each MSA solution in both approaches are detailed in Table 5.
Evaluation of all MSA solutions from both approaches using the consensus score revealed that adding reference sequences to a large dataset of SARS-CoV-2 had no significant impact on the alignment process. In fact, there were slight improvements in all solutions using the consensus-based approach; however, these enhancements were relatively small. MAFFT exhibited the highest enhancement percentage at 0.17%, followed by Clustal Ω at 0.1%, then MergeAlign 0.09%, and finally MUSCLE 0.04%.
MAFFT and MUSCLE demonstrated similar accuracy levels, both utilizing the PAM substitution matrix. In contrast, Clustal Ω employed the HHalign package based on Hidden Markov Models within machine learning, resulting in the least accurate outcomes in both approaches. Furthermore, while MUSCLE is an iterative program and MAFFT is not, the results indicate that more iterations do not necessarily lead to increased accuracy.
In conclusion, determining the most suitable MSA program for a targeted dataset is challenging due to their heuristic nature, necessitating testing on the specific dataset. For our dataset of DNA for SARS-CoV-2, MAFFT emerged as the most accurate individual program.

3.1.3. The Impact of the k Value

All individual MSA programs (Clustal Ω , MUSCLE, MAFFT) utilize k-tuples to identify similar sequences and align them. Thus, it is useful to study the impact of the selected k values on individual MSA programs. In addition, we report the impact of k values on the assembled MSA program. To study the impact of the k value, we chose 10% of the data randomly (64 sequences), then ran each program with the values of k = 4, 6, 8, and 10. We report both the accuracy and computation resources.
Table 6 reports the consensus score for individual MSA programs and the assembled MSA program. The results show that smaller values of k make the k-tuple algorithm more sensitive to local similarities because it is more likely that two short subsequences will be identical than two longer subsequences. Larger values of k make the k-tuple algorithm more specific to broader regions, as two longer subsequences are less likely to be identical by chance.
Table 7 reports the execution time for individual MSA programs and the assembled MSA program. The results show that the choice of the k-tuple size influences the computational time of the alignment process. As expected, larger values of k generally lead to faster computations, but may sacrifice sensitivity to fine-scaled sequence features.
Table 8 reports the percentage of maximum RAM usage for each MSA program. The results show that the choice of the k-tuple size influences the peak RAM usage, with larger k values generally leading to smaller memory consumption.
When comparing individual MSAs for a fixed value of k, our observations hold with respect to computational resource usage and the accuracy of MSA programs.
Researchers often experiment with different k values to find an optimal setting based on the nature of the sequences being aligned and the specific goals of the analysis. Because the goal of this study is to discover SNPs and mutations for Saudi SARS-CoV-2 and compare them with published results globally, we used the most commonly used value in this setting, which is k = 6.

3.2. Genotyping SARS-CoV-2 for the Saudi Population

In this section, we present key aspects of our analysis SARS-CoV-2 in the Saudi population, including details on the number of identified SNPs and mutations, a comparative study of high-frequency SNPs between the Saudi population and the global occurrences of SARS-CoV-2, and an in-depth exploration of transmission patterns.

3.2.1. Discovered SNPs and Mutations

In this section, we provide information on the quantity of identified SNPs and mutations consisting of two segments, namely, all SNPs and mutations and only high-frequency SNPs. For each of these aspects, we examine both the entire genomic regions with a specific focus on coding regions. We present the results in the following order: (I) identified SNPs and mutations, (II) identified SNPs and mutations within coding regions, (III) identified high-frequency SNPs, and (IV) identified high-frequency SNPs within coding regions.

Identified SNPs and Mutations

When considering all SNPs and mutations, our results indicate consistent numbers of discovered SNPs for Clustal Ω , MAFFT, and MergeAlign in both the reference-based and consensus-based approaches. Similarly, the number of mutations remains fixed for Clustal Ω and MergeAlign, with only MAFFT showing an increase of one mutation in the consensus-based approach. In contrast, MUSCLE exhibits variations, with a decrease of 11.63% for SNPs and 3.21% for mutations in the consensus-based approach.
Refer to Table 9 for a detailed overview of the discovered SNPs and mutations for all four programs in both approaches.
Taking MergeAlign as the baseline, MAFFT consistently matches the number of SNPs, while showing one additional mutation in the consensus-based approach. Clustal Ω has 8.57% more SNPs in both approaches. Meanwhile, MUSCLE exhibits 25.58% and 15.79% more SNPs in the reference-based and consensus-based approaches, respectively.
For mutations, MAFFT matches MergeAlign in both the reference-based and the consensus-based approaches. Clustal Ω has 3.0% more mutations in both approaches. In contrast, MUSCLE has 3.43% fewer mutations in the reference-based approach and 6.53% fewer mutations in the consensus-based approach.
MAFFT’s results closely align with MergeAlign, while MUSCLE consistently shows the highest number of SNPs and the lowest number of mutations in both approaches.
Considering Clustal Ω and MAFFT as progressive programs with similar SNP and mutation counts, MUSCLE, as an iterative program, demonstrates distinctive characteristics, exhibiting the lowest mutation count and the highest SNP count in both approaches. This suggests that programs within the same class generally produce comparable numbers of SNPs and mutations.

Identified SNPs and Mutations Inside Coding Regions

When considering SNPs and mutations within coding regions only, our results indicate a reduction in the number of discovered SNPs and mutations across all programs. In both approaches, the number of SNPs and mutations in Clustal Ω is reduced by 17.14% and 13.63%, respectively. In MAFFT, the number of SNPs in both approaches decreases by 9.4%, while the number of mutations is reduced by 10.95% and 11.1% in the reference-based and consensus-based approaches, respectively. For MUSCLE, the number of SNPs is reduced by 16.28% and 10.53% in the reference-based and consensus-based approaches, respectively, while the number of mutations decreases by 8.5% and 4.2%, respectively. The number of SNPs and mutations for Clustal Ω , MAFFT, and MergeAlign become the same. Simultaneously, MUSCLE has 19.44% and 14.7% more SNPs compared to the other programs in the reference-based and consensus-based approaches, respectively. Additionally, MUSCLE has 0.55% more mutations in the consensus-based approach and 0.73% fewer mutations in the reference-based approach. Refer to Table 10 for details on the number of SNPs and mutations inside coding regions for the four programs considered in both approaches.

Identified High-Frequency SNPs

Considering that high-frequency SNPs occur more than 5% of the time, our results indicate a reduction in the number of discovered SNPs and mutations across all programs. A comparison with the results in Table 9 reveals that the number of SNPs for MergeAlign and MAFFT are identical, with a 50% reduction in both approaches. In Clustal Ω , the number of SNPs decreases by 57.14% and 51.43% in the reference-based and consensus-based approaches, respectively. For MUSCLE, the number of SNPs is reduced by 27.9% and 34.2% in the reference-based and consensus-based approaches, respectively. Refer to Table 11 for detailed information on the number of SNPs greater than 5% for the four programs in both approaches.
Similarly, when considering that high-frequency SNPs occur more than 10% of the time, our results show a reduction in the number of discovered SNPs and mutations in all programs. Comparing these results with the number of SNPs in Table 9 reveals that the numbers of SNPs for MergeAlign and MAFFT become the same in each approach, with a reduction of 62.5% and 68.75% in the reference-based and consensus-based approaches, respectively. In Clustal Ω , the number of SNPs was reduced by 65.71% and 71.43% in the reference-based and consensus-based approaches, respectively. For MUSCLE, the number of SNPs is reduced by 53.6% and 34.2% in the reference-based and consensus-based approaches, respectively. See Table 11 for details on the number of SNPs greater than 10% for the four programs in both approaches.

Identified High-Frequency SNPs Inside Coding Regions

When considering high-frequency SNPs occurring more than 5% of the time and only within coding regions, our results reveal a reduction in the number of discovered SNPs and mutations for all programs. A comparison with the results for SNPs within coding regions in Table 10 indicates that the numbers of SNPs for MergeAlign and MAFFT become identical, with a 51.73% reduction in both approaches. In Clustal Ω , the number of SNPs is reduced by 58.62% and 51.73% in the reference-based and consensus-based approaches, respectively. For MUSCLE, the number of SNPs is reduced by 27.77% and 35.3% in the reference-based and consensus-based approaches, respectively. Refer to Table 12 for details on the number of SNPs greater than 5% for the four programs considered in both approaches.
Similarly, when considering high-frequency SNPs occurring more than 10% of the time and only within coding regions, our results show a reduction in the number of discovered SNPs and mutations for all programs. A comparison with the results for SNPs within coding regions in Table 10 indicates that the numbers of SNPs for MergeAlign, MAFFT, and Clustal Ω become identical in both approaches, with a reduction of 62.06% and 65.51% in the reference-based and consensus-based approaches, respectively. For MUSCLE, the number of SNPs is reduced by 36.11% and 52.94% in the reference-based and consensus-based approaches, respectively. See Table 12 for details on the number of SNPs greater than 10% for the four programs considered in both approaches.
MUSCLE employs a distinctive method for calculating pairwise distance, utilizing k-tuples for unaligned sequences and the Kimura distance for aligned sequences. Subsequently, progressive alignment involves a profile function known as the log expectation score. Notably, MUSCLE exhibits distinctive behavior by exhibiting the fewest gaps and the highest number of SNPs in all scenarios.

3.2.2. Comparing High-Frequency SNPs between the Saudi and Global SARS-CoV-2 Datasets

There are two global datasets available for comparison with our work. We compared high-frequency SNPs (>10%) of SARS-CoV-2 in our Saudi dataset with the global datasets in [8,9] and the Indian dataset in [9]. Refer to Table 13 for more details.
The global dataset in [8] consists of 558 sequences, the global dataset in [9] comprises 10,098 sequences, the Indian dataset in [9] includes 566 sequences, and our Saudi dataset has 641 sequences. Across these datasets, there are 13 SNPs in the global dataset from [9], 17 SNPs in the Indian dataset [9], 11 SNPs in the Saudi dataset, and 11 SNPs in the global dataset from [8]. Specifically, positions 3037, 14,408, and 23,780 exhibit similarity across all datasets. Positions 3037, 14,408, 18,877, 22,444, 23,780, 25,563, 26,735, and 28,854 are common between the Indian and Saudi datasets. Positions 3037, 14,408, 23,403, 25,563, 28,881, 28,882, and 28,883 are shared between the global dataset [9] and the Saudi dataset. Additionally, positions 3037, 14,408, 23,403, 28,881, 28,882, and 28,883 exhibit similarity between the Saudi and global datasets [8]. Moreover, the Indian dataset has five unique SNPs, the global dataset [9] has one unique SNP, and the global dataset [8] has two unique SNPs.
Comparing our results with the global dataset [8], our findings reveal that the Saudi data exhibit higher frequencies in all positions than the global frequencies. This higher frequency pattern is attributed to the genetic similarity among individuals of the same ethnicity, as indicated by previous studies [25,26]. Higher frequencies imply a closer relationship among Saudi sequences compared to global sequences. In conclusion, our study underscores the significant regional variations in genotyping, emphasizing the importance of considering geographic diversity in genetic analyses.

3.2.3. Analyzing Transmissions

We conducted a comprehensive analysis of the genetic relationships and transmission dynamics of Saudi SARS-CoV-2 using the directed Jaccard distance. Subsequently, we compared our findings with the published results for global SARS-CoV-2 [8]. Specifically, we focused on Clustal Ω SNP profiles, as the global experiment exclusively utilized Clustal Ω for the alignment process. Following the alignment, we determined descendant relationships using the directed Jaccard distance.
Table 14 presents SNP co-mutations with high descendants for both Saudi and global SARS-CoV-2. Our results indicate that Saudi SARS-CoV-2 exhibits at least three times as many descendant relationships compared to global SARS-CoV-2. Furthermore, these descendants display a higher number of SNPs.
Within the Saudi SARS-CoV-2 dataset, there are ten sequences with a maximum of seven SNP co-mutations with high descendants. In contrast, the global SARS-CoV-2 dataset contains three sequences with a maximum of four SNPs co-mutations exhibiting high descendants. These highly frequent SNPs may be associated with the evolutionary patterns of the virus.
This observation underscores the notion that individuals from the same ethnicity tend to share similar SNPs [25,26].

4. Conclusions

The comparison among individual Multiple Sequence Alignments (MSAs), including Clustal Ω , MAFFT, and MUSCLE, revolves around assessing their accuracy and efficiency. MAFFT emerges as a standout performer in terms of efficiency and space usage, especially in the context of handling extensive DNA datasets such as those associated with SARS-CoV-2. Notably, MAFFT exhibits superior performance in efficiently managing computational resources and space, making it a recommended choice for large-scale genomic analyses. This finding underscores the importance of considering the efficiency of MSA programs to ensure optimal alignment outcomes, particularly when dealing with substantial genetic datasets.
Examining the comparative performance between assembled Multiple Sequence Alignments (MSAs) using MergeAlign and individual MSA solutions reveals that MAFFT and MUSCLE consistently exhibit higher accuracy than Clustal Ω . This observation holds true for both the reference-based and consensus-based approaches, underscoring the enhanced performance of assembly methods over individual solutions, particularly when utilizing MAFFT and MUSCLE.
In our evaluation of genotyping effectiveness, the comparison between a reference sequence exemplified by the SARS-CoV-2 Wuhan-Hu-1 isolate and consensus sequences was assessed through the consensus score. The results indicate that the addition of a reference sequence to a large dataset of SARS-CoV-2 does not impart a significant impact on the alignment process. The consensus score remains relatively consistent, suggesting that the use of a reference sequence such as the Wuhan-Hu-1 isolate may not substantially alter the genotyping outcomes when compared to consensus sequences derived from individual MSA alignments.
The investigation into the occurrence of Single Nucleotide Polymorphisms (SNPs) and mutations within coding regions of the Saudi SARS-CoV-2 dataset compared to global results reveals interesting patterns. Clustal Ω and MAFFT exhibit comparable counts of SNPs and mutations, while MUSCLE, characterized as an iterative program, stands out with distinctive features showcasing the lowest mutation count and the highest SNP count overall. Within coding regions, Clustal Ω , MAFFT, and MergeAlign converge in both SNPs and mutations, whereas MUSCLE consistently maintains higher SNPs specifically in coding regions. This observation emphasizes the influence of program types on the outcomes of SNPs and mutations.
In the analysis of high-frequency SNPs, MAFFT and MergeAlign exhibit identical outcomes over all genomes and within coding regions. This suggests that MAFFT stands out as the most accurate MSA program in the context of high-frequency SNPs.
Comparing high-frequency SNPs between Saudis and the global SARS-CoV-2 population, it becomes evident that Saudis consistently exhibit higher frequencies of these SNPs. This phenomenon is attributed to the genetic similarity among individuals of the same ethnicity, highlighting the importance of considering regional genetic variations in the genotyping of SARS-CoV-2.
The examination of genetic relationships and transmission dynamics between Saudi SARS-CoV-2 data and the global dataset reveals distinct patterns. In the context of transmissions, the Saudi SARS-CoV-2 dataset displays a higher frequency of co-mutations, with ten sequences featuring a maximum of seven SNP co-mutations and high descendants. In contrast, the global SARS-CoV-2 dataset consists of three sequences with a maximum of four SNPs co-mutations and high descendants. This observation suggests that Saudis exhibit more frequent co-mutations, indicating shared evolutionary patterns within individuals of the same ethnicity. These findings underscore significant regional variations in genotyping and emphasize the importance of considering geographic diversity in genetic analyses.

Author Contributions

Conceptualization, M.A.; methodology, M.A.; software, M.A.; validation, M.A. and A.A.; investigation, M.A. and A.A.; resources, M.A.; writing—original draft preparation, M.A. and A.A.; writing—review and editing, M.A.; supervision, M.A.; project administration, M.A.; funding acquisition, M.A. All authors have read and agreed to the published version of the manuscript.

Funding

This research was supported by the Deanship of Scientific Research, Imam Mohammad Ibn Saud Islamic University, Saudi Arabia, Grant No. (20-12-18-012).

Data Availability Statement

The data supporting the findings of this article are available in the Global Initiative on Sharing Avian Influenza Data (GISAID) at https://gisaid.org/, (accessed on 16 January 2021).

Conflicts of Interest

The authors declare no conflict of interest.

References

  1. Pearson, W. An introduction to sequence similarity (“homology”) searching. Curr. Protoc. Bioinform. 2013, 42, 3.1.1–3.1.8. [Google Scholar] [CrossRef] [PubMed]
  2. Sievers, F.; Wilm, A.; Dineen, D.; Gibson, T.; Karplus, K.; Li, W.; Lopez, R.; McWilliam, H.; Remmert, M.; Söding, J.; et al. Fast, scalable generation of high-quality protein multiple sequence alignments using Clustal Omega. Mol. Syst. Biol. 2011, 7, 539. [Google Scholar] [CrossRef] [PubMed]
  3. Katoh, K.; Misawa, K.; Kuma, K.; Miyata, T. MAFFT: A novel method for rapid multiple sequence alignment based on fast Fourier transform. Nucleic Acids Res. 2002, 30, 3059–3066. [Google Scholar] [CrossRef] [PubMed]
  4. Edgar, R. MUSCLE: Multiple sequence alignment with high accuracy and high throughput. Nucleic Acids Res. 2004, 32, 1792–1797. [Google Scholar] [CrossRef]
  5. Bucka-Lassen, K.; Caprani, O.; Hein, J. Combining many multiple alignments in one improved alignment. Bioinformatics 1999, 15, 122–130. [Google Scholar] [CrossRef]
  6. Collingridge, P.; Kelly, S. MergeAlign: Improving multiple sequence alignment performance by dynamic reconstruction of consensus multiple sequence alignments. BMC Bioinform. 2012, 13, 117. [Google Scholar] [CrossRef]
  7. Chatzou, M.; Magis, C.; Chang, J.; Kemena, C.; Bussotti, G.; Erb, I.; Notredame, C. Multiple sequence alignment modeling: Methods and applications. Briefings Bioinform. 2015, 17, 1009–1023. [Google Scholar] [CrossRef]
  8. Yin, C. Genotyping coronavirus SARS-CoV-2: Methods and implications. Genomics 2020, 112, 3588–3596. [Google Scholar] [CrossRef]
  9. Saha, I.; Ghosh, N.; Pradhan, A.; Sharma, N.; Maity, D.; Mitra, K. Whole genome analysis of more than 10000 SARS-CoV-2 virus unveils global genetic diversity and target region of NSP6. Briefings Bioinform. 2021, 22, 1106–1121. [Google Scholar] [CrossRef]
  10. Mok, P.; Koh, A.; Farhana, A.; Alsrhani, A.; Alam, M.; Suresh Kumar, S. Computational drug screening against the SARS-CoV-2 Saudi Arabia isolates through a multiple-sequence alignment approach. Saudi J. Biol. Sci. 2021, 28, 2502–2509. [Google Scholar] [CrossRef]
  11. Nour, I.; Alenazi, I.; Hanif, A.; Eifan, S. Molecular adaptive evolution of SARS-COV-2 spike protein in Saudi Arabia. Saudi J. Biol. Sci. 2021, 28, 3325–3332. [Google Scholar] [CrossRef] [PubMed]
  12. Sallam, M.; Ababneh, N.; Dababseh, D.; Bakri, F.; Mahafzah, A. Temporal increase in D614G mutation of SARS-CoV-2 in the Middle East and North Africa. Heliyon 2021, 7, e06035. [Google Scholar] [CrossRef]
  13. Wang, L. Algorithms for Multiple Sequences Alignment, Comparison of Trees, and Steiner Trees. Ph.D. Thesis, McMaster University, Hamilton, ON, Canada, 1995. [Google Scholar]
  14. Wang, Y.; Wu, H.; Cai, Y. A benchmark study of sequence alignment methods for protein clustering. BMC Bioinform. 2018, 19, 529. [Google Scholar] [CrossRef] [PubMed]
  15. Zhang, Y.; Zhang, Q.; Zhou, J.; Zou, Q. A survey on the algorithm and development of multiple sequence alignment. Briefings Bioinform. 2022, 23, bbac069. [Google Scholar] [CrossRef] [PubMed]
  16. Pais, F.; Ruy, P.; Oliveira, G.; Coimbra, R. Assessing the efficiency of multiple sequence alignment programs. Algorithms Mol. Biol. 2014, 9, 2014. [Google Scholar] [CrossRef]
  17. Ballouz, S.; Dobin, A.; Gillis, J. Is it time to change the reference genome? Genome Biol. 2019, 20, 159. [Google Scholar] [CrossRef]
  18. Shu, Y.; McCauley, J. GISAID: Global initiative on sharing all influenza data–from vision to reality. Eurosurveillance 2017, 22, 30494. [Google Scholar] [CrossRef]
  19. Sims, D.; Sudbery, I.; Ilott, N.; Heger, A.; Ponting, C. Sequencing depth and coverage: Key considerations in genomic analyses. Nat. Rev. Genet. 2014, 15, 121–132. [Google Scholar] [CrossRef]
  20. Wu, F.; Zhao, S.; Yu, B.; Chen, Y.; Wang, W.; Song, Z.; Hu, Y.; Tao, Z.; Tian, J.; Pei, Y.; et al. A new coronavirus associated with human respiratory disease in China. Nature 2020, 579, 265–269. [Google Scholar] [CrossRef]
  21. Saha, I.; Ghosh, N.; Maity, D.; Sharma, N.; Mitra, K. Inferring the genetic variability in Indian SARS-CoV-2 genomes using consensus of multiple sequence alignment techniques. Infect. Genet. Evol. 2020, 85, 104522. [Google Scholar] [CrossRef]
  22. Gusfield, D. Algorithms on Strings, Trees, and Sequences: Computer Science and Computational Biology; Cambridge University Press: Cambridge, MA, USA, 1997. [Google Scholar]
  23. Karki, R.; Pandya, D.; Elston, R.; Ferlini, C. Defining “mutation” and “polymorphism” in the era of personal genomics. BMC Med Genom. 2015, 8, 1–7. [Google Scholar] [CrossRef] [PubMed]
  24. Cock, P.; Antao, T.; Chang, J.; Chapman, B.; Cox, C.; Dalke, A.; Friedberg, I.; Hamelryck, T.; Kauff, F.; Wilczynski, B.; et al. Biopython: Freely available Python tools for computational molecular biology and bioinformatics. Bioinformatics 2009, 25, 1422–1423. [Google Scholar] [CrossRef] [PubMed]
  25. Huang, T.; Shu, Y.; Cai, Y. Genetic differences among ethnic groups. BMC Genom. 2015, 16, 1093. [Google Scholar] [CrossRef]
  26. Choudhury, A.; Hazelhurst, S.; Meintjes, A.; Achinike-Oduaran, O.; Aron, S.; Gamieldien, J.; Jalali Sefid Dashti, M.; Mulder, N.; Tiffin, N.; Ramsay, M. Population-specific common SNPs reflect demographic histories and highlight regions of genomic plasticity with functional relevance. BMC Genom. 2014, 15, 437. [Google Scholar] [CrossRef] [PubMed]
Figure 1. The pipeline for aligning, genotyping, and analyzing transmission of SARS-CoV-2. In the reference-based approach, the added reference sequence is the Wuhan-Hu-1 reference genome. In the consensus-based approach, the added reference sequence is the consensus sequence from the individual MSA alignment with the best consensus score.
Computation 11 00212 g001
Table 1. Abbreviations and definitions.
AbbreviationDefinition
MSAMultiple sequence alignment.
k-tupleA sequence of k adjacent items or elements in a set, often used in sequence analysis algorithms.
k-tuple AlgorithmIt is a heuristic method for finding the similarity of sequences by first finding shared k-tuple(s).
Individual MSA alignmentAn MSA alignment produced by a single MSA program.
Assembled MSA alignmentAn MSA alignment produced by combining the results of multiple MSA programs.
Well-known Reference sequenceA widely recognized and accepted sequence used as a standard or reference.
Consensus sequenceA sequence derived from the consensus of multiple sequences.
Consensus scoreA measure of how similar an MSA alignment is to its consensus sequence.
Reference-Based ApproachAn approach to MSA that uses a well-known reference sequence to align other sequences.
Consensus-Based approachAn approach to MSA that uses a consensus sequence to align other sequences.
SNPsSingle nucleotide polymorphisms.
High-frequency SNPsSNPs that occur frequently in a set of sequences (e.g., more than 5% or 10%).
SNP profileA collection of information about the occurrence and characteristics of all SNPs pairs found between a specific sequence. and the reference sequence.
Clustal Ω Clustal Omega a popular MSA program [2].
MAFFTMultiple Alignment using Fast Fourier Transform a popular MSA program [3].
MUSCLEMultiple Sequence Comparison by Log Expectation a popular MSA program [4].
MergeAlignA program for merging the results of multiple MSA programs [6].
Directed Jaccard DistanceA measure of the mutual relationship between two SNP profiles.
Table 2. Comparison of the raw dataset and the process dataset.
CharacteristicsRaw DatasetProcessed Dataset
Number of Sequences912641
Maximum length30,64330,643
Minimum length29,30029,300
Average Length29,88229,882
CompletenessNoYes
High coverageNoYes
Contains stretch of ‘NNNNN’YesNo
Table 3. Comparison of Execution Time (EX) and peak RAM usage (MAX RAM) of individual MSA programs (Clustal Ω , MUSCLE, MAFFT) and the assembled MSA program (MergeAlign).
ProgramETMAX RAM
Clustal Ω 182 , 891 s 50.8 h 62.1 %
MAFFT283 s 4.7 min 9.3 %
MUSCLE 93 , 261 s 26 h 81.2 %
MergeAlign97 s 1.6 min 17.9 %
Table 4. Comparison of Execution Time (EX) and peak RAM usage (MAX RAM) relative to MAFFT.
Program Program ET MAFFT ET Program MAX RAM MAFFT MAX RAM
Clustal Ω 646.3 6.68
MUSCLE 329.5 8.73
Table 5. Comparing the consensus score for each MSA solution using both the reference-based and the consensus-based approaches, and the percentage of enhancement when using the consensus-based approach.
ProgramRef.SeqCons.SeqEnhancement
Clustal Ω 13,934.513,920.5 0.1 %
MAFFT13,201.513,178.5 0.17 %
MUSCLE13,238.513,232.5 0.04 %
MergeAlign13,188.513,176.5 0.09 %
Table 6. The consensus score of individual MSA programs (Clustal Ω , MUSCLE, MAFFT) and the assembled MSA program (MergeAlign) when varying the k value in the k-tuple algorithm.
Program k = 4 k = 6 k = 8 k = 10
Clustal Ω 2764.5 2768.5 2852.5 2886.5
MAFFT 2526.5 2540.5 2583.5 2760.5
MUSCLE 2544.5 2568.5 2791.5 2854.5
MergeAlign 2520.5 2534.5 2558.5 2688.5
Table 7. The execution time (EX) of individual MSA programs (Clustal Ω , MUSCLE, MAFFT) and the assembled MSA program (MergeAlign) when varying the k value in the k-tuple algorithm.
Program k = 4 k = 6 k = 8 k = 10
Clustal Ω 29,042 s ≈ 8 h18,228 s ≈ 5 h13,571 s ≈ 3.77 h10,582 s ≈ 2.93 h
MAFFT60 s ≈ 1 min47 s31 s23 s
MUSCLE11,875 s ≈ 3.29 h9245 s ≈ 2.56 h7683 s ≈ 2.13 hrs5946 s ≈ 1.65 h
MergeAlign41 s27 s22 s18 s
Table 8. The peak RAM usage (MAX RAM) of individual MSA programs (Clustal Ω , MUSCLE, MAFFT) and assembled MSA program (MergeAlign) when varying the k value in the k-tuple algorithm.
Program k = 4 k = 6 k = 8 k = 10
Clustal Ω 40.6 % 37.4 % 32.5 % 28.2 %
MAFFT 9.7 % 9.1 % 8.8 % 7.9 %
MUSCLE 14.1 % 12.8 % 11.7 % 8.4 %
MergeAlign 12.3 % 11.5 % 10.9 % 9.5 %
Table 9. The number of SNPs and mutations for the Saudi SARS-CoV-2 dataset with respect to the four considered individual and ensemble MSA programs in the reference-based and consensus-based approaches.
Reference-BasedConsensus-Based
ProgramSNPsMutationsSNPsMutations
Clustal Ω 3563135631
MAFFT3261232613
MUSCLE4359138572
MergeAlign3261232612
Table 10. The number of SNPs and mutations inside coding regions for the Saudi SARS-CoV-2 dataset with respect to the four considered individual and ensemble MSA programs in the reference-based and consensus-based approaches.
Reference-BasedConsensus-Based
ProgramSNPsMutationsSNPsMutations
Clustal Ω 2954529545
MAFFT2954529545
MUSCLE3654134548
MergeAlign2954529545
Table 11. The number of SNPs > 5 % and > 10 % for the Saudi SARS-CoV-2 dataset for the four considered programs in the reference-based and consensus-based approaches.
Reference-BasedConsensus-Based
ProgramSNPs > 5 % SNPs > 10 % SNPs > 5 % SNPs > 10 %
Clustal Ω 15121710
MAFFT16121610
MUSCLE31282518
MergeAlign16121610
Table 12. The number of SNPs > 5 % and > 10 % inside coding regions for the Saudi SARS-CoV-2 dataset for the four considered programs in the reference-based and consensus-based approaches.
Reference-BasedConsensus-Based
ProgramSNPs > 5 % SNPs > 10 % SNPs > 5 % SNPs > 10 %
Clustal Ω 12111410
MAFFT14111410
MUSCLE26232216
MergeAlign14111410
Table 13. Comparison of high-frequency SNPs (>10%) within coding regions among the Saudi, Indian, and global [9] datasets and the high-frequency SNPs (>10%) from the global dataset from [8]. * All these high-frequency SNPs were identified using Clusta l Ω in the reference-based approach. “Freq” and “FR” refer to frequency and relative frequency, respectively.
Global [8]
(#Seq = 558)
Global [9]
(#Seq = 10,098)
Indian [9]
(#Seq = 566)
Saudis [Our result](#Seq = 641)
Ref. PosSNPsFreqRFRef. PosSNPsFreqRFRef. PosSNPsFreqRFRef. PosSNPsFreqRF
241 C T 178 0.32
1059 C T 2048 0.20
3037 C T 182 0.33 3037 C T 6768 0.67 3037 C T 339 0.60 3037 C T 545 0.85
6312 C A 177 0.31
8782 C T 138 0.25 8782 C T 1212 0.12
11,083 G T 115 0.20 11,083 G T 1107 0.11 11,083 G T
G A
189 0.33
13 , 730 C T 184 0.32
14 , 408 C T 182 0.33 14,408 C T
C A
6753 0.67 14,408 C T 332 0.59 14,408 C T 603 0.94
18,060 C T 62 0.11
18,877 C T 117 0.20 18,877 C T 346 0.54
19,557 T A
T C
T G
2246 0.22 19,557 T A 2180.39
19,558 A G
A C
A T
2260 0.22 19,558 A G 218 0.39
22,444 C T 69 0.12 22,444 C T 130 0.20
22,506 C A 99 0.17
22,507 T C 99 0.17
23,403 A G 183 0.33 23,403 A G 6780 0.67 23 , 403 A G 334 0.59 23,403 A G 483 0.75
23,929 C T 165 0.29
25,563 G T
G C
2489 0.25 25,563 G T 122 0.22 25,563 G T 459 0.72
26,735 C T 112 0.20 26,735 C T 465 0.73
28,144 T C 140 0.25 28,144 T C
T A
1262 0.12
28 , 311 C T 174 0.30
28 , 854 C T 71 0.12 28,854 C T 125 0.20
28,881 G A 74 0.13 28,881 G A
G T
2098 0.20 28,881 G A 115 0.18
28,882 G A 74 0.13 28,882 G A
G T
2087 0.20 28,882 G A 115 0.18
28,883 G C 74 0.13 28,883 G C 2086 0.20 28,883 G C 115 0.18
* In global [8], they did not mention if it is inside \outside coding regions.
Table 14. Saudi versus global SNP co-mutations with high descendants in SARS-CoV-2 and the corresponding number of descendants.
Saudis SNP Co-MutationsDescendants
(241, C, T), (3037, C, T), (14408, C, T), (25563, G, T), (26735, C, T)187
(241, C, T), (14408, C, T), (23403, A, G), (25563, G, T), (26735, C, T)145
(241, C, T), (3037, C, T), (14408, C, T), (23403, A, G), (25563, G, T), (26735, C, T)132
(241, C, T), (3037, C, T), (14408, C, T), (18877, C, T), (25563, G, T), (26735, C, T)118
(241, C, T), (14408, C, T), (18877, C, T), (23403, A, G)111
(241, C, T), (14408, C, T), (18877, C, T), (23403, A, G), (25563, G, T), (26735, C, T)104
(241, C, T), (3037, C, T), (14408, C, T), (18877, C, T), (23403, A, G), (26735, C, T)100
(241, C, T), (3037, C, T), (14408, C, T), (18877, C, T), (23403, A, G), (25563, G, T), (26735, C, T)98
(241, C, T), (14408, C, T), (28881, G, A), (28882, G, A), (28883, G, C)74
(241, C, T), (3037, C, T), (14408, C, T), (28881, G, A), (28882, G, A), (28883, G, C)65
Globe SNP Co-Mutations [8]Descendants
(8782, C, T), (28144,T, C), (18060,T, C)54
(241, C, T), (3037, C, T), (23403, A, G), (28144, T, C)145
(241, C, T), (3037, C, T), (14408, C, T), (23403, A, G)132
Disclaimer/Publisher’s Note: The statements, opinions and data contained in all publications are solely those of the individual author(s) and contributor(s) and not of MDPI and/or the editor(s). MDPI and/or the editor(s) disclaim responsibility for any injury to people or property resulting from any ideas, methods, instructions or products referred to in the content.

