Article

A Study and Application Analysis Exploring Pythagorean Fuzzy Set Distance Metrics in Decision Making

1
Yogananda School of AI, Computer and Data Sciences, Shoolini University, Solan 173229, India
2
National Institute of Telecommunications, ul. Szachowa 1, 04-894 Warsaw, Poland
3
Research Team on Intelligent Decision Support Systems, Department of Artificial Intelligence and Applied Mathematics, Faculty of Computer Science and Information Technology, West Pomeranian University of Technology in Szczecin, ul. Żołnierska 49, 71-210 Szczecin, Poland
*
Author to whom correspondence should be addressed.
Information 2024, 15(1), 28; https://doi.org/10.3390/info15010028
Submission received: 4 December 2023 / Revised: 23 December 2023 / Accepted: 29 December 2023 / Published: 2 January 2024
(This article belongs to the Special Issue Systems Engineering and Knowledge Management)

Abstract

:
The ever-increasing demand for high-quality solutions drives research toward more sophisticated decision-making solutions. In the field of decision making, the ability to solve complex real-world problems is of paramount importance. To this end, fuzzy sets are used, which offer the possibility of incorporating uncertainty into the values describing decision options. This study focuses on Pythagorean fuzzy sets, an extension of classical fuzzy sets, providing even more tools for modeling real-world problems by presenting a distance measure for these specific sets. A verification of the characteristics of the proposed distance measure has been carried out, proving its validity. The proposed measure is characterized by a more straightforward formula and thus simplifies the calculations. Furthermore, to confirm its usability, a multi-criteria decision-making methodology is presented, the results of which are compared with two multi-criteria decision-making methods, namely, PF-TOPSIS and PF-VIKOR, and another distance measure previously presented in the literature. The comparative analysis highlights lower variability in terms of preference values calculated using the proposed distance measure, which confirms the stability and reliability of the newly proposed distance measure while maintaining low computational complexity. Moreover, a high correlation with rankings calculated using PF-TOPSIS ensures its utility in terms of decision making.

1. Introduction

In order to make better use of the available information, different approaches are used to analyze the data. In the case of decision-making situations, such a tool is multi-criteria decision analysis (MCDA), which allows for a comprehensive analysis of the decision options considered in a given problem [1]. Over the years, several multi-criteria decision-making methods have been presented and applied to problems, such as the assessment of the construction process [2], infrastructure management [3], evaluation of the value of healthcare interventions [4], or sustainable manufacturing process management [5]. This approach to problem solving is vital because it allows for an initial analysis of the alternatives considered in the problem under consideration and the identification of the best and worst possible options.
Given the increasing complexity of decision-making problems, where making a critical decision can significantly impact the course of subsequent events, it is essential to ensure the best possible outcome. To this end, it is important to use the available information as accurately as possible. The measures used in multi-criteria decision-making problems often include distance [6], standard deviation [7], or entropy [8]. They make it possible to describe or characterize the data on which the problem is defined. In addition, measures such as rank similarity coefficients make it possible to compare results obtained using different multi-criteria decision-making methods [9]. In the MCDA literature, many researchers have used other measures, such as the Shannon–Spearman measure, to compare the results of different aggregation methods [10] or measure the congruence or incongruence of the relative significance of alternatives [11].
However, classical decision making, in which the problem is described using crisp values, may not be sufficient in many real-world cases. In such cases, uncertainty often arises that cannot be adequately accounted for by the classical approach. For this purpose, a fuzzy approach is used to describe the data using fuzzy sets (FSs). Zadeh introduced these sets [12] in 1978 so that decision-makers could take uncertainty into account by means of membership functions and express its degree of membership and non-membership. Despite the passage of years, these sets are still in use, and a growing number of solutions appear in the literature to solve certain problems, as presented in many reviews [13,14,15], as well as to present new approaches to deal with problems that are defined in an uncertain environment [16,17,18].
However, classical fuzzy sets also have some drawbacks, which have been addressed by the introduction of intuitionistic fuzzy sets (IFSs), which allow for an even better representation of the decision problem, enabling more informed and accurate decision making. However, they were presented by Atanassov in 1986 [19], and many new challenges have emerged since then. To address them, Yager in 2013 [20] presented Pythagorean fuzzy sets (PFSs), which were quickly popularized and have found many applications in decision-making processes for real-world problem solving [21,22,23]. For example, El-Morsy presented stock portfolio optimization in the environment of PFSs [24], while Rani et al. explored the assessment of sustainable bioenergy technologies for agricultural residues [25]. Another interesting line of research is aggregation operators, the application of which was presented by Tapas Kumar et al., where they used Hamacher aggregation operators to improve the quality of decisions made in problems described on PFSs [26]. Moreover, further research in the Pythagorean fuzzy environment led to the emergence of new measures, like the similarity measure of Pythagorean fuzzy sets based on the Jaccard index [27] or aggregation operators for PFSs based on confidence levels [28].
The distance measure is widely used in multi-criteria decision-making problems. Its use has been demonstrated, for example, in cases such as the evaluation of a flexible manufacturing system [29] or for the development of new multi-criteria decision-making methods to assess alternatives [30]. Ejegwa applied the Hamming distance, Euclidean distance, normalized distance, and similarity measure in the context of interval type-2 fuzzy sets and their application in medical diagnosis and pattern recognition [31]. In the case of Pythagorean fuzzy sets, research has been conducted in various directions [32]. Over the years, many examples of the application of the distance measure to Pythagorean fuzzy sets have been presented. For instance, Chen presented an application of the Minkowski measure to, among other things, internet stocks and investment in research and development projects [33]. Hussian et al. presented distance and similarity measures of Pythagorean fuzzy sets based on the Hausdorff metric with application to the fuzzy Technique for Order of Preference by Similarity to Ideal Solution (TOPSIS) [34]. Agheli et al. explored the relationship between the similarity measure, distance measure, inclusion measure, and entropy for Pythagorean fuzzy sets (PFSs) [35]. However, there are very few research reports on distance measures designed explicitly for Pythagorean fuzzy sets [36].
In 2021, Ohlan proposed a novel distance measure between Pythagorean fuzzy sets based on exponential function [37]. Yin et al. explored an idea of the distance measure based on the earth mover’s distance in the Pythagorean fuzzy environment [38]. Zhou et al. proposed a new distance measure based on the characteristics of Pythagorean fuzzy sets and incorporated it into the TOPSIS method [39]. Moreover, Wang et al. presented the geometric distance measure-based approach to solve Pythagorean cubic fuzzy multi-criteria decision-making problems [40], and Sun et al. presented the centroid distance measure application in Pythagorean fuzzy information processing [41].
It has been observed that numerous distance measures for PFSs available in the literature can be considered as extensions of the measures presented for IFSs. Moreover, it is worth noting that some distance measures lack normalization and have complex mathematical expressions, which limits their practical utility. To this end, this paper proposes a new distance measure characterized by a simple mathematical expression to address the challenges of solving complex real-world problems accurately and efficiently. The research addressed the research gap under consideration, proposed a metric that satisfied the characteristics required for PFS, and validated the proposed measure as a distance measure. In addition, the procedure utilizing the proposed measure was conducted on two multi-criteria decision-making problems, demonstrating its applicability, stability, and reliability in solving decision problems. In summary, the motivation and objectives of this work are as follows:
  • Developing a new distance measure with a simple mathematical expression to address the challenges of solving complex real-world problems accurately and efficiently.
  • Demonstrating the proposed measure’s applicability, stability, and reliability in solving multi-criteria decision-making problems.
  • Comparing the proposed measure with the existing distance measure and other multi-criteria decision-making methods, emphasizing its advantages and superiority.
The rest of this paper is structured as follows: Section 2 presents an introductory discussion that covers the basic concepts of Pythagorean fuzzy sets and introduces a new distance measure for PFSs. Section 3 presents a procedure that, using the newly proposed measure, allows us to obtain a ranking of the alternatives in the decision problem under consideration. Section 4 presents the application of the proposed methodology to solve two multi-criteria decision-making problems, one smaller one that considers the problem of energy microgeneration and the other larger one that presents the solution for selecting a renewable energy source. In addition, this section compares the results with another distance measure presented previously in the literature. Finally, Section 5 concludes this paper and discusses future directions.

2. Preliminaries

According to Yager [20], PFSs can be defined in the following way. Let us take a set S of nominal elements, which is non-empty and has a finite number of elements, denoted by S = s 1 , s 2 , , s n . The representation of the PFS M that is contained inside the set of a crisp set S is as follows:
M = s , μ M s , ϑ M s | s S
where μ M s : S [ 0 , 1 ] and ϑ M s : S [ 0 , 1 ] provided that 0 μ M 2 ( s ) + ϑ M 2 ( s ) 1 . The μ M ( s ) and ϑ M ( s ) are the degree of membership and non-membership of the element s S . The complement of the Pythagorean fuzzy set is π ( s ) , which is determined by the following equation.
π 2 s = 1 μ M 2 ( s ) ϑ M 2 ( s )

2.1. Distance for Pythagorean Fuzzy Set

Let S be a non-empty set and A , B , C P F S ( S ) . The distance measure D between A and B is a function D : P F S × P F S 0 , 1 that satisfies four characteristics, boundedness, reflexivity, symmetry, and separability, in the following way.
i
Boundedness: 0 D A , B 1 , f o r A , B , S .
ii
Reflexivity: D A , A = 0 , f o r A S .
iii
Symmetry: D A , B = D B , A , f o r A , B , S .
iv
Separability: If A , B , C S then, D A , C + D B , C D A , B .
D A , B = 1 n i = 1 n e 1 μ A 2 μ B 2 + e 1 ϑ A 2 ϑ B 2
where e is the number e, which is also known as Euler’s number.
Theorem 1. 
The measure defined in Equation (3) is a reliable distance indicator.
Proof. 
To demonstrate that the proposed measure is a valid distance measure, it is necessary to confirm the four characteristics set out in Section 2.1 for the given measure. For this purpose, let us consider the following characteristics in turn:
i
Boundedness: From the definition of the Pythagorean fuzzy set, we know that:
0 μ A 2 1 ; 0 ϑ A 2 1 ; 0 μ B 2 1 ; 0 ϑ B 2 1 0 μ A 2 μ B 2 1 a n d 0 ϑ A 2 ϑ B 2 1
Therefore, we have:
0 e 1 μ A 2 μ B 2 1 ; 0 e 1 ϑ A 2 ϑ B 2 1 0 e 1 μ A 2 μ B 2 + e 1 ϑ A 2 ϑ B 2 1 1 0 D ( A , B ) 1
ii
Reflexivity: D A , A = 0 , A S .
D A , A = 1 n i = 1 n e 1 μ A 2 μ A 2 + e 1 ϑ A 2 ϑ A 2 = 1 n i = 1 n e 1 0 + e 1 0 = 0
iii
Symmetry: D A , B = D ( B , A ) .
D A , B = 1 n i = 1 n e 1 μ A 2 μ B 2 + e 1 ϑ A 2 ϑ B 2 = 1 n i = 1 n e 1 μ B 2 μ A 2 + e 1 ϑ B 2 ϑ A 2 = D ( B , A )
iv
Separability: D A , B = 0 , if A = B .
D A , B = 0 1 n i = 1 n e 1 μ A 2 μ B 2 + e 1 ϑ A 2 ϑ B 2 = 0 e 1 μ A 2 μ B 2 + e 1 ϑ A 2 ϑ B 2 = 0 e 1 μ A 2 μ B 2 = 0 ; e 1 ϑ A 2 ϑ B 2 = 0 μ A 2 μ B 2 = 0 ; ϑ A 2 ϑ B 2 = 0 μ A 2 = μ B 2 ; ϑ A 2 = ϑ B 2 μ A = μ B ; ϑ A = ϑ B
This proves that the proposed measure can be considered a valid distance measure. □

2.2. PF-TOPSIS

The Technique for Order of Preference by Similarity to Ideal Solution (TOPSIS) is one of the most popular methods for solving multi-criteria decision-making problems. It was introduced in 1994 by Hwang and Yoon [42] and has become very popular over the years, with many examples in the literature, such as ranking evolutionary algorithms [43], green low-carbon port evaluation [44], and many others [45]. Due to its repeated confirmation of its usefulness in a wide variety of decision-making problems, it has lived to see many developments using, among others, spherical fuzzy information presented by Akram et al. [46] or interval-valued Fermatean fuzzy sets presented by Ilieva and Yankova [47]. In the context of this work, the most relevant extension is the one that considers problems using Pythagorean fuzzy sets. This extension was presented by Zhang and Xu [48] and will be used following the procedure established by Zhang and Xu in this work for comparative purposes.

2.3. PF-VIKOR

VIseKriterijumska Optimizacija I Kompromisno Resenje (VIKOR) is another prevalent method that has gained a lot of trust in the field of multi-criteria decision making. It was introduced by Opricovic, who later extended it to the fuzzy environment [49]. Like the TOPSIS method, it has been widely used in the literature to solve problems in various fields, such as, for example, assessing regional security [50], evaluating the current situation of smart healthcare [51], and selecting sustainable hydrogen production [52]. In addition, it has also seen many extensions, among others, to group decision making [53] or to accommodate the use of bipolar fuzzy sets [54]. In the case of the VIKOR method, like TOPSIS, in the research conducted in this article, the most relevant extension is the one using Pythagorean fuzzy sets presented by Bakioglu Atahan [55]. The distinguishing feature of this method is that it offers three final rankings, namely, S, R, and a compromise ranking of Q. In this study, the Q ranking will be used, and the compromise value will be set to 0.5. This means the S and R rankings will be equally important in the final evaluation.

2.4. Similarity Coefficients

For research in the field of multi-criteria decision making, it is important to compare a newly proposed solution with other solutions that have been presented in the literature over the years. For this purpose, ranking similarity coefficients are most often used to find out how different the proposed solutions are [9]. The most commonly used ranking similarity coefficients in the literature are the weighted Spearman correlation coefficient, which was proposed by Pinto da Costa and Soares [56], and the weighted similarity coefficient, which was proposed by Salabun [57]. Equation (9) represents the weighted Spearman coefficient, while Equation (10) represents the weighted similarity coefficient.
r w = 1 6 i = 1 n R i Q i 2 n R i + 1 + n Q i + 1 n 4 + n 3 n 2 n ,
where R i —position in the reference ranking, Q i —position in the second ranking, and n—number of alternatives.
W S = 1 i = 1 n 2 R i · R i R i max 1 R i , n R i ,
where R i —position of reference ranking, Q i —position of second ranking, and n—amount of alternatives.

3. Methodology

In multi-criteria decision-making problems, a decision option is selected from a set of considered alternatives that obtains the highest preference value. In the case considered in this study, the alternatives are described by Pythagorean fuzzy sets, and each criterion has a weight that corresponds to how the criterion will affect the outcome. In this procedure, a measure of distance and similarity is used to obtain a final preference value that allows for the considered alternatives to be further ranked, thus obtaining a solution in which one of the considered decision alternatives is regarded as the best available option. The procedure can be presented in the following detailed steps.
Step 1:
The first step to consider a problem in multi-criteria decision making in the Pythagorean fuzzy environment is to establish a decision matrix. Considering that, establish a Pythagorean fuzzy decision matrix N = ( A i , C j ) m x n where A i denotes alternatives ( i = 1 , 2 , 3 , m ) and C j criteria ( j = 1 , 2 , 3 , n ) where each element contains the value of membership and non-membership:
N = C 1 C 2 C n A 1 A 2 A m P ( μ 11 , ϑ 11 ) P ( μ 12 , ϑ 12 ) P ( μ 1 m , ϑ 1 m ) P ( μ 21 , ϑ 21 ) P ( μ 22 , ϑ 22 ) P ( μ 2 m , ϑ 2 m ) P ( μ n 1 , ϑ n 1 ) P ( μ n 2 , ϑ n 2 ) P ( μ 11 , ϑ n m )
Step 2:
The next step requires the calculation of a positive ideal PFS ( M + ) and a negative ideal PFS ( M ). This determination can be made using the following equations.
M + = μ i j + , ϑ i j + , π i j + = max μ i j , min ϑ i j , min π i j
M = μ i j , ϑ i j , π i j = min μ i j , max ϑ i j , max π i j
Step 3:
Next, determine the distances from the positive D + and negative D ideal solution. The distance measure is a weighted distance calculated with a given weight vector w = w i , 1 i n using the following equation.
D A , B = 1 n i = 1 n w i e 1 μ A 2 μ B 2 + e 1 ϑ A 2 ϑ B 2
where e is the number e, which is also known as Euler’s number.
Step 4:
The similarity measure S is then calculated using the distance determined in the previous step. In this context, different functional types of similarity measures can be explored. However, the following equation is used in this study to calculate the similarity.
S D = ( 1 D )
Step 5:
In the fifth step, the relative similarity S ( R ) is calculated using the following formula.
S R = S D + S D + + S D
where D + shows the positive distance and D shows the negative distance for each alternative.
Step 6:
Lastly, rank the alternatives A i in descending order based on their relative similarity measure value.

4. Numerical Examples

This section presents the application of the newly proposed distance measure to acquire rankings for two theoretical multi-criteria decision-making problems, namely, for one smaller problem that considers the selection of a microgeneration technology, considering five alternatives described by four criteria, and for a second larger renewable energy source selection problem that considers ten alternatives described by ten criteria.

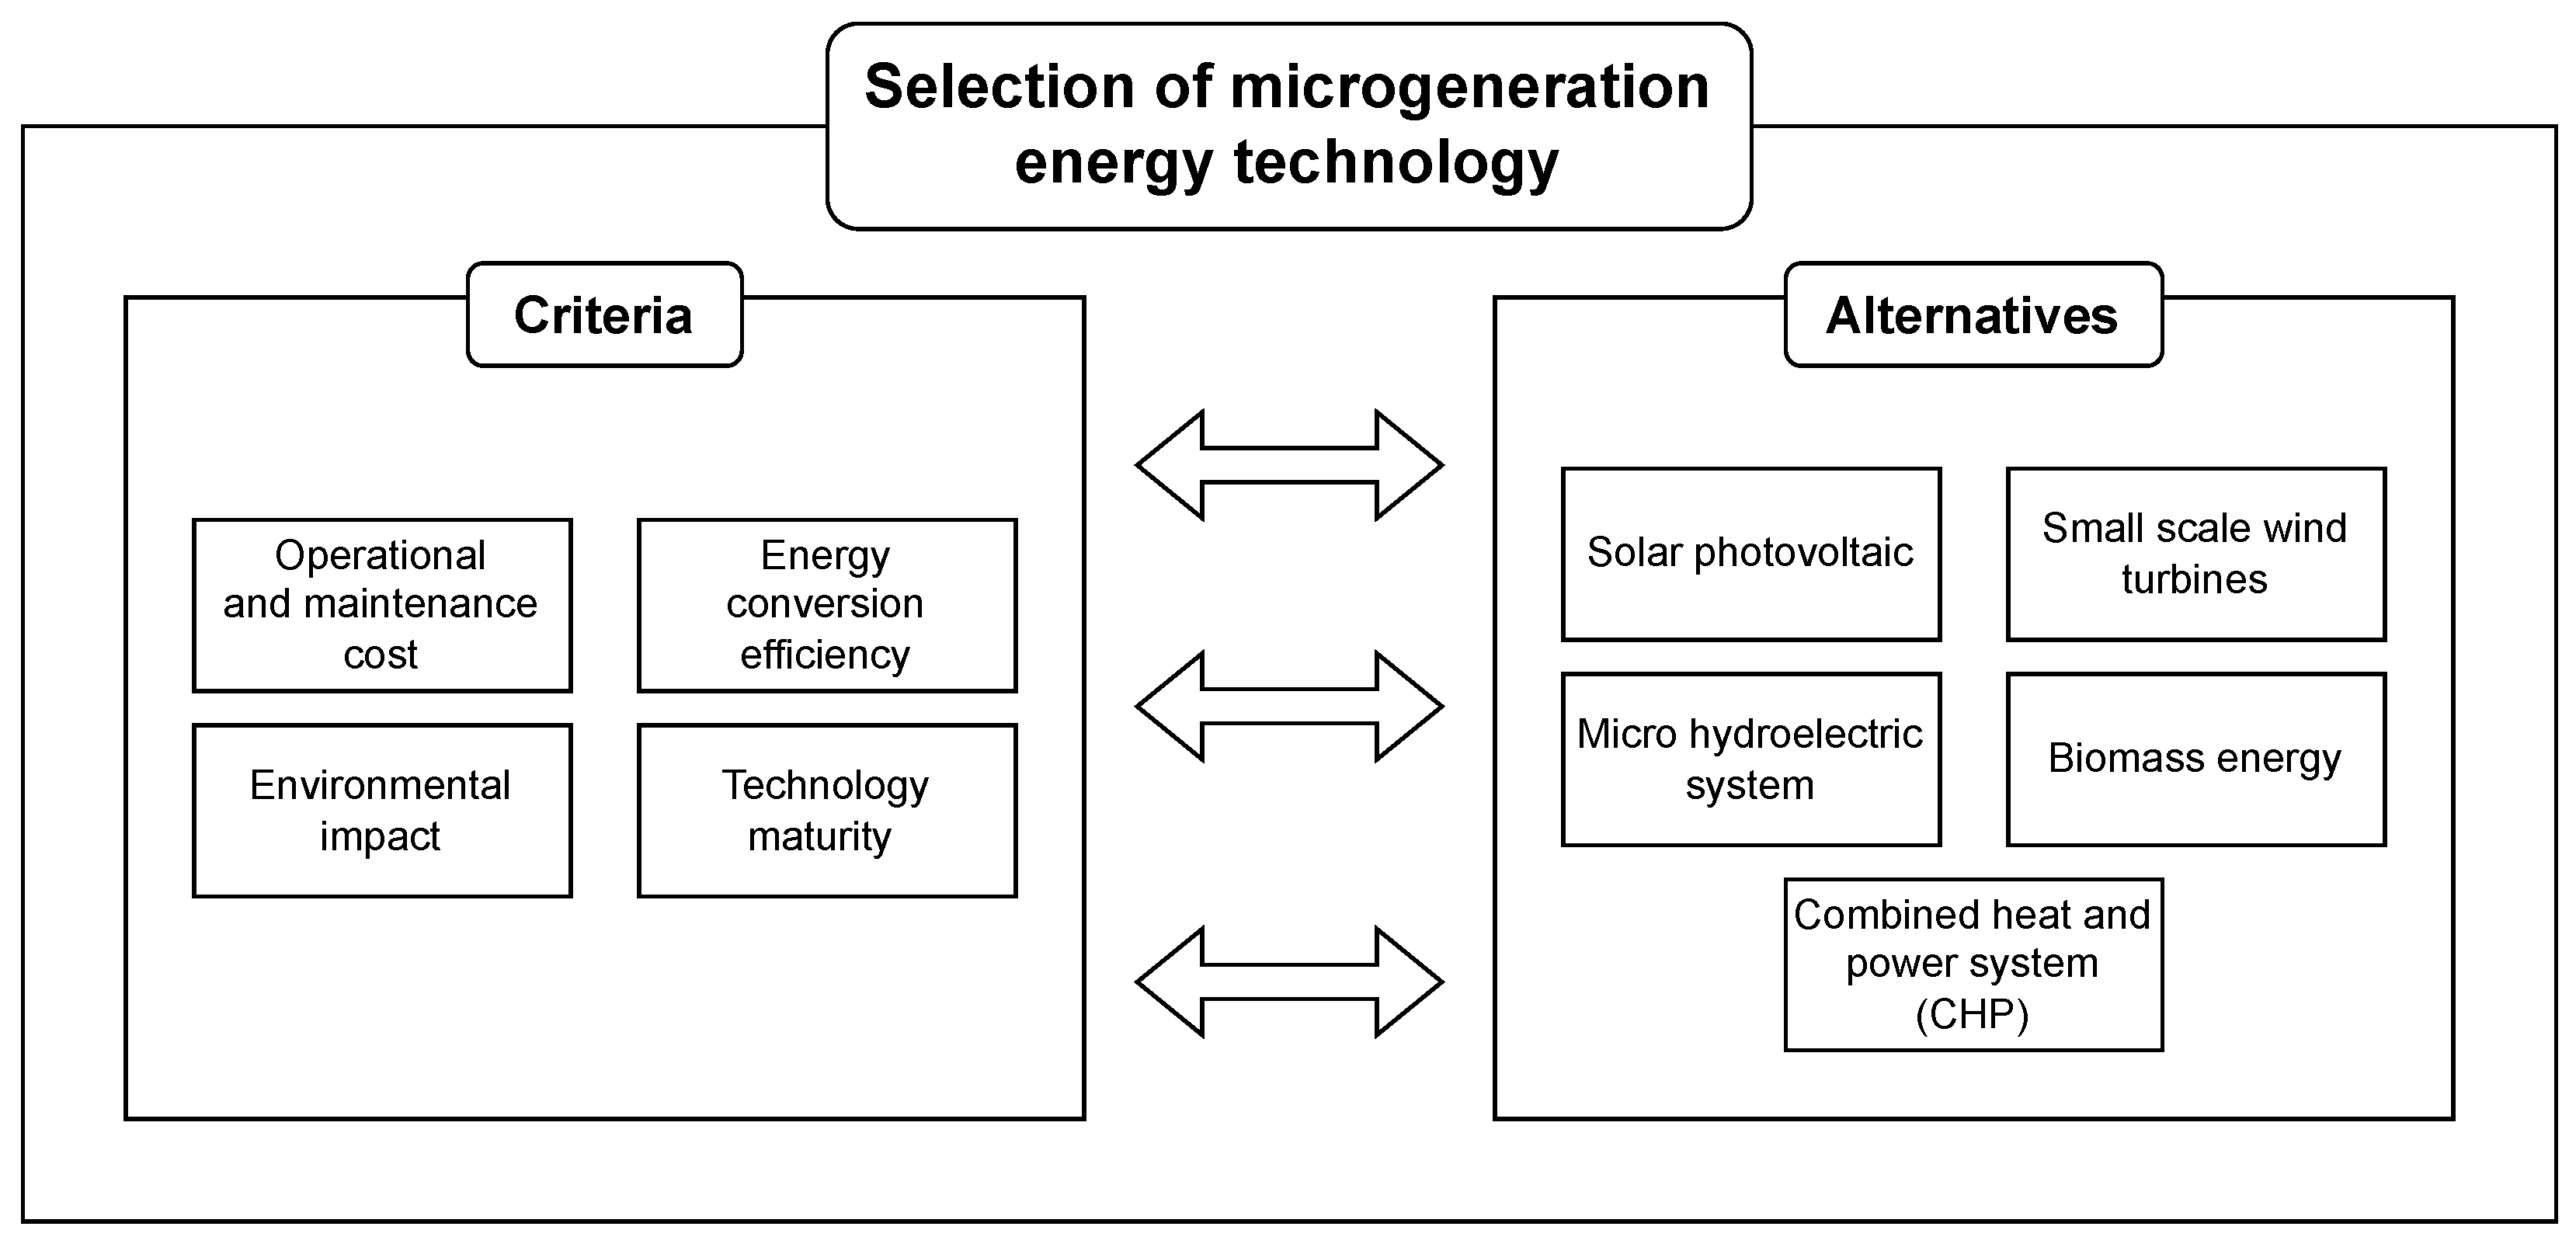
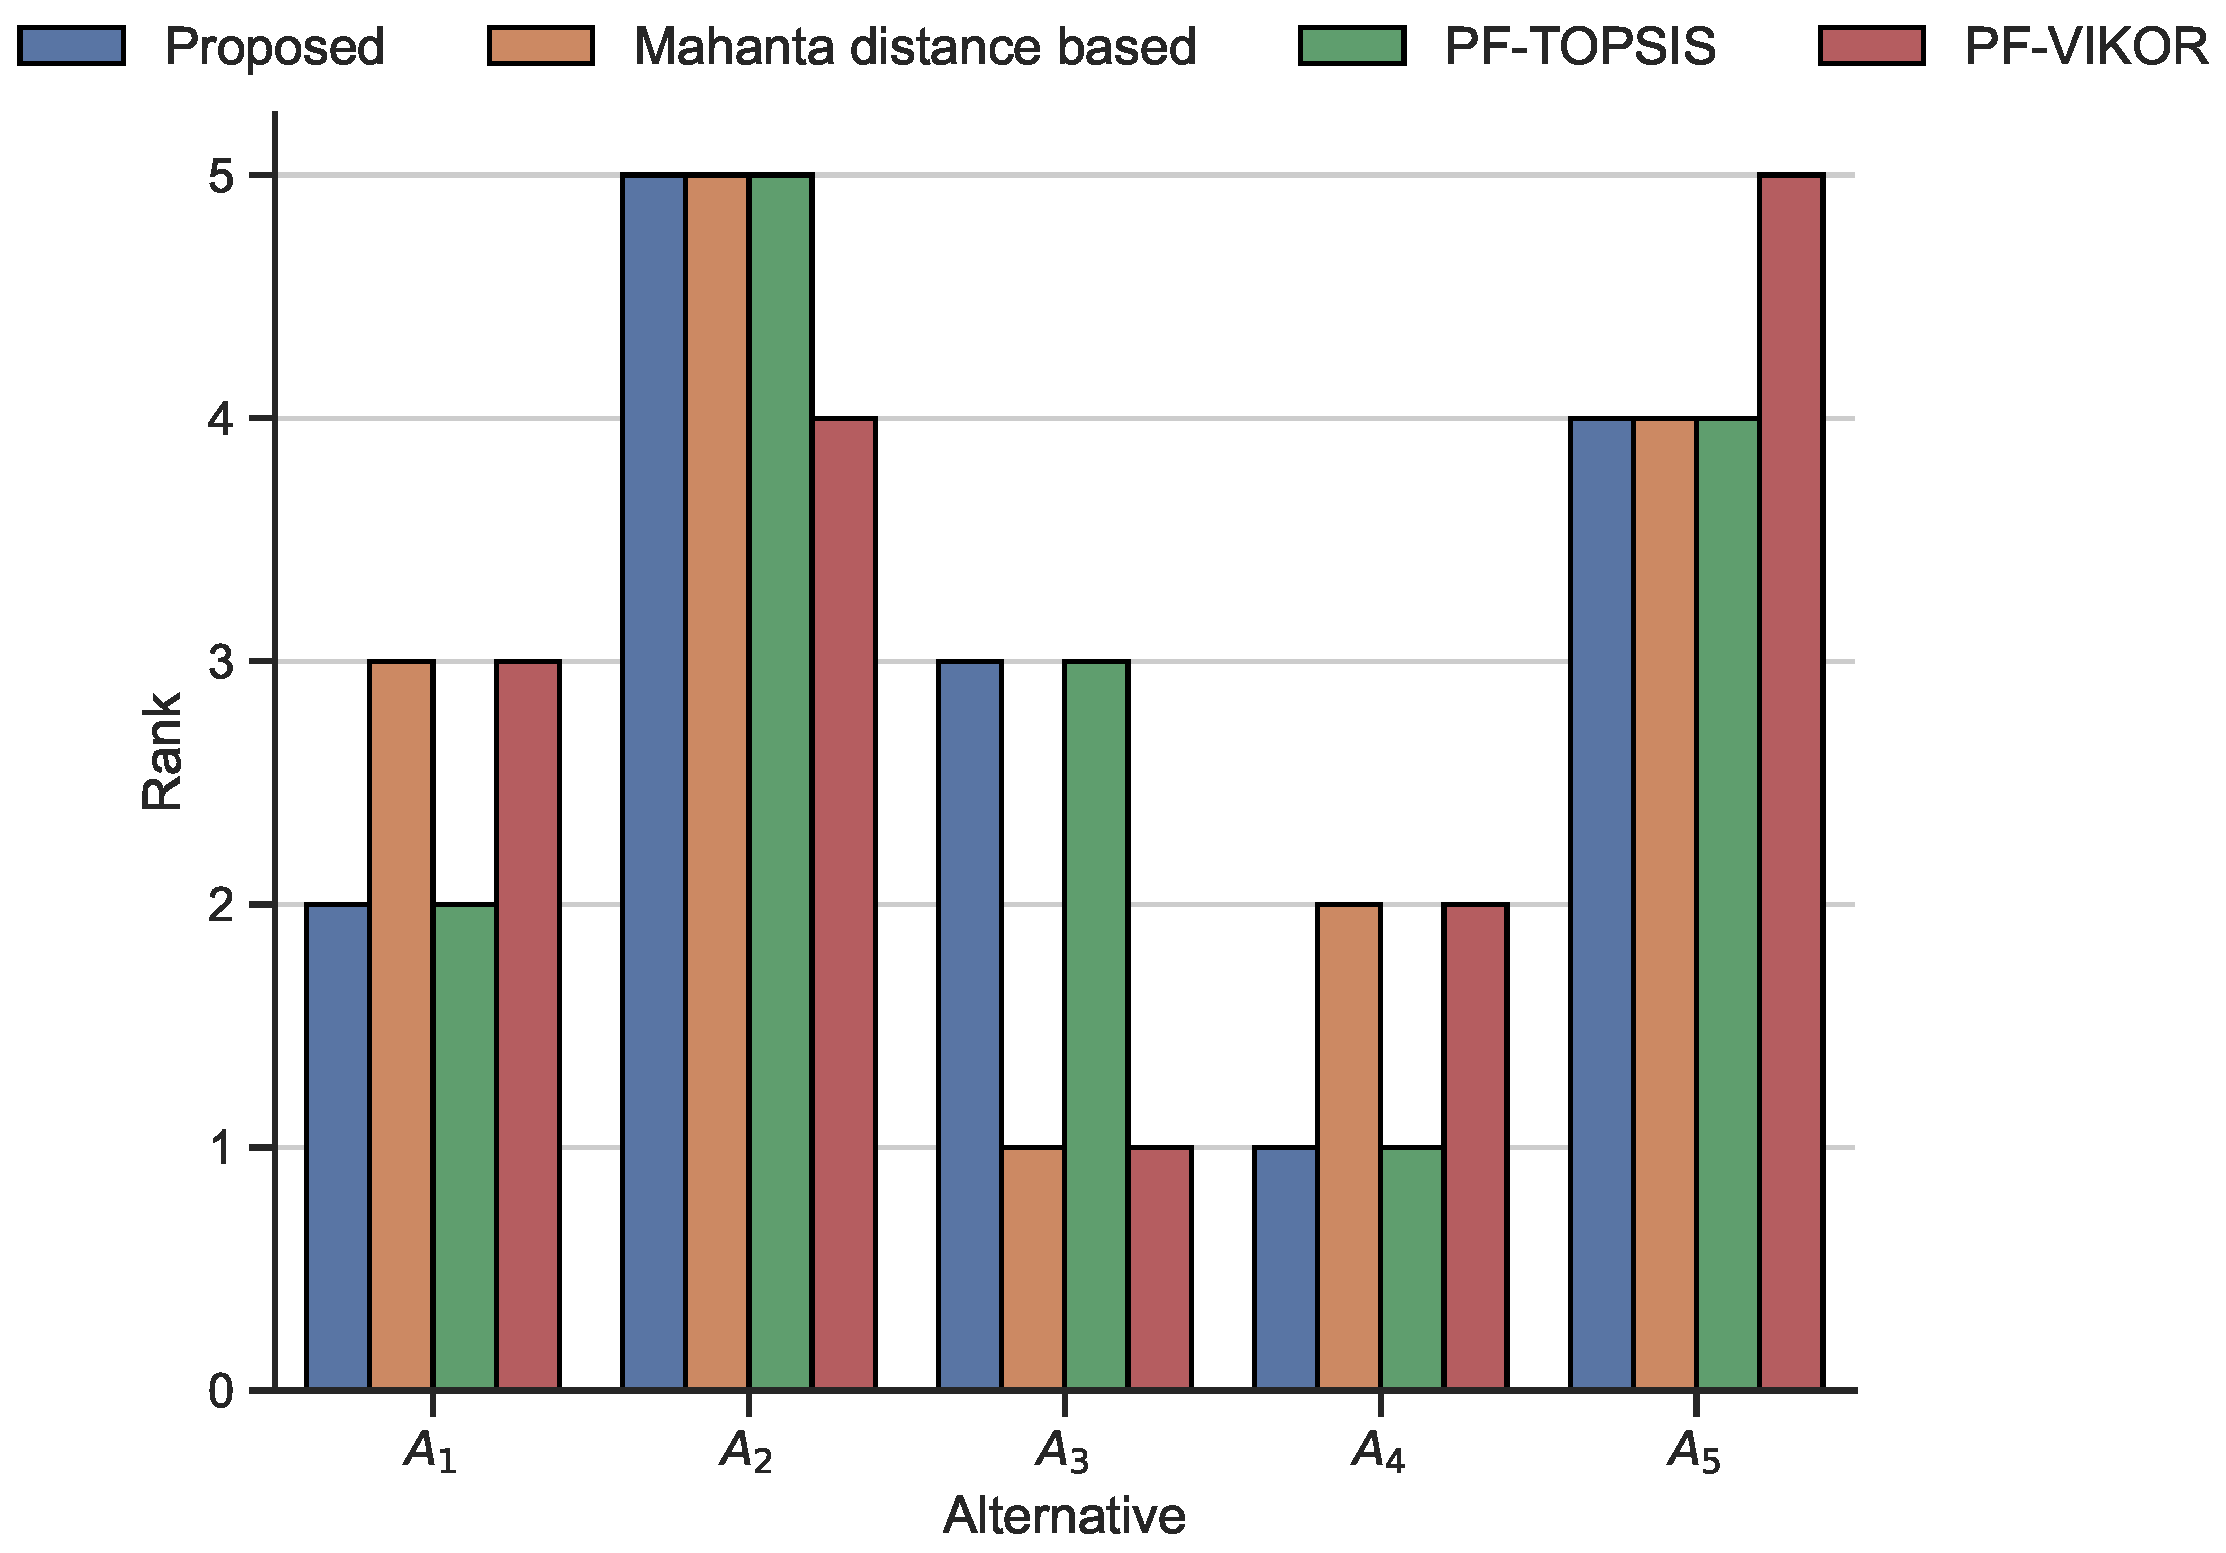
4.1. Microgeneration Technology Selection

The first problem that will be considered is a smaller problem where four criteria describe five alternatives. As microgeneration is an important topic that should be further researched, let us consider such a problem. The importance of this topic is shown through numerous studies, such as the one presented by Kamali Saraji et al. [58], where they proposed a framework utilizing the combined Stepwise Weight Assessment Ratio Analysis and Technique for Order of Preference by Similarity to Ideal Solution (SWARA-TOPSIS) approach to solve a similar problem, or Zhang et al. [59], where another integrated MCDA approach was used for the microgeneration problem. However, not many researchers provide an example that utilizes a distance measure, which is why providing such an example is essential.
When it comes to the problem of energy microgeneration technology, a key consideration is the cost-effectiveness of investing in this type of solution. As with any newly developed technology, costs are expected to fall as the industry develops. However, if the adaptation of a technology encounters significant difficulties, this can significantly affect the subsequent ability to use it effectively. Therefore, in addition to the costs associated with using the chosen technology, the simplicity of its application with sufficient performance should be considered. In this regard, it should be borne in mind that alternative solutions that are difficult to implement will result in a decrease in productivity or the resulting process efficiency and an increase in costs. Environmental compatibility is another essential aspect in this situation, as not all technologies may be suitable for given geographical areas. As a result, it would be prudent to choose an alternative that is acceptable for the climatic conditions of the region in which the microgeneration projects are located.
In this problem, let us consider solar photovoltaics, small-scale wind turbines, micro-hydroelectric systems, biomass energy, and combined heat and power systems (CHPs) as alternatives and operational and maintenance cost, energy conversion efficiency, environmental impact, and technology maturity as criteria. The considered problem is presented on the chart in Figure 1.
In the considered problem, a decision matrix presented in Table 1 will be used for further calculations.
Then, the positive ideal PFS ( M + ) and negative ideal PFS ( M ) must be established. It is performed using Equation (12) for the positive and Equation (13) for the negative ideal PFS. Table 2 presents the according values.
We then need to calculate the distance using Equation (3). The weights for the criteria need to be set to use the equation mentioned earlier. In this example, the weights were chosen arbitrarily to provide an example where differences in the results from different approaches would be more apparent and are defined as follows: w = 0.25 , 0.25 , 0.25 , 0.25 . We can then calculate the distances between M i and M + / M , which can ultimately be used to measure the similarity using Equation (15), which lets us calculate the relative similarity using Equation (16). Table 3 shows the computed distance and relative similarity measures. Those results are considered preference values that should be ranked in descending order and will be further discussed in next section.

Comparison

It is essential to check whether the results offered by the newly proposed distance measure are stable and allow for multi-criteria decision-making problems to be solved reliably. For this purpose, another distance measure was chosen, presented by Mahanta and Panda in 2021 [60], where they provided proof that their proposed distance is valid and showed how it performs compared to other distance measures. This ensures that the distance proposed in this paper can be compared to the one proposed by Mahanta and Panda, providing insightful information. The following Equation (17) describes the distance presented by Mahanta and Panda.
D ( A , B ) = 1 n i = 1 n w i μ A 2 μ B 2 + ϑ A 2 ϑ B 2 μ A 2 + μ B 2 + ϑ A 2 + ϑ B 2
The above measure was applied in the same way as the newly proposed measure, namely, in the procedure described in Section 3. In addition, the PF-TOPSIS and PF-VIKOR methods were used in the comparison carried out. The preference values obtained from the evaluation of the different alternatives are summarized in Table 4. Considering that the same problem is further analyzed, the same weights vector was used, namely, w = 0.25 , 0.25 , 0.25 , 0.25 , and all the criteria were considered to be of the profit type. The obtained preference values for the individual alternatives look similar when distance measures are used in multi-criteria decision making. For PF-TOPSIS, the preference values are negative, and in the case of PF-VIKOR, the values are in the range [ 0 , 1 ] .
To better illustrate the distribution of the preference values, Table 5 shows the measures of the minimum, mean, maximum, and standard deviation. It can be seen that the values obtained by PF-TOPSIS are characterized by the highest standard deviation and the proposed approach by the lowest. Such consistency in the case of the proposed approach ensures that the results cluster closely around the mean, enhancing the reliability of the data interpretation. Additionally, a smaller standard deviation solidifies the mean value as a more representative indicator of the overall trends, making it a more dependable metric for further analysis.
In addition, because a multi-criteria decision-making problem is being solved, it would be useful to look at the resulting rankings. These are visualized in Figure 2, where it can be seen that the proposed approach offers similar results to PF-TOPSIS despite significant differences in the statistical measures that describe the preference values. Compared with the distance measure presented by Mahanta, we can see that changes appeared in the first positions of the rankings. The podium has significant discrepancies, especially looking at alternative three, which was considered the best using the distance presented by Mahanta. However, this alternative would be regarded as the best with the distance measure presented in this work.
A further comparison of the ranking was conducted using rank similarity coefficients. Table 6 presents the comparison of the ranking calculated using the proposed approach and other methods. The weighted Spearman coefficient and the WS rank correlation coefficient provided similar results, allowing us to conclude that the proposed distance measure offers different results than the measure presented by Mahanta while still being valid. In addition, it can be said that the proposed approach utilizing the proposed distance measure has a basis to be used in multi-criteria decision-making problems due to the fact that it offers precisely the same ranking as the PF-TOPSIS method while providing a more straightforward procedure requiring fewer mathematical operations.

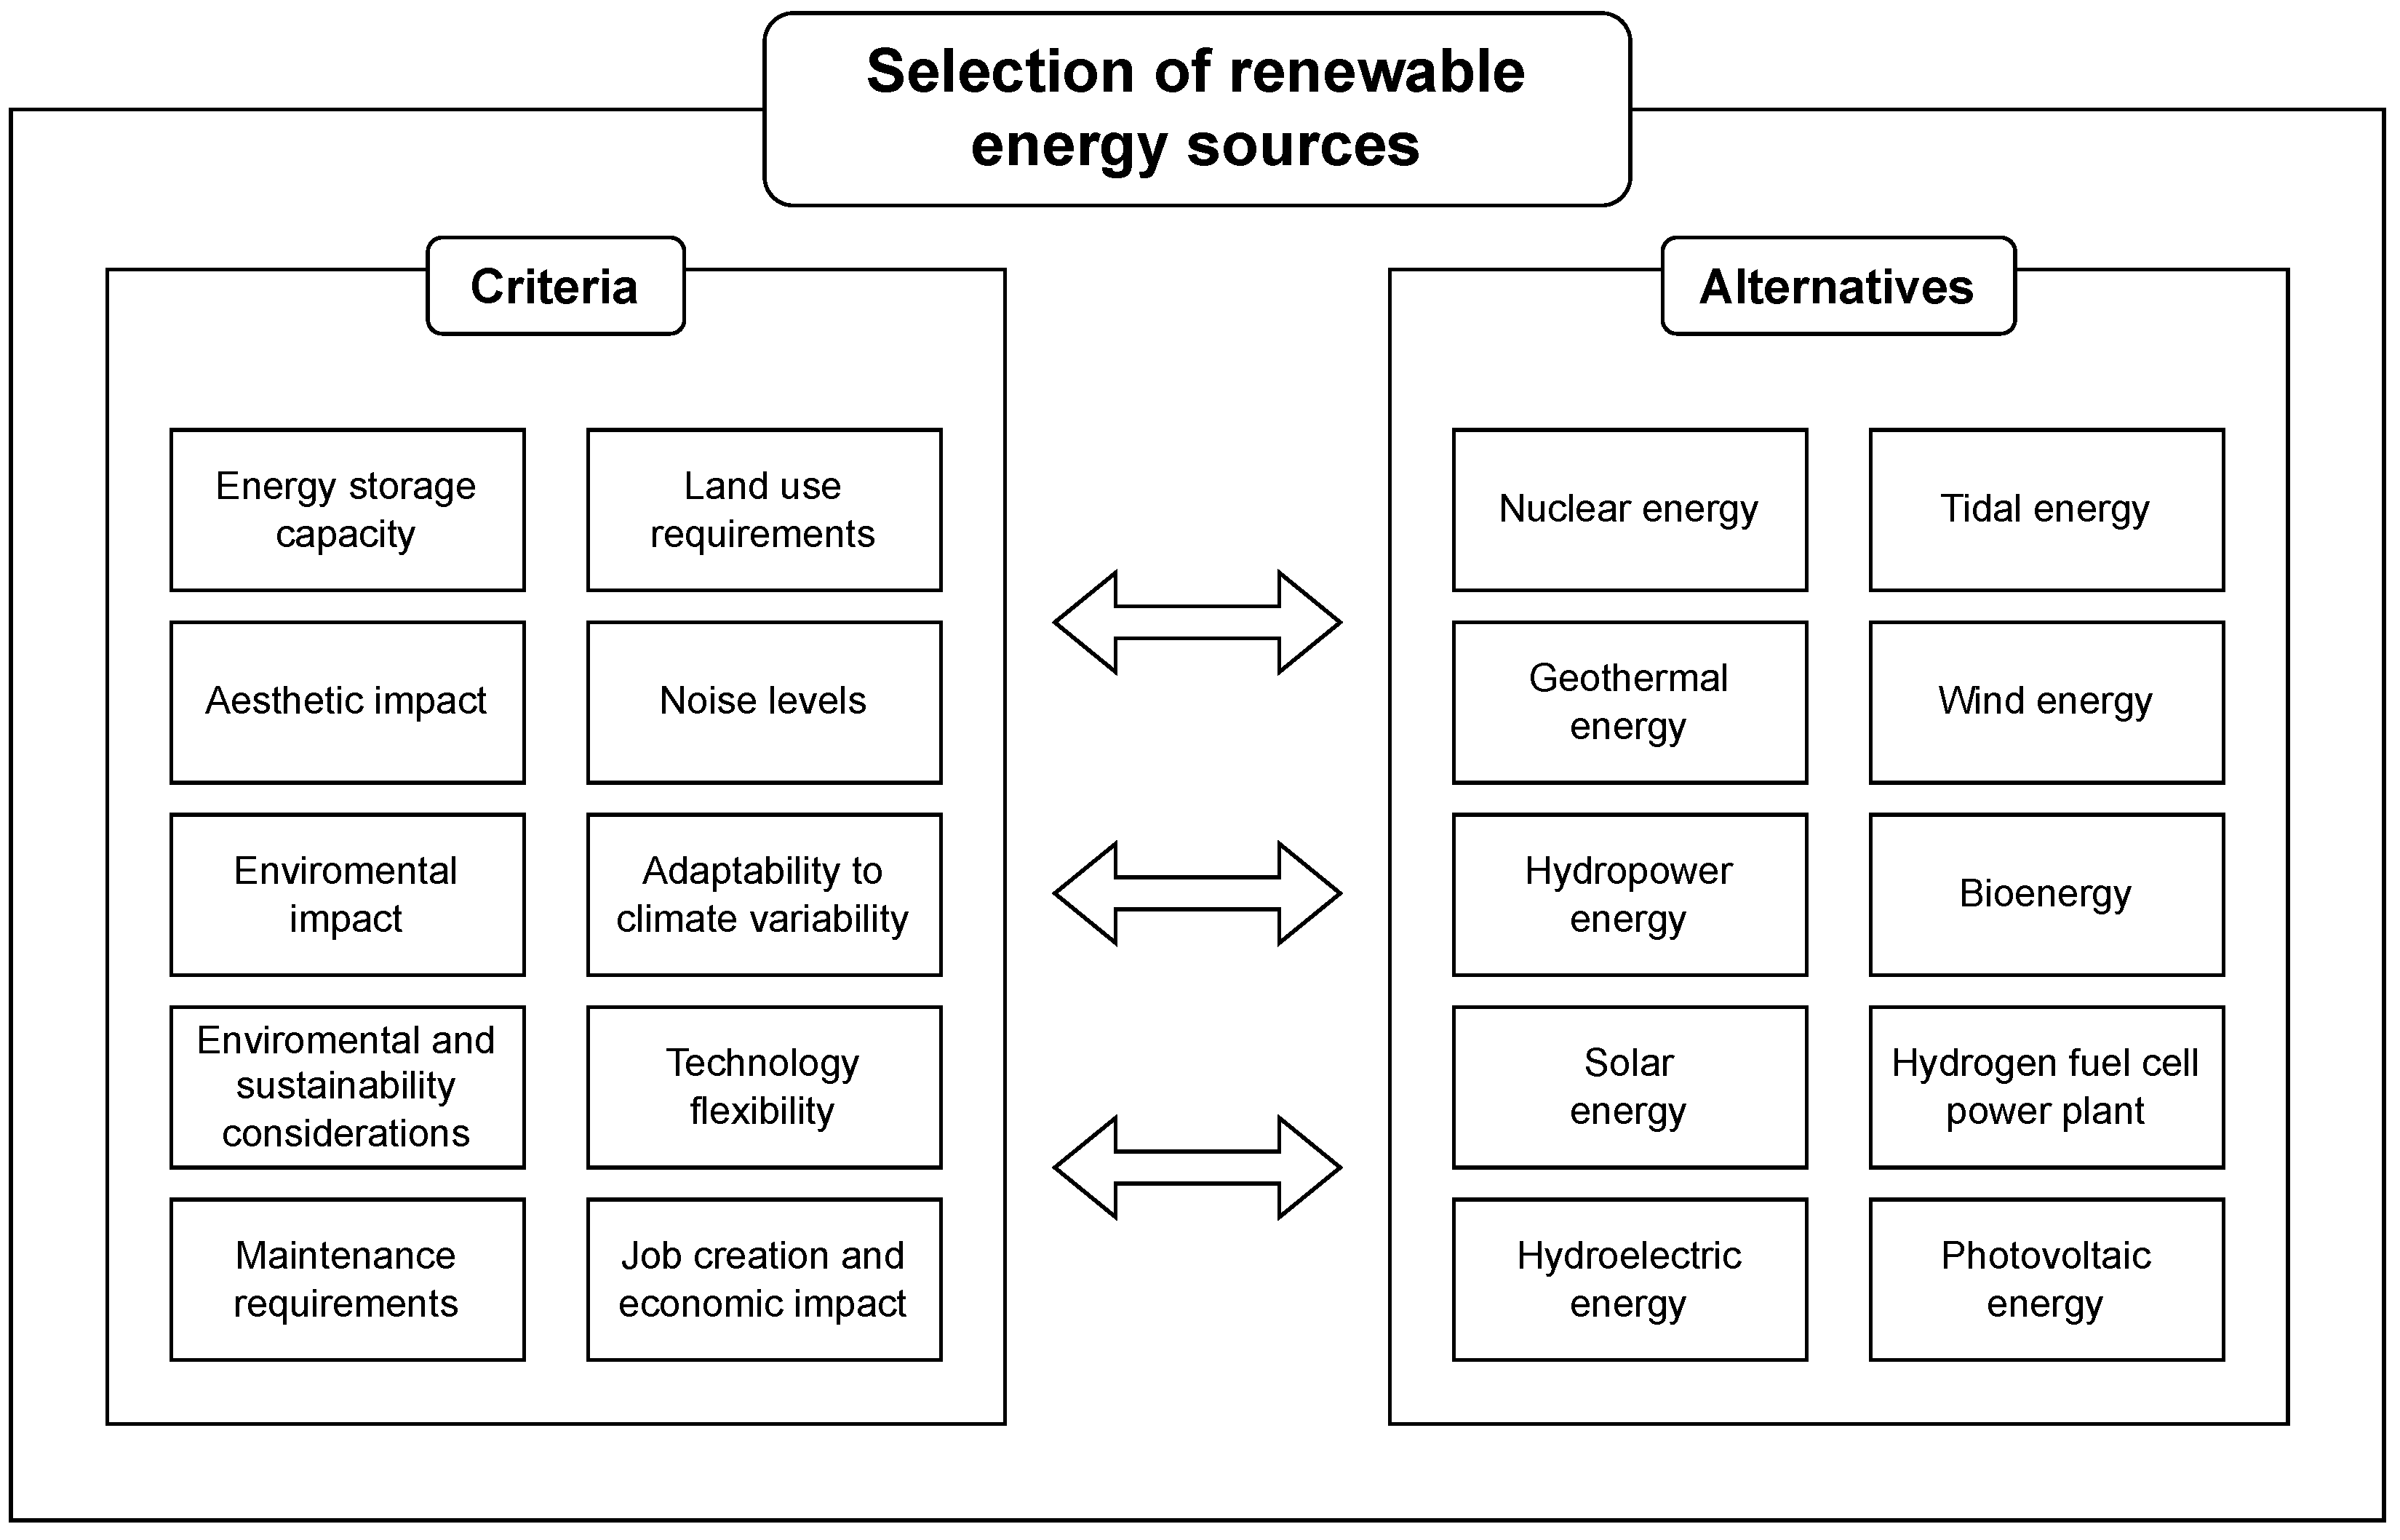
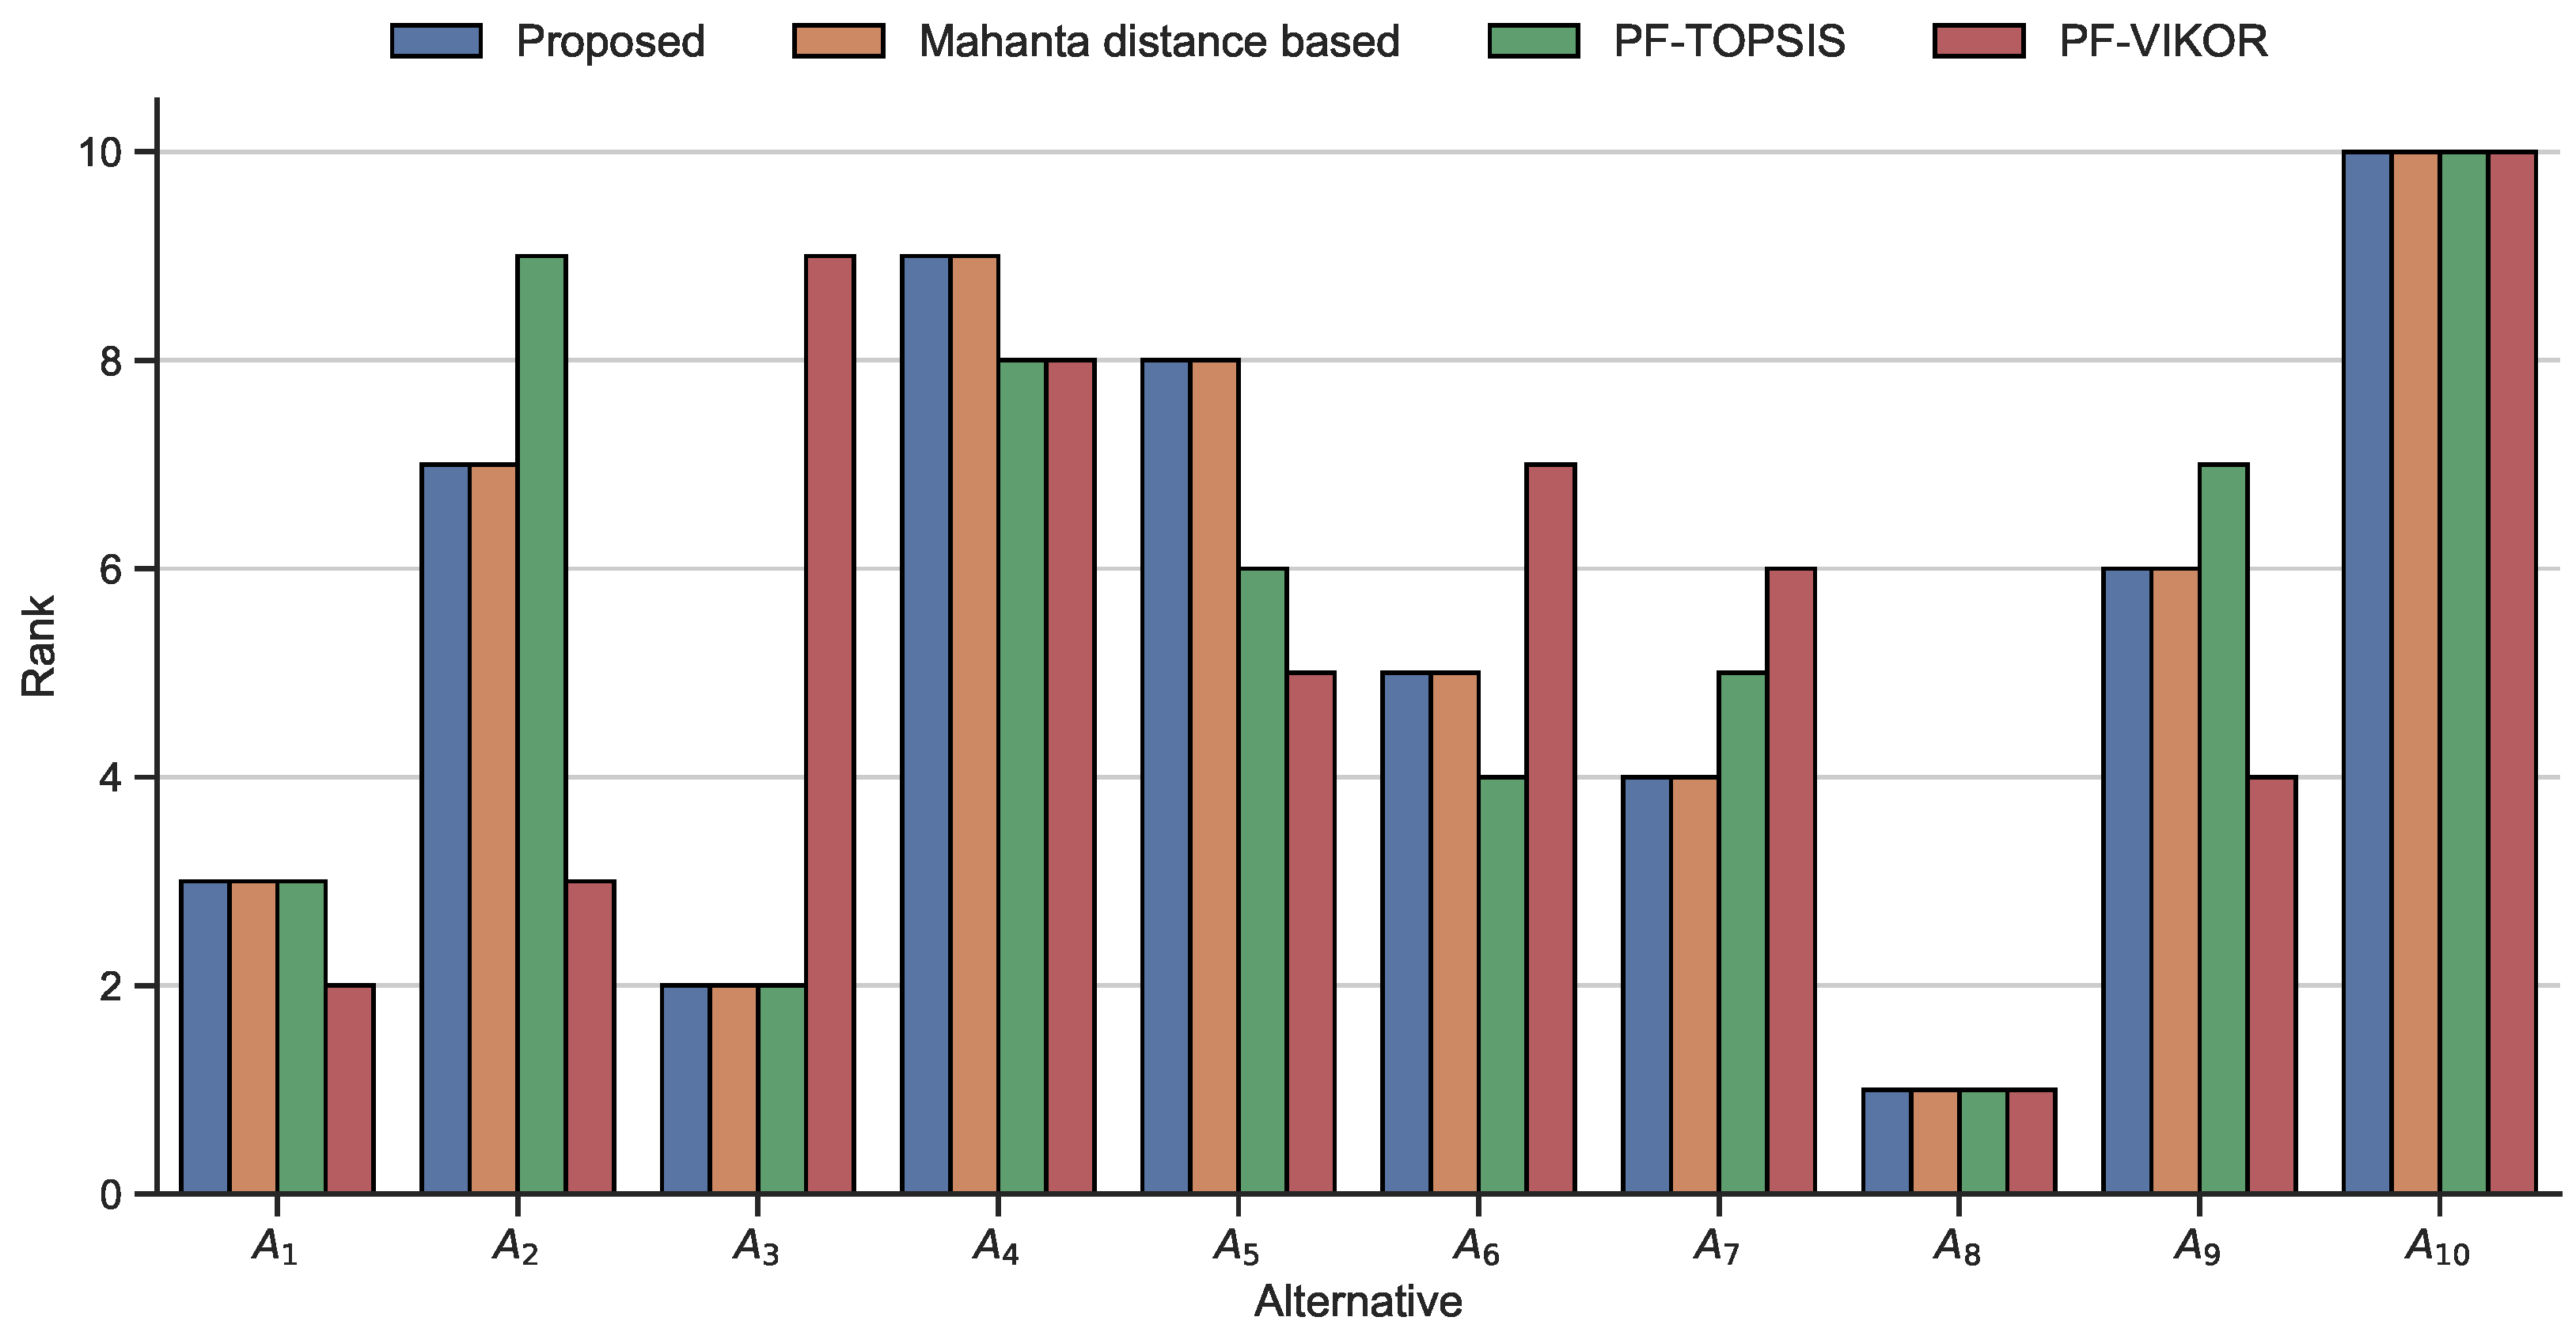
4.2. Renewable Energy Source Selection

Another prevalent and crucial issue from a socio-economic point of view is the production of energy from renewable sources. This topic is widely discussed due to the current emphasis on sustainability. It is also a complex topic because using renewable energy sources for energy production must consider costs, the least possible impact on the environment, and the existing architectural order in the area. This topic has been addressed many times in the literature, whether in problems using crisp values, such as the presented comparison of classical multi-criteria decision-making methods in ranking renewable energy sources in Taiwan by Lee and Chang [61]; or the ones that were considered in a fuzzy environment, as in the case presented by Xu et al. [62] where they showed the application of decision-making methods in a renewable energy evaluation problem; or even Ezbakhe and Pérez-Foguet [63], where they considered renewable energy planning under uncertainty.
Therefore, it is worth looking into this problem, and in this numerical example, we will consider a larger theoretical decision problem containing ten alternatives and ten criteria. These will be nuclear energy, tidal energy, geothermal energy, wind energy, hydropower energy, bioenergy, solar energy, hydrogen fuel cells powerplant, hydroelectric energy, and photovoltaic energy as the alternatives. Energy storage capacity, land use requirements, aesthetic impact, noise levels, material availability and environmental impact, adaptability to climate variability, technology flexibility, maintenance requirements, job creation and economic impact, and supply chain resilience will be the criteria. This is also additionally shown as a scheme in Figure 3.
Table 7 presents a decision matrix that will be taken under further consideration.
Similarly to the previous numerical example, the positive and negative ideal PFS must be determined using Equations (12) and (13) accordingly. The resulting values are presented in Table 8.
In the case of this problem, an equal weighting approach was used so that the further vector of weights considered is as follows w = 0.1 , 0.1 , 0.1 , 0.1 , 0.1 , 0.1 , 0.1 , 0.1 , 0.1 , 0.1 . We then need to calculate the distance using Equation (3), which can ultimately be used to measure the similarity using Equation (15), which lets us calculate the relative similarity using Equation (16). The resulting values are presented in Table 9, which will be further discussed in next section.

Comparison

The comparison of the results in the renewable energy source selection problem was carried out in the same way as for the earlier, smaller problem, but in this case, equal weights were used. The preference values obtained using each solution are shown in Table 10. The values offered by PF-TOPSIS stand out the most due to their negative value. Also, the results obtained using the proposed distance measure are most similar to those obtained using the measure presented by Mahanta, followed by PF-VIKOR and PF-TOPSIS. Notably, the preference values obtained using the proposed distance measure are close to each other and thus would be more difficult for a human to draw conclusions from quickly.
The statistical measures are then presented in Table 11. These reaffirm how preference values are distributed by the different approaches to solve multi-criteria decision-making problems. In this case, as well as in the microgeneration technology selection problem, we can see that the results obtained using the proposed measure have the smallest standard deviation. This provides stability and reliability when solving decision-making problems. It is also worth noting the PF-VIKOR values, which, despite the large range, are characterized by a relatively low standard deviation.
The preference values were then ranked and visualized in Figure 4. It can be seen that there are no significant changes on the podium, but in the case of alternative three, PF-VIKOR rated it extremely less favorably than the other approaches, as in this case it was placed ninth instead of second place. The situation is similar for alternative two, whose position was assessed more favorably by PF-VIKOR than the rest of the approaches. However, it is worth noting that the distance measure proposed in this paper offers very similar results to the distance measure presented by Mahanta as well as to PF-TOPSIS.
The rankings were then compared using rank similarity coefficients (see Table 12). For this problem, we can observe a very high correlation with the approach using the distance proposed by Mahanta and with PF-TOPSIS. This confirms the usefulness of the proposed measure and methodology for decision-making problems. In multi-criteria decision-making problems, the values of the weights, which determine the importance of the individual criteria and the input data itself, might significantly impact the outcome. Simulation studies would need to be conducted to draw more insightful conclusions. It is also important to bear in mind the low variance of the preference values obtained after using the proposed distance measure, which may prove to be a limitation in problems containing a very large number of alternatives.

5. Conclusions and Future Directions

Many decisions made in life can significantly influence the course of subsequent events, whether in one’s personal, professional, or social life. Some decisions, which are global or national in scale, can affect many people as well as the economic state of an entire country. Therefore, studying this field and seeking new solutions to solve multi-criteria decision-making problems by considering various aspects is worthwhile.
This paper proposes a new formula for measuring the distance between Pythagorean fuzzy sets. The proof is carried out to demonstrate that the proposed measure is valid, and its use to obtain rankings in two example theoretical decision problems is presented. Furthermore, for both cases of multi-criteria decision-making problems, the results are compared with another distance measure and two multi-criteria decision-making methods, namely, PF-TOPSIS and PF-VIKOR. The analysis allows us to conclude that the results obtained by the approach using the proposed measure are valid and yield results similar to the PF-TOPSIS method while maintaining less complicated calculations and a more straightforward procedure. The preference results have the smallest standard deviation, which allows for higher stability and reliability, leading to more accurate and reliable outcomes in decision-making processes. However, the low variability in the data can become a limitation when solving large decision-making problems, i.e., those in which the number of alternatives would be at least several hundred.
Future studies would benefit from a simulation approach to provide a more in-depth analysis considering the sensitivity analysis of the proposed approach. Moreover, it would be worthwhile to lean into real-world problems from different domains to reassert the stability of the proposed measure. Furthermore, it would be worth comparing the results obtained by the presented procedure with other multi-criteria decision-making methods designed for an uncertain environment.

Author Contributions

Conceptualization, P.T. (Palvinder Thakur), B.P., N.G., P.T. (Parul Thakur), N.S. and W.S.; methodology, P.T. (Palvinder Thakur), B.P., N.G., P.T. (Parul Thakur), N.S. and W.S.; software, P.T. (Palvinder Thakur), B.P., N.G., P.T. (Parul Thakur), N.S. and W.S.; validation, P.T. (Palvinder Thakur), B.P., N.G., P.T. (Parul Thakur), N.S. and W.S.; formal analysis, P.T. (Palvinder Thakur), B.P., N.G., P.T. (Parul Thakur), N.S. and W.S.; investigation, P.T. (Palvinder Thakur), B.P., N.G., P.T. (Parul Thakur), N.S. and W.S.; resources, P.T. (Palvinder Thakur), B.P., N.G., P.T. (Parul Thakur), N.S. and W.S.; data curation, P.T. (Palvinder Thakur), B.P., N.G., P.T. (Parul Thakur), N.S. and W.S.; writing—original draft preparation, P.T. (Palvinder Thakur), B.P., N.G., P.T. (Parul Thakur), N.S. and W.S.; writing—review and editing, P.T. (Palvinder Thakur), B.P., N.G., P.T. (Parul Thakur), N.S. and W.S.; visualization, P.T. (Palvinder Thakur), B.P., N.G., P.T. (Parul Thakur), N.S. and W.S.; supervision, P.T. (Palvinder Thakur), B.P., N.G., P.T. (Parul Thakur), N.S. and W.S.; project administration, P.T. (Palvinder Thakur), B.P., N.G., P.T. (Parul Thakur), N.S. and W.S.; funding acquisition, W.S. All authors have read and agreed to the published version of the manuscript.

Funding

This research was funded by National Science Center grant number 2021/41/B/HS4/01296.

Institutional Review Board Statement

Not applicable.

Informed Consent Statement

Not applicable.

Data Availability Statement

Data are contained within the article.

Acknowledgments

The authors would like to thank the editor and the anonymous reviewers, whose insightful comments and constructive suggestions helped us to significantly improve the quality of this paper.

Conflicts of Interest

The authors declare no conflicts of interest.

Abbreviations

The following abbreviations are used in this manuscript:
MCDAMulti-criteria Decision Analysis
MCDMMulti-criteria Decision Making
FSFuzzy Set
IFSIntuitionistic Fuzzy Set
PFSPythagorean Fuzzy Set
TOPSISTechnique for Order of Preference by Similarity to Ideal Solution
SWARAStepwise Weight Assessment Ratio Analysis
PF-TOPSISPythagorean Fuzzy Technique for Order of Preference by Similarity to Ideal Solution
PF-VIKORPythagorean Fuzzy VIseKriterijumska Optimizacija I Kompromisno Resenje

References

  1. Aruldoss, M.; Lakshmi, T.M.; Venkatesan, V.P. A survey on multi criteria decision making methods and its applications. Am. J. Inf. Syst. 2013, 1, 31–43. [Google Scholar]
  2. Jato-Espino, D.; Castillo-Lopez, E.; Rodriguez-Hernandez, J.; Canteras-Jordana, J.C. A review of application of multi-criteria decision making methods in construction. Autom. Constr. 2014, 45, 151–162. [Google Scholar] [CrossRef]
  3. Kabir, G.; Sadiq, R.; Tesfamariam, S. A review of multi-criteria decision-making methods for infrastructure management. Struct. Infrastruct. Eng. 2014, 10, 1176–1210. [Google Scholar] [CrossRef]
  4. Marsh, K.; Lanitis, T.; Neasham, D.; Orfanos, P.; Caro, J. Assessing the value of healthcare interventions using multi-criteria decision analysis: A review of the literature. Pharmacoeconomics 2014, 32, 345–365. [Google Scholar] [CrossRef] [PubMed]
  5. Jamwal, A.; Agrawal, R.; Sharma, M.; Kumar, V. Review on multi-criteria decision analysis in sustainable manufacturing decision making. Int. J. Sustain. Eng. 2021, 14, 202–225. [Google Scholar] [CrossRef]
  6. Shekhovtsov, A.; Więckowski, J.; Wątróbski, J. Toward reliability in the MCDA rankings: Comparison of distance-based methods. In Intelligent Decision Technologies, Proceedings of the 13th KES-IDT 2021 Conference; Springer: Berlin/Heidelberg, Germany, 2021; pp. 321–329. [Google Scholar]
  7. Kizielewicz, B.; Więckowski, J.; Shekhovtsov, A.; Wątróbski, J.; Depczyński, R.; Sałabun, W. Study towards the time-based mcda ranking analysis—A supplier selection case study. Facta Univ. Ser. Mech. Eng. 2021, 19, 381–399. [Google Scholar] [CrossRef]
  8. Thakur, P.; Kizielewicz, B.; Gandotra, N.; Shekhovtsov, A.; Saini, N.; Saeid, A.B.; Sałabun, W. A new entropy measurement for the analysis of uncertain data in mcda problems using intuitionistic fuzzy sets and copras method. Axioms 2021, 10, 335. [Google Scholar] [CrossRef]
  9. Sałabun, W.; Wątróbski, J.; Shekhovtsov, A. Are mcda methods benchmarkable? A comparative study of topsis, vikor, copras, and promethee ii methods. Symmetry 2020, 12, 1549. [Google Scholar] [CrossRef]
  10. Zhou, P.; Ang, B.W. Comparing MCDA aggregation methods in constructing composite indicators using the Shannon-Spearman measure. Soc. Indic. Res. 2009, 94, 83–96. [Google Scholar] [CrossRef]
  11. Antucheviciene, J.; Zakarevicius, A.; Zavadskas, E.K. Measuring congruence of ranking results applying particular MCDM methods. Informatica 2011, 22, 319–338. [Google Scholar] [CrossRef]
  12. Zadeh, L.A. Fuzzy sets as a basis for a theory of possibility. Fuzzy Sets Syst. 1978, 1, 3–28. [Google Scholar] [CrossRef]
  13. Kaya, I.; Colak, M.; Terzi, F. A comprehensive review of fuzzy multi criteria decision making methodologies for energy policy making. Energy Strategy Rev. 2019, 24, 207–228. [Google Scholar] [CrossRef]
  14. Pelissari, R.; Oliveira, M.C.; Abackerli, A.J.; Ben-Amor, S.; Assumpção, M.R.P. Techniques to model uncertain input data of multi-criteria decision-making problems: A literature review. Int. Trans. Oper. Res. 2021, 28, 523–559. [Google Scholar] [CrossRef]
  15. Mardani, A.; Jusoh, A.; Zavadskas, E.K. Fuzzy multiple criteria decision-making techniques and applications—Two decades review from 1994 to 2014. Expert Syst. Appl. 2015, 42, 4126–4148. [Google Scholar] [CrossRef]
  16. Shekhovtsov, A.; Paradowski, B.; Więckowski, J.; Kizielewicz, B.; Sałabun, W. Extension of the SPOTIS method for the rank reversal free decision-making under fuzzy environment. In Proceedings of the 2022 IEEE 61st Conference on Decision and Control (CDC), Cancun, Mexico, 6–9 December 2022; pp. 5595–5600. [Google Scholar]
  17. Yatsalo, B.; Korobov, A. Different approaches to fuzzy extension of an MCDA method and their comparison. In Intelligent and Fuzzy Techniques: Smart and Innovative Solutions, Proceedings of the INFUS 2020 Conference, Istanbul, Turkey, 21–23 July 2020; Springer: Berlin/Heidelberg, Germany, 2021; pp. 709–717. [Google Scholar]
  18. Yatsalo, B.; Korobov, A.; Martínez, L. Fuzzy multi-criteria acceptability analysis: A new approach to multi-criteria decision analysis under fuzzy environment. Expert Syst. Appl. 2017, 84, 262–271. [Google Scholar] [CrossRef]
  19. Atanassov, K.T.; Stoeva, S. Intuitionistic fuzzy sets. Fuzzy Sets Syst. 1986, 20, 87–96. [Google Scholar] [CrossRef]
  20. Yager, R.R.; Abbasov, A.M. Pythagorean membership grades, complex numbers, and decision making. Int. J. Intell. Syst. 2013, 28, 436–452. [Google Scholar] [CrossRef]
  21. Peng, X.; Selvachandran, G. Pythagorean fuzzy set: State of the art and future directions. Artif. Intell. Rev. 2019, 52, 1873–1927. [Google Scholar] [CrossRef]
  22. Lin, M.; Chen, Y.; Chen, R. Bibliometric analysis on Pythagorean fuzzy sets during 2013–2020. Int. J. Intell. Comput. Cybern. 2021, 14, 104–121. [Google Scholar] [CrossRef]
  23. Jafar, M.N.; Muniba, K.; Saqlain, M. Enhancing Diabetes Diagnosis through an Intuitionistic Fuzzy Soft Matrices-Based Algorithm. Spectr. Eng. Manag. Sci. 2023, 1, 73–82. [Google Scholar]
  24. El-Morsy, S. Stock portfolio optimization using pythagorean fuzzy numbers. J. Oper. Strateg. Anal. 2023, 1, 8–13. [Google Scholar] [CrossRef]
  25. Rani, P.; Mishra, A.R.; Saha, A.; Pamucar, D. Pythagorean fuzzy weighted discrimination-based approximation approach to the assessment of sustainable bioenergy technologies for agricultural residues. Int. J. Intell. Syst. 2021, 36, 2964–2990. [Google Scholar] [CrossRef]
  26. Paul, T.K.; Jana, C.; Pal, M. Enhancing Multi-Attribute Decision Making with Pythagorean Fuzzy Hamacher Aggregation Operators. J. Ind. Intell. 2023, 8, 372–383. [Google Scholar] [CrossRef]
  27. Hussain, Z.; Alam, S.; Hussain, R.; ur Rahman, S. New similarity measure of Pythagorean fuzzy sets based on the Jaccard index with its application to clustering. Ain Shams Eng. J. 2023, 15, 102294. [Google Scholar] [CrossRef]
  28. Garg, H. Confidence levels based Pythagorean fuzzy aggregation operators and its application to decision-making process. Comput. Math. Organ. Theory 2017, 23, 546–571. [Google Scholar] [CrossRef]
  29. Karsak, E.E. Distance-based fuzzy MCDM approach for evaluating flexible manufacturing system alternatives. Int. J. Prod. Res. 2002, 40, 3167–3181. [Google Scholar] [CrossRef]
  30. Sałabun, W. The characteristic objects method: A new distance-based approach to multicriteria decision-making problems. J. Multi-Criteria Decis. Anal. 2015, 22, 37–50. [Google Scholar] [CrossRef]
  31. Ejegwa, P.A. Distance and similarity measures for Pythagorean fuzzy sets. Granul. Comput. 2020, 5, 225–238. [Google Scholar] [CrossRef]
  32. Soltani, M.; Aouag, H.; Anass, C.; Mouss, M.D. Development of an advanced application process of lean manufacturing approach based on a new integrated mcdm method under pythagorean fuzzy environment. J. Clean. Prod. 2023, 386, 135731. [Google Scholar] [CrossRef]
  33. Chen, T.-Y. Remoteness index-based Pythagorean fuzzy VIKOR methods with a generalized distance measure for multiple criteria decision analysis. Inf. Fusion 2018, 41, 129–150. [Google Scholar] [CrossRef]
  34. Hussian, Z.; Yang, M.-S. Distance and similarity measures of Pythagorean fuzzy sets based on the Hausdorff metric with application to fuzzy TOPSIS. Int. J. Intell. Syst. 2019, 34, 2633–2654. [Google Scholar] [CrossRef]
  35. Agheli, B.; Adabitabar Firozja, M.; Garg, H. Similarity measure for Pythagorean fuzzy sets and application on multiple criteria decision making. J. Stat. Manag. Syst. 2022, 25, 749–769. [Google Scholar] [CrossRef]
  36. Zeng, W.; Li, D.; Yin, Q. Distance and similarity measures of Pythagorean fuzzy sets and their applications to multiple criteria group decision making. Int. J. Intell. Syst. 2018, 33, 2236–2254. [Google Scholar] [CrossRef]
  37. Ohlan, A. Multiple attribute decision-making based on distance measure under pythagorean fuzzy environment. Int. J. Inf. Technol. 2022, 14, 2205–2217. [Google Scholar] [CrossRef]
  38. Yin, L.; Zhang, Q.; Zhao, F.; Mou, Q.; Xian, S. A new distance measure for Pythagorean fuzzy sets based on earth mover’s distance and its applications. J. Intell. Fuzzy Syst. 2022, 42, 3079–3092. [Google Scholar] [CrossRef]
  39. Zhou, F.; Chen, T.-Y. A novel distance measure for pythagorean fuzzy sets and its applications to the technique for order preference by similarity to ideal solutions. Int. J. Comput. Intell. Syst. 2019, 12, 955–969. [Google Scholar] [CrossRef]
  40. Wang, F.; Zhao, X. Prospect-theory and geometric distance measure-based Pythagorean cubic fuzzy multicriteria decision-making. Int. J. Intell. Syst. 2021, 36, 4117–4142. [Google Scholar] [CrossRef]
  41. Sun, G.; Wang, M. Pythagorean fuzzy information processing based on centroid distance measure and its applications. Expert Syst. Appl. 2024, 236, 121295. [Google Scholar] [CrossRef]
  42. Lai, Y.-J.; Liu, T.-Y.; Hwang, C.-L. Topsis for MODM. Eur. J. Oper. Res. 1994, 76, 486–500. [Google Scholar] [CrossRef]
  43. Krohling, R.A.; Pacheco, A.G. A-TOPSIS–an approach based on TOPSIS for ranking evolutionary algorithms. Procedia Comput. Sci. 2015, 55, 308–317. [Google Scholar] [CrossRef]
  44. Yang, S.; Pan, Y.; Zeng, S. Decision making framework based Fermatean fuzzy integrated weighted distance and TOPSIS for green low-carbon port evaluation. Eng. Appl. Artif. Intell. 2022, 114, 105048. [Google Scholar] [CrossRef]
  45. Salih, M.M.; Zaidan, B.; Zaidan, A.; Ahmed, M.A. Survey on fuzzy TOPSIS state-of-the-art between 2007 and 2017. Comput. Oper. Res. 2019, 104, 207–227. [Google Scholar] [CrossRef]
  46. Akram, M.; Kahraman, C.; Zahid, K. Extension of TOPSIS model to the decision-making under complex spherical fuzzy information. Soft Comput. 2021, 25, 10771–10795. [Google Scholar] [CrossRef]
  47. Ilieva, G.; Yankova, T. Extension of interval-valued Fermatean fuzzy TOPSIS for evaluating and benchmarking COVID-19 vaccines. Mathematics 2022, 10, 3514. [Google Scholar] [CrossRef]
  48. Zhang, X.; Xu, Z. Extension of TOPSIS to multiple criteria decision making with Pythagorean fuzzy sets. Int. J. Intell. Syst. 2014, 29, 1061–1078. [Google Scholar] [CrossRef]
  49. Opricovic, S. Fuzzy VIKOR with an application to water resources planning. Expert Syst. Appl. 2011, 38, 12983–12990. [Google Scholar] [CrossRef]
  50. Hezer, S.; Gelmez, E.; Özceylan, E. Comparative analysis of TOPSIS, VIKOR and COPRAS methods for the COVID-19 Regional Safety Assessment. J. Infect. Public Health 2021, 14, 775–786. [Google Scholar] [CrossRef]
  51. Gou, X.; Xu, Z.; Liao, H.; Herrera, F. Probabilistic double hierarchy linguistic term set and its use in designing an improved VIKOR method: The application in smart healthcare. J. Oper. Res. Soc. 2021, 72, 2611–2630. [Google Scholar] [CrossRef]
  52. Saqlain, M. Sustainable hydrogen production: A decision-making approach using VIKOR and intuitionistic hypersoft sets. J. Intell. Manag. Decis. 2023, 2, 130–138. [Google Scholar] [CrossRef]
  53. Ju, Y.; Wang, A. Extension of VIKOR method for multi-criteria group decision making problem with linguistic information. Appl. Math. Model. 2013, 37, 3112–3125. [Google Scholar] [CrossRef]
  54. Riaz, M.; Tehrim, S.T. A robust extension of VIKOR method for bipolar fuzzy sets using connection numbers of SPA theory based metric spaces. Artif. Intell. Rev. 2021, 54, 561–591. [Google Scholar] [CrossRef]
  55. Bakioglu, G.; Atahan, A.O. AHP integrated TOPSIS and VIKOR methods with Pythagorean fuzzy sets to prioritize risks in self-driving vehicles. Appl. Soft Comput. 2021, 99, 106948. [Google Scholar] [CrossRef]
  56. Pinto da Costa, J.; Soares, C. A weighted rank measure of correlation. Aust. N. Z. J. Stat. 2005, 47, 515–529. [Google Scholar] [CrossRef]
  57. Sałabun, W.; Urbaniak, K. A new coefficient of rankings similarity in decision-making problems. In Proceedings of the Computational Science–ICCS 2020: 20th International Conference, Amsterdam, The Netherlands, 3–5 June 2020; Proceedings, Part II 20. Springer: Berlin/Heidelberg, Germany, 2020; pp. 632–645. [Google Scholar]
  58. Kamali Saraji, M.; Streimikiene, D.; Ciegis, R. A novel Pythagorean fuzzy-SWARA-TOPSIS framework for evaluating the EU progress towards sustainable energy development. Environ. Monit. Assess. 2022, 194, 42. [Google Scholar] [CrossRef] [PubMed]
  59. Zhang, C.; Wang, Q.; Zeng, S.; Baležentis, T.; Štreimikienė, D.; Ališauskaitė-Šeškienė, I.; Chen, X. Probabilistic multi-criteria assessment of renewable micro-generation technologies in households. J. Clean. Prod. 2019, 212, 582–592. [Google Scholar] [CrossRef]
  60. Mahanta, J.; Panda, S. Distance measure for Pythagorean fuzzy sets with varied applications. Neural Comput. Appl. 2021, 33, 17161–17171. [Google Scholar] [CrossRef]
  61. Lee, H.C.; Chang, C.T. Comparative analysis of MCDM methods for ranking renewable energy sources in Taiwan. Renew. Sustain. Energy Rev. 2018, 92, 883–896. [Google Scholar] [CrossRef]
  62. Xu, L.; Shah, S.A.A.; Zameer, H.; Solangi, Y.A. Evaluating renewable energy sources for implementing the hydrogen economy in Pakistan: A two-stage fuzzy MCDM approach. Environ. Sci. Pollut. Res. 2019, 26, 33202–33215. [Google Scholar] [CrossRef]
  63. Ezbakhe, F.; Pérez-Foguet, A. Decision analysis for sustainable development: The case of renewable energy planning under uncertainty. Eur. J. Oper. Res. 2021, 291, 601–613. [Google Scholar] [CrossRef]
Figure 1. Framework of microgeneration technology selection.
Information 15 00028 g001
Figure 2. Rankings visualization for the problem of microgeneration technology selection.
Information 15 00028 g002
Figure 3. Framework of renewable energy source selection.
Information 15 00028 g003
Figure 4. Rankings visualization for the problem of renewable energy source selection.
Information 15 00028 g004
Table 1. Pythagorean fuzzy matrix for microgeneration technology selection problem.
C1C2C3C4
A1(0.54, 0.63)(0.29, 0.61)(0.32, 0.27)(0.73, 0.44)
A2(0.23, 0.61)(0.49, 0.54)(0.39, 0.64)(0.60, 0.63)
A3(0.10, 0.25)(0.44, 0.56)(0.48, 0.31)(0.34, 0.43)
A4(0.61, 0.54)(0.73, 0.42)(0.28, 0.44)(0.53, 0.29)
A5(0.80, 0.12)(0.27, 0.68)(0.45, 0.66)(0.30, 0.64)
Table 2. Positive and negative ideal PFS for a given criterion in the problem of microgeneration technology selection.
CiC1C2C3C4
M+(0.80, 0.12)(0.73, 0.42)(0.48, 0.27)(0.73, 0.29)
M(0.10, 0.63)(0.27, 0.68)(0.28, 0.66)(0.30, 0.64)
Table 3. Distance and similarity for alternatives considered in the problem of microgeneration technology selection.
AiA1A2A3A4A5
D+0.22870.36360.22960.19190.2736
D0.24140.10640.24050.27820.1964
S(R)0.50420.41590.50360.52820.4748
Table 4. Preference values for the assessed alternatives in the problem of microgeneration technology selection.
AiProposed DistanceMahanta DistancePF-TOPSISPF-VIKOR
A10.50420.5278−0.12580.3196
A20.41590.3557−1.52120.8506
A30.50360.5420−0.59910.0000
A40.52820.54010.00000.2784
A50.47480.4578−0.91181.0000
Table 5. Statistical measures for the values of preferences from different approaches in the problem of microgeneration technology selection.
Statistical MeasureProposed DistanceMahanta DistancePF-TOPSISPF-VIKOR
Min0.41590.3557−1.52120.0000
Mean0.48530.4847−0.63160.4897
Max0.52820.54200.00001.0000
Std0.03860.07150.55240.3752
Table 6. Similarity of rankings of the proposed approach with other available approaches in the problem of microgeneration technology selection.
CoefficientMahanta DistancePF-TOPSISPF-VIKOR
Weighted Spearman0.61.00.5500
WS coefficient0.66671.00.6380
Table 7. Pythagorean fuzzy matrix for renewable energy source selection problem.
C1C2C3C4C5C6C7C8C9C10
A1(0.42, 0.60)(0.34, 0.23)(0.60, 0.16)(0.70, 0.23)(0.32, 0.42)(0.36, 0.54)(0.53, 0.70)(0.45, 0.25)(0.24, 0.35)(0.45, 0.45)
A2(0.72, 0.52)(0.12, 0.35)(0.33, 0.22)(0.55, 0.51)(0.36, 0.54)(0.14, 0.51)(0.21, 0.65)(0.23, 0.50)(0.72, 0.45)(0.26, 0.41)
A3(0.56, 0.54)(0.54, 0.12)(0.33, 0.59)(0.36, 0.45)(0.70, 0.18)(0.56, 0.45)(0.60, 0.45)(0.39, 0.36)(0.60, 0.12)(0.20, 0.10)
A4(0.34, 0.45)(0.30, 0.70)(0.36, 0.21)(0.45, 0.54)(0.35, 0.60)(0.26, 0.34)(0.25, 0.36)(0.35, 0.26)(0.27, 0.34)(0.14, 0.39)
A5(0.23, 0.45)(0.64, 0.45)(0.55, 0.35)(0.25, 0.32)(0.12, 0.35)(0.47, 0.52)(0.21, 0.51)(0.43, 0.54)(0.24, 0.36)(0.32, 0.60)
A6(0.52, 0.10)(0.56, 0.30)(0.45, 0.60)(0.40, 0.25)(0.50, 0.70)(0.58, 0.34)(0.36, 0.74)(0.46, 0.50)(0.32, 0.54)(0.60, 0.36)
A7(0.70, 0.33)(0.26, 0.36)(0.16, 0.36)(0.60, 0.11)(0.22, 0.70)(0.50, 0.35)(0.54, 0.70)(0.50, 0.15)(0.56, 0.60)(0.31, 0.54)
A8(0.66, 0.21)(0.75, 0.24)(0.41, 0.55)(0.51, 0.36)(0.70, 0.60)(0.51, 0.41)(0.66, 0.16)(0.52, 0.36)(0.52, 0.23)(0.71, 0.44)
A9(0.22, 0.69)(0.60, 0.61)(0.33, 0.60)(0.45, 0.31)(0.55, 0.29)(0.35, 0.21)(0.53, 0.25)(0.24, 0.29)(0.31, 0.54)(0.16, 0.36)
A10(0.16, 0.47)(0.13, 0.33)(0.26, 0.70)(0.23, 0.31)(0.30, 0.39)(0.25, 0.50)(0.31, 0.60)(0.13, 0.50)(0.36, 0.60)(0.27, 0.35)
Table 8. Positive and negative ideal PFS for a given criterion in the problem of renewable energy source selection.
CiC1C2C3C4C5C6C7C8C9C10
M+(0.72, 0.10)(0.75, 0.12)(0.60, 0.16)(0.70, 0.11)(0.70, 0.18)(0.58, 0.21)(0.66, 0.16)(0.52, 0.15)(0.72, 0.12)(0.71, 0.10)
M(0.16, 0.69)(0.12, 0.70)(0.16, 0.70)(0.23, 0.54)(0.12, 0.70)(0.14, 0.54)(0.21, 0.74)(0.13, 0.54)(0.24, 0.60)(0.14, 0.60)
Table 9. Distance and similarity for alternatives considered in the problem of renewable energy source selection.
AiA1A2A3A4A5A6A7A8A9A10
D+0.25910.31100.20520.33980.31700.27800.27500.13500.30300.3927
D0.26460.21270.31850.18490.20670.24570.24870.38870.22070.1309
S(R)0.50190.46670.53840.44720.46260.48910.49110.58590.47220.4113
Table 10. Preference values for the assessed alternatives in the problem of renewable energy source selection.
AiProposed DistanceMahanta DistancePF-TOPSISPF-VIKOR
A10.50190.5261−1.44330.3742
A20.46670.3892−2.30210.4269
A30.53840.6010−1.11940.6948
A40.44720.3675−2.23220.5495
A50.46260.3863−1.89380.4737
A60.48910.5057−1.80330.4977
A70.49110.5074−1.85590.4759
A80.58590.67580.00000.0000
A90.47220.4447−2.00140.4722
A100.41130.2321−2.93470.9960
Table 11. Statistical measures for the values of preferences from different approaches in the problem of renewable energy source selection.
Statistical MeasureProposed DistanceMahanta DistancePF-TOPSISPF-VIKOR
Min0.4110.232−2.9350.000
Mean0.4870.464−1.7590.496
Max0.5860.6760.0000.996
Std0.0460.1210.7480.237
Table 12. Similarity of rankings of the proposed approach with other available approaches in the problem of renewable energy source selection.
CoefficientMahanta DistancePF-TOPSISPF-VIKOR
Weighted Spearman1.00.950.47
WS coefficient1.00.980.72
Disclaimer/Publisher’s Note: The statements, opinions and data contained in all publications are solely those of the individual author(s) and contributor(s) and not of MDPI and/or the editor(s). MDPI and/or the editor(s) disclaim responsibility for any injury to people or property resulting from any ideas, methods, instructions or products referred to in the content.

