

Success Factors in Management of IT Service Projects: Regression, Confirmatory Factor Analysis, and Structural Equation Models


Abstract
:1. Introduction
- −
- We examined how the six criteria of measuring project management success [6,7,8,9], that is, (1) quality, (2) scope, (3) time, (4) cost, (5) customer satisfaction, and (6) provider satisfaction, relate to the four project management success dimensions obtained in the exploratory factor analysis. For this purpose, we performed a series of stepwise regression analyses that resulted in multivariate models showing which of these dimensions significantly influenced the measurement criteria and to what extent. These results are presented in Section 4.1.
- −
- We conducted a confirmatory factor analysis to evaluate the quality of the structure identified in the previous paper [5] using the exploratory factor analysis approach. Additionally, we validated the structure by performing a series of ten exploratory and confirmatory factor analyses on two random samples, dividing the initial data into two groups. The outcomes of this analysis are provided in Section 4.2.
- −
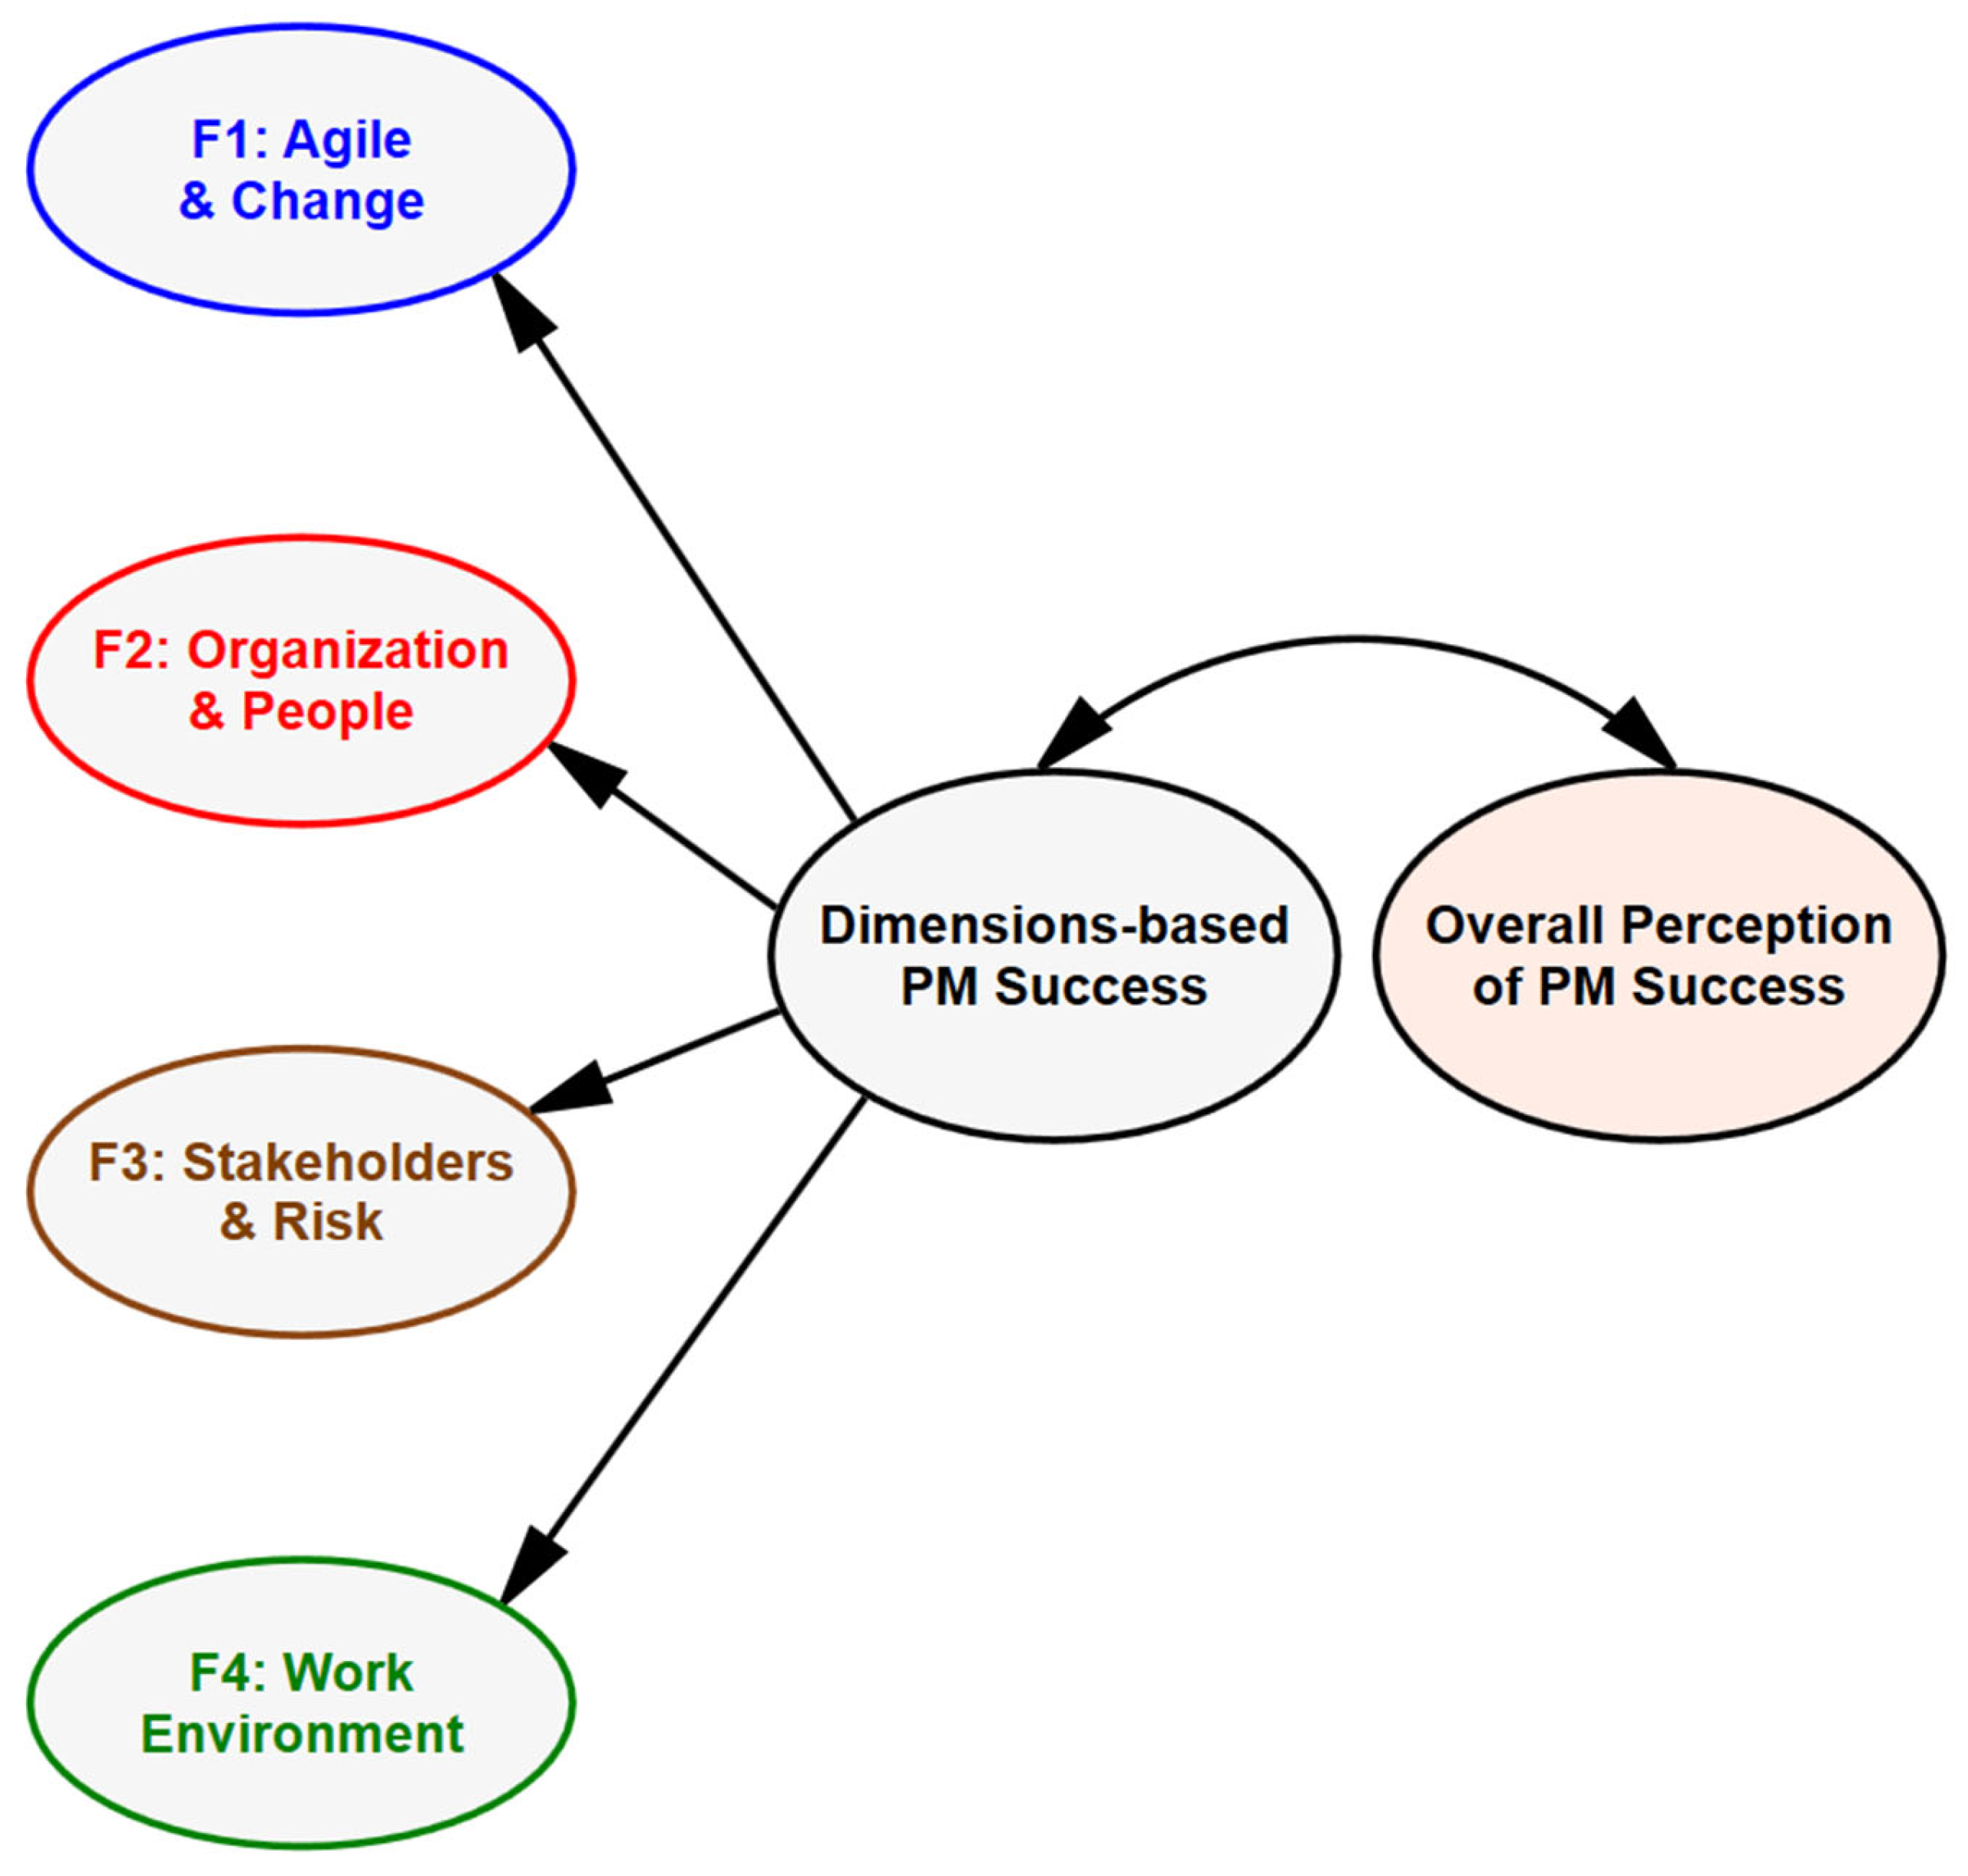
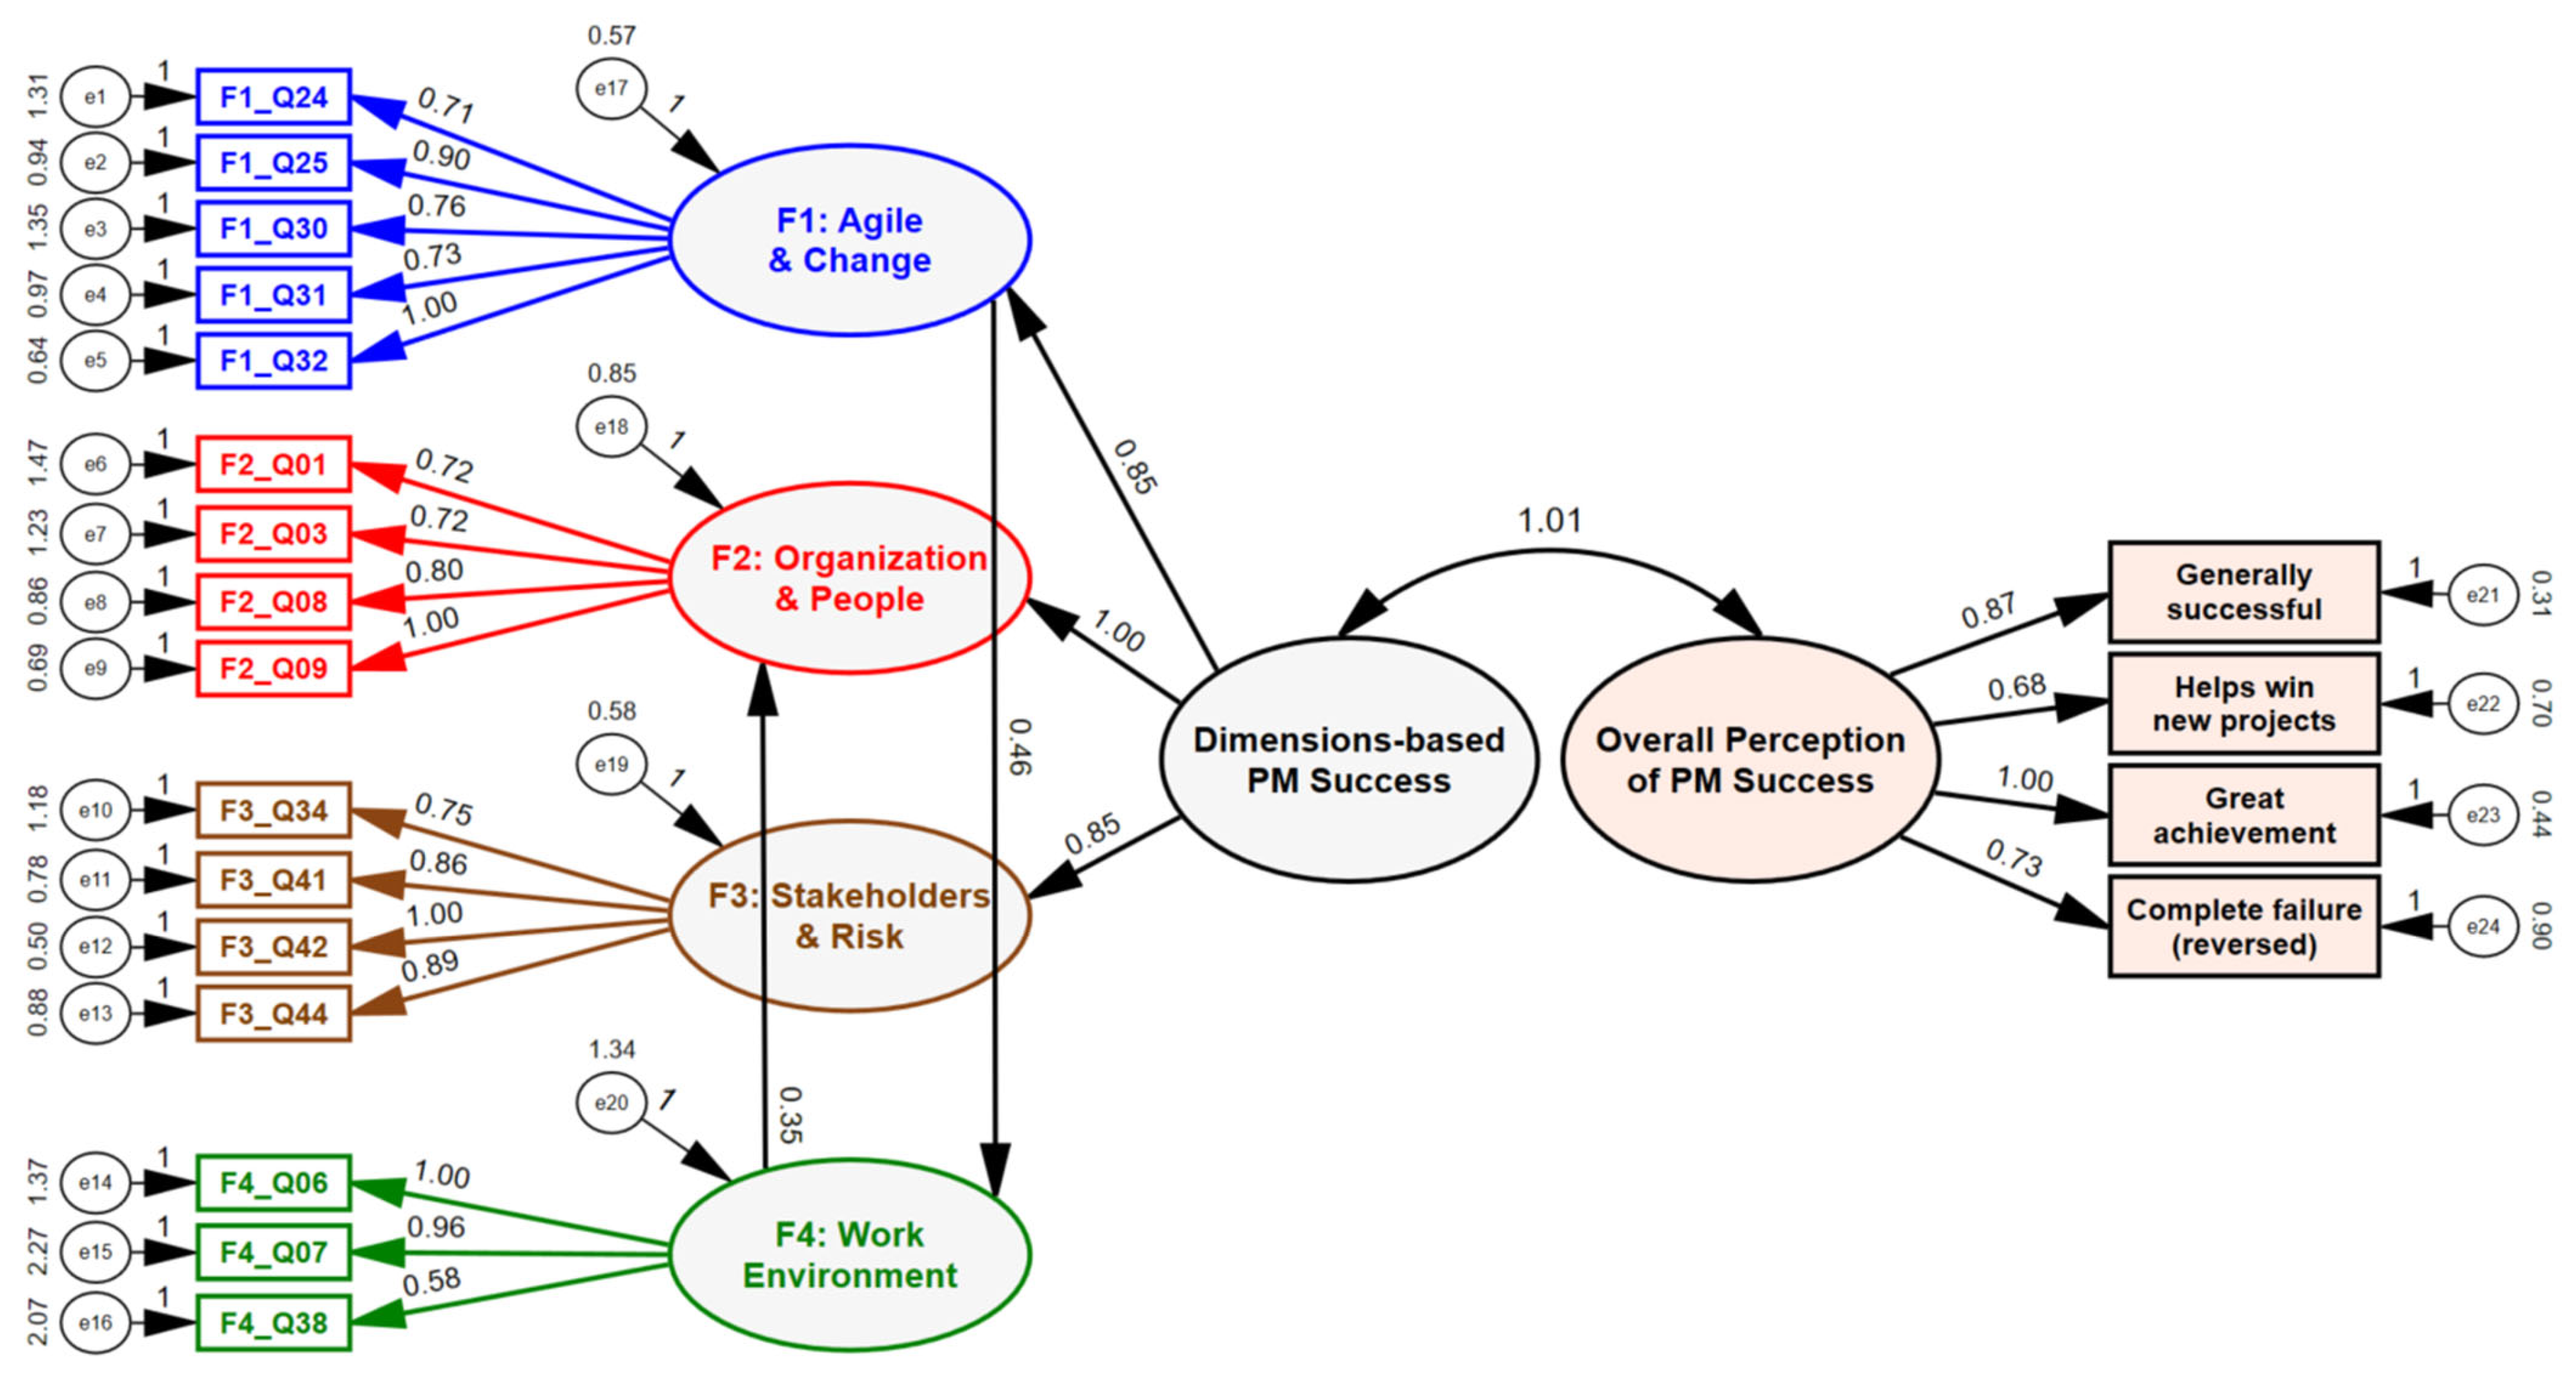
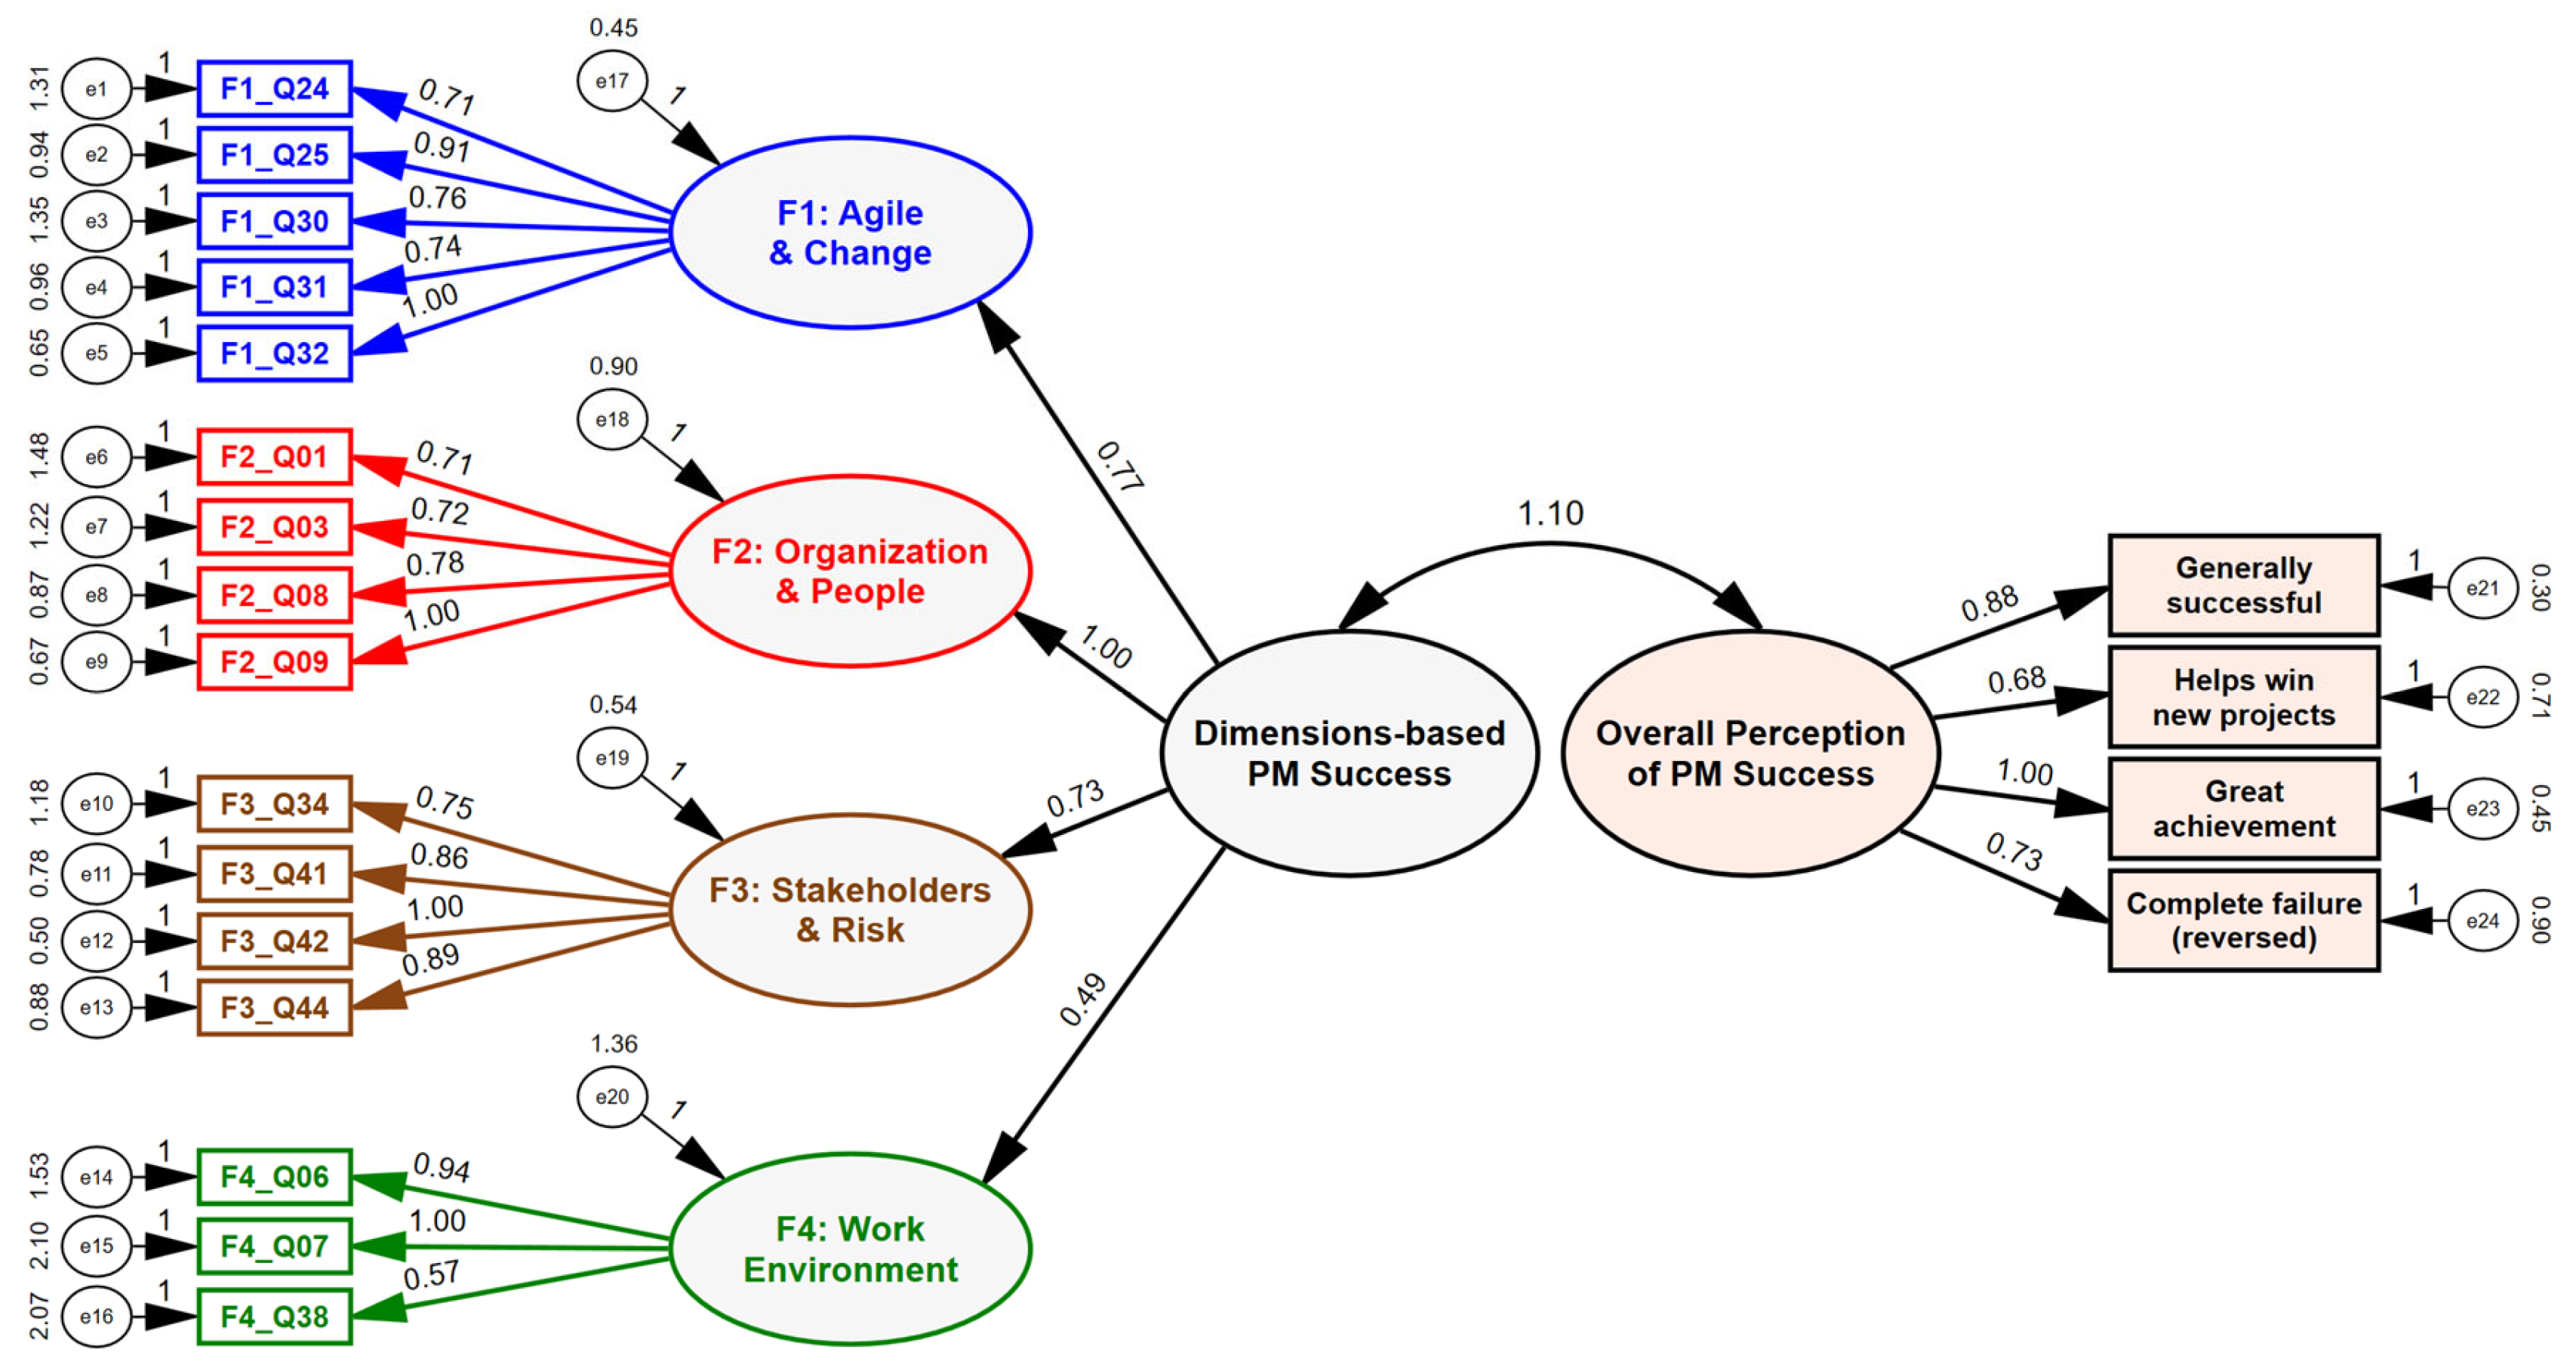
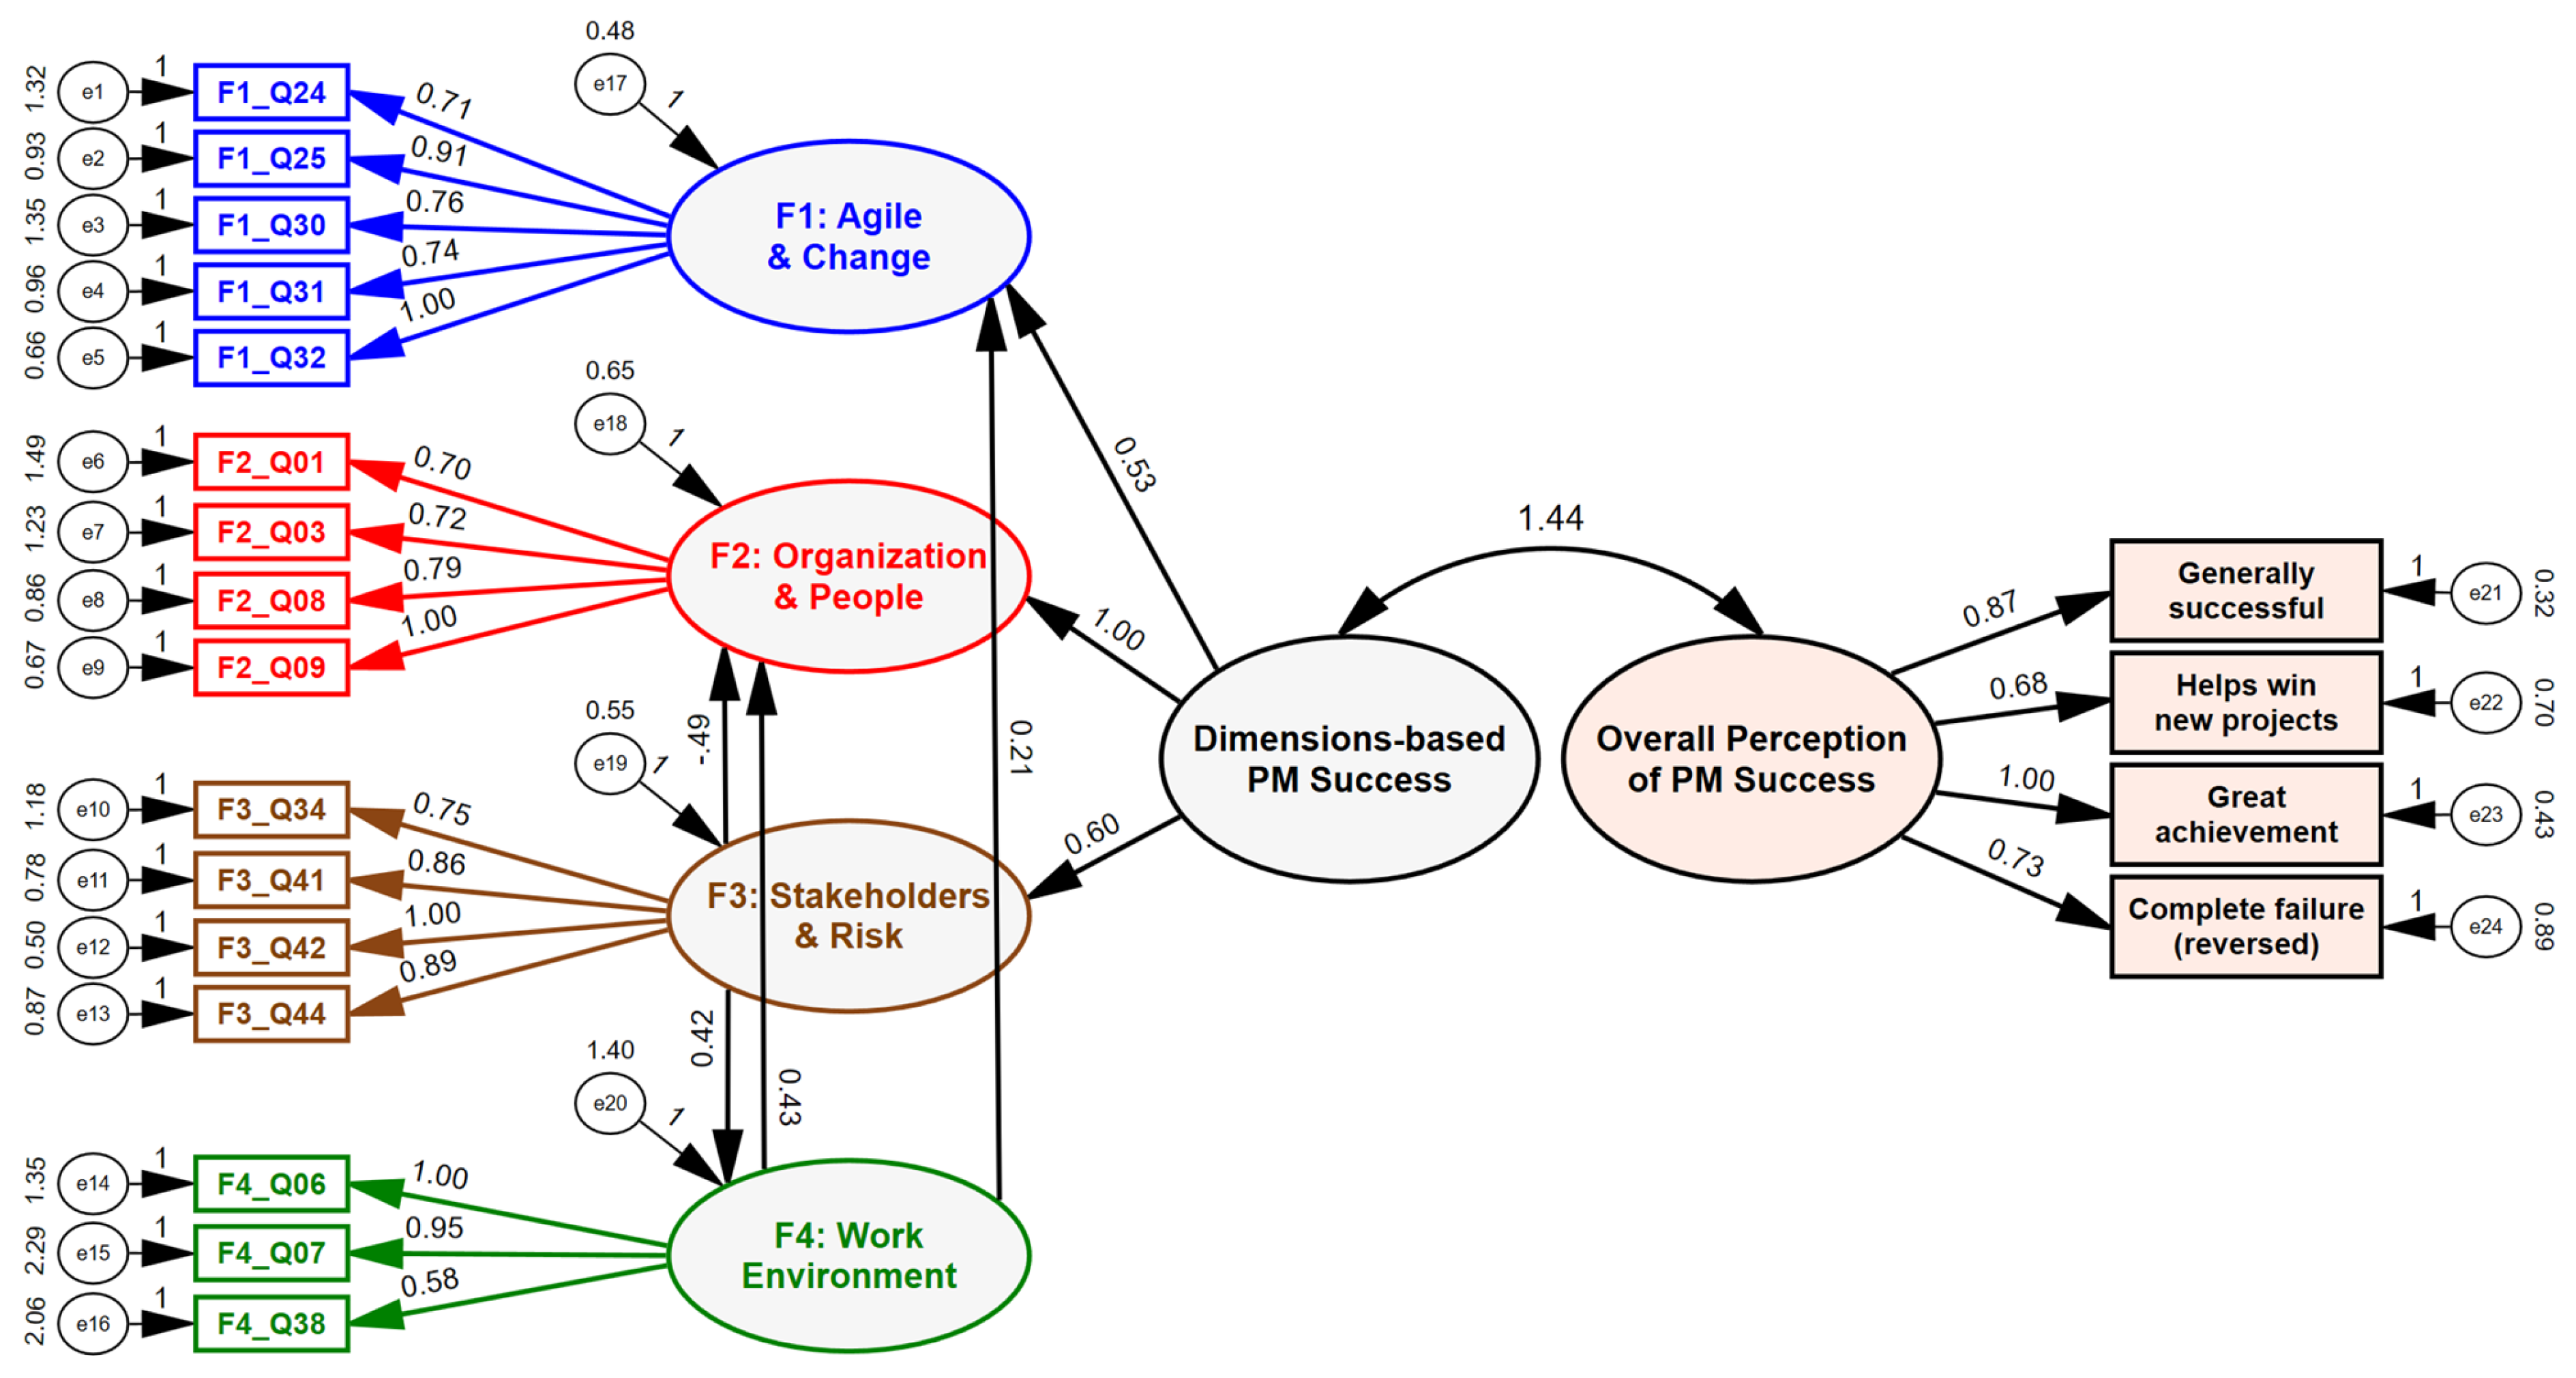
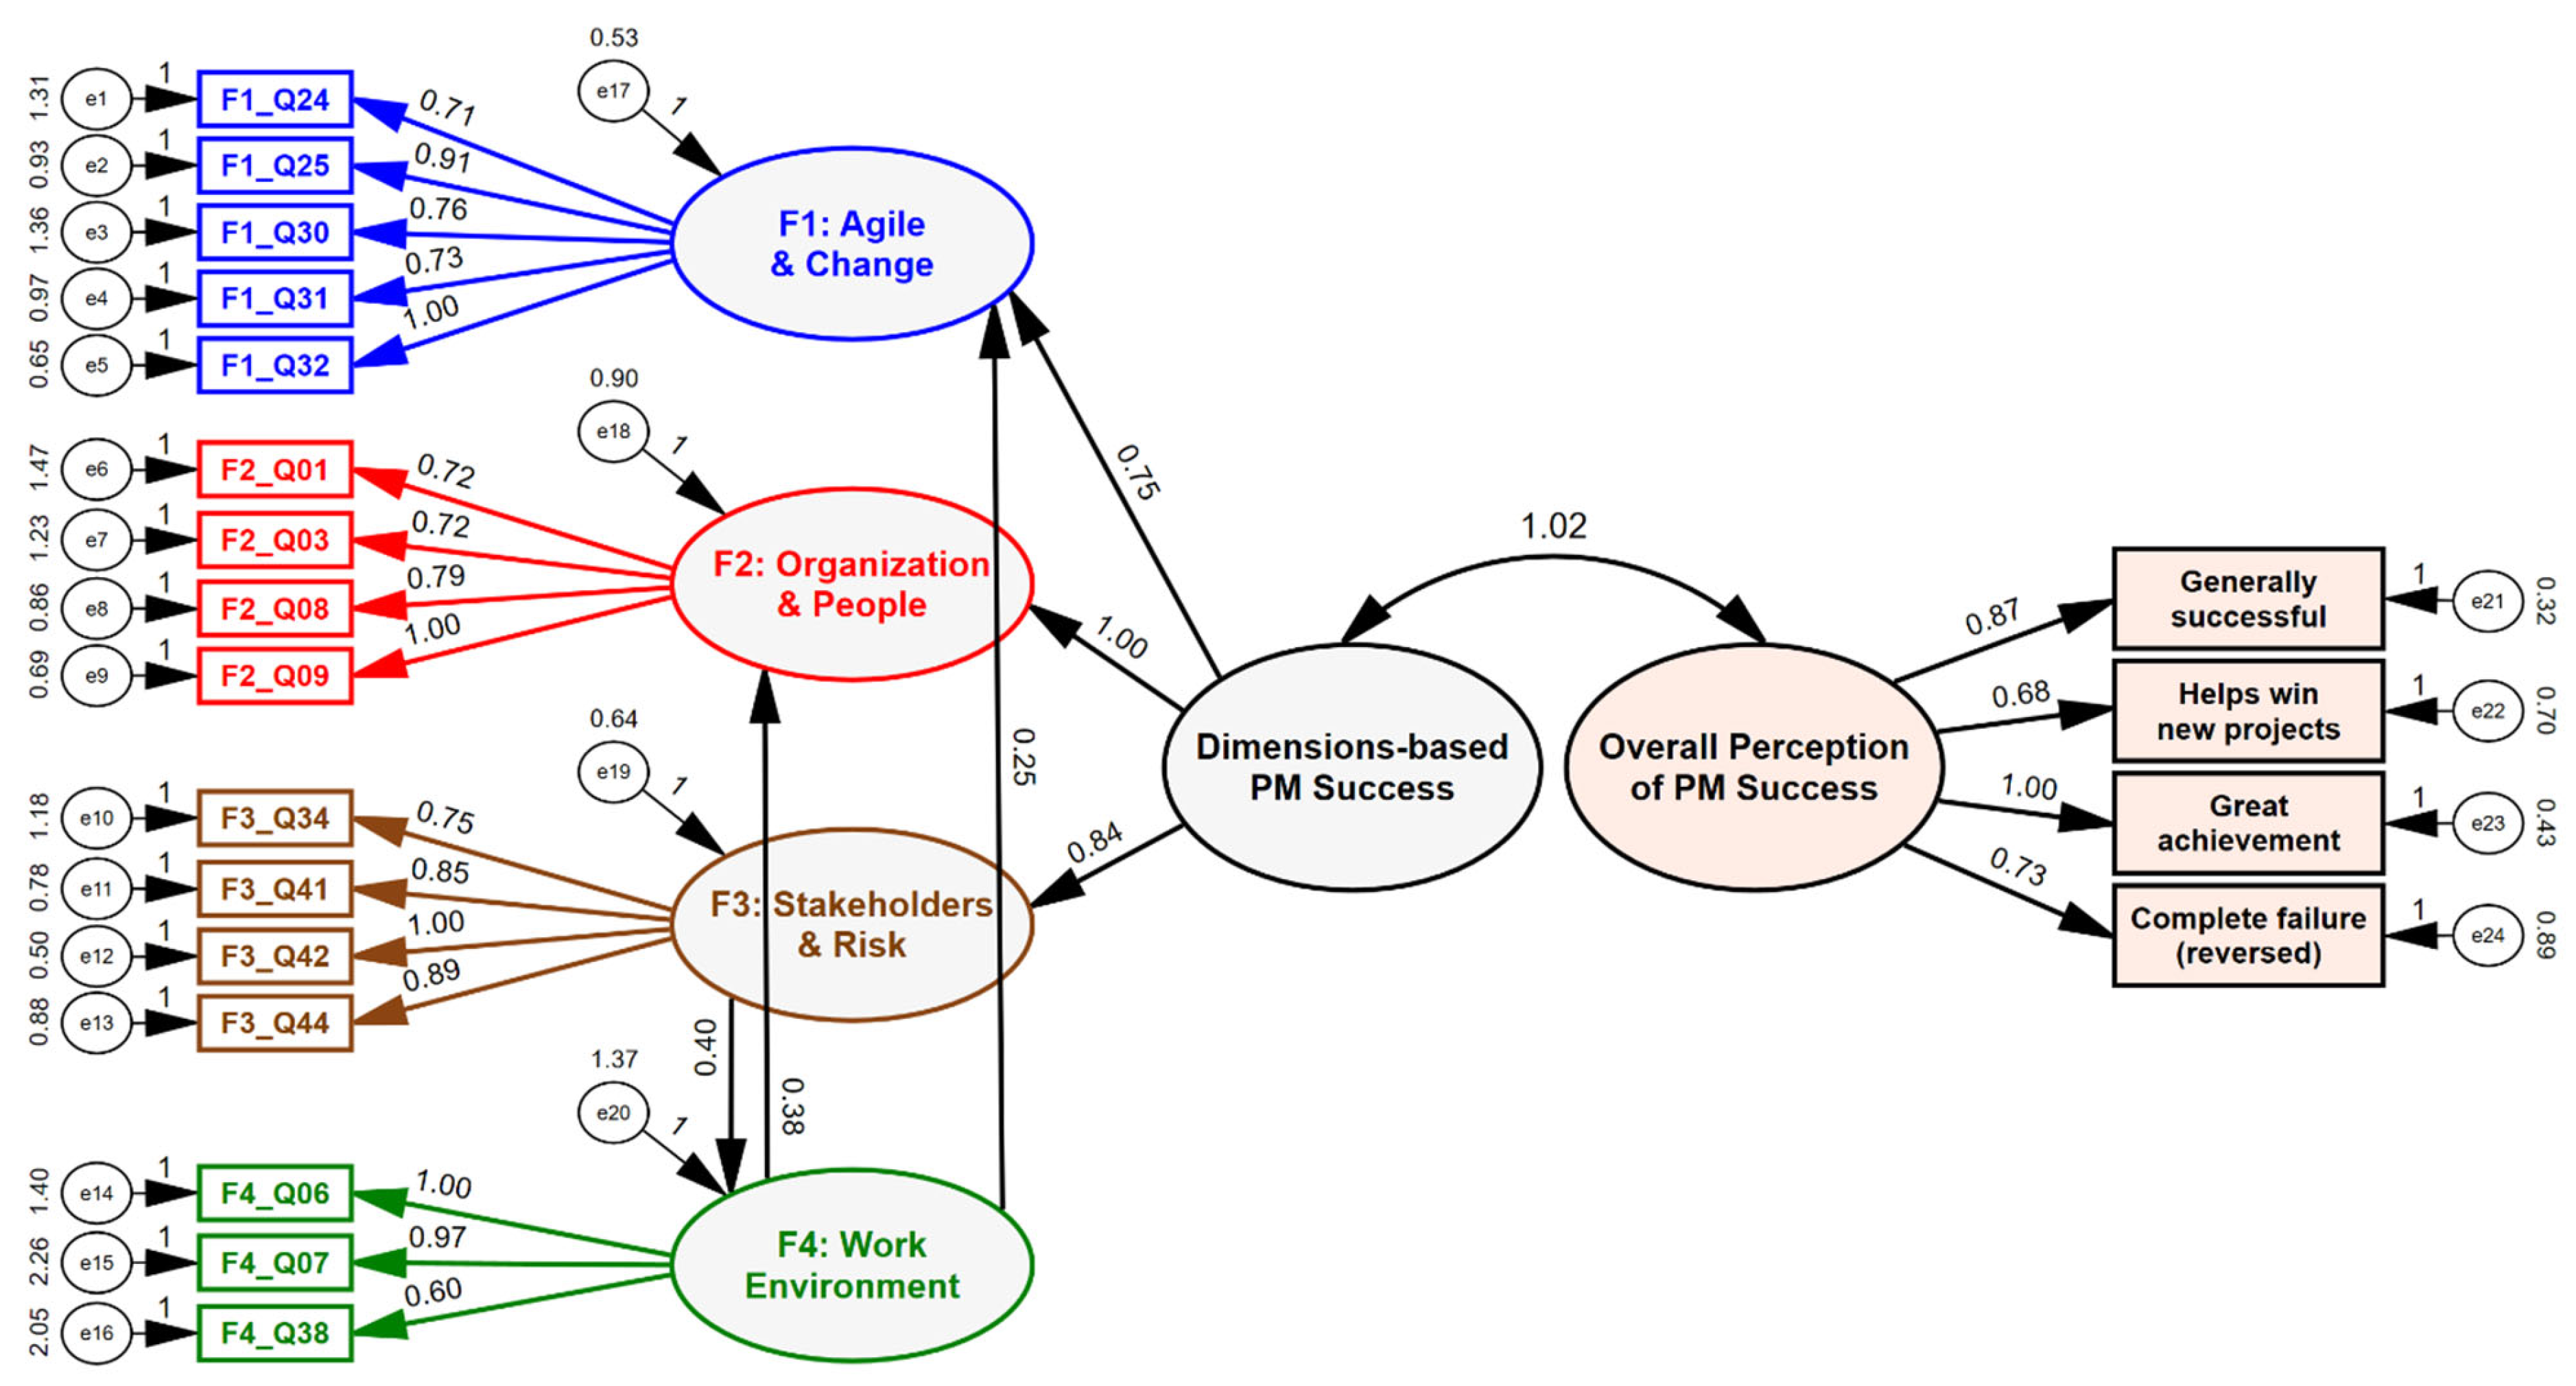
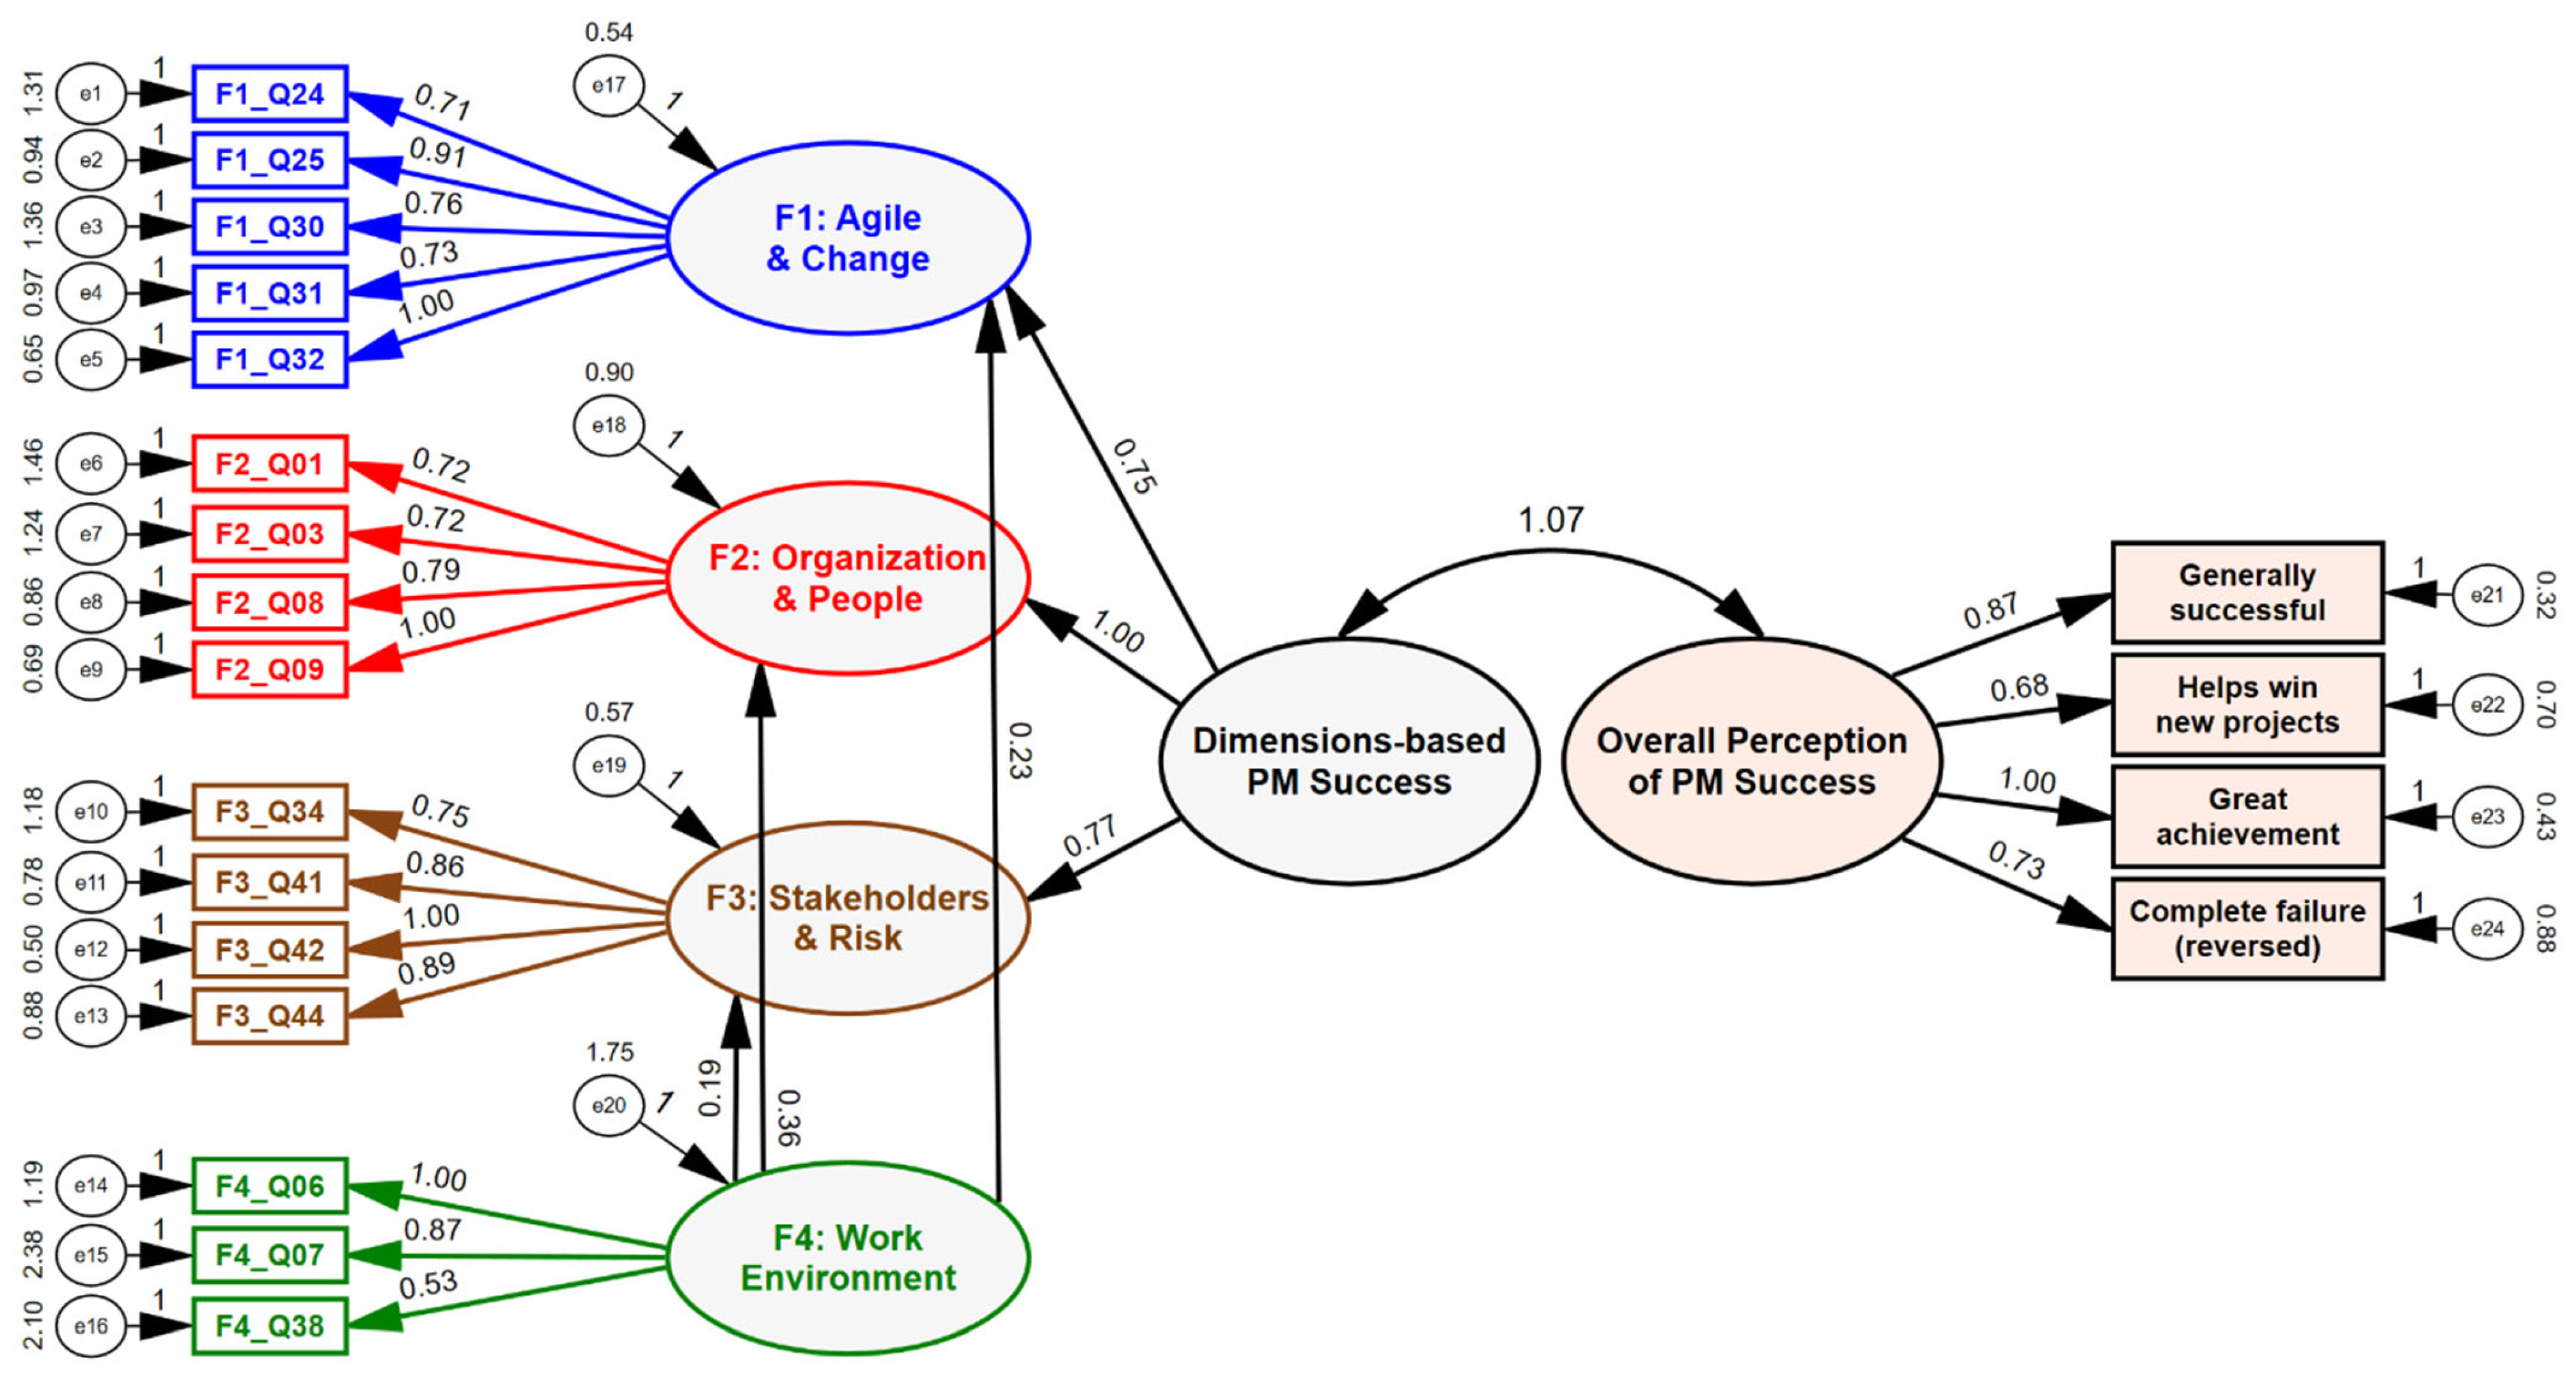
- In our study, we also gathered information on the respondents’ perception of project management success, which was not included in the analyses published by Zaleski & Michalski [5]. We found the relationships between the obtained success dimensions interesting, and thus, we employed structural equation modeling procedures to examine them. To find the best possible model that fits all the obtained questionnaire results, we developed a series of SEM analyses. We started with the orthogonal structure of the identified dimensions and the latent variable representing the overall perception of project management success, which was based on four questions. Next, we used the model specification search procedure available in the IBM SPSS Amos (version 28) software to identify the best overall model that involved all the gathered data. The entire procedure, along with the proposal of the final model that fits the data well and is logically interpretable, is provided in Section 4.3.
- −
- The additional contribution of this paper is related to the presented methodological approach for examining the relationships between different aspects of project management success. To the best of our knowledge, such a procedure has not been presented in any research that involved SEM in the field of project management and there are very few similar approaches in other areas.
2. Literature Review
2.1. Project Management Success and SEM
2.2. IT-Related Project Management Success and SEM
3. Methods
3.1. Questionnaire Development
3.2. Sample and Data Collection
3.3. Modeling
3.3.1. Multivariate Regressions
3.3.2. Confirmatory Factor Analysis (CFA)
3.3.3. Structural Equation Modeling
- (1)
- Model specification, which should be based on the theory and results of previous research. In this step, the necessary variables both dependent and independent along with their relations are defined. In our case, the model specification was built upon the results of exploratory factor analysis, which was based on a comprehensive literature review.
- (2)
- Model identification aims at finding the most parsimonious structure that reflects the links observed in the gathered data as best as possible. Only the most significant variables and relations should be introduced.
- (3)
- Parameter estimation, which consists of calculating values of the model parameters and accompanying errors. The most commonly used technique here is the maximum likelihood method, which is robust to change in measurement scale. Such a method of parameter estimation was used both in our confirmatory and path analysis (SEM).
- (4)
- Testing, which generally involves checking the quality of the model fit to the empirical data. Many techniques are available for this purpose. In the current study, we report typical absolute fit indices, such as chi-square test [38] and scaled [46]. We include frequently used Steiger’s root mean square error of approximation (RMSEA) measure [47], as well. Since these indicators are sensitive to sample size, therefore, we also present indices related to the extreme models (saturated and independent), that is, incremental fit index (IFI) [48] and comparative fit index (CFI) [49]. While modeling any phenomenon, researchers strive to include as few parameters as possible while at the same maximizing time reconstructing properties of the proposed model. For assessing and finding the most parsimonious proposals, we employed mainly Akaike information criterion (AIC) [50], Browne-Cudeck criterion (BCC) [51], and Bayes information criterion (BIC) [52]. The strength of model parameters was evaluated by standardized estimates for path coefficients, and the applied bootstrap procedure for 500 samples [53] allowed for verifying their statistical significance. The latent variable of overall project management success perception, based on four question variables was additionally assessed by composite reliability, Cronbach’s alpha and its standardized version, as well as the average variance extracted measures.
- (5)
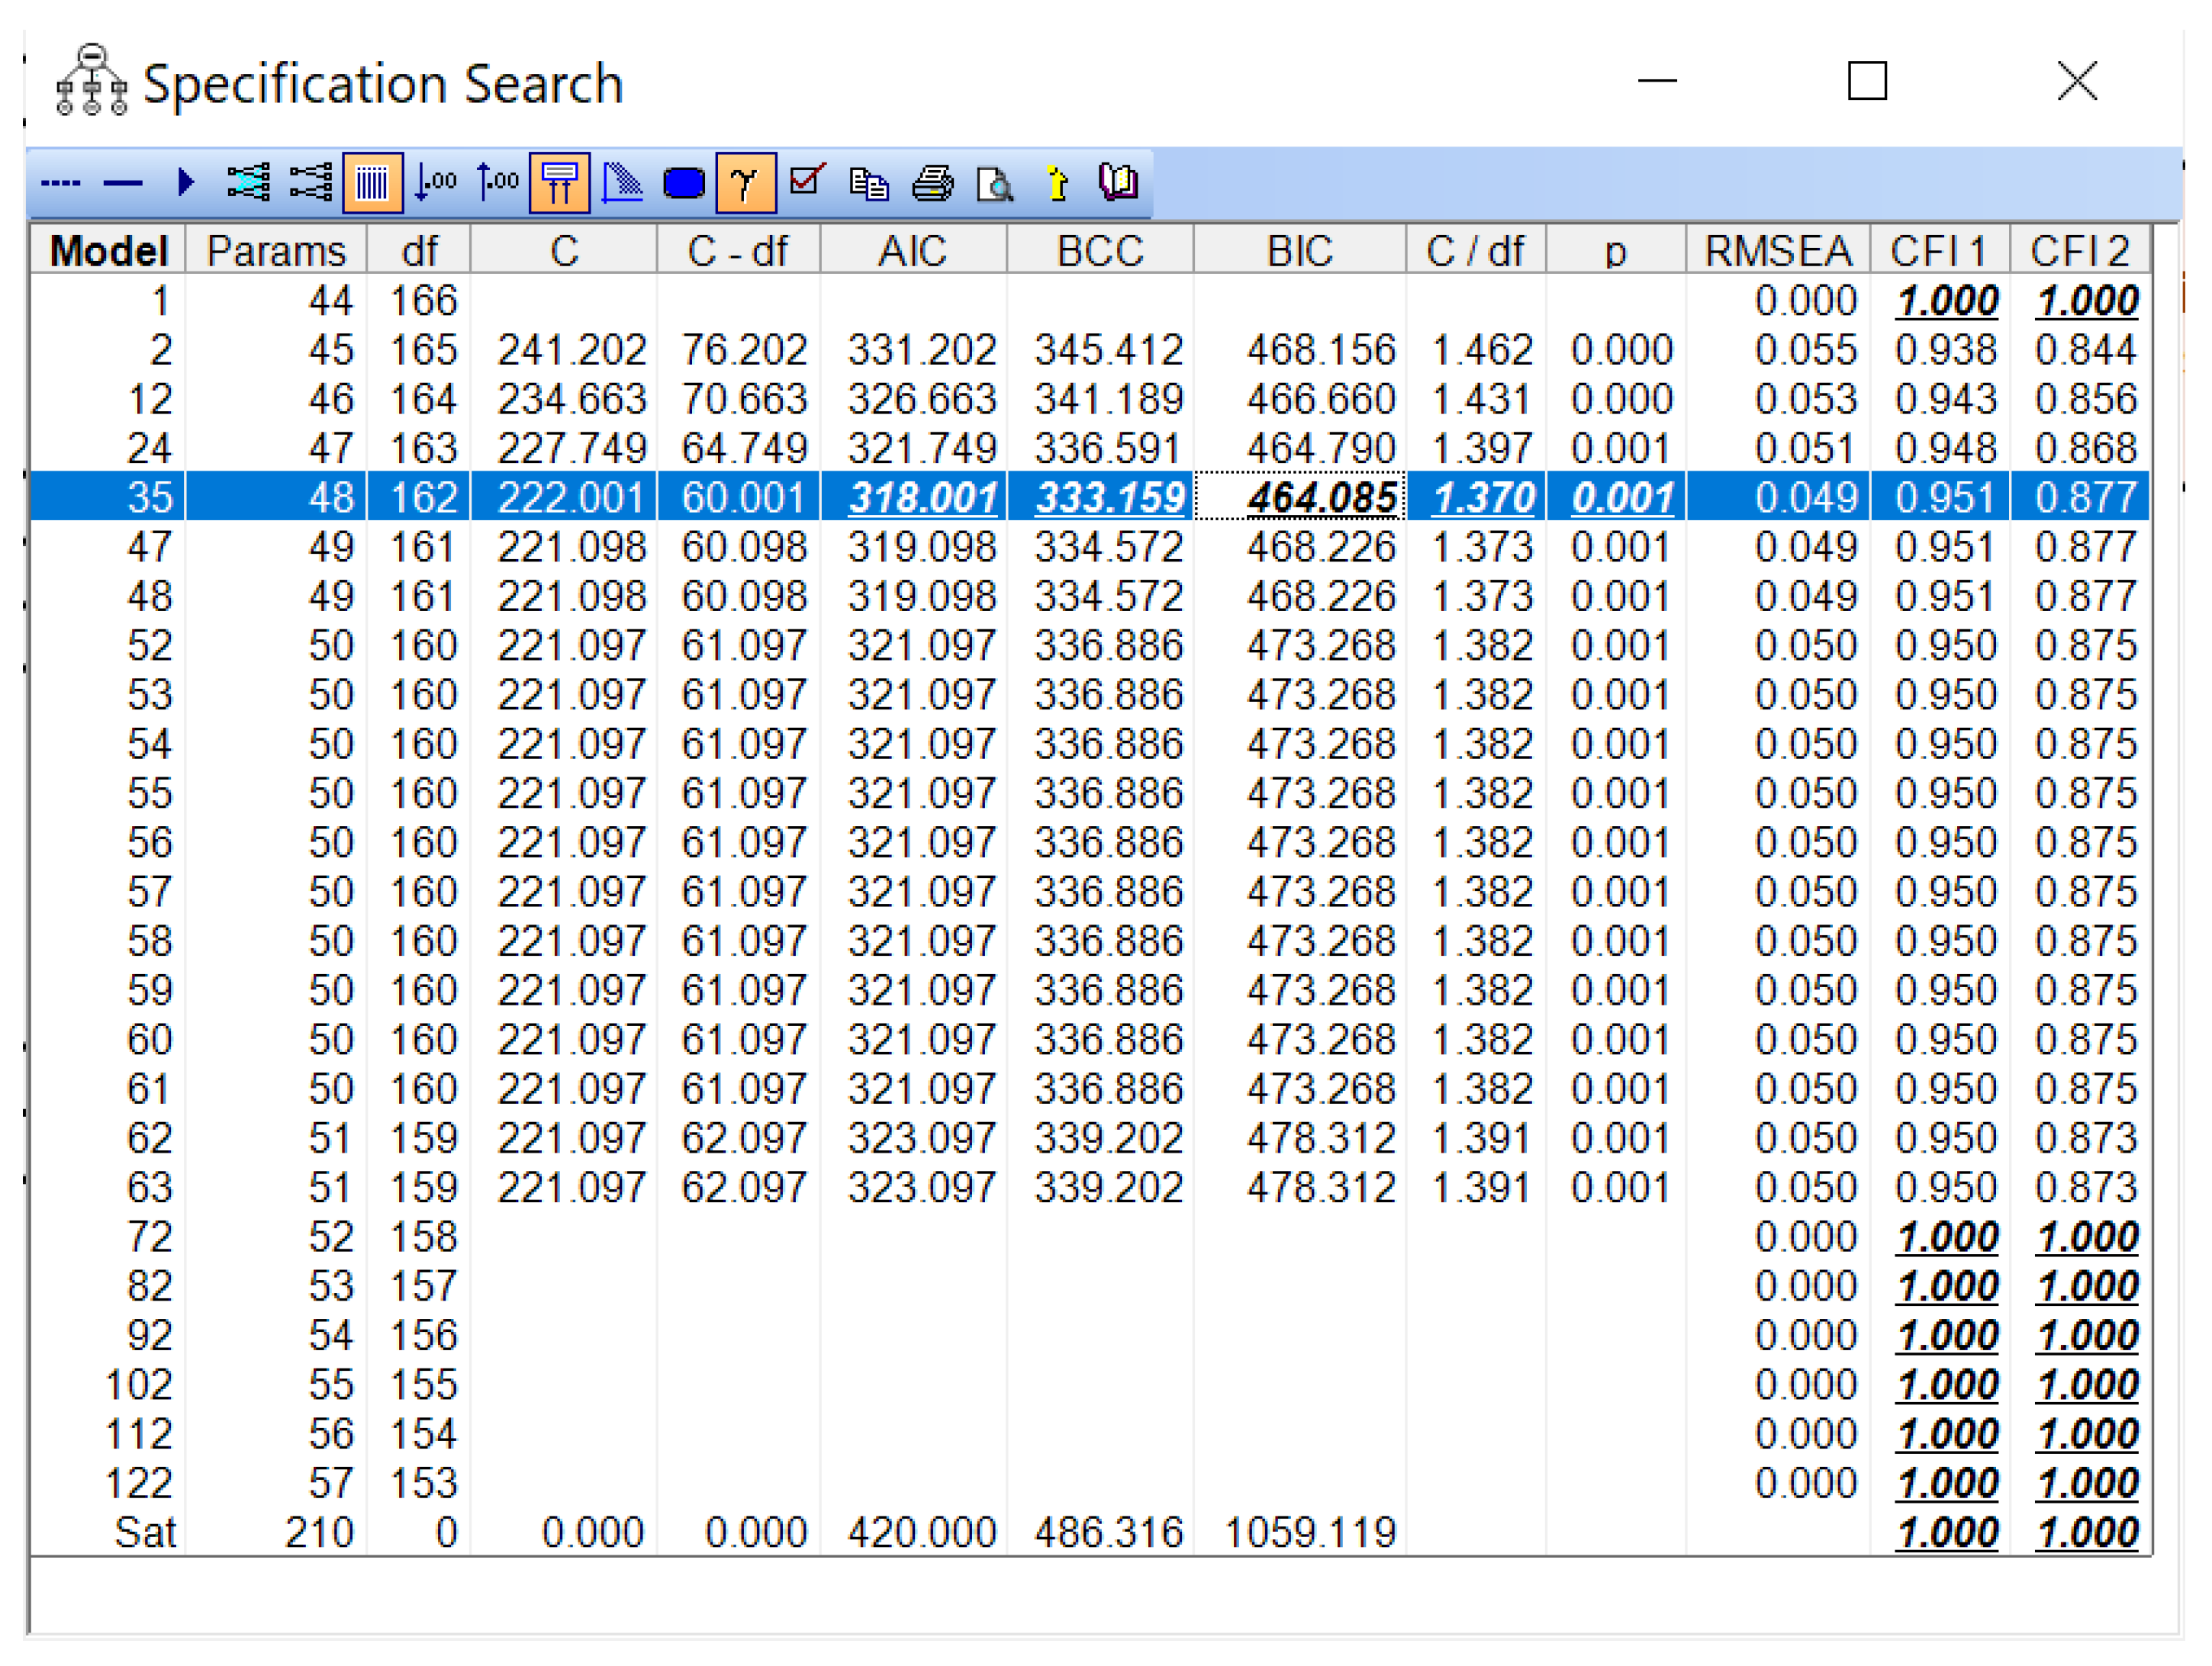
- Modifications of the initial model are often necessary, for example, in the face of either insufficient values of fit indices or statistically insignificant coefficients. This was also the case in this study. We tested and analyzed many models and provided both formal statistical and substantive-based justification for our choices. For this purpose, we have taken advantage of the model specification search functionality of the Amos software [54] and additional qualitative analysis.
4. Modeling Results
4.1. Multivariate Regression Models
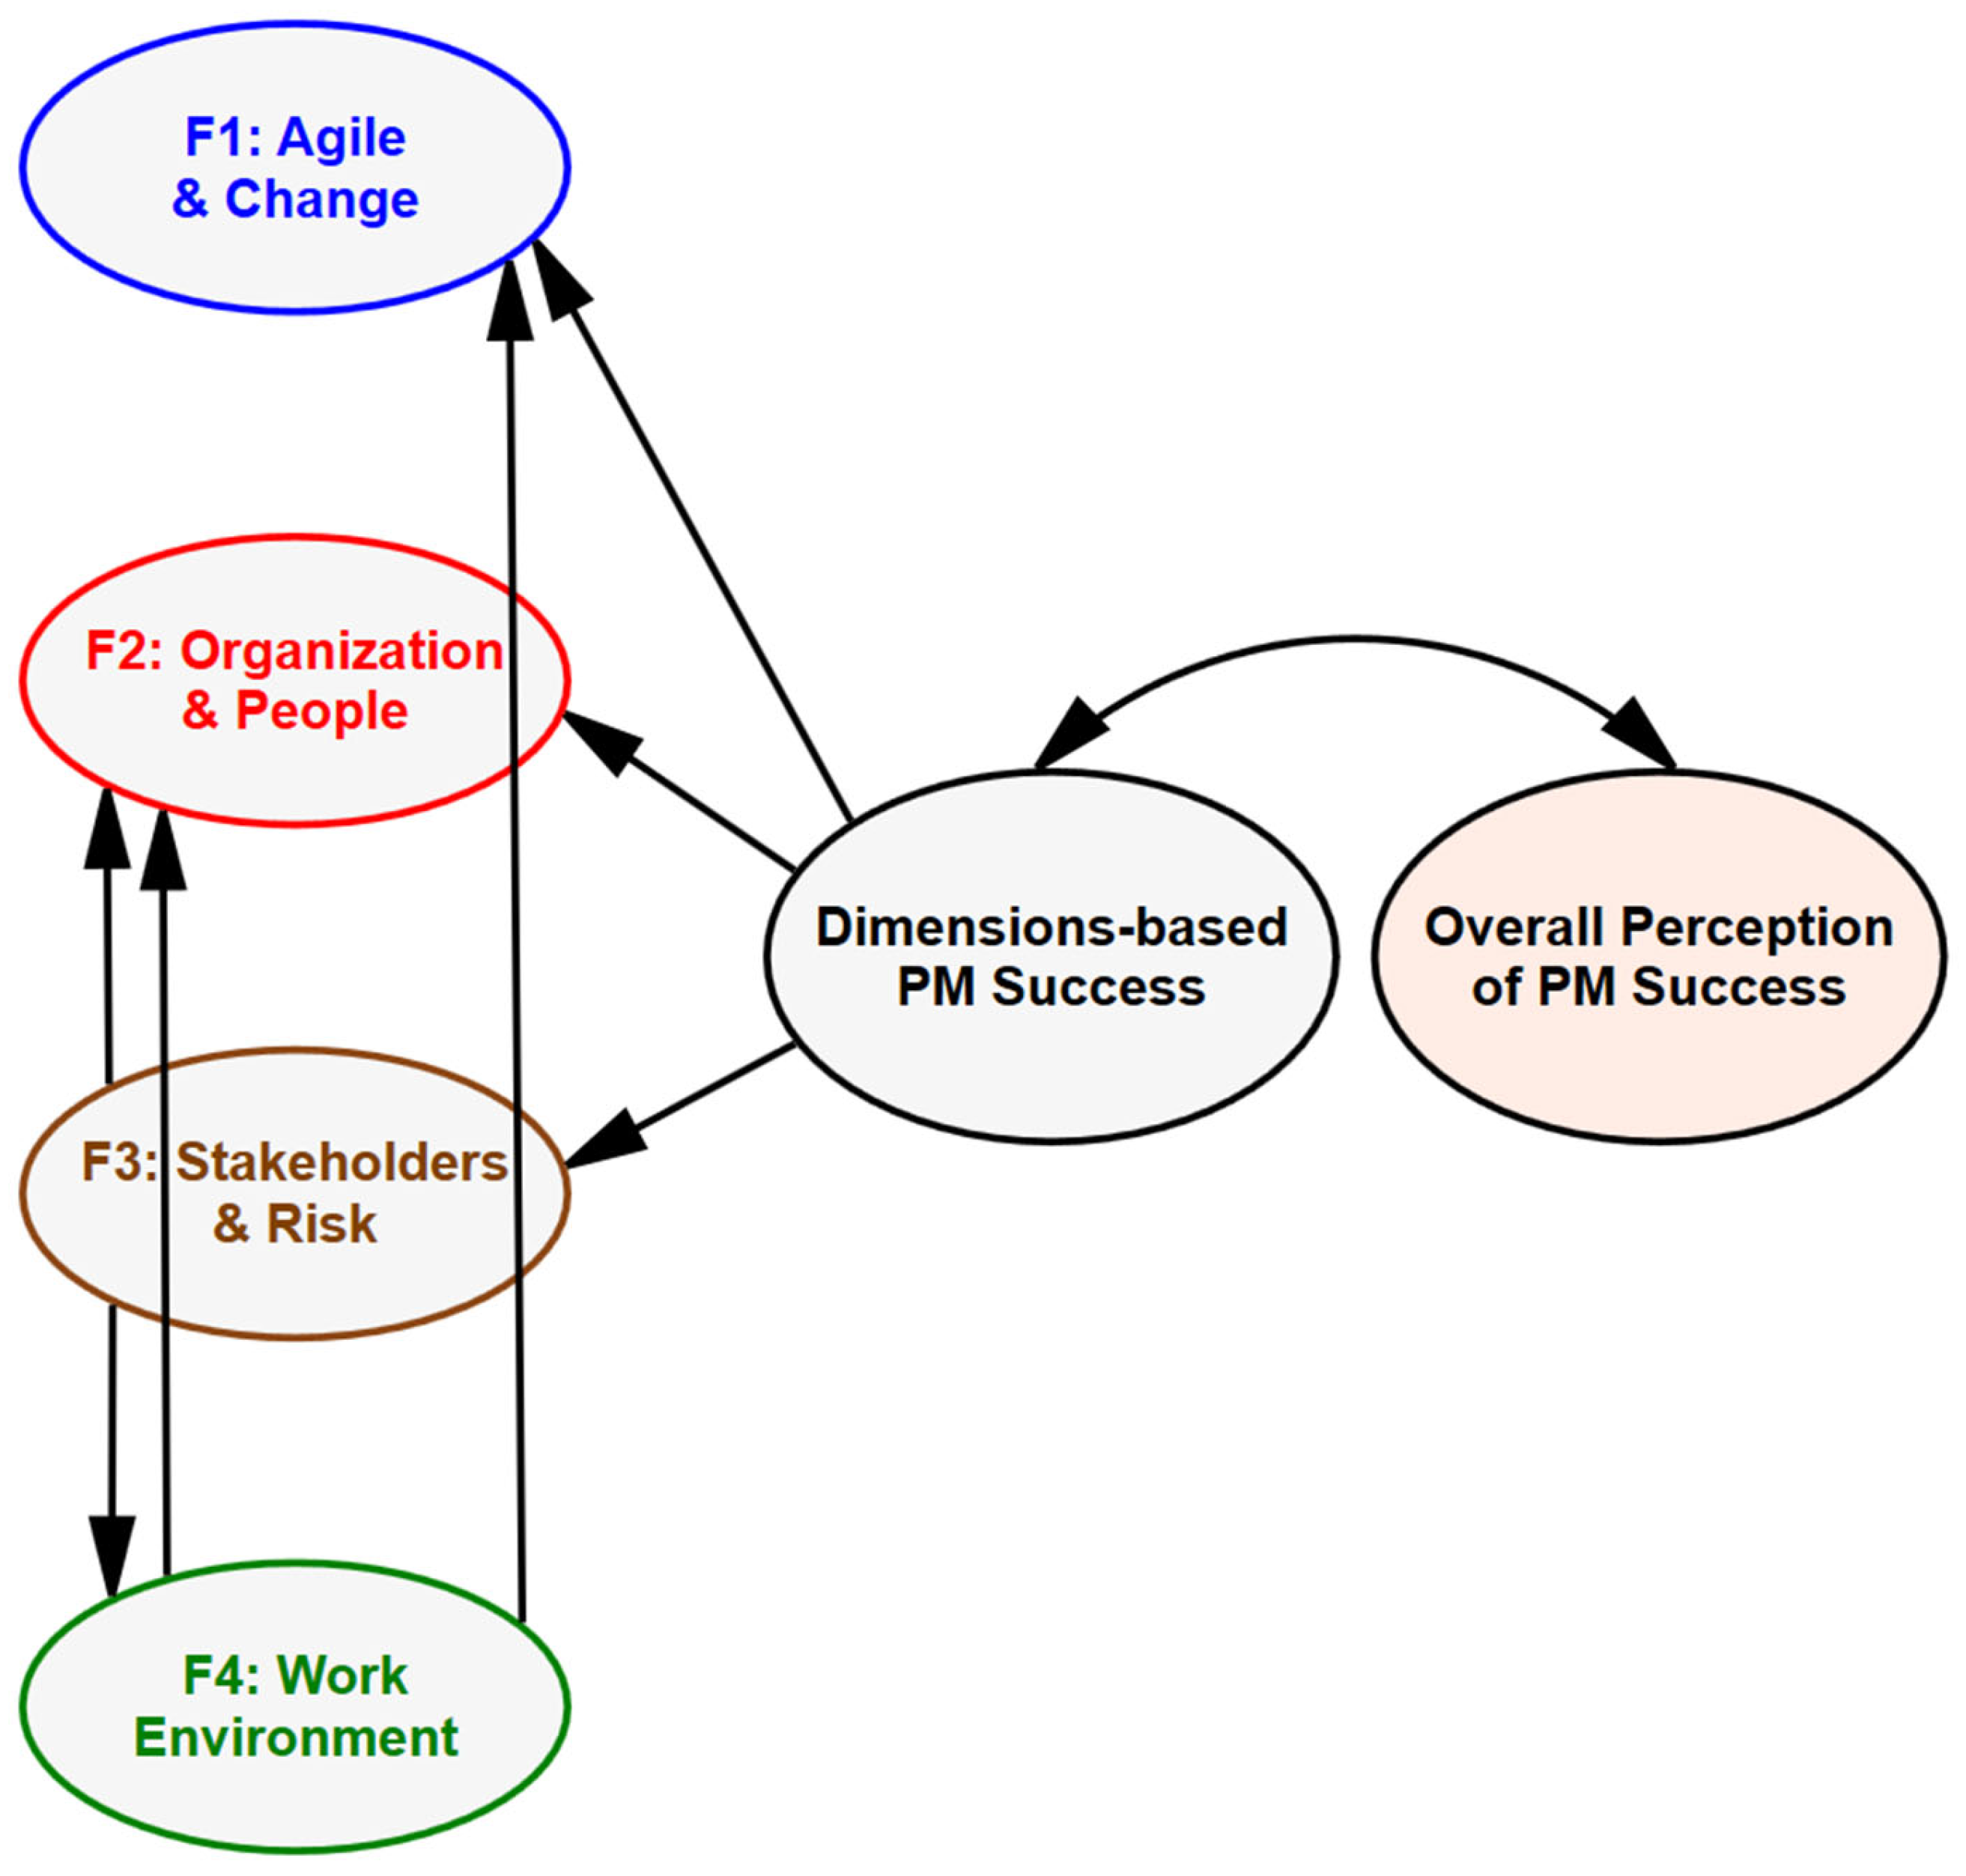
- F1: Agile techniques and change management (AgileChange);
- F2: Organization and people (OrgPeople);
- F3: Stakeholders and risk analysis (StakeRisk);
- F4: Work environment (WorkEnv),
- Quality of the delivered product ();
- Scope realization and requirements ();
- Timeliness of delivery ();
- Delivery within budget ();
- Customer satisfaction, measured by a satisfaction survey completed by the customer-side project manager; the results were made available to the project manager by the provider side ();
- Provider satisfaction, assessed by the provider’s project manager ().
- −
- Forward—starting from zero model, step by step adding variables until the best form of model is achieved;
- −
- Backward—starting from the full model and analogously reducing variables in subsequent steps;
- −
- Using Mallow’s indicator, which refers to the estimation of least squares methods and adjusted R2 that takes into account the amount of variance measured by independent variables affecting dependent variables.
- Y = Quality. The stepwise procedure identified a statistically significant linear model (p < 0.001) of a moderate value of R2. According to the Student’s t-statistics, three out of four independent variables included in the regression and the intercept were meaningfully different from zero. Interestingly, the study subjects’ opinions did not take into account the factor when evaluating the quality of the delivered product. Conversely, all the remaining variables were associated with this success criterion. The standardized coefficients indicated that the most influential factor was (agile techniques and change management), followed by (stakeholders and risk analysis). In contrast, the (organization and people) factor had the smallest impact.
- Y = . The most challenging task was to find a decent regression for the scope and requirements dependent variable. The best model, in terms of formal statistical measures, was the linear regression with as the only independent variable. The intercept was statistically different from zero, and the probability levels of both the Student’s t-statistic for and the F-statistic for the whole model were slightly higher than the more relaxed limit of 0.1. The model suggests that if any factor was related to the subjective assessment of the project management success Scope criterion, it was probably the variable. However, given the small value of R2, one should be very cautious in interpreting this outcome, and further research is required in this aspect.
- Y = . We found that the best model for completing the project on time involved all of the considered independent variables. The moderate R2 was statistically different from zero, as shown by the F-statistics value. Similarly, Student’s t-statistics confirmed that the parameters for all variables, along with the intercept, were also statistically relevant. The beta values suggested that the most influential factors were and , while and were somewhat less important. However, the comparable values of standardized regression coefficients indicated that all of these factors contributed substantially to the assessment of the timeliness aspect of project management success.
- Y = . The proposed regression model for delivering the project within a budget includes only two variables: and , with similar standardized beta coefficients. From the formal point of view, the model is acceptable, since all included parameters and R2 are statistically significantly different from zero. However, the very small value of R2 raises questions about whether the included independent variables sufficiently explain the Cost dependent variable. Additional investigations are needed to explore this issue.
- Y = . The regression analysis for the customer satisfaction dependent measure identified three factors that could explain it. As expected, was the most influential. Beta coefficients for the other two variables and were only slightly smaller. The statistical tests confirmed the good quality of this model, and the R2 was decidedly larger than for the previous four success criteria.
- Y = . The presented regression model for provider satisfaction proved to be the best in terms of the results of formal verification, as well as the highest value of R2. Similar to the customer satisfaction model, the most influential factor was , followed by and , with only somewhat smaller standardized beta coefficients.
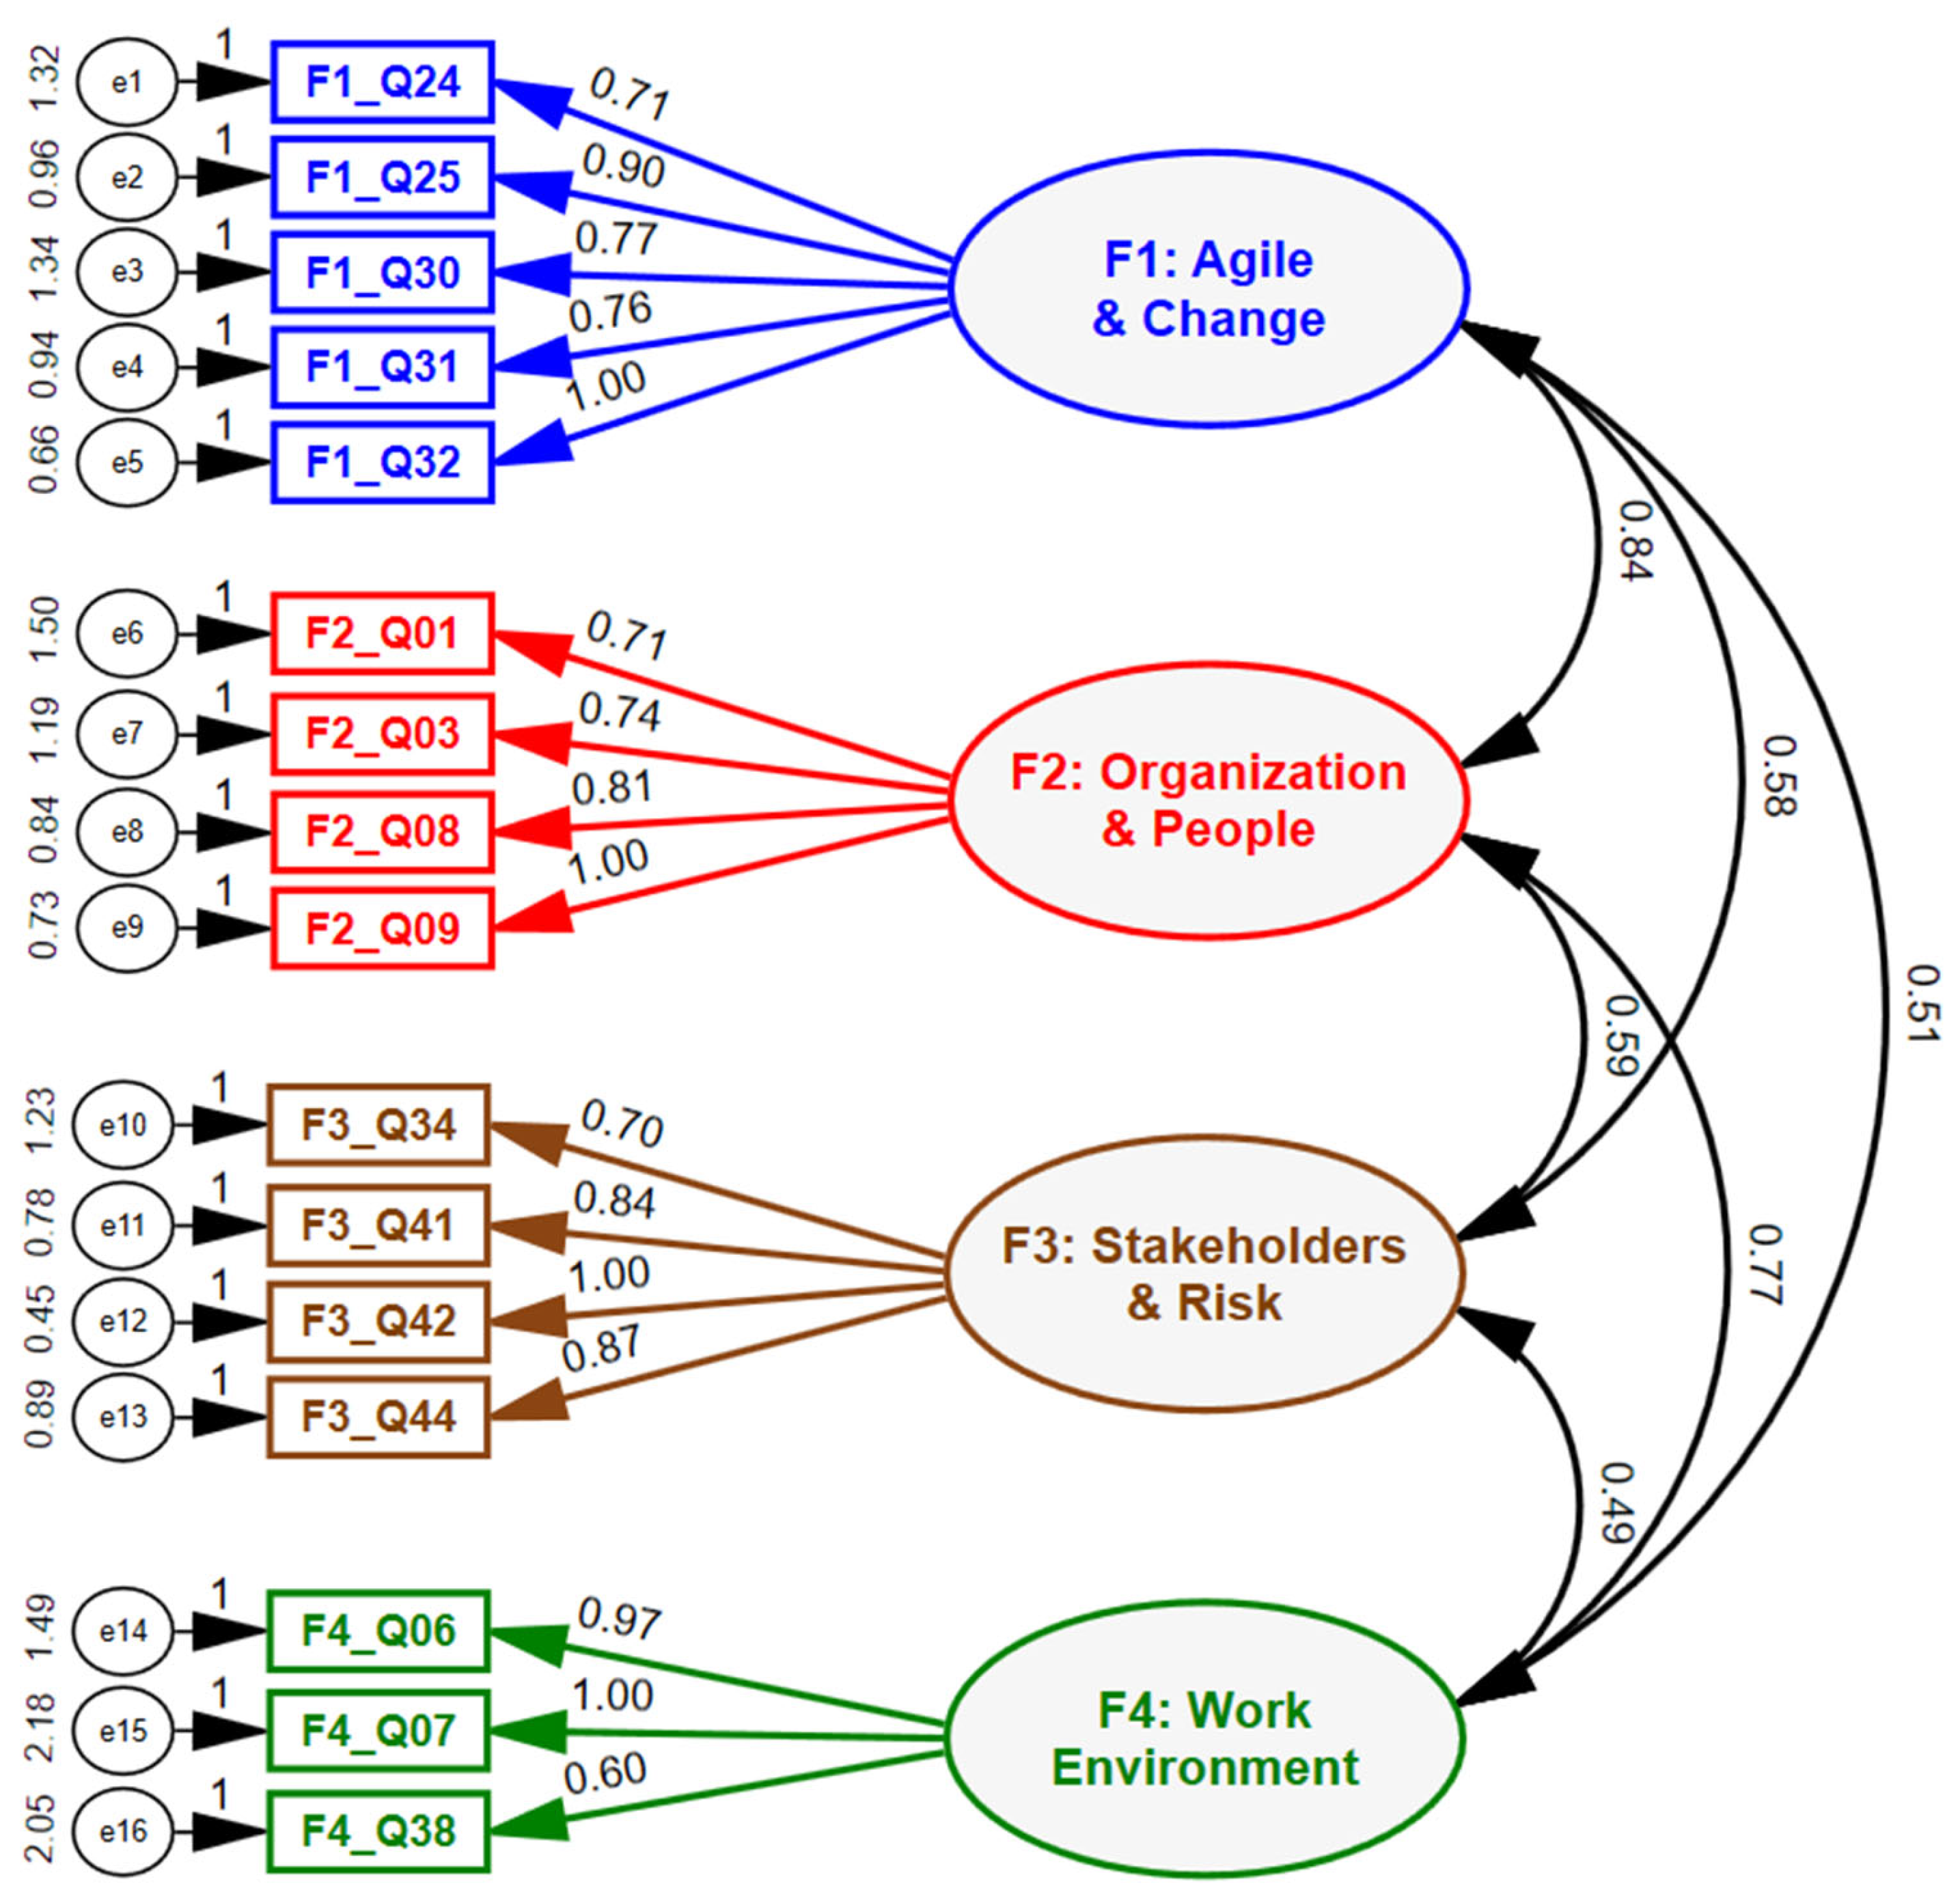
4.2. Confirmatory Factor Analysis Model
4.3. Structural Equations Models
4.3.1. Initial Orthogonal SEM Model
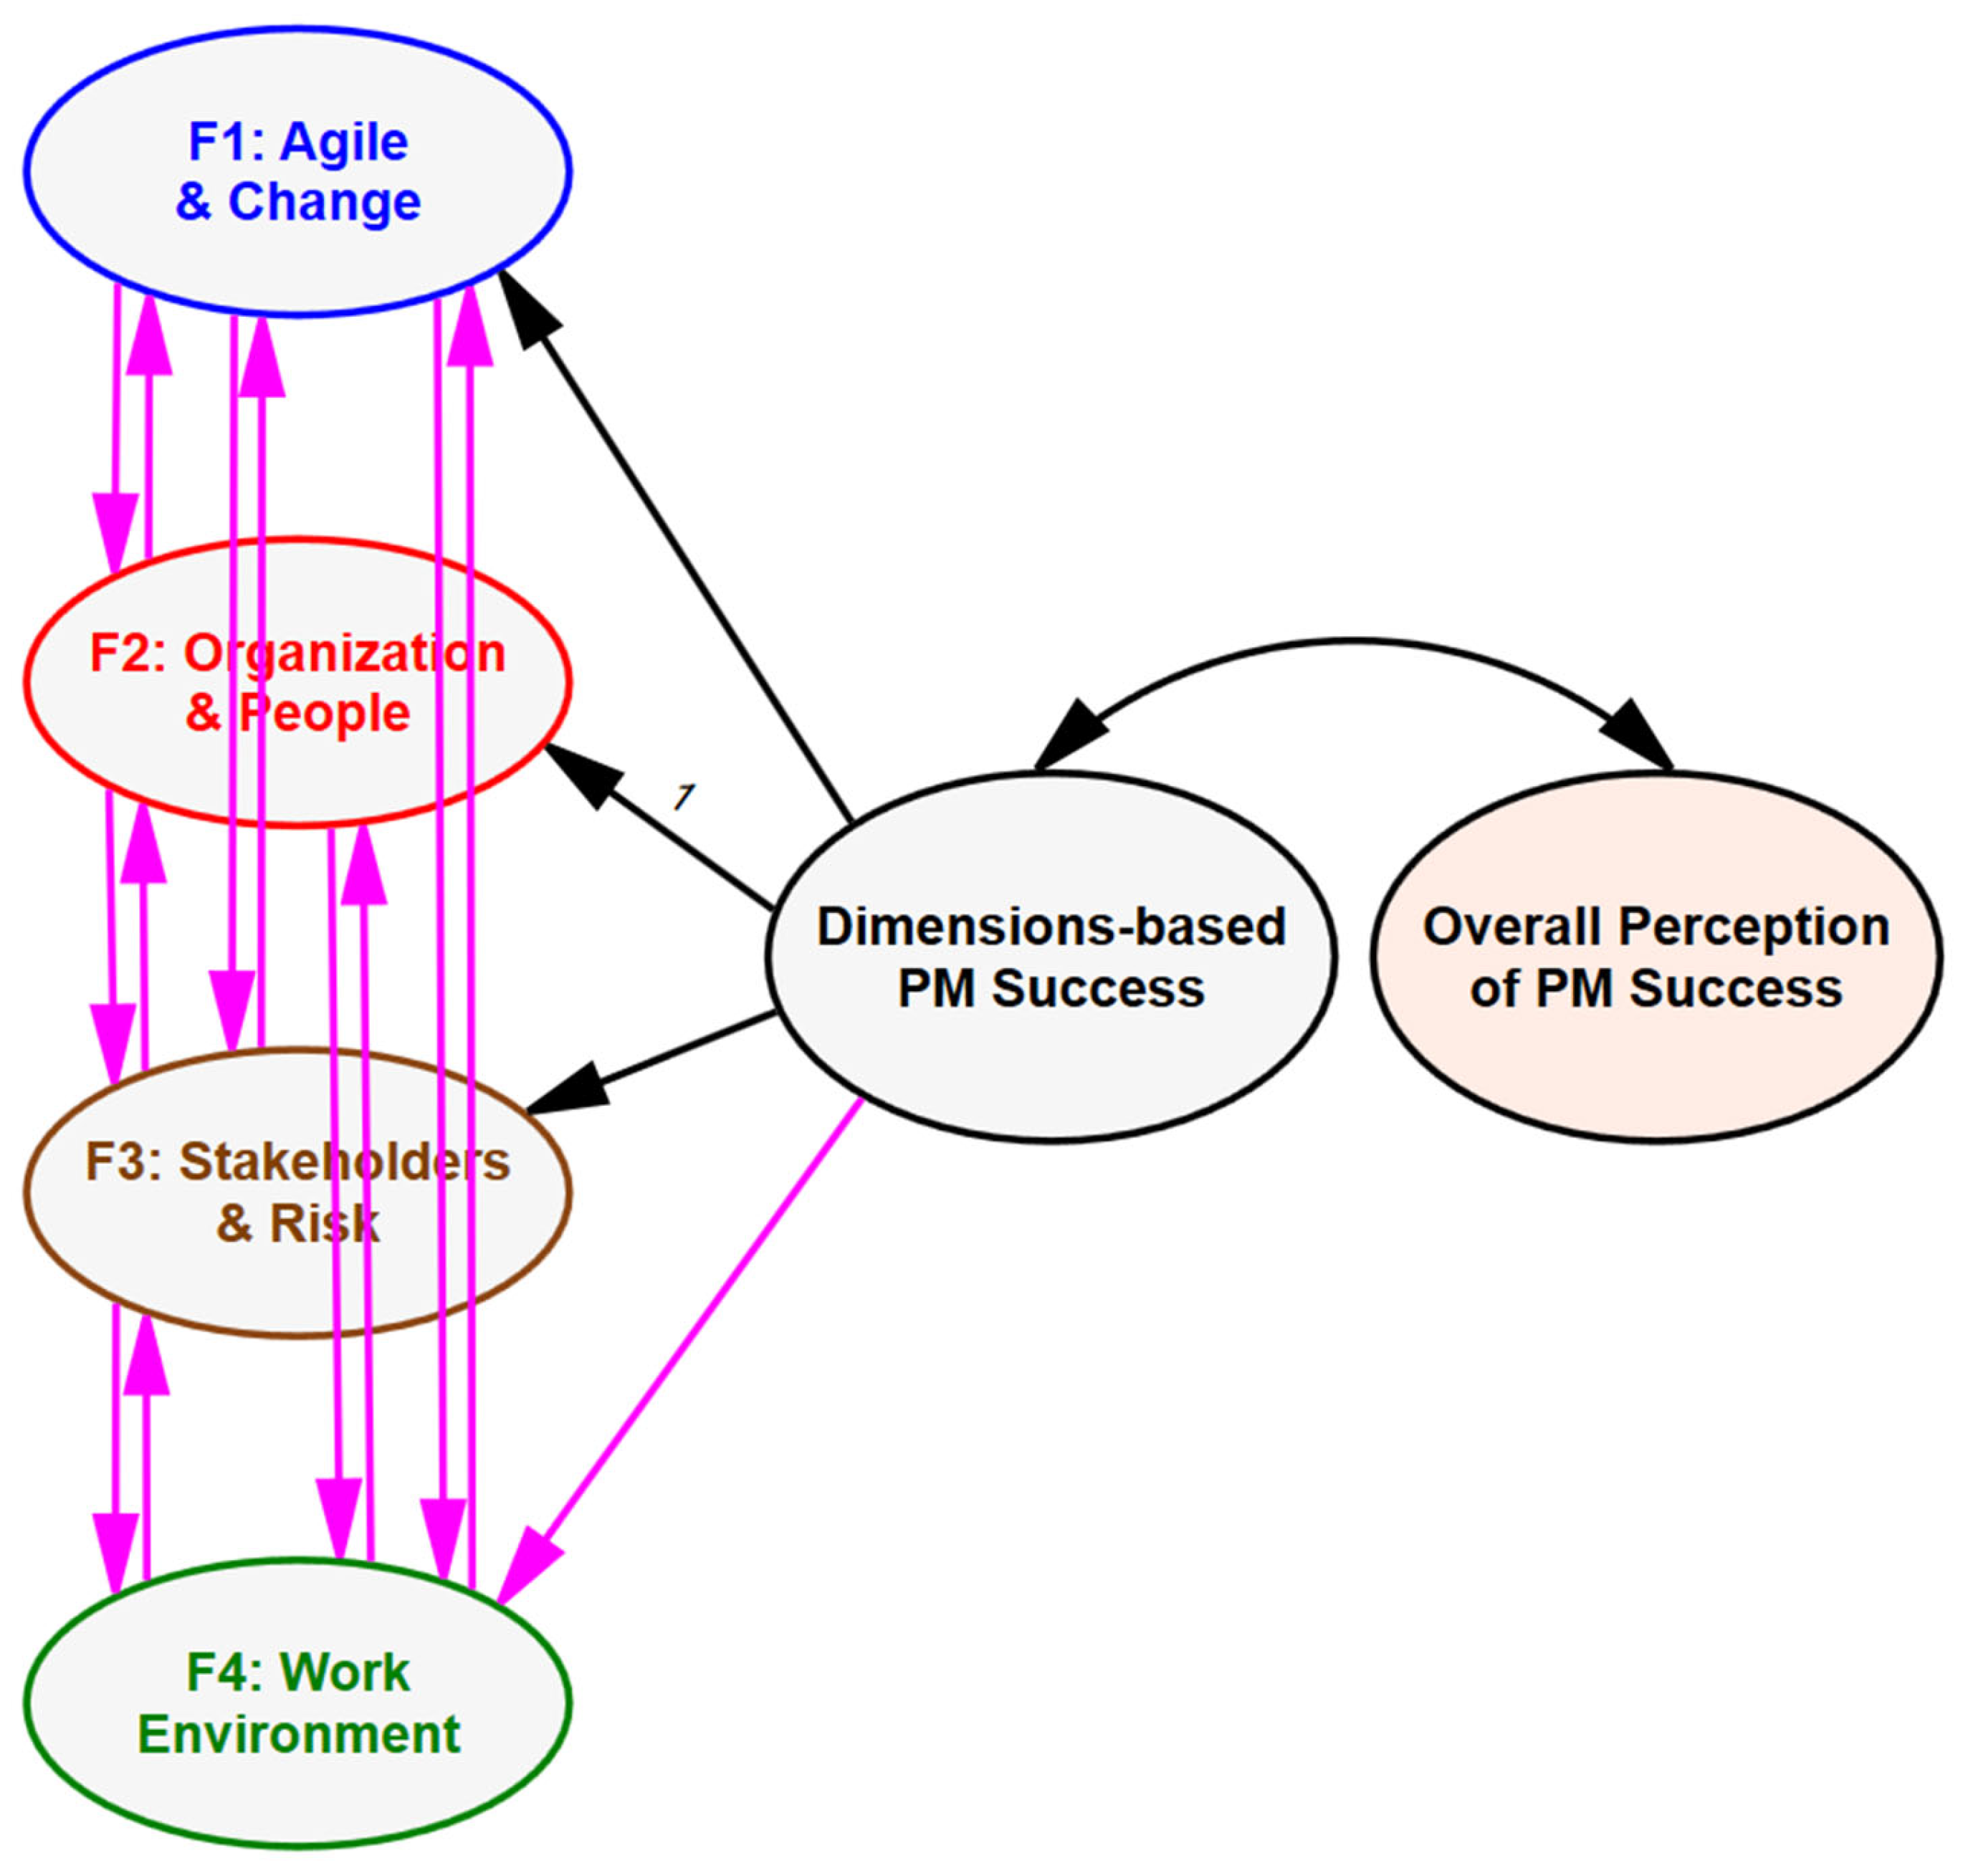
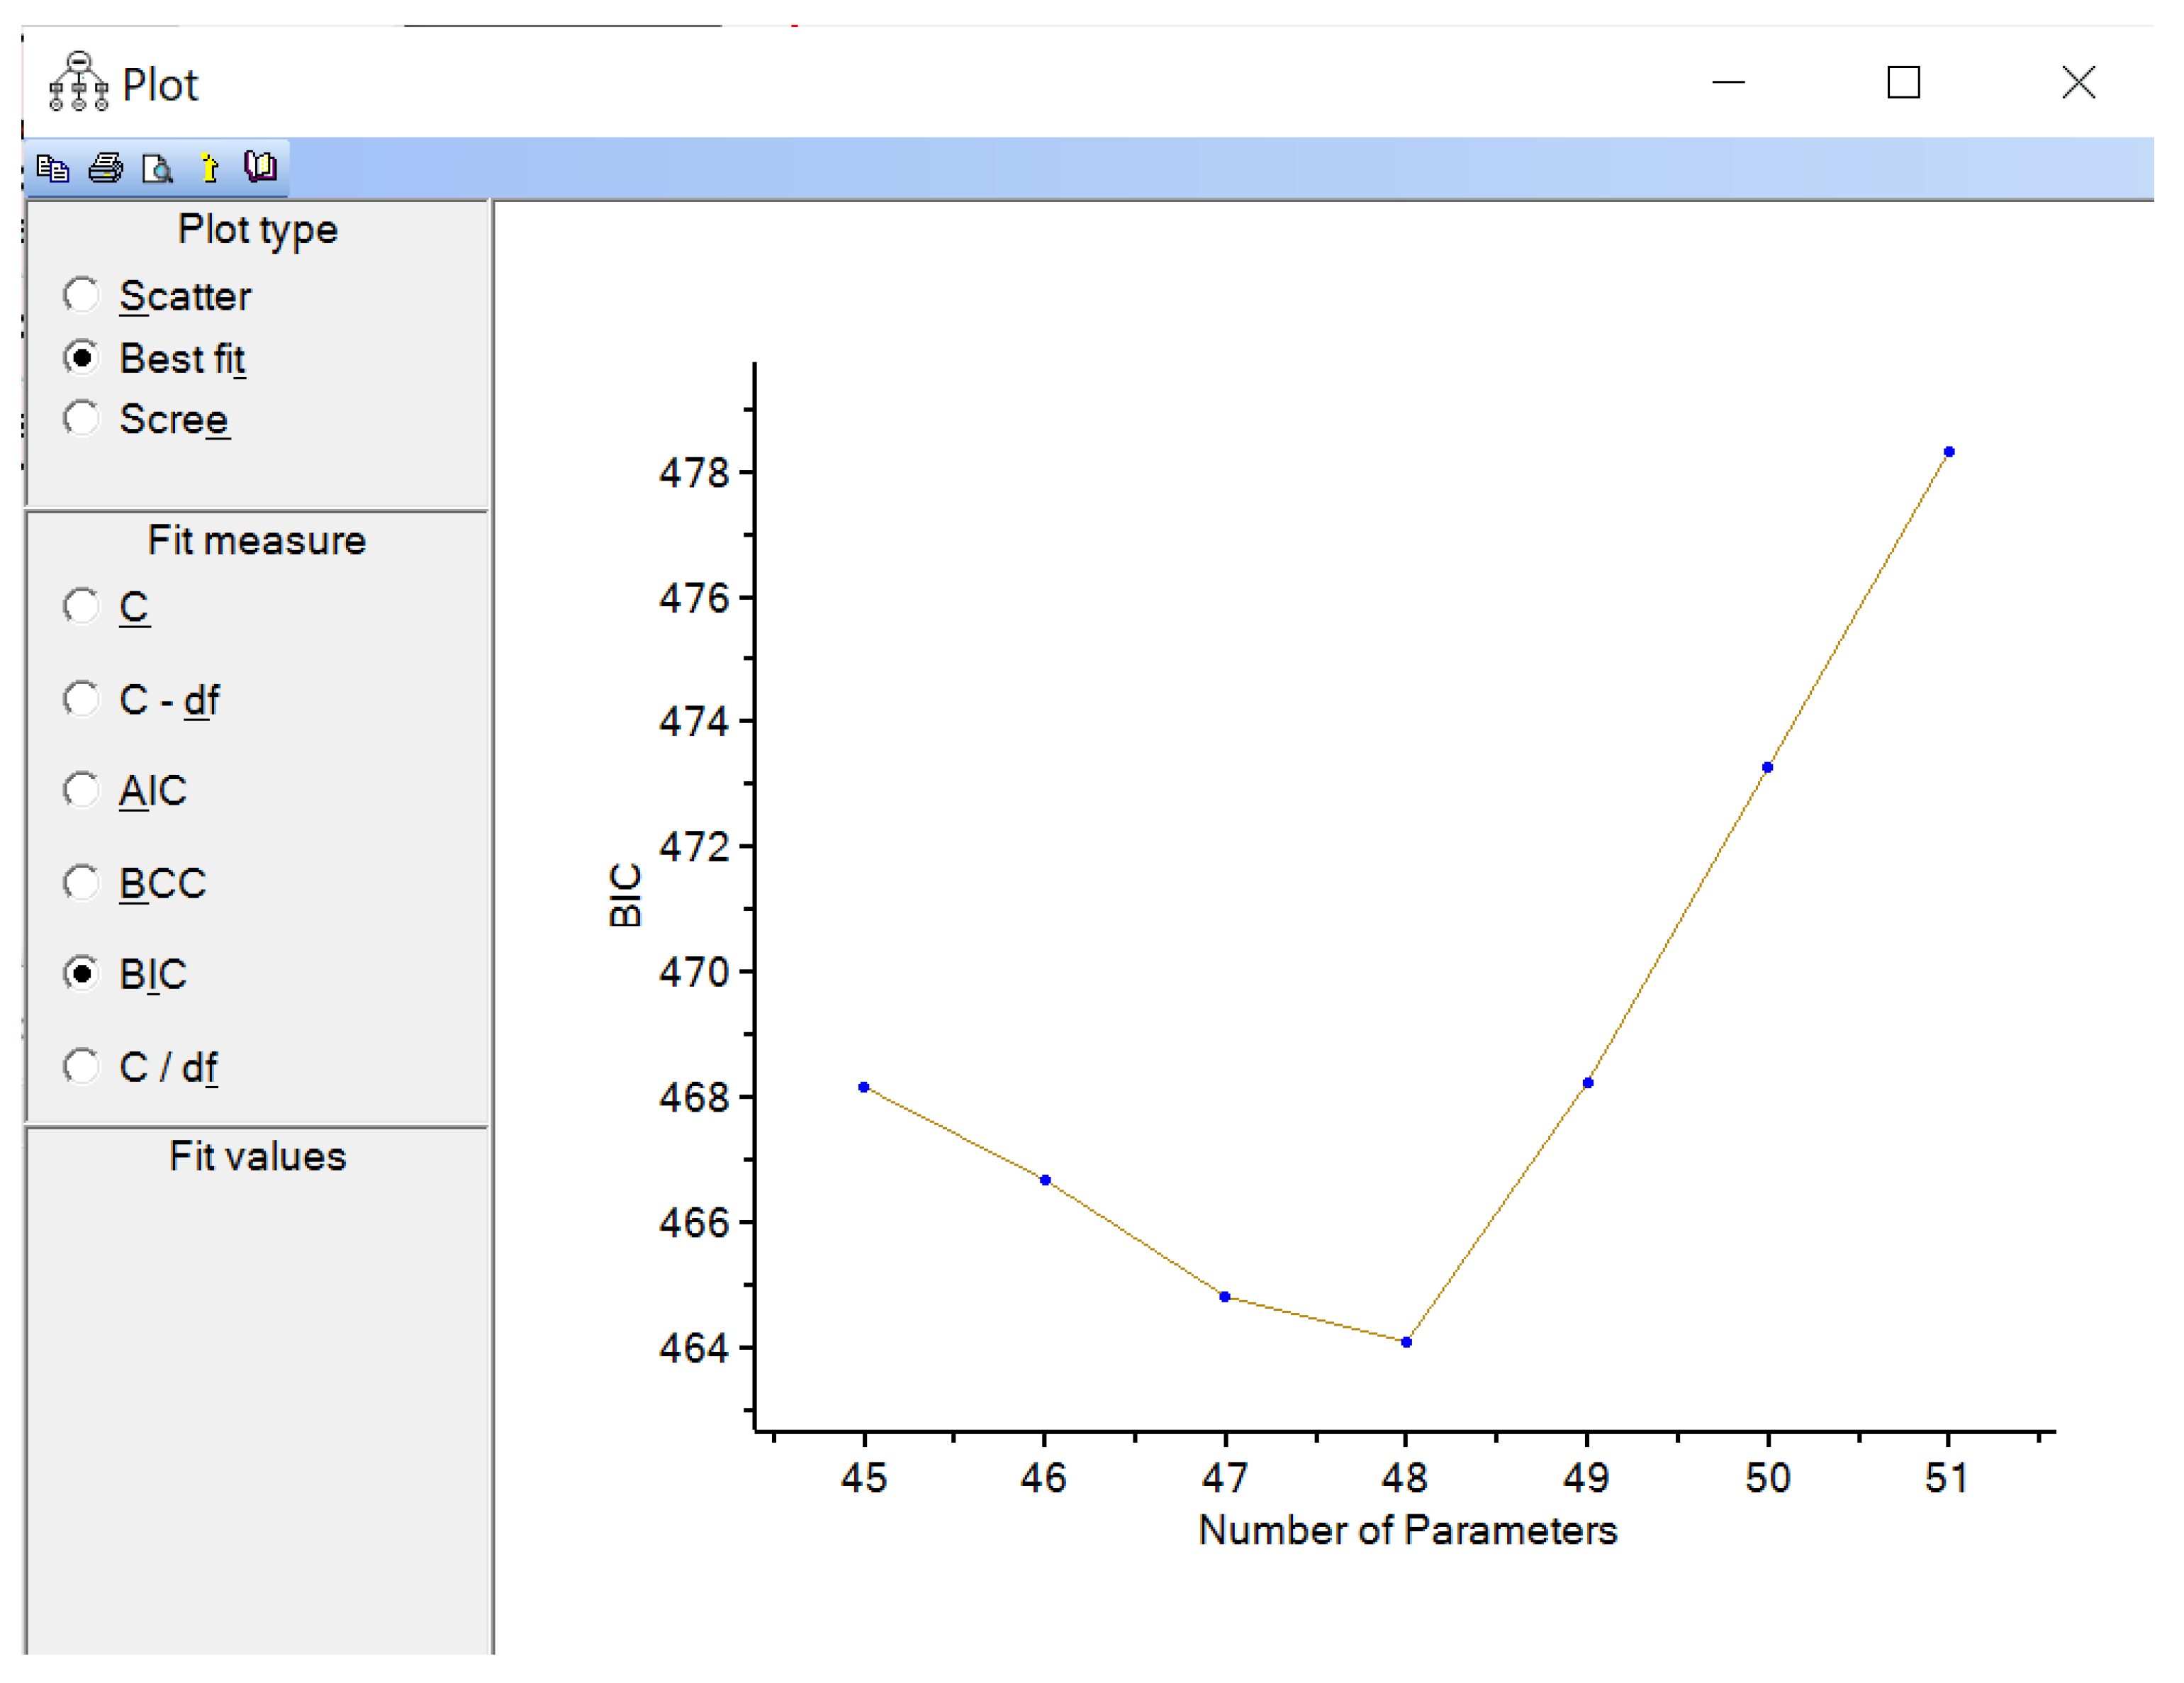
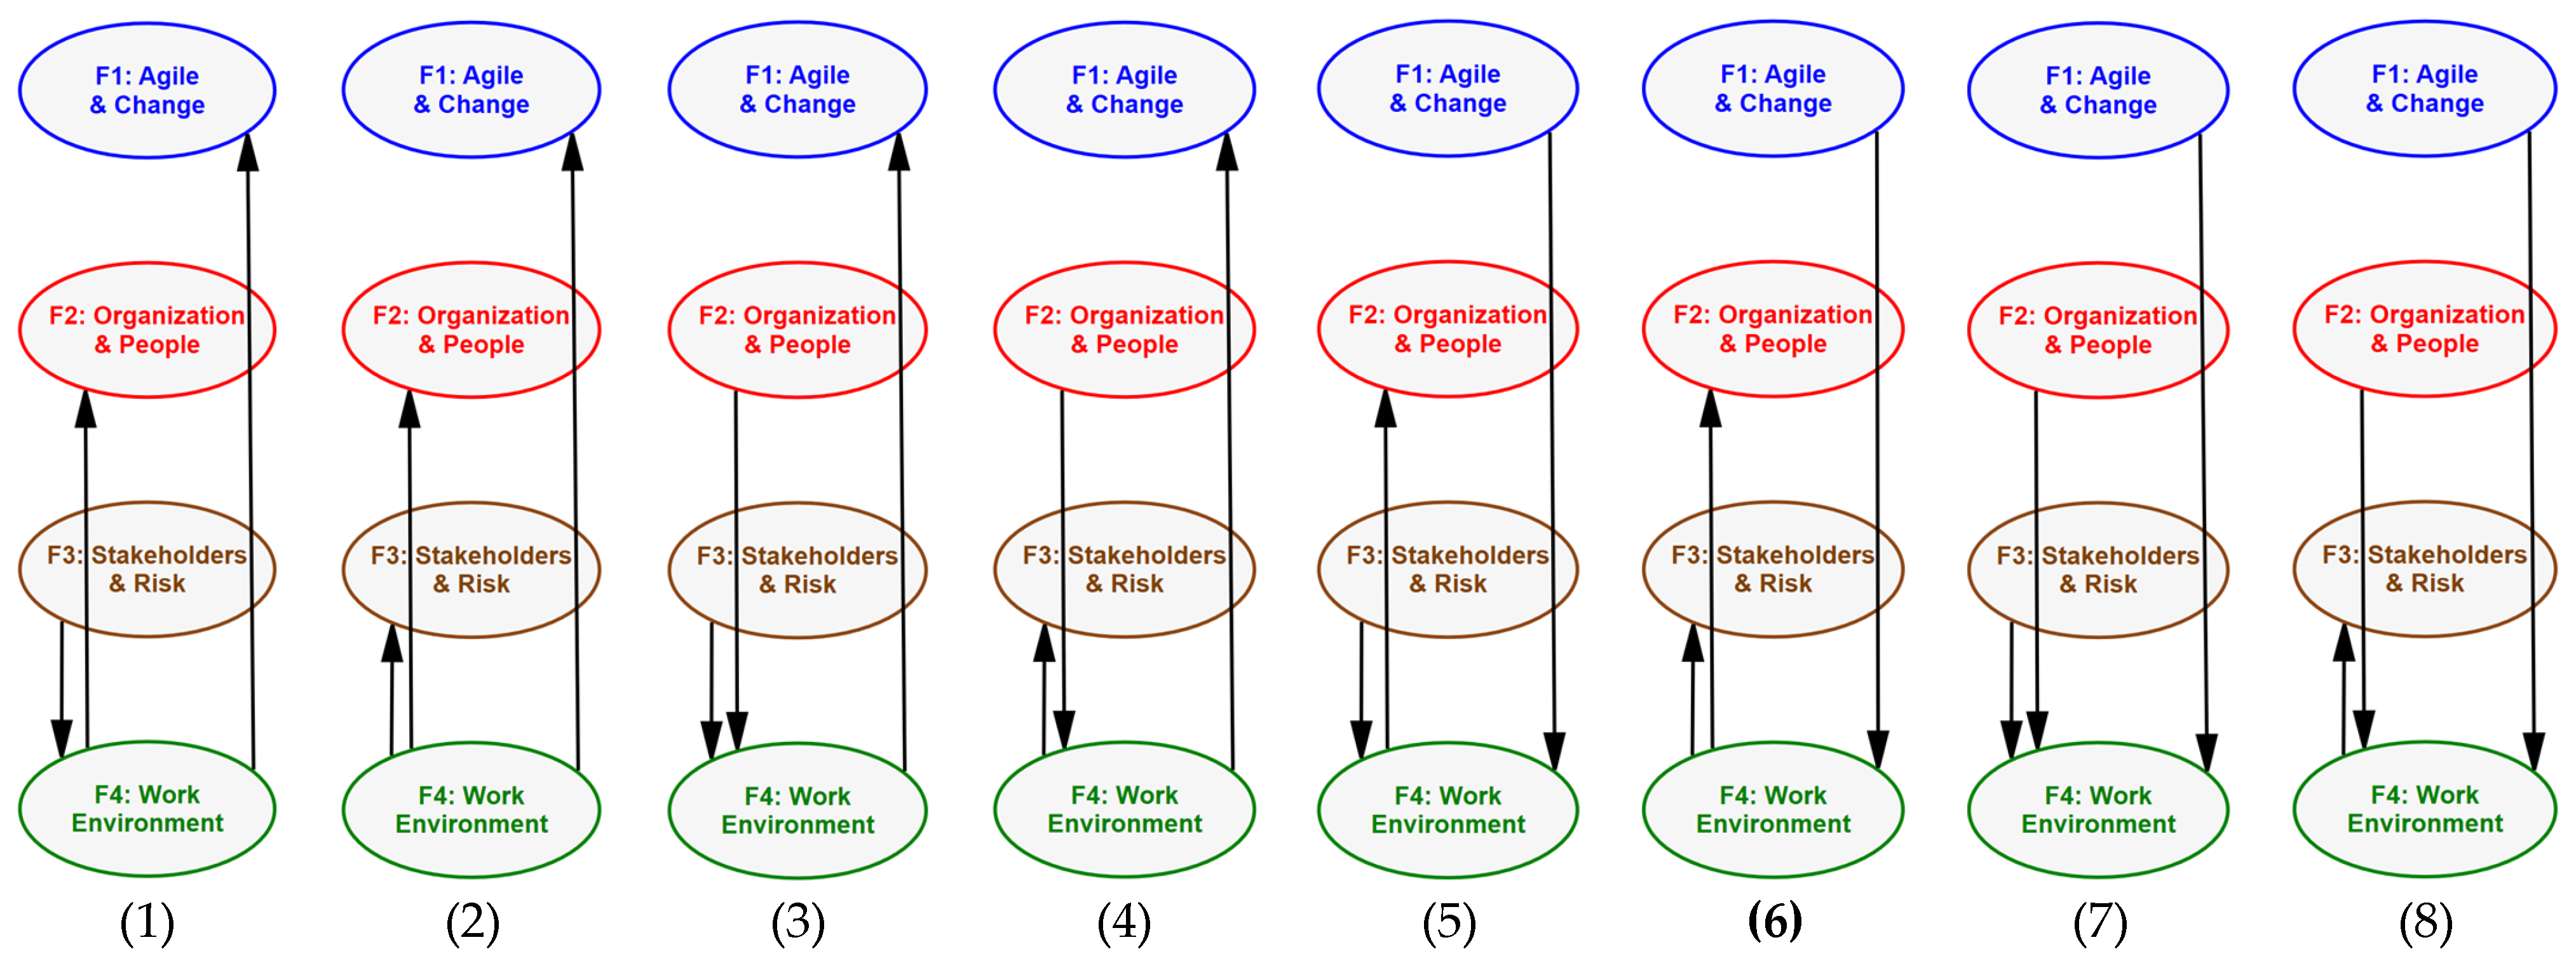
4.3.2. Search for the Most Appropriate SEM Model
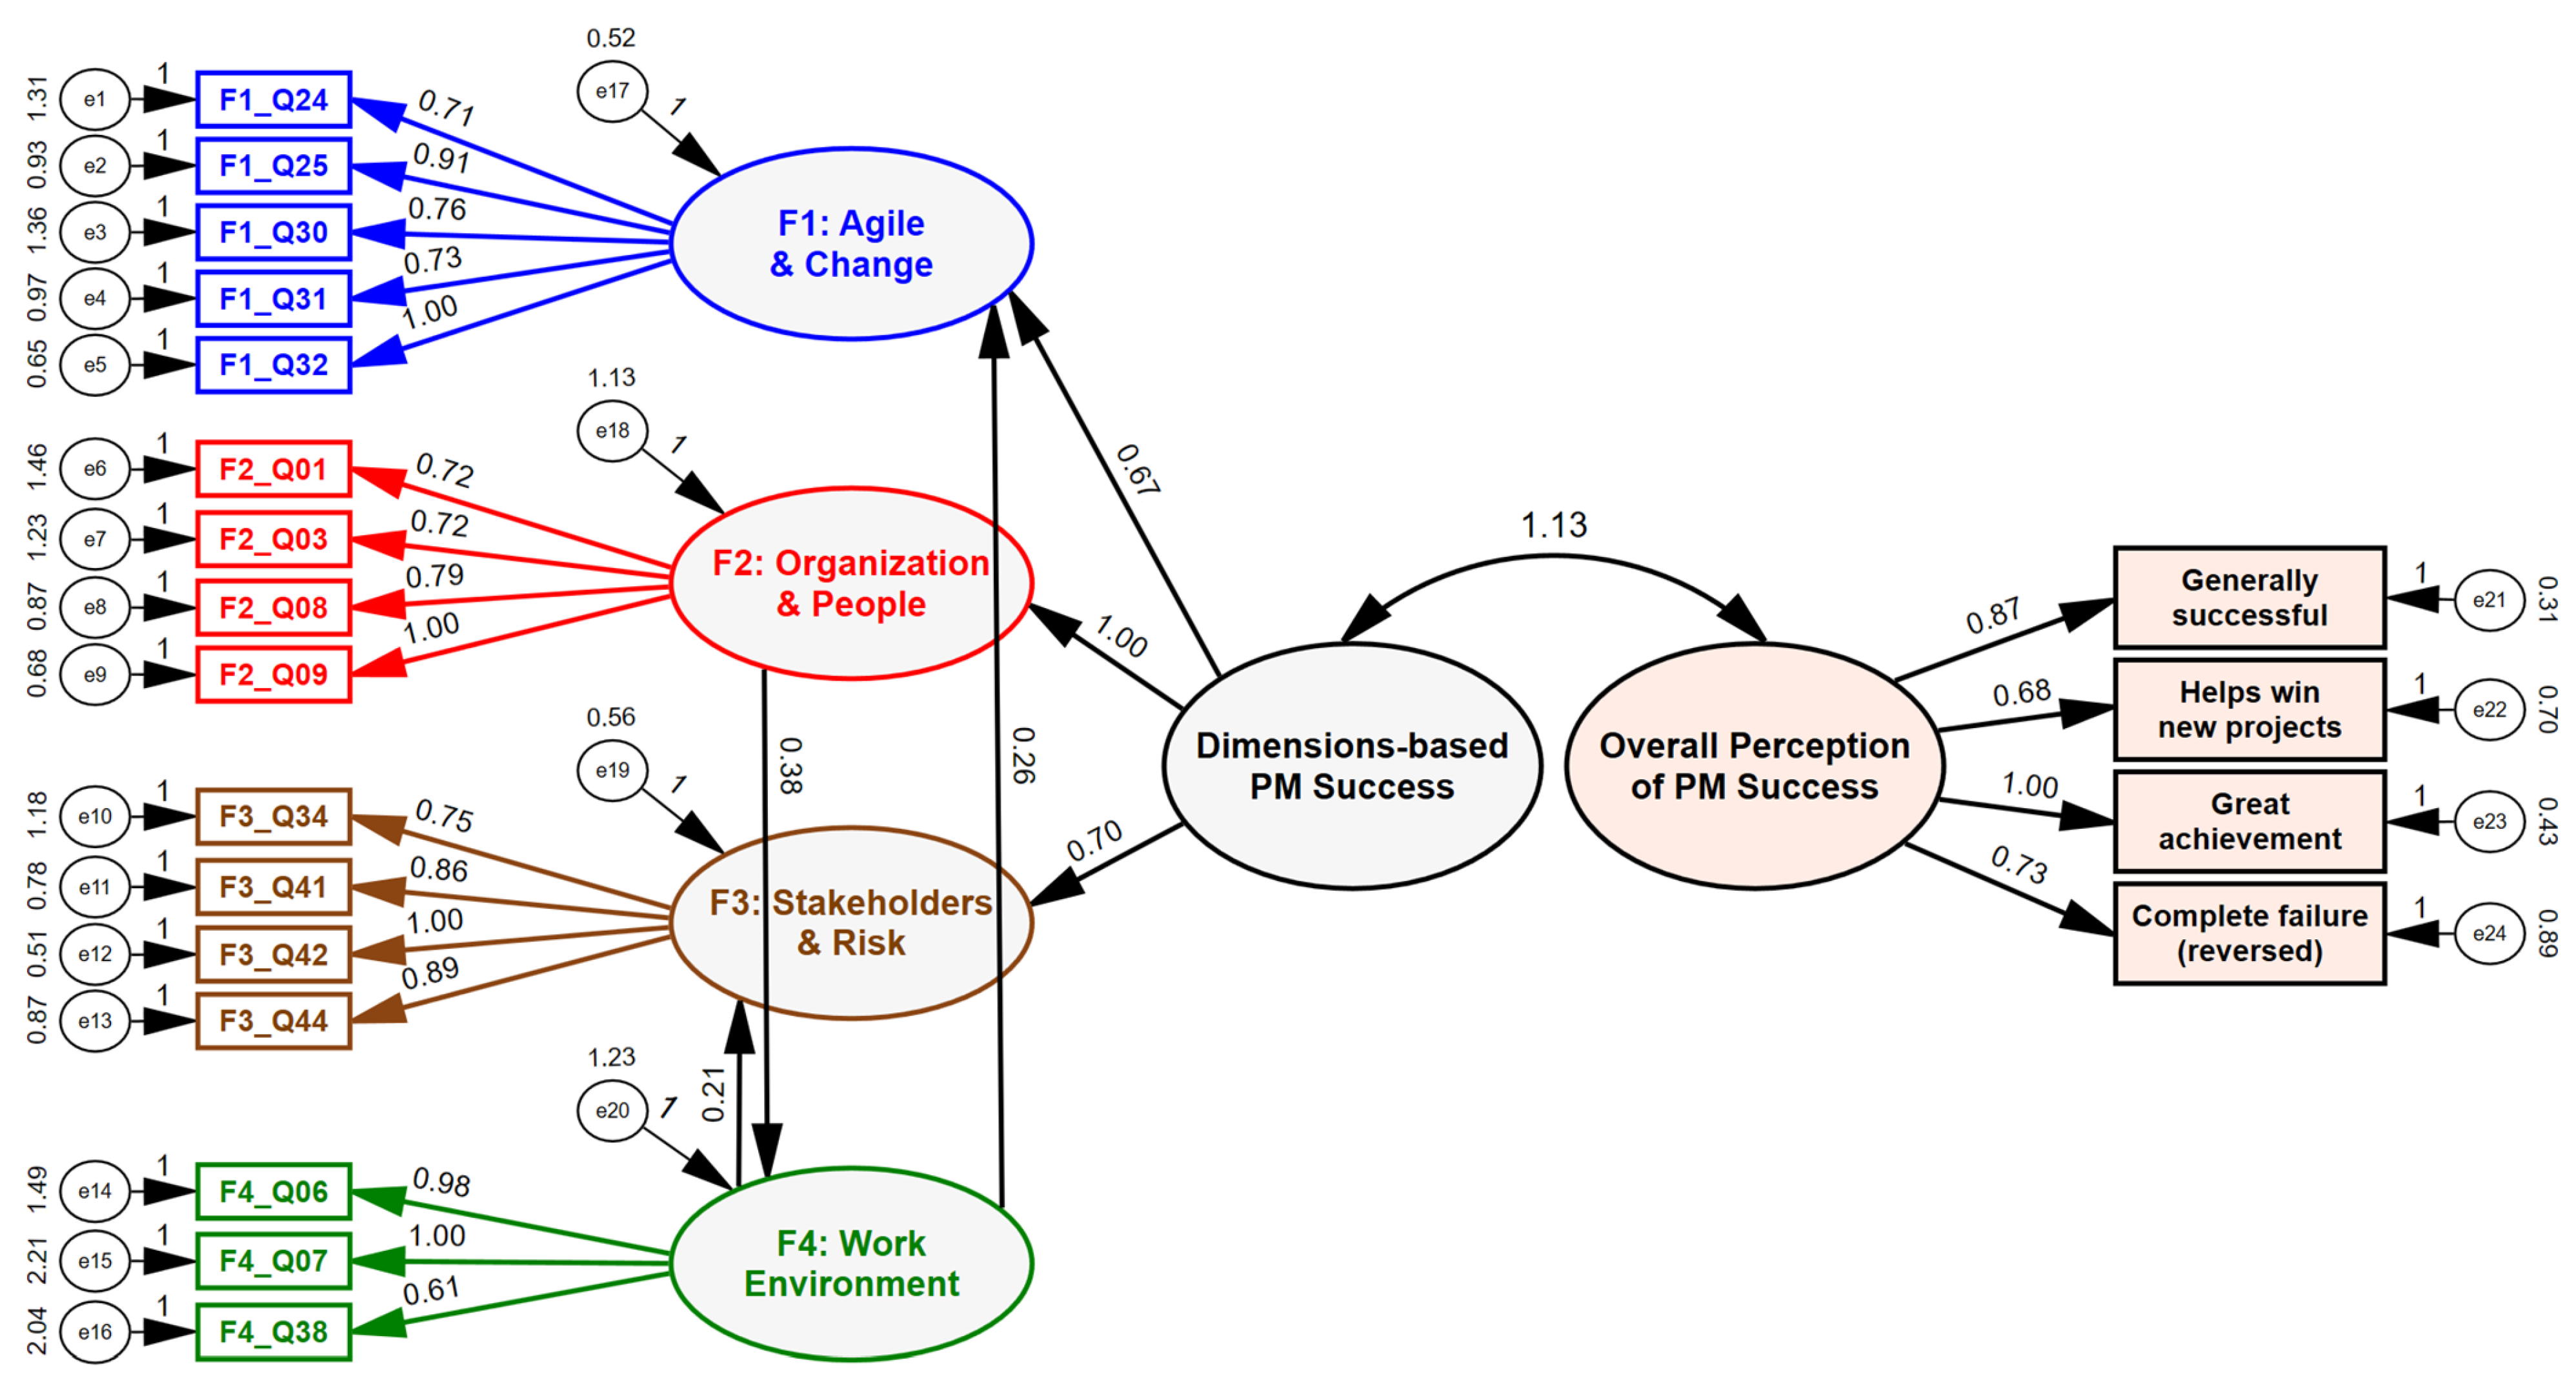
4.3.3. Final SEM for Success Factors of IT Services Project Management
5. Discussion
5.1. Discussion of Multivariate Regression Models
5.2. Discussion of SEMs
5.3. Limitations and Future Research
6. Conclusions
Author Contributions
Funding
Institutional Review Board Statement
Informed Consent Statement
Data Availability Statement
Acknowledgments
Conflicts of Interest
Appendix A

| No. | Question |
|---|---|
| F1_Q24 | The project manager underwent training in agile methodology |
| F1_Q25 | The work in progress was limited and bottlenecks removed for faster throughput |
| F1_Q30 | The project focused on the work that was delivered (outcomes) instead of how busy people were (utilization) to increase the throughput and flow |
| F1_Q31 | The change request process was used in the project (i.e., recording, planning, documenting, testing, accepting, categorizing, assessing, authorizing, implementing, and reviewing in a controlled manner) |
| F1_Q32 | Throughout the project, the right amount of documentation was maintained, not too focused on producing elaborate documentation as milestones but not ignoring documentation altogether either |
| F2_Q01 | The project received strong executive support (by the Board of Directors or CEO, CFO, CIO, etc.), which influenced the decision-making |
| F2_Q03 | In the project, a hierarchal culture that has clear divisions of responsibility and authority was employed |
| F2_Q08 | The selected project team members had high technical competence and expertise (problem-solving, subject matter) |
| F2_Q09 | Project team members had great motivation and were committed to executing the project in the best possible way |
| F3_Q34 | From the customer’s point of view, the most important features/outcomes were delivered first in the project |
| F3_Q41 | In the project, risk analysis was evaluated at each change |
| F3_Q42 | In the project, risk analysis was evaluated at control points |
| F3_Q44 | The impact of stakeholders on the project was analyzed |
| F4_Q06 | All team members worked in the same location for ease of communication and casual, constant contact |
| F4_Q07 | The project team worked in a facility with a work environment like one of these: an open space, communal area, ample wall spaces for postings, etc. |
| F4_Q38 | In the project, no multiple, independent teams were working together |
Appendix B
| Sample No. | Dimension | CR 1 | CA 2 | Std. CA 3 | AVE 4 |
|---|---|---|---|---|---|
| 1 | F1 | 0.744 | 0.741 | 0.742 | 0.378 |
| F2 | 0.856 | 0.831 | 0.832 | 0.598 | |
| F3 | 0.830 | 0.784 | 0.787 | 0.555 | |
| F4 | 0.781 | 0.668 | 0.673 | 0.546 | |
| 2 | F1 | 0.815 | 0.784 | 0.785 | 0.471 |
| F2 | 0.779 | 0.774 | 0.773 | 0.471 | |
| F3 | 0.791 | 0.723 | 0.725 | 0.498 | |
| F4 | 0.730 | 0.638 | 0.635 | 0.479 | |
| 3 | F1 | 0.814 | 0.800 | 0.801 | 0.473 |
| F2 | 0.866 | 0.834 | 0.834 | 0.617 | |
| F3 | 0.832 | 0.780 | 0.781 | 0.557 | |
| F4 | 0.779 | 0.644 | 0.637 | 0.557 | |
| 4 | F1 | 0.772 | 0.745 | 0.745 | 0.406 |
| F2 | 0.834 | 0.813 | 0.811 | 0.559 | |
| F3 | 0.826 | 0.774 | 0.780 | 0.553 | |
| F4 | 0.800 | 0.684 | 0.682 | 0.577 | |
| 5 | F1 | 0.832 | 0.794 | 0.795 | 0.499 |
| F2 | 0.834 | 0.825 | 0.823 | 0.560 | |
| F3 | 0.845 | 0.789 | 0.788 | 0.581 | |
| F4 | 0.759 | 0.618 | 0.621 | 0.515 | |
| 6 | F1 | 0.791 | 0.787 | 0.788 | 0.445 |
| F2 | 0.855 | 0.847 | 0.846 | 0.597 | |
| F3 | 0.821 | 0.789 | 0.789 | 0.538 | |
| F4 | 0.763 | 0.614 | 0.633 | 0.522 | |
| 7 | F1 | 0.822 | 0.779 | 0.779 | 0.480 |
| F2 | 0.831 | 0.828 | 0.828 | 0.552 | |
| F3 | 0.818 | 0.751 | 0.755 | 0.539 | |
| F4 | 0.744 | 0.639 | 0.627 | 0.495 | |
| 8 | F1 | 0.734 | 0.706 | 0.704 | 0.365 |
| F2 | 0.833 | 0.820 | 0.821 | 0.556 | |
| F3 | 0.809 | 0.801 | 0.799 | 0.523 | |
| F4 | 0.789 | 0.679 | 0.680 | 0.556 | |
| 9 | F1 | 0.835 | 0.805 | 0.805 | 0.506 |
| F2 | 0.813 | 0.796 | 0.796 | 0.522 | |
| F3 | 0.837 | 0.789 | 0.793 | 0.566 | |
| F4 | 0.777 | 0.647 | 0.644 | 0.539 | |
| 10 | F1 | 0.795 | 0.768 | 0.767 | 0.439 |
| F2 | 0.744 | 0.770 | 0.772 | 0.430 | |
| F3 | 0.819 | 0.780 | 0.780 | 0.537 | |
| F4 | 0.717 | 0.643 | 0.630 | 0.483 |
Appendix C

| Regression Relation | Regression Weight | Standard Error | p | ||
|---|---|---|---|---|---|
| F1_Q24 | ← | F1:AgileChange | 0.712 | 0.506 | 0.004 |
| F1_Q25 | ← | F1:AgileChange | 0.905 | 0.652 | 0.004 |
| F1_Q30 | ← | F1:AgileChange | 0.761 | 0.531 | 0.004 |
| F1_Q31 | ← | F1:AgileChange | 0.740 | 0.514 | 0.004 |
| F1_Q32 | ← | F1:AgileChange | 1 | 1 | |
| F2_Q01 | ← | F2:OrgPeople | 0.709 | 0.545 | 0.004 |
| F2_Q03 | ← | F2:OrgPeople | 0.722 | 0.562 | 0.004 |
| F2_Q08 | ← | F2:OrgPeople | 0.784 | 0.624 | 0.004 |
| F2_Q09 | ← | F2:OrgPeople | 1 | 1 | |
| F3_Q34 | ← | F3:StakeRisk | 0.749 | 0.504 | 0.004 |
| F3_Q41 | ← | F3:StakeRisk | 0.856 | 0.685 | 0.004 |
| F3_Q42 | ← | F3:StakeRisk | 1 | 1 | |
| F3_Q44 | ← | F3:StakeRisk | 0.892 | 0.708 | 0.004 |
| F4_Q06 | ← | F4:WorkEnv | 0.937 | 0.576 | 0.004 |
| F4_Q07 | ← | F4:WorkEnv | 1 | 1 | |
| F4_Q38 | ← | F4:WorkEnv | 0.574 | 0.292 | 0.004 |
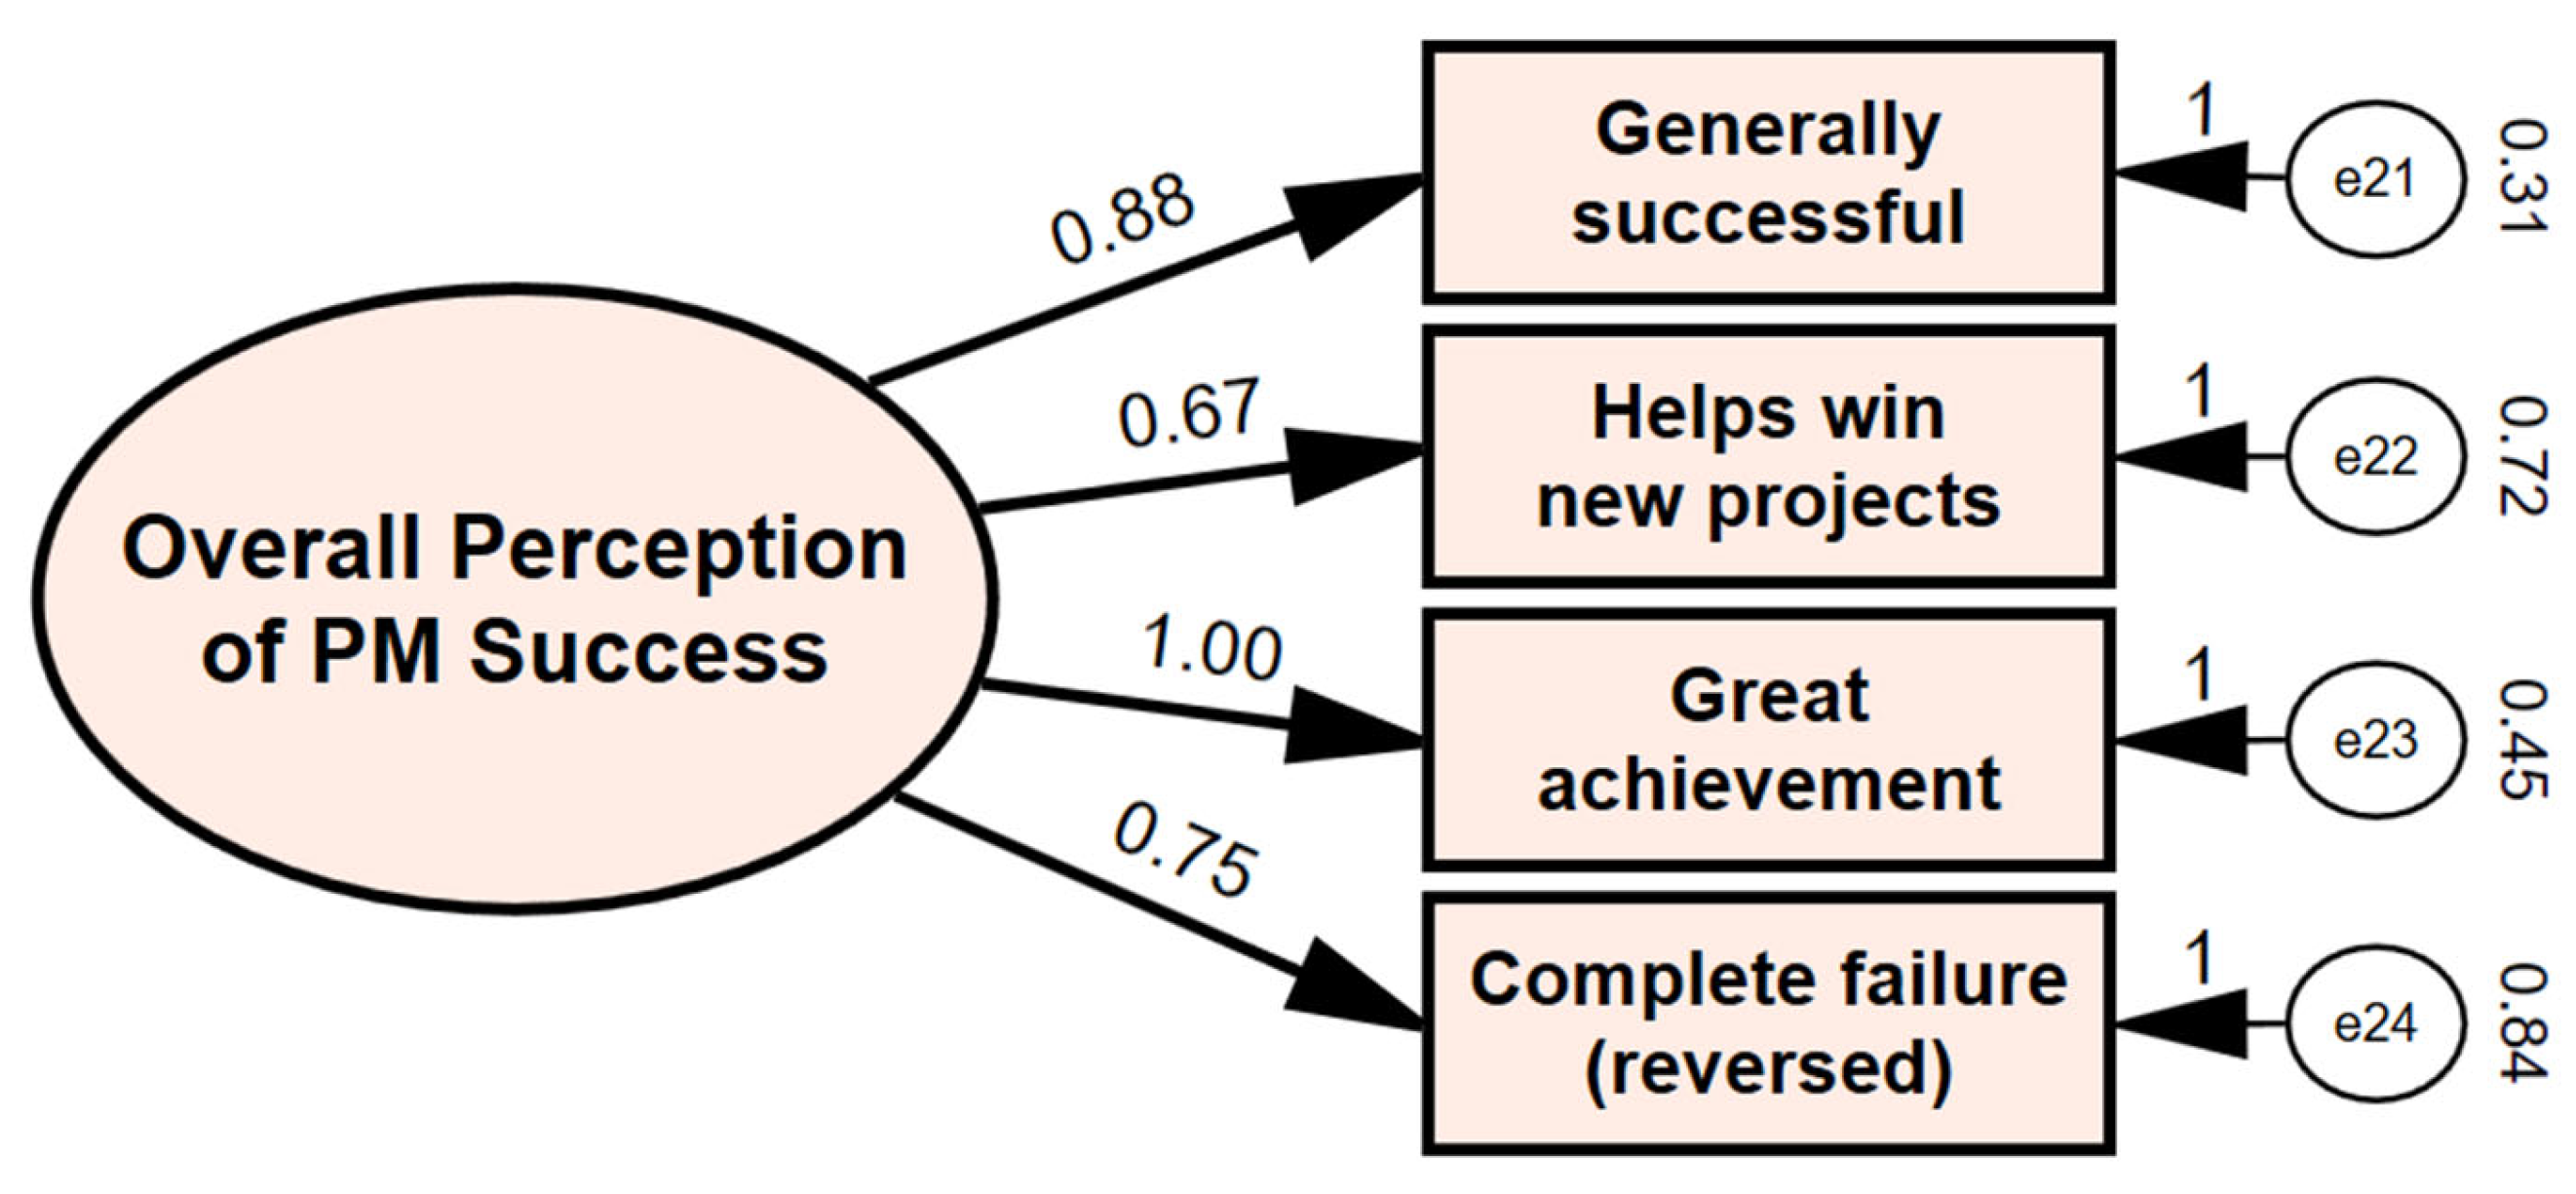
| SP_Q1_GenSuccess | ← | SuccessPer | 0.884 | 0.764 | 0.004 |
| SP_Q2_WinNewProj | ← | SuccessPer | 0.677 | 0.547 | 0.004 |
| SP_Q3_Achievement | ← | SuccessPer | 1 | 1 | |
| SP_Q4_FailureRev | ← | SuccessPer | 0.730 | 0.569 | 0.004 |
| F1:AgileChange | ← | SuccessDim | 0.773 | 0.556 | 0.004 |
| F2:OrgPeople | ← | SuccessDim | 1 | 1 | |
| F3:StakeRisk | ← | SuccessDim | 0.729 | 0.504 | 0.004 |
| F4:WorkEnv | ← | SuccessDim | 0.485 | 0.107 | 0.030 |
Appendix D

| df | p | RMSEA | IFI | CFI | AIC | BIC | ||
|---|---|---|---|---|---|---|---|---|
| 222 | 162 | 0.001 | 1.370 | 0.0490 | 0.952 | 0.951 | 318.0 | 464.1 |
| Regression Relation | Regression Weight | Standard Error | p | ||
|---|---|---|---|---|---|
| F1_Q24 | ← | F1:AgileChange | 0.710 | 0.112 | 0.004 |
| F1_Q25 | ← | F1:AgileChange | 0.915 | 0.115 | 0.004 |
| F1_Q30 | ← | F1:AgileChange | 0.764 | 0.12 | 0.006 |
| F1_Q31 | ← | F1:AgileChange | 0.743 | 0.104 | 0.004 |
| F1_Q32 | ← | F1:AgileChange | 1 | ||
| F2_Q01 | ← | F2:OrgPeople | 0.703 | 0.087 | 0.007 |
| F2_Q03 | ← | F2:OrgPeople | 0.719 | 0.082 | 0.004 |
| F2_Q08 | ← | F2:OrgPeople | 0.788 | 0.077 | 0.004 |
| F2_Q09 | ← | F2:OrgPeople | 1 | ||
| F3_Q34 | ← | F3:StakeRisk | 0.751 | 0.111 | 0.005 |
| F3_Q41 | ← | F3:StakeRisk | 0.857 | 0.095 | 0.008 |
| F3_Q42 | ← | F3:StakeRisk | 1 | ||
| F3_Q44 | ← | F3:StakeRisk | 0.893 | 0.101 | 0.004 |
| F4_Q06 | ← | F4:WorkEnv | 1 | ||
| F4_Q07 | ← | F4:WorkEnv | 0.947 | 0.189 | 0.005 |
| F4_Q38 | ← | F4:WorkEnv | 0.580 | 0.141 | 0.008 |
| SP_Q1_GenSuccess | ← | SuccessPer | 0.867 | 0.061 | 0.005 |
| SP_Q2_WinNewProj | ← | SuccessPer | 0.678 | 0.066 | 0.004 |
| SP_Q3_Achievement | ← | SuccessPer | 1 | ||
| SP_Q4_FailureRev | ← | SuccessPer | 0.725 | 0.075 | 0.003 |
| F1:AgileChange | ← | SuccessDim | 0.534 | 0.120 | 0.003 |
| F2:OrgPeople | ← | SuccessDim | 1 | ||
| F3:StakeRisk | ← | SuccessDim | 0.597 | 0.116 | 0.002 |
| F1:AgileChange | ← | F4:WorkEnv | 0.206 | 0.091 | 0.014 |
| F2:OrgPeople | ← | F4:WorkEnv | 0.428 | 0.117 | 0.003 |
| F2:OrgPeople | ← | F3:StakeRisk | –0.489 | 0.238 | 0.090 |
| F4:WorkEnv | ← | F3:StakeRisk | 0.415 | 0.128 | 0.010 |

| Total Effects | F1:Agile Change | F2:Org People | F3:Stake Risk | F4:Work Env | Success Dim |
|---|---|---|---|---|---|
| F1:Agile Change | 0 | 0 | 0.102 (0.017) | 0.255 (0.01) | 0.839 (0.003) |
| F2:Org People | 0 | 0 | 0.152 (0.009) | 0.38 (0.004) | 1.128 (0.002) |
| F3:Stake Risk | 0 | 0 | 0 | 0 | 0.844 (0.005) |
| F4:Work Env | 0 | 0 | 0.399 (0.009) | 0 | 0.337 (0.009) |

| Total Effects | F1:Agile Change | F2:Org People | F3:Stake Risk | F4:Work Env | Success Dim |
|---|---|---|---|---|---|
| F1:Agile Change | 0 | 0 | 0 | 0.231 (0.013) | 0.751 (0.003) |
| F2:Org People | 0 | 0 | 0 | 0.360 (0.003) | 1.000 |
| F3:Stake Risk | 0 | 0 | 0 | 0.190 (0.013) | 0.775 (0.003) |

| Total Effects | F1:Agile Change | F2:Org People | F3:Stake Risk | F4:Work Env | Success Dim |
|---|---|---|---|---|---|
| F1:Agile Change | 0 | 0.097 (0.005) | 0 | 0.257 (0.005) | 0.769 (0.003) |
| F2:Org People | 0 | 0 | 0 | 0 | 1 |
| F3:Stake Risk | 0 | 0.078 (0.013) | 0 | 0.207 (0.024) | 0.782 (0.003) |
| F4:Work Env | 0 | 0.377 (0.005) | 0 | 0 | 0.377 (0.005) |

| Total Effects | F1:Agile Change | F2:Org People | F3:Stake Risk | F4:Work Env | Success Dim |
|---|---|---|---|---|---|
| F1:Agile Change | 0 | 0 | 0 | 0.000 | 0.828 (0.006) |
| F2:Org People | 0.173 (0.016) | 0 | 0 | 0.371 (0.004) | 1.143 (0.004) |
| F3:Stake Risk | 0.092 (0.023) | 0 | 0 | 0.198 (0.019) | 0.865 (0.006) |
| F4:Work Env | 0.465 (0.010) | 0 | 0 | 0.000 | 0.385 (0.012) |
References
- Standish. CHAOS Report 1994; The Standish Group International, Inc.: Centerville, MA, USA, 1995; Available online: www.standishgroup.com (accessed on 1 January 2024).
- White, D.; Fortune, J. Current practice in project management—An empirical study. Int. J. Proj. Manag. 2002, 20, 1–11. [Google Scholar] [CrossRef]
- Besner, C.; Hobbs, B. The perceived value and potential contribution of project management practices to project success. Proj. Manag. J. 2006, 37, 37–48. [Google Scholar] [CrossRef]
- Besner, C.; Hobbs, J.B. An Empirical Investigation of Project Management Practice: In Reality, Which Tools Do Practitioners Use? Paper Presented at PMI® Research Conference: Innovations; Project Management Institute: London, UK, 2004. [Google Scholar]
- Zaleski, S.; Michalski, R. Success Factors in Sustainable Management of IT Service Projects: Exploratory Factor Analysis. Sustainability 2021, 13, 4457. [Google Scholar] [CrossRef]
- Atkinson, R. Project management: Cost, time and quality, two best guesses and a phenomenon, its time to accept other success criteria. Int. J. Proj. Manag. 1999, 17, 337–342. [Google Scholar] [CrossRef]
- Baccarini, D. The Logical Framework Method for Defining Project Success. Proj. Manag. J. 1999, 30, 25–32. [Google Scholar] [CrossRef]
- de Wit, A. Measurement of project success. Int. J. Proj. Manag. 1988, 6, 164–170. [Google Scholar] [CrossRef]
- Ika, L.A. Project Success as a Topic in Project Management Journals. Proj. Manag. J. 2009, 40, 6–19. [Google Scholar] [CrossRef]
- Shi, S.; Chong, H.-Y.; Liu, L.; Ye, X. Examining the Interrelationship among Critical Success Factors of Public Private Partnership Infrastructure Projects. Sustainability 2016, 8, 1313. [Google Scholar] [CrossRef]
- Almeile, A.M.; Chipulu, M.; Ojiako, U.; Vahidi, R.; Marshall, A. The impact of economic and political imperatives on the successful use of public-private partnership (PPP) in projects. Prod. Plan. Control 2022, 1–21. [Google Scholar] [CrossRef]
- Banihashemi, S.; Hosseini, M.R.; Golizadeh, H.; Sankaran, S. Critical success factors (CSFs) for integration of sustainability into construction project management practices in developing countries. Int. J. Proj. Manag. 2017, 35, 1103–1119. [Google Scholar] [CrossRef]
- Krajangsri, T.; Pongpeng, J. Effect of Sustainable Infrastructure Assessments on Construction Project Success Using Structural Equation Modeling. J. Manag. Eng. 2017, 33, 04016056. [Google Scholar] [CrossRef]
- Watfa, M.K.; Abdelrehim, A.; Shahin, N.; Jaafar, K. A structural equation model to assess the impact of sustainability management on the success of construction projects. Int. J. Constr. Manag. 2021, 23, 1653–1664. [Google Scholar] [CrossRef]
- Gunduz, M.; Abumoza, A.M.; Aly, A.A. A structural equation model to assess the effects of strategic and project related potential risks on project delivery in Qatar. Eng. Constr. Archit. Manag. 2022, 30, 4782–4820. [Google Scholar] [CrossRef]
- Kineber, A.F.; Oke, A.E.; Alyanbaawi, A.; Abubakar, A.S.; Hamed, M.M. Exploring the Cloud Computing Implementation Drivers for Sustainable Construction Projects—A Structural Equation Modeling Approach. Sustainability 2022, 14, 14789. [Google Scholar] [CrossRef]
- Kineber, A.F.; Othman, I.B.; Oke, A.E.; Chileshe, N. Modelling the relationship between value management’s activities and critical success factors for sustainable buildings. J. Eng. Des. Technol. 2022, 20, 414–435. [Google Scholar] [CrossRef]
- Charles, S.H.; Chang-Richards, A.; Yiu, T.W. What do post-disaster reconstruction project success indicators look like? End-user’s perspectives. Int. J. Disaster Resil. Built Environ. 2022, 13, 31–50. [Google Scholar] [CrossRef]
- Unegbu, H.C.O.; Yawas, D.S.; Dan-asabe, B. An investigation of the relationship between project performance measures and project management practices of construction projects for the construction industry in Nigeria. J. King Saud Univ. Eng. Sci. 2022, 34, 240–249. [Google Scholar] [CrossRef]
- Yazici, H.J. An exploratory analysis of the project management and corporate sustainability capabilities for organizational success. Int. J. Manag. Proj. Bus. 2020, 13, 793–817. [Google Scholar] [CrossRef]
- Maqbool, R.; Deng, X.; Ashfaq, S. Success of renewable energy projects under the financial and non-financial performance measures. Sustain. Dev. 2020, 28, 1366–1375. [Google Scholar] [CrossRef]
- Hussain, S.; Xuetong, W.; Maqbool, R.; Hussain, M.; Shahnawaz, M. The influence of government support, organizational innovativeness and community participation in renewable energy project success: A case of Pakistan. Energy 2022, 239, 122172. [Google Scholar] [CrossRef]
- Irfan, M.; Hassan, M.; Hassan, N. The Effect of Project Management Capabilities on Project Success in Pakistan: An Empirical Investigation. IEEE Access 2019, 7, 39417–39431. [Google Scholar] [CrossRef]
- Komal, B.; Janjua, U.I.; Anwar, F.; Madni, T.M.; Cheema, M.F.; Malik, M.N.; Shahid, A.R. The Impact of Scope Creep on Project Success: An Empirical Investigation. IEEE Access 2020, 8, 125755–125775. [Google Scholar] [CrossRef]
- Tam, C.; Moura, E.J.d.C.; Oliveira, T.; Varajão, J. The factors influencing the success of on-going agile software development projects. Int. J. Proj. Manag. 2020, 38, 165–176. [Google Scholar] [CrossRef]
- Fakhkhari, H.; Bounabat, B.; Bennani, M. Structural Equation Model (SEM) for Evaluating Factors Affecting ICT4D Project Success. J. Comput. Sci. 2021, 17, 724–737. [Google Scholar] [CrossRef]
- Malik, M.O.; Khan, N. Analysis of ERP implementation to develop a strategy for its success in developing countries. Prod. Plan. Control 2021, 32, 1020–1035. [Google Scholar] [CrossRef]
- Hamid, M.; Zeshan, F.; Ahmad, A.; Malik, S.; Saleem, M.; Tabassum, N.; Qasim, M. Analysis of Software Success Through Structural Equation Modeling. Intell. Autom. Soft Comput. 2022, 31, 1689–1701. [Google Scholar] [CrossRef]
- Yohannes, A.; Mauritsius, T. Critical Success Factors in Information Technology Projects. Int. J. Emerg. Technol. Adv. Eng. 2022, 12, 45–67. [Google Scholar] [CrossRef]
- Zaleski, S.; Michalski, R. Czynniki sukcesu zarządzania projektami usług IT. Przegląd Organizacji 2020, 8, 29–36. [Google Scholar] [CrossRef]
- Freund, R.J. Regression Analysis; Elsevier Science & Technology Books: Amsterdam, The Netherlands, 2006. [Google Scholar]
- Welfe, A. Ekonometria: Metody i ich Zastosowanie; (Wyd. 3 zm.); Polskie Wydawnictwo Ekonomiczne: Warsaw, Poland, 2003. [Google Scholar]
- Neter, J.; Wasserman, W.; Kutner, M. Applied Linear Statistical Models: Regression, Analysis of Variance, and Experimental Designs; RD Irwin: Homewood, IL, USA, 1985. [Google Scholar]
- Williams, F.; Monge, P.R. Reasoning with Statistics: How to Read Quantitative Research; Thomson Wadsworth: Belmont, CA, USA, 2001. [Google Scholar]
- DiStefano, C.; Hess, B. Using Confirmatory Factor Analysis for Construct Validation: An Empirical Review. J. Psychoeduc. Assess. 2005, 23, 225–241. [Google Scholar] [CrossRef]
- Jackson, D.L.; Gillaspy, J.A., Jr.; Purc-Stephenson, R. Reporting practices in confirmatory factor analysis: An overview and some recommendations. Psychol. Methods 2009, 14, 6–23. [Google Scholar] [CrossRef] [PubMed]
- Jöreskog, K.G. Statistical analysis of sets of congeneric tests. Psychometrika 1971, 36, 109–133. [Google Scholar] [CrossRef]
- Bollen, K.A. Structural Equations with Latent Variables; John Wiley & Sons: Hoboken, NJ, USA, 1989. [Google Scholar] [CrossRef]
- Hair, J.F.; Tatham, R.L.; Anderson, R.E.; Black, W. Multivariate Data Analysis, 5th ed.; Prentice Hall: London, UK, 1998. [Google Scholar]
- Wolfle, L.M. Sewall wright on the method of path coefficients: An annotated bibliography. Struct. Equ. Model. Multidiscip. J. 1999, 6, 280–291. [Google Scholar] [CrossRef]
- Wright, S. The Relative Importance of Heredity and Environment in Determining the Piebald Pattern of Guinea-Pigs. Proc. Natl. Acad. Sci. USA 1920, 6, 320–332. [Google Scholar] [CrossRef] [PubMed]
- Wright, S. Correlation and Causation. J. Agric. Res. 1921, 20, 557–585. [Google Scholar]
- Wright, S. The Method of Path Coefficients. Ann. Math. Stat. 1934, 5, 161–215. [Google Scholar] [CrossRef]
- Kline, R.B. Principles and Practice of Structural Equation Modeling, 2nd ed.; Guilford Publications: New York, NY, USA, 2005. [Google Scholar]
- Schumacker, R.E.; Lomax, R.G. A Beginner’s Guide to Structural Equation Modeling; Psychology Press: London, UK, 2004. [Google Scholar]
- Satorra, A.; Bentler, P.M. Corrections to test statistics and standard errors in covariance structure analysis. In Latent Variables Analysis: Applications for Developmental Research; Sage Publications, Inc.: Thousand Oaks, CA, USA, 1994; pp. 399–419. [Google Scholar]
- Steiger, J.H. Structural Model Evaluation and Modification: An Interval Estimation Approach. Multivar. Behav. Res. 1990, 25, 173–180. [Google Scholar] [CrossRef]
- Bollen, K.A. A New Incremental Fit Index for General Structural Equation Models. Sociol. Methods Res. 1989, 17, 303–316. [Google Scholar] [CrossRef]
- Bentler, P.M. Comparative fit indexes in structural models. Psychol. Bull. 1990, 107, 238–246. [Google Scholar] [CrossRef]
- Akaike, H. Factor analysis and AIC. Psychometrika 1987, 52, 317–332. [Google Scholar] [CrossRef]
- Browne, M.W.; Cudeck, R. Single Sample Cross-Validation Indices for Covariance Structures. Multivar. Behav. Res. 1989, 24, 445–455. [Google Scholar] [CrossRef]
- Schwarz, G. Estimating the Dimension of a Model. Ann. Stat. 1978, 6, 461–464. [Google Scholar] [CrossRef]
- Efron, B. Bootstrap Methods: Another Look at the Jackknife. Ann. Stat. 1979, 7, 1–26. [Google Scholar] [CrossRef]
- Arbuckle, J.L. IBM® SPSS® AmosTM 26 User’s Guide; AMOS Development Corporation: Chicago, IL, USA, 2019. [Google Scholar]
- Hair, J.; Black, W.; Babin, B.; Anderson, R. Multivariate Data Analysis; Prentice Hall: London, UK, 2009. [Google Scholar]
- Chow, T.; Cao, D.-B. A survey study of critical success factors in agile software projects. J. Syst. Softw. 2008, 81, 961–971. [Google Scholar] [CrossRef]
- Stankovic, D.; Nikolic, V.; Djordjevic, M.; Cao, D.-B. A survey study of critical success factors in agile software projects in former Yugoslavia IT companies. J. Syst. Softw. 2013, 86, 1663–1678. [Google Scholar] [CrossRef]
- Brown, G. An Examination of Critical Success Factors of an Agile Project; [ProQuest Dissertations Publishing]. 2015. Available online: http://search.proquest.com/docview/1660970158/?pq-origsite=primo (accessed on 1 January 2024).
- Stanberry, L. Critical Success Factors for Large and Distributed Agile Software Development Projects Using Scrum in U.S.-Based Global Companies. [ProQuest Dissertations Publishing]. 2018. Available online: http://search.proquest.com/docview/2027207191/?pq-origsite=primo (accessed on 1 January 2024).
- Saaty, T.L. A scaling method for priorities in hierarchical structures. J. Math. Psychol. 1977, 15, 234–281. [Google Scholar] [CrossRef]


| 1. | ||||||
| , 6 | , | , | ||||
| 2. | ||||||
| , | ||||||
| 3. | ||||||
| , | , | , | , | |||
| 4. | ||||||
| , | , | |||||
| 5. | ||||||
368 | , | , | , | |||
| 6. | ||||||
448 | , | , | , |
| df | p | IFI | CFI | RMSEA | ||
|---|---|---|---|---|---|---|
| 140 | 98 | 0.003 | 1.429 | 0.948 | 0.946 | 0.053 |
| Sample No. | p | IFI | CFI | RMSEA | |
|---|---|---|---|---|---|
| 1 | 0.008 | 1.375 | 0.913 | 0.908 | 0.07 |
| 2 | 0.041 | 1.262 | 0.944 | 0.941 | 0.058 |
| 3 | 0.072 | 1.216 | 0.951 | 0.949 | 0.053 |
| 4 | 0.109 | 1.179 | 0.958 | 0.956 | 0.048 |
| 5 | 0.015 | 1.336 | 0.924 | 0.92 | 0.066 |
| 6 | 0.022 | 1.308 | 0.919 | 0.914 | 0.063 |
| 7 | 0.082 | 1.204 | 0.952 | 0.949 | 0.052 |
| 8 | 0.045 | 1.254 | 0.938 | 0.934 | 0.058 |
| 9 | 0.030 | 1.286 | 0.933 | 0.929 | 0.061 |
| 10 | 0.088 | 1.198 | 0.951 | 0.948 | 0.051 |
| Abbreviation | Short Description | Question |
|---|---|---|
| SP_Q1_GenSuccess | Generally successful | Generally, I consider the project as successful |
| SP_Q2_WinNewProj | Helps win new projects | The implementation of the project increases the chances of obtaining new projects |
| SP_Q3_Achievement | Great achievement | I think the project was a great achievement |
| SP_Q4_FailureRev | Complete failure (reversed) | Overall, the project was a complete failure |
| Latent Variable | CR 1 | CA 2 | Std. CA 3 | AVE 4 |
|---|---|---|---|---|
| Overall Perception of PM Success | 0.91 | 0.867 | 0.867 | 0.718 |
| df | p | RMSEA | IFI | CFI | AIC | BIC | ||
|---|---|---|---|---|---|---|---|---|
| 248 | 165 | <0.001 | 1.503 | 0.0571 | 0.934 | 0.933 | 338.0 | 474.9 |
| Variants of Model 35 | RMSEA | IFI | CFI | AIC | BIC | |
|---|---|---|---|---|---|---|
| (1) F1←F4, F2←F4, F4←F3 | 1.397 | 0.0508 | 0.949 | 0.948 | 321.7 | 464.8 |
| (2) F1←F4, F2←F4, F3←F4 | 1.409 | 0.0515 | 0.947 | 0.946 | 323.7 | 466.7 |
| (3) F1←F4, F4←F2, F4←F3 | 1.425 | 0.0526 | 0.945 | 0.944 | 326.4 | 469.4 |
| (4) F1←F4, F4←F2, F3←F4 | 1.406 | 0.0513 | 0.947 | 0.946 | 323.2 | 466.2 |
| (5) F4←F1, F2←F4, F4←F3 | 1.428 | 0.0527 | 0.945 | 0.943 | 326.7 | 469.9 |
| (6) F4←F1, F2←F4, F3←F4 | 1.402 | 0.0511 | 0.948 | 0.947 | 322.5 | 465.6 |
| (7) F4←F1, F4←F2, F4←F3 | 1.460 | 0.0546 | 0.941 | 0.939 | 331.9 | 474.9 |
| (8) F4←F1, F4←F2, F3←F4 | 1.448 | 0.0539 | 0.942 | 0.941 | 330.0 | 473.0 |
| df | p | RMSEA | IFI | CFI | AIC | BIC | ||
|---|---|---|---|---|---|---|---|---|
| 235 | 164 | 0.0002 | 1.431 | 0.0529 | 0.944 | 0.943 | 326.7 | 466.7 |
| Regression Relation | Regression Weight | Standard Error | p | ||
|---|---|---|---|---|---|
| F1_Q24 | ← | F1:AgileChange | 0.711 | 0.111 | 0.004 |
| F1_Q25 | ← | F1:AgileChange | 0.902 | 0.113 | 0.004 |
| F1_Q30 | ← | F1:AgileChange | 0.756 | 0.119 | 0.006 |
| F1_Q31 | ← | F1:AgileChange | 0.733 | 0.102 | 0.004 |
| F1_Q32 | ← | F1:AgileChange | 1 | ||
| F2_Q01 | ← | F2:OrgPeople | 0.717 | 0.088 | 0.008 |
| F2_Q03 | ← | F2:OrgPeople | 0.722 | 0.084 | 0.004 |
| F2_Q08 | ← | F2:OrgPeople | 0.795 | 0.078 | 0.005 |
| F2_Q09 | ← | F2:OrgPeople | 1 | ||
| F3_Q34 | ← | F3:StakeRisk | 0.747 | 0.112 | 0.005 |
| F3_Q41 | ← | F3:StakeRisk | 0.858 | 0.095 | 0.007 |
| F3_Q42 | ← | F3:StakeRisk | 1 | ||
| F3_Q44 | ← | F3:StakeRisk | 0.890 | 0.101 | 0.004 |
| F4_Q06 | ← | F4:WorkEnv | 1 | ||
| F4_Q07 | ← | F4:WorkEnv | 0.959 | 0.202 | 0.005 |
| F4_Q38 | ← | F4:WorkEnv | 0.581 | 0.145 | 0.009 |
| SP_Q1_GenSuccess | ← | SuccessPer | 0.874 | 0.061 | 0.006 |
| SP_Q2_WinNewProj | ← | SuccessPer | 0.677 | 0.066 | 0.004 |
| SP_Q3_Achievement | ← | SuccessPer | 1 | ||
| SP_Q4_FailureRev | ← | SuccessPer | 0.727 | 0.075 | 0.003 |
| F1:AgileChange | ← | SuccessDim | 0.846 | 0.153 | 0.006 |
| F2:OrgPeople | ← | SuccessDim | 1 | ||
| F3:StakeRisk | ← | SuccessDim | 0.852 | 0.153 | 0.004 |
| F4:WorkEnv | ← | F1:AgileChange | 0.459 | 0.132 | 0.005 |
| F2:OrgPeople | ← | F4:WorkEnv | 0.346 | 0.110 | 0.005 |
| Total Effects | F1:Agile Change | F2:Org People | F3:Stake Risk | F4:Work Env | Success Dim |
|---|---|---|---|---|---|
| F1:Agile Change | 0 | 0 | 0 | 0.846 (0.006) | |
| F2:Org People | 0.159 (0.006) | 0 | 0 | 0.346 (0.005) | 1.134 (0.005) |
| F3:Stake Risk | 0 | 0 | 0 | 0 | 0.852 (0.004) |
| F4:Work Env | 0.459 (0.005) | 0 | 0 | 0 | 0.389 (0.003) |
Disclaimer/Publisher’s Note: The statements, opinions and data contained in all publications are solely those of the individual author(s) and contributor(s) and not of MDPI and/or the editor(s). MDPI and/or the editor(s) disclaim responsibility for any injury to people or property resulting from any ideas, methods, instructions or products referred to in the content. |
© 2024 by the authors. Licensee MDPI, Basel, Switzerland. This article is an open access article distributed under the terms and conditions of the Creative Commons Attribution (CC BY) license (https://creativecommons.org/licenses/by/4.0/).
Share and Cite
Michalski, R.; Zaleski, S. Success Factors in Management of IT Service Projects: Regression, Confirmatory Factor Analysis, and Structural Equation Models. Information 2024, 15, 105. https://doi.org/10.3390/info15020105
Michalski R, Zaleski S. Success Factors in Management of IT Service Projects: Regression, Confirmatory Factor Analysis, and Structural Equation Models. Information. 2024; 15(2):105. https://doi.org/10.3390/info15020105
Chicago/Turabian StyleMichalski, Rafał, and Szymon Zaleski. 2024. "Success Factors in Management of IT Service Projects: Regression, Confirmatory Factor Analysis, and Structural Equation Models" Information 15, no. 2: 105. https://doi.org/10.3390/info15020105