
Recognizing the Wadi Fluvial Structure and Stream Network in the Qena Bend of the Nile River, Egypt, on Landsat 8-9 OLI Images


Abstract
:1. Introduction
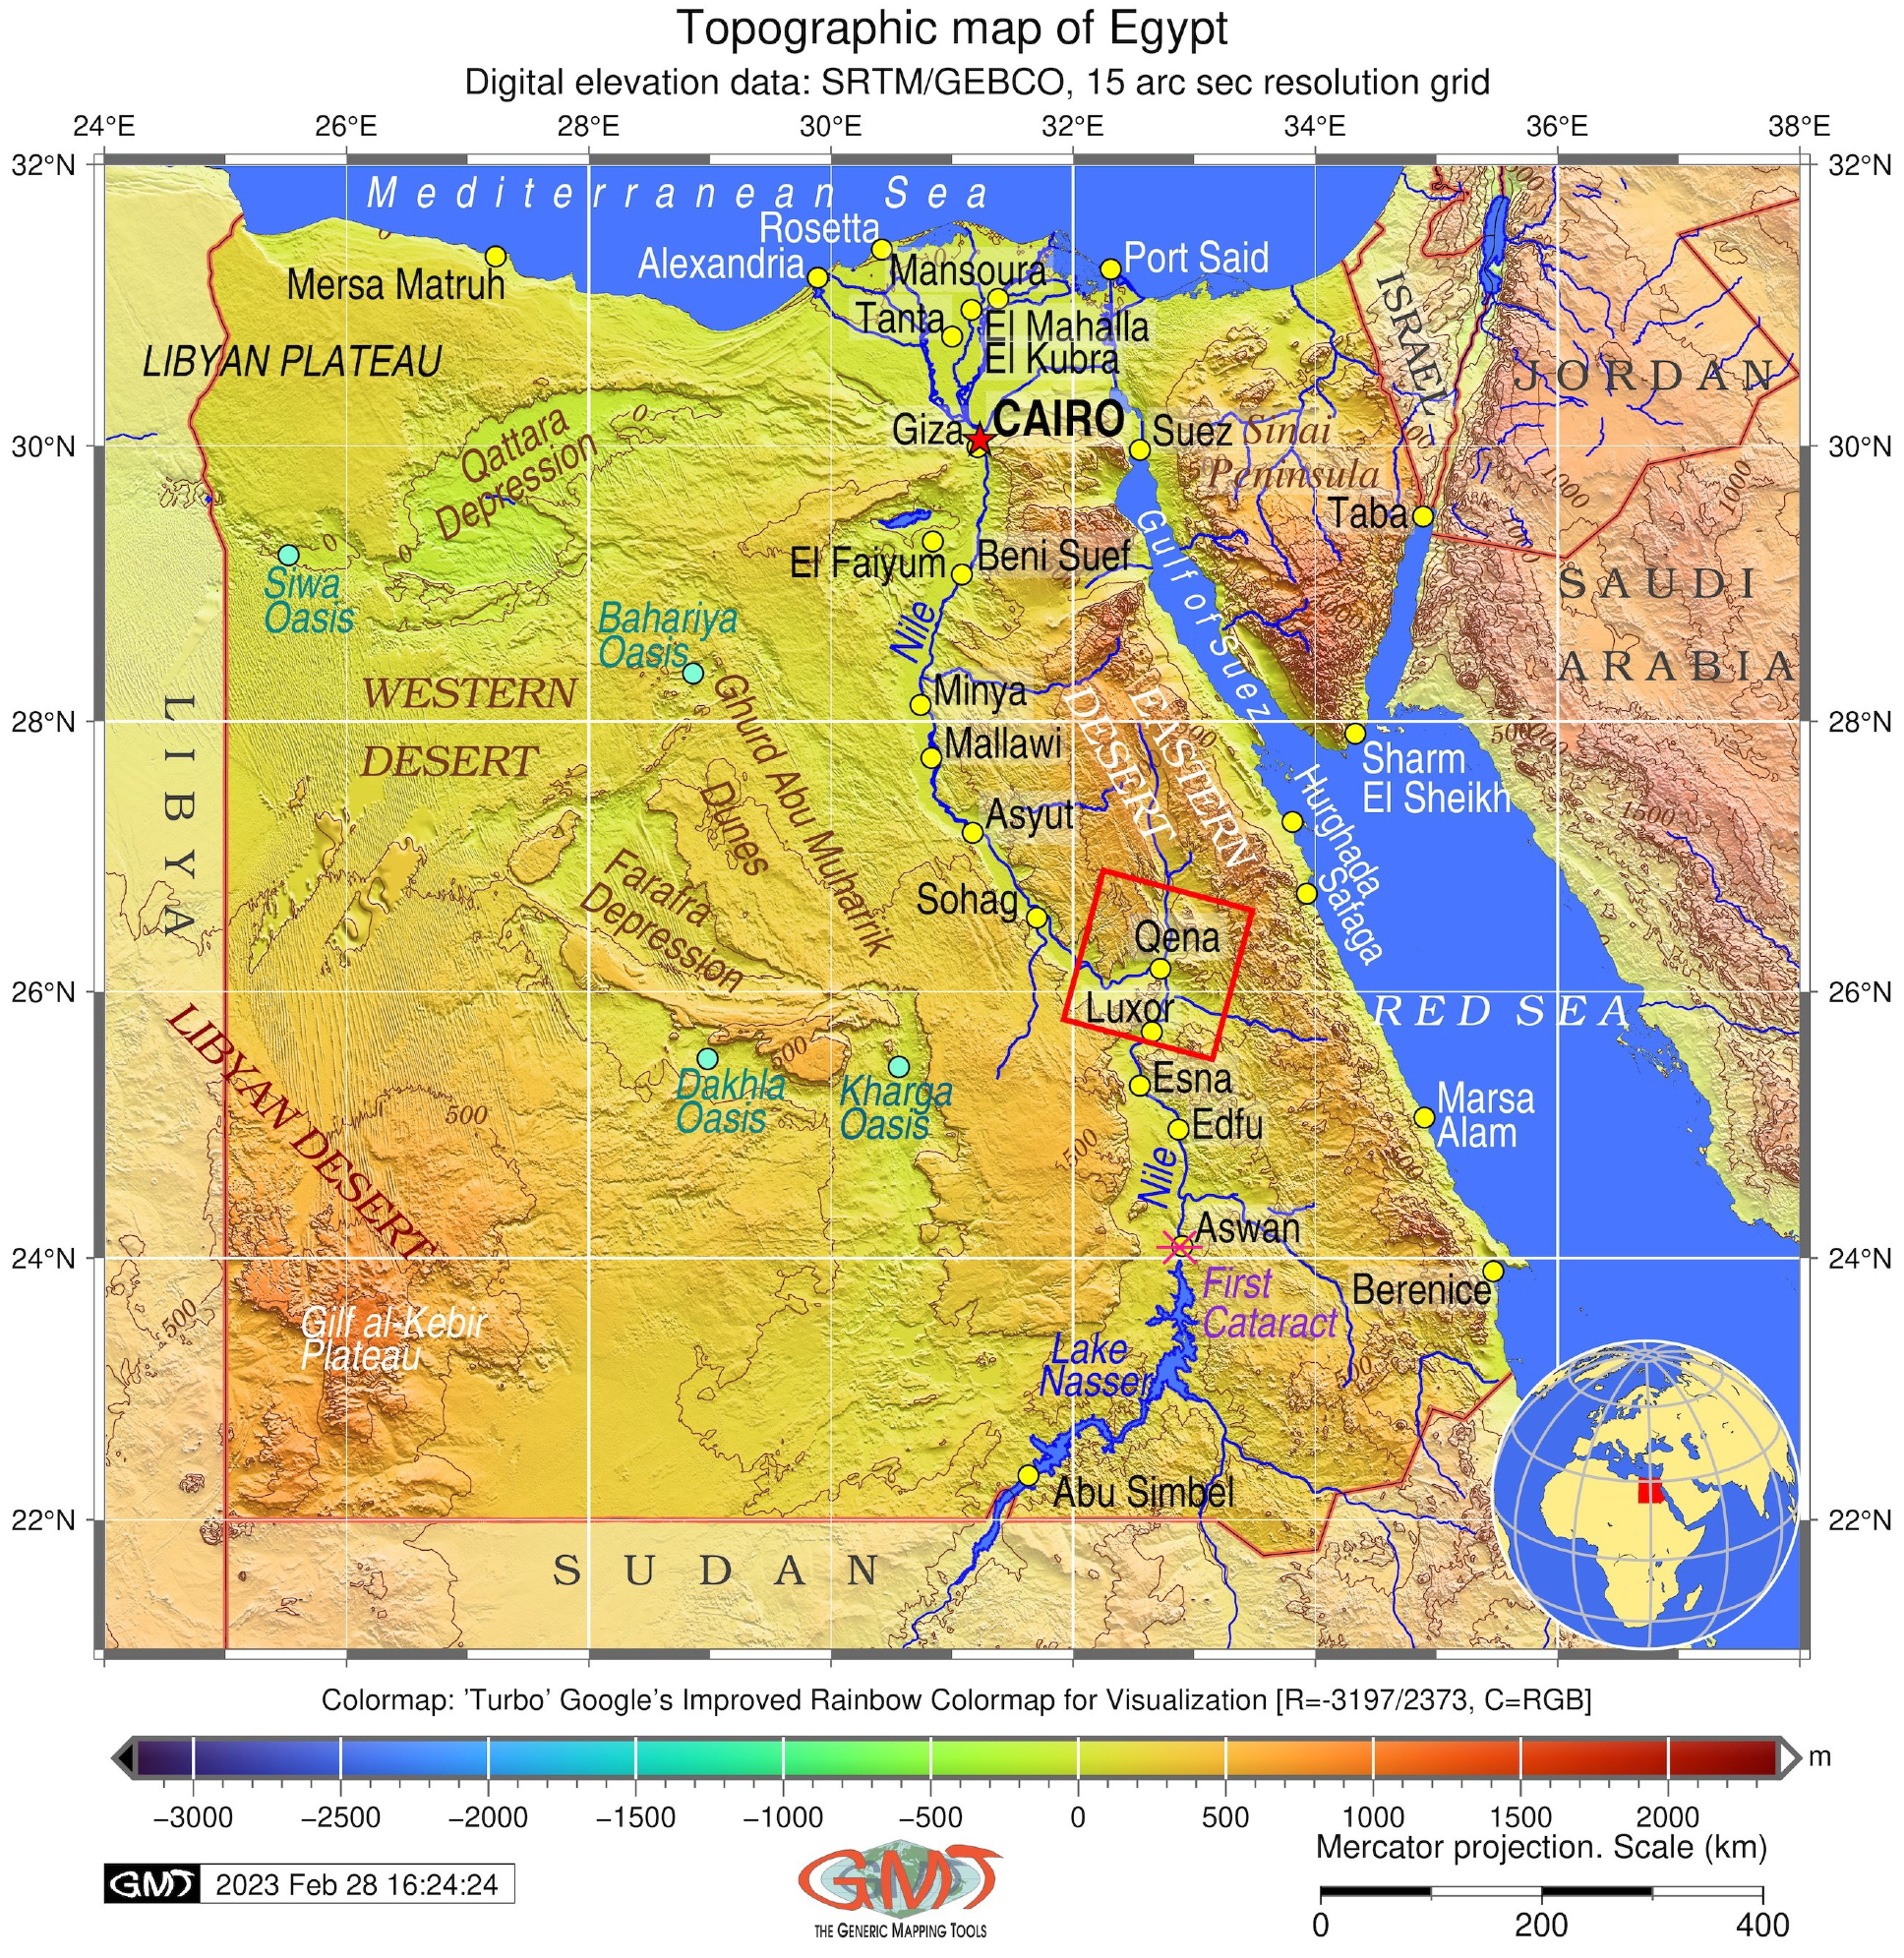
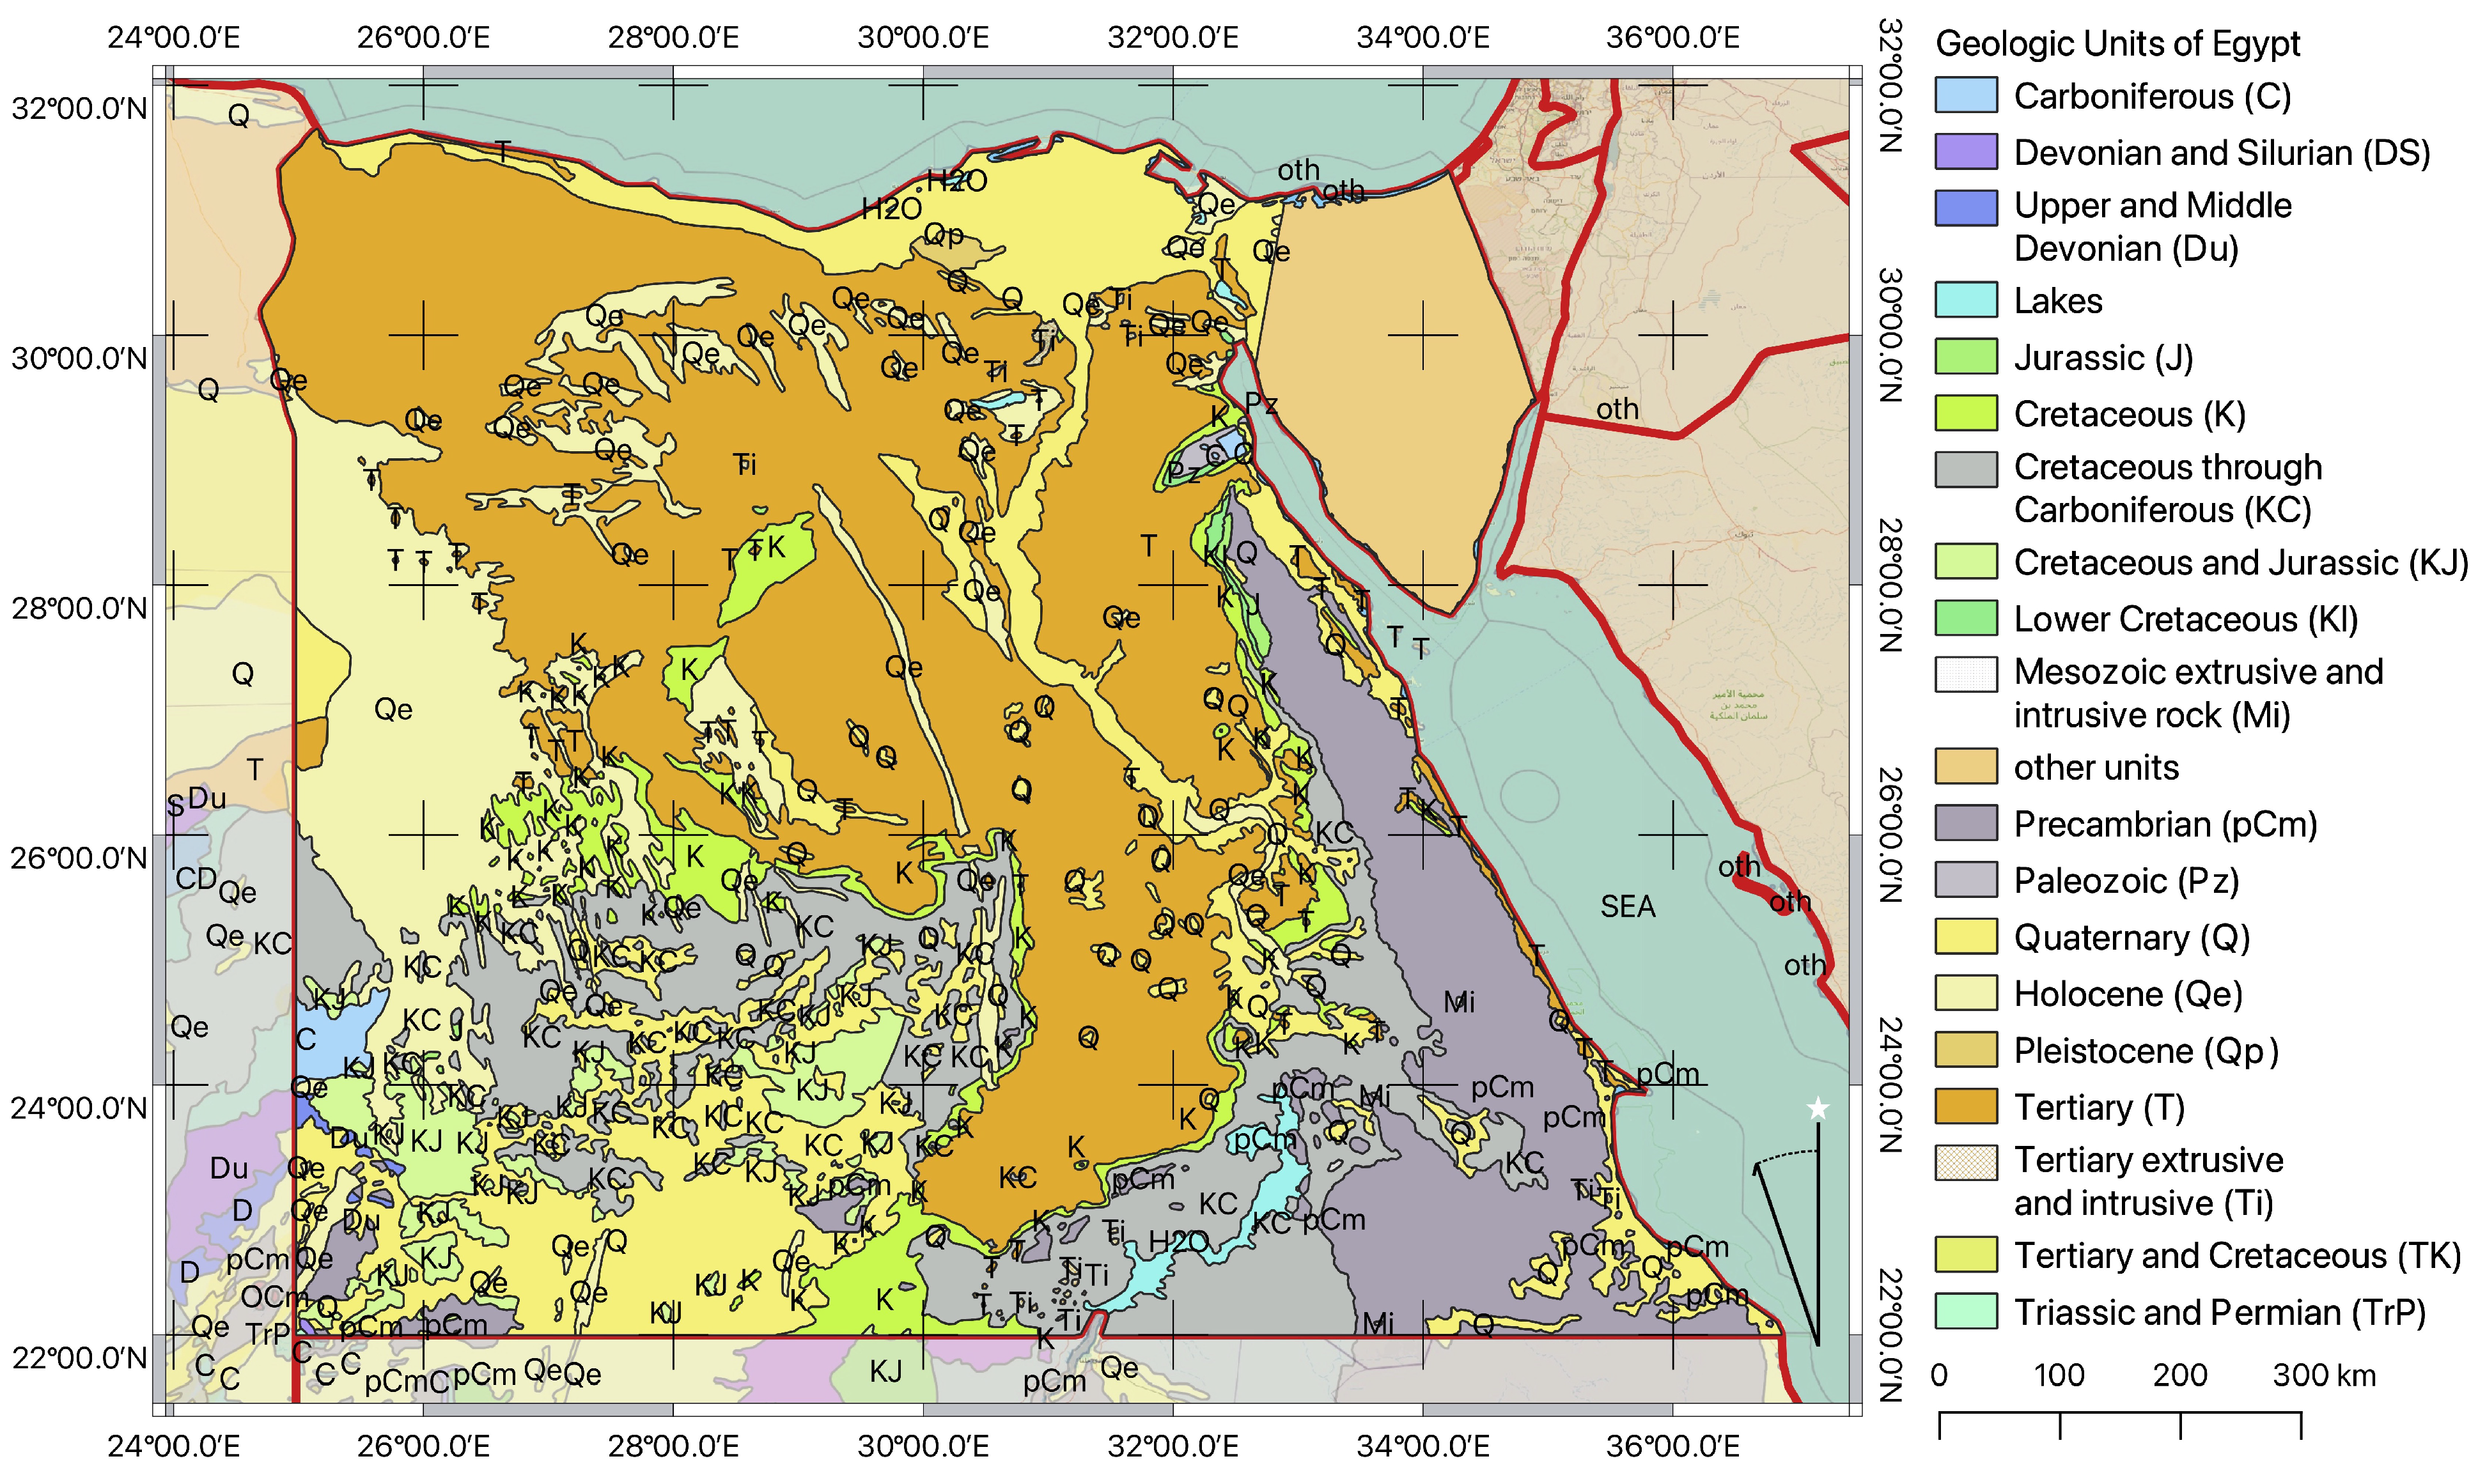
1.1. Background
1.2. Motivation and Objectives
2. Prior Work
3. Materials and Methods
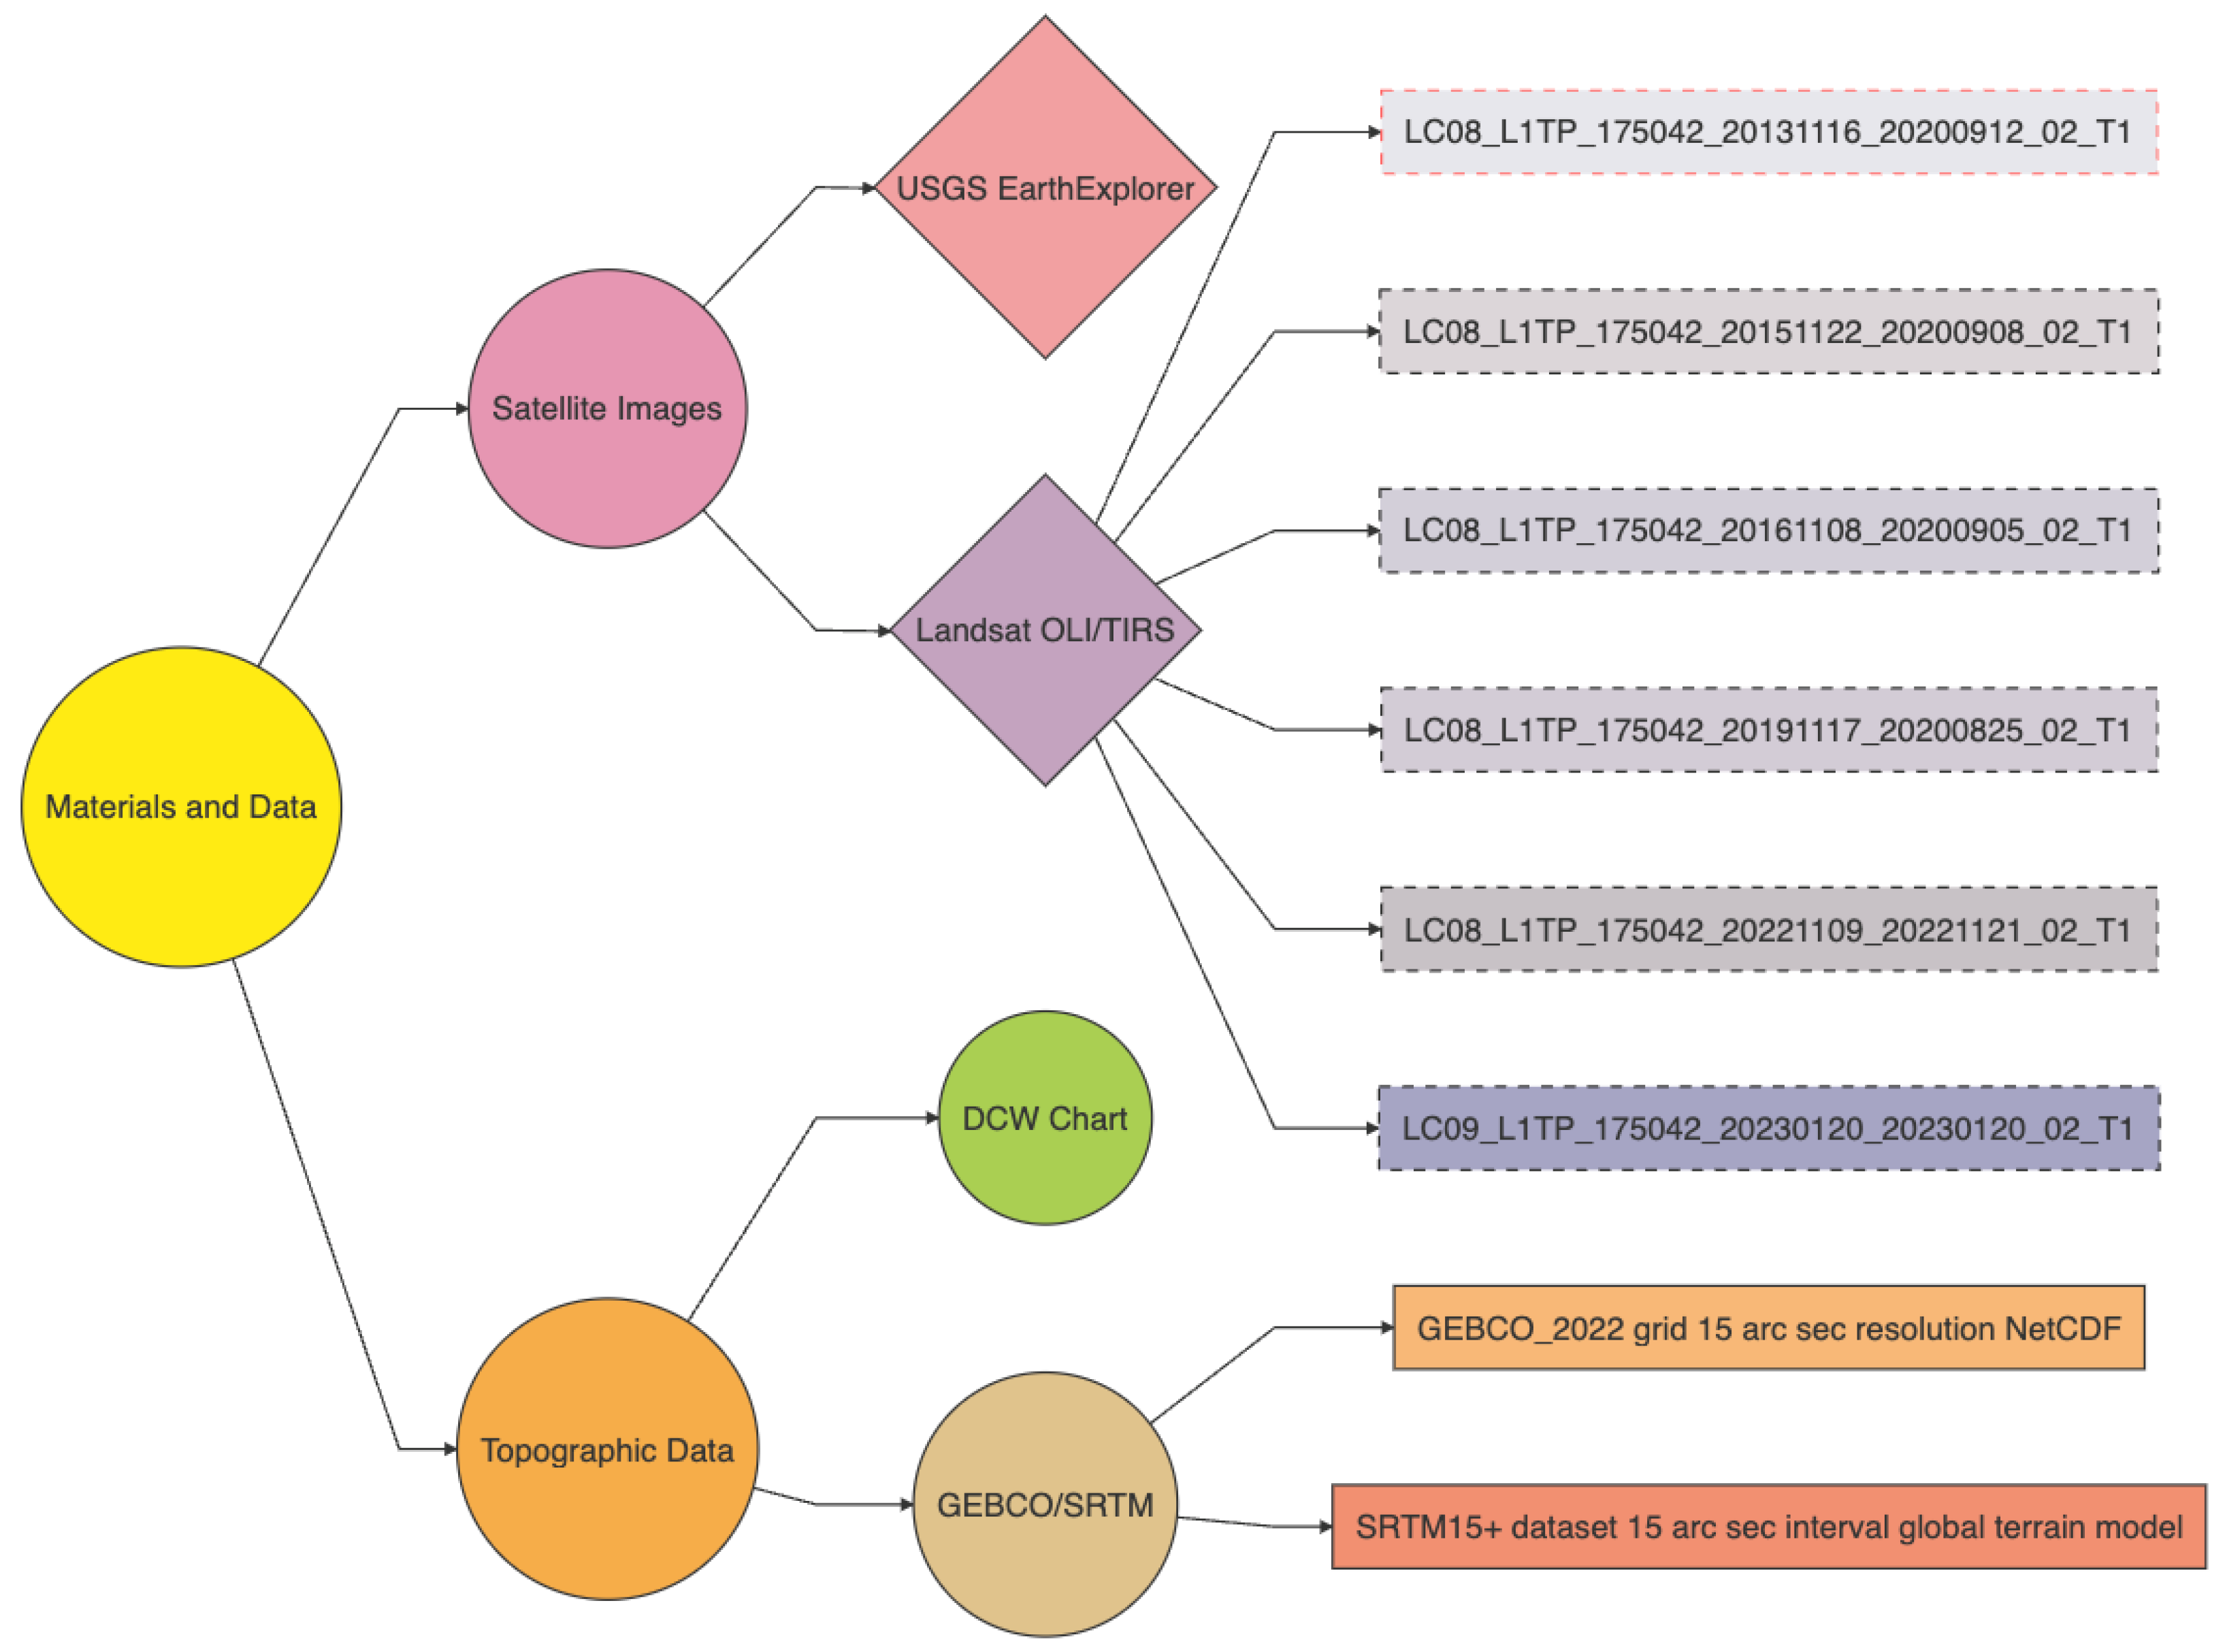
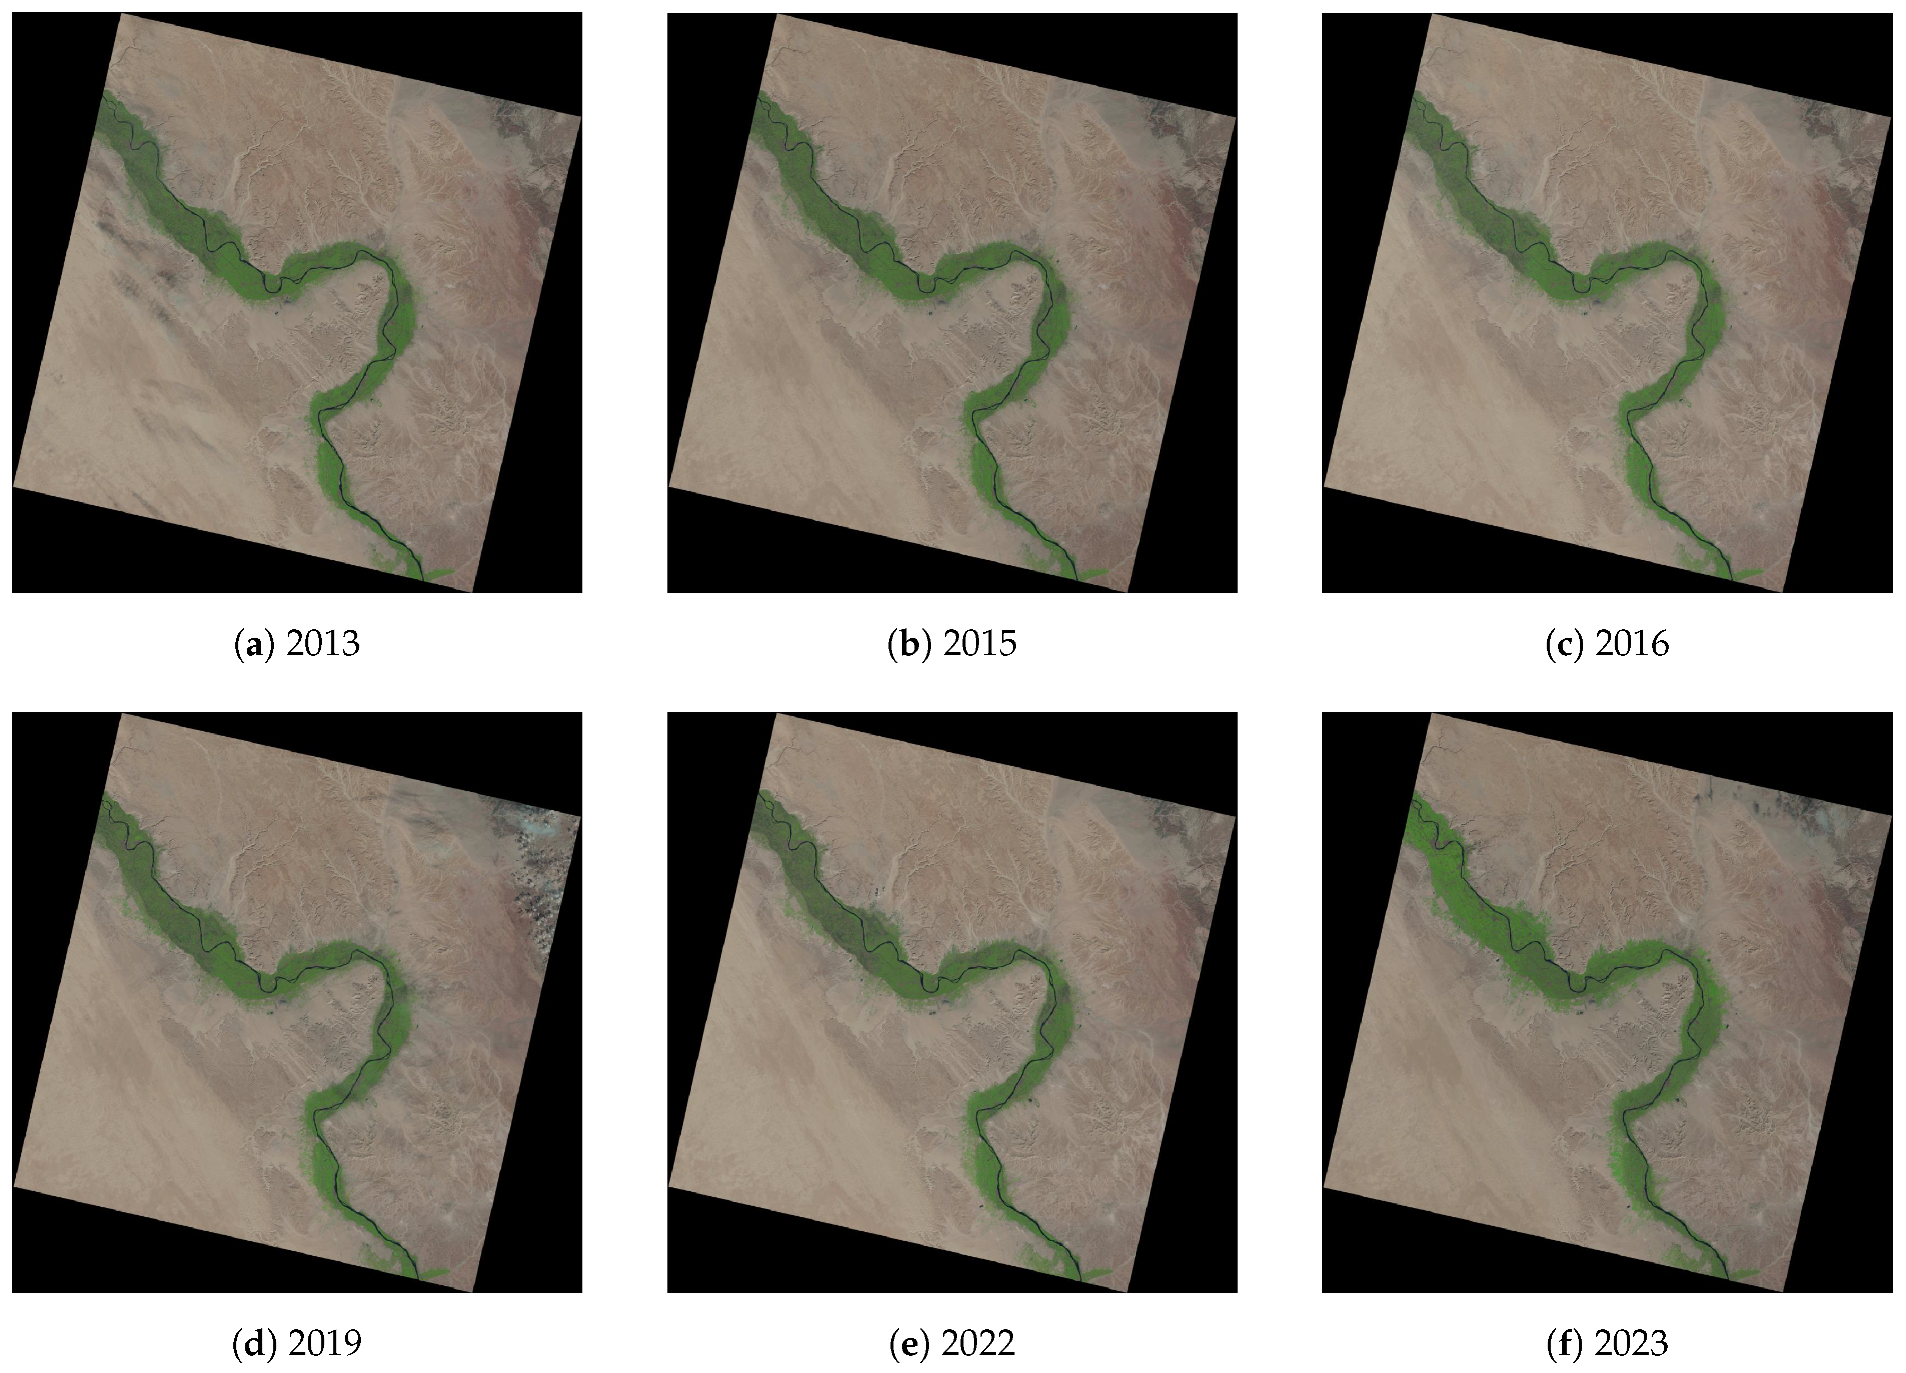
3.1. Data
3.2. Methods
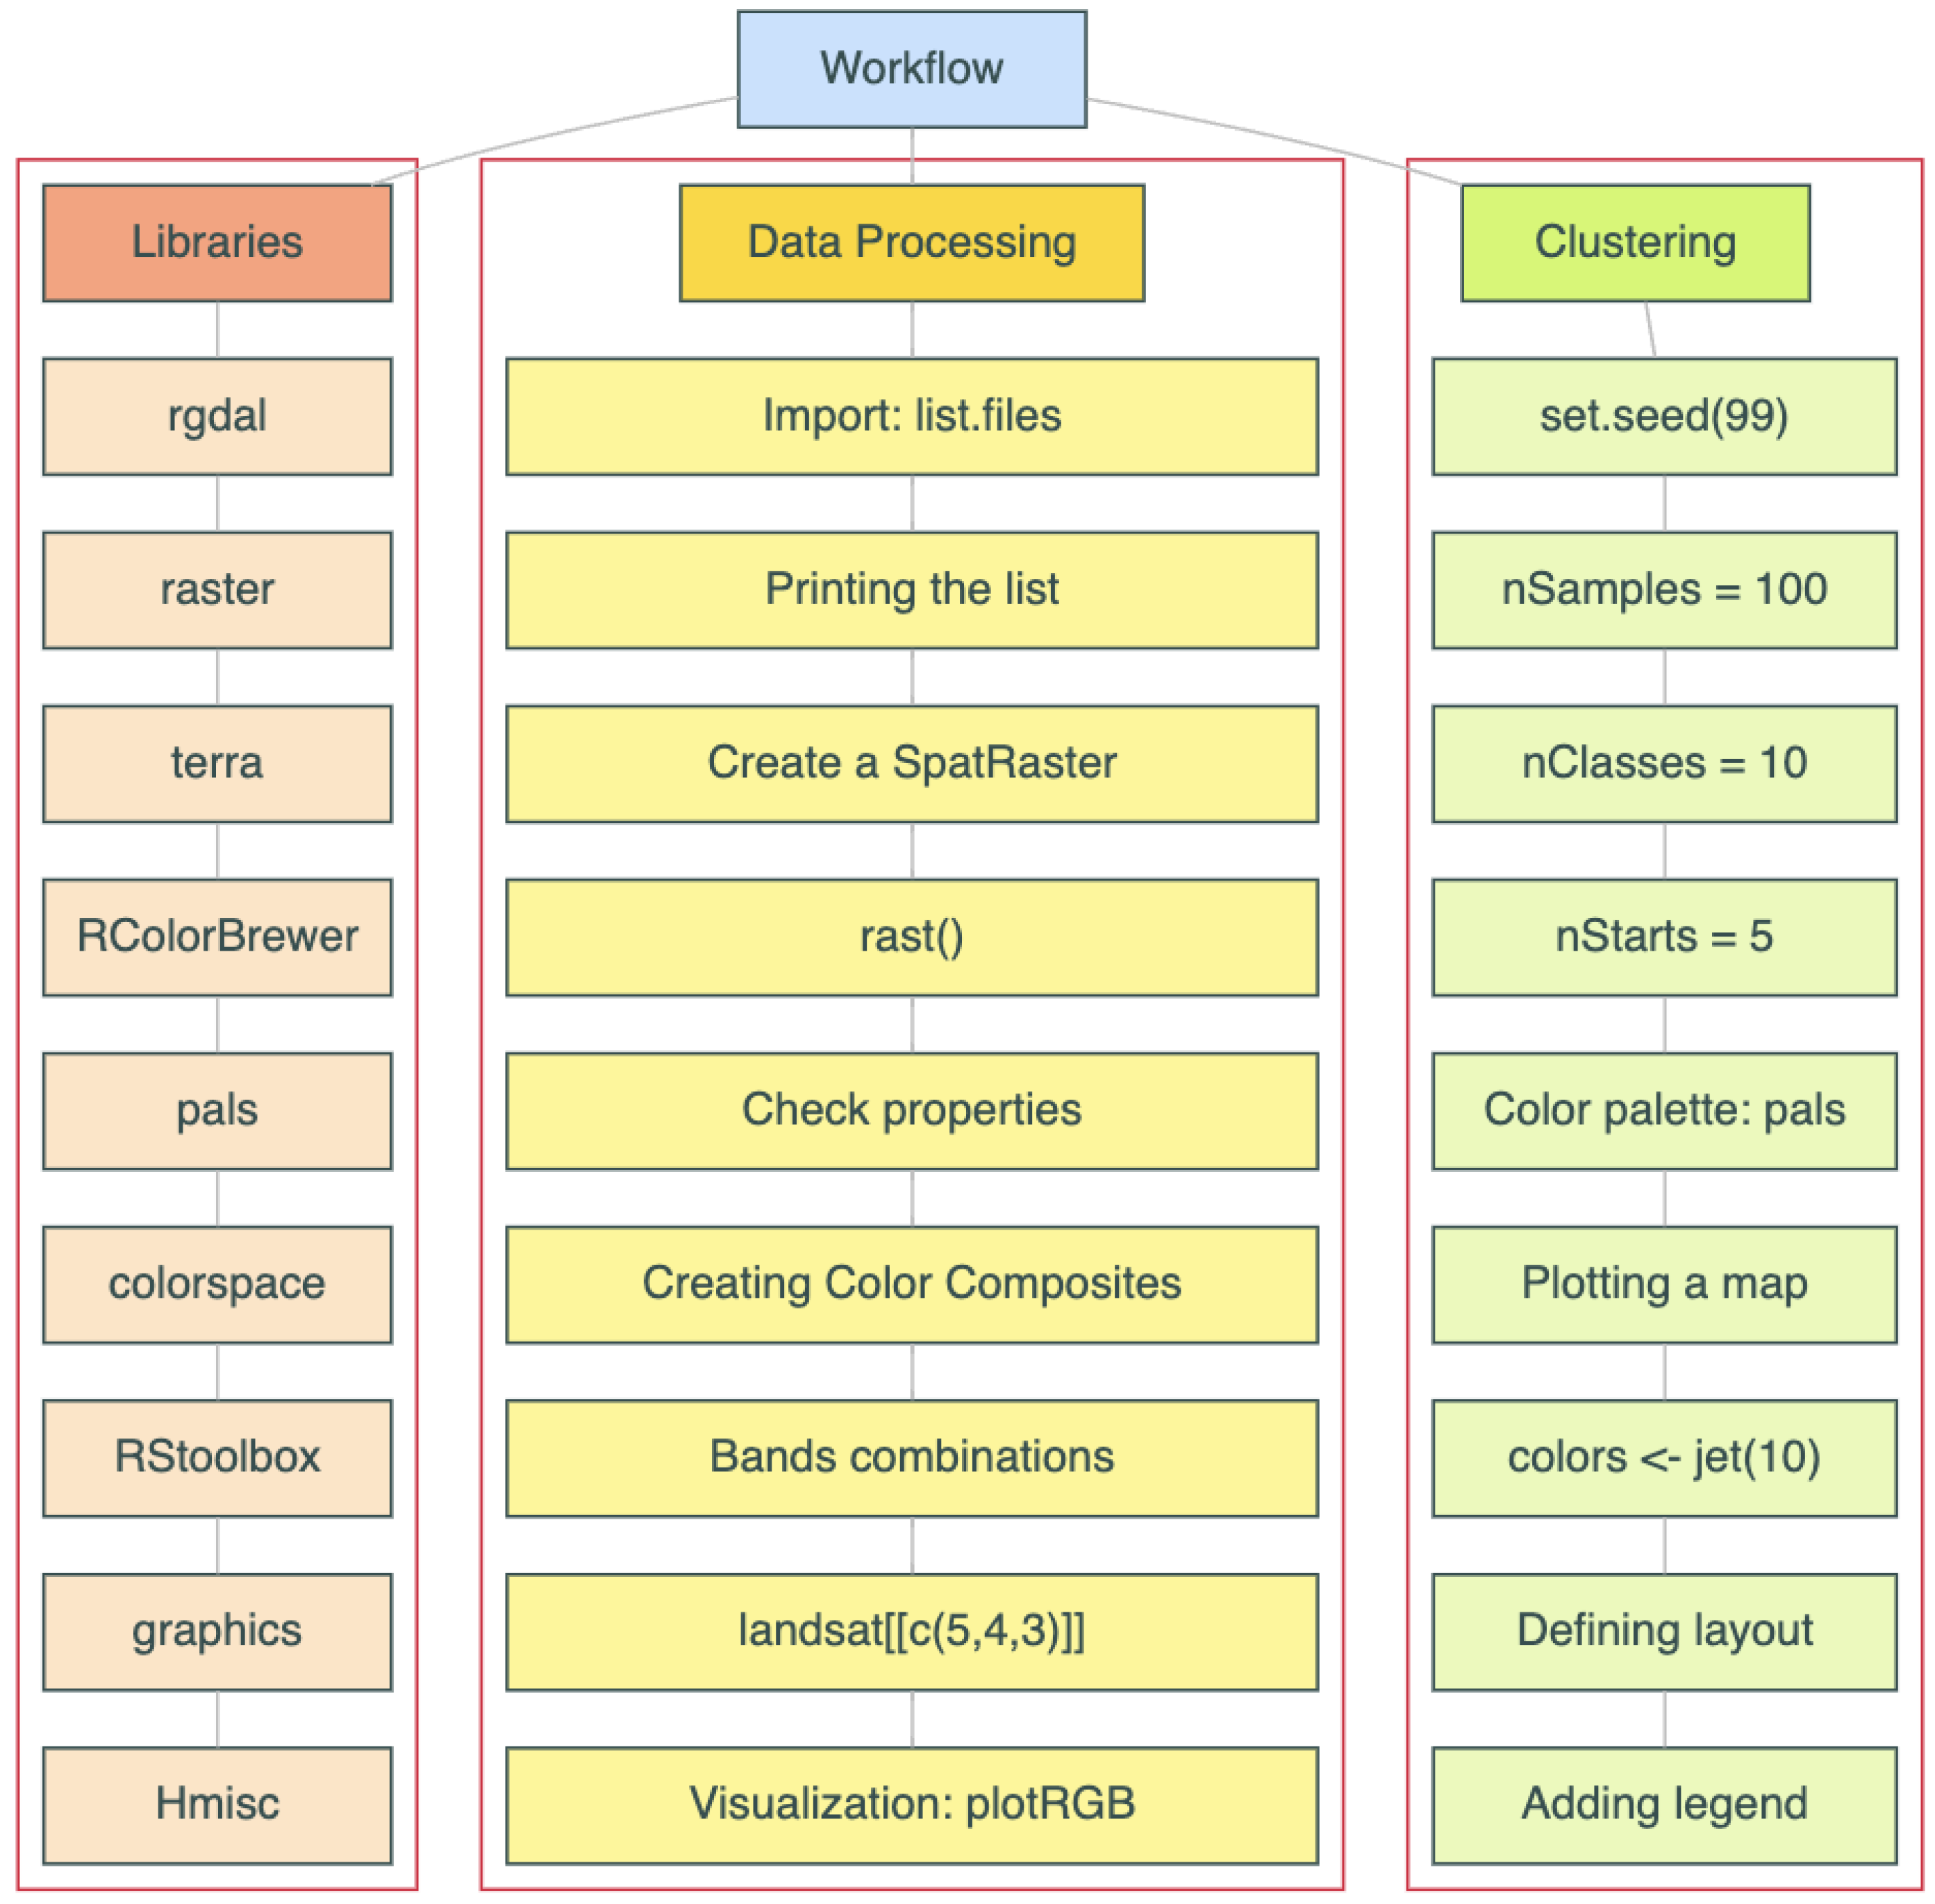
3.2.1. Research Concept and Advantages
3.2.2. Data Processing Workflow
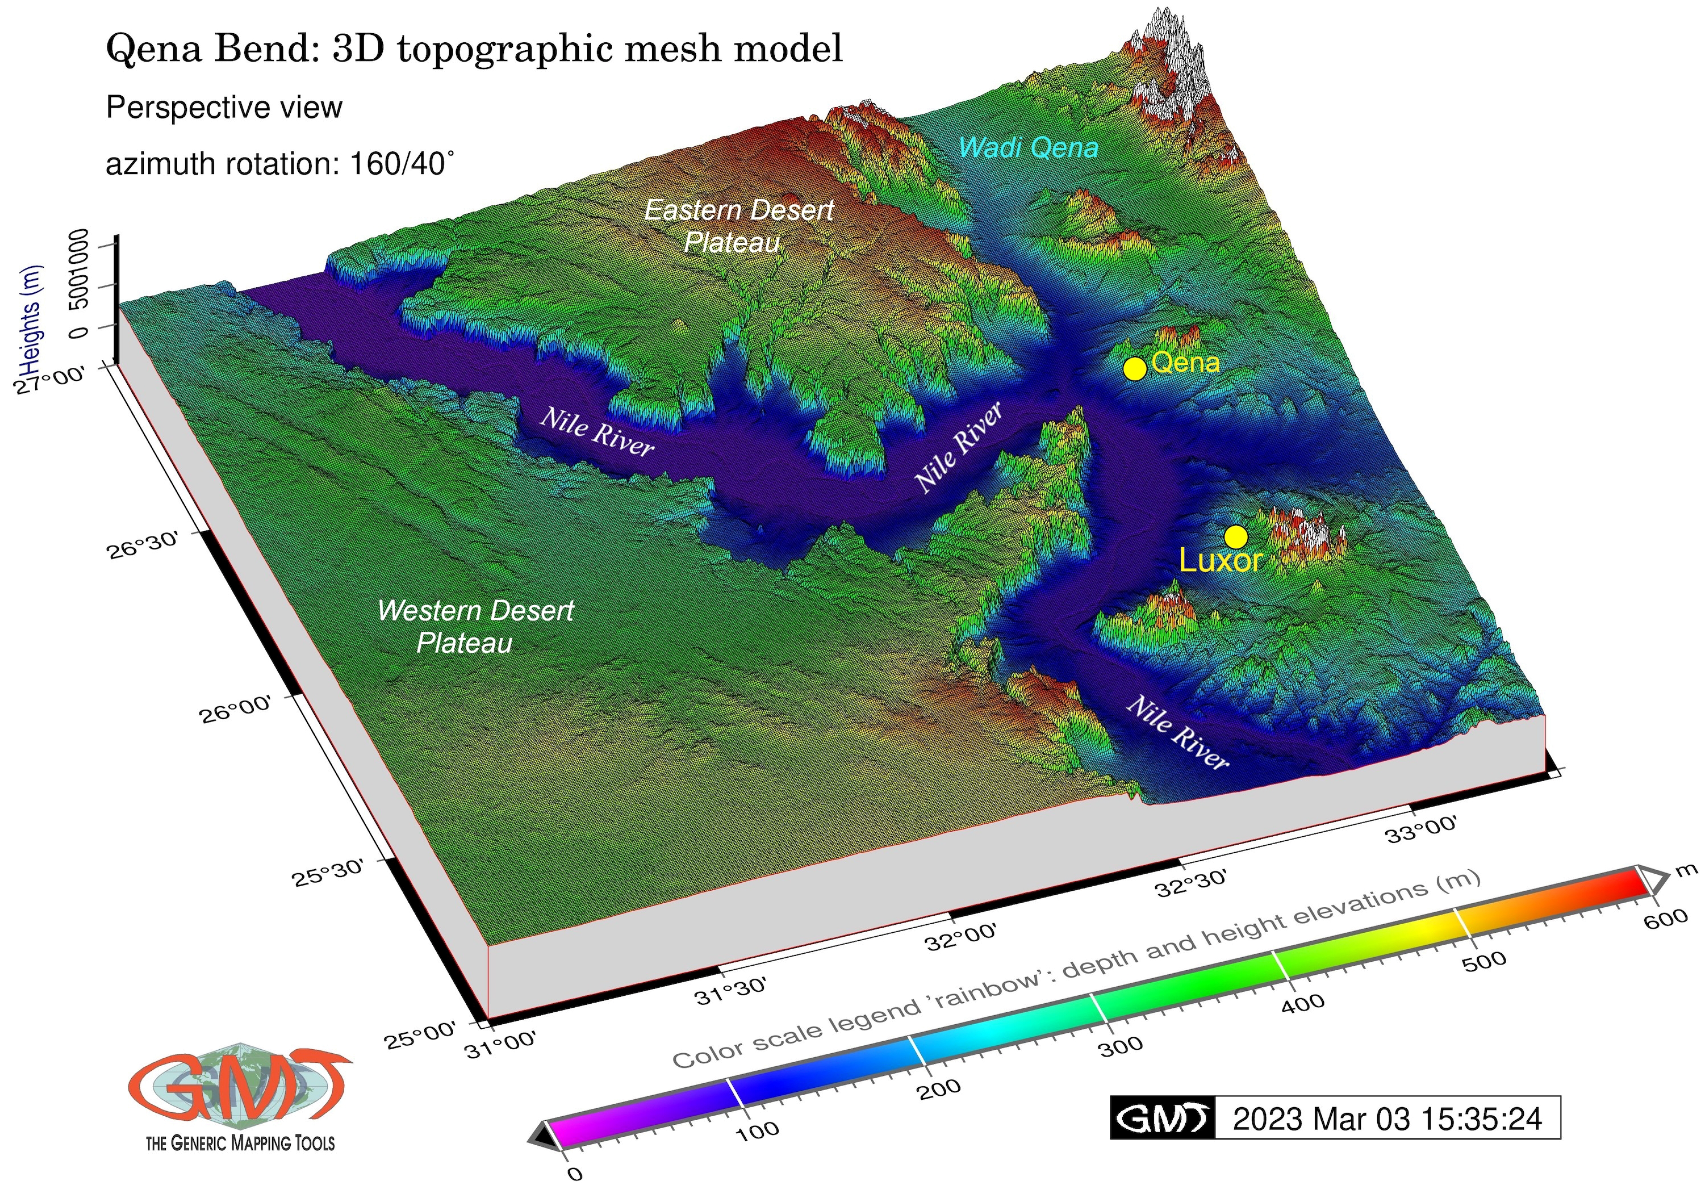
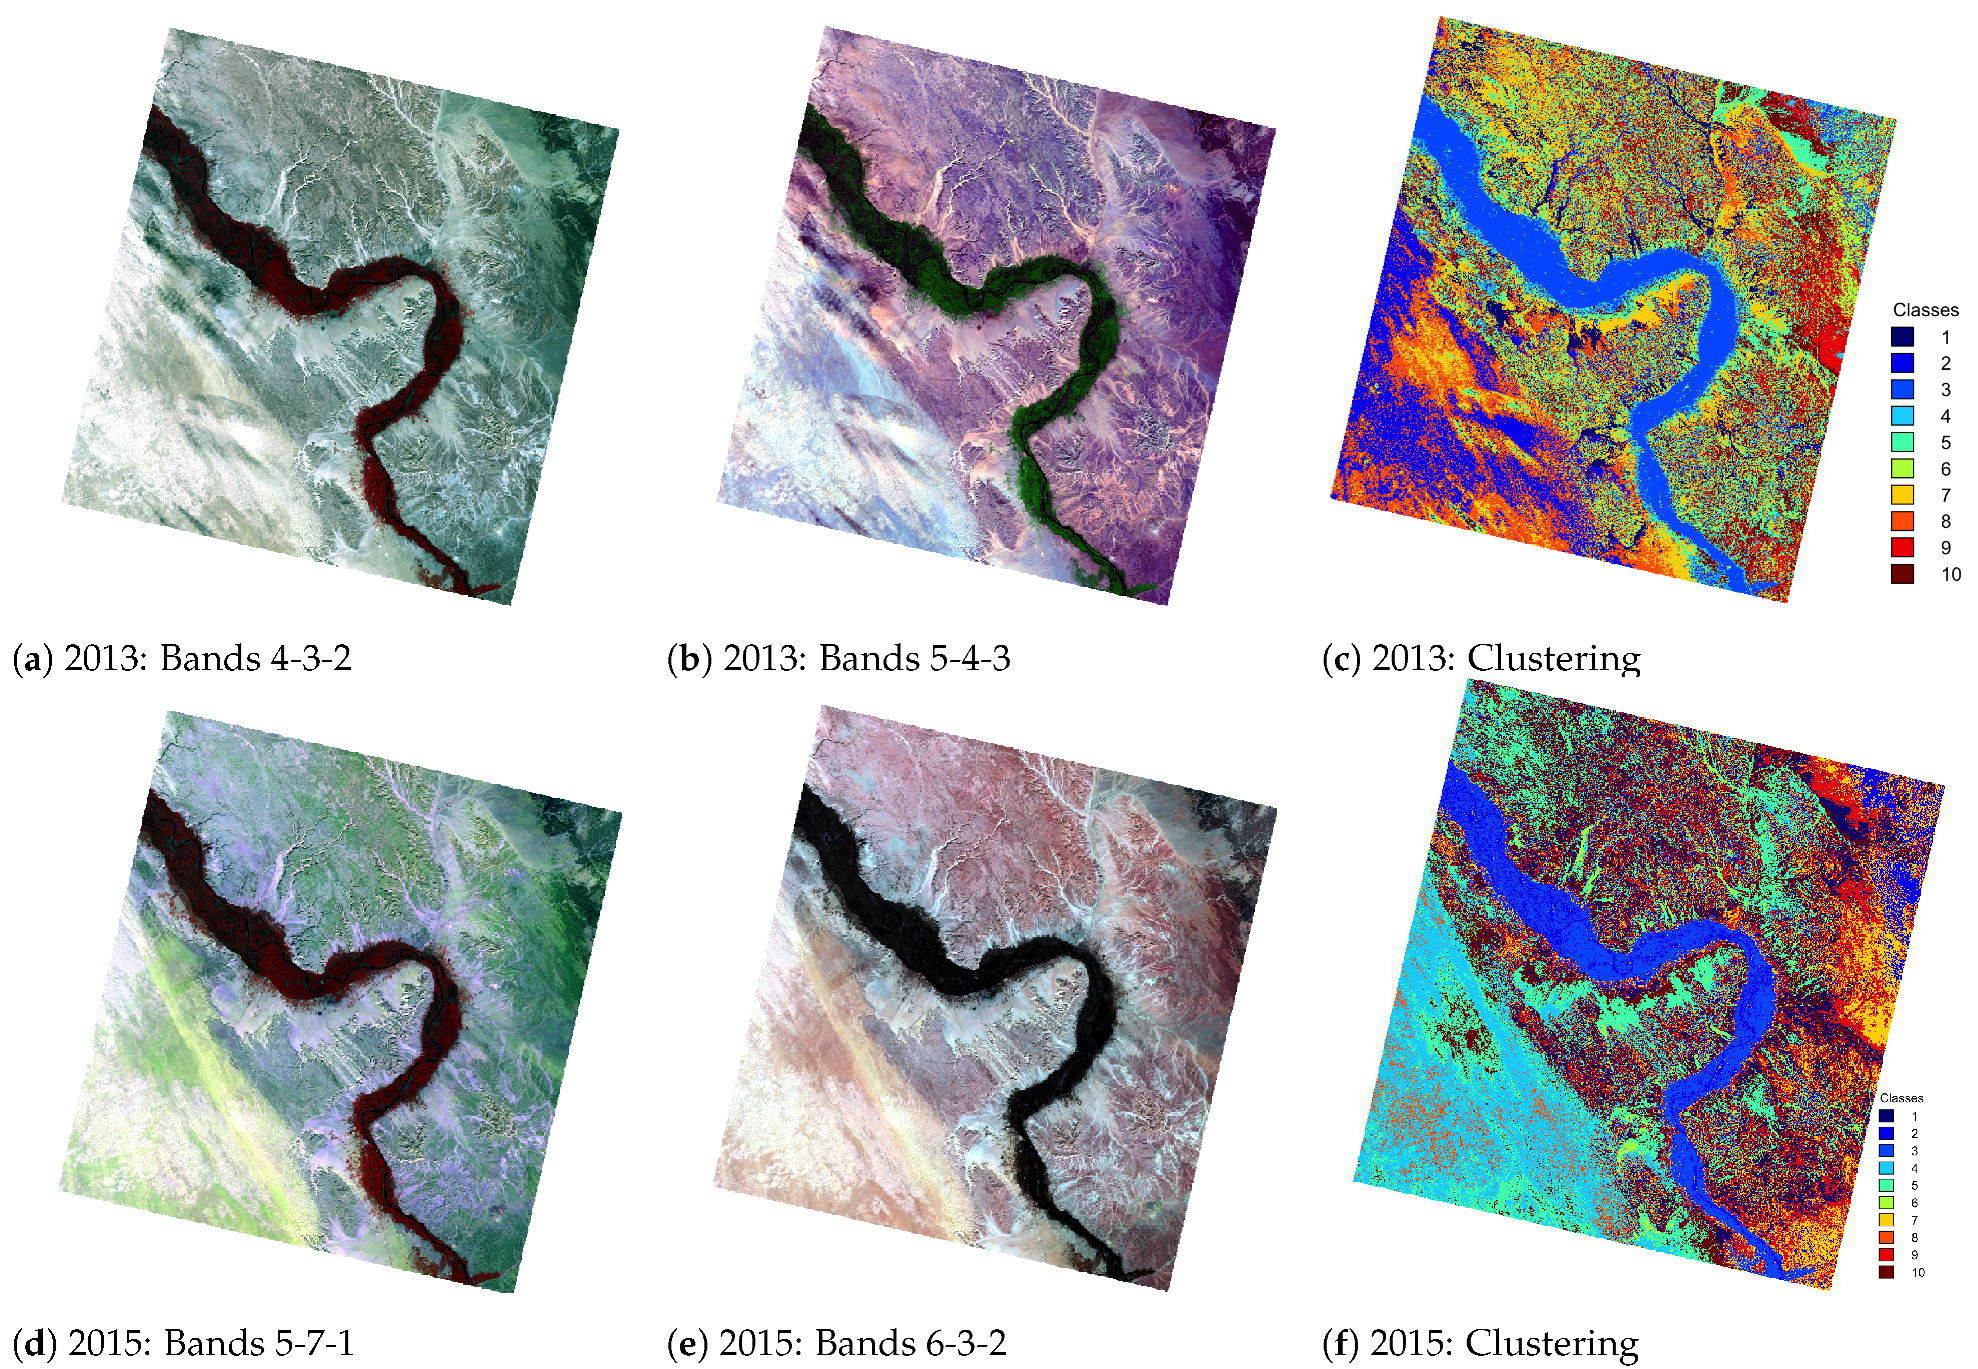
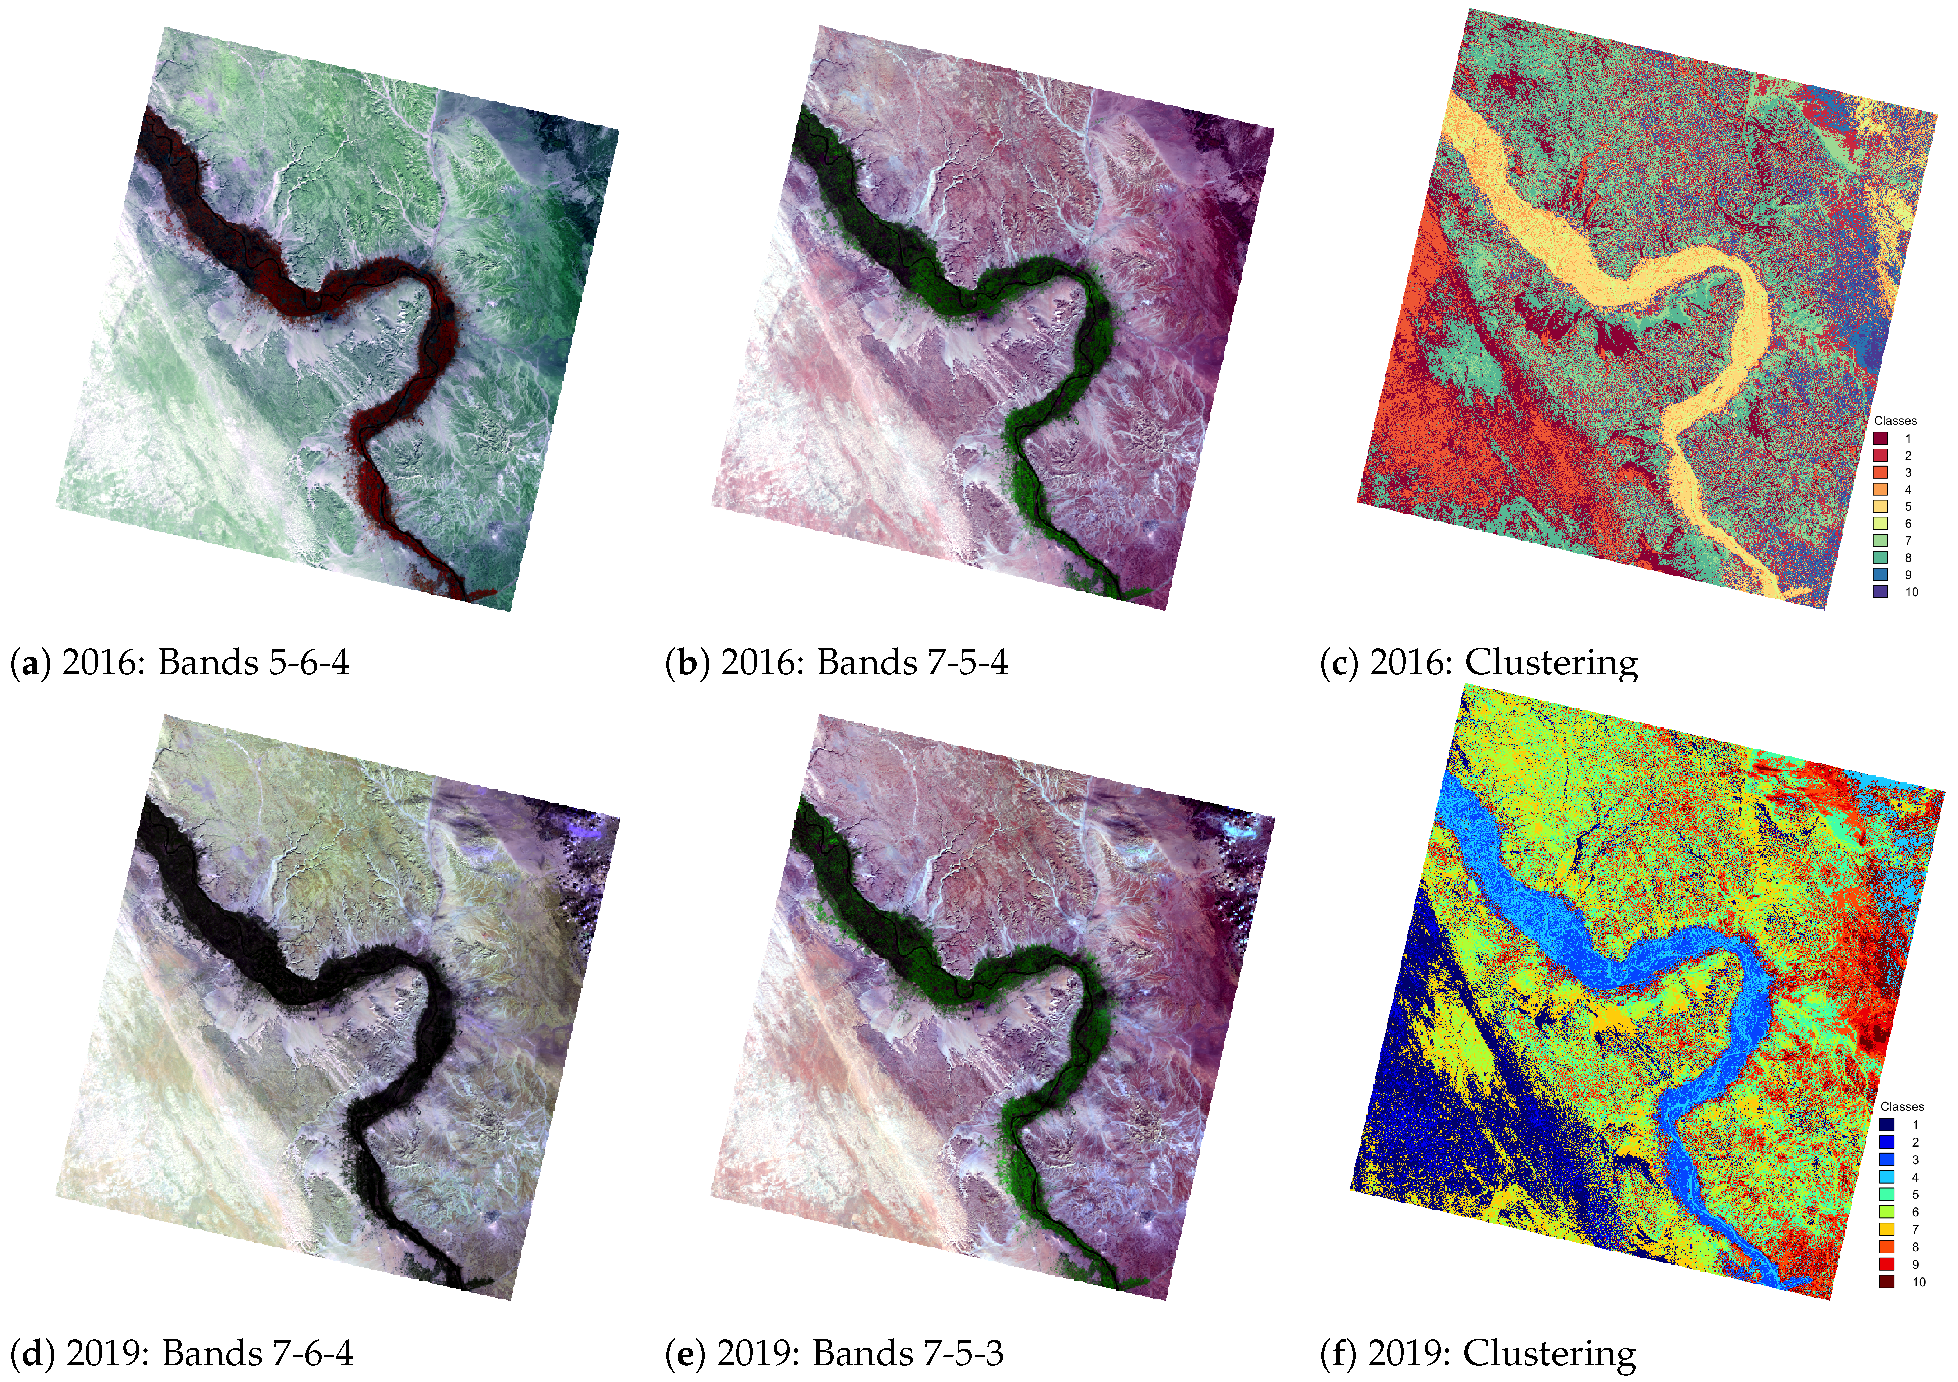
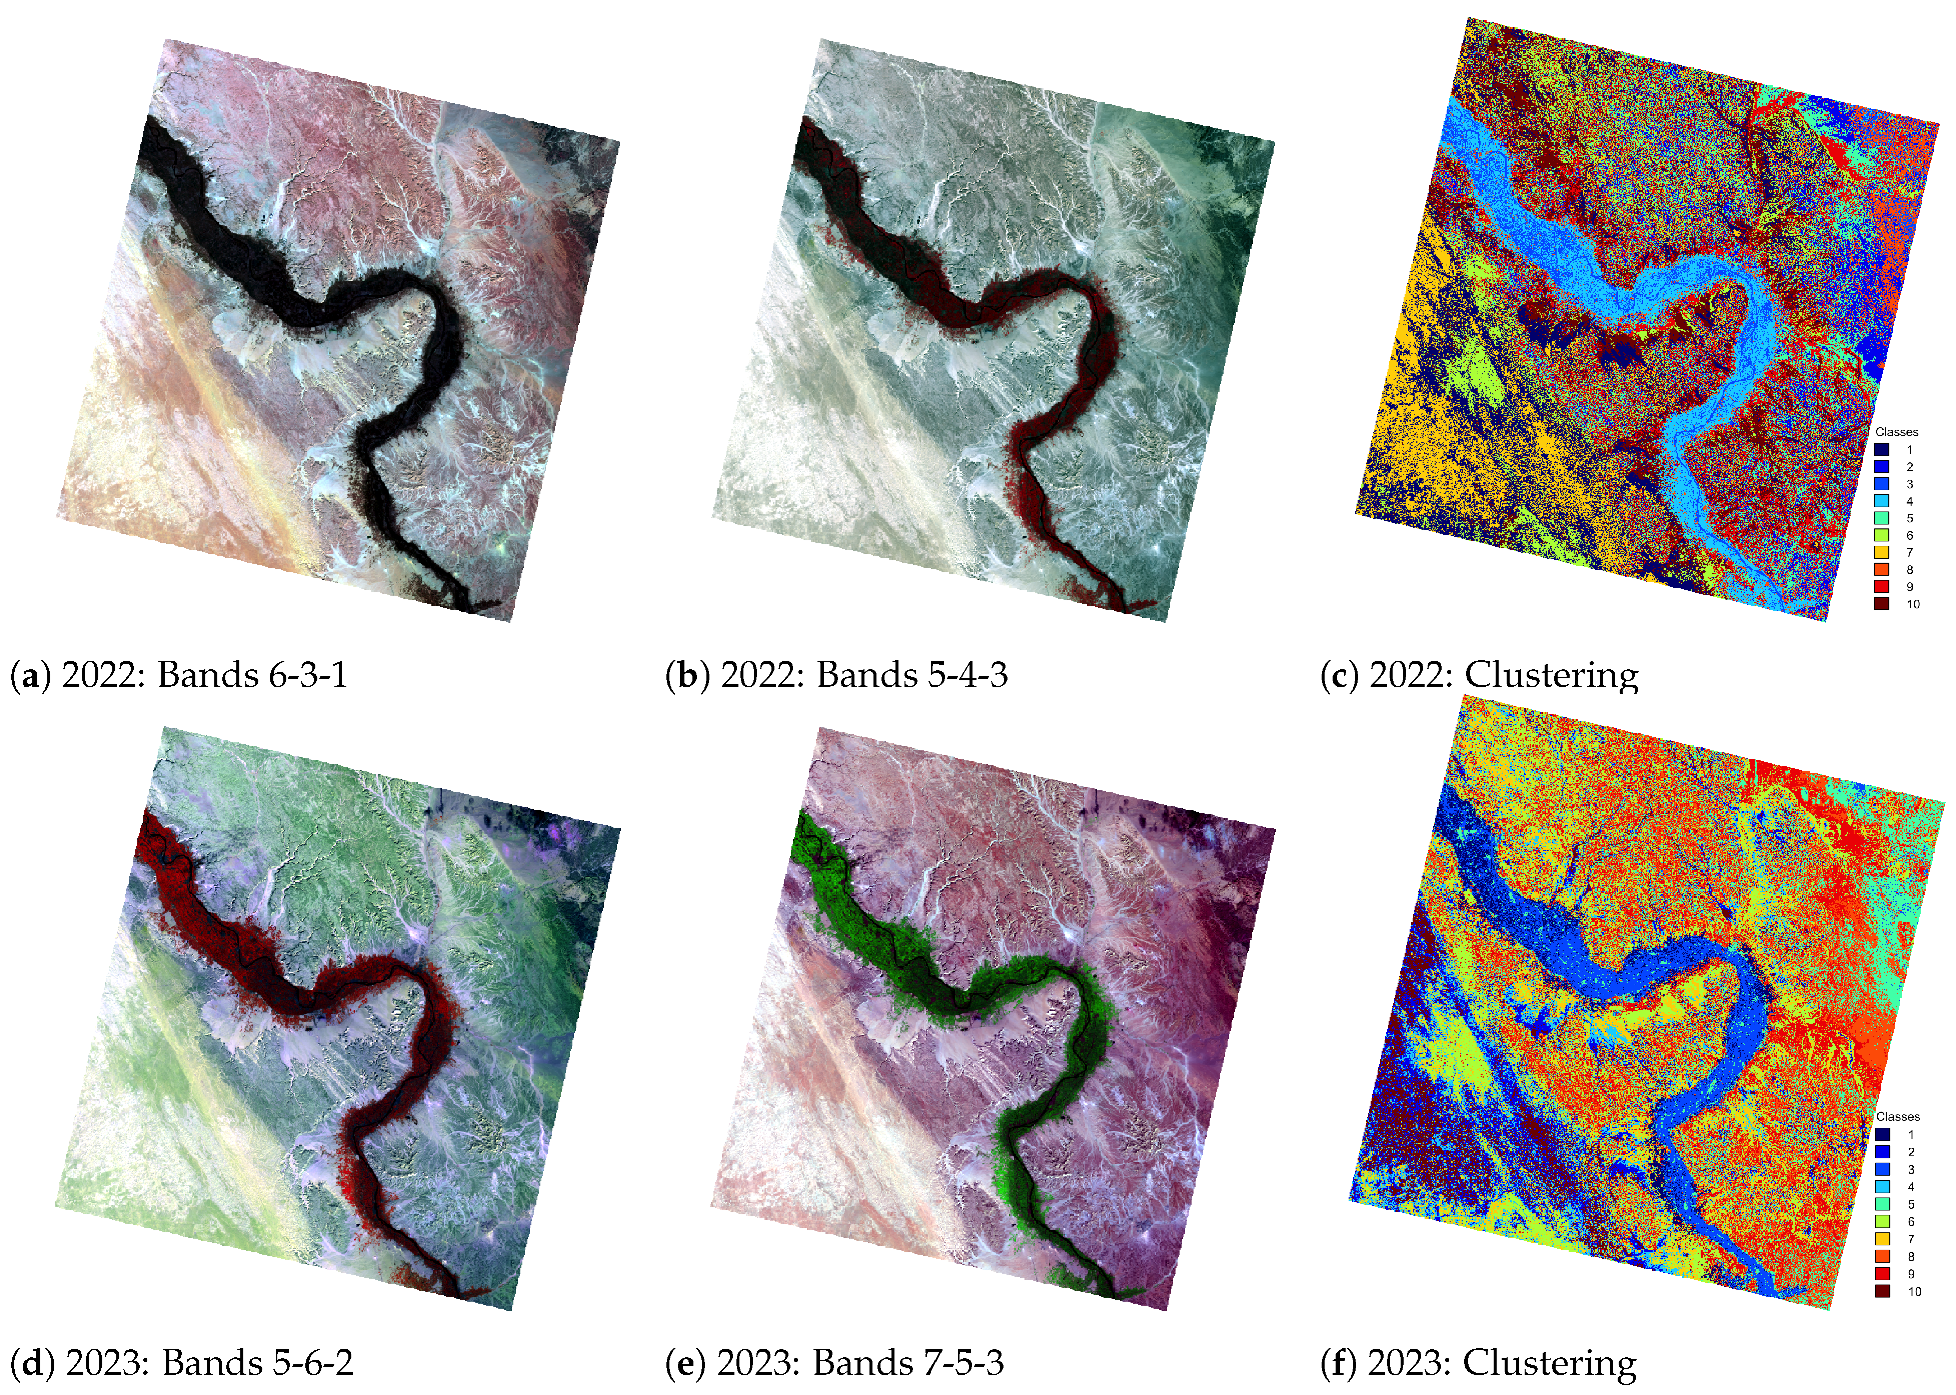
4. Results
5. Discussion
6. Conclusions
Author Contributions
Funding
Institutional Review Board Statement
Informed Consent Statement
Data Availability Statement
Acknowledgments
Conflicts of Interest
Abbreviations
| ASTER | Advanced Spaceborne Thermal Emission and Reflection Radiometer |
| DBSCAN | Density-Based Spatial Clustering of Applications with Noise |
| GEBCO | General Bathymetric Chart of the Oceans |
| GMT | Generic Mapping Tools |
| GIS | Geographic Information System |
| Landsat OLI/TIRS | Landsat Operational Land Imager Thermal Infrared Sensor |
| NIR | Near Infrared |
| RGB | Red Green Blue |
| SRTM | Shuttle Radar Topography Mission |
| SWIR | Shortwave Infrared |
| DEM | Digital Elevation Model |
| UTM | Universal Transverse Mercator |
| WGS84 | World Geodetic System 1984 |
References
- Abdelkareem, M.; Kamal El-Din, G.M.; Osman, I. An integrated approach for mapping mineral resources in the Eastern Desert of Egypt. Int. J. Appl. Earth Obs. Geoinf. 2018, 73, 682–696. [Google Scholar] [CrossRef]
- Ramadan, T.; Sultan, S. Integration of geological, remote sensing and geophysical data for the identification of massive sulphide zones at Wadi Allaqi area, South Eastern Desert, Egypt. In Proceedings of the IGARSS 2003—2003 IEEE International Geoscience and Remote Sensing Symposium—Proceedings (IEEE Cat. No.03CH37477), Toulouse, France, 21–25 July 2003; Volume 4, pp. 2589–2592. [Google Scholar] [CrossRef]
- Zoheir, B.; Emam, A.; Abdel-Wahed, M.; Soliman, N. Multispectral and Radar Data for the Setting of Gold Mineralization in the South Eastern Desert, Egypt. Remote Sens. 2019, 11, 1450. [Google Scholar] [CrossRef]
- El-Khattib, H.; El-Mowelhi, N.; El-Salam, A. Desertification and land degradation using high resolution satellite data in the Nile Delta, Egypt. In Proceedings of the IGARSS’97—1997 IEEE International Geoscience and Remote Sensing Symposium Proceedings—Remote Sensing—A Scientific Vision for Sustainable Development, Singapore, 3–8 August 1997; Volume 1, pp. 197–199. [Google Scholar] [CrossRef]
- Lemenkova, P.; Debeir, O. Satellite Image Processing by Python and R Using Landsat 9 OLI/TIRS and SRTM DEM Data on Côte d’Ivoire, West Africa. J. Imaging 2022, 8, 317. [Google Scholar] [CrossRef] [PubMed]
- El-Khattib, H.; El-Mowelhi, N.; Hawela, F. Monitoring land cover of the desert fringes of the eastern Nile Delta, Egypt. In Proceedings of the IGARSS ’96—1996 International Geoscience and Remote Sensing Symposium, Lincoln, NE, USA, 31 May 1996; Volume 3, pp. 1756–1758. [Google Scholar] [CrossRef]
- Lemenkova, P.; Debeir, O. R Libraries for Remote Sensing Data Classification by k-means Clustering and NDVI Computation in Congo River Basin, DRC. Appl. Sci. 2022, 12, 12554. [Google Scholar] [CrossRef]
- Kaiser, M.F. GIS data integration for SRTM -Landsat ETM+-RADARSAT-1 images to delineat subsurface paleolakes, Wadi Watir area, Egypt. In Proceedings of the 2013 IEEE International Geoscience and Remote Sensing Symposium—IGARSS, Melbourne, VIC, Australia, 21–26 July 2013; pp. 3594–3597. [Google Scholar] [CrossRef]
- Kamel, M.; Tolba, A.; AbuBakr, M.M.; Omar, M.M. Utilization of Landsat-8 data for lithological mapping of neoproterozoic basement rocks in north Qena-Safaga road, North Eastern Desert, Egypt. J. Afr. Earth Sci. 2022, 186, 104420. [Google Scholar] [CrossRef]
- Mohamed, S.A. Application of satellite image processing and GIS-Spatial modeling for mapping urban areas prone to flash floods in Qena governorate, Egypt. J. Afr. Earth Sci. 2019, 158, 103507. [Google Scholar] [CrossRef]
- Abdalla, F. Mapping of groundwater prospective zones using remote sensing and GIS techniques: A case study from the Central Eastern Desert, Egypt. J. Afr. Earth Sci. 2012, 70, 8–17. [Google Scholar] [CrossRef]
- Lemenkova, P.; Debeir, O. Satellite Altimetry and Gravimetry Data for Mapping Marine Geodetic and Geophysical Setting of the Seychelles and the Somali Sea, Indian Ocean. J. Appl. Eng. Sci. 2022, 12, 191–202. [Google Scholar] [CrossRef]
- Koch, M.; Burkholder, B.; Gaber, A. Identifying suitable areas for agricultural expansion in the Western Desert of Egypt by multisensor data fusion. In Proceedings of the 2012 IEEE International Geoscience and Remote Sensing Symposium, Munich, Germany, 22–27 July 2012; pp. 2683–2686. [Google Scholar] [CrossRef]
- Hamza, E.; Gomaa, M. Optimum Three Bands for Change Detection Using Landsat Images. In Proceedings of the 2020 12th International Conference on Electrical Engineering (ICEENG), Cairo, Egypt, 7–9 July 2020; pp. 293–297. [Google Scholar] [CrossRef]
- Singh, M.; Tyagi, K.D.; Singh, A.; Singh, K.K. Detection of changes in Landsat Images using Hybrid PSO-FCM. Procedia Comput. Sci. 2020, 167, 423–430. [Google Scholar] [CrossRef]
- Hashim, A.; Elkelish, A.; Alhaithloul, H.; El-hadidy, S.M.; Farouk, H. Environmental monitoring and prediction of land use and land cover spatio-temporal changes: A case study from El-Omayed Biosphere Reserve, Egypt. Environ. Sci. Pollut. Res. 2020, 27, 42881–42897. [Google Scholar] [CrossRef]
- Badreldin, N.; Xing, Z.; Goossens, R. The application of satellite-based model and bi-stable ecosystem balance concept to monitor desertification in arid lands, a case study of Sinai Peninsula. Model. Earth Syst. Environ. 2017, 3, 21. [Google Scholar] [CrossRef]
- Kawy, W.; Darwish, K. Assessment of land degradation and implications on agricultural land in Qalyubia Governorate, Egypt. Bull. Natl. Res. Cent. 2019, 43, 70. [Google Scholar] [CrossRef]
- El-Horiny, M.M. Mapping and monitoring of soil salinization using remote sensing and regression techniques: A case study in the Bahariya depression, Western Desert, Egypt. In Proceedings of the IGARSS 2019—2019 IEEE International Geoscience and Remote Sensing Symposium, Yokohama, Japan, 28 July–2 August 2019; pp. 1–4. [Google Scholar] [CrossRef]
- Gad, A. Qualitative and Quantitative Assessment of Land Degradation and Desertification in Egypt Based on Satellite Remote Sensing: Urbanization, Salinization and Wind Erosion. In Environmental Remote Sensing in Egypt; Springer International Publishing: Cham, Switzerland, 2020; pp. 443–497. [Google Scholar] [CrossRef]
- Hereher, M. Environmental monitoring and change assessment of Toshka lakes in southern Egypt using remote sensing. Environ. Earth Sci. 2015, 73, 3623–3632. [Google Scholar] [CrossRef]
- Taha, M.M.; Elbarbary, S.M.; Naguib, D.M.; El-Shamy, I. Flash flood hazard zonation based on basin morphometry using remote sensing and GIS techniques: A case study of Wadi Qena basin, Eastern Desert, Egypt. Remote Sens. Appl. Soc. Environ. 2017, 8, 157–167. [Google Scholar] [CrossRef]
- Elsadek, W.M.; Ibrahim, M.G.; Mahmod, W.E. Runoff hazard analysis of Wadi Qena Watershed, Egypt based on GIS and remote sensing approach. Alex. Eng. J. 2019, 58, 377–385. [Google Scholar] [CrossRef]
- Dinh Duong, N. Decomposition of Landsat 8 OLI Images by Simplified Spectral Patterns for Land Cover Mapping. In Proceedings of the 2018 10th IAPR Workshop on Pattern Recognition in Remote Sensing (PRRS), Beijing, China, 19–20 August 2018; pp. 1–13. [Google Scholar] [CrossRef]
- Wang, M.; Zhang, J.L.; Cao, D.Y. Fusion of multispectral and panchromatic satellite images based on ihs and curvelet transformations. In Proceedings of the 2007 International Conference on Wavelet Analysis and Pattern Recognition, Beijing, China, 2–4 November 2007; Volume 1, pp. 321–325. [Google Scholar] [CrossRef]
- Khafagy, M.; El-Sayed, H.; Darwish, K. Land cover/use change analysis and mapping of Borg El-Arab City, Egypt. Arab. J. Geosci. 2020, 13, 1123. [Google Scholar] [CrossRef]
- Bishta, A. Utilities of Landsat 7 data and selective image processing in characterization of radioactivity zones of Wadi Baba–Wadi Shalal Area, Westcentral Sinai, Egypt. Arab. J. Geosci. 2013, 6, 3513–3526. [Google Scholar] [CrossRef]
- Kusky, T.; Ramadan, T.; Hassaan, M.; Gabr, S. Structural and tectonic evolution of El-Faiyum depression, North Western Desert, Egypt based on analysis of Landsat ETM+, and SRTM Data. J. Earth Sci. 2011, 22, 75–100. [Google Scholar] [CrossRef]
- Salman, A.A.B. Using Landsat imagery interpretation for underground water prospection around Qena Province, Egypt. Int. J. Remote Sens. 1983, 4, 179–189. [Google Scholar] [CrossRef]
- Shalaby, M.; Bishta, A.; Roz, M.; Zalaky, M.E. Integration of Geologic and Remote Sensing Studies for the Discovery of Uranium Mineralization in Some Granite Plutons, Eastern Desert, Egypt. J. King Abdulaziz Univ. 2010, 21, 1–25. [Google Scholar] [CrossRef]
- Yang, L.; Meng, X.; Zhang, X. SRTM DEM and its application advances. Int. J. Remote Sens. 2011, 32, 3875–3896. [Google Scholar] [CrossRef]
- El Bastawesy, M.; Ali, R.R.; Deocampo, D.M.; Al Baroudi, M.S. Detection and Assessment of the Waterlogging in the Dryland Drainage Basins Using Remote Sensing and GIS Techniques. IEEE J. Sel. Top. Appl. Earth Obs. Remote Sens. 2012, 5, 1564–1571. [Google Scholar] [CrossRef]
- Hamdan, A.; Khozyem, H. Morphometric, statistical, and hazard analyses using ASTER data and GIS technique of WADI El-Mathula watershed, Qena, Egypt. Arab. J. Geosci. 2018, 11, 722. [Google Scholar] [CrossRef]
- Issawi, B.; Sallam, E. Rejuvenation of dry paleochannels in arid regions in NE Africa: A geological and geomorphological study. Arab. J. Geosci. 2017, 10, 14. [Google Scholar] [CrossRef]
- Abdalla, F.; Moubark, K.; Abdelkareem, M. Groundwater potential mapping using GIS, linear weighted combination techniques and geochemical processes identification, west of the Qena area, Upper Egypt. J. Taibah Univ. Sci. 2020, 14, 1350–1362. [Google Scholar] [CrossRef]
- Gaber, A.; Amarah, B.A.; Abdelfattah, M.; Ali, S. Investigating the use of the dual-polarized and large incident angle of SAR data for mapping the fluvial and aeolian deposits. Nriag J. Astron. Geophys. 2017, 6, 349–360. [Google Scholar] [CrossRef]
- Lemenkova, P.; Debeir, O. Quantitative Morphometric 3D Terrain Analysis of Japan Using Scripts of GMT and R. Land 2023, 12, 261. [Google Scholar] [CrossRef]
- Abdel-Fattah, M.; Saber, M.; Kantoush, S.A.; Khalil, M.F.; Sumi, T.; Sefelnasr, A.M. A Hydrological and Geomorphometric Approach to Understanding the Generation of Wadi Flash Floods. Water 2017, 9, 553. [Google Scholar] [CrossRef]
- Abdelkareem, M.; El-Baz, F. Integration of optical images and radar data reveal paleohydrological processes west of the Nile, Egypt. Proc. Geol. Soc. Am. Abstr. 2013, 45, 161. [Google Scholar]
- Abdelkareem, M.; El-Baz, F. Remote sensing of paleodrainage systems west of the Nile River, Egypt. Geocarto Int. 2017, 32, 541–555. [Google Scholar] [CrossRef]
- Beshr, A.M.; Kamel Mohamed, A.; ElGalladi, A.; Gaber, A.; El-Baz, F. Structural characteristics of the Qena Bend of the Egyptian Nile River, using remote-sensing and geophysics. Egypt. J. Remote Sens. Space Sci. 2021, 24, 999–1011. [Google Scholar] [CrossRef]
- Kamal El-Din, G.; El-Noby, E.; Abdelkareem, M.; Hamimi, Z. Using multispectral and radar remote sensing data for geological investigation, Qena-Safaga Shear Zone, Eastern Desert, Egypt. Arab. J. Geosci. 2021, 14, 997. [Google Scholar] [CrossRef]
- Moubark, K.; Abdelkareem, M. Characterization and assessment of groundwater resources using hydrogeochemical analysis, GIS, and field data in southern Wadi Qena, Egypt. Arab. J. Geosci. 2018, 11, 598. [Google Scholar] [CrossRef]
- Abd El-Sadek, E.; Elbeih, S.; Negm, A. Coastal and landuse changes of Burullus Lake, Egypt: A comparison using Landsat and Sentinel-2 satellite images. Egypt. J. Remote Sens. Space Sci. 2022, 25, 815–829. [Google Scholar] [CrossRef]
- Ghebrezgabher, M.G.; Yang, T.; Yang, X.; Wang, X.; Khan, M. Extracting and analyzing forest and woodland cover change in Eritrea based on landsat data using supervised classification. Egypt. J. Remote Sens. Space Sci. 2016, 19, 37–47. [Google Scholar] [CrossRef]
- Abdelmalik, K.W. Landsat 8: Utilizing sensitive response bands concept for image processing and mapping of basalts. Egypt. J. Remote Sens. Space Sci. 2020, 23, 263–274. [Google Scholar] [CrossRef]
- Kamel, M.; Youssef, M.; Hassan, M.; Bagash, F. Utilization of ETM+ Landsat data in geologic mapping of wadi Ghadir-Gabal Zabara area, Central Eastern Desert, Egypt. Egypt. J. Remote Sens. Space Sci. 2016, 19, 343–360. [Google Scholar] [CrossRef]
- Eldosouky, A.M.; Sehsah, H.; Elkhateeb, S.O.; Pour, A.B. Integrating aeromagnetic data and Landsat-8 imagery for detection of post-accretionary shear zones controlling hydrothermal alterations: The Allaqi-Heiani Suture zone, South Eastern Desert, Egypt. Adv. Space Res. 2020, 65, 1008–1024. [Google Scholar] [CrossRef]
- Gabr, S.S.; Diab, H.; Abdel Fattah, T.A.; Sadek, M.F.; Khalil, K.I.; Youssef, M.A. Aeromagnetic and Landsat-8 data interpretation for structural and hydrothermal alteration mapping along the Central and Southern Eastern Desert boundary, Egypt. Egypt. J. Remote Sens. Space Sci. 2022, 25, 11–20. [Google Scholar] [CrossRef]
- Bakr, N.; Weindorf, D.; Bahnassy, M.; Marei, S.; El-Badawi, M. Monitoring land cover changes in a newly reclaimed area of Egypt using multi-temporal Landsat data. Appl. Geogr. 2010, 30, 592–605. [Google Scholar] [CrossRef]
- Nasser Mohamed Eid, A.; Olatubara, C.; Ewemoje, T.; Farouk, H.; El-Hennawy, M.T. Coastal wetland vegetation features and digital Change Detection Mapping based on remotely sensed imagery: El-Burullus Lake, Egypt. Int. Soil Water Conserv. Res. 2020, 8, 66–79. [Google Scholar] [CrossRef]
- Ali-Bik, M.W.; Sadek, M.F.; Hassan, S.M. Basement rocks around the eastern sector of Baranis-Aswan Road, Egypt: Remote sensing data analysis and petrology. Egypt. J. Remote Sens. Space Sci. 2022, 25, 113–124. [Google Scholar] [CrossRef]
- Ali-Bik, M.W.; Hassan, S.M. Remote sensing-based mapping of the Wadi Sa’al-Wadi Zaghara basement rocks, southern Sinai, Egypt. Egypt. J. Remote Sens. Space Sci. 2022, 25, 593–607. [Google Scholar] [CrossRef]
- Hossen, H.; Negm, A. Change Detection in the Water Bodies of Burullus Lake, Northern Nile Delta, Egypt, Using RS/GIS. Procedia Eng. 2016, 154, 951–958. [Google Scholar] [CrossRef]
- Said, R. The Geological Evolution of the River Nile, 1st ed.; Springer: New York, NY, USA, 1981; 159p. [Google Scholar] [CrossRef]
- Said, R. The Geology of Egypt; Routledge: New York, NY, USA, 2017. [Google Scholar]
- Paulissen, E.; Vermeersch, P.M. Earth, Man and Climate in the Egyptian Nile Valley During the Pleistocene. In Prehistory of Arid North Africa; Southern Methodist University Press: Dallas, TX, USA, 1987; pp. 1–29. [Google Scholar]
- Abdelhamid, M.A.M. Middle–upper Cenomanian echinoids from north Wadi Qena, North Eastern Desert, Egypt. Cretac. Res. 2014, 50, 138–170. [Google Scholar] [CrossRef]
- Soliman, M.A.; Habib, M.E.; Ahmed, E.A. Sedimentologic and tectonic evolution of the Upper Cretaceous-Lower Tertiary succession at Wadi Qena, Egypt. Sediment. Geol. 1986, 46, 111–133. [Google Scholar] [CrossRef]
- Mandur, M.M.; Hewaidy, A.G.A.; Farouk, S.; El Agroudy, I.S. Implications of calcareous nannofossil biostratigraphy, biochronology, paleoecology, and sequence stratigraphy of the Paleocene-Eocene of the Wadi Qena, Egypt. J. Afr. Earth Sci. 2022, 193, 104594. [Google Scholar] [CrossRef]
- Sehim, A. Cretaceous tectonics in Egypt. Egypt. J. Geol. 1993, 37, 335–372. [Google Scholar]
- Moawad, M.B.; Aziz, A.O.A.; Mamtimin, B. Flash floods in the Sahara: A case study for the 28 January 2013 flood in Qena, Egypt. Geomat. Nat. Hazards Risk 2016, 7, 215–236. [Google Scholar] [CrossRef]
- El-Fakharany, M. Drainage Basins And Flash Floods Management In The Area Southeast Qena, Eastern Desert, Egypt. Egypt. J. Geol. 1998, 42, 737–750. [Google Scholar]
- El-Haddad, B.; Youssef, A.; Pourghasemi, H.; Pradhan, B.; El-Shater, A.H.; El-Khashab, M.H. Flood susceptibility prediction using four machine learning techniques and comparison of their performance at Wadi Qena Basin, Egypt. Nat. Hazards 2021, 105, 83–114. [Google Scholar] [CrossRef]
- Elsadek, W.; Ibrahim, M.; Mahmod, W.; Kanae, S. Developing an overall assessment map for flood hazard on large area watershed using multi-method approach: Case study of Wadi Qena watershed, Egypt. Nat. Hazards 2019, 95, 739–767. [Google Scholar] [CrossRef]
- Abdalla, F.; Shamy, I.; Bamousa, A.; Mansour, A.; Mohamed, A.; Tahoon, M. Flash Floods and Groundwater Recharge Potentials in Arid Land Alluvial Basins, Southern Red Sea Coast, Egypt. Int. J. Geosci. 2014, 5, 971–982. [Google Scholar] [CrossRef]
- El Osta, M.; El Sabri, M.; Masoud, M. Environmental sensitivity of flash flood hazard based on surface water model and GIS techniques in Wadi El Azariq, Sinai, Egypt. Environ. Technol. Innov. 2021, 22, 101522. [Google Scholar] [CrossRef]
- Abdel-Lattif, A.; Sherief, Y. Morphometric analysis and flash floods of Wadi Sudr and Wadi Wardan, Gulf of Suez, Egypt: Using digital elevation model. Arab. J. Geosci. 2012, 5, 181–195. [Google Scholar] [CrossRef]
- El-Magd, S.; Pradhan, B.; Alamri, A. Machine learning algorithm for flash flood prediction mapping in Wadi El-Laqeita and surroundings, Central Eastern Desert, Egypt. Arab. J. Geosci. 2021, 14, 323. [Google Scholar] [CrossRef]
- Bandel, K.; Kuss, J.; Malchus, N. The sediments of Wadi Qena (Eastern Desert, Egypt). J. Afr. Earth Sci. (1983) 1987, 6, 427–455. [Google Scholar] [CrossRef]
- Alkholy, A.; Saleh, A.; Ghazala, H.; Deep, M.A.; Mekkawi, M. Groundwater exploration using drainage pattern and geophysical data: A case study from Wadi Qena, Egypt. Arab. J. Geosci. 2023, 16, 92. [Google Scholar] [CrossRef]
- Abdel Moneim, A.; Seleem, E.; Zeid, S.a. Hydrogeochemical characteristics and age dating of groundwater in the Quaternary and Nubian aquifer systems in Wadi Qena, Eastern Desert, Egypt. Sustain. Water Resour. Manag. 2015, 1, 213–232. [Google Scholar] [CrossRef]
- Hussien, H.M.; Kehew, A.E.; Aggour, T.; Korany, E.; Abotalib, A.Z.; Hassanein, A.; Morsy, S. An integrated approach for identification of potential aquifer zones in structurally controlled terrain: Wadi Qena basin, Egypt. CATENA 2017, 149, 73–85. [Google Scholar] [CrossRef]
- Abdel Moneim, A. Overview of the geomorphological and hydrogeological characteristics of the Eastern Desert of Egypt. Hydrogeol. J. 2005, 13, 416–425. [Google Scholar] [CrossRef]
- Ali, M.; Ali, M.Y.; Abdelhady, A.; Fairhead, J.D. Tectonic evolution and subsidence history of the Cretaceous basins in southern Egypt: The Komombo Basin. Basin Res. 2022, 34, 1731–1762. [Google Scholar] [CrossRef]
- Youssef, M.M. Structural setting of central and south Egypt: An overview. Micropaleontology 2003, 49, 1–13. [Google Scholar] [CrossRef]
- Said, R. The Nile in Egypt. In The Geological Evolution of the River Nile; Springer: New York, NY, USA, 1981; pp. 12–92. [Google Scholar] [CrossRef]
- Abdelkareem, M.; Ghoneim, E.; El-Baz, F.; Askalany, M. New insight on paleoriver development in the Nile basin of the eastern Sahara. J. Afr. Earth Sci. 2012, 62, 35–40. [Google Scholar] [CrossRef]
- Philobbos, E.R.; Essa, M.A.; Ismail, M.M. Geologic history of the Neogene “Qena Lake” developed during the evolution of the Nile Valley: A sedimentological, mineralogical and geochemical approach. J. Afr. Earth Sci. 2015, 101, 194–219. [Google Scholar] [CrossRef]
- Youssef, A.M.; Pradhan, B.; Gaber, A.F.D.; Buchroithner, M.F. Geomorphological hazard analysis along the Egyptian Red Sea coast between Safaga and Quseir. Nat. Hazards Earth Syst. Sci. 2009, 9, 751–766. [Google Scholar] [CrossRef]
- Elfadaly, A.; Attia, W.; Lasaponara, R. Monitoring the Environmental Risks Around Medinet Habu and Ramesseum Temple at West Luxor, Egypt, Using Remote Sensing and GIS Techniques. J. Archaeol. Method Theory 2018, 25, 587–610. [Google Scholar] [CrossRef]
- Sultan, M.; Arvidson, R.E.; Sturchio, N.C. Mapping of serpentinites in the Eastern Desert of Egypt by using Landsat thematic mapper data. Geology 1986, 14, 995–999. [Google Scholar] [CrossRef]
- Sultan, M.; Arvidson, R.E.; Sturchio, N.C.; Guinness, E.A. Lithologic mapping in arid regions with Landsat thematic mapper data: Meatiq dome, Egypt. Gsa Bull. 1987, 99, 748–762. [Google Scholar] [CrossRef]
- Irons, J.R.; Dwyer, J.L.; Barsi, J.A. The next Landsat satellite: The Landsat Data Continuity Mission. Remote Sens. Environ. 2012, 122, 11–21. [Google Scholar] [CrossRef]
- R Core Team. R: A Language and Environment for Statistical Computing; R Foundation for Statistical Computing: Vienna, Austria, 2022. [Google Scholar]
- Moneim, A. Hydrogeological conditions and aquifers potentiality for sustainable development of the desert areas in Wadi Qena, Eastern Desert, Egypt. Arab. J. Geosci. 2014, 7, 4573–4591. [Google Scholar] [CrossRef]
- Abd El Hameed, A.G.; El-Shayeb, H.M.; El-Araby, N.A.; Hegab, M.G. Integrated geoelectrical and hydrogeological studies on Wadi Qena, Egypt. Nriag J. Astron. Geophys. 2017, 6, 218–229. [Google Scholar] [CrossRef]
- Othman, A.A.; Beshr, A.M.; El-Gawad, A.M.S.A.; Ibraheem, I.M. Hydrogeophysical investigation using remote sensing and geoelectrical data in southeast Hiw, Qena, Egypt. Geocarto Int. 2022, 37, 14241–14260. [Google Scholar] [CrossRef]
- Gaber, A.; Mohamed, A.K.; ElGalladi, A.; Abdelkareem, M.; Beshr, A.M.; Koch, M. Mapping the Groundwater Potentiality of West Qena Area, Egypt, Using Integrated Remote Sensing and Hydro-Geophysical Techniques. Remote Sens. 2020, 12, 1559. [Google Scholar] [CrossRef]
- Azzazy, A.A.; Elhusseiny, A.A.; Zamzam, S. Integrated radioactive mineralization modeling using analytical hierarchy process for airborne radiometric and remote sensing data, East Wadi Qena (EWQ), Eastern Desert, Egypt. J. Appl. Geophys. 2022, 206, 104805. [Google Scholar] [CrossRef]
- Xu, D.; Tian, Y. A Comprehensive Survey of Clustering Algorithms. Ann. Data Sci. 2015, 2, 165–193. [Google Scholar] [CrossRef]
- Chander, B.; Gopalakrishnan, K. 10—Data clustering using unsupervised machine learning. In Statistical Modeling in Machine Learning; Goswami, T., Sinha, G., Eds.; Academic Press: Cambridge, MA, USA, 2023; pp. 179–204. [Google Scholar] [CrossRef]
- Zhiying, X.; Yuanrong, H.; Hanxin, L.; Peng, Y.; Shuanghui, C. Hierarchical clustering for line detection with UAV images and an application for the estimation of the clearance volume of oyster stones. Ecol. Inform. 2023, 73, 101935. [Google Scholar] [CrossRef]
- Xie, W.B.; Liu, Z.; Das, D.; Chen, B.; Srivastava, J. Scalable clustering by aggregating representatives in hierarchical groups. Pattern Recognit. 2023, 136, 109230. [Google Scholar] [CrossRef]
- Zein, A.A.; Dowaji, S.; Al-Khayatt, M.I. Clustering-based method for big spatial data partitioning. Meas. Sens. 2023, 27, 100731. [Google Scholar] [CrossRef]
- Roy, P.; Mandal, J. A Novel Spatial Fuzzy Clustering using Delaunay Triangulation for Large Scale GIS Data (NSFCDT). Procedia Technol. 2012, 6, 452–459. [Google Scholar] [CrossRef]
- Guo, Y.; Şengür, A.; Akbulut, Y.; Shipley, A. An effective color image segmentation approach using neutrosophic adaptive mean shift clustering. Measurement 2018, 119, 28–40. [Google Scholar] [CrossRef]
- Beck, G.; Duong, T.; Lebbah, M.; Azzag, H.; Cérin, C. A distributed approximate nearest neighbors algorithm for efficient large scale mean shift clustering. J. Parallel Distrib. Comput. 2019, 134, 128–139. [Google Scholar] [CrossRef]
- Cheng, D.; Xu, R.; Zhang, B.; Jin, R. Fast density estimation for density-based clustering methods. Neurocomputing 2023, 532, 170–182. [Google Scholar] [CrossRef]
- Maheshwari, R.; Mohanty, S.K.; Mishra, A.C. DCSNE: Density-based Clustering using Graph Shared Neighbors and Entropy. Pattern Recognit. 2023, 137, 109341. [Google Scholar] [CrossRef]
- You, K.; Suh, C. Parameter estimation and model-based clustering with spherical normal distribution on the unit hypersphere. Comput. Stat. Data Anal. 2022, 171, 107457. [Google Scholar] [CrossRef]
- Ouyang, T.; Shen, X. Online structural clustering based on DBSCAN extension with granular descriptors. Inf. Sci. 2022, 607, 688–704. [Google Scholar] [CrossRef]
- Pranata, K.S.; Gunawan, A.A.S.; Gaol, F.L. Development clustering system IDX company with k-means algorithm and DBSCAN based on fundamental indicator and ESG. Procedia Comput. Sci. 2023, 216, 319–327. [Google Scholar] [CrossRef]
- Wu, G.; Cao, L.; Tian, H.; Wang, W. HY-DBSCAN: A hybrid parallel DBSCAN clustering algorithm scalable on distributed-memory computers. J. Parallel Distrib. Comput. 2022, 168, 57–69. [Google Scholar] [CrossRef]
- Fávero, L.P.; Belfiore, P.; de Freitas Souza, R. (Eds.) Chapter 11—Cluster analysis. In Data Science, Analytics and Machine Learning with R; Academic Press: Cambridge, MA, USA, 2023; pp. 193–201. [Google Scholar] [CrossRef]
- Wessel, P.; Luis, J.F.; Uieda, L.; Scharroo, R.; Wobbe, F.; Smith, W.H.F.; Tian, D. The Generic Mapping Tools Version 6. Geochem. Geophys. Geosystems 2019, 20, 5556–5564. [Google Scholar] [CrossRef]
- Lemenkova, P.; Debeir, O. Seismotectonics of Shallow-Focus Earthquakes in Venezuela with Links to Gravity Anomalies and Geologic Heterogeneity Mapped by a GMT Scripting Language. Sustainability 2022, 14, 15966. [Google Scholar] [CrossRef]
- Kamel, M. Monitoring of Land Use and Land Cover Change Detection Using Multi-temporal Remote Sensing and Time Series Analysis of Qena-Luxor Governorates (QLGs), Egypt. J. Indian Soc. Remote Sens. 2020, 48, 1767–1785. [Google Scholar] [CrossRef]
- Sitanggang, I.S.; Pertiwi, D.P.; Agmalaro, M.A. Verifying Haze Dispersion from Peatland Fires using Classified Landsat 8. In Proceedings of the 2018 4th International Symposium on Geoinformatics (ISyG), Malang, Indonesia, 10–12 November 2018; pp. 1–5. [Google Scholar] [CrossRef]
- Hermas, E.; Sadek, M. Triggering upstream channel incision in the fluvial systems of the trunk valley of Wadi Watir drainage basin, South Sinai Peninsula, Egypt. Arab. J. Geosci. 2013, 6, 4057–4068. [Google Scholar] [CrossRef]
- Abdelkareem, M.; El-Baz, F. Evidence of drainage reversal in the NE Sahara revealed by space-borne remote sensing data. J. Afr. Earth Sci. 2015, 110, 245–257. [Google Scholar] [CrossRef]
- Lemenkova, P.; Plaen, R.D.; Lecocq, T.; Debeir, O. Computer Vision Algorithms of DigitSeis for Building a Vectorised Dataset of Historical Seismograms from the Archive of Royal Observatory of Belgium. Sensors 2022, 23, 56. [Google Scholar] [CrossRef] [PubMed]
- ElQadi, M.M.; Lesiv, M.; Dyer, A.G.; Dorin, A. Computer vision-enhanced selection of geo-tagged photos on social network sites for land cover classification. Environ. Model. Softw. 2020, 128, 104696. [Google Scholar] [CrossRef]
- Hussein, H.A.; Rabie, S.I.; Nabi, S.H.A. Regional remapping of the basement complex outcrops, using factor analysis to spectrometric data, of the Gabal Eteiqa, Eastern Desert, Egypt. Int. J. Remote Sens. 1995, 16, 811–823. [Google Scholar] [CrossRef]
- Dhanya, V.; Subeesh, A.; Kushwaha, N.; Vishwakarma, D.K.; Nagesh Kumar, T.; Ritika, G.; Singh, A. Deep learning based computer vision approaches for smart agricultural applications. Artif. Intell. Agric. 2022, 6, 211–229. [Google Scholar] [CrossRef]
- Curran, P.J. Principles of Remote Sensing; Longman Inc.: Harlow, UK, 1985. [Google Scholar]
- Nasr, M.E.; Elkaffas, S.M.; El-Tobely, T.A.; Ragheb, A.M.; El-Samie, F.E.A. An Integrated Image Fusion Technique for Boosting the Quality of Noisy Remote Sensing Images. In Proceedings of the 2007 National Radio Science Conference, Cairo, Egypt, 13–15 March 2007; pp. 1–10. [Google Scholar] [CrossRef]
- Lenney, M.P.; Woodcock, C.E.; Collins, J.B.; Hamdi, H. The status of agricultural lands in Egypt: The use of multitemporal NDVI features derived from landsat TM. Remote Sens. Environ. 1996, 56, 8–20. [Google Scholar] [CrossRef]
- El-Shamy, I. Quantitative geomorphology and surface water conservation in Wadi Matula-Wadi Abbad area, central Eastern Desert. Ann. Geol. Surv. Egypt 1985, 15, 349–358. [Google Scholar]
- Abdelkhalek, A.; King-Okumu, C. Groundwater Exploitation in Mega Projects: Egypt’s 1.5 Million Feddan Project. In Groundwater in Egypt’s Deserts; Springer International Publishing: Cham, Switzerland, 2021; pp. 347–372. [Google Scholar] [CrossRef]
- Abdelkareem, M.; El-Baz, F.; Askalany, M.; Akawy, A.; Ghoneim, E. Groundwater prospect map of Egypt’s Qena Valley using data fusion. Int. J. Image Data Fusion 2012, 3, 169–189. [Google Scholar] [CrossRef]
- Kamal El-Din, G.; Abdelaty, D.; Moubark, K.; Abdelkareem, M. Assessment of the groundwater possibility and its efficiency for irrigation purposes in the area east of Qena, Egypt. Arab. J. Geosci. 2021, 14, 839. [Google Scholar] [CrossRef]
- Abd El Aal, A.K.; Nabawy, B.S.; Aqeel, A.; Abidi, A. Geohazards assessment of the karstified limestone cliffs for safe urban constructions, Sohag, West Nile Valley, Egypt. J. Afr. Earth Sci. 2020, 161, 103671. [Google Scholar] [CrossRef]


| Date | Spacecraft | Landsat Product ID | Scene ID | Cloudiness |
|---|---|---|---|---|
| 16 November 2013 | Landsat 8 | LC08_L2SP_175042_20131116_20200912_02_T1 | LC81750422013320LGN01 | 0.89 |
| 22 November 2015 | Landsat 8 | LC08_L2SP_175042_20151122_20200908_02_T1 | LC81750422015326LGN01 | 0.05 |
| 8 November 2016 | Landsat 8 | LC08_L2SP_175042_20161108_20200905_02_T1 | LC81750422016313LGN01 | 0.31 |
| 17 November 2019 | Landsat 8 | LC08_L2SP_175042_20191117_20200825_02_T1 | LC81750422019321LGN00 | 1.16 |
| 9 November 2022 | Landsat 8 | LC08_L2SP_175042_20221109_20221121_02_T1 | LC81750422022313LGN00 | 0.02 |
| 20 January 2023 | Landsat 9 | LC09_L2SP_175042_20230120_20230122_02_T1 | LC91750422023020LGN01 | 0.32 |
| Class ID | 2013 | 2015 | 2016 | 2019 | 2022 | 2023 |
|---|---|---|---|---|---|---|
| 1 | 6,237,758.6 | 25,058,427 | 11,830,859 | 11,050,520 | 33,773,365.2 | 22,414,794 |
| 2 | 26,530,972.6 | 3,829,403 | 6,847,520 | 7,687,698 | 21,467,288.5 | 4,080,038 |
| 3 | 46,356,528.0 | 23,160,871 | 13,056,437 | 31,925,587 | 466,472.5 | 13,918,989 |
| 4 | 10,314,256.8 | 7,458,695 | 12,594,525 | 3,359,878 | 3,547,592.0 | 1,863,680 |
| 5 | 7,861,914.8 | 9,909,609 | 3,012,708 | 11,101,016 | 7,714,730.1 | 6,083,803 |
| 6 | 625,035.3 | 4,568,955 | 2,195,275 | 14,290,386 | 9,346,294.4 | 14,743,313 |
| 7 | 22,694,195.3 | 3,019,950 | 12,277,811 | 14,898,378 | 6,978,872.8 | 6,370,890 |
| 8 | 5,804,917.1 | 1,942,973 | 10,144,633 | 5,386,949 | 16,906,933.2 | 6,053,497 |
| 9 | 7,320,502.4 | 13,450,745 | 3,220,846 | 5,501,193 | 8,429,786.2 | 11,952,344 |
| 10 | 6,121,676.5 | 10,228,437 | 4,195,904 | 10,594,134 | 11,161,798.4 | 10,517,903 |
| Class ID | 2013 | 2015 | ||||
|---|---|---|---|---|---|---|
| Band 5 | Band 4 | Band 3 | Band 5 | Band 4 | Band 3 | |
| 1 | 21,019.08 | 18,348.92 | 15,722.58 | 19,819.50 | 17,226.143 | 14,765.14 |
| 2 | 21,956.38 | 19,148.12 | 16,294.50 | 12,087.00 | 10,917.333 | 10,115.00 |
| 3 | 26,892.38 | 23,105.00 | 19,120.92 | 18,736.17 | 9956.333 | 10,142.17 |
| 4 | 14,308.50 | 13,163.75 | 11,730.75 | 24,835.46 | 21,496.385 | 17,990.38 |
| 5 | 19,246.50 | 16,942.69 | 14,626.81 | 23,315.56 | 20,178.688 | 17,043.31 |
| 6 | 17,656.18 | 15,405.09 | 13,460.00 | 26,302.78 | 22,807.222 | 19,156.67 |
| 7 | 23,465.45 | 20,280.18 | 17,179.82 | 15,028.50 | 13,507.500 | 12,109.33 |
| 8 | 16,549.67 | 10,211.17 | 10,132.83 | 29,412.00 | 25,219.500 | 20,731.50 |
| 9 | 22,484.00 | 19,481.25 | 16,802.50 | 17,737.46 | 15,833.385 | 13,783.23 |
| 10 | 24,895.53 | 21,740.20 | 18,326.47 | 17,737.46 | 18,747.389 | 15,990.33 |
| Class ID | 2016 | 2019 | ||||
|---|---|---|---|---|---|---|
| Band 5 | Band 4 | Band 3 | Band 5 | Band 4 | Band 3 | |
| 1 | 25,067.53 | 21,805.82 | 18,283.65 | 20,721.42 | 18,438.42 | 15,725.33 |
| 2 | 19,837.27 | 17,506.45 | 15,060.45 | 24,198.84 | 21,005.26 | 17,763.84 |
| 3 | 27,148.44 | 23,483.89 | 19,596.67 | 25,536.93 | 22,109.73 | 18,481.20 |
| 4 | 16,049.43 | 13,237.00 | 11,880.43 | 18,257.00 | 9376.75 | 9707.50 |
| 5 | 19,541.25 | 9323.50 | 9742.75 | 14,476.67 | 12,599.83 | 11,411.17 |
| 6 | 12,780.50 | 11,767.00 | 10,670.50 | 16,992.00 | 15,236.88 | 13,304.75 |
| 7 | 21,370.47 | 18,891.65 | 16,208.94 | 18,829.53 | 16,928.47 | 14,654.00 |
| 8 | 23,122.89 | 20,069.28 | 16,927.33 | 31,113.00 | 26,355.00 | 21,077.00 |
| 9 | 18,240.88 | 16,536.62 | 14,205.25 | 27,920.00 | 23,667.00 | 19,115.00 |
| 10 | 17,269.14 | 15,186.43 | 13,284.43 | 22,736.25 | 19,858.25 | 16,938.06 |
| Class ID | 2022 | 2023 | ||||
|---|---|---|---|---|---|---|
| Band 5 | Band 4 | Band 3 | Band 5 | Band 4 | Band 3 | |
| 1 | 24,428.50 | 21,422.20 | 18,051.50 | 21,513.50 | 10,245.750 | 10,483.000 |
| 2 | 19,238.75 | 17,313.00 | 14,911.25 | 25,528.40 | 22,234.800 | 18,665.200 |
| 3 | 27,402.67 | 23,631.83 | 19,472.50 | 17,918.11 | 9096.444 | 9575.333 |
| 4 | 22,303.50 | 19,676.83 | 16,793.33 | 24,549.75 | 21,362.375 | 17,997.875 |
| 5 | 17,517.33 | 11,594.67 | 10,989.33 | 15,965.40 | 14,835.200 | 13,574.400 |
| 6 | 12,943.67 | 11,050.00 | 10,303.00 | 22,865.67 | 19,456.933 | 16,537.733 |
| 7 | 17,225.22 | 15,122.22 | 13,253.00 | 23,488.23 | 20,695.000 | 17,726.000 |
| 8 | 25,640.82 | 22,323.82 | 18,730.73 | 18,460.75 | 16,531.833 | 14,379.417 |
| 9 | 20,699.44 | 18,365.81 | 15,840.12 | 20,155.57 | 18,063.786 | 15,478.143 |
| 10 | 23,487.22 | 20,428.72 | 17,181.22 | 27,425.50 | 23,626.900 | 19,359.200 |
Disclaimer/Publisher’s Note: The statements, opinions and data contained in all publications are solely those of the individual author(s) and contributor(s) and not of MDPI and/or the editor(s). MDPI and/or the editor(s) disclaim responsibility for any injury to people or property resulting from any ideas, methods, instructions or products referred to in the content. |
© 2023 by the authors. Licensee MDPI, Basel, Switzerland. This article is an open access article distributed under the terms and conditions of the Creative Commons Attribution (CC BY) license (https://creativecommons.org/licenses/by/4.0/).
Share and Cite
Lemenkova, P.; Debeir, O. Recognizing the Wadi Fluvial Structure and Stream Network in the Qena Bend of the Nile River, Egypt, on Landsat 8-9 OLI Images. Information 2023, 14, 249. https://doi.org/10.3390/info14040249
Lemenkova P, Debeir O. Recognizing the Wadi Fluvial Structure and Stream Network in the Qena Bend of the Nile River, Egypt, on Landsat 8-9 OLI Images. Information. 2023; 14(4):249. https://doi.org/10.3390/info14040249
Chicago/Turabian StyleLemenkova, Polina, and Olivier Debeir. 2023. "Recognizing the Wadi Fluvial Structure and Stream Network in the Qena Bend of the Nile River, Egypt, on Landsat 8-9 OLI Images" Information 14, no. 4: 249. https://doi.org/10.3390/info14040249