Article

IoT-Enabled Precision Agriculture: Developing an Ecosystem for Optimized Crop Management

1
College of Engineering and IT, University of Dubai, Dubai 14143, United Arab Emirates
2
Telecommunication Engineering Department, An-Najah National University, Nablus P.O. Box 7, Palestine
3
Faculty of Information Technology and Computer Science, Yarmouk University, Irbid 21163, Jordan
4
Palestine Department of Computer Systems Engineering, Palestine Technical University-Kadoorie, Tulkarm P.O. Box 7, Palestine
*
Authors to whom correspondence should be addressed.
Information 2023, 14(4), 205; https://doi.org/10.3390/info14040205
Submission received: 15 January 2023 / Revised: 2 March 2023 / Accepted: 17 March 2023 / Published: 27 March 2023
(This article belongs to the Special Issue Advances in Computing, Communication & Security)

Abstract

:
The Internet of Things (IoT) has the potential to revolutionize agriculture by providing real-time data on crop and livestock conditions. This study aims to evaluate the performance scalability of wireless sensor networks (WSNs) in agriculture, specifically in two scenarios: monitoring olive tree farms and stables for horse training. The study proposes a new classification approach of IoT in agriculture based on several factors and introduces performance assessment metrics for stationary and mobile scenarios in 6LowPAN networks. The study utilizes COOJA, a realistic WSN simulator, to model and simulate the performance of the 6LowPAN and Routing protocol for low-power and lossy networks (RPL) in the two farming scenarios. The simulation settings for both fixed and mobile nodes are shared, with the main difference being node mobility. The study characterizes different aspects of the performance requirements in the two farming scenarios by comparing the average power consumption, radio duty cycle, and sensor network graph connectivity degrees. A new approach is proposed to model and simulate moving animals within the COOJA simulator, adopting the random waypoint model (RWP) to represent horse movements. The results show the advantages of using the RPL protocol for routing in mobile and fixed sensor networks, which supports dynamic topologies and improves the overall network performance. The proposed framework is experimentally validated and tested through simulation, demonstrating the suitability of the proposed framework for both fixed and mobile scenarios, providing efficient communication performance and low latency. The results have several practical implications for precision agriculture by providing an efficient monitoring and management solution for agricultural and livestock farms. Overall, this study provides a comprehensive evaluation of the performance scalability of WSNs in the agriculture sector, offering a new classification approach and performance assessment metrics for stationary and mobile scenarios in 6LowPAN networks. The results demonstrate the suitability of the proposed framework for precision agriculture, providing efficient communication performance and low latency.

1. Introduction

The integration of the Internet of Things (IoT) within the agriculture sector has advanced significantly, as evidenced by its incorporation into various commercial applications such as monitoring weather conditions, soil moisture, temperature, fertility, and crop growth, as well as weed and pest detection, animal intrusion, irrigation control, and supply chain and food waste management. By deploying IoT sensors, farmers can reduce human effort and increase operational efficiency in monitoring their farms. Furthermore, sensors use communication channels to transmit the obtained status information into consolidated, scalable data repositories [1].
The application of data-processing algorithms on collected data can create opportunities for the development of further innovations and data-driven services, such as decision-making applications that can be combined with IoT actuators to act on physical objects (e.g., turning on a water pump) with minimal or no farmer intervention. However, sensor integration into industrial-scale frameworks requires a large volume of constrained sensor devices, resulting in a self-contained network known as a wireless sensor network (WSN) [2,3,4,5,6,7]. Despite the existence of these technologies and services, they are not always deployed.
In WSNs, four constrained elements are used to organize the internal structure of any sensor device: (1) sensing element (such as a horse heartbeat signal sensor); (2) limited computation power (e.g., main memory and central processing unit (CPU)); (3) short-distance, limited-bandwidth radio transceiver; and (4) limited battery power. These constraints make it challenging to integrate such a sensor network into the agriculture sector, in terms of meeting the scalability and performance requirements of the harsh environments of agricultural farms [8,9,10].
In this study, the 6LowPAN and Routing protocol for low-power and lossy networks (RPL) were considered in assessing the performance of the WSN. The evaluation results of the RPL protocol in the two farming scenarios were modeled and simulated using COOJA, a realistic WSN simulator. The first scenario represents an olive tree farm with an integrated WSN that uses fixed-position sensor nodes and settings, while the other scenario represents a horse training stable, with each horse equipped with a sensor node representing the WSN in a mobile case. This approach helps ensure the ability to capture the impact of mobility in both scenarios and provides a realistic comparison of networking performance indices by sharing the simulation settings for both fixed and mobile nodes, with the main difference being node mobility. This paper characterized different aspects of the performance requirements in the two farming scenarios by comparing: (1) average power consumption; (2) average radio duty cycle; and (3) connectivity degrees of the sensor network graph. A new approach was proposed to model and simulate moving animals within the COOJA simulator, adopting the random waypoint model (RWP) to represent horse movements.
The aims of this study are twofold: to assess the performance scalability of WSN in the agriculture sector and to provide a classification framework for studying IoT in the agriculture sector. Several performance metrics, such as network graph connectivity and power consumption, were evaluated. Furthermore, the stationary configuration and mobility covered both animal and plant farms. The main contributions of this study can be summarized as follows: (1) introducing performance assessment metrics for stationary and mobile scenarios in 6LowPAN networks; (2) introducing a novel holistic IoT ecosystem suitable for the precision agriculture domain that satisfies the requirements for both studied scenarios; (3) introducing a new classification approach of IoT in agriculture based on several factors.
The main originality of this research is the assessment of the performance scalability of WSNs in the agriculture sector, along with the development of a classification framework for studying IoT in agriculture. The study evaluates performance metrics such as network graph connectivity and power consumption for both stationary and mobile scenarios in 6LowPAN networks and proposes a new approach for simulating moving animals within the COOJA simulator. Additionally, the paper introduces a novel holistic IoT ecosystem suitable for precision agriculture that satisfies the requirements for both the studied scenarios. This paper presented a framework for integrating IoT systems in precision agriculture. The paper is organized as follows: Section 2 reviews related research works and draws a conclusion on how this work helps to fill the gap in the current state of the art. Section 3 describes the proposed framework that effectively combines an array of sensor measurements, communication technologies, middleware, and applications to provide automated decision-making support. Section 4 describes how the proposed framework was experimentally validated and tested through simulation, using two application scenarios: monitoring olive tree farms and stables for horse training. The results obtained through simulation demonstrate the suitability of the proposed framework for both fixed and mobile scenarios, providing efficient communication performance and low latency. Additionally, Section 5 discusses how the results show the advantages of using the RPL protocol for routing in mobile and fixed sensor networks, which supports dynamic topologies and improves the overall network performance. Section 6 highlights the several practical implications for precision agriculture by providing an efficient monitoring and management solution for agricultural and livestock farms.

2. Related Works

There has been a growing interest in understanding the best approaches for integrating IoT solutions within the agricultural sector. This interest can be broadly categorized into three stages: (1) Vertical studies that examine the best practices and technical guidelines for using IoT-enabling technologies such as wireless sensor networks (WSNs), gateways, communication platforms, and middleware in production farms [3,11,12]. (2) Horizontal studies that investigate approaches to bridge gaps among the vertical studies by discussing standardization, interoperability issues, large-scale prototyping, and system of systems approach [1]. (3) Business-driven studies that focus on integrating the entire chain of agriculture, wherein social and technical guidelines and frameworks are considered, such as farm-to-fork and traceability for food-chain-related studies [13].
IoT and AI state-of-the-art solutions in agriculture have been discussed in [14,15]. The RPL protocol has been widely investigated in vertical studies focusing on several IoT sectors and applications (e.g., home and building automation, urban environments, and industrial applications). However, few research studies have examined how RPL behaves in other application domains, such as agriculture. For example, the authors in [16] examined the behavior of RPL for precision agriculture using a methodology similar to that used in this work; they proposed an extension model and presented preliminary network performance measurements of RPL. This study further investigates and demonstrates how the RPL behaves in two precision agriculture use cases (i.e., stationary and mobile).
Many attempts have been made to build functional architectures for IoT applications suitable for plant and crop field monitoring and management [13,17,18]. Sensors for collecting information about the environment, soil, and water level are combined with geographical information systems (GISs). The captured parameters are stored in centralized databases using data management software. Web and mobile applications provide farmers with easy access to these databases.
Several studies have proposed using IoT applications for monitoring animals, such as using sensor readings to track their health, behavior, and nutrition. These readings can be transferred to a centralized server for storage and further processing, providing valuable insights to farmers and animal trainers. They can then use this information to optimize their cost and time investments and achieve more value-added products [19,20,21,22,23,24,25,26].
Similarly, various proposed IoT systems have been proposed for monitoring peat forests, such as environmental conditions and potentially managing disasters. These systems often use solar power and communicate with monitoring centers through LoRa networks. Additionally, some studies have proposed using high-resolution satellite imagery to identify changes in forest viability and detect foliar diseases. These systems aim to provide early warning systems for fires, pest control, or deforestation [25,27,28,29].
In livestock farming, a wide range of factors to consider, such as wool and skin, depending on the type and number of farm animals. Studies have proposed solutions such as support systems for disease diagnosis and treatment, non-contact temperature measurement for early disease detection, and IoT monitoring systems for tracking animal behavior and health in large-scale pig farms. These systems can provide animal health recommendations to farmers in rural areas where veterinary access is difficult [30,31,32,33].
This study examined the performance of wireless sensor networks (WSN) in two different agricultural scenarios: olive tree farms with fixed-position sensor nodes and a horse training stable with mobile sensor nodes. The sensors were used to monitor the physical condition of the horses, aiming to improve their health and well-being while also collecting high-precision measurements. The experiments adopted a random waypoint model to simulate the movement of the horses in the second scenario. Our evaluation measures included average power consumption, radio duty cycle, and sensor network connectivity levels. The paper proposed a new approach for simulating moving animals using the COOJA simulator.
Despite the limitations imposed by the constrained nature of WSNs, extending their lifespan remains a critical challenge. Various techniques, such as power optimization algorithms, low-power communications, and reactive sensor networks, have been proposed to address this issue [34,35,36,37]. However, studies that compare the performance of WSNs in fixed and mobile deployment scenarios in the agriculture sector are limited. Furthermore, the implementation of IoT technologies such as WSNs in the agriculture industry has been slower compared to other domains, indicating a need for further research in this area to promote wider and faster diffusion of IoT in the sector [38,39,40,41,42].
IoT integration within the agriculture sector has matured, as evidenced by its extension into several commercial applications. There has been a growing interest in understanding the best approaches for integrating IoT solutions within the agricultural sector, which can be broadly categorized into three stages: (1) vertical studies that examine the best practices and technical guidelines for using IoT-enabling technologies such as wireless sensor networks (WSNs); (2) horizontal studies that investigate approaches to bridge gaps among the vertical studies; and (3) business-driven studies that focus on integrating the entire chain of agriculture. This study examined the performance of wireless sensor networks (WSN) in two different agricultural scenarios: olive tree farms with fixed-position sensor nodes and a horse training stable with mobile sensor nodes.
Our proposed system builds upon these existing technologies by incorporating machine learning and data analysis techniques to provide farmers with real-time recommendations on crop management practices. By analyzing data from various sources, including remote sensing [43] and ground-based sensors [44], our system can provide farmers with a comprehensive view of their fields and make recommendations tailored to their specific needs. Furthermore, our system aims to be user-friendly and accessible, requiring minimal technical knowledge to operate. By providing easy-to-understand recommendations through a user-friendly interface, we aim to make precision agriculture more accessible to a wider range of farmers. In conclusion, our proposed system builds upon the strengths of existing precision agriculture systems while addressing their limitations, with the ultimate goal of improving efficiency, reducing costs, and increasing crop yields for farmers.
The state-of-the-art precision agriculture systems involve the use of advanced technologies such as sensors, GPS, robotics, and data analytics to optimize crop production and reduce costs. Remote sensing and ground-based sensor systems are commonly used to monitor crop health, soil moisture, and other environmental factors. Variable rate application systems use this data to adjust inputs such as fertilizers, pesticides, and water according to the specific needs of different parts of a field. Autonomous agricultural equipment, such as drones and robots, are also being developed and used to automate planting, harvesting, and other tasks. In addition to these technologies, precision agriculture systems are also integrating machine learning and AI algorithms to analyze large volumes of data and make predictions about crop health and yield. This allows farmers to make data-driven decisions and optimize their operations for maximum efficiency and profitability. The research problems in precision agriculture systems primarily involve developing more accurate and reliable sensors, improving data analytics and modeling techniques, and addressing issues related to data privacy and security. Additionally, there is ongoing research in developing more advanced autonomous equipment and integrating multiple systems for a more comprehensive approach to precision agriculture. Overall, precision agriculture is a rapidly evolving field, with new technologies and techniques constantly emerging. The state-of-the-art is driven by a focus on improving efficiency, reducing waste, and increasing yields through the use of advanced technologies and data-driven decision making. Our proposed system advances the state of the art in precision agriculture by combining the benefits of both remote sensing and ground-based sensor systems. By using both satellite imagery and ground-based sensors, our system can provide a more comprehensive view of crop health and environmental factors, with greater detail and accuracy than either system alone. Additionally, our system utilizes machine learning algorithms to analyze the data and provide real-time recommendations for crop management, further improving efficiency and yields. Overall, our proposed system offers a more advanced and integrated approach to precision agriculture that can help farmers make more informed decisions and optimize crop production.

3. Overview of Precision Agriculture

This section covers the topic of precision agriculture and its applications, the use of advanced information and communication technology (ICT) in transforming the agricultural industry, and the advantages of utilizing IoT-enabled technologies to enhance precision agriculture.
Precision agriculture is a modern approach to managing farming and cultivation that utilizes ICT to improve production yield, quality, and efficiency [45]. This integration of ICT involves optimizing the entire farming process chain, from monitoring plant and animal health and growth to observing the environment, applying fertilizers, managing water irrigation, and deploying sensors on tractors to collect data on soil moisture and crop growth using drones and GPS technology [46]. Decision support systems then analyze the collected data to inform farming practices and improve overall efficiency.
Precision agriculture, which utilizes advanced ICT to improve production yield, quality, and efficiency, can greatly benefit from integrating IoT in crop and animal farms. In crop farms, such as olive tree farms, IoT allows farmers to monitor the growth and health of their plants and collect data such as temperature, rainfall, leaf water potential, and overall plant health. This information can prevent diseases and pests from affecting the yield.
In animal farms, IoT sensors can be used to monitor the health and performance of the animals, allowing farmers to gather data on the herd’s health, welfare, and physical location. For example, in a horse training stable, smart sensors and tags can provide information on each horse’s temperature, health, activity, nutrition, and collective herd information. This can help farmers identify sick animals and separate them from the herd to prevent contamination and reduce labor costs by using technologies such as drones for real-time livestock tracking. The application of an IoT-based system can have a significant impact on the efficiency of farming operations in both olive tree and horse stable management. In the case of olive tree farming, an IoT-based system can be used to monitor and control irrigation, fertilizer application, and pest management. The system can be designed to collect data on soil moisture, temperature, and other environmental factors, which can be used to determine the optimal irrigation schedule and fertilizer application rates. This can lead to more efficient water and fertilizer use, reduce costs, and increase crop yields. In horse stable management, an IoT-based system can be used to monitor the health and behavior of horses, as well as the temperature and humidity levels in the stable. This can help detect early signs of illness or injury in horses, and provide insights into their behavior patterns. The system can also be used to automate feeding and watering schedules, which can reduce labor costs and ensure that horses receive the proper nutrition. Overall, the application of an IoT-based system can help farmers make data-driven decisions, automate tasks, and optimize resource use, leading to increased efficiency and profitability in both olive tree and horse stable management.

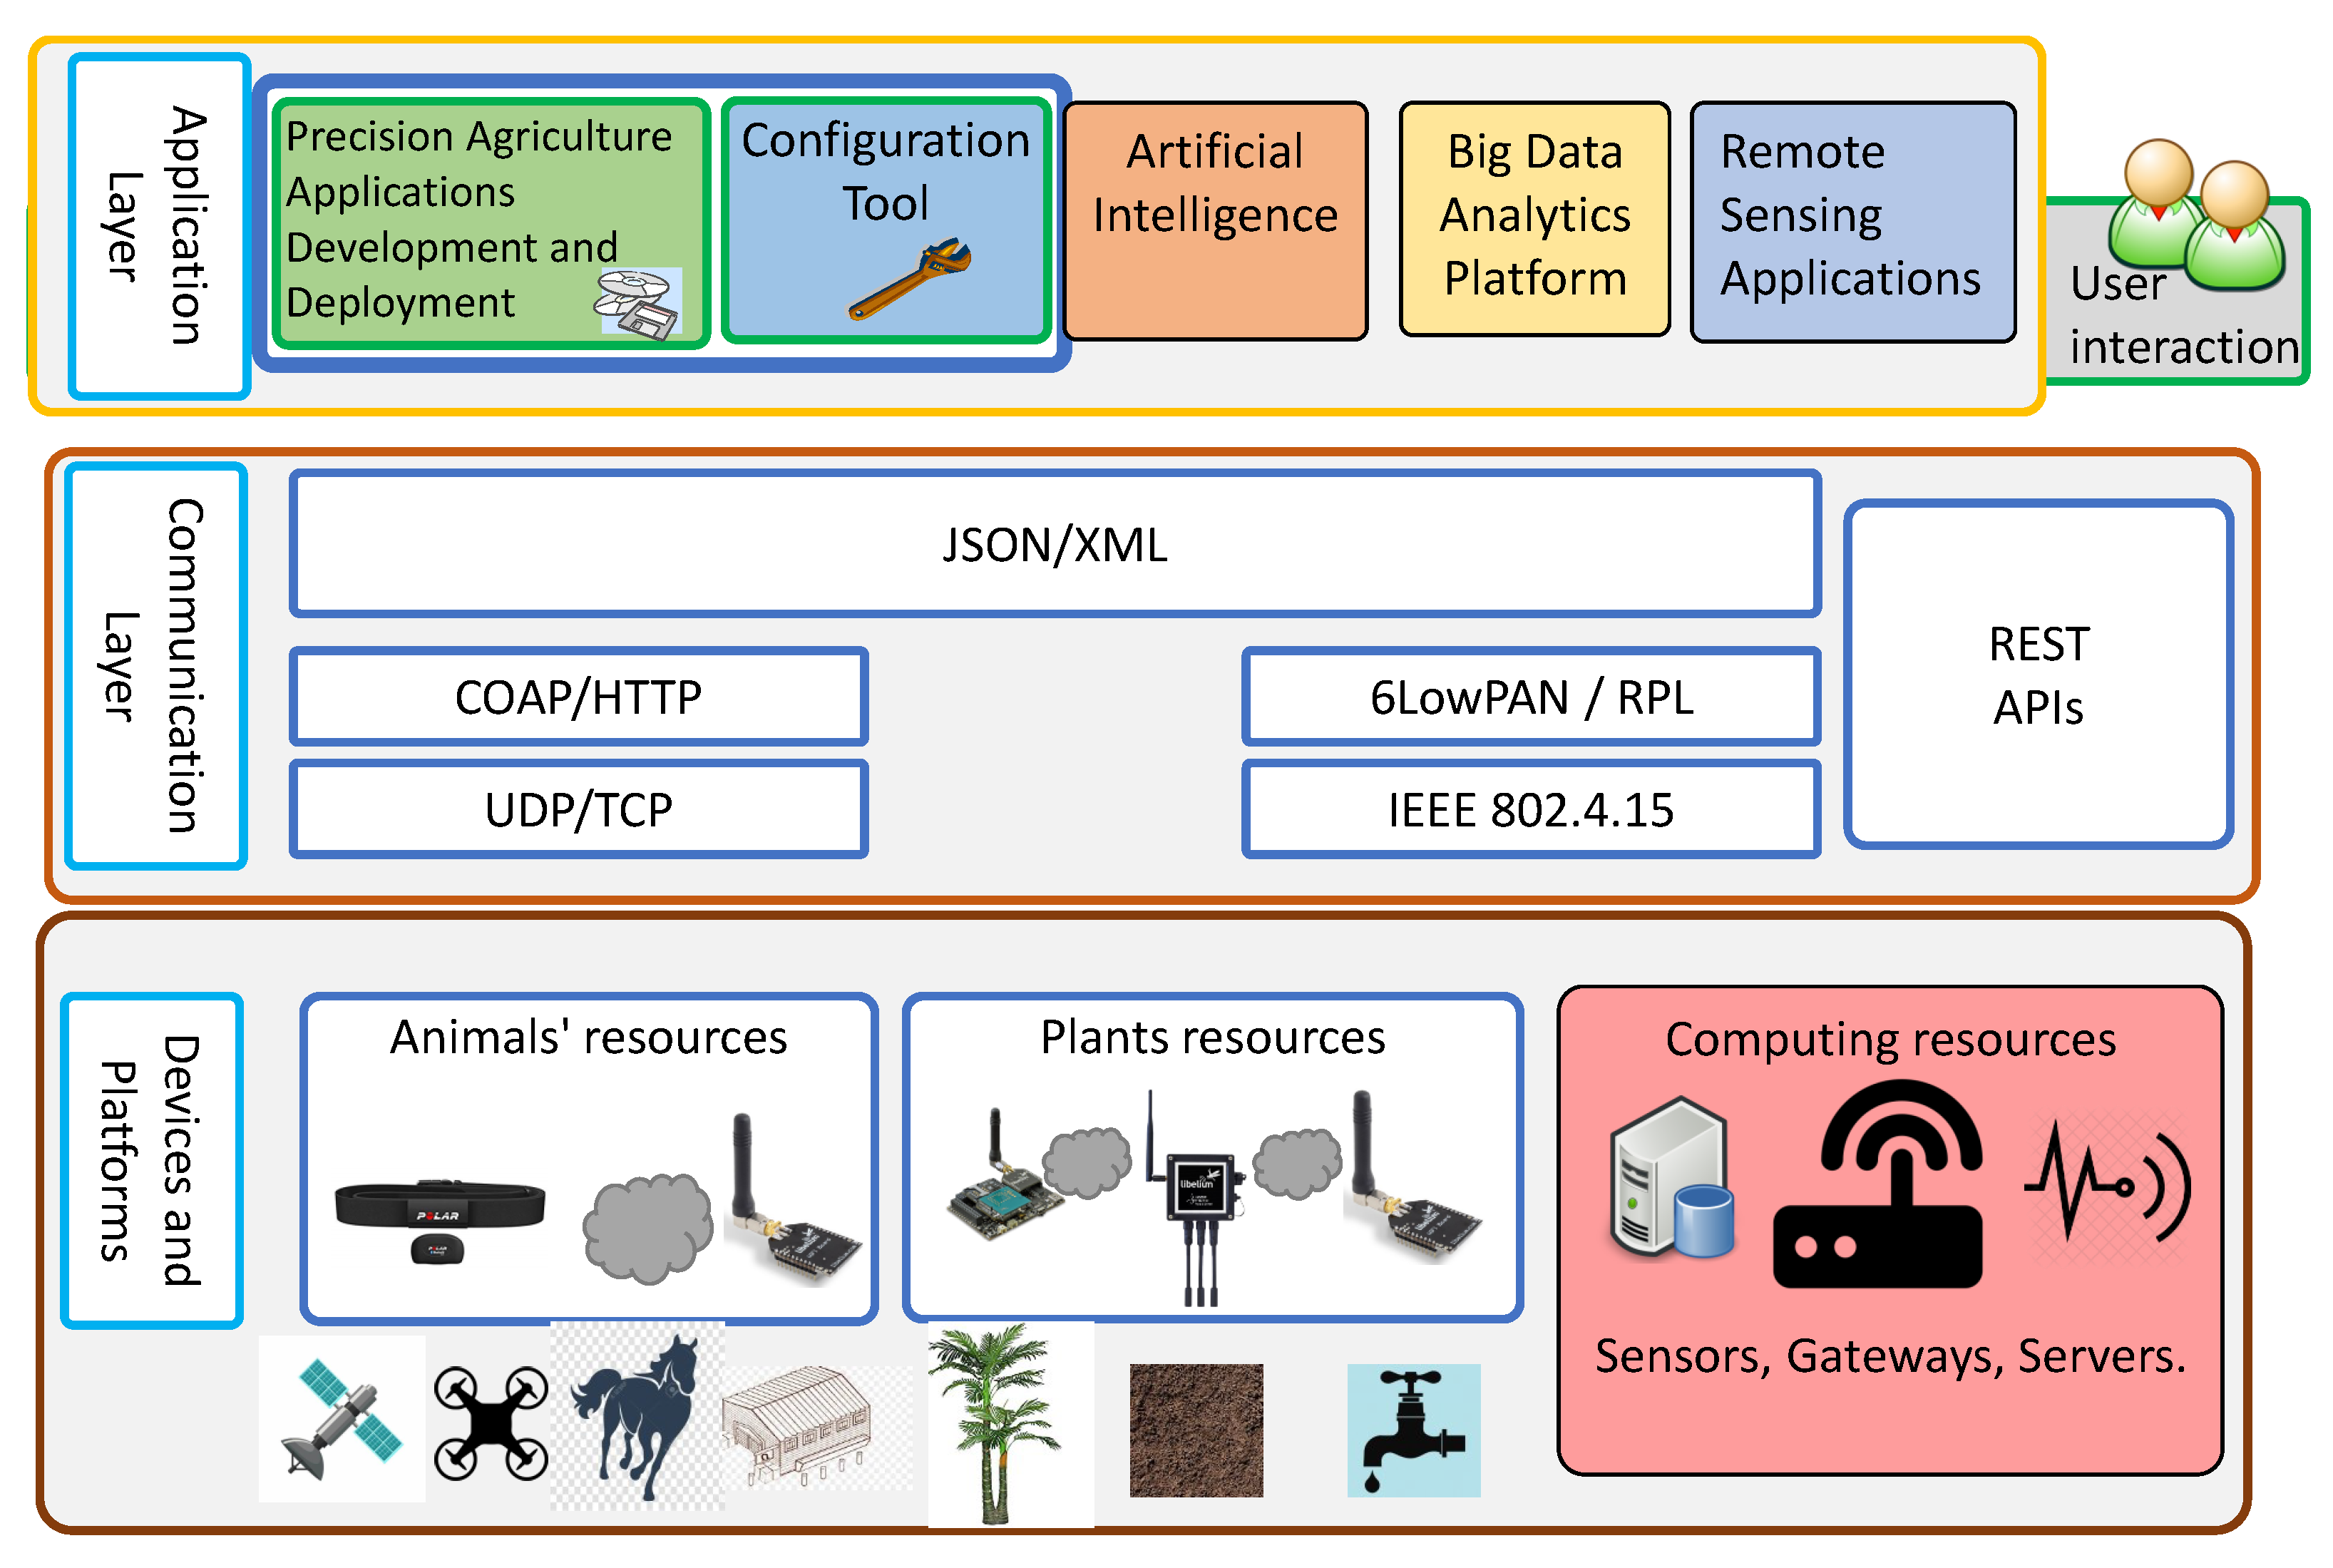
3.1. The Proposed System Model

This paper provides a reference framework to facilitate the development of precision agriculture applications. The proposed model considers heterogeneous sensors and network-enabling technologies for near-real-time network access to status information about a pool of agricultural resources. These resources include trees, animals, water pumps, applications, and other services. These resources can be controlled with minimal management effort or farmer interaction. By using this system, farmers can benefit in multiple ways:
1.
Real-time monitoring: The proposed system allows farmers to monitor their crops and livestock in real time, which enables them to take prompt action in case of any abnormalities or issues.
2.
Automated decision making: The system uses data analysis to provide farmers with insights and recommendations for optimizing their operations, such as determining the ideal time for planting or harvesting or identifying the best feeding and watering schedule for their livestock.
3.
Reduced labor costs: The system allows farmers to automate many of their tasks, such as irrigation and pest control, which reduces the need for labor-intensive manual work.
4.
Improved crop and animal health: The system allows farmers to monitor the health of their crops and animals more closely, which enables them to identify and address issues more quickly.
5.
Increased yield and revenue: By using precision agriculture techniques, farmers can improve their crop yields and animal health, leading to increased revenue.
6.
Resource optimization: The proposed system can also help farmers optimize their use of resources, such as water and fertilizers, which can reduce costs and minimize environmental impact.
The proposed system model for precision agriculture comprises three main layers, as shown in Figure 1: devices and platforms, communication layers, and application layers.
I.
The application layer includes user applications, data analysis, and dashboards used to monitor and optimize precision operations. The Big Data and analytics module consist of a data warehouse storage, which runs at the application layer. This component contains the technology and services necessary to integrate and archive data from multiple sensors and applications, enabling the IoT system to derive and deliver value from its data assets.
II.
The communication layer offers real-time connectivity and enables communication between devices and platforms. This includes sensors to sensors, sensors to gateways, and gateways to servers within the IoT ecosystem. The framework combines several heterogeneous communication technologies, such as IEEE 802.4.15, 6lowPAN, and COAP.
III.
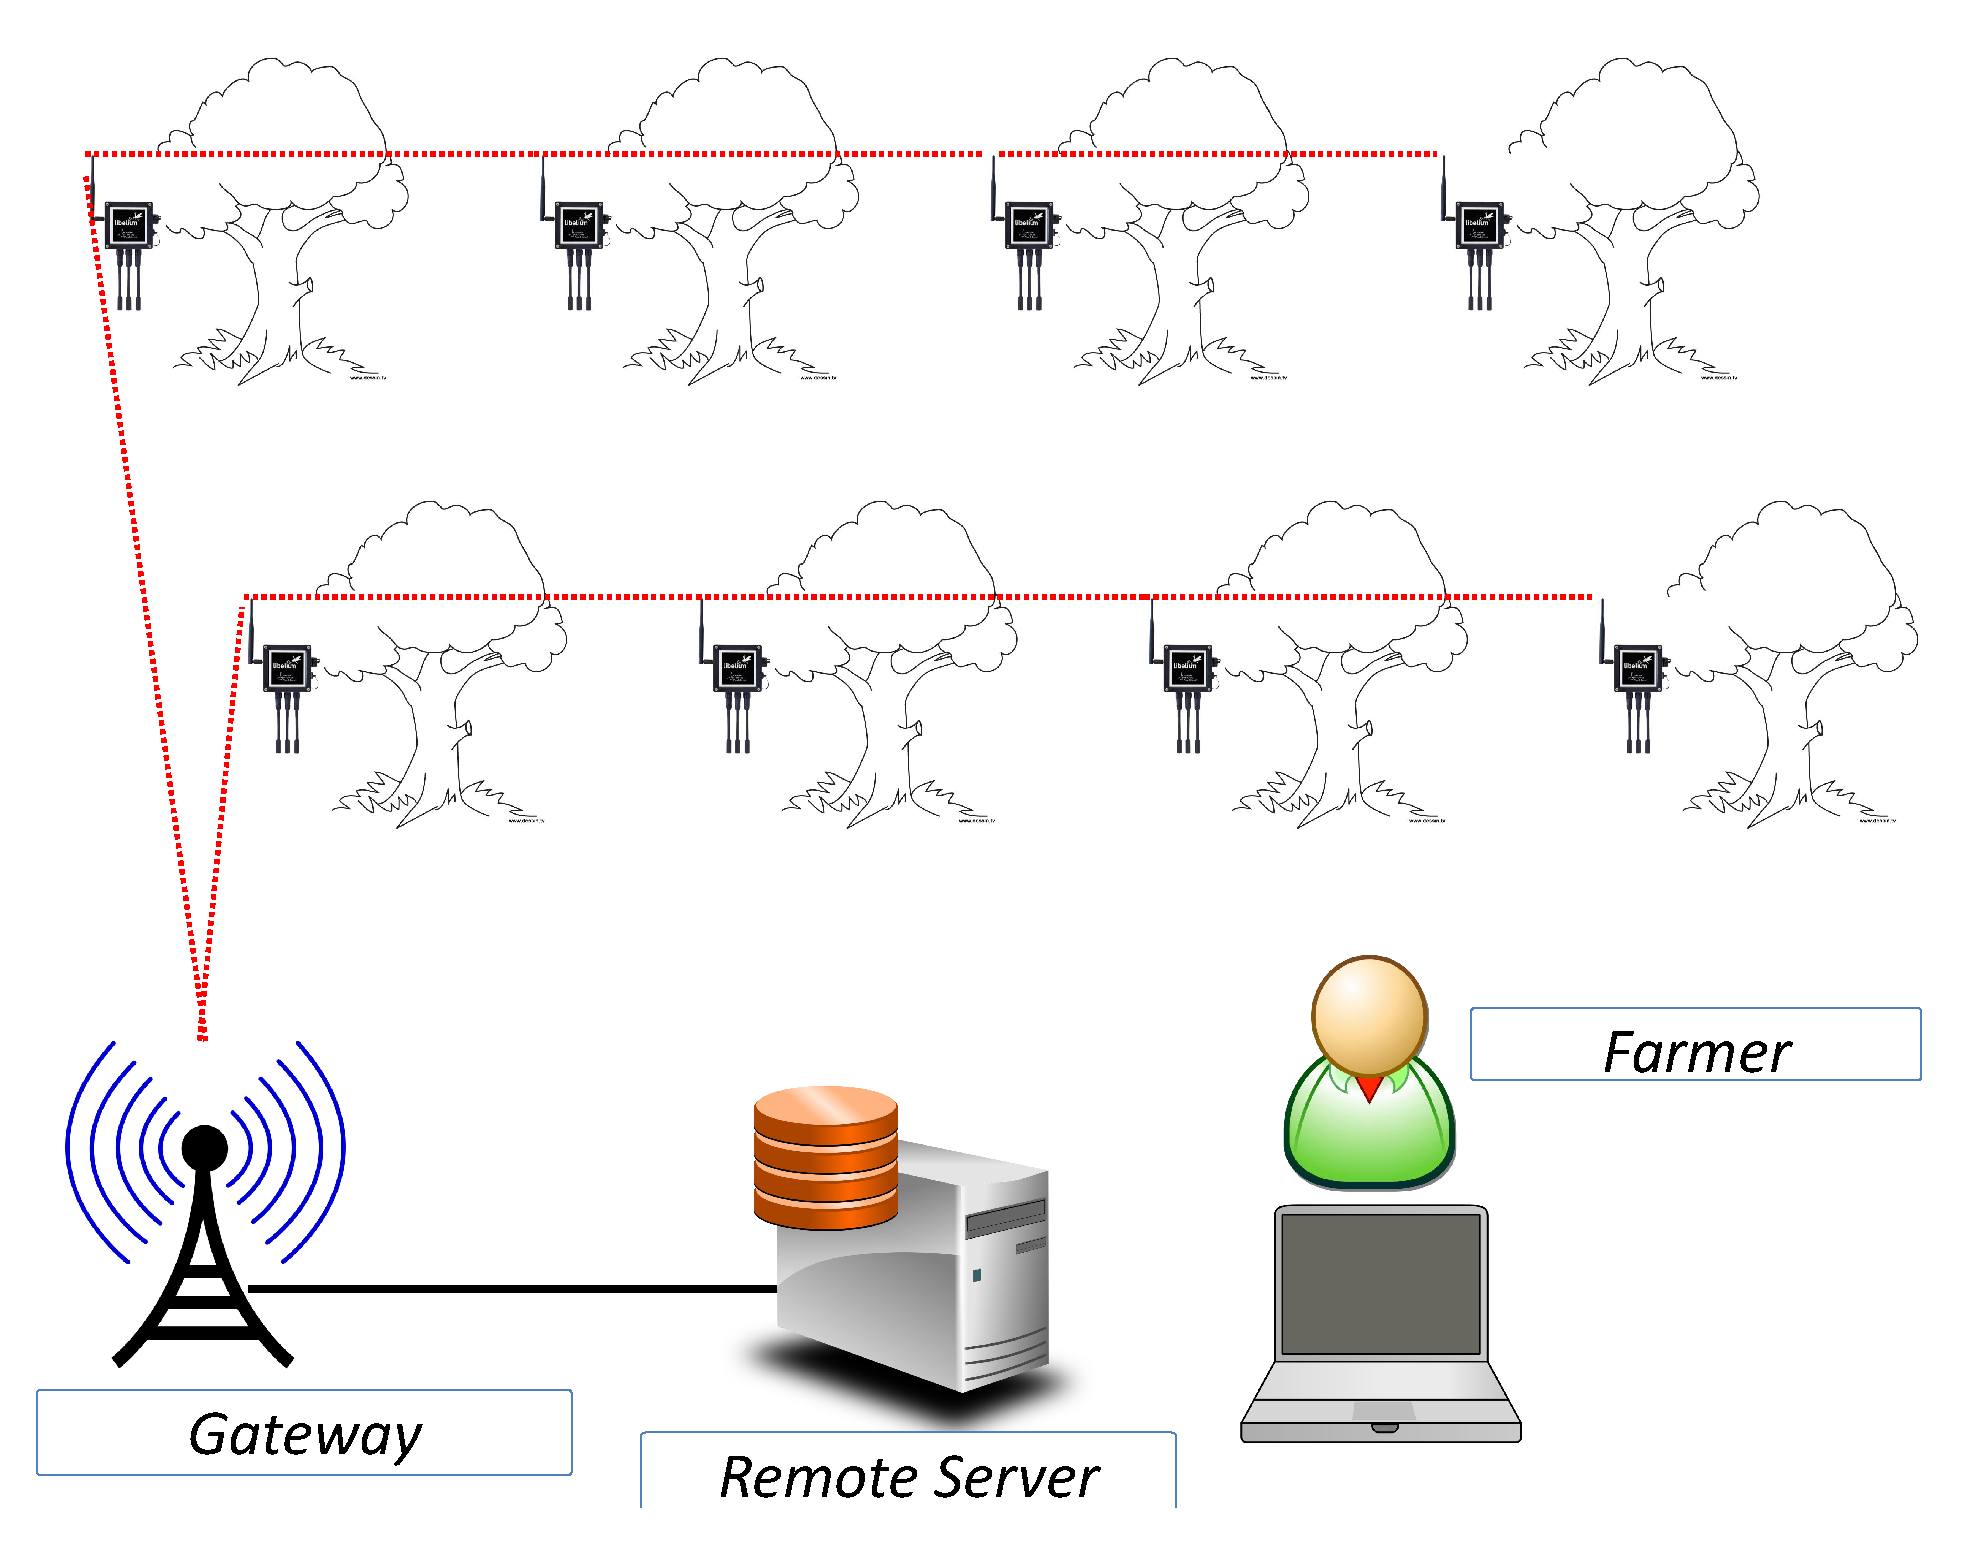
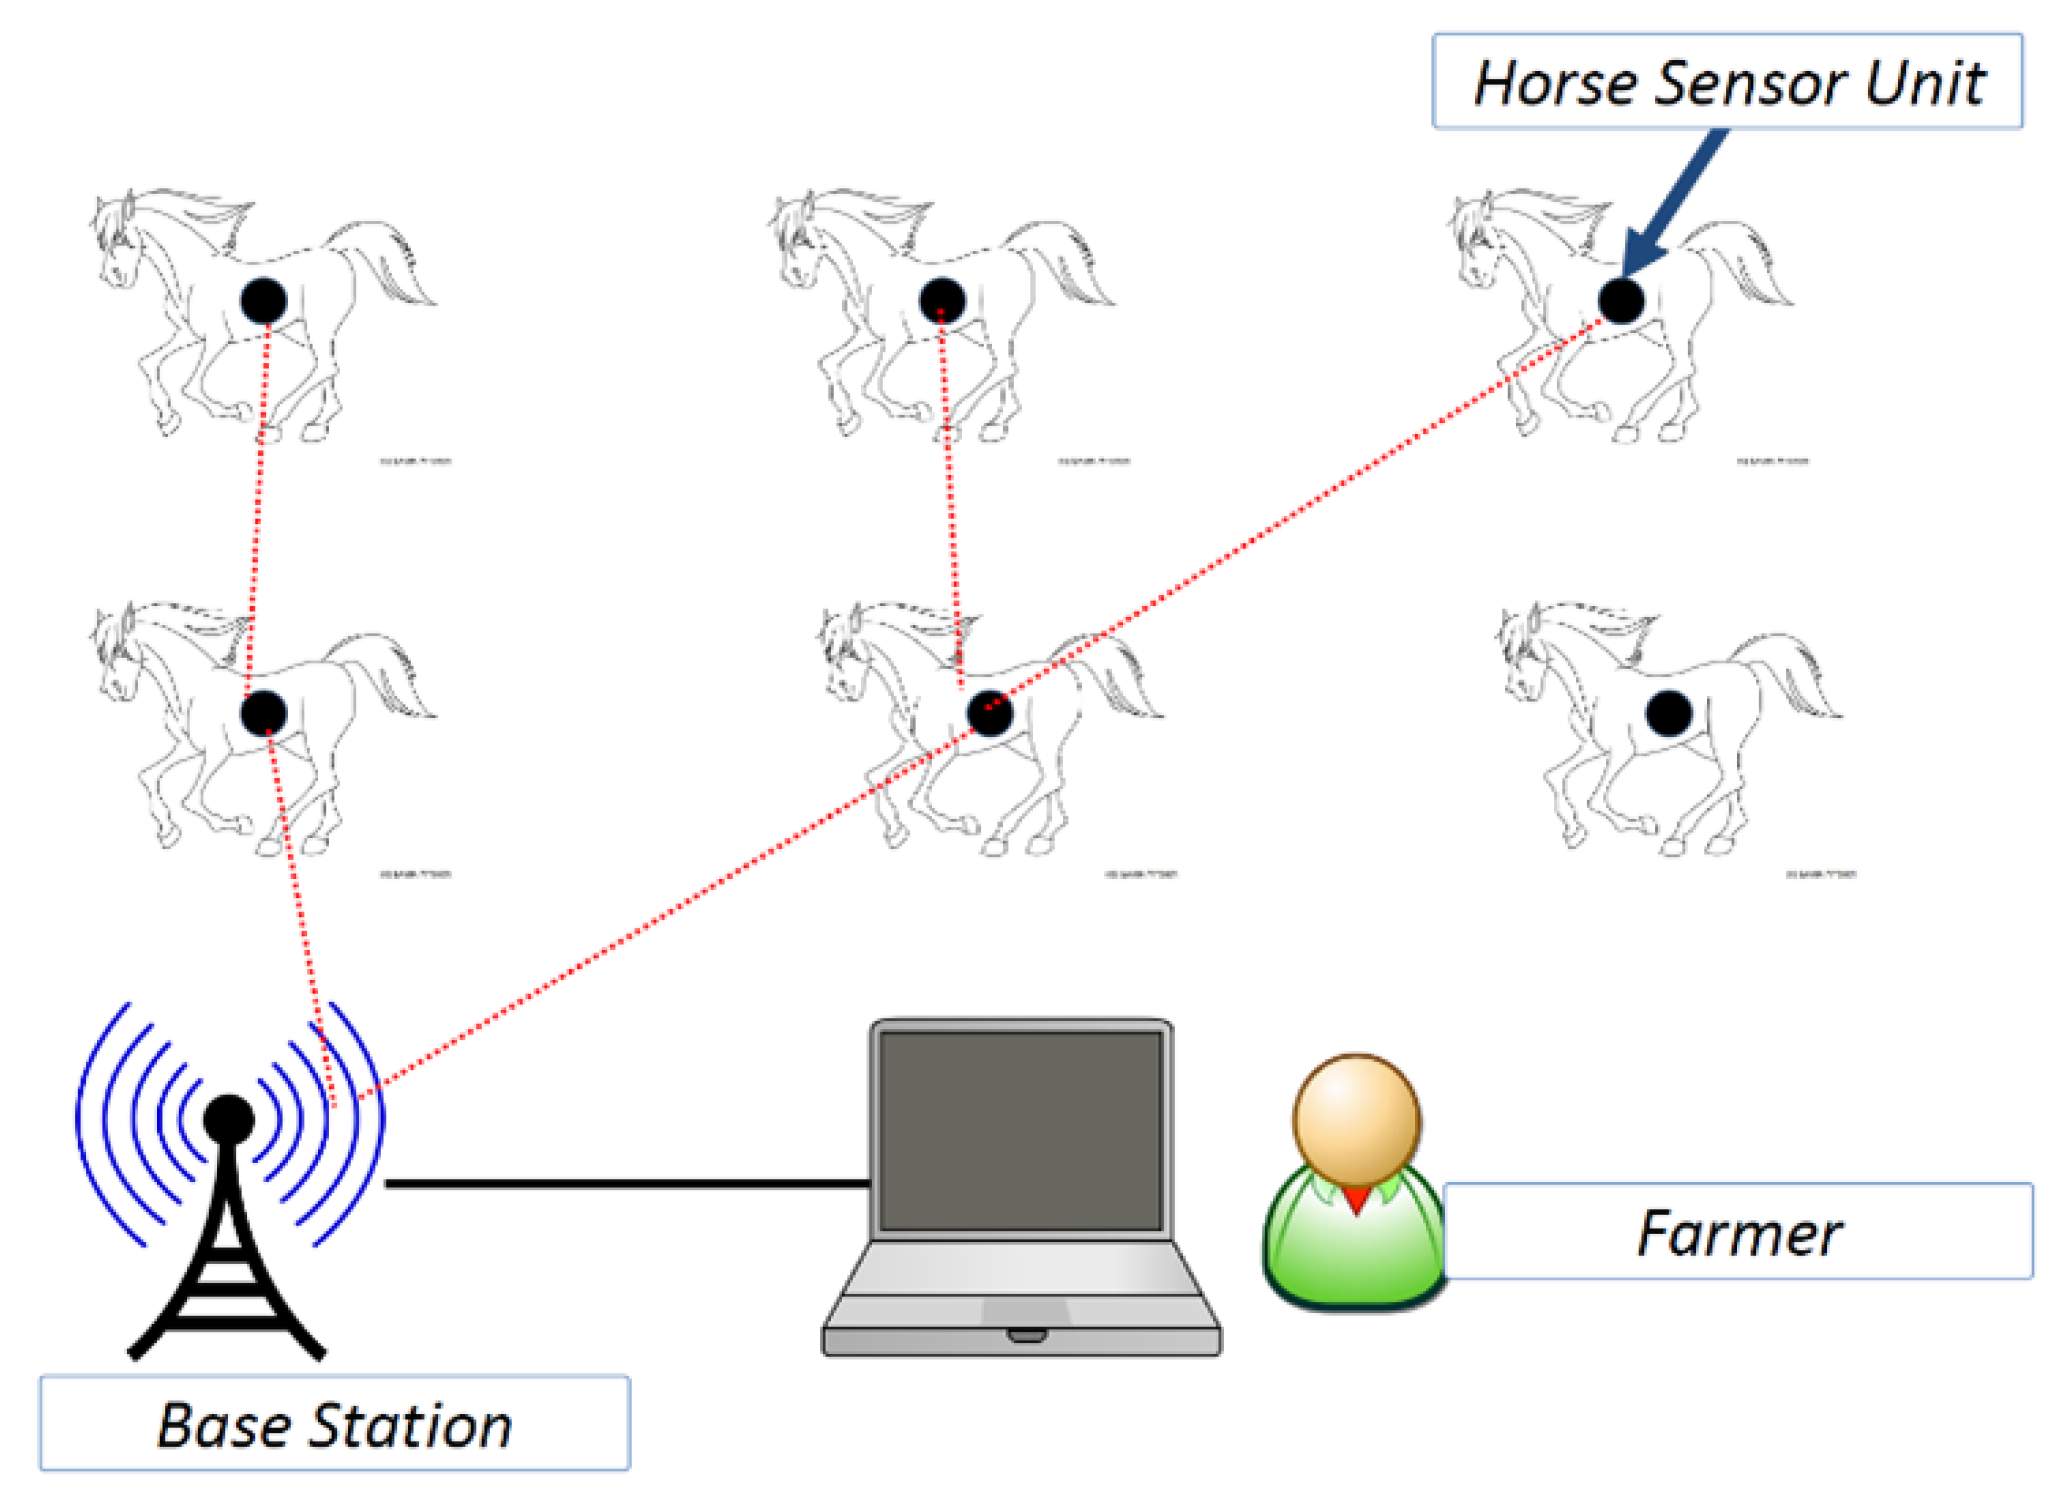
The devices and platforms layer is the foundation of the IoT ecosystem infrastructure. These layers include system components such as sensors, gateways, and server platforms. Sensors are devices that capture the status information about physical world objects and convert them into digital data for transmission and processing. The main goal of the gateway’s platform is to aggregate heterogeneous data sources with different communication standards, given that an array of sensor devices is required to collect data about plants, water, environments, animals, and soil, among others. Servers host user applications and data repositories and provide unified access APIs for other systems and users.
The three main layers of the proposed system model, devices and platforms, communication layers, and application layers, interact to perform the high-level operations of precision agriculture. The devices and platforms layer is the foundation of the IoT ecosystem infrastructure, including system components such as sensors, gateways, and server platforms. These devices capture the status information about physical world objects and convert them into digital data for transmission and processing. The communication layer offers real-time connectivity and enables communication between devices and platforms. It includes the network protocols required to transfer digital information from the sensor to the application layer. The application layer comprises user applications, data analysis, and dashboards used to monitor and optimize precision operations. The artificial intelligence module hosts machine learning models to predict and anticipate anomalies and actions to support the automation process. Remote Sensing hosts applications to analyze images coming from satellites and drones. All these layers work together to enable farmers to monitor and optimize their crops and livestock, leading to more efficient and productive farming operations.

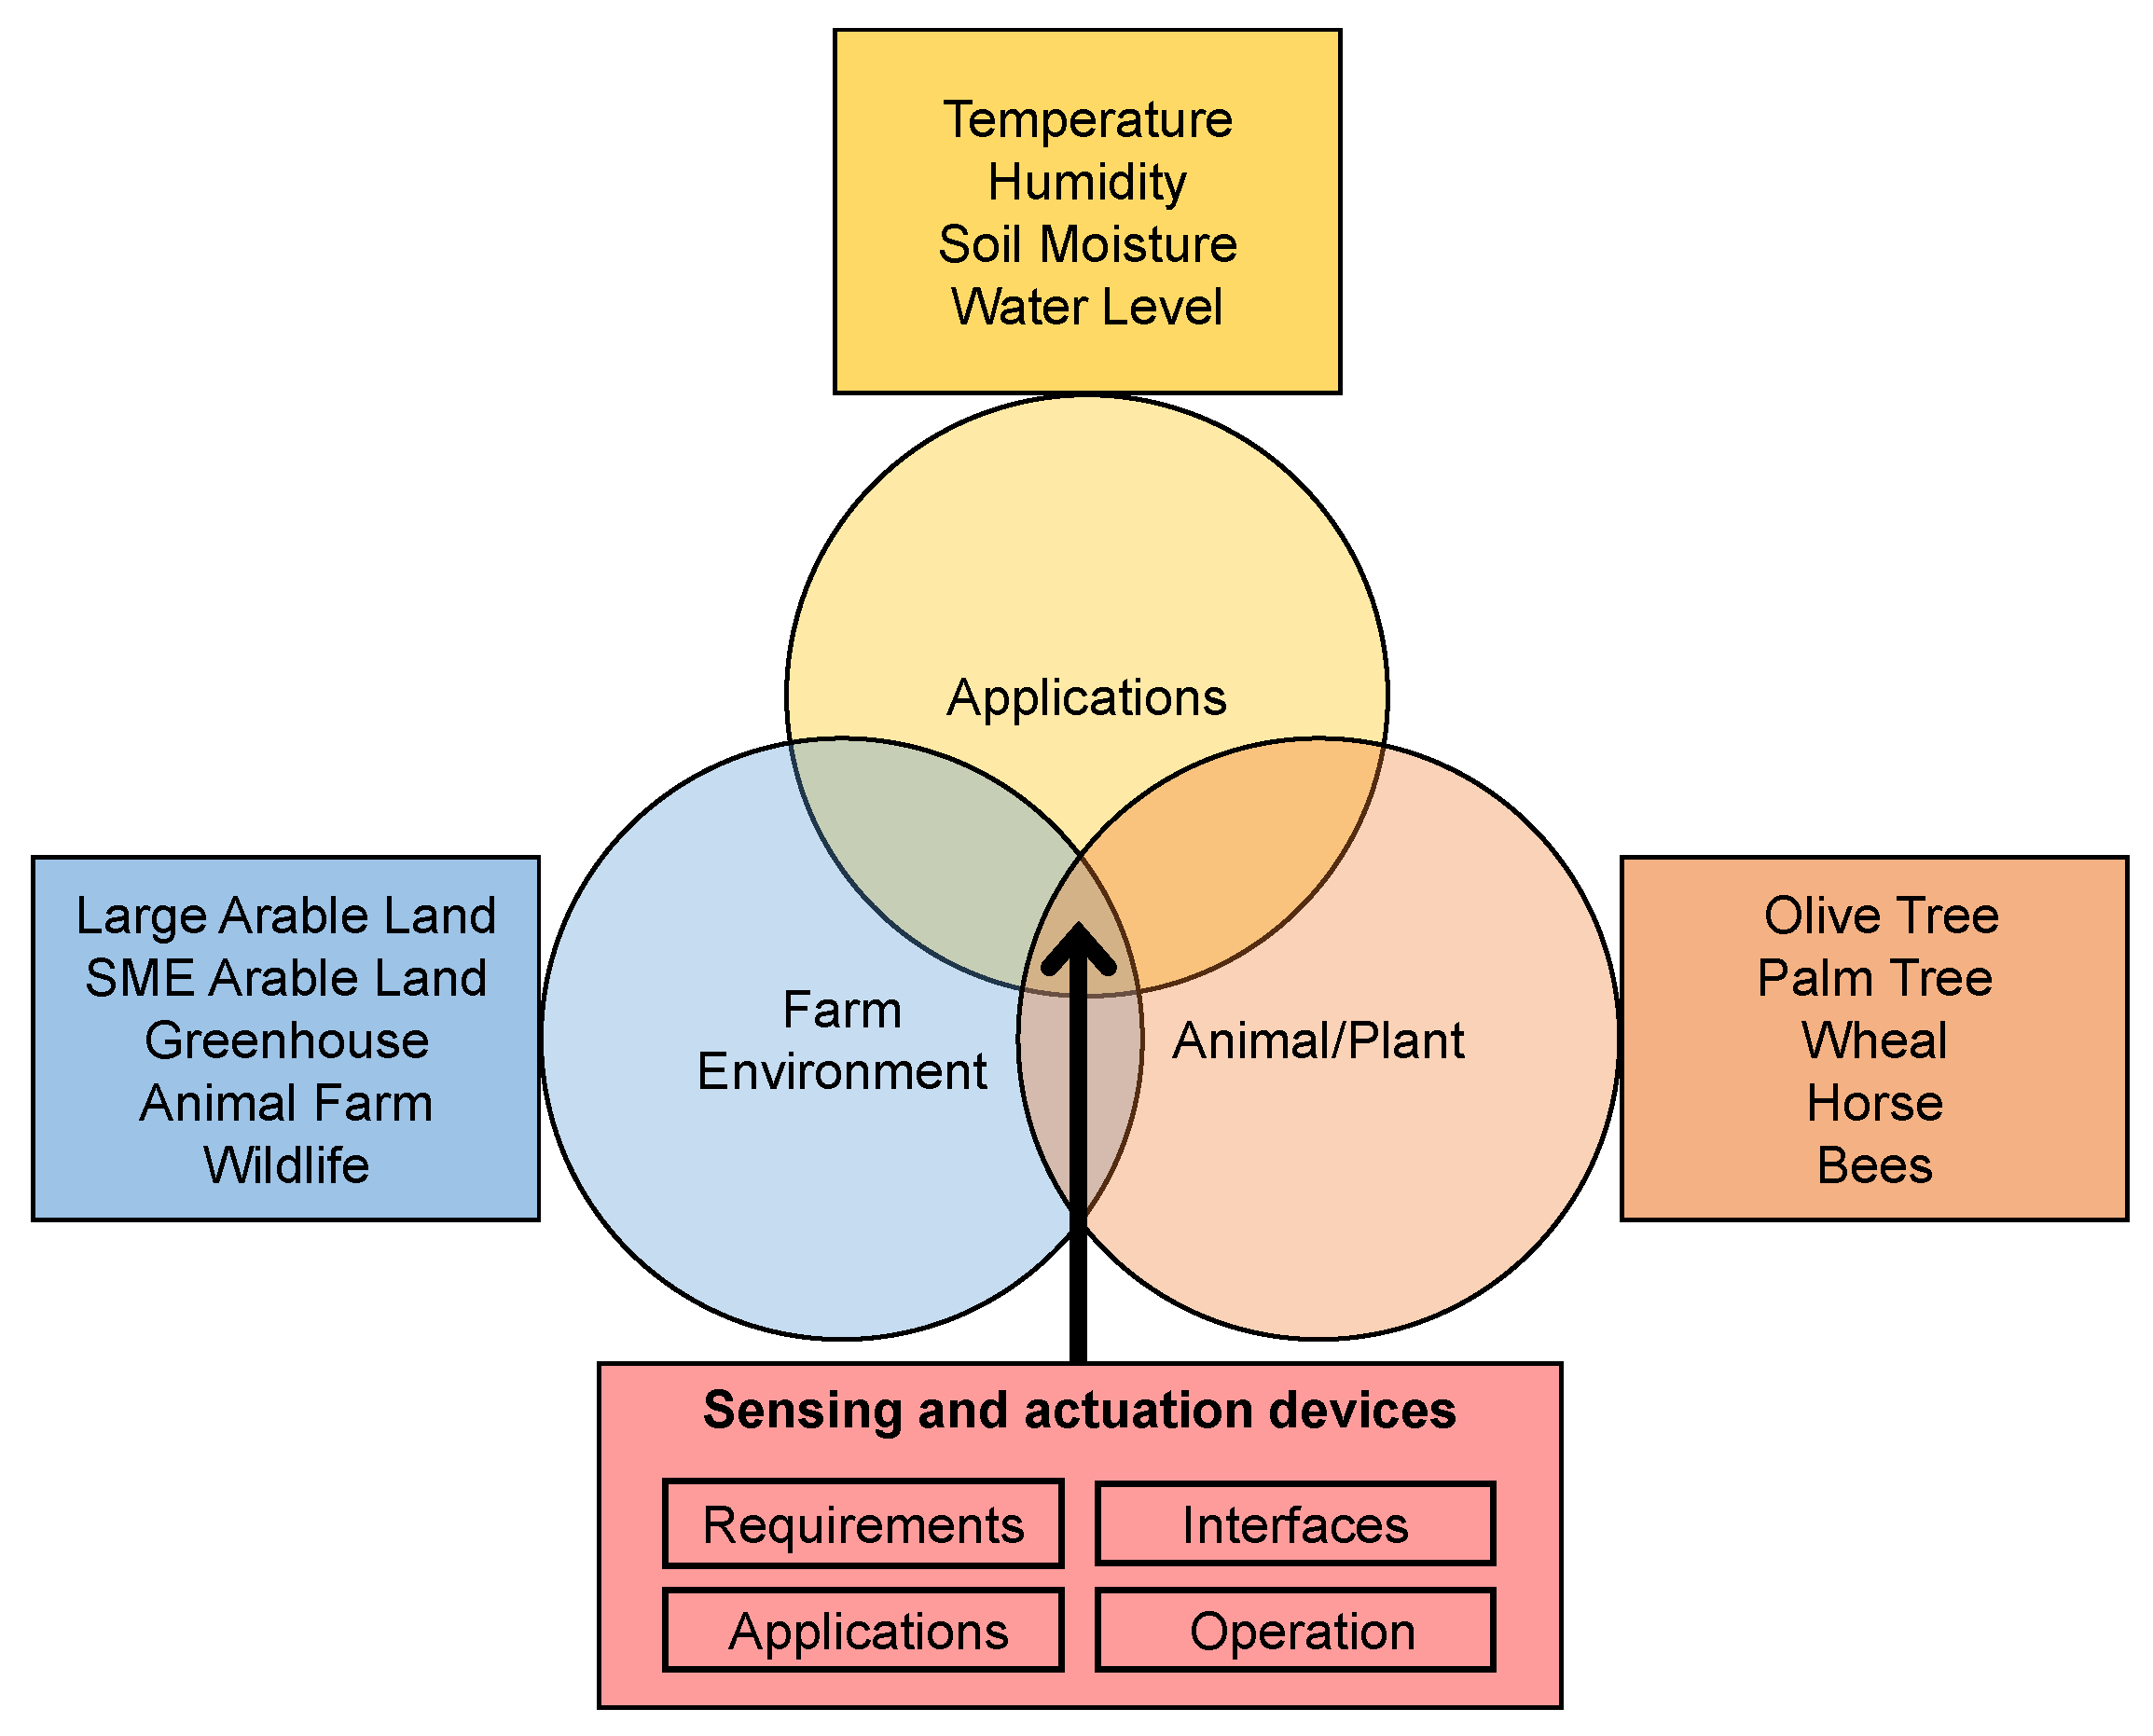
3.2. Precision Agriculture Applications

For example, an application such as horse monitoring is essential for several reasons, such as horses being prone to sudden illnesses such as colic, which can be fatal. Therefore, monitoring horses remotely and constantly is essential to be aware of their condition and function as quickly as possible in an emergency. For this task, WSNs play a decisive role, allowing owners and/or breeders to monitor the vital signs and anxiety of the horses or the stable environmental conditions that can influence the horses’ comfort.
The utilization of WSN technology for farm animal monitoring has received considerable research attention. Research has focused on monitoring the behavioral preferences of cattle using a combination of GPS, satellite imagery, and WSNs. Wireless sensor technology has been used for horses to analyze gait (to identify lameness) and detect foaling time. Monitoring cows and pasture time on a new grass strip using Zigbee technology has already been addressed [47].
IoT systems for horse management, which is a WSN-based system that provides a solution for equine real-time monitoring, allows farmers to access and evaluate vital health signs and behavioral and environmental measurements remotely while being connected to the Internet. In addition to monitoring, the system comprises additional functionalities (i.e., registering and alerting and remote video streaming). Many sensors have been developed in recent years for such horse stables; these sensors can be used to monitor various conditions. The following are some mobility-support sensors that can be used for horse monitoring: (1) motion sensors; (2) blood pressure sensors; (3) heartbeat sensors; (4) colic sensors [48,49].
A commercially available sensor board can be used to use these sensors. For example, some boards support up to 16 sensor plugs on the same board, which can help create a single node that can measure many physical parameters [50,51,52,53].
A second practical example is IoT for olive trees, which integrates IoT devices to manage irrigation, fertilization, and pest control on plant structures. This system helps to detect the disease in its early stages and the risk of the disease spreading in the field by determining the right amount and time of additional olive tree irrigation and tree changes caused by agricultural pests. The system relies on temperature and humidity sensors on the ground and cameras that take pictures of the trees. The data generated by these devices are sent to a database server through web services and analyzed. This system sends instructions to decide, such as the amount of irrigation and fertilization, the time to water, and the precise infection treatment.
For example, Libelium’s Waspmote Plug & Sense! Sensor Platform is a commercially available sensor board used for best control in an olive tree farm. For Example, Libelium’s boards support up to 16 sensor branches on a single board so that a node can measure multiple parameters [29].

3.3. Communications Protocols

The communication layer in the proposed system model facilitates interactions among various IoT subsystems using a variety of network protocols. For example, the application layer utilizes lightweight protocols and architectures, such as JSON and REST, encapsulated over HTTP/COAP at the network layer. Additionally, reliable and unreliable protocols are supported at the transport layer, including TCP and UDP. Constrained devices communicate using 6LowPAN, IPv6, and RPL for routing data packets. Routing among network nodes is achieved through the RPL protocol, which dynamically builds a destination-oriented directed acyclic graph (DODAG) at the sink node. This protocol supports static topologies and mobile nodes and enables efficient traffic flow toward the sink node [54].
JSON (JavaScript Object Notation) is a lightweight data-interchange format that is easy for humans to read and write and for machines to parse and generate. It is based on a subset of the JavaScript Programming Language. It is commonly used to transmit data between a server and a web application, as well as between different systems. JSON is also language-independent and can be used in any programming language.
REST (Representational State Transfer) is an architectural style that defines a set of constraints to create web services. It is based on the principles of the HTTP protocol, which is used to transfer data over the internet. RESTful web services are characterized by their ability to be accessed by a URI (Uniform Resource Identifier) and their support for the HTTP methods (GET, POST, PUT, DELETE, etc.). RESTful web services are lightweight, easy to implement, and easily consumed by many clients, including web browsers, mobile devices, and other systems. JSON and REST are commonly used together in IoT systems to transfer data in a lightweight, easy-to-use format that a wide range of devices and systems can access.
HTTP/COAP (Constrained Application Protocol) is a communications protocol used at the network layer for IoT systems. HTTP is a widely-used protocol for web communication and is typically used for web-based applications. COAP is a specialized web transfer protocol for use with constrained nodes and networks in the IoT. It is designed to use fewer network resources and less bandwidth than HTTP and is optimized for use in low-power and lossy networks, such as those found in IoT systems. It uses DODAG to build routes and support static typologies and mobile nodes.
DODAG is a data structure used in RPL to build and maintain routes in a low-power and lossy network such as an IoT network. The DODAG is built and maintained by a root node, also known as a sink node, which acts as the central point of the network and is responsible for forwarding data packets to their intended destinations. The DODAG is essentially a tree structure where each node in the network has a specific parent node, and all nodes point toward the root node. The DODAG is directed, meaning that data flows in a specific direction towards the root node, and is acyclic, meaning there are no loops in the data flow. The RPL protocol uses the DODAG to determine the optimal routes for data packets, considering factors such as network congestion, energy efficiency, and link quality. The DODAG also allows for dynamic adjustments to the routes as network conditions change.

3.4. Devices and Platforms

This layer of the proposed system model comprises the sensor platform and associated sensing technologies. Sensors capture and digitize the measurement parameters of physical objects and their environments, such as plants, animals, soil, and water. Precision applications in agriculture require the identification of specific measurement parameters and corresponding sensors. The overall characteristics of the IoT ecosystem, including hardware, operating systems, and network stack protocols, also play a role in determining the sensor computing platforms.
The identification of measurement parameter requirements is influenced by three factors: the type of animal or plant being considered (e.g., horse, dog, rice, palm, or olive tree), the farm environment where the species are studied (such as large arable fields, small/medium-sized arable farms, animals in the field or house, indoor horticulture, greenhouses, beehives, fishery and aquaculture, and leisure agriculture [55]), and the specific applications being used (such as monitoring livestock food supply chain, tracking, traceability, early warning systems, and pest management). Figure 2 illustrates these factors.
Table 1 summarizes commonly used plant sensory data in precision agriculture. The information is adapted from the primary vendor, Libelum, in the IoT domain. This list is useful for IoT system developers to optimize their applications and make informed decisions about sensor selection. The data type of the sensor is also provided to aid in programming.
Sensor device platforms, as shown in Table 2, are built from hardware and software components. The functional element of the software is responsible for managing the underlying hardware platform and providing a set of services for upper-layer applications. Operating systems (OS) play a crucial role in the functionality of the sensor device platform. The OS kernel, which is the core component of the OS, includes a scheduler that manages resource sharing among users, such as CPU, main memory, and I/O device operations. Additionally, the programming model of the OS, such as threading, supports concurrency and enables efficient resource management [56].

4. Experiments and Simulation

The proposed framework’s overall aim is to enhance the effective planning and implementation of an IoT System for process management in precision agriculture applications. It provides guidelines and best practices for IoT development and implementation practitioners. To validate the proposed framework, two application scenarios were used: the first scenario is an olive tree farm where the WSN nodes are fixed in the soil and on the tree, forming a stationary network. The second scenario represents a horse stable where the animals are moving and the WSN nodes need to be attached to horses to be able to monitor the health and nutrition status, forming a mobile and changing network structure. Therefore, it is important to compare the dynamic behaviors for both cases to understand the impact on the network’s DODAG.
One of the main limitations in the validation process is the difficulty in implementing all the components of the proposed system. Therefore, sub-components of the system were experimentally validated and tested, while other components were analyzed conceptually. This approach allows for a thorough examination of the proposed framework’s performance and scalability in a simulated environment, as well as its suitability for edge and fog platforms in terms of packet delivery ratio, power consumption, and packet delivery rates. The above processes are enabled by data sources from the sensors allocated in the two application scenarios. The simulation results demonstrated acceptable performance, and thus, the two scenarios were selected to take part in the final framework. Overall, the framework was assessed by creating a simulated test that primarily aimed to measure communication performance and latency, and comparing the efficiency and reliability of RPL protocol for fixed and mobile scenarios.
Wireless sensor networks (WSNs) for fixed and mobile nodes have some key differences that need to be considered when designing and implementing them. In a WSN for fixed nodes, such as in an olive farm, the sensor nodes are typically placed in a stationary manner, either in the soil or on the trees. These nodes form a stationary network structure that is relatively stable and predictable. On the other hand, in a WSN for mobile nodes, such as in a horse stable, the sensor nodes need to be attached to the animals and are constantly moving. This results in a mobile and changing network structure that is more dynamic and less predictable. It is important to compare the dynamic behaviors of both cases to understand the impact on the network and the performance of the routing protocol used, such as the destination-oriented directed acyclic graph (DODAG) in the RPL protocol. By validating both cases, the practitioners can better understand the limitations and challenges of implementing IoT systems for precision agriculture and identify the most suitable solutions for different scenarios.
The fixed sensor nodes in the olive tree, as shown in Figure 3, farm scenario form a stationary network, whereas the mobile sensor nodes attached to the horses in the stable scenario form a dynamic and constantly changing network structure, as shown in Figure 4. This allows us to compare the dynamic behaviors of the network in both cases and understand the impact on the RPL protocol’s destination-oriented directed acyclic graph (DODAG) formation. By validating both scenarios, the experiments aim to demonstrate the flexibility and adaptability of the proposed framework in different precision agriculture environments and provide insights for future development and optimization of IoT systems in precision agriculture.
The experiment is designed to measure the communication performance and latency of the system, comparing the efficiency and reliability of the RPL protocol in both fixed and mobile scenarios. Each scenario was evaluated individually within the overall framework and yielded acceptable performance; hence, they were selected to take part in the final framework. The system assessment results have shown the suitability of our implementation for edge and fog platforms in terms of packet delivery ratio, power consumption, and packet delivery rates that demonstrate the advantages of improving mobile and fixed sensor networks.
The simulation tool used for this work is the COOJA simulator, a JAVA-based simulator for Contiki OS. The COOJAs mobility plugin needs to be enabled because it is not supported by default; it must include information about mobility positions for each node during the simulation. Therefore, the mobile node speed was set to 3.33 m/s. All node information regarding mobility positions was saved in a file and loaded before the simulation process started in the simulator. In all simulations, sensors that communicated with a central sink node completed data gathering and aggregation. The monitoring unit (MU), a central unit, works as a gateway between the users and the sensors, considering the typical physical configuration of a horse farm.
The MU is a set of customized sensors for each horse on the farm; equine sensors in the horse stable are assembled in the sensor node. The horse is equipped with airflow, heart rate, body temperature, speed, indicator movements, and colic sensors. Each sensor node can read multiple parameters and communicate directly with the central point. The base station is plugged into the MU, which is the system’s central unit and implements all users’ and administrators’ functionalities, communicating between sensor nodes, and connecting the system with the Internet and cellular networks.

4.1. Simulation Software: Contiki and COOJA

The experimentation utilized wireless sensor nodes that were built on the open-source, highly portable, multi-tasking operating system, Contiki [57]. This operating system is specifically designed for memory-efficient networked embedded systems and wireless sensor networks (WSNs). It is capable of running on microcontrollers with minimal memory resources, with a typical configuration of 2 kB of RAM and 40 kB of ROM. The use of Contiki in our sensor nodes allowed for efficient resource management and ensured compatibility with the low-power requirements of our precision agriculture applications.
Contiki was selected as the operating system for the sensor nodes and used C as the programming language. Contiki has many advantages over other sensor-network operating systems; for example, it includes an embedded simulation tool, COOJA, which can compile and simulate application software conveniently and quickly [41]. For simulation, a single sink node was assumed in each application and 36 normal nodes. The sink node is assumed to be fixed in the olive farm case and mobile in the horse farm case. The static nodes were simulated in COOJA using 36 clients and a single server (Sky Mote IPv6 RPL-UDP). The mobile nodes were modeled using a WSN 6lowPan in COOJA, where the mobility model was modeled using RWM. The data analysis and processing server were fixed at the simulation area’s center. Finally, the simulation duration was set as 4 h. Table 3 and Table 4, summarize all used summation parameters.

4.2. Experiment Mobility Model for Both Scenarios

In the first set of experiments conducted at the olive tree farm, experiments deployed a wireless sensor network consisting of 36 static nodes, each representing a tree equipped with a sensor board. The nodes were distributed on a grid and strategically placed within different squared areas of 25 m × 25 m, 50 m × 50 m, 75 m × 75 m, and 100 m × 100 m. The sink node, which serves as the central point for data collection and transmission, was located at the center of the simulation area. This configuration allowed us to evaluate the network performance and assess the impact of node density and area coverage on the overall system performance.
The density and coverage of nodes in a wireless sensor network (WSN) can have a significant impact on the overall system performance. A higher node density results in a more extensive coverage area, which can improve the accuracy of data collection and increase the chances of successful data transmission. However, a higher node density also increases the number of nodes that need to be maintained and managed, which can increase the complexity of the system and reduce overall performance. Additionally, a higher node density can lead to increased interference between nodes, which can negatively impact the system’s communication performance. On the other hand, a lower node density can result in lower coverage areas, which can reduce the accuracy of data collection and decrease the chances of successful data transmission. Therefore, the optimal node density and coverage will depend on the specific requirements of the application and must be carefully considered during the design and deployment of the WSN.
In the second set of experiments, the focus is on mobile horse farms and the impact of node density and area coverage on the overall system performance. The experiments are conducted using the same grid-based areas as in the first set, with dimensions of 25 m × 25 m, 50 m × 50 m, 75 m × 75 m, and 100 m × 100 m. However, in this scenario, 36 nodes representing sensor boards mounted on horses are used, and the nodes are made to move based on the random waypoint model (RWP) [58]. The sink node remains static and is located at the center of the simulation area.
The random waypoint model (RWP) is a commonly used mobility model in wireless sensor networks (WSN) and mobile ad hoc networks (MANET) simulations. The RWP model simulates a scenario where nodes move randomly within a defined area, with each node having a destination point chosen randomly and a random speed between a defined minimum and maximum value. The node then moves towards the destination point at the chosen speed, pauses for a random amount of time upon reaching the destination, and then chooses a new destination point. This model is used to simulate a variety of mobile scenarios, such as vehicular networks or animal tracking, and allows researchers to study the impact of mobility on network performance, such as connectivity, throughput, and delay. The RWP mobility model distributes the nodes randomly within predefined simulation areas after the start of the simulation. At the beginning of the simulation run, every mobile node remained in its location for a certain random period (i.e., a pause time), and this was uniformly chosen between 0–60 s. Once this time expires, it moves to a random location within a simulation area and at a speed uniformly distributed between minspeed and maxspeed. The mobile node then moves to the newly selected destination location at the selected speed. The node pauses for the specified pause time before repeating the same process when it arrives. The node chooses a new speed and destination combination and then moves again after the completion of the pause time. The simulation setting for the speed of the mobile nodes is uniformly selected between 1 and 2 m/s. This model is used in several simulation studies and is closer to simulating a horse’s movement.
The impact of mobility on performance can be significant in wireless sensor networks for mobile applications such as horse monitoring. As the nodes move, the network topology changes and the routing paths may need to be recalculated. This can lead to increased network overhead, decreased packet delivery ratio, and increased power consumption. Additionally, the moving nodes may experience varying levels of signal strength and interference, leading to further challenges in maintaining stable communication. Thus, it is essential to consider the impact of mobility on the overall system performance in wireless sensor networks for mobile applications.

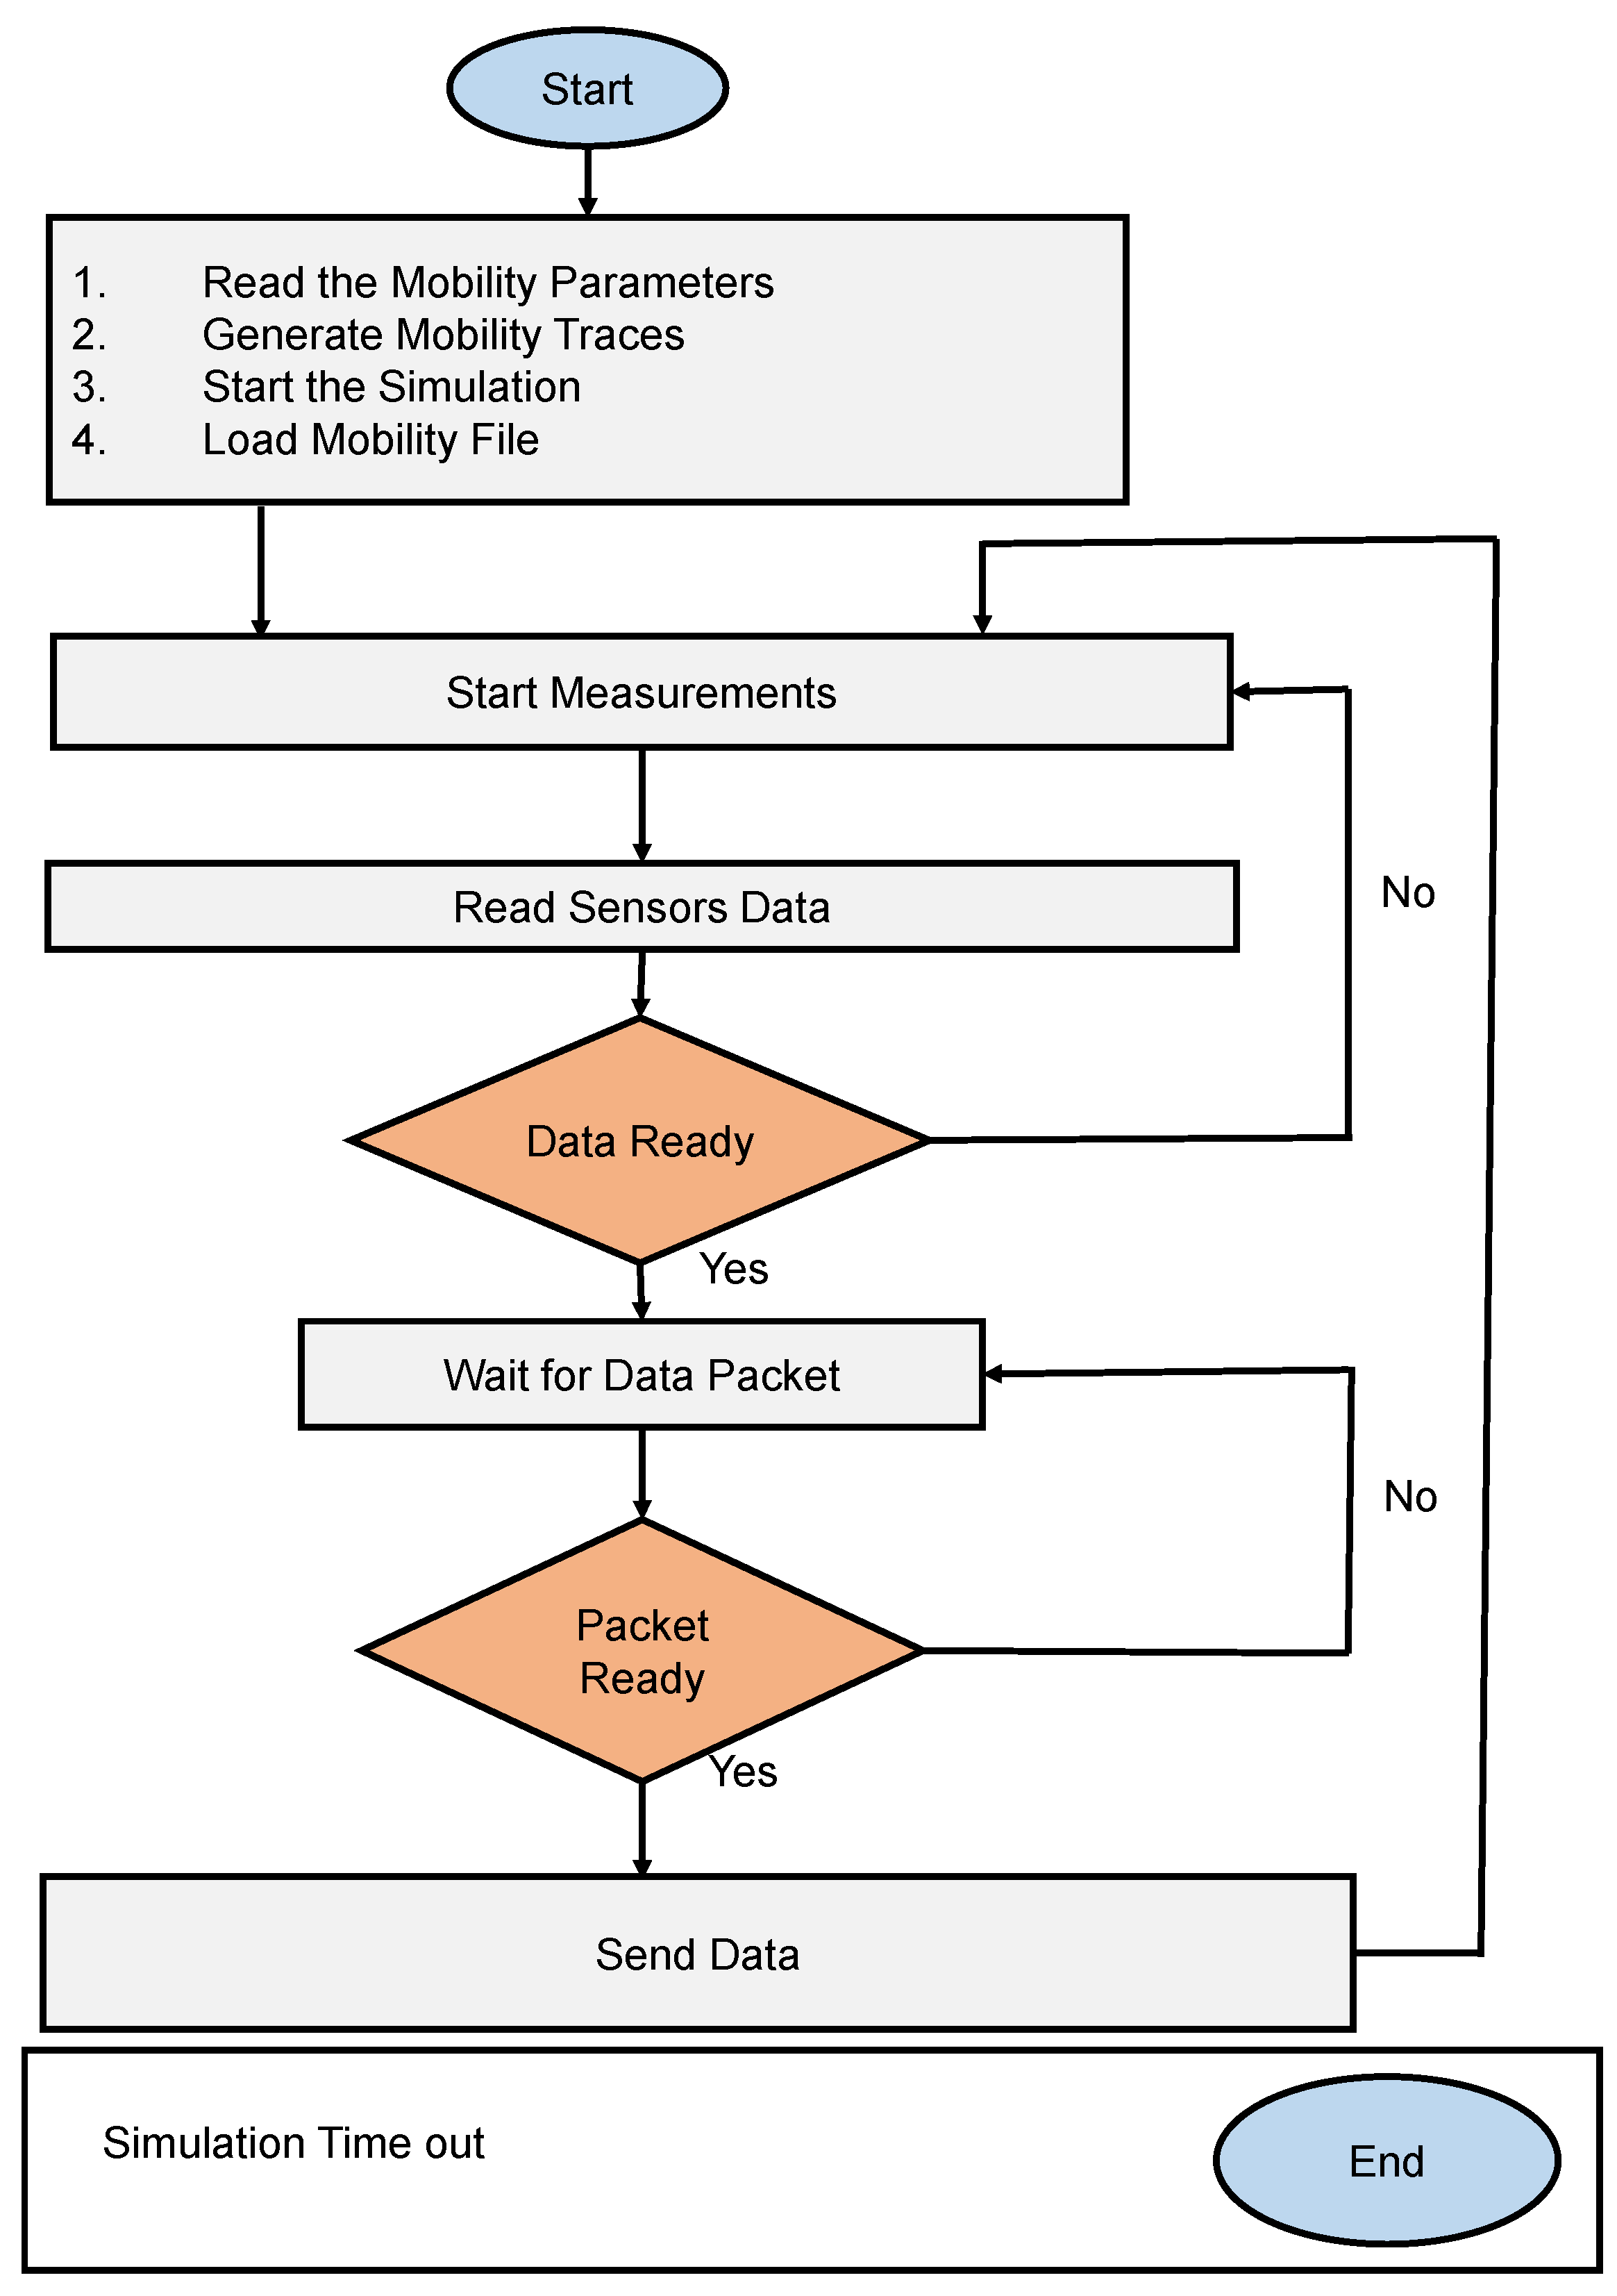
4.3. Simulation Flow Chart
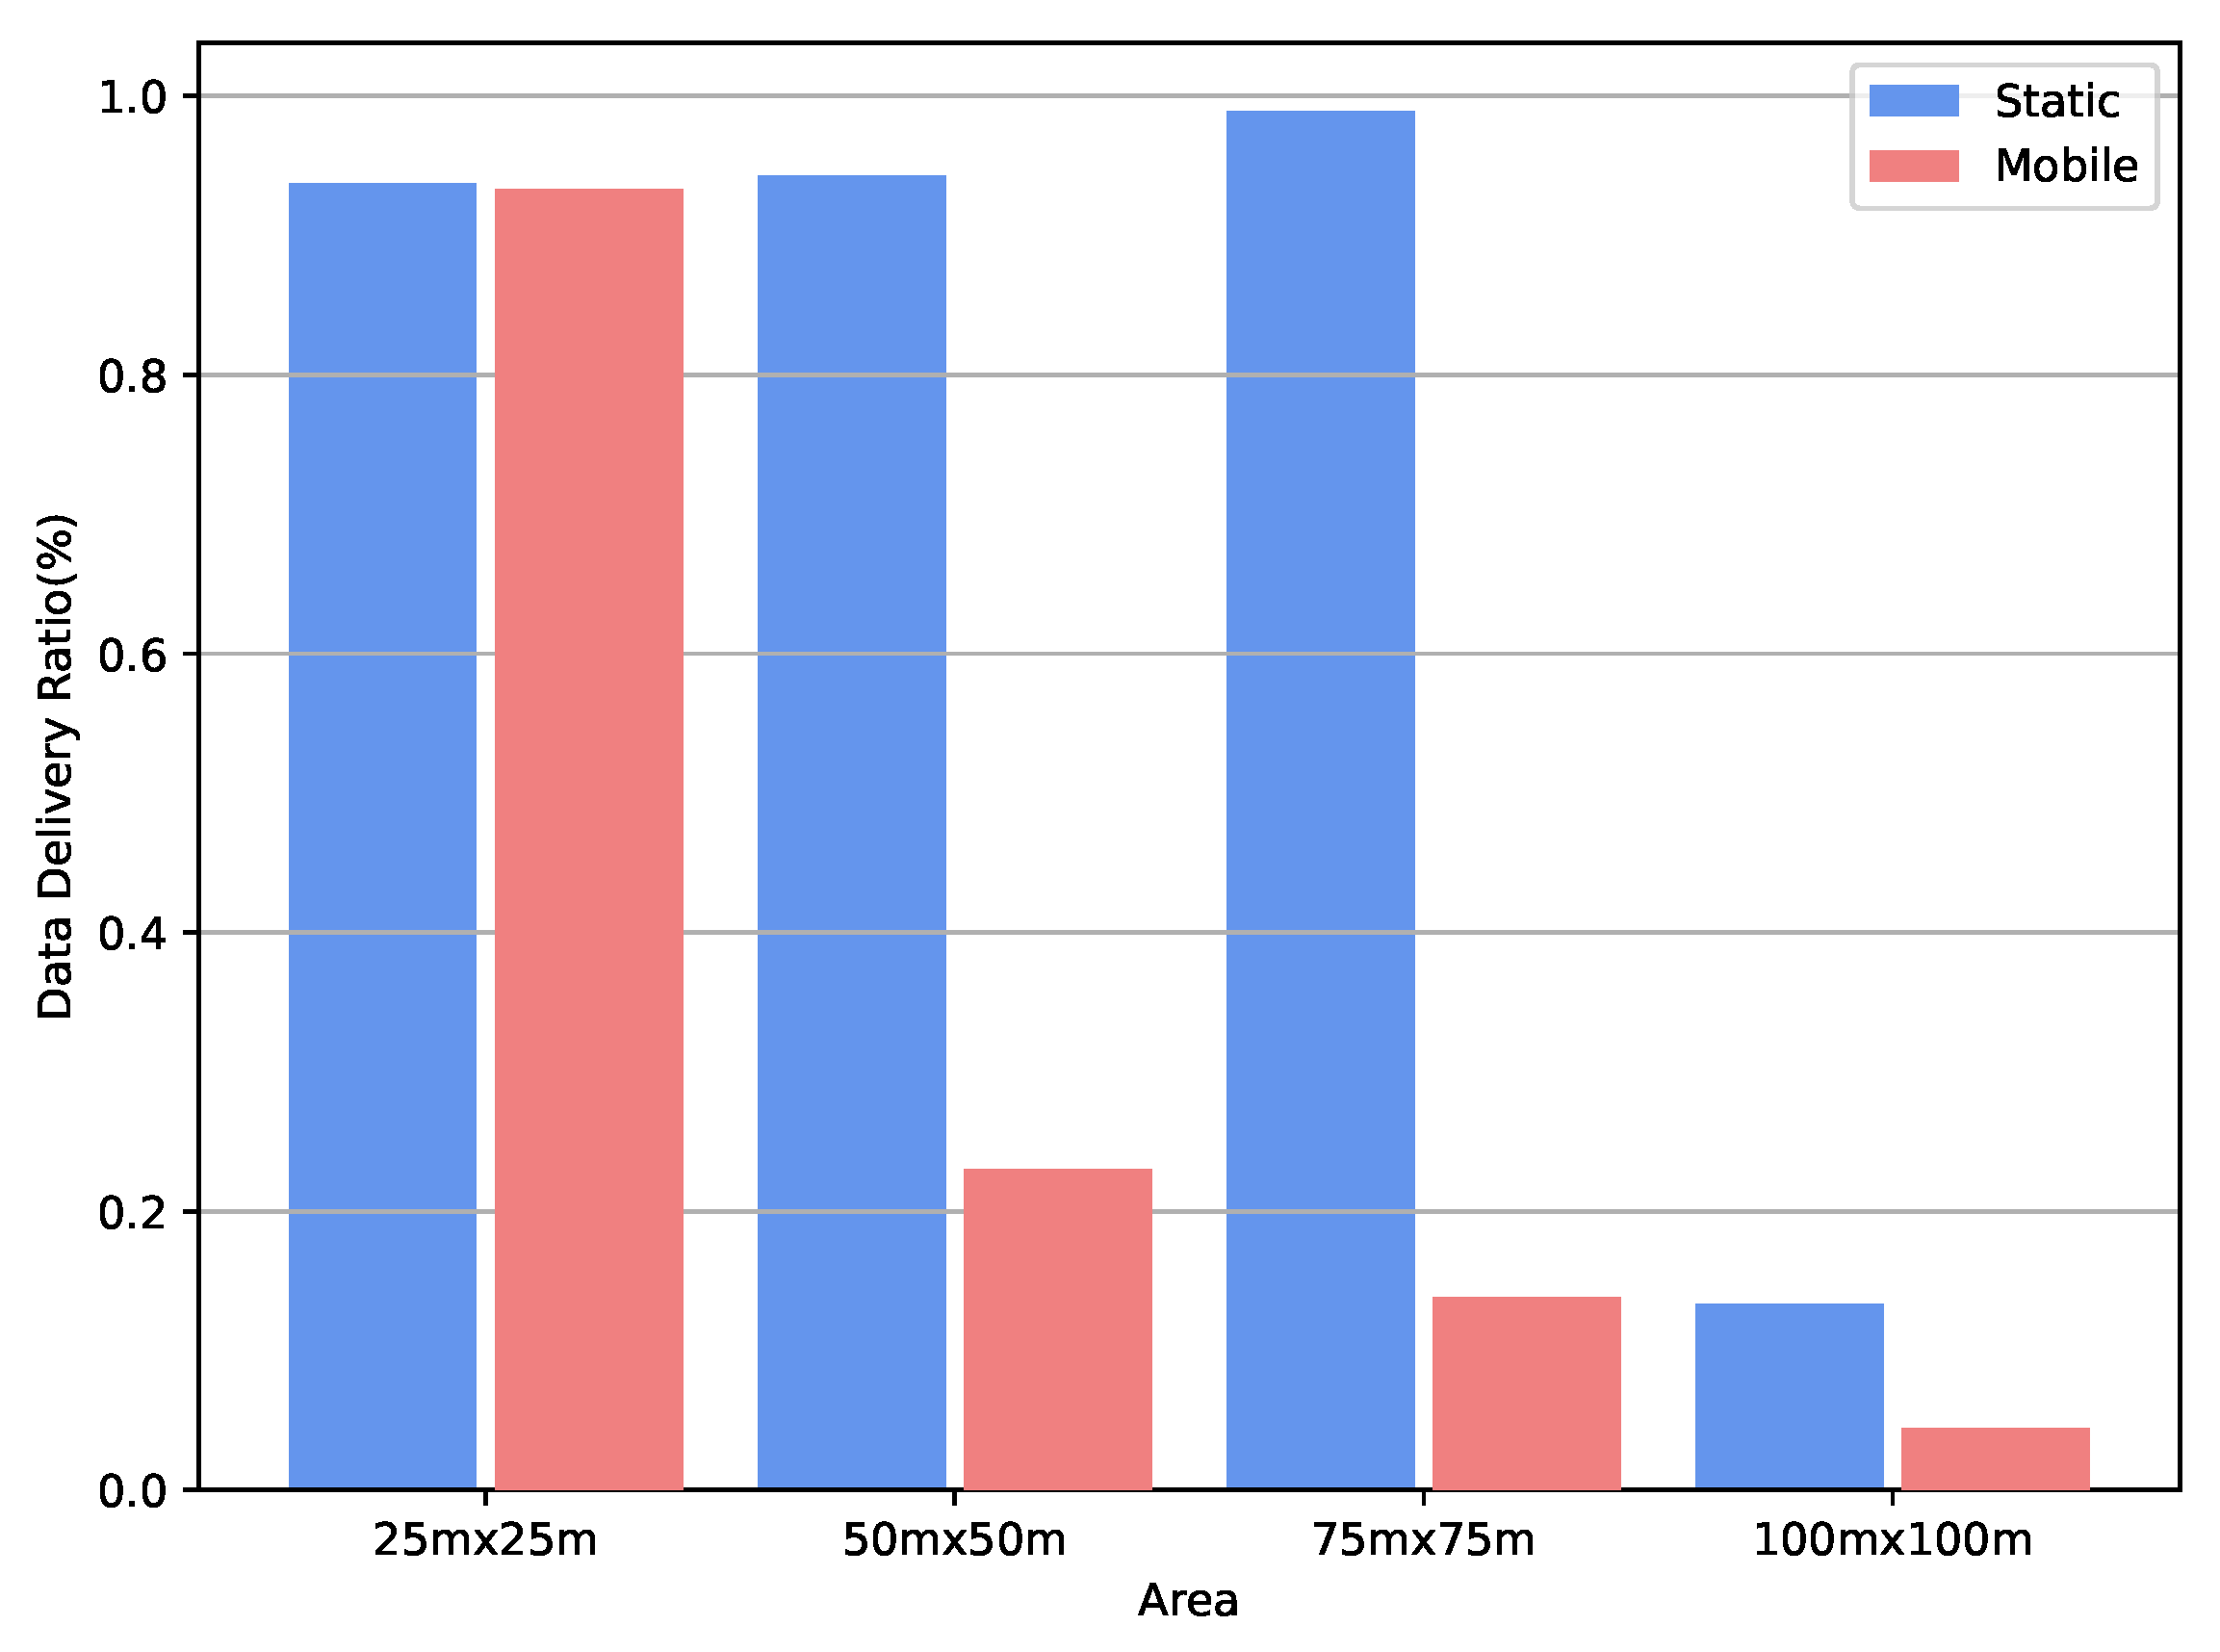
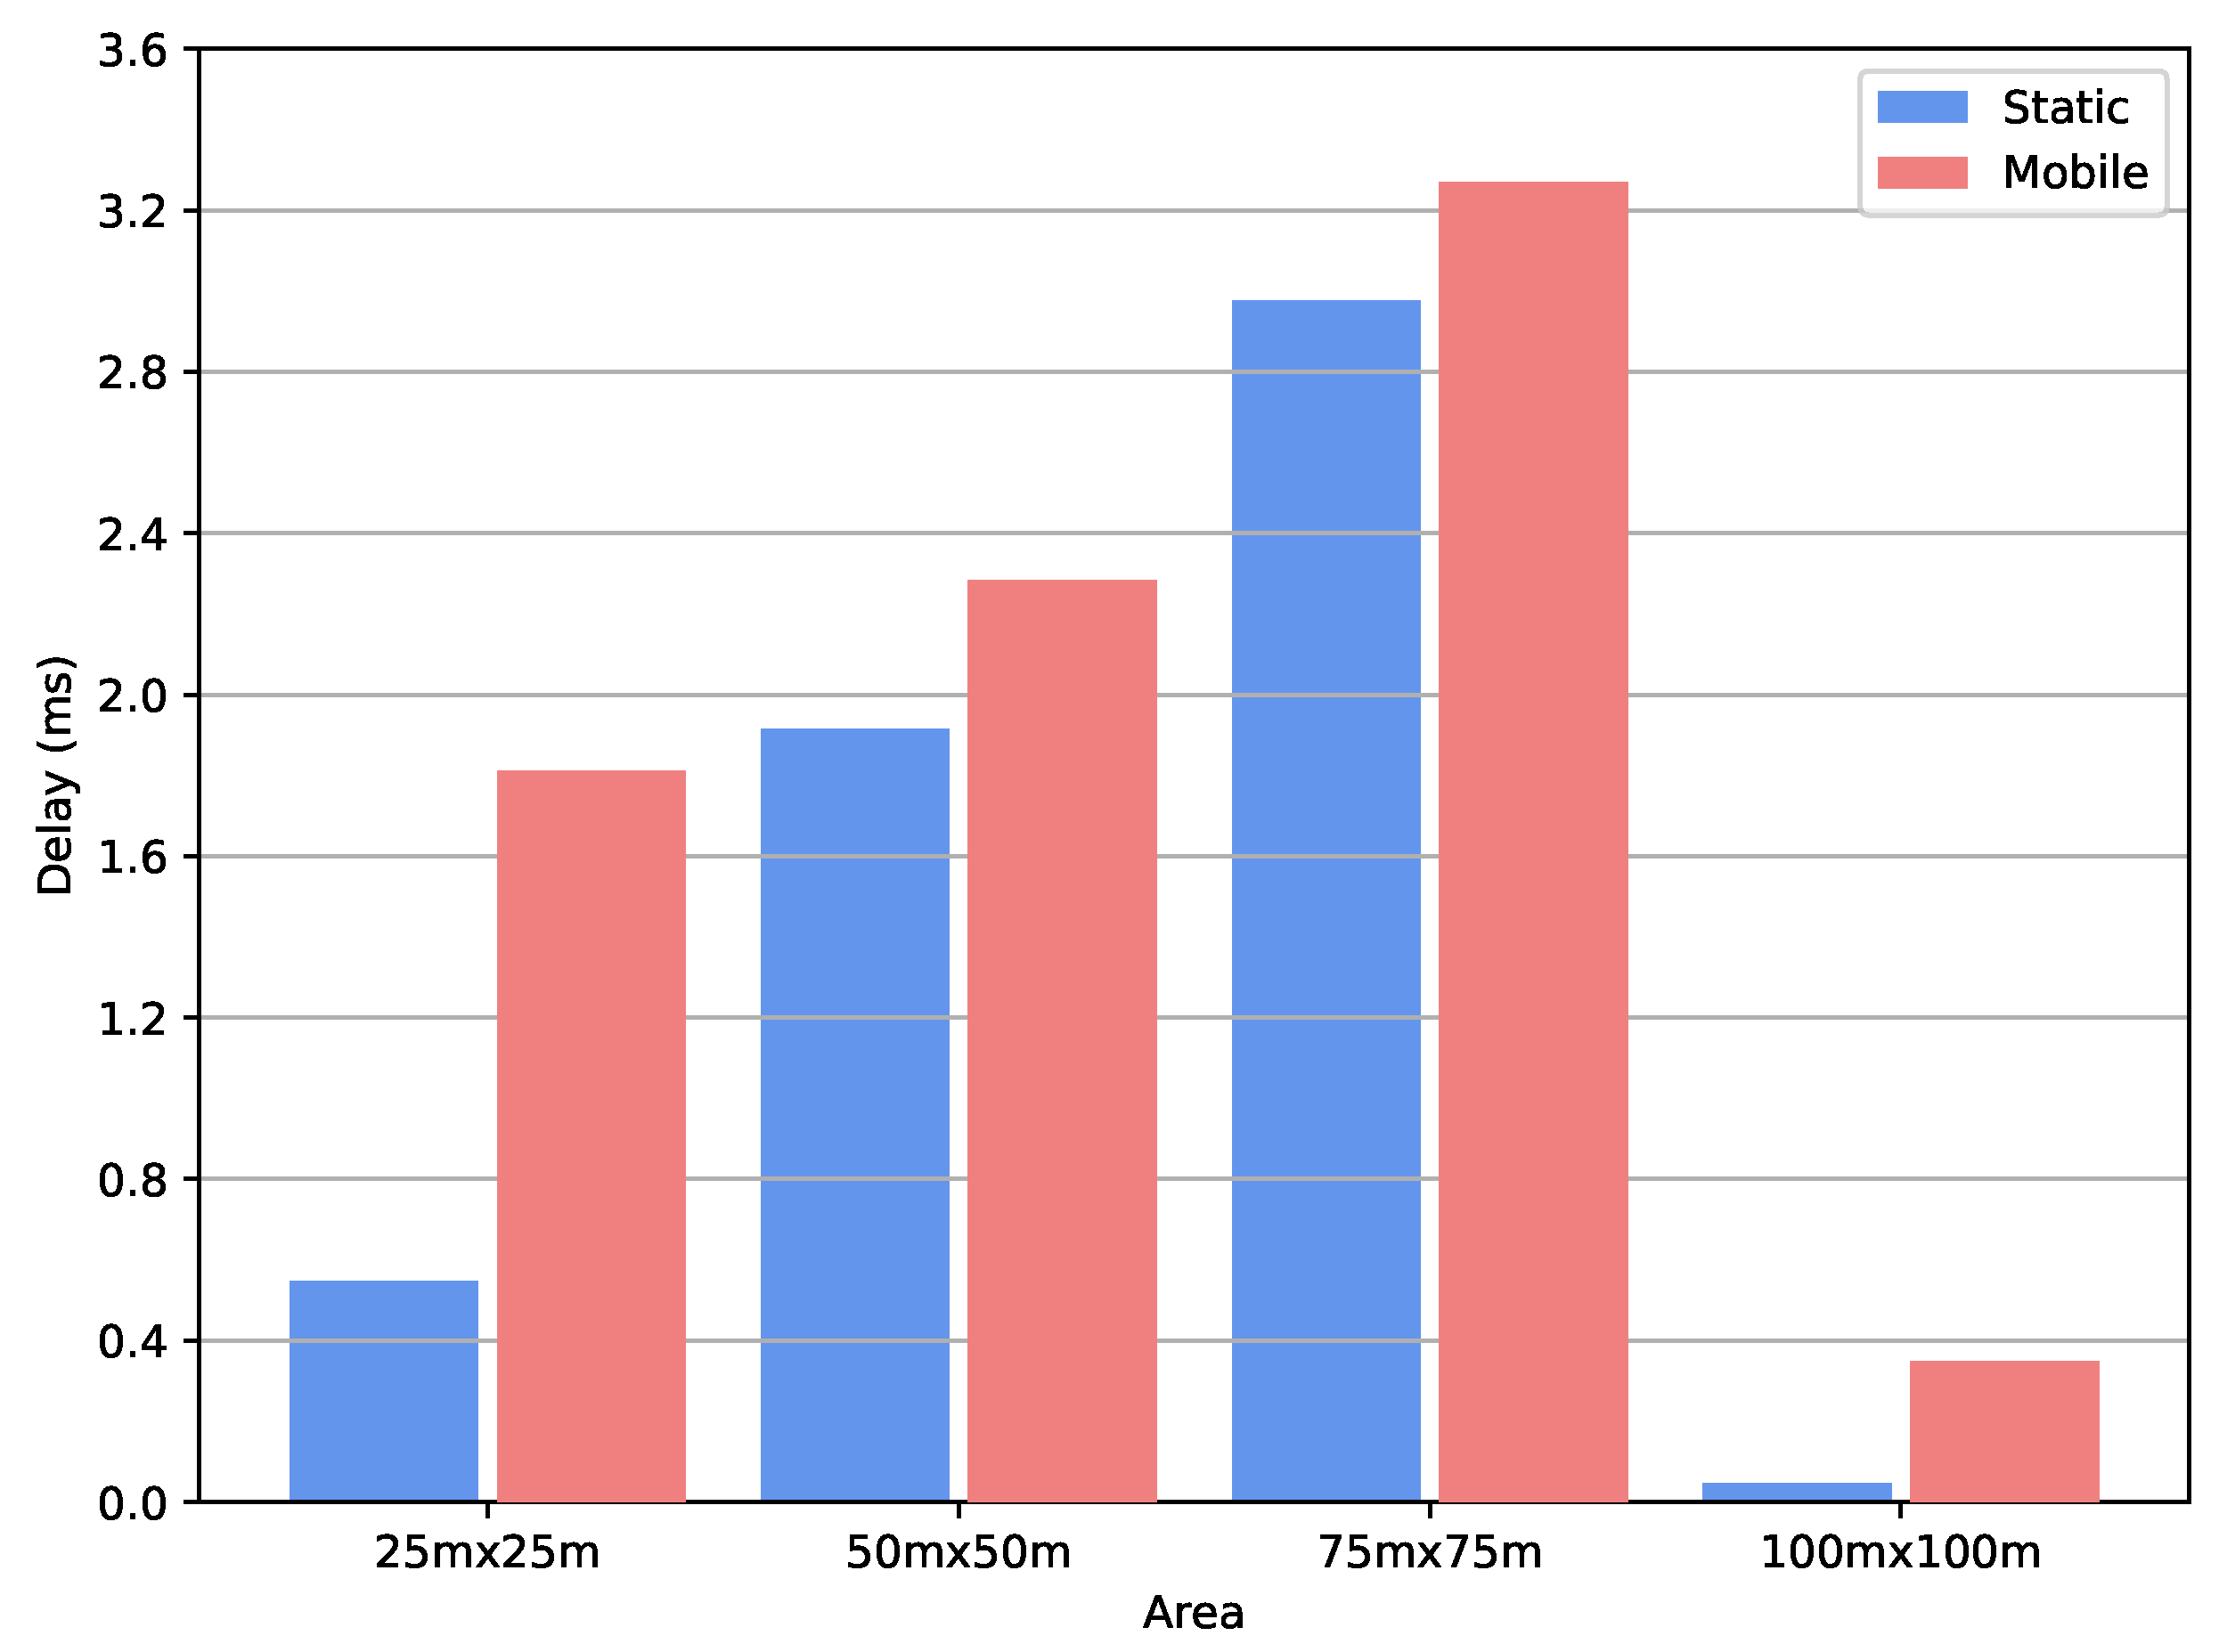
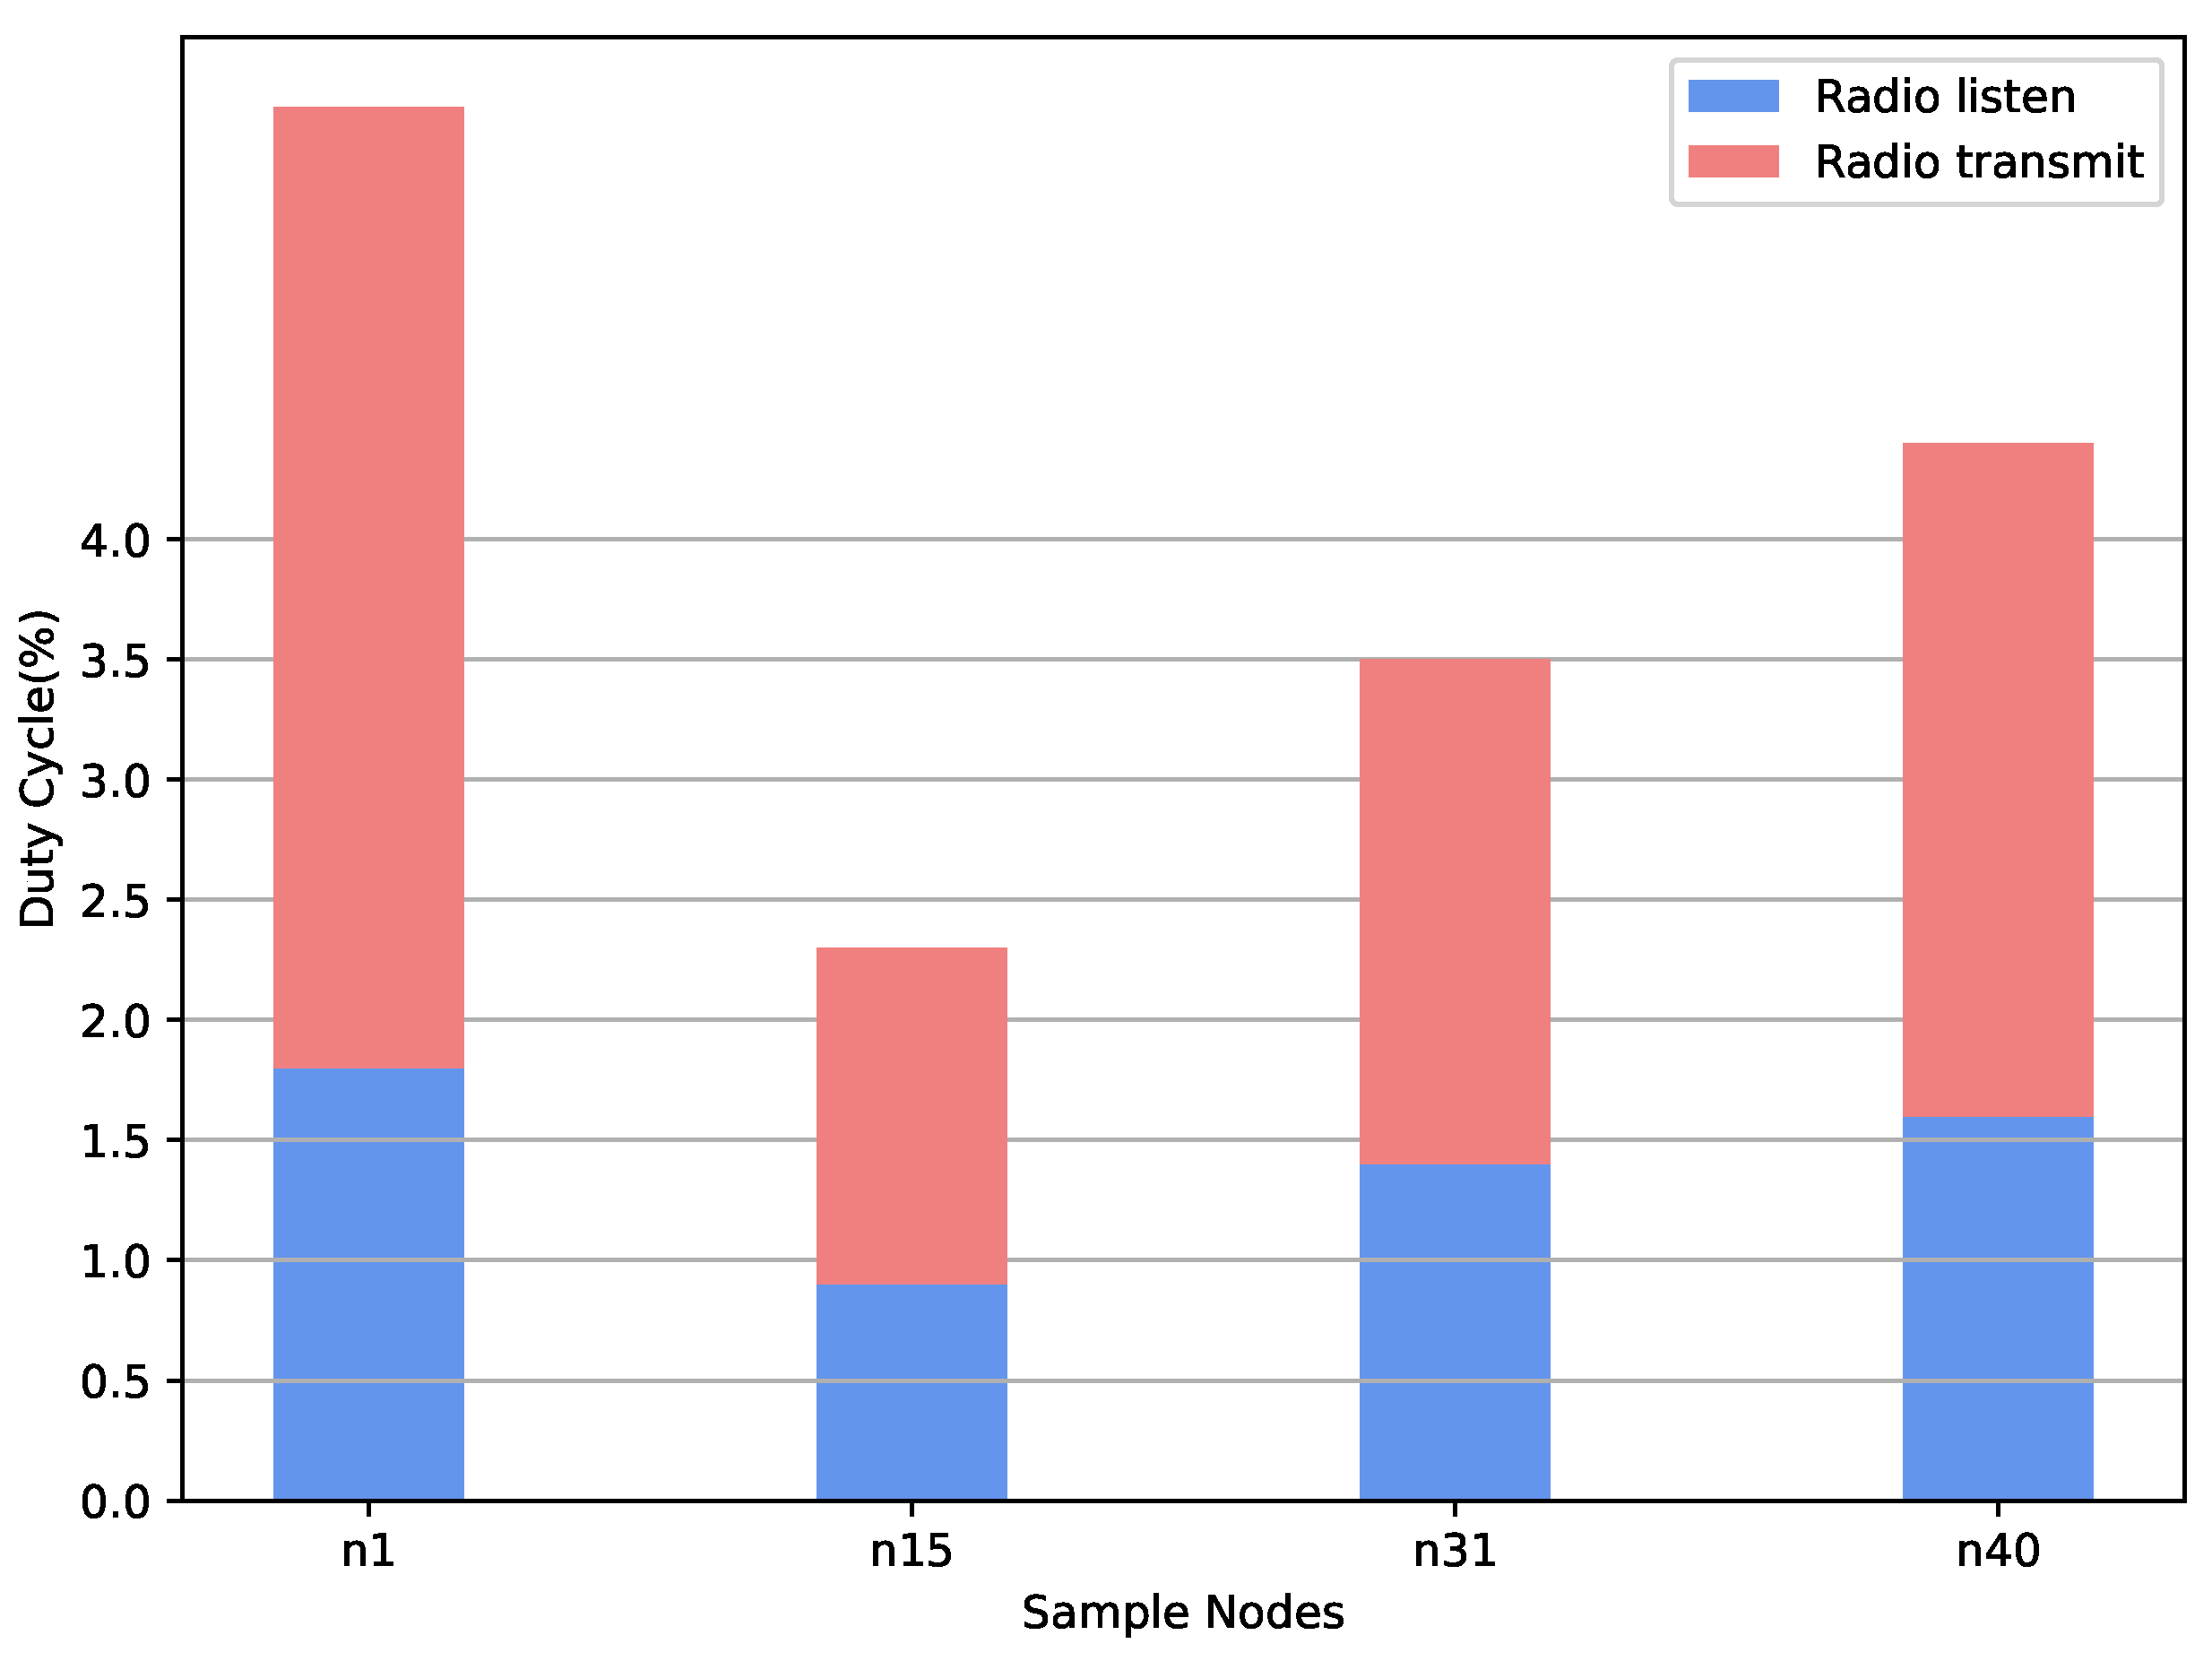
Figure 5 presents the flowchart of the suggested simulation sessions, starting with determining the mobility parameters and then generating the corresponding mobility file that will be loaded to the simulator once the simulation is started. The nodes can be mobile nodes or static, stationary nodes. Next, the system measures the sensor set data parameters, as in Table 4. The packets are created and sent after sensors collect the data, and the WSN can work as a relay in multi-hop communication; therefore, it can forward (broadcast) the received packet to its neighbors.

4.4. Data Analysis

After collecting the data, a Python script was developed using the Pandas library for data analysis and Matplotlib for plotting charts. The collected data from the simulation was processed and analyzed using statistical methods to obtain the necessary metrics for further analysis. The script was used to calculate the sensor network graph’s average power consumption, radio duty cycle, and connectivity degrees. The simulation was run five times, and the average of the obtained data was taken for further analysis. The results were then plotted using Matplotlib to visualize the data trends and compare different scenarios.

5. Results Analysis and Discussion

The results of the experiments conducted in both scenarios were analyzed to evaluate the overall performance of the proposed framework. The results demonstrated that the proposed framework is suitable for both fixed and mobile scenarios, providing efficient communication performance and low latency. Additionally, the results showed the advantages of using RPL protocol for routing in mobile and fixed sensor networks, which supports dynamic topologies and improves the overall network performance. The results also highlighted the impact of node density and area coverage on the overall system performance in the fixed scenario, as well as the impact of mobility on the performance in the mobile scenario. The random waypoint model used to simulate the movement of horses in the stable scenario was found to be suitable to simulate the movement of horses. Overall, the proposed framework is a promising solution for precision agriculture applications and can be further enhanced by incorporating more advanced technologies and techniques to improve its performance and scalability.
Using simulation as a validation method for the proposed framework in precision agriculture applications offers several advantages. One of the key advantages is the ability to realistically compare the networking performance indices of both fixed and mobile nodes using the same simulation settings. By combining these two scenarios, the simulation allows us to capture the effect of mobility on both applications, and thus provide a comprehensive understanding of the system’s behavior in different scenarios. Moreover, using a software simulator such as COOJA enables us to test the system in a controlled environment, which can minimize the cost and complexity of implementing the system in a real-world setting. Furthermore, the simulation results can be easily replicated and verified, providing a high level of confidence in the validity of the results.
The first set of results compares the performance of the proposed framework in a fixed IoT application scenario, where a single static sink node is utilized to collect sensor data from 36 static nodes distributed in different square areas of 25 m × 25 m, 50 m × 50 m, 75 m × 75 m, and 100 m × 100 m. The second set of results, on the other hand, represents a mobile IoT application scenario, where a single static sink node is utilized to collect sensor data from 36 mobile nodes that move based on the random waypoint model (RWP). In order to compare the performance of both scenarios, experiments used the hop count metric as a measure of the number of hops along the path between a node and the destination. Figure 6 shows a comparison of the average end-to-end packet delivery ratio (PDR) between the mobile nodes and the sink node, calculated over five runs for a 4-h duration for each run. This metric is used to evaluate the reliability of the network in delivering data packets from the source to the destination.
When all nodes are static, as with trees, all packets sent to the sink node from a node follow the same path; therefore, the hop count is fixed for all delivered packets.
H S ( i ) = h i
A v e r a g e H S = 1 m i = 1 m H S ( i )
In Equation (1), H S ( i ) represents the hop count for all packets sent from node i to the sink, whereas Equation (2) calculates the average hop count for all successful packets sent from all m static source nodes to the sink.
The network topology keeps changing for the hop count in the mobile scenario; therefore, the packets sent to the sink from a node may follow different paths and result in different hop counts for different packets.
H M ( i , k ) = h i k
A v e r a g e H M = 1 m i = 1 m k = 1 m H M ( i , k )
In Equation (3), H M ( i , k ) represents the hop count for packet k sent by node I, which is successfully received at the sink node. Equation (4) calculates the average hop count for all n successful packets sent from all m mobile source nodes to the sink. In these equations, P D R is defined as the ratio of data packets received by the destination to those generated by the source; it is mathematically defined by Equation (5).
P D R = R S
where S represents the sum of all data packets generated by all sources and R represents the sum of all correctly received data packets at the sink node. Further, the results consider the common term “end-to-end delay”, which indicates the average time required for a data packet to be transmitted across the network from the source to the destination, and it is mathematically presented as Equation (6).
E E D = T N
where T represents the summation of time spent to deliver all successfully, N received packets to the sink by all source nodes in the network.
In addition, experiments consider network connectivity, which represents the percentage of all nodes that can deliver at least one packet to the sink, and it varies from 100% to 0%.
Figure 6 shows the average PDR for different cases. PDR in the static case is always higher than the PDR in the mobile case for different simulation areas. Here, PDR increases while moving from the dense network 25 × 25 to a less dense network when the congestion level decreases. Further, the PDR is worse for a spare network ( 100 × 100 . There are no path details from all nodes to the sink, and some nodes become isolated because of the poor graph connectivity, and the poor PDR for mobile nodes 50 × 50 and 75 × 75 compared to static nodes result from the frequent changes in the network topology with mobile nodes. The RPL route reconfiguration cannot cope with the fast network topology changes that result in connectivity loss and, therefore, the failure in the delivery of the data when mobile sensor nodes move out of the transmission range of the parent nodes.
The mobility of sensor nodes in WSNs provided new challenges in packet delivery ratio and energy consumption because the positions of sensor and sink nodes continue to change, resulting in connection failure. Therefore, the node cannot send packets to the parent and is dropped. As shown in Figure 7, experiments map the node to the number of hops; experiments increase the delay with an increase in the number of hops. The delay does not decrease for the nodes at one hop from the sink; however, the delay decreases considerably for nodes on the periphery, especially for those far away from the DAG root. This is a general observation for a very dense network, which is not present in our case. The average number of neighbor node density = the average number of neighbors. Further, the term “dense networks” defines networks with many nodes within a small area, and such networks affect network performance. In high-density networks, nodes are required to send many more messages to check the availability of the network where the congestion and collision between packets are very high and result in an increase in the transmission delay; this requires more resources.
As shown in Figure 8, the red values represent the percentage of time for which the node stayed in the listening mode and listened to the radio messages exchanged by the other nodes. The average listening percentage is approximately 1.75%. The blue values indicate the percentage of time the node stayed in transmission mode, i.e., when the node sent packets to other nodes. The average transmission rate was approximately 2.5%. The network graph represents links between the sender and sinks nodes, as shown in Table 5.
In Figure 9, each bar on the Y-axis indicates the average total power composite of the four power elements (LPM, CPU, radio listen, and radio transmit). The link power management (LPM) represents low power, equal to 0.1 mW. The CPU computer programming unit was 0.85 mW, whereas the average radio listening power was 2.75 mW. Further, the average radio transmission power was 3 mW.

6. Practical and Research Implications

The proposed framework for integrating IoT systems in precision agriculture provides a comprehensive solution for the effective planning and implementation of IoT systems in precision agriculture applications. The proposed system effectively combines an array of sensor measurements, communication technologies, middleware, and applications to provide automated decision-making support. The experimental results obtained through simulation demonstrate the suitability of the proposed framework for both fixed and mobile scenarios, providing efficient communication performance and low latency. Additionally, the results show the advantages of using RPL protocol for routing in mobile and fixed sensor networks, which supports dynamic topologies and improves the overall network performance.
This research has several practical implications for precision agriculture. First, the proposed framework provides an efficient solution for monitoring and managing agricultural and livestock farms. The system can be used to collect essential information from the fields, such as plant health and soil moisture levels, and transmit it to a specific application for analysis and decision-making. This can help farmers improve crop yields, reduce water usage, and prevent crop damage. Furthermore, automated machine learning can also be used to model the sensor data to predict the condition and needs of the crops.
Additionally, this research has important research implications. The proposed framework is a promising solution for precision agriculture and can be further enhanced by incorporating more advanced technologies and techniques to improve its performance and scalability. The experimental results obtained through simulation provide a foundation for further research on the performance of IoT systems in precision agriculture. Moreover, the proposed framework can be extended to other application domains that require efficient data collection and management, such as smart cities and industrial IoT.
A limitation of this methodology was the use of only simulation to validate the framework; hence, the results may not be exactly the same as those obtained in a real-world setting. However, using simulation as a validation method for the proposed framework in precision agriculture applications offers several advantages, such as the ability to realistically compare the networking performance indices of both fixed and mobile nodes using the same simulation settings. Additionally, the simulation results can be easily replicated and verified, providing a high level of confidence in the validity of the results.
One potential area for future improvement in this study is the integration of automated machine learning (AutoML) techniques to model the sensor data collected by the IoT system. By applying AutoML algorithms, the proposed framework can automatically identify patterns and anomalies in the sensor data and predict the condition and needs of the crops. This can help farmers make more accurate and timely decisions about crop management, such as when to water, fertilize, or apply pesticides. Additionally, by automating the modeling process, the proposed framework can provide more accurate predictions with less human intervention, reducing the time and resources required for manual data analysis. Overall, the integration of AutoML techniques can help to improve the performance and scalability of the proposed framework, making it even more useful for precision agriculture applications.
Future improvements include testing the proposed framework in a real-world setting to validate the simulation results, as well as investigating the use of more advanced technologies and techniques, such as machine learning, to improve the performance and scalability of the proposed framework. Additionally, more work needs to be performed to evaluate the proposed framework in different network topologies and environments to understand its behavior in different scenarios.

7. Discussion

The proposed framework for integrating IoT systems in precision agriculture was evaluated in two different scenarios: a fixed IoT application scenario in olive tree farms and a mobile IoT application scenario in horse stables. The results of the experiments conducted in both scenarios were analyzed to evaluate the overall performance of the proposed framework.
In the fixed scenario, the results highlighted the impact of node density and area coverage on the overall system performance. The average end-to-end packet delivery ratio (PDR) between the nodes and the sink node was calculated over five runs for a 4-h duration for each run, as shown in Figure 7. The results indicate that as the node density increases, the PDR also increases, indicating that a higher node density results in better network performance. Similarly, as the area coverage increases, the PDR also increases, indicating that a larger coverage area results in better network performance.
In the mobile scenario, the results highlighted the impact of mobility on performance. The mobile nodes were simulated using the random waypoint model (RWP), which distributes the nodes randomly within predefined simulation areas after the start of the simulation. The simulation setting for the speed of the mobile nodes was uniformly selected between 1 and 2 m/s. The hop count metric was used to evaluate the reliability of the network in delivering data packets from the source to the destination. The results indicate that as the mobility of the nodes increases, the hop count also increases, indicating that a higher mobility results in a higher hop count and a lower PDR.
The simulation results showed that the proposed framework is suitable for both fixed and mobile scenarios, providing efficient communication performance and low latency. The results also highlighted the impact of node density and area coverage on the overall system performance in the fixed scenario, as well as the impact of mobility on the performance in the mobile scenario. The simulation results are a promising solution for precision agriculture applications and can be further enhanced by incorporating more advanced technologies and techniques to improve its performance and scalability.
It is important to note that using simulation as a validation method for the proposed framework in precision agriculture applications offers several advantages. One of the key advantages is the ability to realistically compare the networking performance indices of both fixed and mobile nodes using the same simulation settings. By combining these two scenarios, the simulation allows us to capture the effect of mobility on both applications, and thus provide a comprehensive understanding of the system’s behavior in different scenarios. Moreover, using a software simulator such as COOJA enables us to test the system in a controlled environment, which can minimize the cost and complexity of implementing the system in a real-world setting. Furthermore, the simulation results can be easily replicated and verified, providing a high level of confidence in the validity of the results.

8. Conclusions

In conclusion, the proposed framework for integrating IoT systems in precision agriculture applications is a promising solution for managing agricultural and livestock farms. The simulation results obtained using the COOJA simulator demonstrate the effectiveness of the proposed framework in both fixed and mobile scenarios. The results also indicate that network connectivity and average hop count play crucial roles in the performance of RPL in precision agriculture applications. Additionally, the best end-to-end packet delivery probability was achieved for network scenarios of 75 × 75 and 100 × 100 for both the olive tree and horse stable scenarios. The results also demonstrate that the average end-to-end delay is directly proportional to the average hop count. As the network becomes denser with a decrease in the network area, there is an increase in network connectivity and a decrease in hop count. This research can serve as a foundation for future studies to enhance the performance and scalability of the proposed framework.
One limitation of this methodology is that the simulation results may not fully represent the real-world performance of the proposed framework in precision agriculture applications. This is because the simulation does not take into account various real-world factors that may affect the performance of the system, such as environmental conditions, human factors, and unexpected failures. Therefore, further validation of the proposed framework in real-world settings is necessary to ensure its reliability and effectiveness in precision agriculture applications.
In terms of future improvements, incorporating advanced technologies such as machine learning algorithms and edge computing can enhance the performance and scalability of the proposed framework. Additionally, integrating more sophisticated sensor technologies such as drones and cameras can provide a more comprehensive understanding of the farm environment. Furthermore, incorporating a more dynamic mobility model for the mobile scenario can provide a more realistic representation of the movement of animals in precision agriculture applications.

Author Contributions

Conceptualization, S.A., K.F.B.H. and H.M.; methodology, S.T. and A.G.; software, M.D. (Mohammad Daradkeh) and Y.H.; validation, M.D. (Mohammad Daradkeh) and S.A.; formal analysis, A.G.; investigation, A.G.; writing—original draft preparation, M.D. (Mohammad Daradkeh); writing—review and editing, M.D. (Motaz Daadoo) and Y.H.; supervision, W.M.; project administration, M.D. (Motaz Daadoo), W.M. and A.G. All authors have read and agreed to the published version of the manuscript.

Funding

This research received no external funding.

Informed Consent Statement

Not applicable.

Data Availability Statement

Not applicable.

Conflicts of Interest

The authors declare no conflict of interest.

References

  1. Zhang, X.; Cao, Z.; Dong, W. Overview of edge computing in the agricultural Internet of Things: Key technologies, applications, challenges. IEEE Access 2020, 8, 141748–141761. [Google Scholar] [CrossRef]
  2. Ashton, K. That ‘Internet of Things’ thing. RFID J. 2009, 22, 97–114. [Google Scholar]
  3. Sreekantha, D.; Kavya, A. Agricultural crop monitoring using IOT-a study. In Proceedings of the 2017 11th International Conference on Intelligent Systems and Control (ISCO), Coimbatore, India, 5–6 January 2017; pp. 134–139. [Google Scholar]
  4. Aziz, K.; Tarapiah, S.; Alsaedi, M.; Ismail, S.H.; Atalla, S. Wireless sensor networks for road traffic monitoring. Int. J. Adv. Comput. Sci. Appl. 2015, 6, 265–270. [Google Scholar] [CrossRef] [Green Version]
  5. El Hendy, M.; Atalla, S.; Miniaoui, S.; Daradkeh, M.; Mansoor, W.; Bin Hashim, K.F. Hybrid Approach for Developing Strategic ICT Framework for Smart Cities—A Case Study of Dubai’s Toll Gates (Salik). Smart Cities 2022, 5, 1554–1573. [Google Scholar] [CrossRef]
  6. Sanjeevi, P.; Prasanna, S.; Siva Kumar, B.; Gunasekaran, G.; Alagiri, I.; Vijay Anand, R. Precision agriculture and farming using Internet of Things based on wireless sensor network. Trans. Emerg. Telecommun. Technol. 2020, 31, e3978. [Google Scholar] [CrossRef]
  7. Arreaga, N.X.; Blanc, S.; Rivas, L.V.; Palanca, S. Implementation of choreography services for precision agriculture based on real-time monitoring and control system using WSN. J. Wirel. Commun. Netw. 2021, 2021, 1–20. [Google Scholar]
  8. Mahajan, H.B.; Badarla, A.; Junnarkar, A.A. CL-IoT: Cross-layer Internet of Things protocol for intelligent manufacturing of smart farming. J. Ambient. Intell. Humaniz. Comput. 2021, 12, 7777–7791. [Google Scholar] [CrossRef]
  9. Zamora-Izquierdo, M.A.; Santa, J.; Martínez, J.A.; Martínez, V.; Skarmeta, A.F. Smart farming IoT platform based on edge and cloud computing. Biosyst. Eng. 2019, 177, 4–17. [Google Scholar] [CrossRef]
  10. Sun, Y.; Ding, W.; Shu, L.; Li, K.; Zhang, Y.; Zhou, Z.; Han, G. On enabling mobile crowd sensing for data collection in smart agriculture: A vision. IEEE Syst. J. 2021, 16, 132–143. [Google Scholar] [CrossRef]
  11. Sheng, R.T.C.; Huang, Y.H.; Chan, P.C.; Bhat, S.A.; Wu, Y.C.; Huang, N.F. Rice Growth Stage Classification via RF-Based Machine Learning and Image Processing. Agriculture 2022, 12, 2137. [Google Scholar] [CrossRef]
  12. Huang, T.W.; Bhat, S.A.; Huang, N.F.; Chang, C.Y.; Chan, P.C.; Elepano, A.R. Artificial intelligence-based real-time pineapple quality classification using acoustic spectroscopy. Agriculture 2022, 12, 129. [Google Scholar] [CrossRef]
  13. Nandyala, C.S.; Kim, H.K. Green IoT agriculture and healthcare application (GAHA). Int. J. Smart Home 2016, 10, 289–300. [Google Scholar] [CrossRef] [Green Version]
  14. Vangala, A.; Das, A.K.; Chamola, V.; Korotaev, V.; Rodrigues, J.J. Security in IoT-enabled smart agriculture: Architecture, security solutions and challenges. Clust. Comput. 2022, 1–24. [Google Scholar] [CrossRef]
  15. Abraham, A.; Dash, S.; Rodrigues, J.J.; Acharya, B.; Pani, S.K. AI, Edge and IoT-Based Smart Agriculture; Academic Press: Cambridge, MA, USA, 2021. [Google Scholar]
  16. Chen, Y.; Chanet, J.P.; Hou, K.M. RPL Routing Protocol a case study: Precision agriculture. In Proceedings of the First China-France Workshop on Future Computing Technology (CF-WoFUCT 2012), Harbin, China, 16–17 February 2012. [Google Scholar]
  17. Vasisht, D.; Kapetanovic, Z.; Won, J.; Jin, X.; Chandra, R.; Sinha, S.; Kapoor, A.; Sudarshan, M.; Stratman, S. FarmBeats: AnIoT Platform for Data-Driven Agriculture. In Proceedings of the 14th USENIX Symposium on Networked Systems Design and Implementation (NSDI 17), Boston, MA, USA, 27–29 March 2017; pp. 515–529. [Google Scholar]
  18. Cama-Pinto, D.; Holgado-Terriza, J.A.; Damas-Hermoso, M.; Gómez-Mula, F.; Cama-Pinto, A. Radio wave attenuation measurement system based on RSSI for precision agriculture: Application to tomato greenhouses. Inventions 2021, 6, 66. [Google Scholar] [CrossRef]
  19. Noda, A.; Fukuda, O.; Okumura, H.; Arai, K. Behavior analysis of a small animal using IoT sensor system. In Proceedings of the 2017 International Conference on Intelligent Informatics and Biomedical Sciences (ICIIBMS), Okinawa, Japan, 24–26 November 2017; pp. 9–10. [Google Scholar]
  20. Gordon, M.; Jerina, M.; Raub, R.; Davison, K.; Young, J.; Williamson, K. The effects of dietary manipulation and exercise on weight loss and related indices of health in horses. Comp. Exerc. Physiol. 2009, 6, 33–42. [Google Scholar] [CrossRef] [Green Version]
  21. Olsen, E.; Andersen, P.H.; Pfau, T. Accuracy and precision of equine gait event detection during walking with limb and trunk mounted inertial sensors. Sensors 2012, 12, 8145–8156. [Google Scholar] [CrossRef] [PubMed]
  22. Park, J.K.; Park, E.Y. Animal Monitoring Scheme in Smart Farm using Cloud-Based System. ECTI Trans. Comput. Inf. Technol. (ECTI-CIT) 2021, 15, 24–33. [Google Scholar] [CrossRef]
  23. Billah, M.M.; Yusof, Z.M.; Kadir, K.; Ali, A.M.M.; Ahmad, I. Real-time monitoring of water quality in animal farm: An IoT application. In Proceedings of the 2019 IEEE International Conference on Smart Instrumentation, Measurement and Application (ICSIMA), Kuala Lumpur, Malaysia, 27–29 August 2019; pp. 1–6. [Google Scholar]
  24. Michie, C.; Andonovic, I.; Davison, C.; Hamilton, A.; Tachtatzis, C.; Jonsson, N.; Duthie, C.A.; Bowen, J.; Gilroy, M. The Internet of Things enhancing animal welfare and farm operational efficiency. J. Dairy Res. 2020, 87, 20–27. [Google Scholar] [CrossRef]
  25. Liu, Y.; Li, D.; Du, B.; Shu, L.; Han, G. Rethinking Sustainable Sensing in Agricultural Internet of Things: From Power Supply Perspective. IEEE Wirel. Commun. 2022, 29, 102–109. [Google Scholar] [CrossRef]
  26. Lin, C.; Han, G.; Qi, X.; Du, J.; Xu, T.; Martinez-Garcia, M. Energy-optimal data collection for unmanned aerial vehicle-aided industrial wireless sensor network-based agricultural monitoring system: A clustering compressed sampling approach. IEEE Trans. Ind. Inform. 2020, 17, 4411–4420. [Google Scholar] [CrossRef]
  27. Germani, L.; Mecarelli, V.; Baruffa, G.; Rugini, L.; Frescura, F. An IoT architecture for continuous livestock monitoring using LoRa LPWAN. Electronics 2019, 8, 1435. [Google Scholar] [CrossRef] [Green Version]
  28. Essa, S.; Petra, R.; Uddin, M.R.; Suhaili, W.S.H.; Ilmi, N.I. IoT-based environmental monitoring system for Brunei peat swamp forest. In Proceedings of the 2020 International Conference on Computer Science and Its Application in Agriculture (ICOSICA), Bogor, Indonesia, 16–17 September 2020; pp. 1–5. [Google Scholar]
  29. Balaceanu, C.; Suciu, G.; Marcu, I. Libelium-based IoT Monitoring Solution for Precision Agriculture. J. E-Technol. Vol. 2019, 10, 1. [Google Scholar] [CrossRef]
  30. Marx, A.; Tetteh, G.O. A forest vitality and change monitoring tool based on RapidEye imagery. IEEE Geosci. Remote Sens. Lett. 2017, 14, 801–805. [Google Scholar] [CrossRef]
  31. Chaudhry, A.A.; Mumtaz, R.; Zaidi, S.M.H.; Tahir, M.A.; School, S.H.M. Internet of Things (IoT) and machine learning (ML) enabled livestock monitoring. In Proceedings of the 2020 IEEE 17th International Conference on Smart Communities: Improving Quality of Life Using ICT, IoT and AI (HONET), Charlotte, NC, USA, 14–16 December 2020; pp. 151–155. [Google Scholar]
  32. Yang, Y.; Ren, R.; Johnson, P.M. VetLink: A Livestock Disease-Management System. IEEE Potentials 2020, 39, 28–34. [Google Scholar] [CrossRef]
  33. Ma, S.; Yao, Q.; Masuda, T.; Higaki, S.; Yoshioka, K.; Arai, S.; Takamatsu, S.; Itoh, T. Development of noncontact body temperature monitoring and prediction system for livestock cattle. IEEE Sens. J. 2021, 21, 9367–9376. [Google Scholar] [CrossRef]
  34. Cardell-Oliver, R.; Smettem, K.; Kranz, M.; Mayer, K. Field testing a wireless sensor network for reactive environmental monitoring [soil moisture measurement]. In Proceedings of the 2004 Intelligent Sensors, Sensor Networks and Information Processing Conference, Melbourne, Australia, 14–17 December 2004; pp. 7–12. [Google Scholar]
  35. Daadoo, M.; Tarapiah, S.; Atalla, S. Dimensioning Mobile Wimax Network: A Case Study. ARPN J. Eng. Appl. Sci. 2017, 12, 462–470. [Google Scholar]
  36. Daadoo, M. Mobile Network Planning Process Case Study-3G Network. Comput. Inf. Sci. 2016, 9, 115–133. [Google Scholar]
  37. Tarapiah, S.; Aziz, K.; Atalla, S. Radio resource management in heterogeneous networks, functional models and implementation requirements. Int. J. Comput. Appl. 2015, 127, 1–4. [Google Scholar] [CrossRef]
  38. Brewster, C.; Roussaki, I.; Kalatzis, N.; Doolin, K.; Ellis, K. IoT in agriculture: Designing a Europe-wide large-scale pilot. IEEE Commun. Mag. 2017, 55, 26–33. [Google Scholar] [CrossRef]
  39. Cavaliere, D.; Loia, V.; Senatore, S. Towards a layered agent-modeling of IoT devices to precision agriculture. In Proceedings of the 2020 IEEE International Conference on Fuzzy Systems (FUZZ-IEEE), Glasgow, UK, 19–24 July 2020; pp. 1–8. [Google Scholar]
  40. Gaikwad, S.V.; Vibhute, A.D.; Kale, K.V.; Mehrotra, S.C. An innovative IoT based system for precision farming. Comput. Electron. Agric. 2021, 187, 106291. [Google Scholar] [CrossRef]
  41. Dunkels, A.; Gronvall, B.; Voigt, T. Contiki-a lightweight and flexible operating system for tiny networked sensors. In Proceedings of the 29th Annual IEEE International Conference on Local Computer Networks, Tampa, FL, USA, 16–18 November 2004; pp. 455–462. [Google Scholar]
  42. Keswani, B.; Mohapatra, A.G.; Keswani, P.; Khanna, A.; Gupta, D.; Rodrigues, J. Improving weather dependent zone specific irrigation control scheme in IoT and big data enabled self driven precision agriculture mechanism. Enterp. Inf. Syst. 2020, 14, 1494–1515. [Google Scholar] [CrossRef]
  43. Radočaj, D.; Jurišić, M.; Gašparović, M. The role of remote sensing data and methods in a modern approach to fertilization in precision agriculture. Remote Sens. 2022, 14, 778. [Google Scholar] [CrossRef]
  44. Bagha, H.; Yavari, A.; Georgakopoulos, D. Hybrid Sensing Platform for IoT-Based Precision Agriculture. Future Internet 2022, 14, 233. [Google Scholar] [CrossRef]
  45. Dong, X.; Vuran, M.C.; Irmak, S. Autonomous precision agriculture through integration of wireless underground sensor networks with center pivot irrigation systems. Ad Hoc Netw. 2013, 11, 1975–1987. [Google Scholar] [CrossRef]
  46. Issad, H.A.; Aoudjit, R.; Belkadi, M.; Rodrigues, J.J. Many-objective optimisation-based optimal drone deployment for agricultural zone. Int. J. Commun. Netw. Distrib. Syst. 2021, 26, 76–98. [Google Scholar] [CrossRef]
  47. Batista, J.O.R.; Mostaço, G.M.; Silva, R.F.; Bressan, G.; Cugnasca, C.E.; Martucci, M. Evaluating the Performance of a Simulated Softwarized Agricultural Wireless Sensor Network. In Information and Communication Technologies for Agriculture—Theme I: Sensors; Springer: Berlin/Heidelberg, Germany, 2022; pp. 121–137. [Google Scholar]
  48. Casella, E.; Khamesi, A.R.; Silvestri, S. A framework for the recognition of horse gaits through wearable devices. Pervasive Mob. Comput. 2020, 67, 101213. [Google Scholar] [CrossRef]
  49. Nardelli, M.; Lanata, A.; Valenza, G.; Felici, M.; Baragli, P.; Scilingo, E.P. A tool for the real-time evaluation of ECG signal quality and activity: Application to submaximal treadmill test in horses. Biomed. Signal Process. Control 2020, 56, 101666. [Google Scholar] [CrossRef]
  50. Nadimi, E.S.; Søgaard, H.; Bak, T.; Oudshoorn, F.W. ZigBee-based wireless sensor networks for monitoring animal presence and pasture time in a strip of new grass. Comput. Electron. Agric. 2008, 61, 79–87. [Google Scholar] [CrossRef] [Green Version]
  51. Kumar, A.; Hancke, G.P. A zigbee-based animal health monitoring system. IEEE Sens. J. 2014, 15, 610–617. [Google Scholar] [CrossRef]
  52. Bhavsar, A.; Arolkar, H.A. ZigBee Frame Structure for WSN Based Animal Health Monitoring in Rural Area of Gujarat. In Proceedings of the International Conference on Sustainable Computing in Science, Technology and Management (SUSCOM), Amity University Rajasthan, Jaipur, India, 26–28 February 2019. [Google Scholar]
  53. Sahana, K. Farm Vigilance: Smart IoT System for Farmland Monitoring and Animal Intrusion Detection using Neural Network. In Proceedings of the 2021 Asian Conference on Innovation in Technology (ASIANCON), Pune, India, 27–29 August 2021; pp. 1–6. [Google Scholar]
  54. Carels, D.; De Poorter, E.; Moerman, I.; Demeester, P. RPL mobility support for point-to-point traffic flows towards mobile nodes. Int. J. Distrib. Sens. Netw. 2015, 11, 470349. [Google Scholar] [CrossRef] [Green Version]
  55. Verdouw, C.; Wolfert, S.; Tekinerdogan, B. Internet of Things in agriculture. CAB Rev. Perspect. Agric. Vet. Sci. Nutr. Nat. Resour. 2016, 11, 1–12. [Google Scholar] [CrossRef]
  56. Baccelli, E.; Hahm, O.; Günes, M.; Wählisch, M.; Schmidt, T.C. RIOT OS: Towards an OS for the Internet of Things. In Proceedings of the 2013 IEEE conference on computer communications workshops (INFOCOM WKSHPS), Turin, Italy, 14–19 April 2013; pp. 79–80. [Google Scholar]
  57. Eriksson, J.; Österlind, F.; Finne, N.; Tsiftes, N.; Dunkels, A.; Voigt, T.; Sauter, R.; Marrón, P.J. COOJA/MSPSim: Interoperability testing for wireless sensor networks. In Proceedings of the 2nd International Conference on Simulation Tools and Techniques, Rome, Italy, 2–6 March 2009; pp. 1–7. [Google Scholar]
  58. Johnson, D.B.; Maltz, D.A. Dynamic source routing in ad hoc wireless networks. In Mobile Computing; Springer: Berlin/Heidelberg, Germany, 1996; pp. 153–181. [Google Scholar]
Figure 1. Proposed IoT system model for precision agriculture, showing the relationship between various entities such as sensors, network-enabling technologies, and agricultural resources for real-time monitoring and control.
Information 14 00205 g001
Figure 2. Process of identifying the measurement parameters requirements.
Information 14 00205 g002
Figure 3. IoT system for monitoring olive trees in a fixed position.
Information 14 00205 g003
Figure 4. IoT System for horse monitoring.
Information 14 00205 g004
Figure 5. Simulation Flowchart.
Information 14 00205 g005
Figure 6. Data delivery ratio for trees vs. animals.
Information 14 00205 g006
Figure 7. Data delay for trees vs. animals.
Information 14 00205 g007
Figure 8. Duty Cycle Percentage for Random nodes = [1, 15, 31, 40].
Information 14 00205 g008
Figure 9. Instantaneous Power Consumption for nodes = [1, 15, 31, 40].
Information 14 00205 g009
Table 1. Sensory Data used plant sensory data in precision agriculture.
MeasurementDescriptionRange [Unit]
Noncontact temperatureThe temperature of the surface of soil, fruits, vegetables−45–80 [ C]
Leaf and Fruit bud temperatureLeaf and fruit bud temperature−50–100 [ C]
Oxygen levelsIndoor and outdoor oxygen levels0–100 [% O ]
Ultraviolet radiationUV measurement level in outdoor250–400 [nm]
Photosynthetically active radiation (PAR)Photosynthetic photon flux density410–655 [nm]
Shortwave radiationShortwave radiation in agriculture0–2000 [m W 2 ]
Electrical conductivity, volumetric water content, and soilGreenhouse substrate temperature measurements1–80, 0–25, −40–60 [-, dS/m, C]
Temperature and volumetric water content of the soilBalance of soil in waterApparent dielectric Permittivity (a): 1 (air) to 80 (water) [Unit]
Vapor pressure, humidity, temperature, and atmospheric pressure in the soil and airVapor measurements in soil and waterdata range [Unit]
Leaf wetnesslevel of wetness of the plant leaf0–1400 [Counts]
Trunk diameterPlants’ trunk growth2-100 [cm]
Stem diameterPlants’ Stem growth0–20 [cm]
Fruit diameterPlants’ Fruit growth0–11 [cm]
Temperature, air humidity, and pressureEnvironmental Parameters0–65, 0–100, 30–110 [ C, kPa]
Table 2. Sensors Platforms for IoT in precision agriculture.
O.S PlatformDescriptionH.W PlatformKernel StructureProgramming Model
ContikiEvent-driven O.S suitable for constrained WSNTmote, Sky, TelosB, MicaZ, ESBModularEvent driven
TinyOSEvent-driven O.S suitable for constrained WSNTmote, Sky, TelosB, MicaZ, ESBMonolithicEvent driven
LinuxEvent-driven O.S suitable for constrained WSNTmote, Sky, TelosB, MicaZ, ESBHybridThreading
Table 3. Sensors Platforms and Simulation Settings.
ParameterValue
Number of nodes used31
Type of RoutingIPv6
Standard used6lowPan IEEE 802.15.4
Scenario area(25 × 25), ( 50 × 50), (75 × 75), and (100 × 100)
Type of transport protocolUDP
Transmission range and interface range20, 40
Transmission ratio and receiver ratio80,100
Mobility modelRandom waypoint
Table 4. Sensors Platforms and Sensors Data Parameters.
DataData TypeSize of Data in Bits
Speed rateFloat32
Air flow sensorFloat32
Body temperature sensorDouble64
Heart rate sensorFloat32
Indicate colicBoolean1
Table 5. Network Connectivity Parameters.
ScenarioTreesTreesAnimalsAnimals
 Avg HopsConnectivityAvg HopsConnectivity
25 × 251.2100%1.2597%
50 × 501.72100%1.591.9%
75 × 753100%1.755%
100 × 100411%1.638%
Disclaimer/Publisher’s Note: The statements, opinions and data contained in all publications are solely those of the individual author(s) and contributor(s) and not of MDPI and/or the editor(s). MDPI and/or the editor(s) disclaim responsibility for any injury to people or property resulting from any ideas, methods, instructions or products referred to in the content.

