Article

Continuous User Authentication on Multiple Smart Devices

School of Electronic and Electrical Engineering, Shanghai University of Engineering Science, Shanghai 201620, China
*
Author to whom correspondence should be addressed.
Information 2023, 14(5), 274; https://doi.org/10.3390/info14050274
Submission received: 14 March 2023 / Revised: 26 April 2023 / Accepted: 1 May 2023 / Published: 5 May 2023
(This article belongs to the Special Issue Advances in Computing, Communication & Security)

Abstract

:
Recent developments in the mobile and intelligence industry have led to an explosion in the use of multiple smart devices such as smartphones, tablets, smart bracelets, etc. To achieve lasting security after initial authentication, many studies have been conducted to apply user authentication through behavioral biometrics. However, few of them consider continuous user authentication on multiple smart devices. In this paper, we investigate user authentication from a new perspective—continuous authentication on multi-devices, that is, continuously authenticating users after both initial access to one device and transfer to other devices. In contrast to previous studies, we propose a continuous user authentication method that exploits behavioral biometric identification on multiple smart devices. In this study, we consider the sensor data captured by accelerometer and gyroscope sensors on both smartphones and tablets. Furthermore, multi-device behavioral biometric data are utilized as the input of our optimized neural network model, which combines a convolutional neural network (CNN) and a long short-term memory (LSTM) network. In particular, we construct two-dimensional domain images to characterize the underlying features of sensor signals between different devices and then input them into our network for classification. In order to strengthen the effectiveness and efficiency of authentication on multiple devices, we introduce an adaptive confidence-based strategy by taking historical user authentication results into account. This paper evaluates the performance of our multi-device continuous user authentication mechanism under different scenarios, and extensive empirical results demonstrate its feasibility and efficiency. Using the mechanism, we achieved mean accuracies of 99.8% and 99.2% for smartphones and tablets, respectively, in approximately 2.3 s, which shows that it authenticates users accurately and quickly.

1. Introduction

The use of smart devices has become an indispensable part of human daily lives and communications. According to a recent technology report [1], there were around 1.51 billion units of smartphones, 168.8 million units of tablets, and 533.6 million units of wearables that were shipped worldwide in 2021, and the global smartwatch market has been increasing over the last few years. Given the extensive usage of smart devices, users are likely to store large amounts of private data on their devices [2], which attracts attackers to effect unauthorized access. Normally, smart devices are protected by static authentication approaches including passwords, pattern locks, face recognition, and fingerprint scans to thwart unauthorized access. However, these popular mechanisms offer limited security. They are vulnerable to guessing, smudge attacks, side-channel attacks, and shoulder-surfing attacks. In addition, static approaches no longer meet the demand for adequate vigilance after authenticating users at login [3]. An attacker may access the user’s device after login of the originally authenticated user who cannot be verified as the user in control of the device.
Unlike one-time authentication methods, continuous or implicit authentication techniques have been developed to continuously observe user identity after login [4,5]. The device implements user authentication via behavioral biometric signals from sensitive inbuilt sensors such as an accelerometer, gyroscope, orientation monitor, touch screen, etc. Behavioral biometric-based schemes contribute to continuous protection against unauthorized users. However, owning and using multiple smart devices meanwhile brings new challenges in security and privacy [6]. When a user switches from one device to another, it is required to rebuild the continuous or implicit authentication model in the latter device [7]. This process means that when using multiple devices, existing continuous or implicit authentication mechanisms still allow one-time authentication and cannot achieve continuous authentication between multiple devices. Hence, we ask the following question—instead of only continuously monitoring user identity on one device, can we authenticate users on multiple smart devices in a continuous manner? In this paper, we addressed the continuous authentication concern from a broader perspective—not only continuously authenticating a smart device user on individual devices, but also continuously authenticating the user when he or she transfers to other smart devices. We developed a continuous authentication method that makes use of behavioral biometrics and can be applied to multiple smart device scenarios.
Smart devices are typically equipped with built-in sensors [8], touch screens [9], keyboard interfaces [10], and other accessories [11] that can be used to capture behavioral data. Continuous authentication systems essentially employ behavioral data originating from the user interaction with the mobile device to extract invariant features of user behavior. Many continuous authentication schemes identify the user through tapping or swiping captured by the keyboard interface and the touch screen [12]. However, it is inconvenient or impossible to manipulate keyboard interfaces or touch screens for some popular devices such as smartwatches and wearable devices. Hence, an authentication method based on such behavioral patterns of one device cannot establish the underlying connections between multiple smart devices when another device is not equipped with keyboard interfaces or touch screens. In fact, motion sensors such as accelerometers and gyroscopes that can be used for biometric authentication are common in a wide range of smart devices. They provide opportunities to build useful behavioral models that carry on among multiple devices. We exploited a continuous behavioral pattern relevance on multiple devices using the existing inbuilt accelerometers and gyroscopes so as to realize continuous authentication on multiple devices.
Accordingly, the critical point in multi-device authentication is how to use sensor data from different devices to model the biobehavioral features of users and identify them, when inbuilt motion sensors can precisely capture user behavioral data from multiple devices. Past approaches that mainly used traditional machine learning algorithms successfully extracted behavioral features [13,14], while they usually took a long time to analyze which features were effective manually. Nonetheless, because the multi-device data contains more noise and features, it is difficult to obtain valid features from complex multi-device sensor data using the time-consuming process of hand-crafted feature extraction. As deep learning-based methods have been proven to outperform traditional machine learning-based methods [15], they allow us to get rid of complex feature engineering and obtain new solutions to the challenging problem of user behavioral model generation. In this paper, we discovered the correlation between multi-device sensor data in time and space dimensions. In addition, according to this correlation, data processing and neural network establishment are carried out in an orderly manner. As a result, we utilized two-dimensional images to present the relevance and input them into a spatiotemporal convolutional neural network.
While essential neural networks are capable of making decisions for user certification, there are still some problems to consider. One is that the authentication accuracy needs to be higher, and the other is that the authentication performance of different devices varies. By noticing the continuity of user behavior, it is possible for multiple devices to enhance authentication effectiveness and efficiency with a confidence-based strategy. During user authentication, the confidence-based strategy will rectify the neural network prediction errors by combining them with the users’ past authentication results of the device. Moreover, we adjusted the strategy appropriately for each device according to its historical certification. The results of evaluating the strategy showed that it enhanced the stability and usability of continuous user authentication.
The main contributions of this paper are summarized as follows:
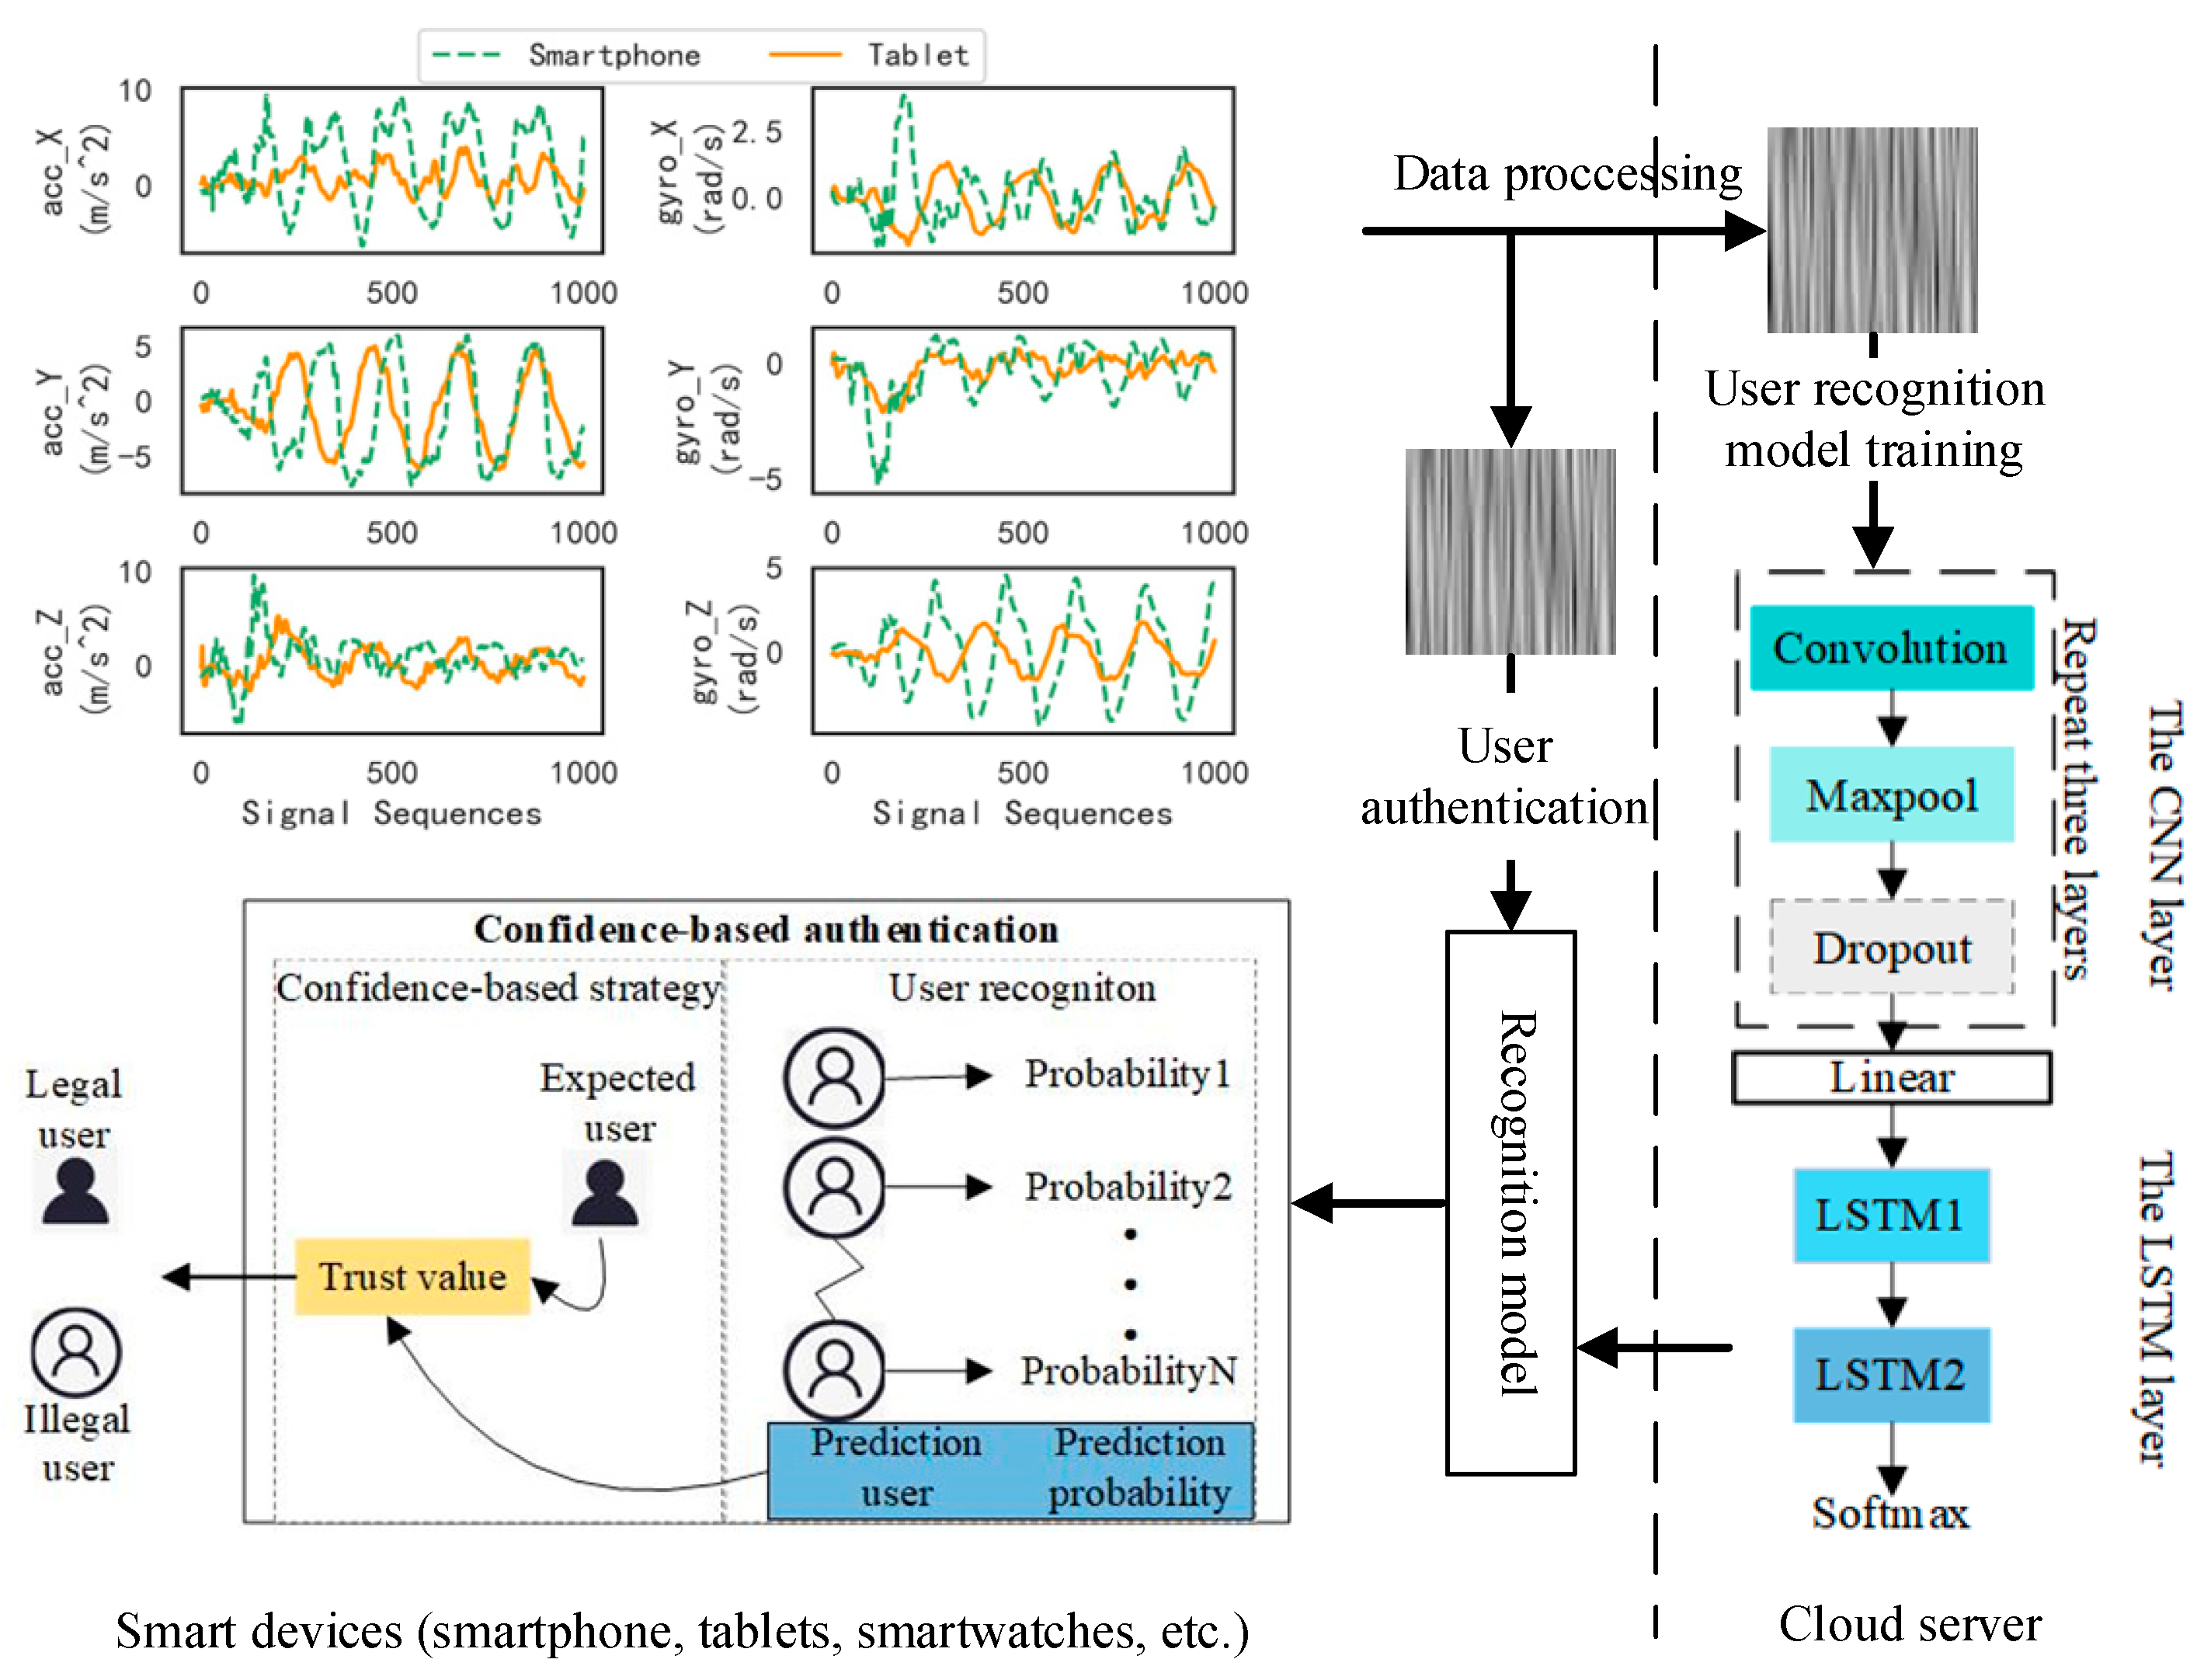
  • We propose an effective and efficient multi-device continuous authentication scheme that can complement the existing multi-device authentication mechanisms. Each device in the scheme is monitored continuously for user authentication, even when a user switches to another smart device.
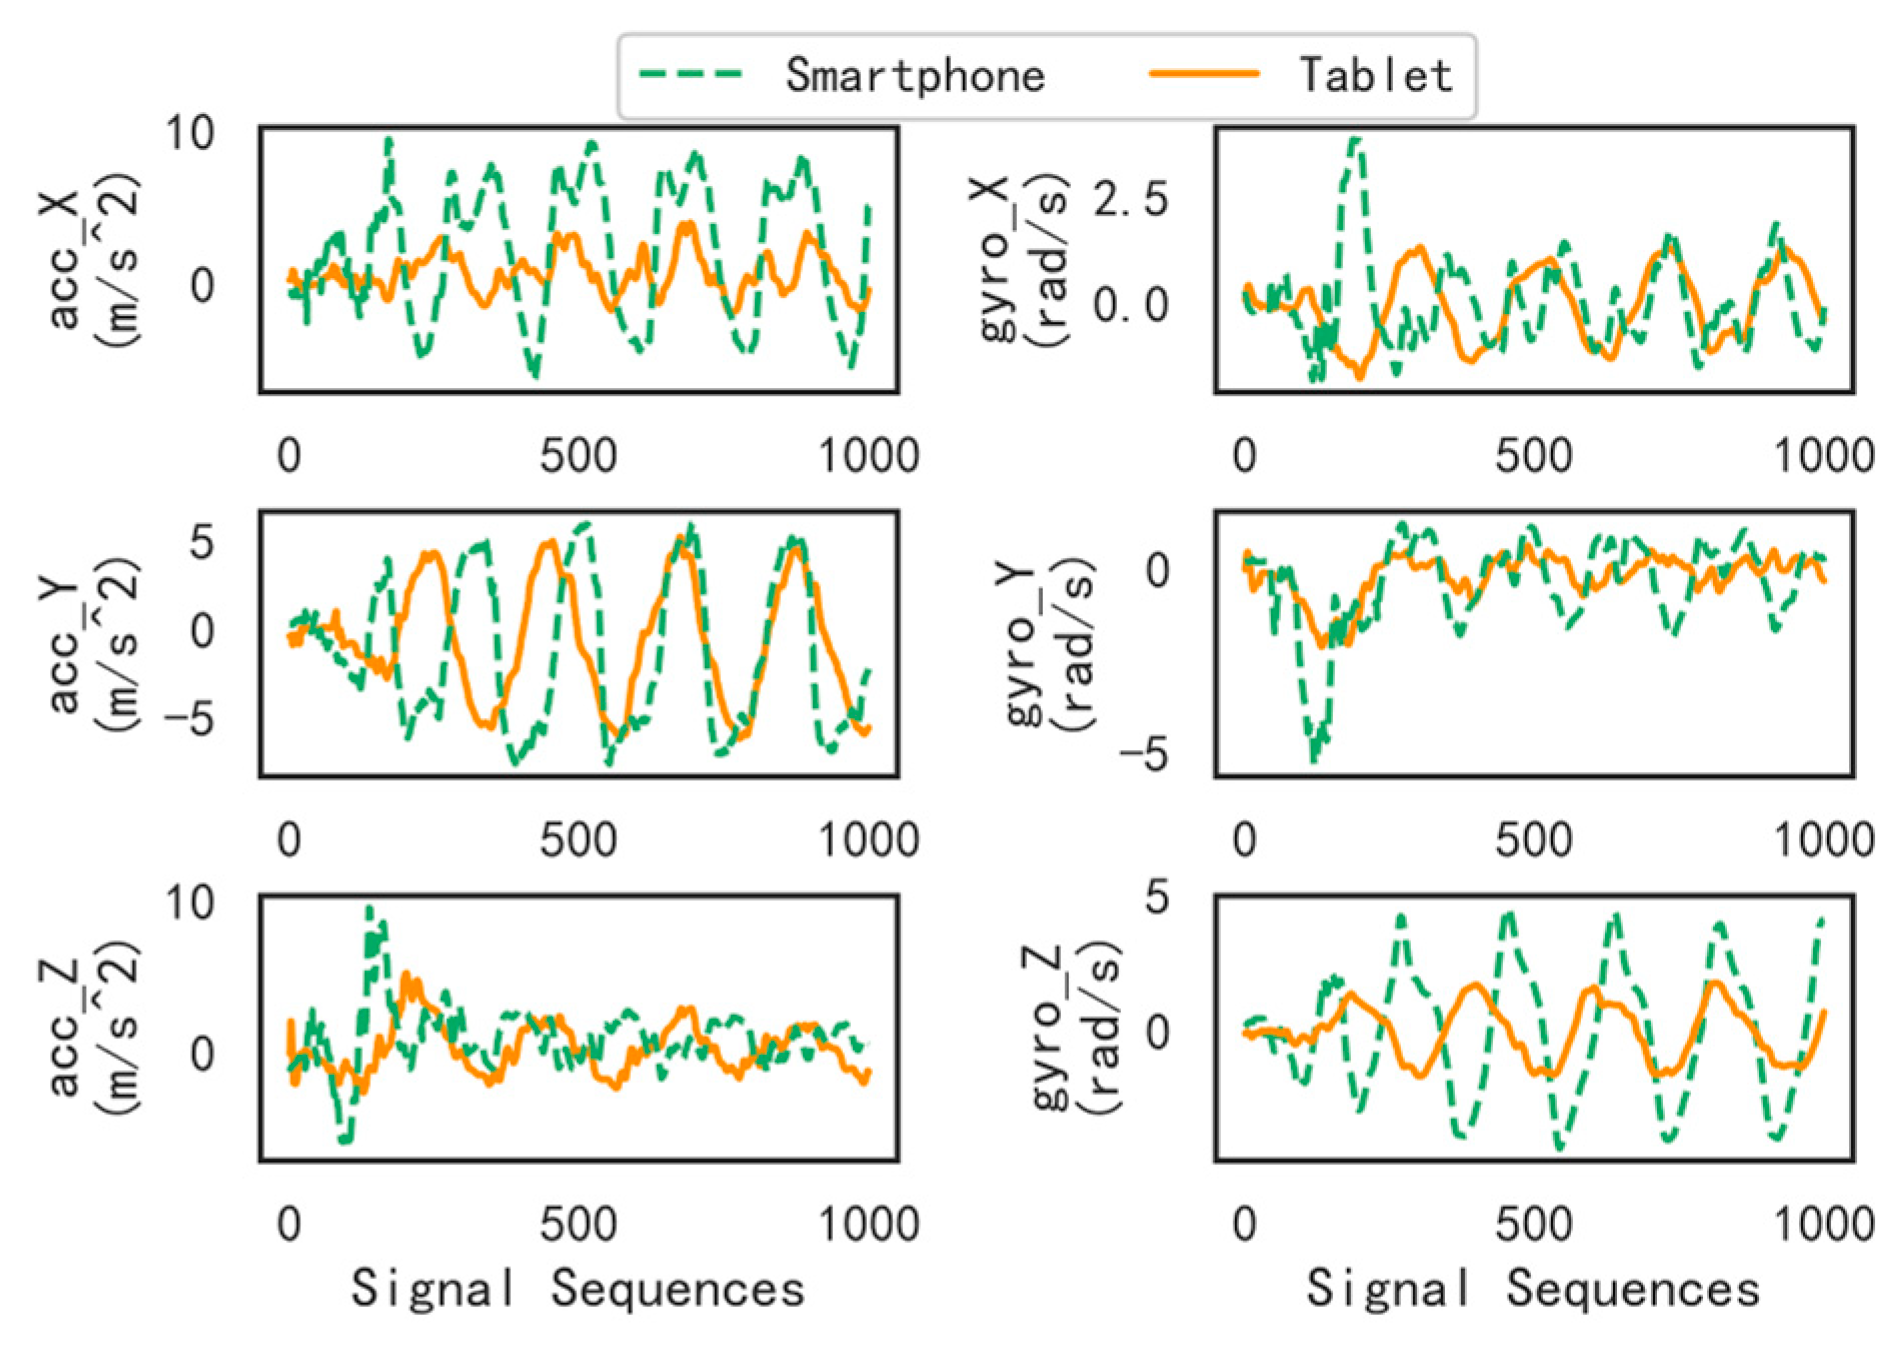
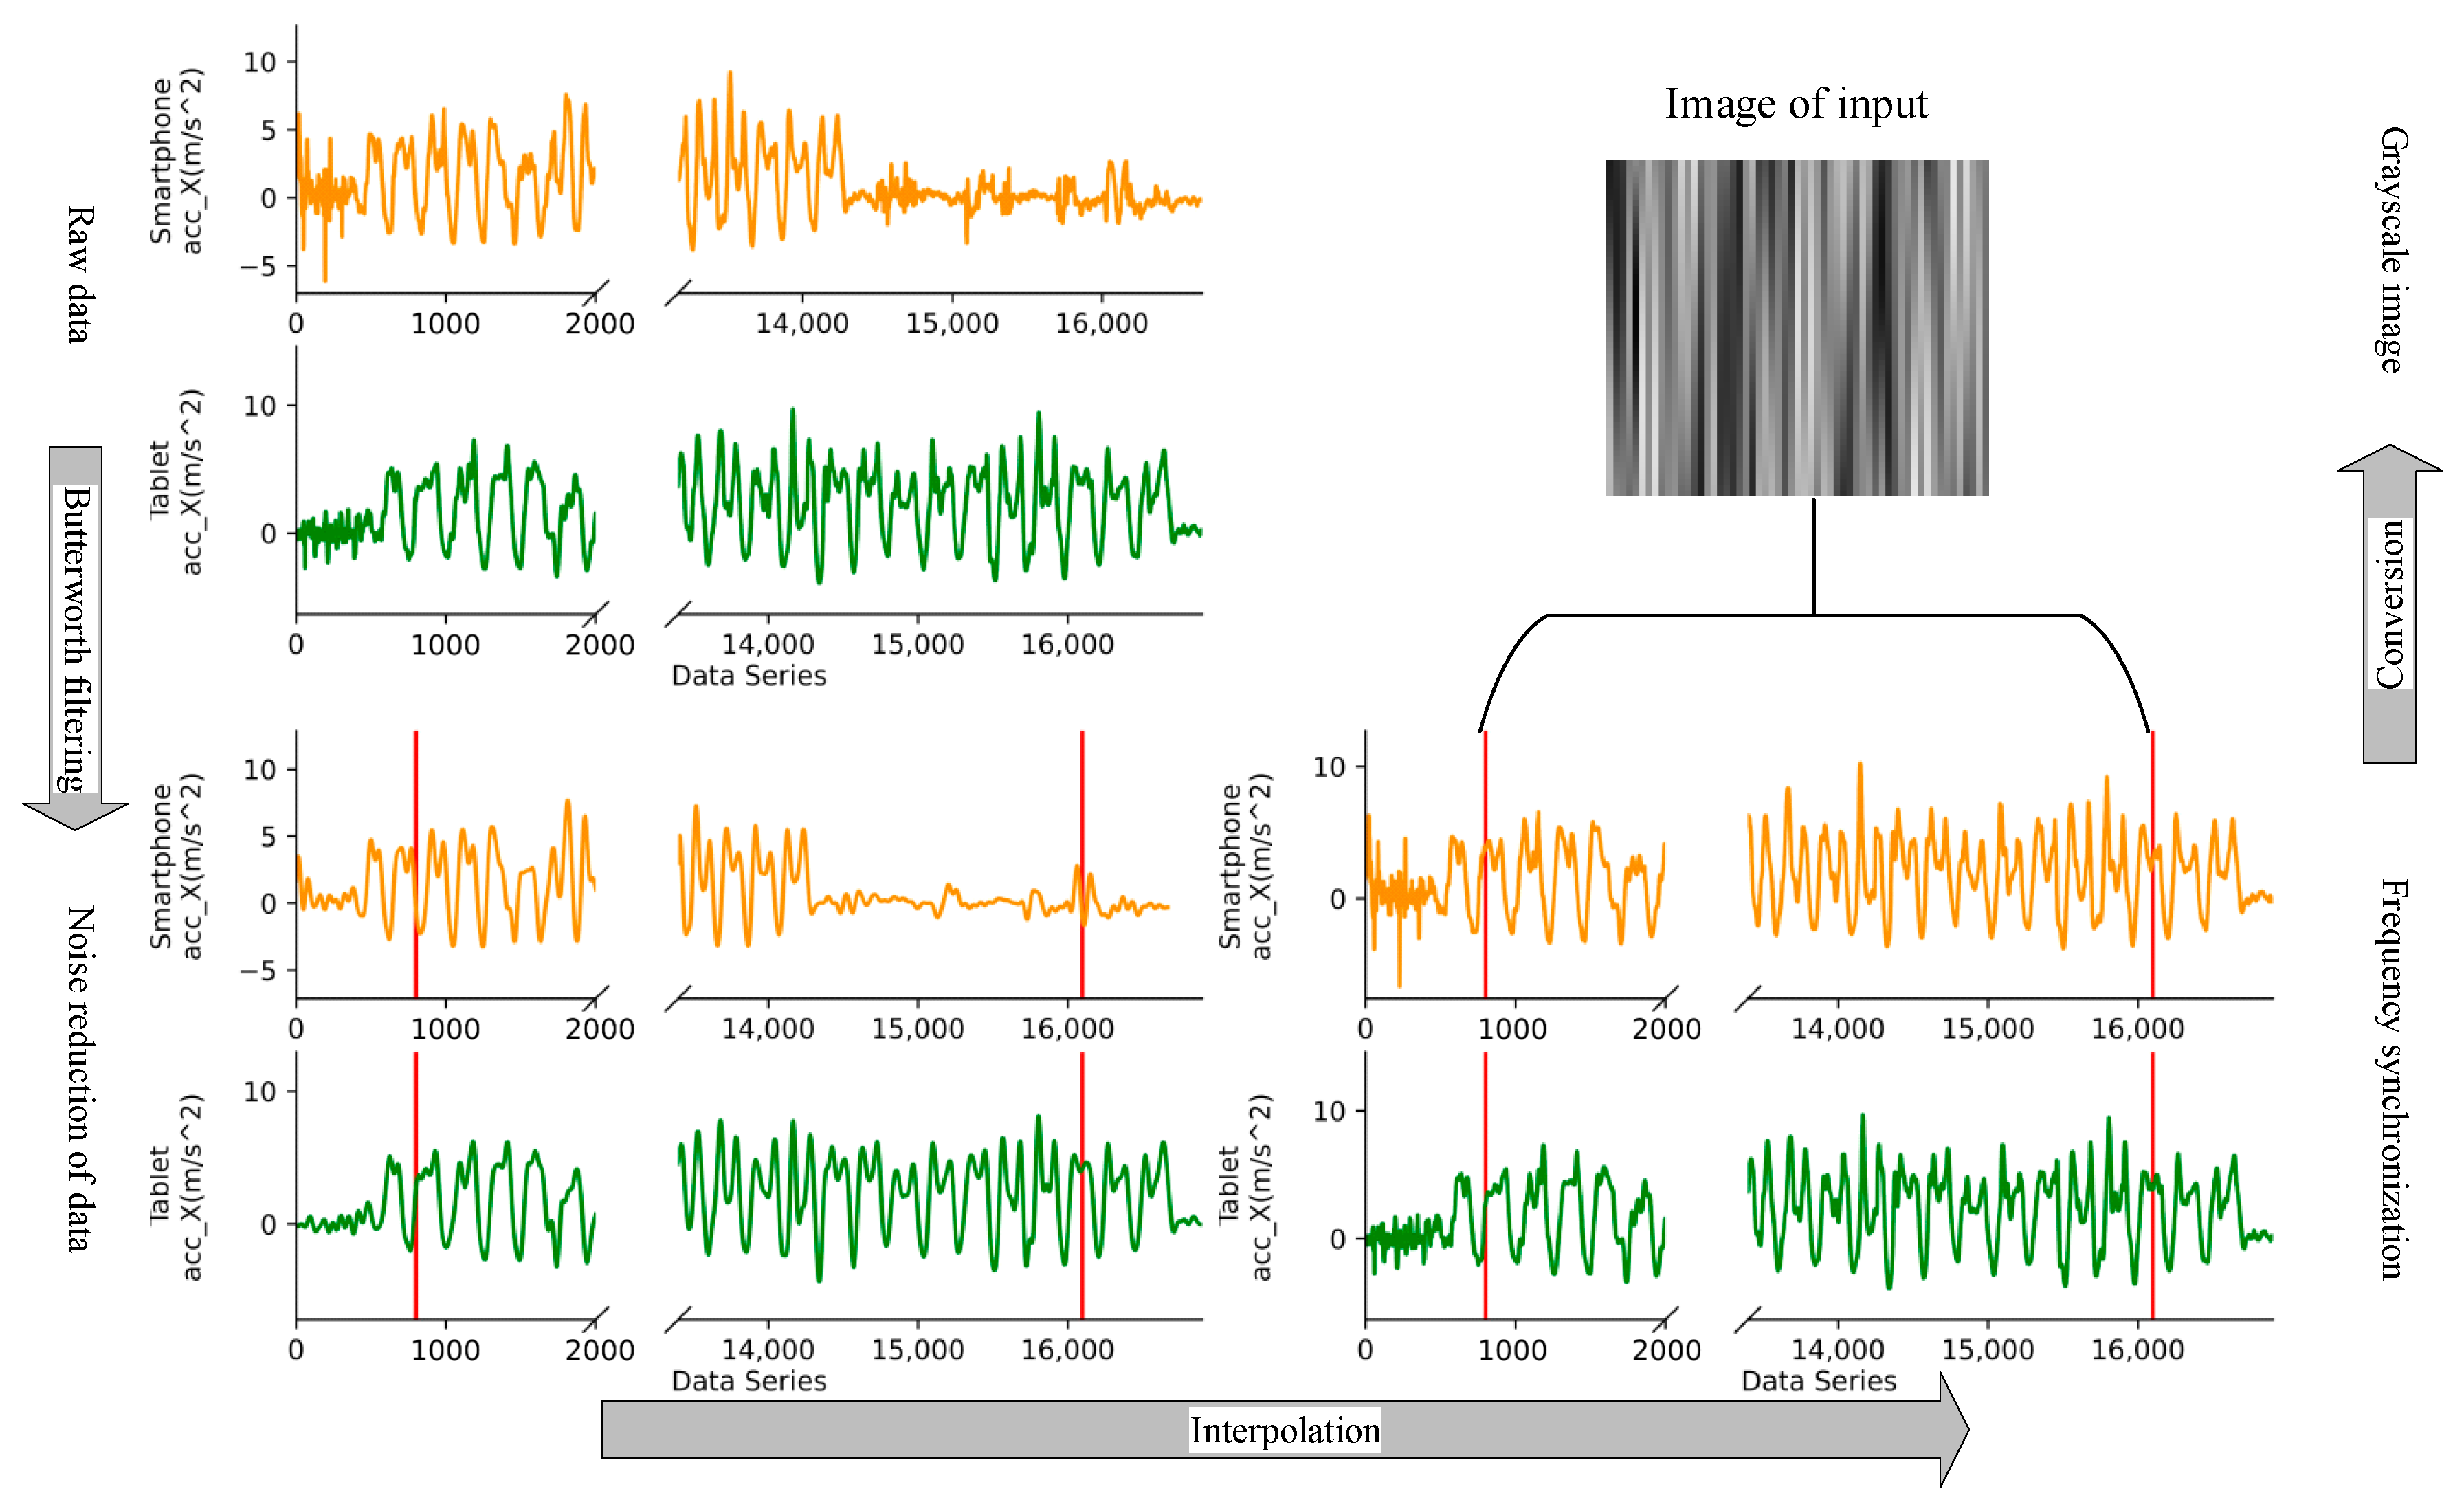
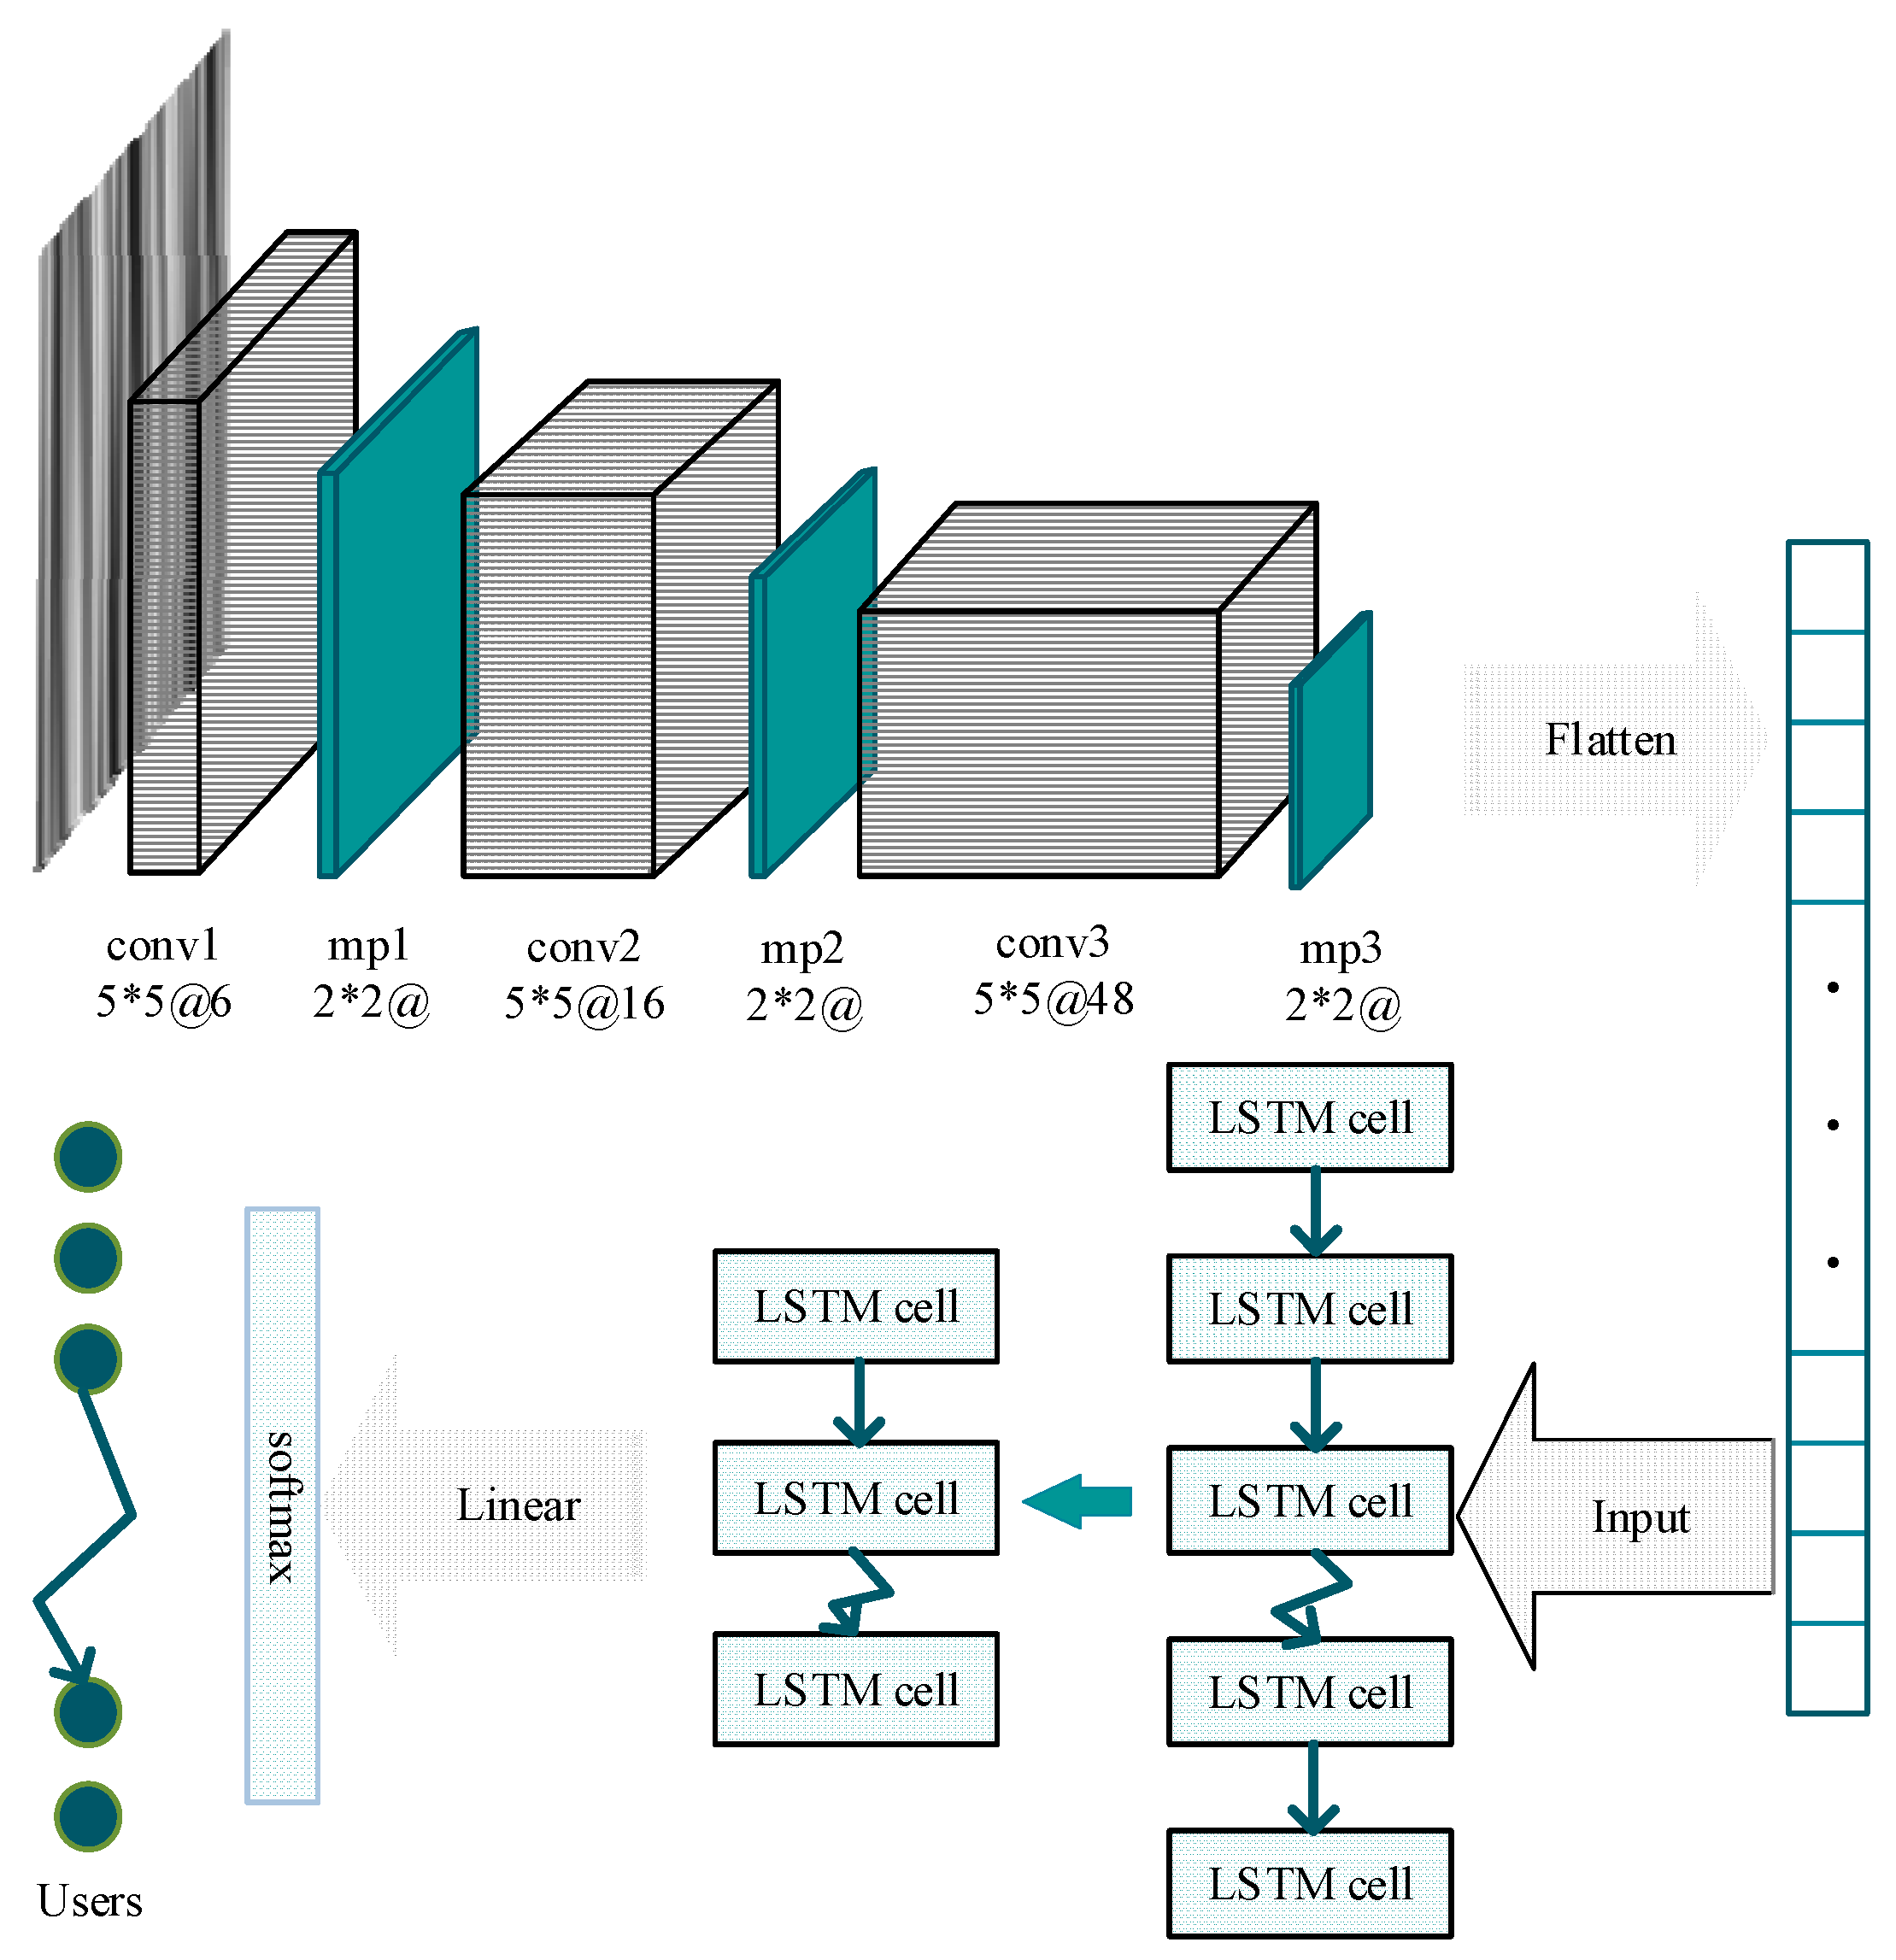
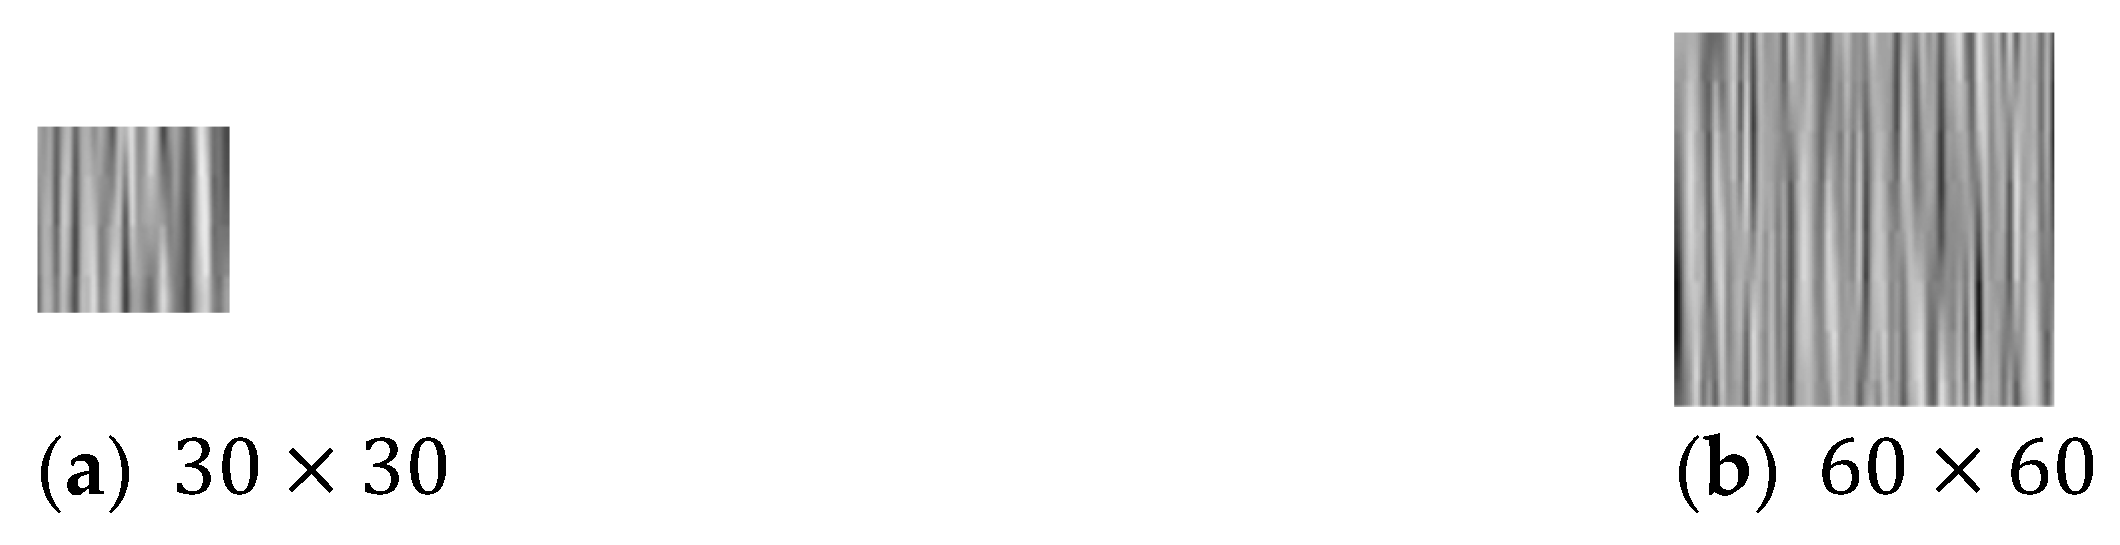
  • We find the relevance of multi-device behavioral data from the accelerometer and gyroscope sensors and transform the signal to two-dimensional images, which is the basis for learning users’ unique behavioral features through a spatiotemporal convolutional neural network.
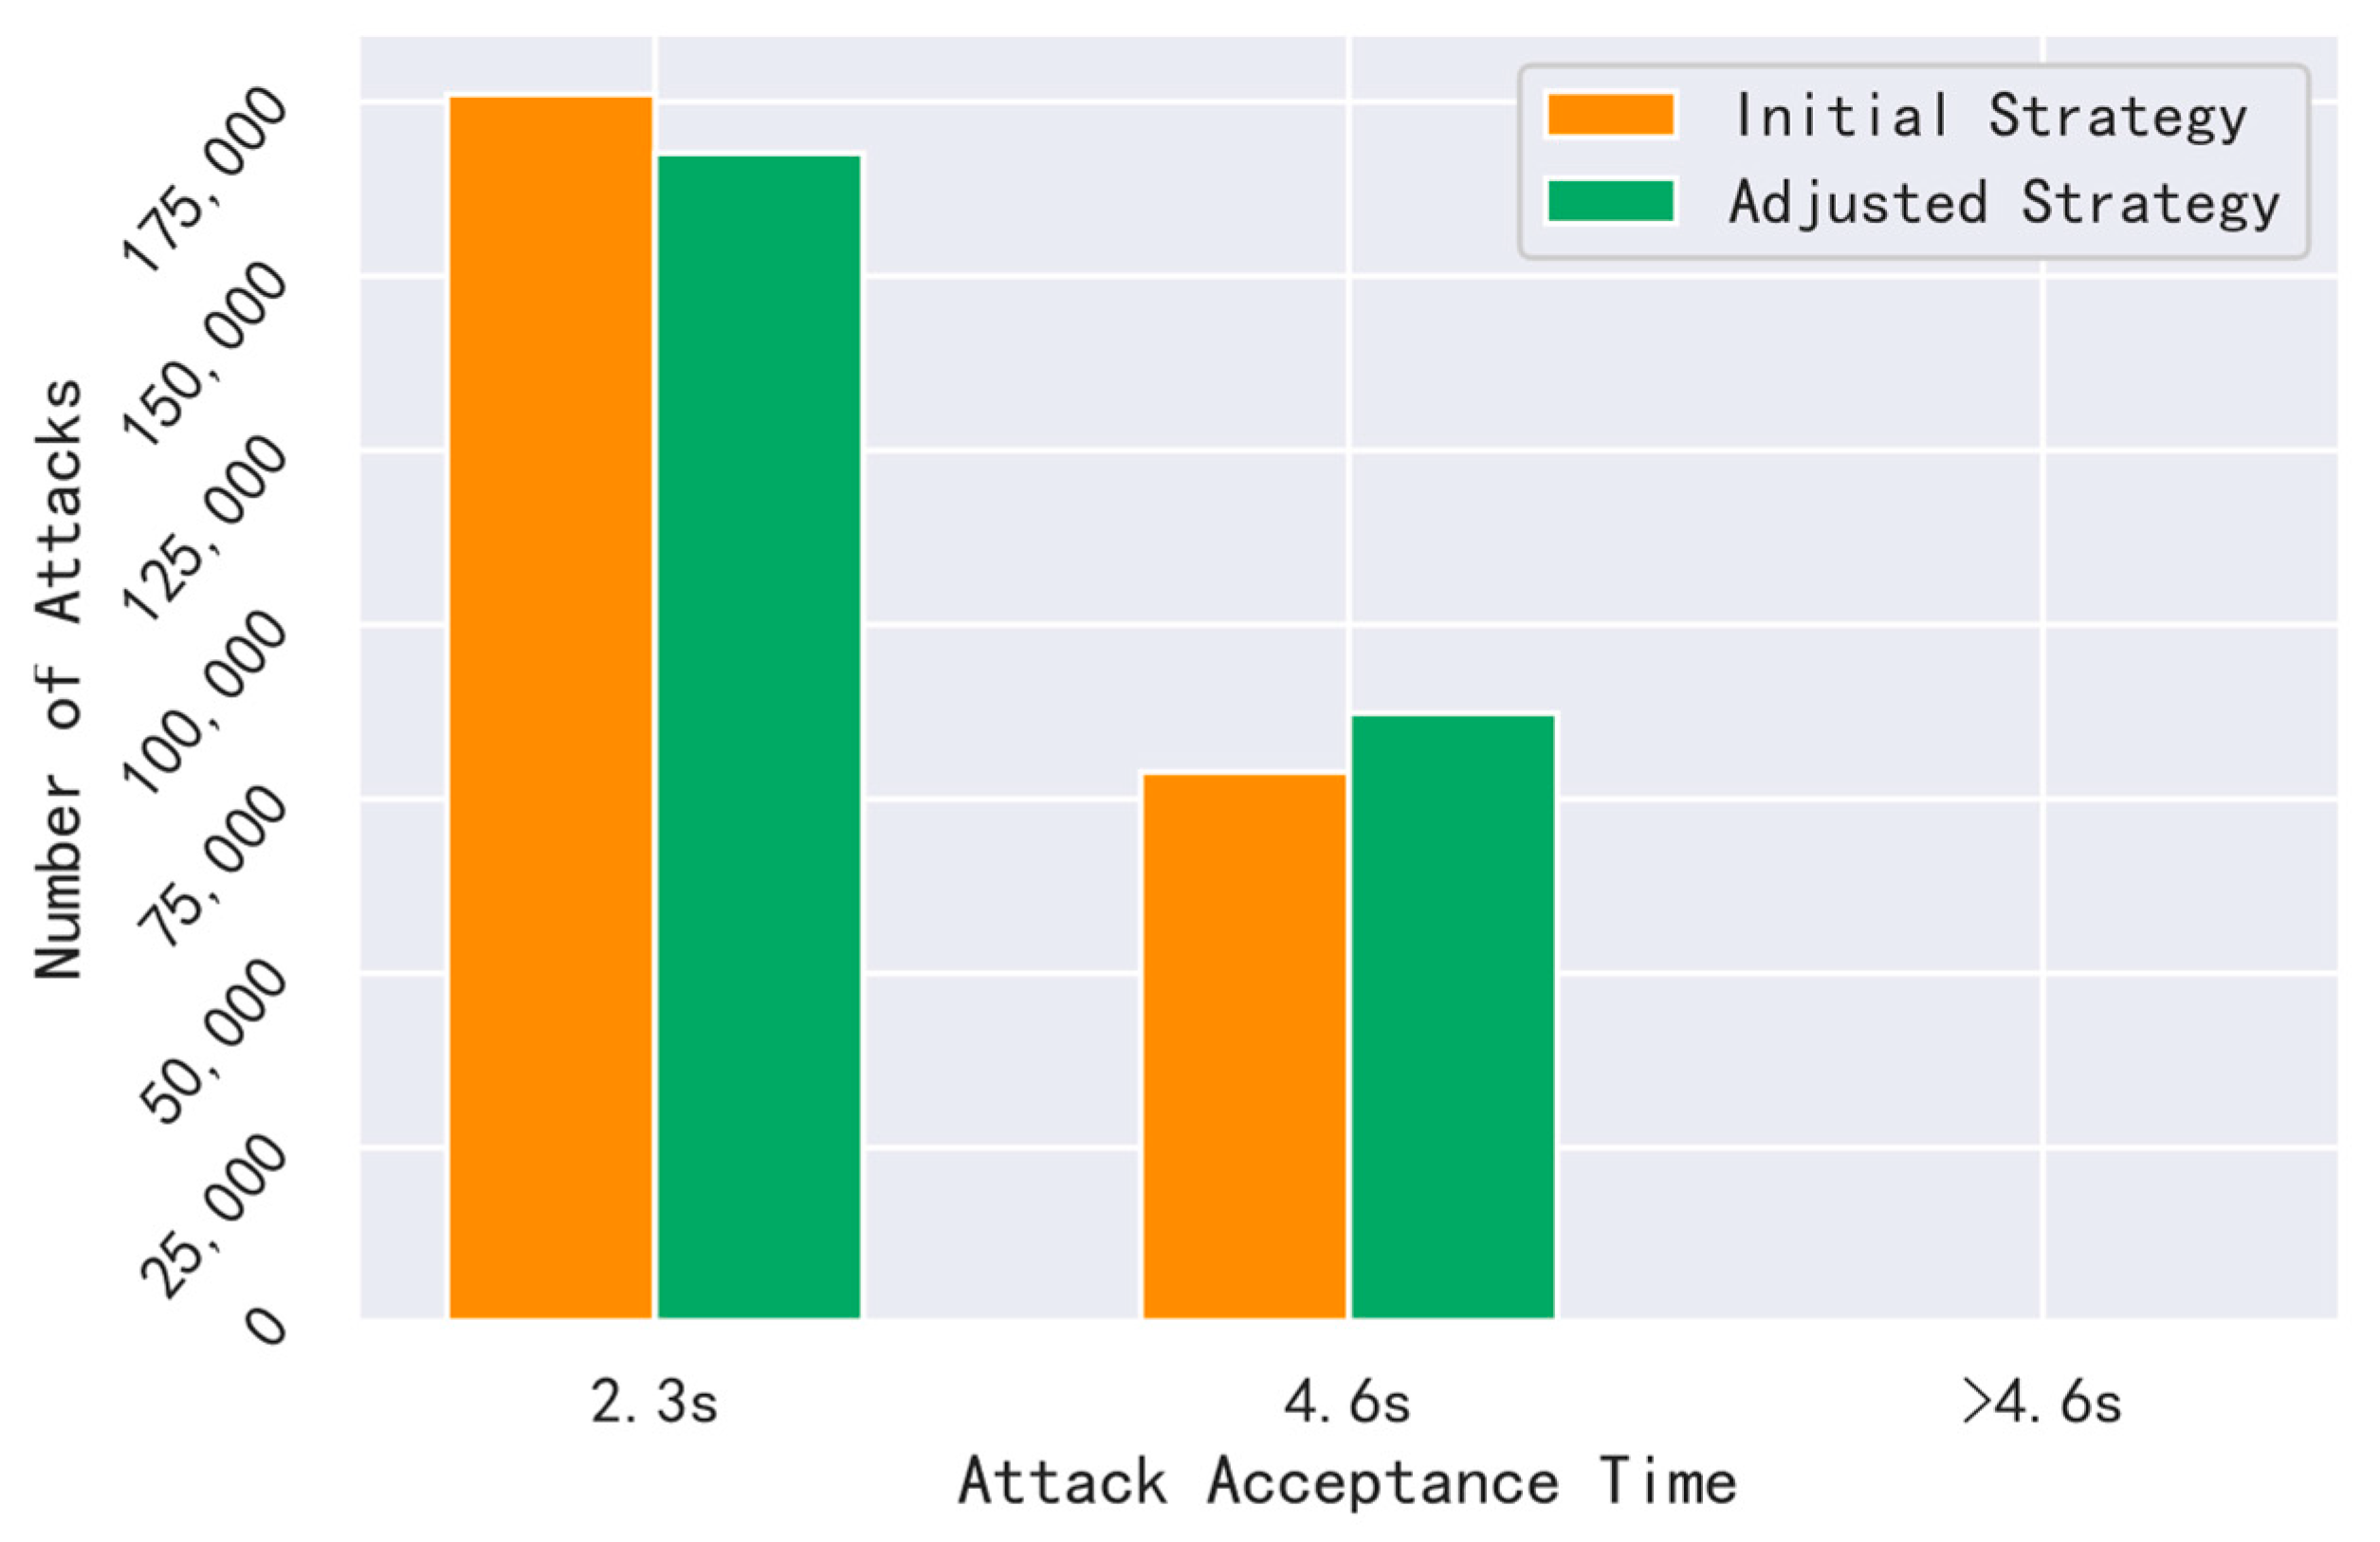
  • We present a dynamic confidence-based strategy for addressing the issue of insufficient stability and accuracy in multi-device authentication, which is appropriately adjusted for every device according to the situation of user authentication.
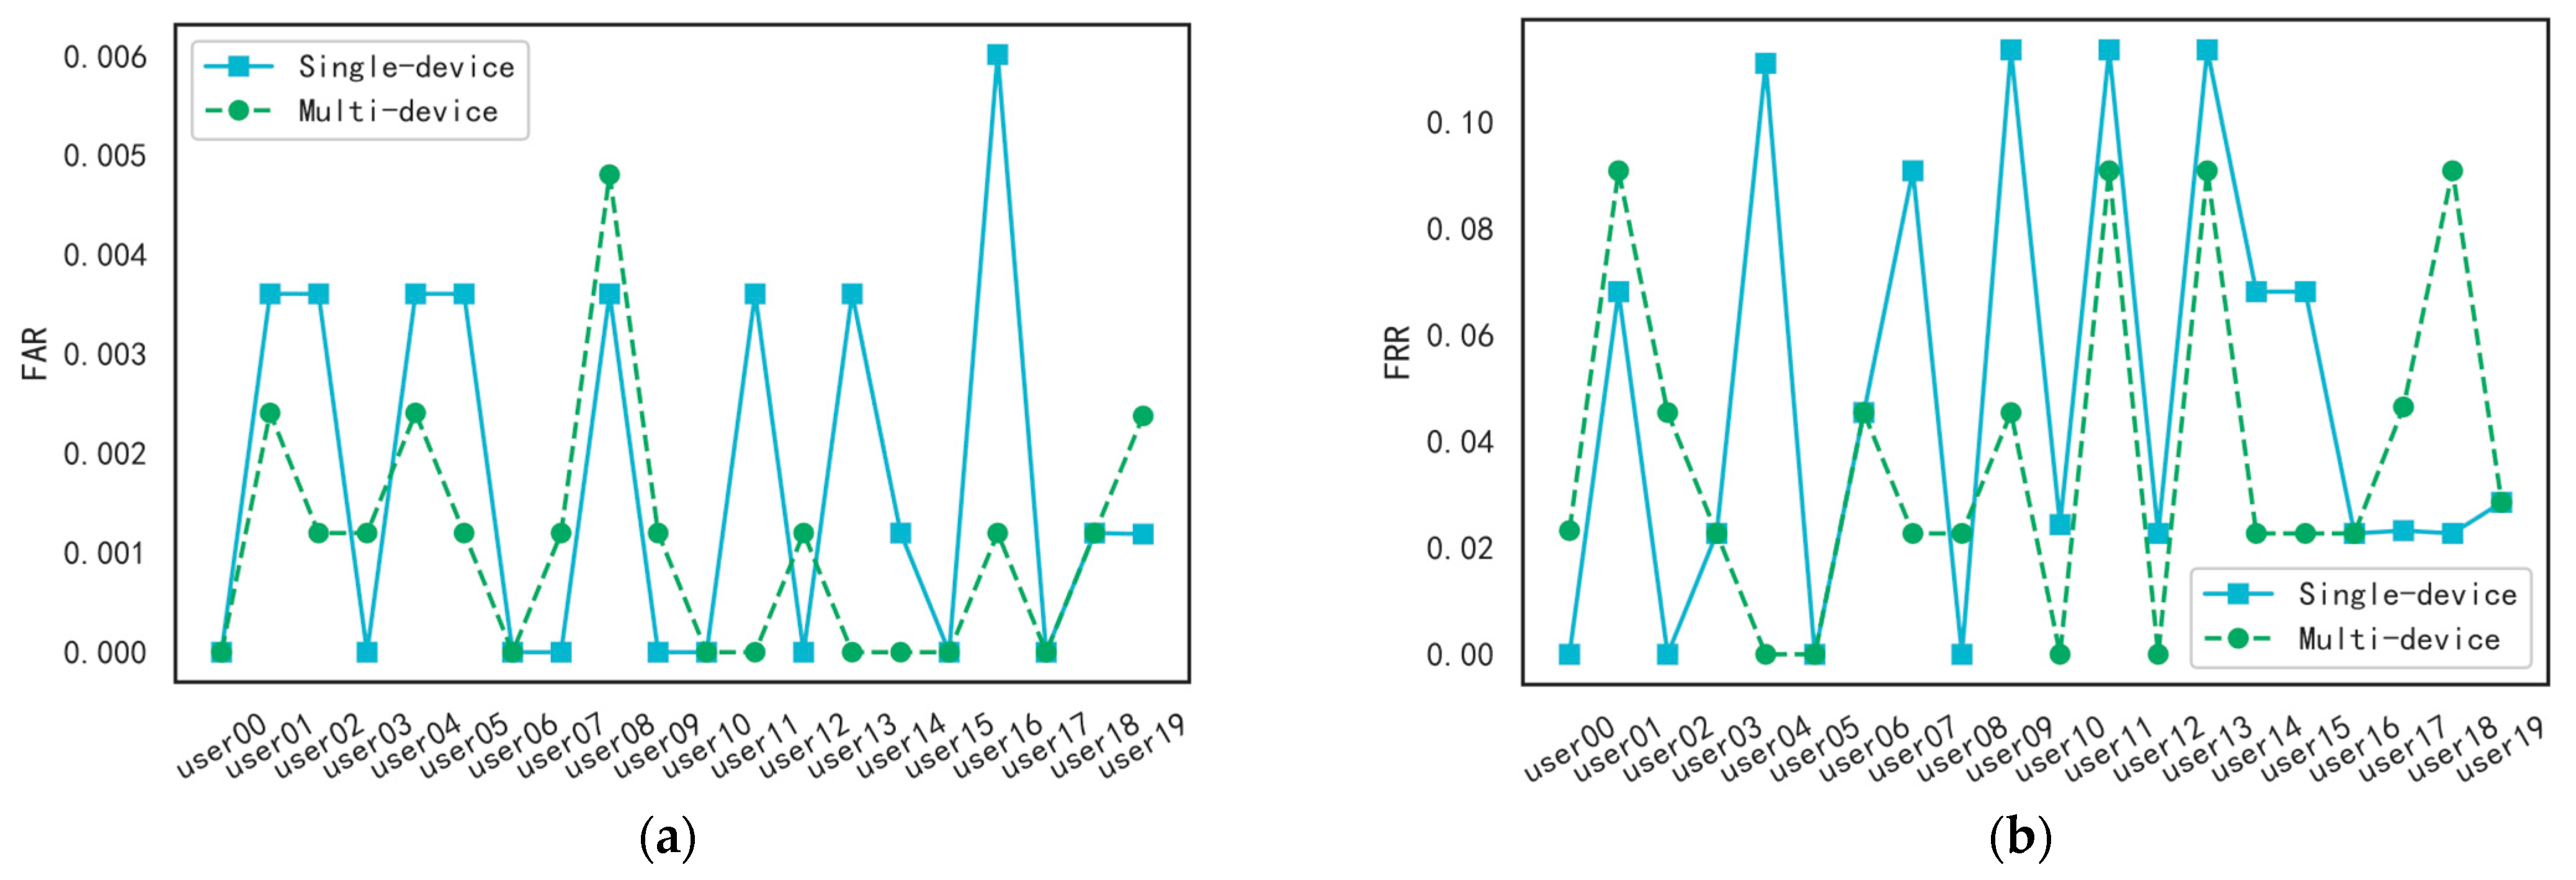
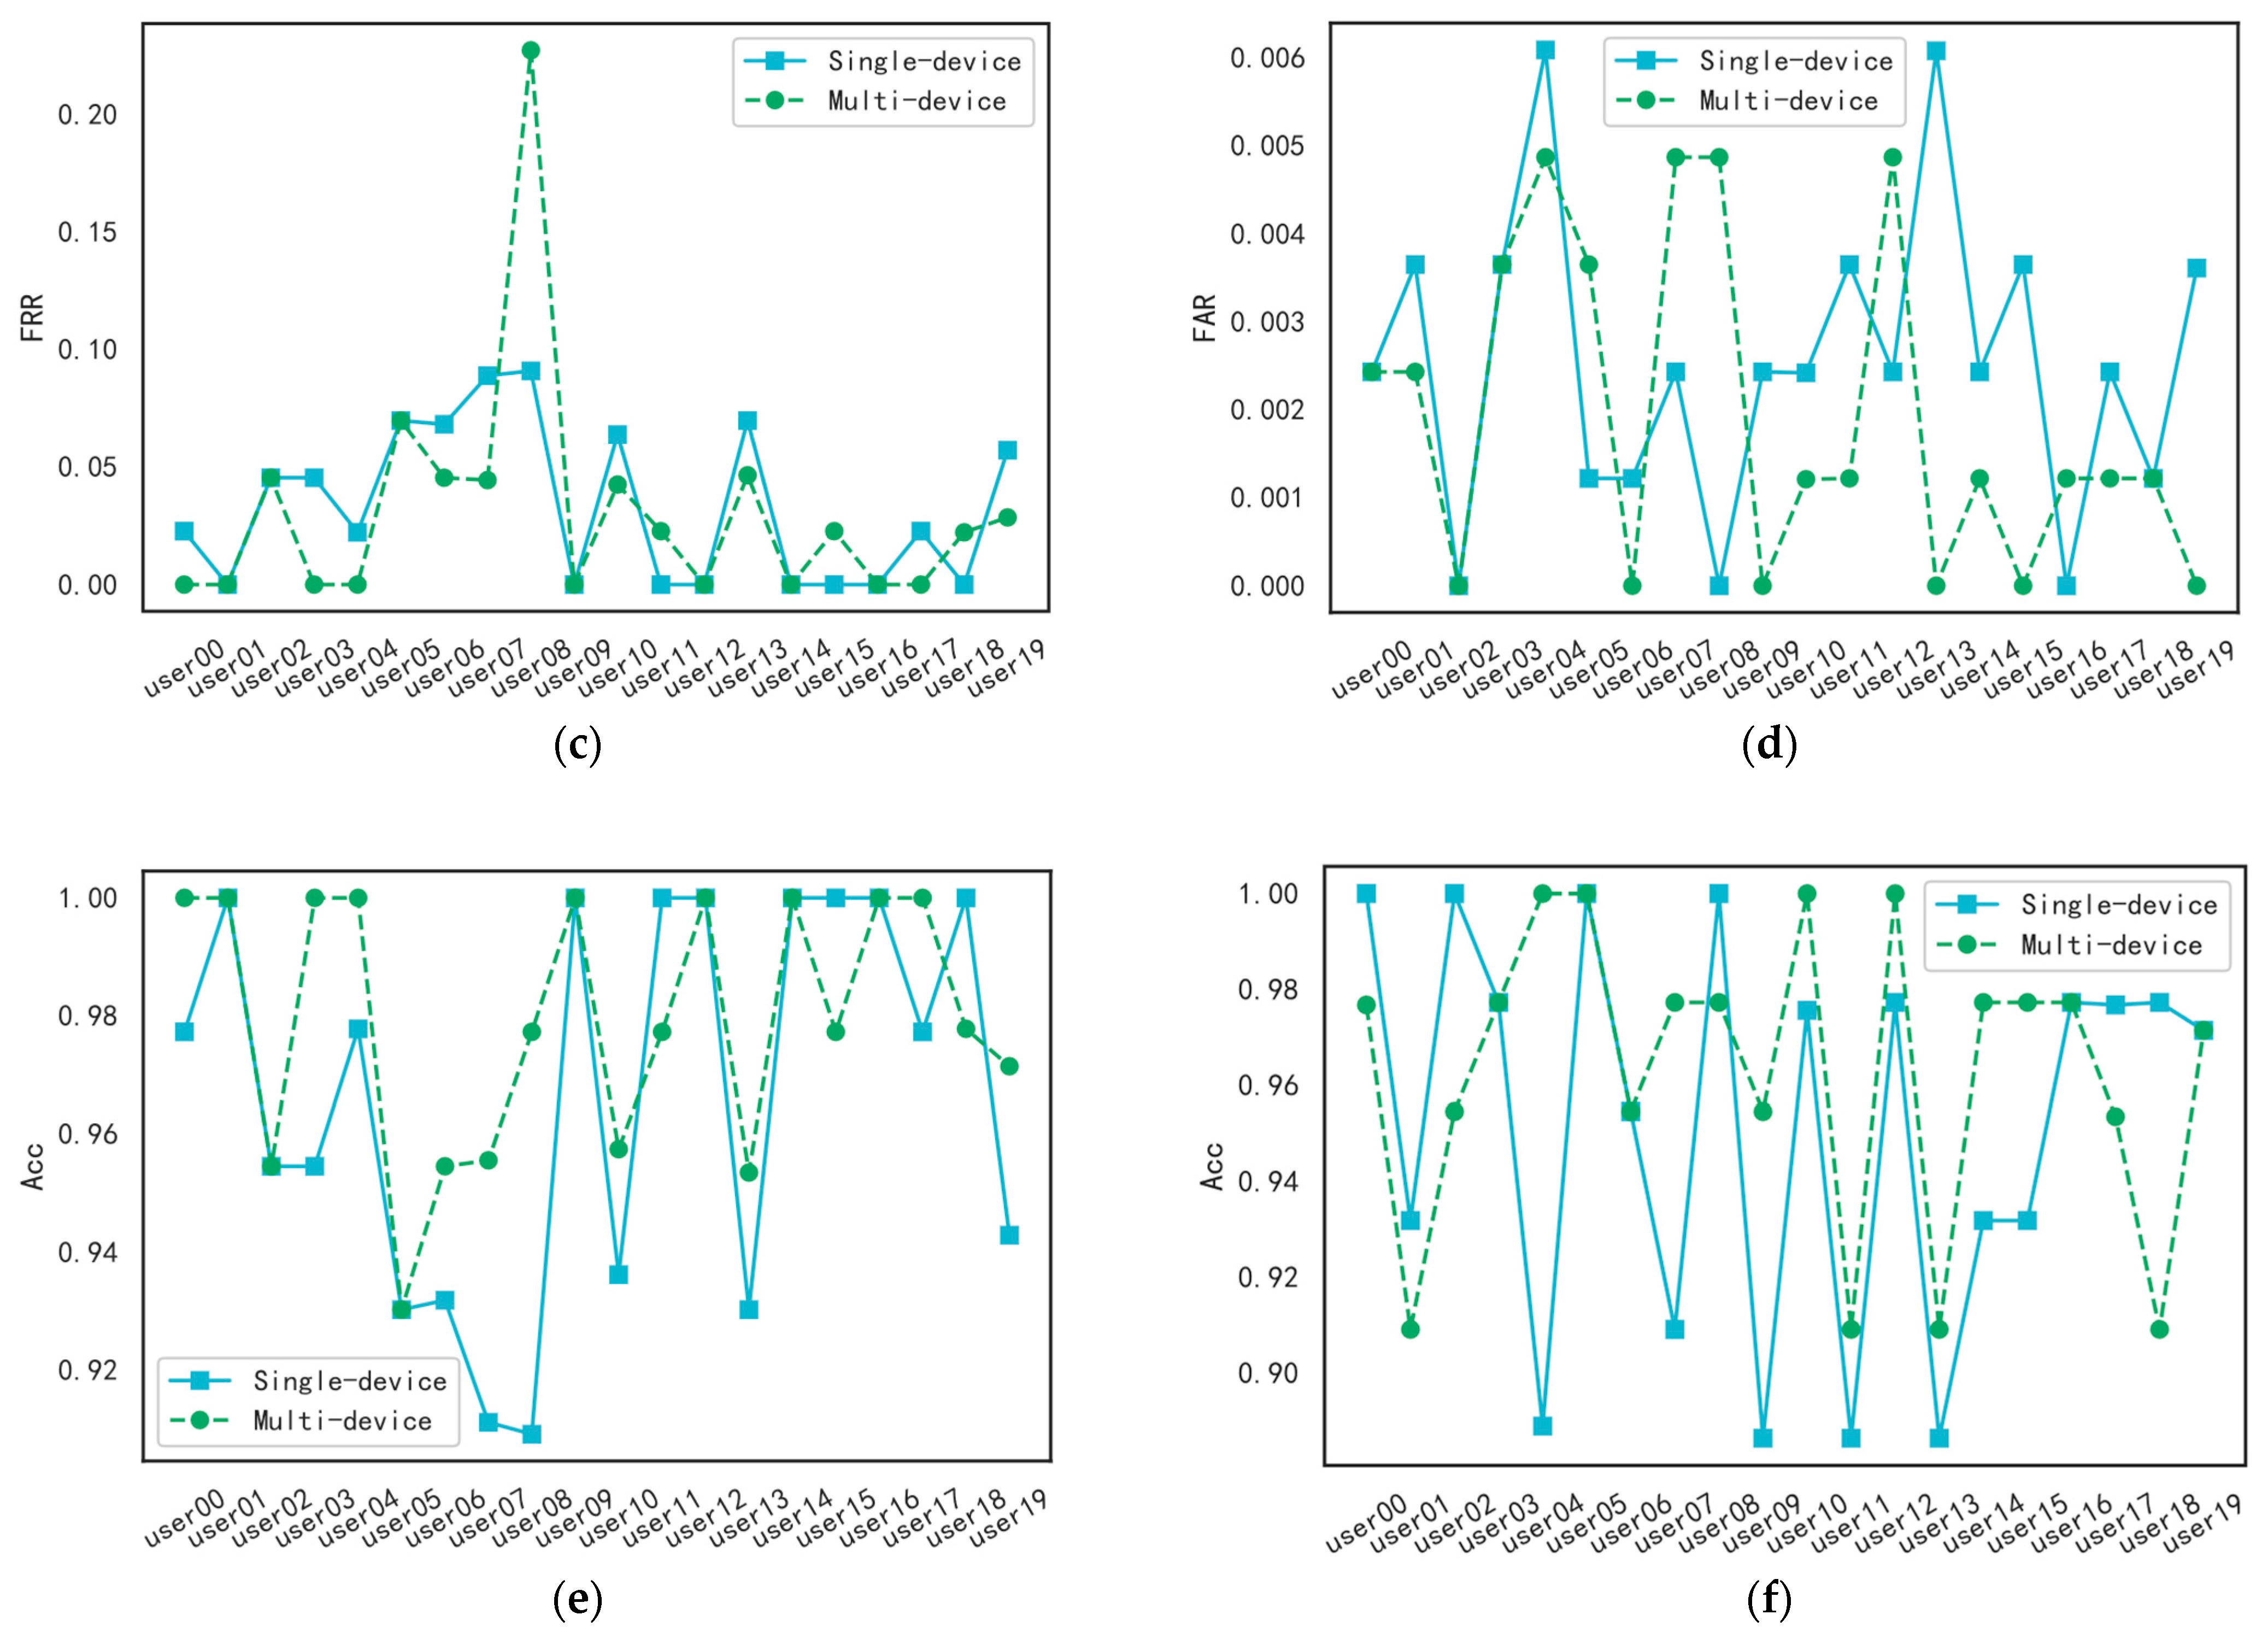
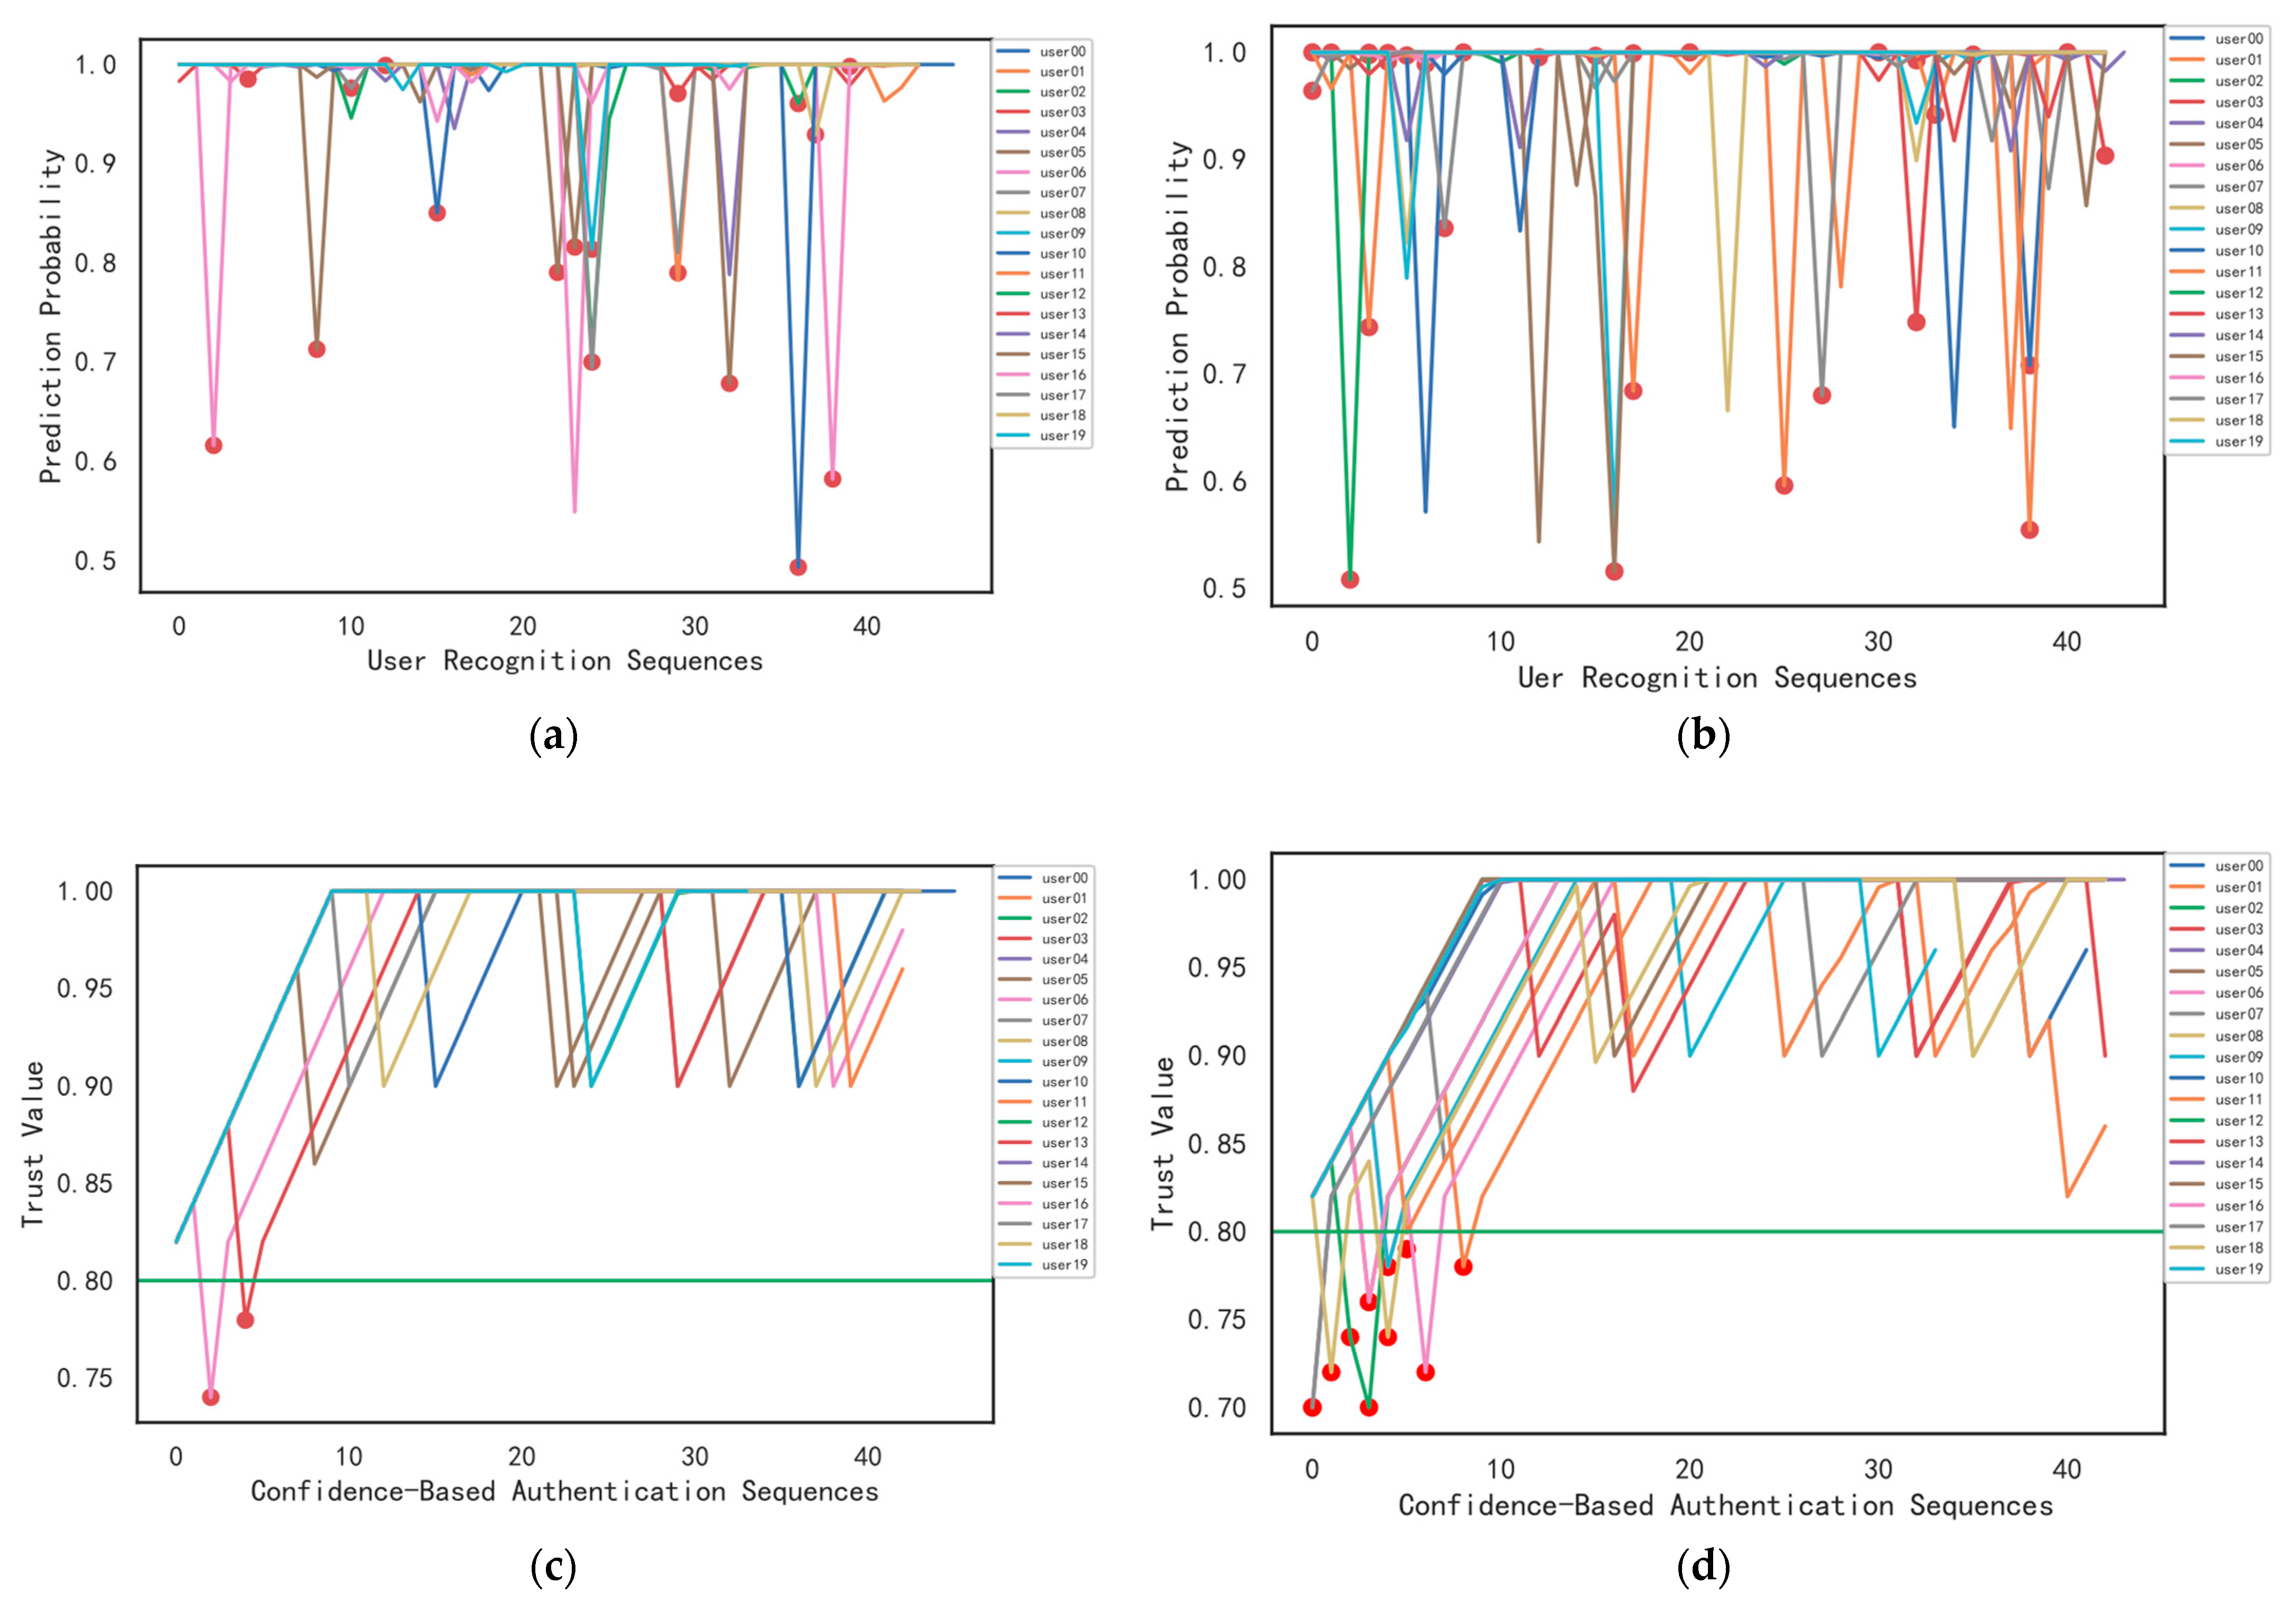
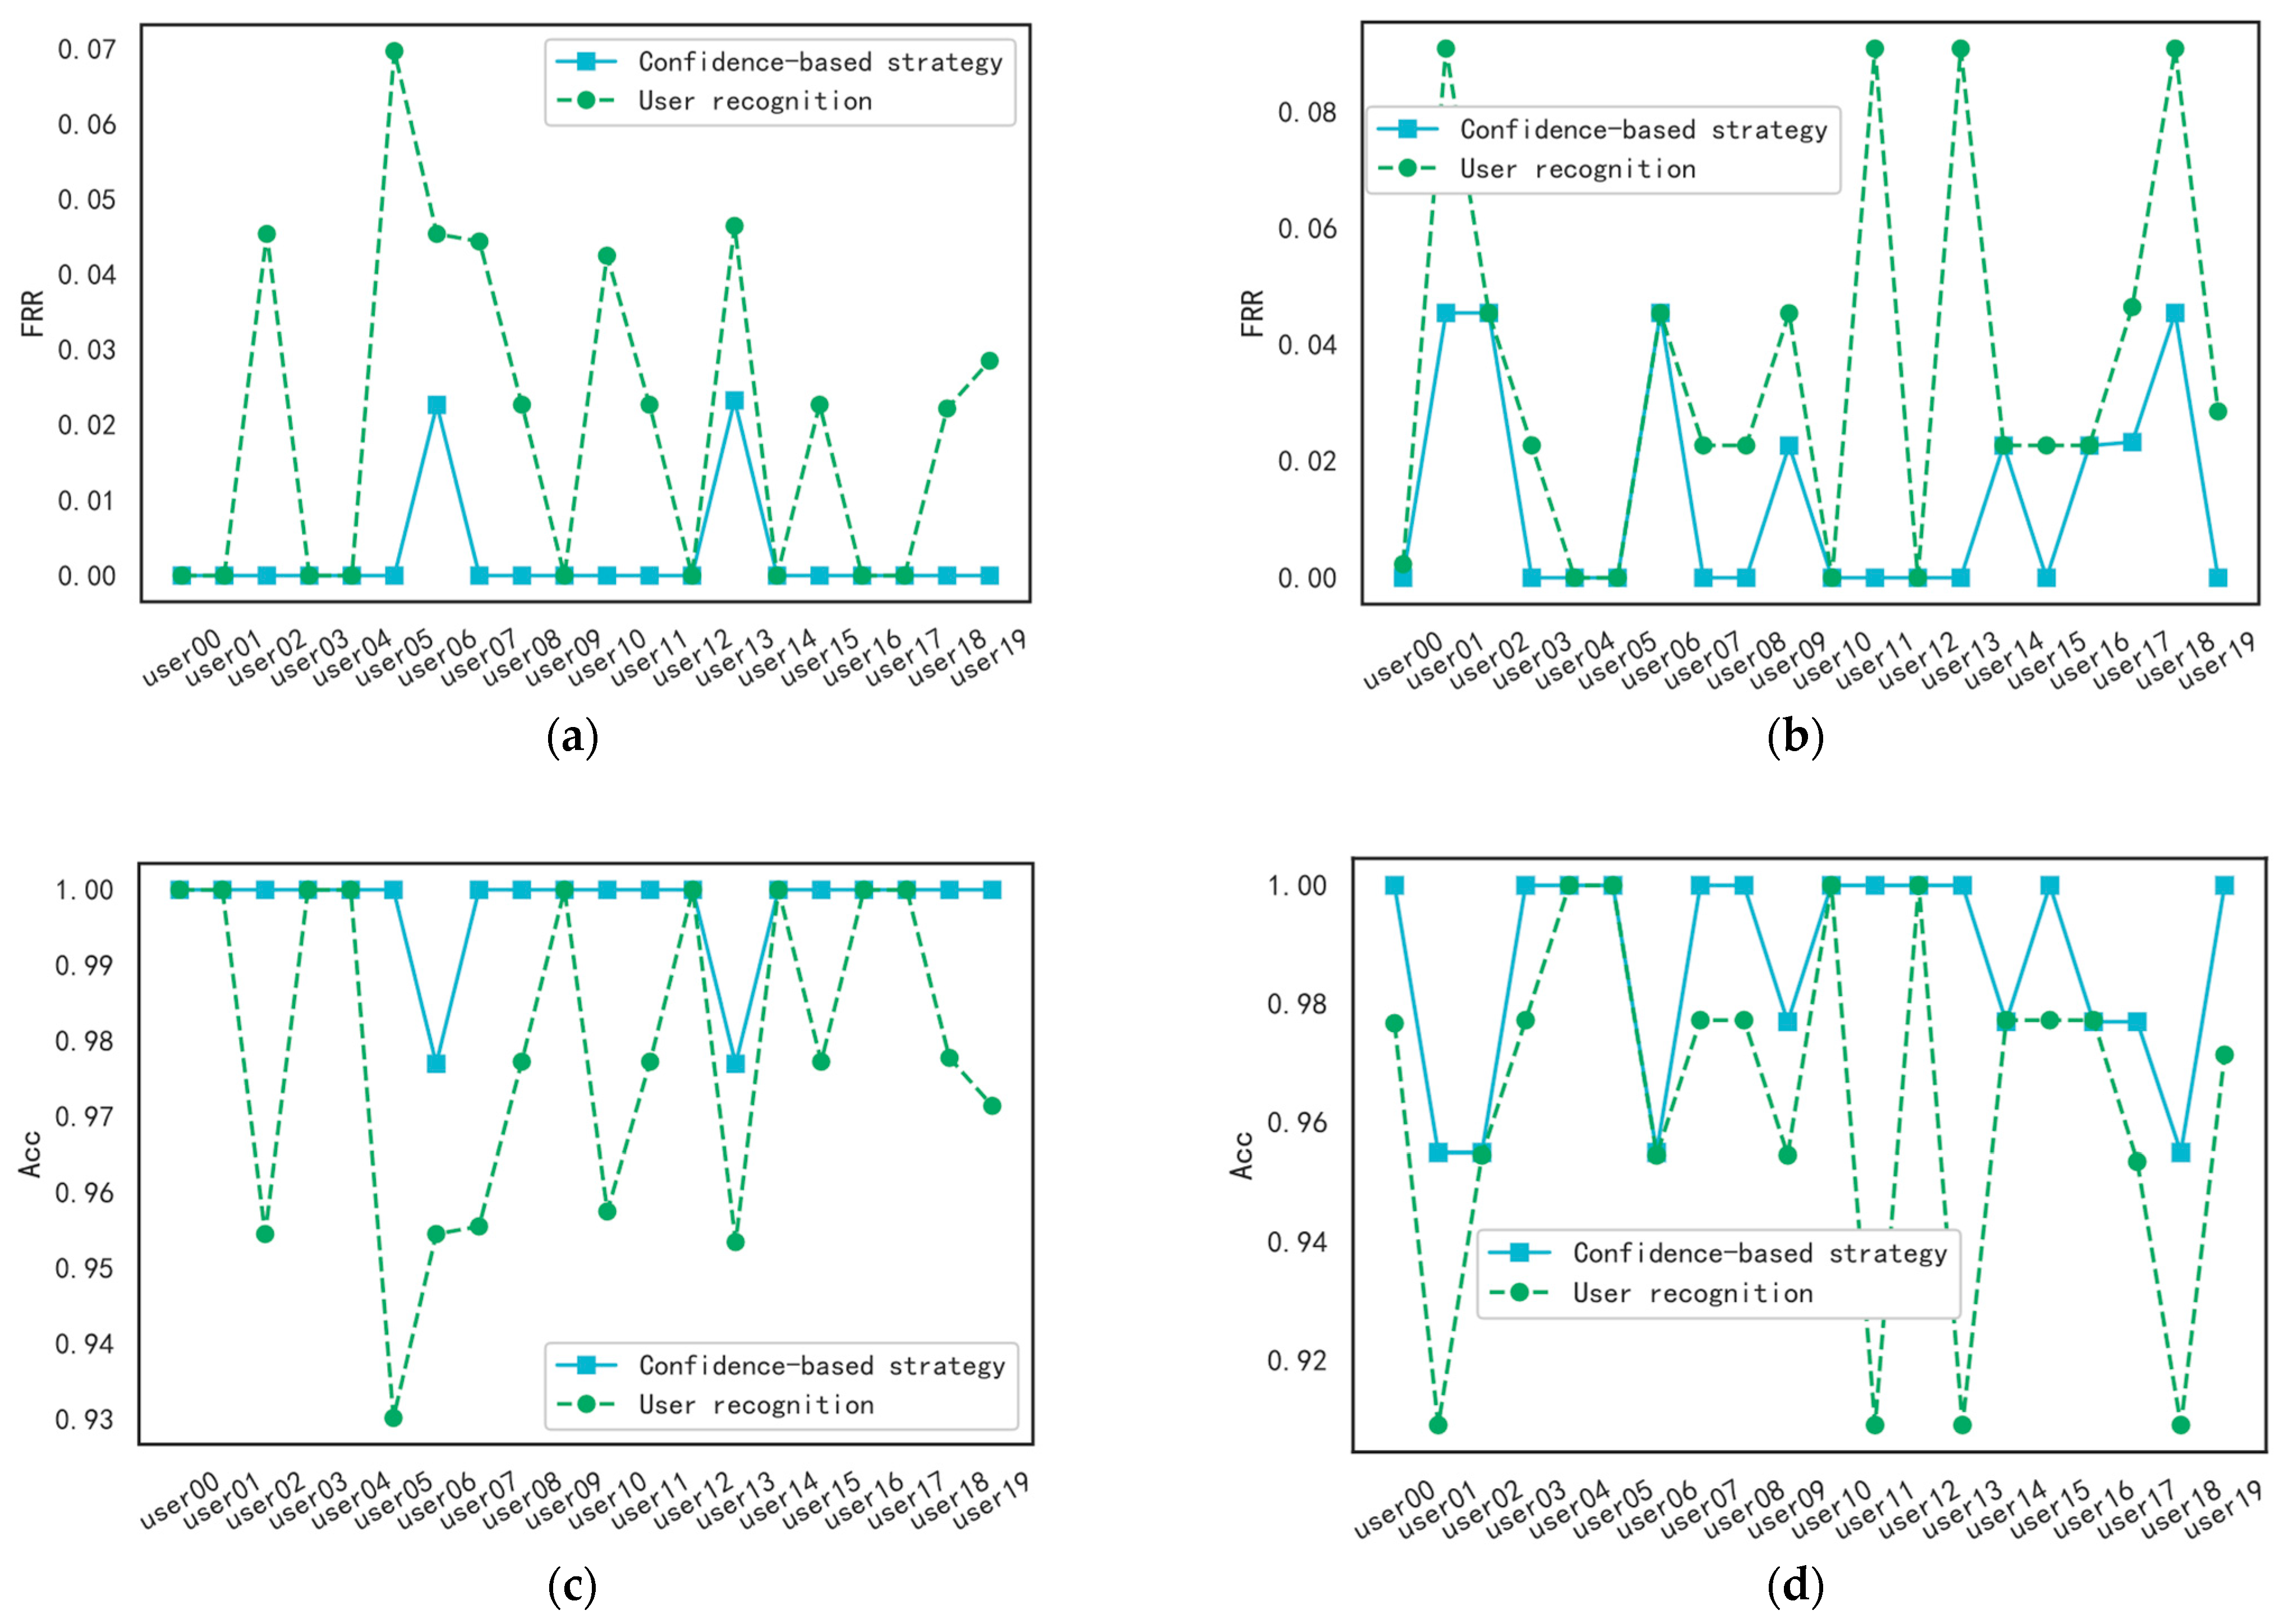
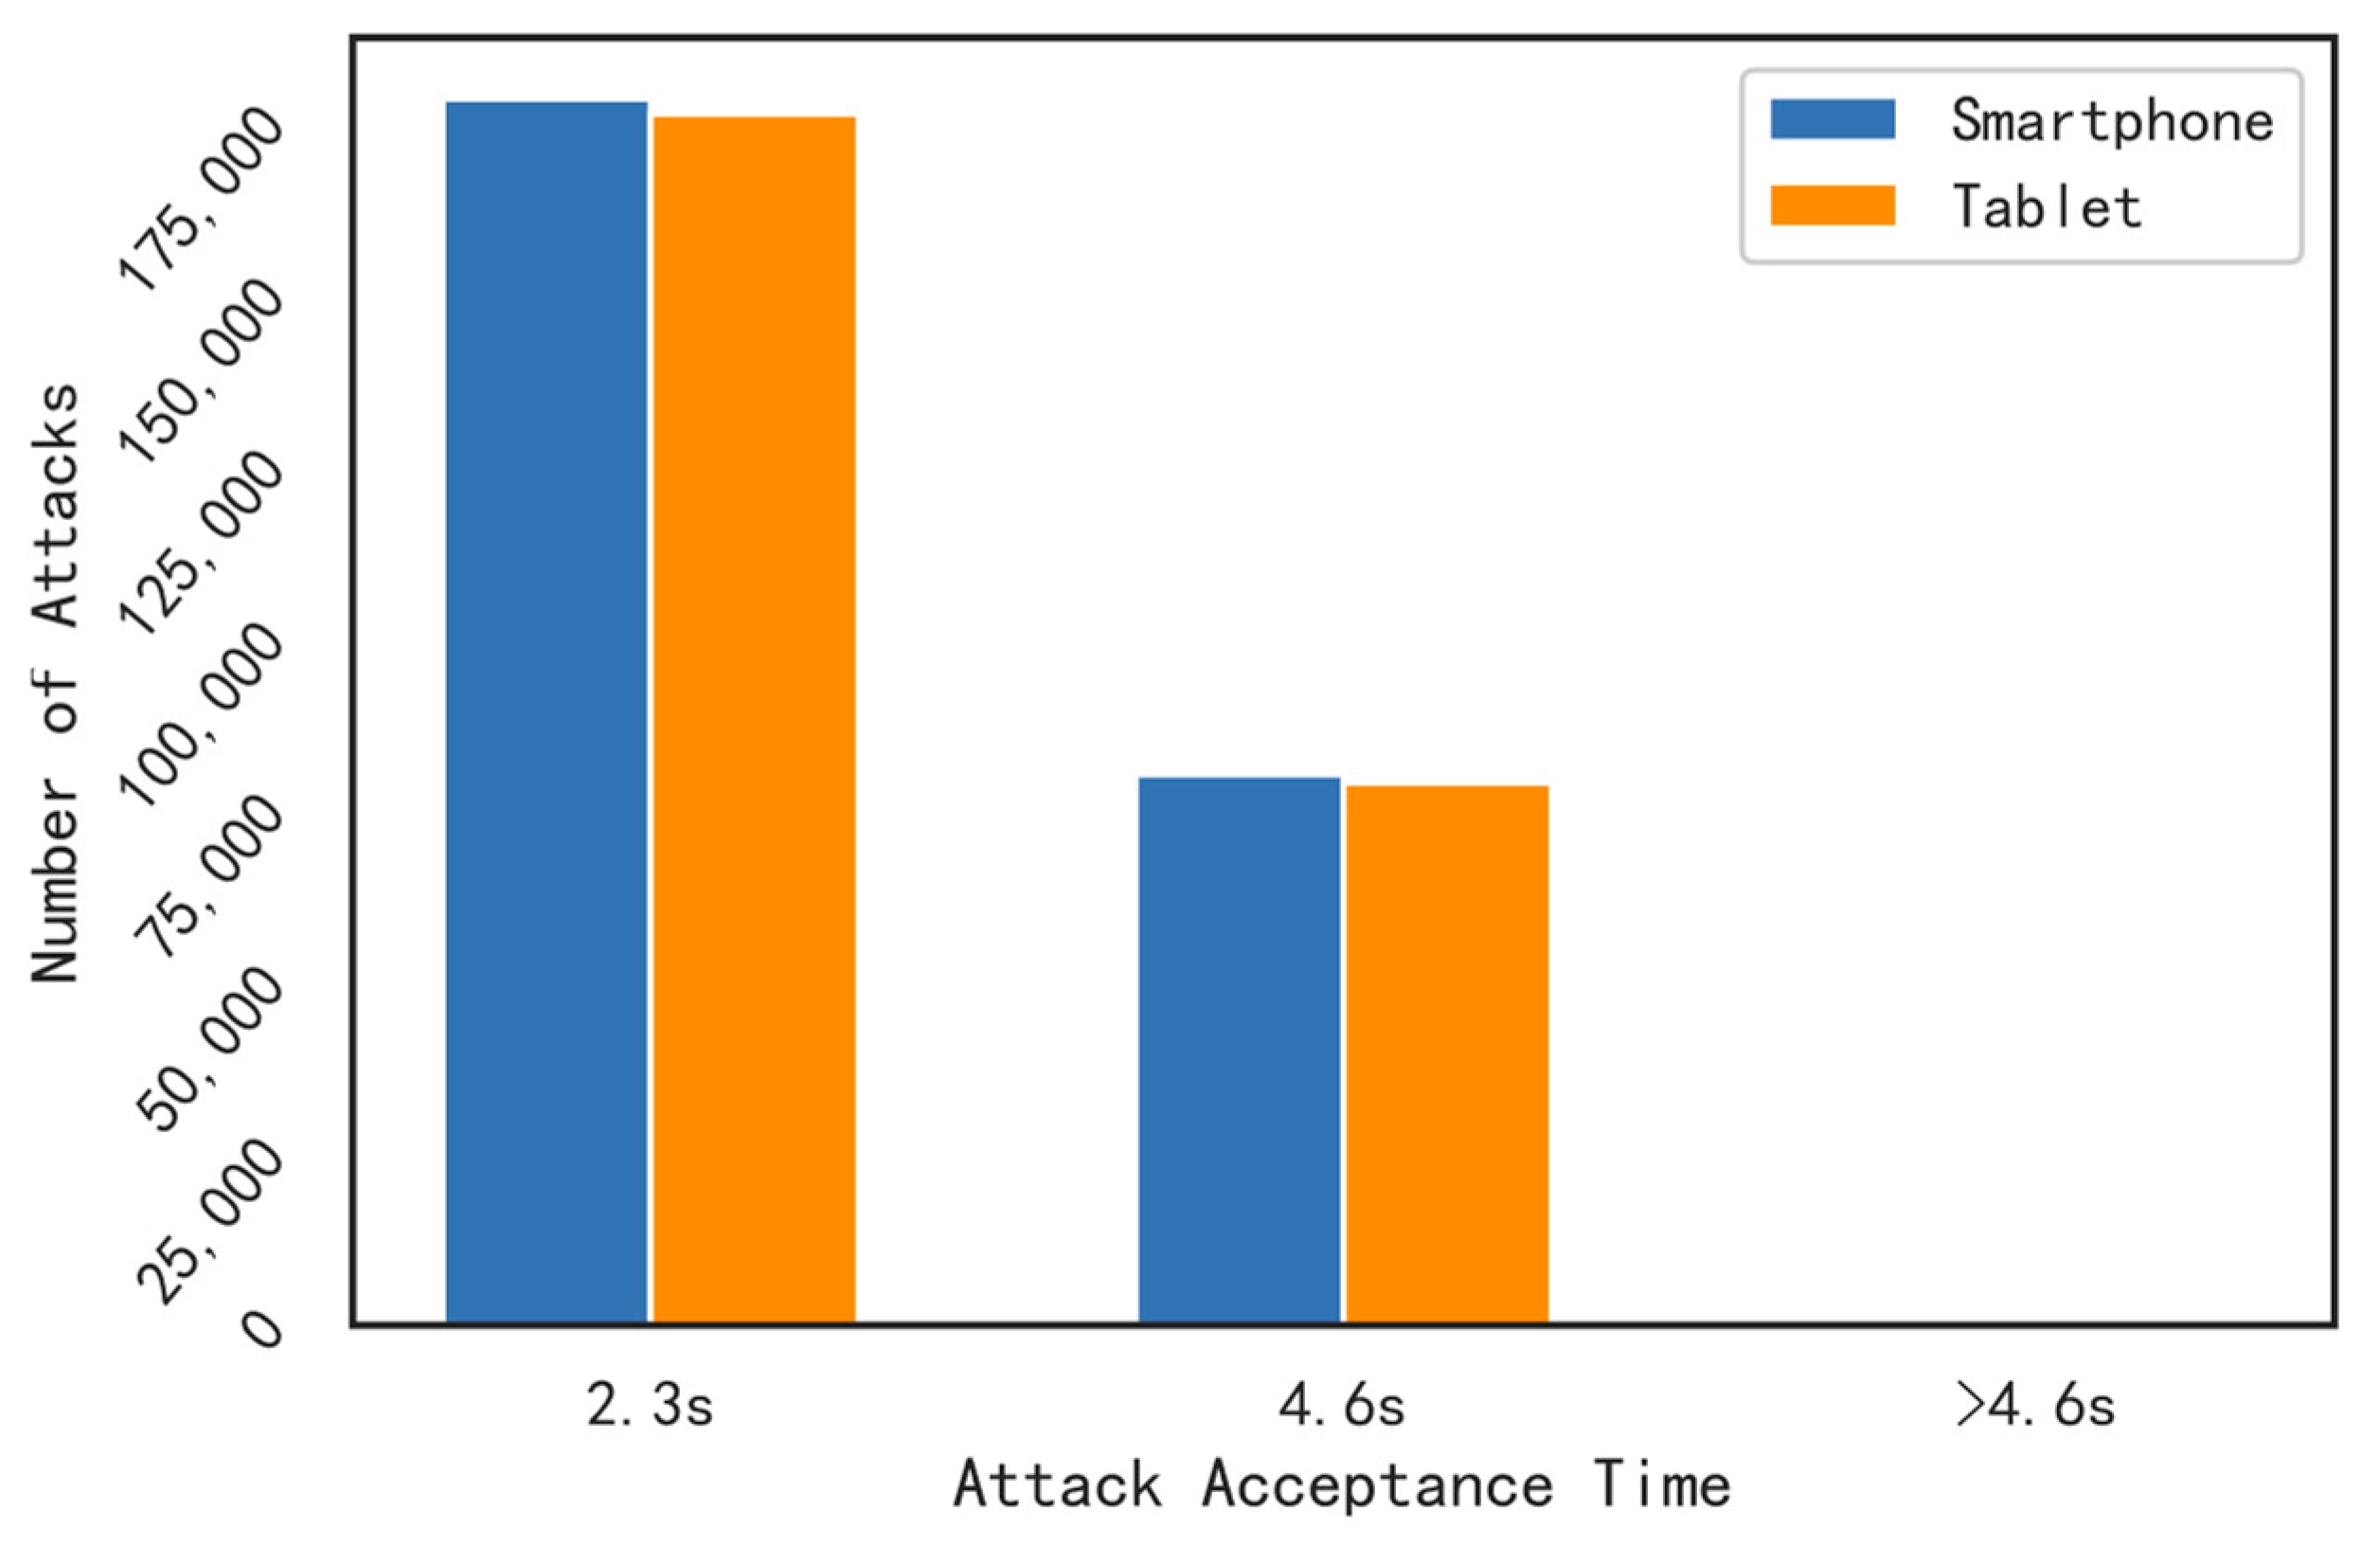
  • We carried out experiments to evaluate the performance of our scheme. First, we checked the effectiveness of the user recognition model in a multi-device scenario and the result showed the recognition model improved the accuracy of smartphones and tablets to 97.9% and 96.3%, respectively, with FRR reduced to 0.02057 and 0.03695, and FAR reduced to 0.00108 and 0.00194 for smartphones and tablets, respectively. Then, we checked the effectiveness and efficiency of the confidence-based authentication. The experimental results showed that the approach achieved 99.8% and 99.2% user authentication accuracy on the smartphone and tablet, respectively, with false rejection rates of 0.0029 and 0.00808, respectively.
The paper is structured as follows. Section 2 reviews related work. Then, our multi-device continuous authentication scheme is described in Section 3. In Section 4, we evaluate the multi-device continuous authentication performance in different scenarios. Finally, Section 5 concludes the paper and looks ahead to future work.

2. Related Work

Academics are paying behavioral biometrics more attention to redeem the shortfalls of authentication strategies in common use such as PINs, passwords, fingerprints, and face detection, which are usually available for entry-point authentication and are easily obtained or imitated. Behavior-based authentication leverages the distinct patterns of people’s actions in daily life, allowing smart devices to confirm user identity more safely and conveniently. Moreover, it enables devices to authenticate the user continuously and implicitly.
With various sensors built into smart mobile devices, such as touchscreens, accelerometers, and so forth, behavioral biometrics can be captured for continuous user authentication when people use or carry these devices. Luzbashev et al. [16] proposed a method for smartphone user authentication via consecutive swipe gesture recognition, which depended essentially on the gesture trajectory and gesture dynamic generated from the touch screen. Dybczak et al. [17] presented a smartphone continuous authentication system based on user hand movements utilizing inbuilt sensors such as the accelerometer and the gyroscope. Especially for smart touch devices, Herath et al. [18] designed a non-foolproof continuous authentication system based on features extracted from user keystroke dynamics. Moreover, Ali et al. [19] explored the approach to identify distinct users through real-world wrist-worn sensor data collected from a range of activities, and the sensors they exploited were the accelerometer and the gyroscope in wearables. Using smart wearables—smartwatches—Musale et al. [20] established an authentication framework based on gait to identify users on these widely available commercial devices. As smart devices generally accessed in daily life can provide a different continuous authentication strategy, it is still a challenge to consider a method that applies to multiple smart devices.
Existing research began investigating continuous authentication on multiple devices via various accessories and sensors. By identifying users from the behavior of keystrokes, Belman et al. [6] found correlations between smartphones, tablets, and desktops and designed a system for cross-device user authentication. It attained mean accuracies of 99.31%, 99.33%, and 99.12% for relationships between desktop and phone, desktop and tablet, and tablet and phone, respectively, using random forests (RF) classifiers. With the authentication device being confined to the same type, Wang et al. [7] achieved user authentication across the new and old smartphones by analyzing the similarity of sliding screen data between these two devices and realized 80% to 96% AUC scores using an RF (Random Forest) model. However, whether it is keystroke or touchscreen biometrics, the hardware limitation of a keyboard or touchscreen excludes most smart wearables, such as smartwatches, which are becoming increasingly popular.
As the majority of smart devices have internal motion sensors, such as accelerometers and gyroscopes, that can perceive the state of human motion, including movement and posture, biobehavioral features based on data from these sensors, such as gait [21], are one of the most promising ways to implement multi-device continuous authentication. Currently, all kinds of sensors are included in smart devices. According to the smart products provided by large-scale Internet companies such as Xiaomi, Apple, Huawei, Fitbit, and Samsung, built-in motion sensors—the accelerometer and the gyroscope—as well as the communication technology adopted by popular devices—smartphones, tablets, smartwatches, and smart bracelets—are shown in Table 1. Almost all these devices are equipped with an accelerometer sensor, that is, it is available to all of them. Meanwhile, they are all equipped with a gyroscope sensor, excluding the smart bracelet, i.e., it is optional for smart bracelets to include a sensor in accordance with the functional requirement. Significantly, all these devices can communicate with a cloud server or other endpoints. For example, smartphones can be connected to the Internet through a mobile network, such as 5G, and smart wearables can be linked with smartphones by Bluetooth, which means that most smart wearables are capable of accepting and analyzing data relying on mobile terminals, such as smartphones [22]. With the development of smart devices, they will be better able to provide user motion awareness services. Correspondingly, it might be possible to implement the biobehavioral features based on accelerometers and gyroscopes for user authentication.
A line of investigation started from motion sensor data, which exhibited symptoms of covertness and few or even no interactions [23,24]. Based on the behavioral data sensed by the accelerometer and the gyroscope built into smartphones and wearable smartwatches, Lee et al. [25] extracted user behavioral biometrics with the KRR (Kernel Ridge Regression) algorithm, improving the accuracy to a high level of 92.1% in their smartphone authentication system—iAuth. In iAuth, the time and frequency knowledge of the sensor data from multiple devices was utilized successfully. More intelligent in feature engineering than traditional machine learning techniques, Zou et al. [26] enhanced inertia-based gait recognition performance on smartphones based on a deep learning method. They integrated a DCNN (Deep Convolutional Neural Network) and a DRNN (Deep Recurrent Neural Network) to function in different domains together after noticing both the space and time domains of the inbuilt sensor data. While these practices all served continuous authentication for single devices—smartphones—we discovered the relevance of the sensor data from multiple smart devices in the spatial and temporal domain, applying it as a point of penetration to the multi-device continuous authentication. Given that the motion data of built-in sensors on different kinds of smart devices contain more complicated noise and behavioral features, deep learning neural networks are potentially able to analyze biobehavioral features from multiple devices.
It is worth noting that the continuous authentication system can recognize user identities immediately using either neural networks or traditional machine learning. In addition, most approaches determine if the user is trustworthy in a primitive way [27,28]. Diversely, some research noticed the shortcomings of the basic mechanism, such as insufficient accuracy and efficiency. Motivated by the low robustness owing to the vulnerability to the environment of biobehavioral authentication, Wang et al. [29] proposed a context-aware scheme to improve authentication stabilization, which consolidated the results of different features derived from gesture and touch behavior in static and dynamic contexts. When it comes to the situation of switching between devices in a multi-device environment, there are more complications. Due to the peculiarity of the multi-device motion sensor data, the authentication accuracy of every single device based on the straightforward mechanism differs from that of the others and is insufficient. Given the problem, we designed an adapted strategy to evaluate the level at which users can be reliable, which is extended to accommodate each device in the scheme of multi-device continuous authentication.

3. Multi-Device Authentication Scheme

In this section, we will first summarize the scheme of the multi-device continuous authentication. Then, we will explain several issues important for its implementation, including multi-device data acquisition and processing, neural network model, the scale of model input, confidence-based strategy, and user authentication.

3.1. System Overview

Existing continuous authentication systems are usually appropriate for single devices but seem ineffective for seamless authentication across multiple devices. As most smart devices are equipped with motion sensors—accelerometers and gyroscopes—we can collect users’ motion data in real time for multi-device continuous authentication. Figure 1 shows the framework of the authentication scheme. The system is applicable to mobile smart devices, such as smartphones, tablets, and smart wearables. The scheme mainly includes three stages: (1) data acquisition and processing, (2) user identity recognition through the spatiotemporal convolutional neural network model, and (3) user authentication with the confidence-based strategy.
To release the computing resources of authentication devices, a cloud server is utilized, especially for the storage and processing of large amounts of data and the common model building of multiple devices. In the stage of data collection for training, smart devices record and send the motion data to the server constantly by a background application. Then, the cloud server stores and pre-processes the mass data. After normalizing the original data, the cloud server will train the recognition network based on biobehavioral characteristics derived from users’ holding and walking and send the optimal network model to devices that require authentication separately. In the authentication stage, smart devices recognize the user by the recognition model after processing the real-time data and then update the user trust value employing the recognition result for final authentication. In the scheme, the authentication system will be updated as either device is used. In addition, when a new device needs to join the system, it will be updated by incorporating new data. In this paper, we conducted experiments using these two smart devices—a smartphone and a tablet—to verify the effectiveness and efficiency of this multi-device continuous authentication scheme.

3.2. Data Acquisition and Processing

3.2.1. Data Acquisition

Due to the fact that most existing public datasets based on built-in motion sensors come from a single device and cannot be used for research on multi-device identity authentication, we collected our own multi-device motion dataset. We designed a background motion data acquisition program to continuously collect the accelerometer and gyroscope data when users walk holding their device, with the accelerometer measuring the three-axis acceleration component of users’ hand movement in m / s 2 and the gyroscope measuring the three-axis angular velocity component of users’ hand posture in rad / s .
Based on existing mature gait datasets [30,31], we design the details of data acquisition, including the number of participants, gender ratio, time span, carrying method, etc. In order to collect the motion data of the user as accurately as possible, the data collection experiment simulates the daily life scenario as much as possible. All motion data are sensed when users walk while holding the device. Users walk with one device at a time, and in the process, data from the accelerometer and the gyroscope will be sensed. Table 2 shows an overview of our data collection initiatives. The data collection experiment was conducted in multiple sessions and over multiple natural days to reduce the occasionality of data acquisition. The experiment participants were 20 campus students, whose age distribution was between 18 and 30 years old. Two ubiquitous devices were selected for the experiment, an Android smartphone and an Android tablet that are available for behavioral data access through the authorization of the Android system. To avoid missing information within the action cycle of the arm swing due to a low sampling rate, the acquisition frequency was set to 100 Hz.

3.2.2. Multi-Device Data Relationship Analysis

The behavior of different users is unique [32]. The built-in accelerometer measures changes in the velocity or acceleration of an object, which means it captures the way the user moves their device in space [33]. The built-in gyroscope detects the orientation and rotational motion of an object, which means it records small movements or changes in position made by the user while holding the device [34]. The sensor data generated by the same user on different devices have various differences and correlations in time (e.g., frequency) and space (e.g., acceleration, rotation angle), with the accelerometer capturing the user’s movement patterns and the gyroscope recording the user’s subtle poses. Multi-device data under the same action of a user is shown in Figure 2. As can be seen, the sensor sensitivity of different devices is different. This is reflected in the difference in the value, peak, amplitude, etc. of the sensor data. Taking the X-axis data of the accelerometer as an example, the numerical range of smartphone data is significantly larger than that of tablet data. However, the overall trend line of the data from the two devices is consistent, indicating that different devices describe the user’s behavior from different perspectives, enriching the user’s behavioral characteristics to a certain extent. Based on this consistency, sensor data from multiple devices is potentially used for continuous certification research.

3.2.3. Multi-Device Data Processing

A six-dimensional vector S = ( A , G ) was formed by concatenating the three axes’ signals of the accelerometer and the gyroscope of one device, where A = ( a c c X , a c c Y , a c c Z ) is the three-dimensional vector of the accelerometer sensor and G = ( g y r o X , g y r o Y , g y r o Z ) is the three-dimensional vector of the gyroscope. We normalized the multi-device original data as shown in Figure 3, which takes the X-axis data of the acceleration sensor as an example in the intermediate process. The normalization process includes noise reduction, frequency synchronism, and grayscale image conversion, with the invalid experimental data being cut in advance.
The sensor signals contain high-frequency noise generated by the device and disturb biobehavioral feature extraction. On the other hand, it is not conducive to the synchronization of multi-device sensor signals in the next step. Therefore, the original data are first subjected to Butterworth low-pass filtering to reduce noise and maximize the flatness of the low-frequency curve. However, there is still a problem in that the equal amount of sensor data exhibits different action durations as a result of the difference in actual sampling frequency of various devices, which hinders the biobehavioral features analysis. Thus, further frequency synchronization of the sensor signal is performed using the cubic spline interpolation method. By interpolating the data in segments, it provides frequency synchronization better for real-time motion data in the condition of user authentication. The frequency synchronization algorithm is shown in Algorithm 1.
Algorithm 1 Frequency synchronization algorithm.
Input: Sensor data for device d i : s d i , i = 1 ,   2 , , n d , n d is the number of devices; Duration of sensor data for device d i : t d i .
Output: The new data after interpolation.
1. Obtain the amount of sensor data for device d i : n d i ;
2. Obtain the actual acquisition frequency f d i of the device d i : f d i = n d i / t d i
3. Obtain maximum acquisition frequency: f m a x = max( [ f d i ] );
4. Obtain the interpolated ratio for device d i : r a t e d i = f m a x / f d i ;
5. Interpolation to obtain frequency-consistent signals: S d i = interpolate ( S d i , r a t e d i ).
N S = L × L T m a x × f m a x
N S items of motion data records were intercepted and converted into grayscale images for input to the spatiotemporal convolutional neural network. The number of intercepted data, N S , is determined as in Equation (1), where L × L is the size of the grayscale image transformed from N S pieces of motion data, influenced by the maximum of the arm swing period T m a x and the maximum of the actual motion data acquisition frequency among multiple devices f m a x .
P j k = S j k m i n ( x j ) max ( x j ) m i n ( x j ) × 255
Then, the data values are mapped into grayscale images in the manner shown in Equation (2), where, S j is the motion data sequence of the j-th column, S j k is the k-th value of the column, and P j k is the pixel of S j k mapped in the grayscale image. Finally, a grayscale image containing L rows and L columns of motion signals, P , is formed, and the P ( i ) is the input to the neural network consisting of the data of the i-th motion segment.

3.3. Spatiotemporal Convolutional Neural Network

The neural network structure is shown in Figure 4. The spatiotemporal convolutional neural network consists of a three-layer CNN, which includes convolution and max-pooling, and a two-stage stacked LSTM. The activation function used after convolution is ReLU. The model’s input is a sequence of grayscale images P ( i ) transformed by motion segments.
P ( i ) is first convolved and pooled in the CNN with input x i n   C 1 × H 1 × W 1 until the image is scaled to a small enough size, where C 1 = 1 is the number of input channels and ( H 1 , W 1 ) is the size of each image, then output the convolution result x o u t   C 2 × H 2 × W 2 . The CNN reconnects the convolutional layer with the pooling layer repeatedly to extract the spatial features and flatten the result for input to the LSTM, which is a two-layer stack. Each layer provides different hidden layers and neural units, respectively, and the input of the second unit is the output of the first unit, with the storage state of the memory unit reset for each layer. The two-layer stacked LSTM helps the whole neural network maintain the temporal characteristics between behavioral feature images during training. After the LSTM extracts the temporal features of the motion data, it outputs the user recognition result y ( i ) = [ y 0 ( i ) y 1 ( i ) y N u 1 ( i ) ] , where N u is the number of users and y u ( i ) denotes the probability that the image P ( i ) belongs to the user u, 0 u N u 1 . Finally, the spatiotemporal convolutional neural network is trained to obtain the optimal user identity recognition model, by which the user identity can be recognized, i.e., the identity of the user is predicted and the possibility of belonging to the predicted identity is assessed.

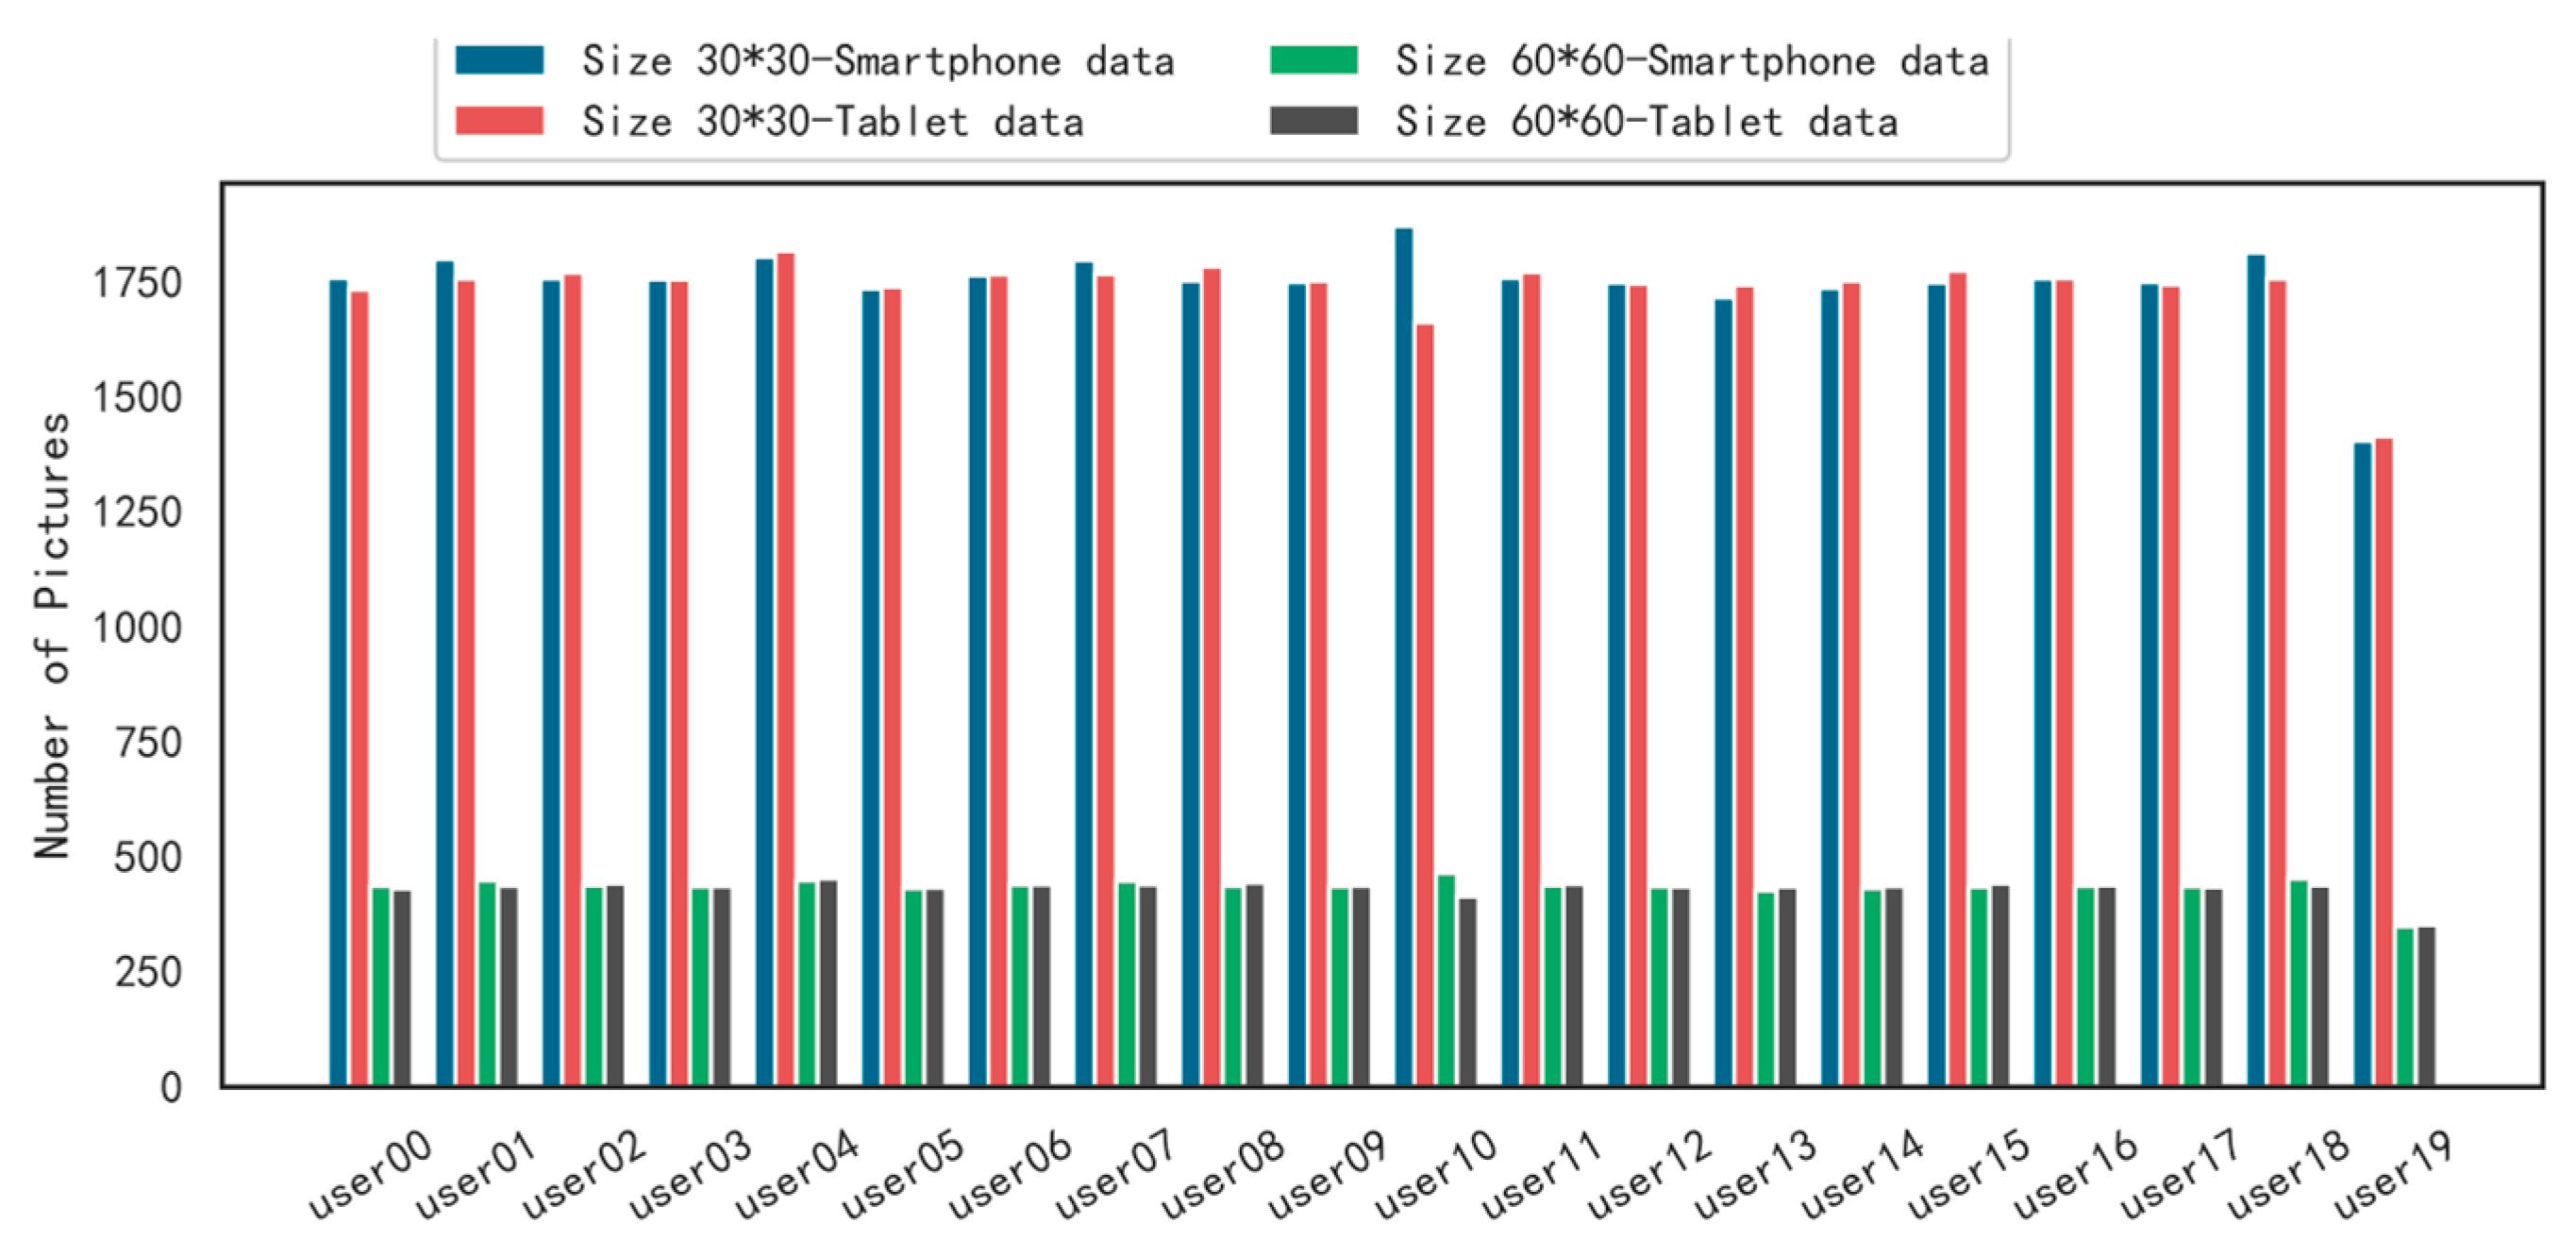
3.4. Input Scale Selection

The scale selection of the image input to neural networks is a critical point for the system because it controls the authentication effectiveness by determining whether the neural networks predict more or less accurately and impacts the time for authentication. Model inputs of different sizes are significantly relevant to multi-device common feature extraction, while motion data of a complete cycle contain more comprehensive behavioral features. When humans walk, most of the motion cycles of adults last between 1 and 1.32 s, so 1.5 s of data contain at least one motion cycle of the user data. However, when we choose some data according to the designed frequency of data acquisition (100 Hz), the actual frequency conflicts with it because devices produce more data than the experiment pre-set, and the amount of data exceeds that before frequency synchronization. According to the frequency synchronization algorithm in Algorithm 1, the actual frequency is 175 Hz. We selected different network inputs with a size L of 30 and 60 based on these two data acquisition frequencies separately, as shown in Figure 5.
The number of different-sized images obtained from the smartphone and the tablet, respectively, is shown in Figure 6. In this paper, all the data were processed into two datasets according to these image sizes. Each dataset contains two types of single devices and one type of multiple devices, totaling three data types. Each dataset was divided into a training set, a validation set, and a test set in the ratio of 8:1:1 for training, validation, and testing, respectively.
We achieved a stable model after training the user recognition networks for 1000 iterations with a learning rate of 0.0002. Table 3 shows the user recognition accuracy of the models trained with different sizes of network inputs and different types of data. With the image size L being 30, the user recognition accuracy of the smartphone is 0.883 for single-device data and 0.871 for multi-device data, which is a decrease of 0.012. Meanwhile, the user recognition accuracy of the tablet is 0.865 for single-device data and 0.845 for multi-device data, respectively, which is a decrease of 0.020. That is, when the image size is 30, the accuracy of both devices with the multi-device user recognition model is reduced compared to that with the single-device model, even if both the smartphone and tablet data are derived from the same user. While L is 60, the user recognition accuracy of the smartphone is 0.967 for single-device data and 0.979 for multi-device data, which is an improvement of 0.012. In the meantime, the user recognition accuracy of the tablet is 0.952 for single-device data and 0.963 for multi-device data, respectively, which is an increase of 0.011. That is, when the image size is 60, compared to the single-device user recognition model, the accuracy of both devices is improved with the multi-device model. These results indicate that images of size 60 contain more comprehensive motion features, which is highly correlated with the extraction of common behavioral features for multiple devices. Therefore, the dataset with an image size of 60 is selected for subsequent experiments and analytical evaluation.

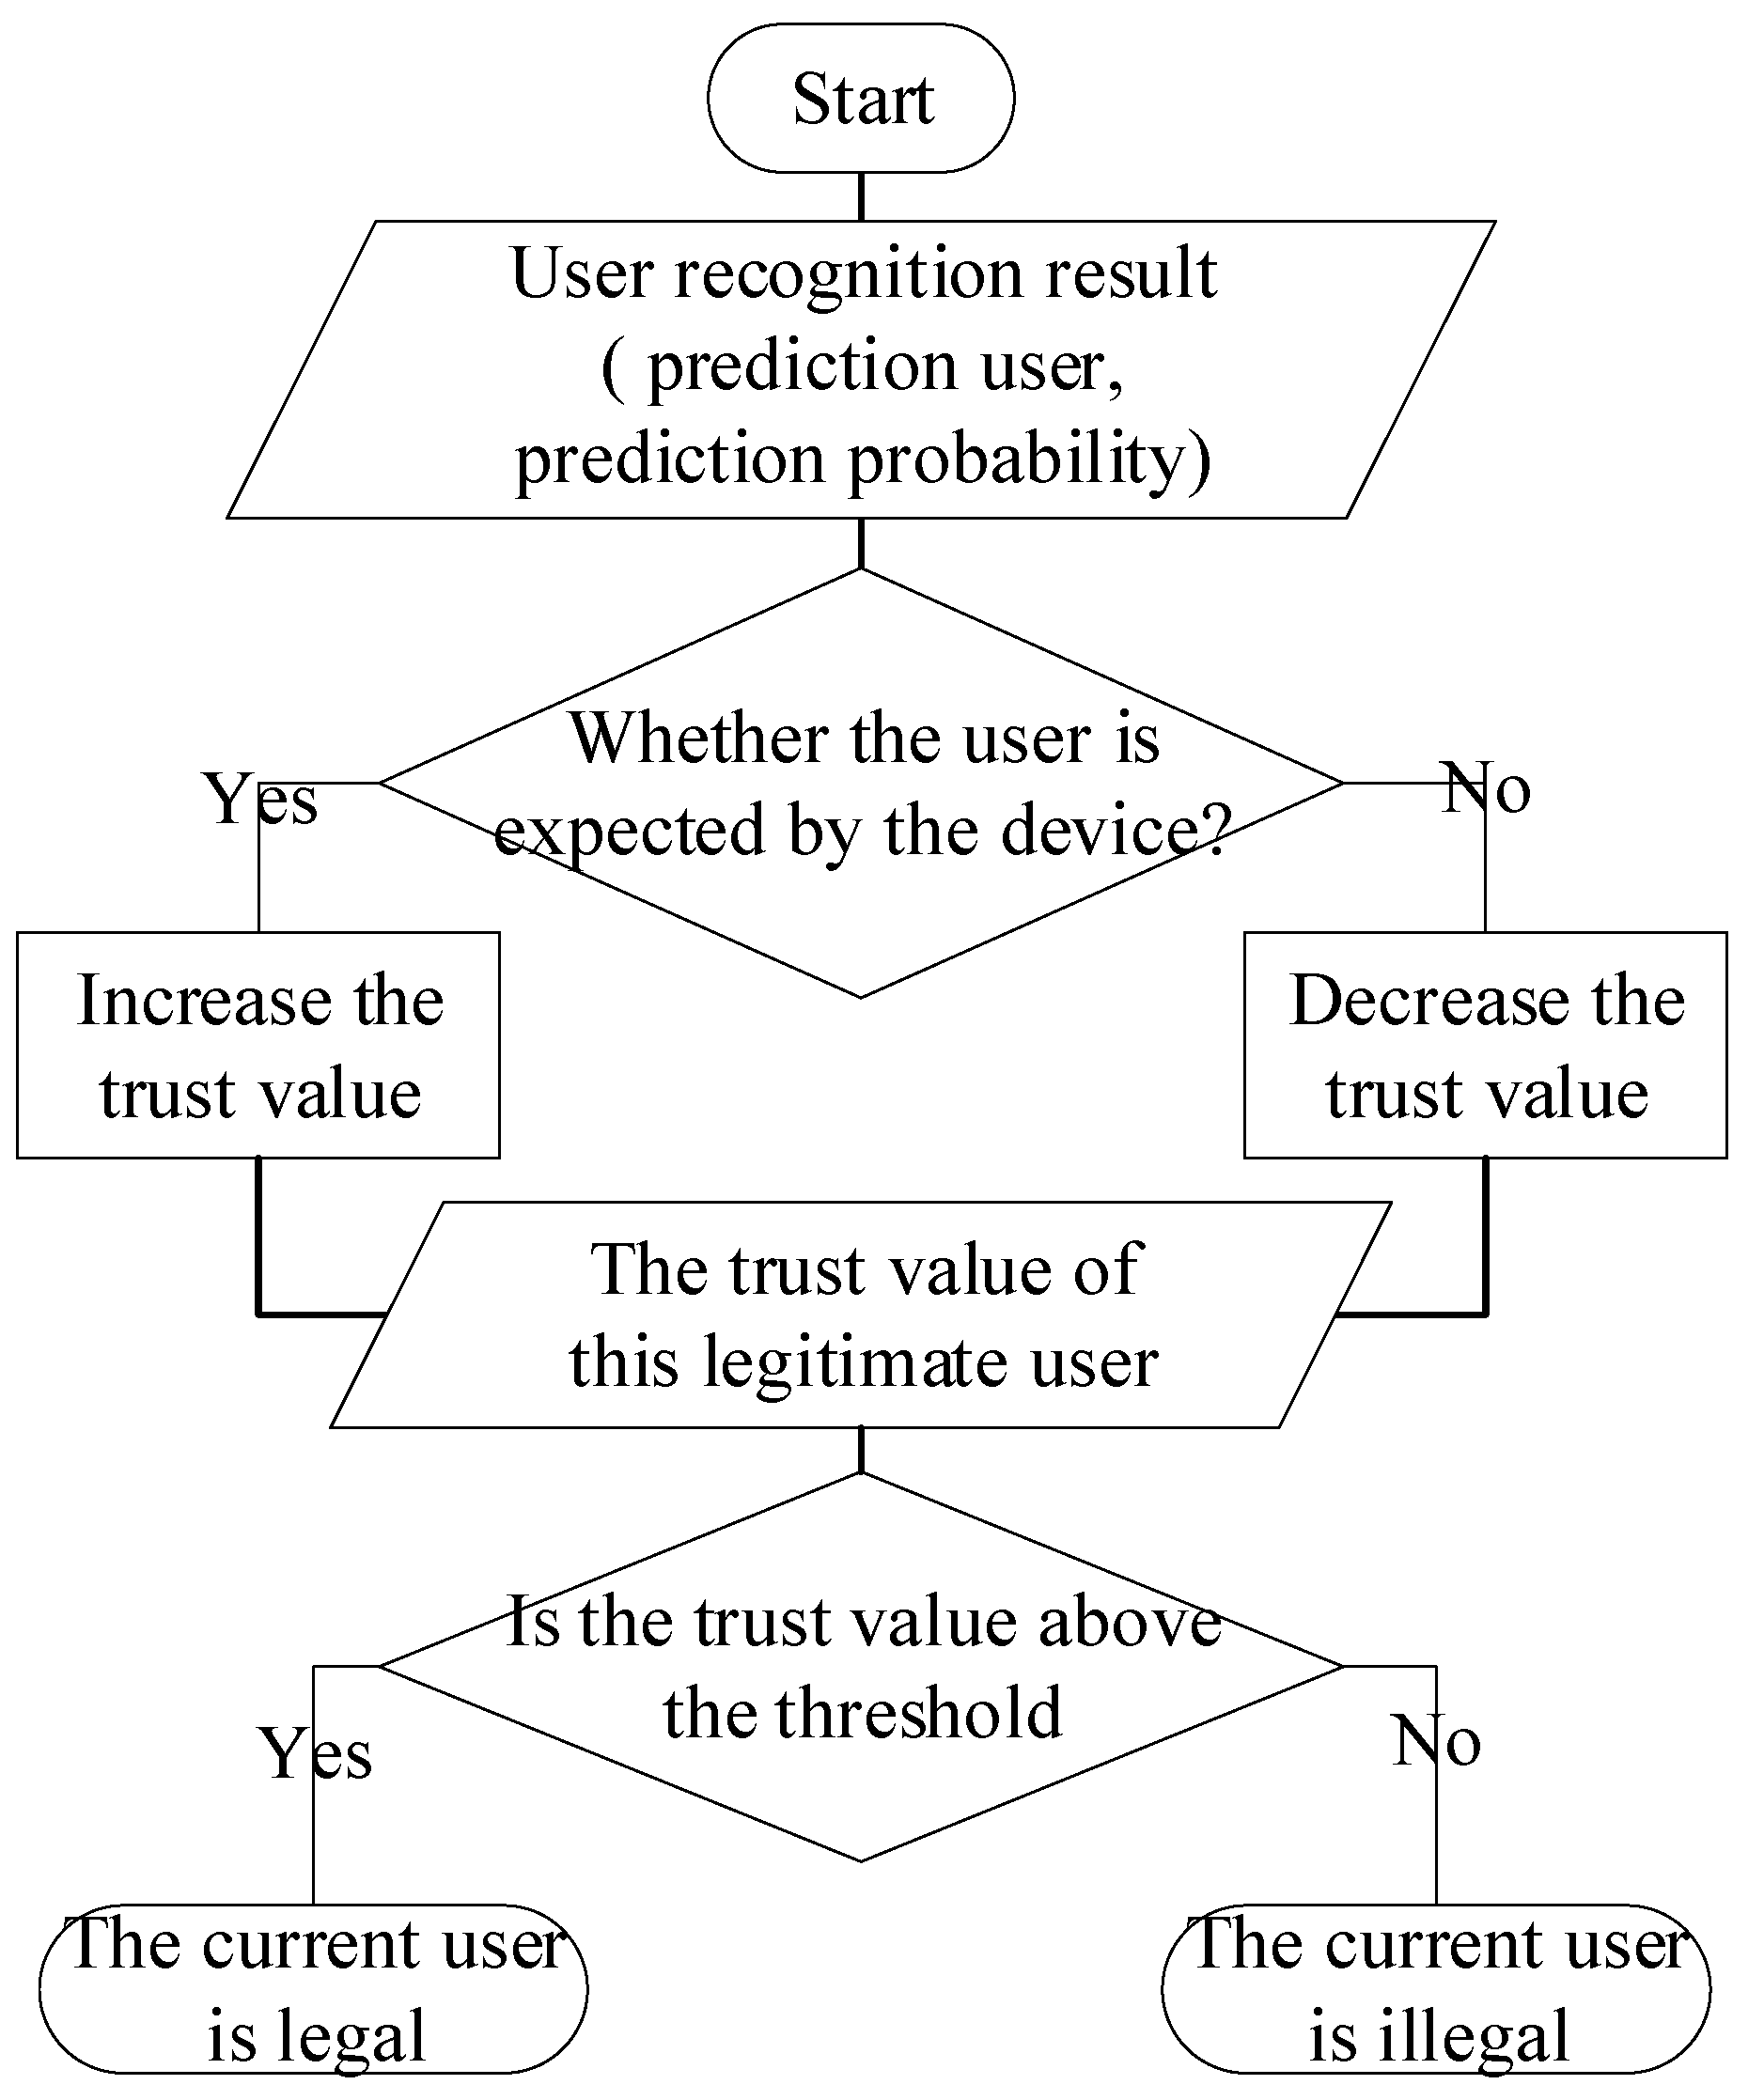
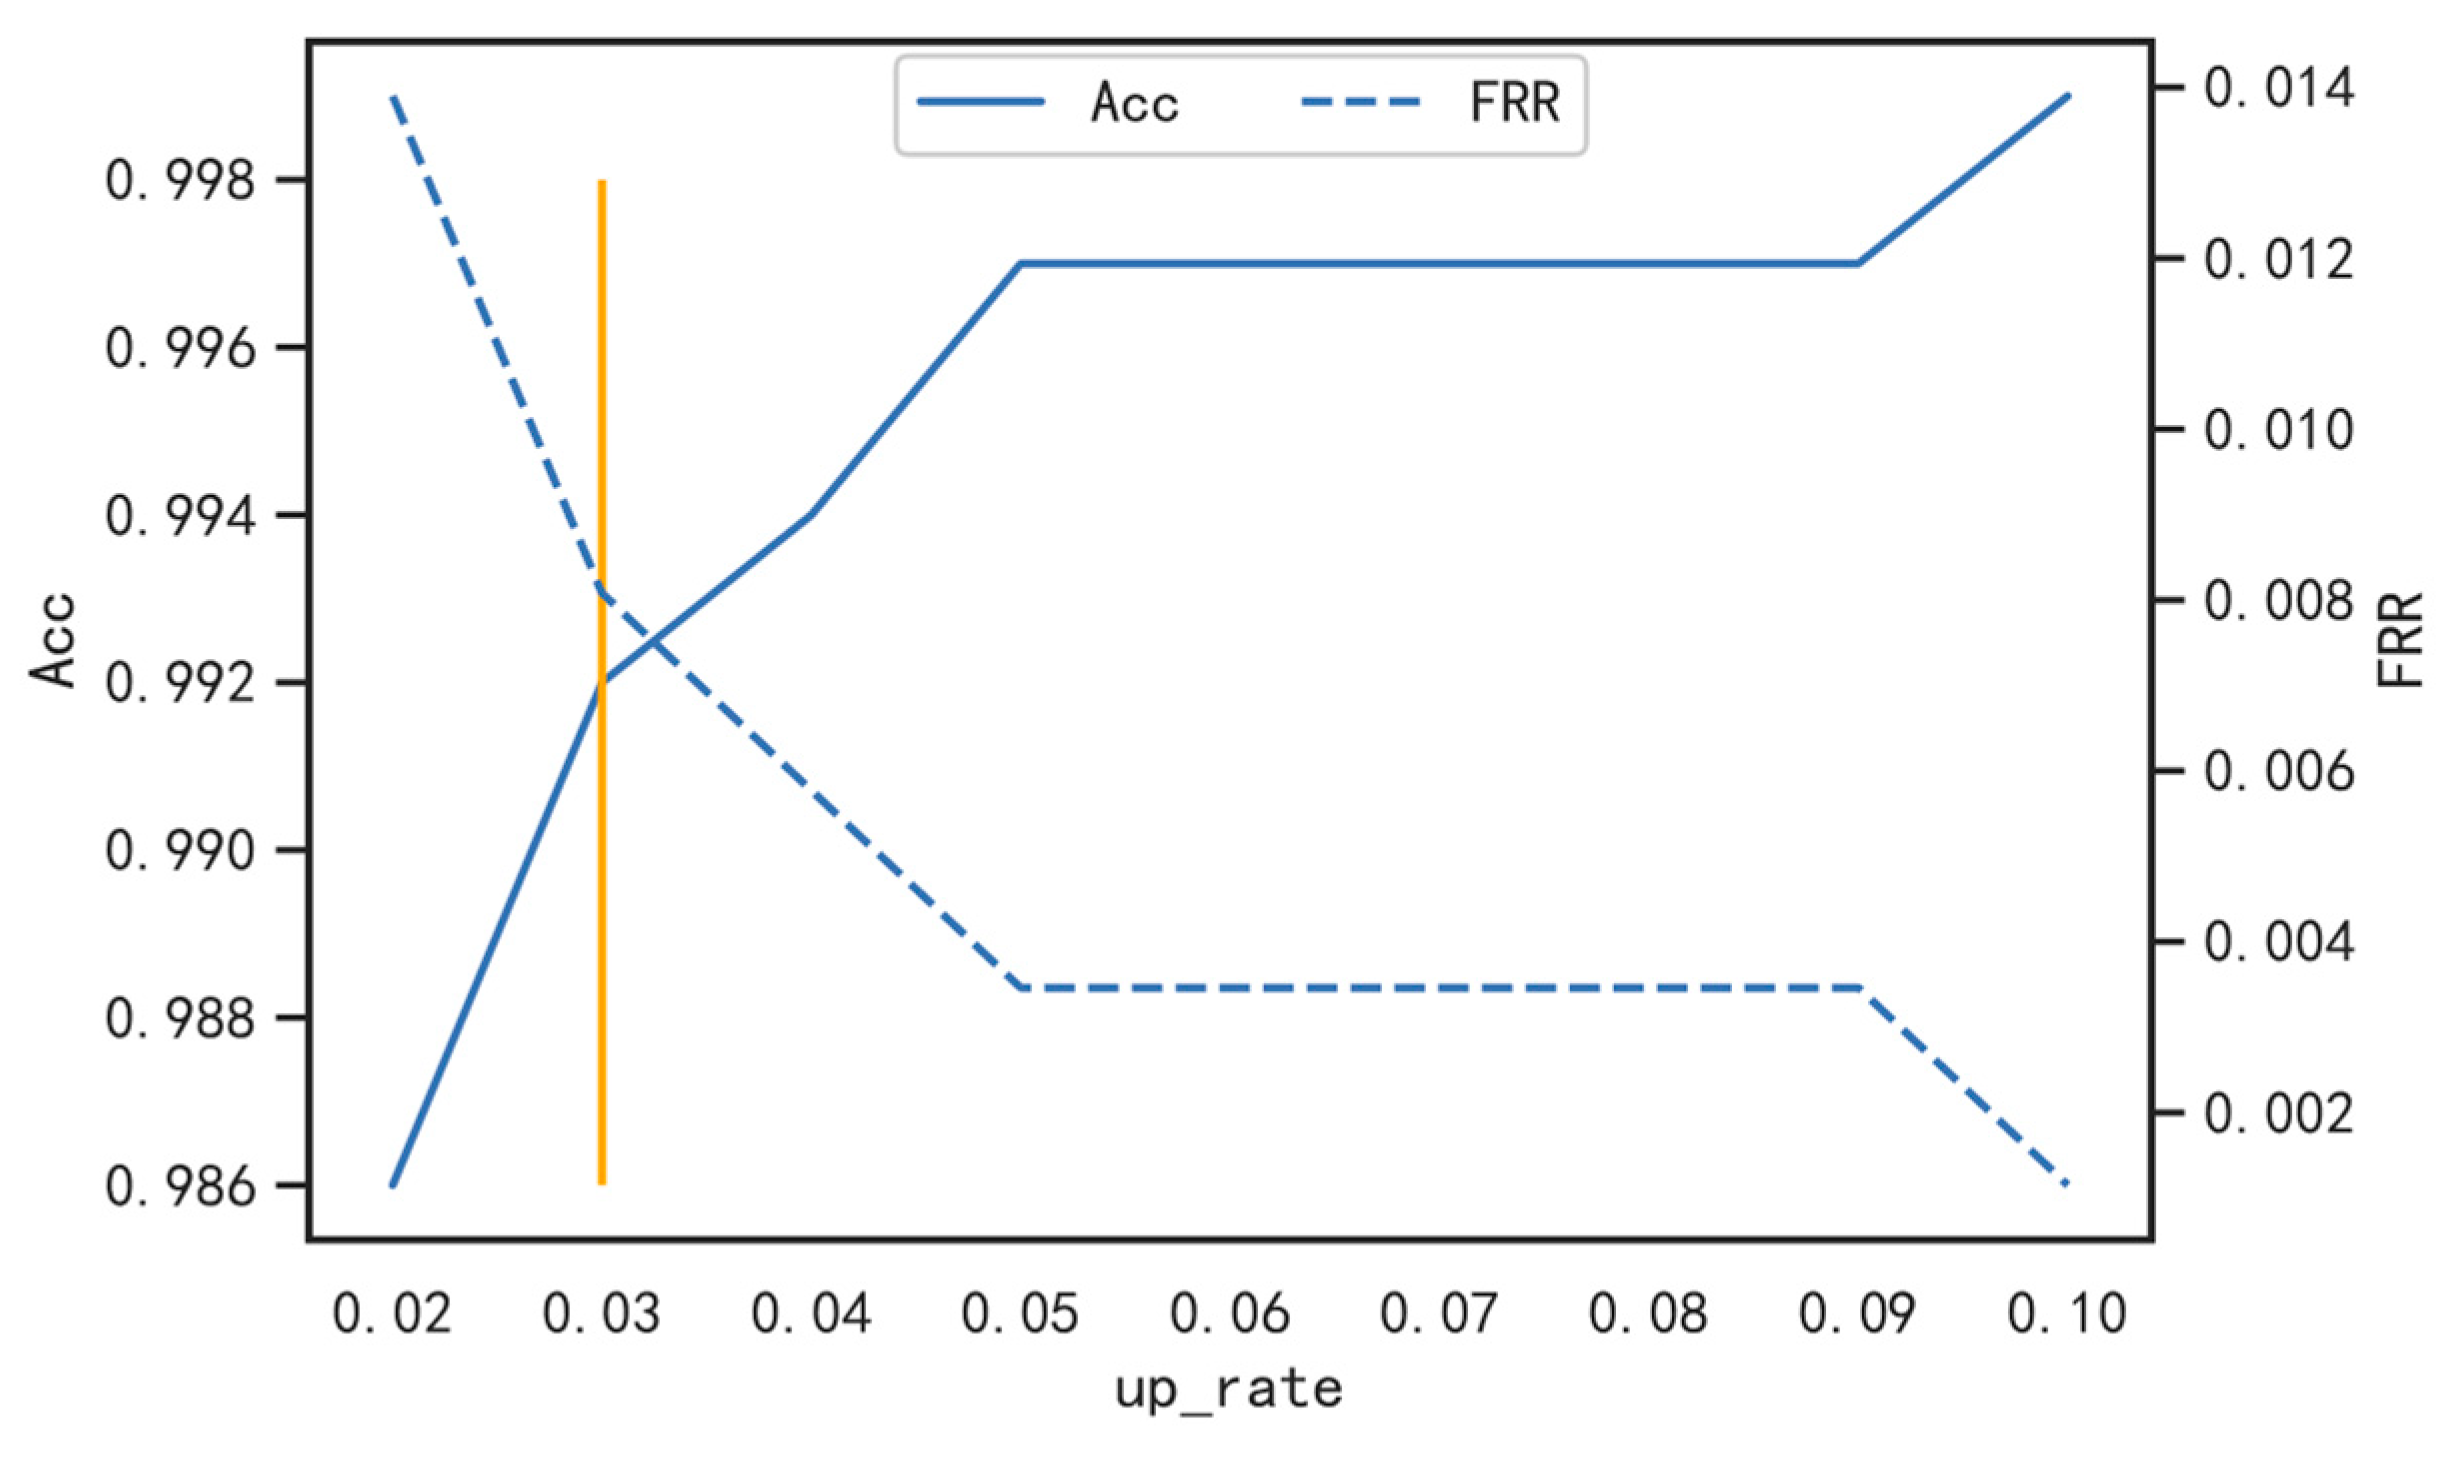
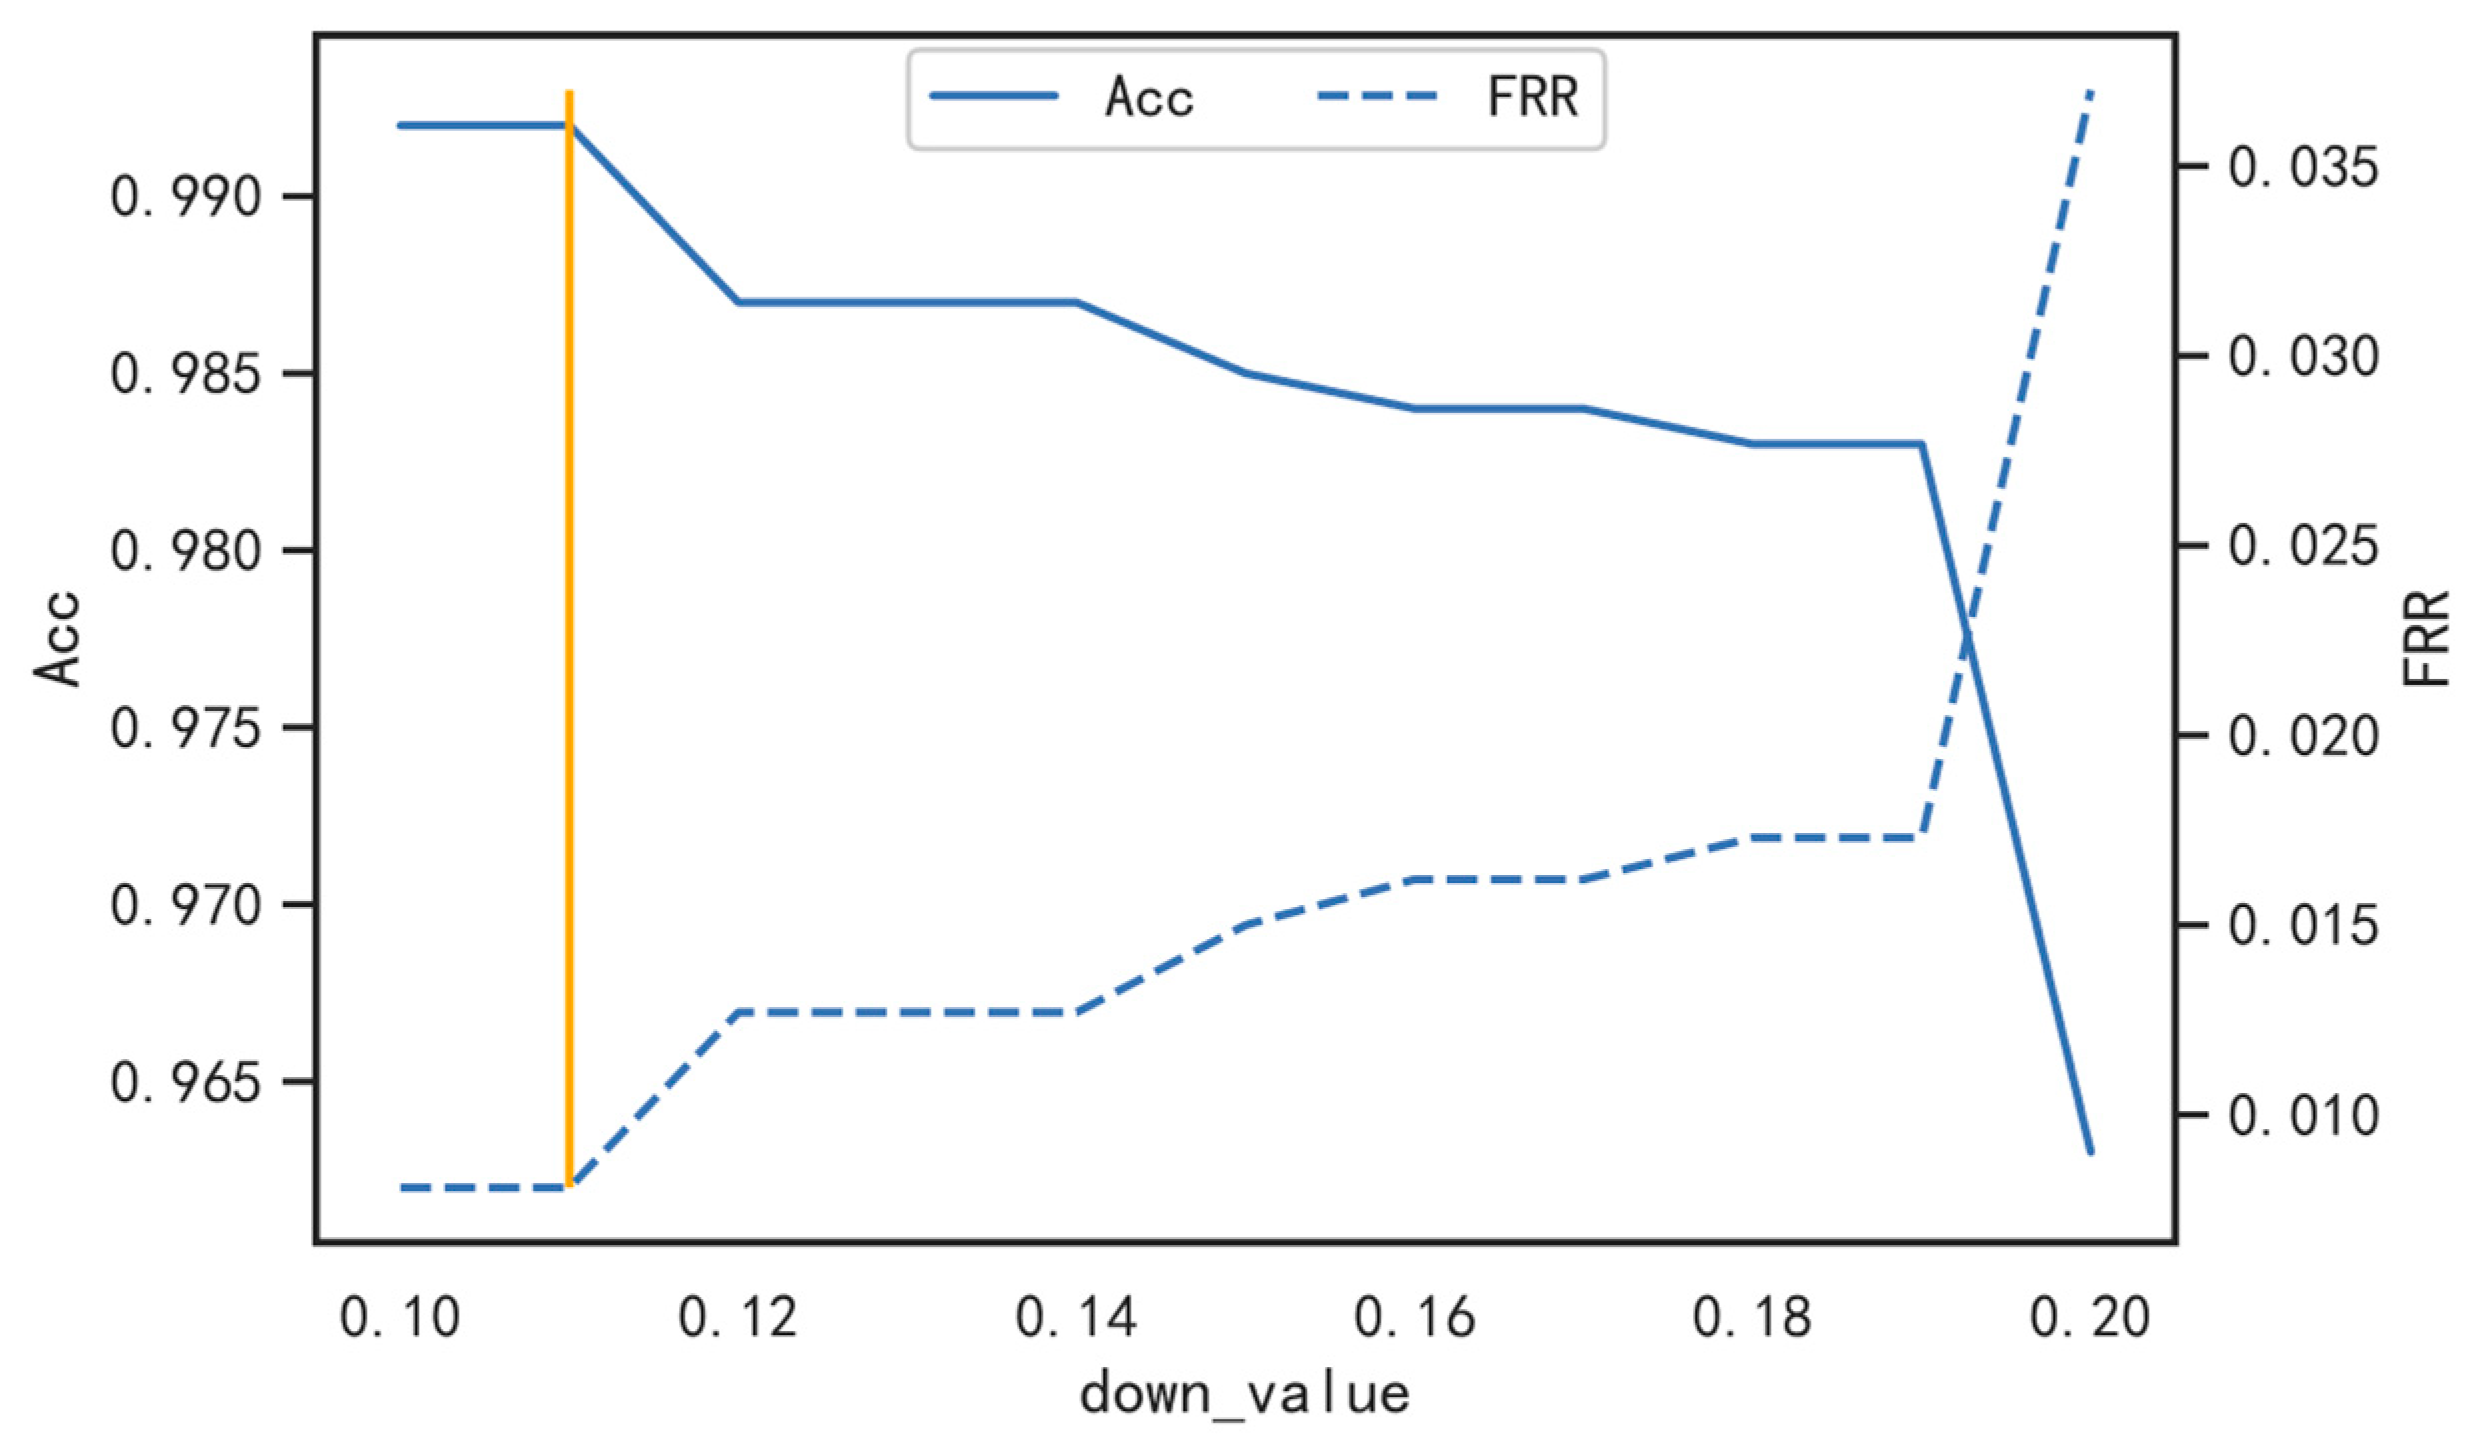
3.5. Confidence-Based Strategy

In order to cover the shortfalls in recognition with the basic neural network method, including insufficient accuracy and efficiency, we introduced a confidence-based strategy to establish long-term records of trust values for user authentication. The trust value measures how much the device trusts the legitimate user as a confidence level, which is essentially utilized by our strategy. It achieves the goal by minimizing the authentication fluctuation caused by user action irregularities and the prediction errors of neural networks. For legitimate users, the identity corresponding to the motion is consistent as their motion is continuous over a period of time. Therefore, on the basis of historical authentication results, the confidence-based strategy links the current recognition result to it and obtains the current trust degree of the device as a value. With the trust value, the correction of the next user authentication can be achieved.
t i = { t i 1 d o w n v a l u e ,     u n e x p e c t e d   u s e r t i 1 + p r o b a b i l i t y i × u p r a t e ,     e x p e c t e d   u s e r
The trust value update method is as in Equation (3). The confidence-based strategy sets an initial trust value t 0 , an increase rate u p _ r a t e , a decrease value d o w n _ v a l u e , and a threshold T for user identity legitimacy determination. These values, together with the user’s previous trust value t i 1 and the p r o b a b i l i t y i of the current motion being recognized as the user, determine the user’s current trust value t i . The predicted identity provided by user recognition is compared with the expected identity of the device to assess the user’s trust value. If it is matched, the trust value will be increased based on the historical value, where the growth value is the product of the increase rate u p _ r a t e and the predicted probability value p r o b a b i l i t y i . Otherwise, the trust value of the user will be decreased by the d o w n _ v a l u e .
We considered three factors that collectively balance the effectiveness and convenience of authenticating legitimate users and the timeliness of device locking when attacked by illegal users: (1) the gap between the threshold value T and the highest trust value 1; (2) the increase rate in the trust value after successful identification; (3) the decrease rate in the trust value after failed identification. By adjusting the values of T , u p _ r a t e , d o w n _ v a l u e , it is possible to adjust the ease of use and reliability of authentication for each device. Keeping the values of T and d o w n _ v a l u e unchanged, appropriately increasing u p _ r a t e will correspondingly improve the ease of use of authentication. Keeping u p _ r a t e unchanged and appropriately increasing the value of T or d o w n _ v a l u e will enhance the reliability of the certification. All adjustments are performed in accordance with every device requirement. Preliminarily, the initial trust value t 0 and threshold T are set to 0.8, with trust value 1 being fully trusted and no higher than 0.8 being untrustworthy. To reduce the abnormal fluctuation of authentication for a legitimate user, the u p _ r a t e is set to 0.02. In addition, since the threshold value T is close to the maximum trust value of 1, the d o w n _ v a l u e is set to a larger value of 0.1 in order to prevent illegal users from making multiple attacks when the device has reached the maximum trust value.

3.6. User Authentication

The user authentication procedure with the confidence-based strategy is shown in Figure 7. After the user trust value is determined, if the threshold is exceeded, it is authenticated as a legitimate user; otherwise, it is an illegal user. Once authenticated as an intruder, the device is locked out and the trust value returns to the initial value.

4. Experimental Results

In this section, we exhibit the experimental results and prove the effectiveness and efficiency of our multi-device continuous authentication system. We first show the feasibility of user recognition across multiple devices utilizing spatiotemporal convolutional neural networks to model the common behavioral features. Subsequently, we display the performance of the confidence-based strategy and evidence it can be adapted to each device for better user authentication.

4.1. Evaluation Criteria

User authentication goes through two phases: user recognition and confidence-based authentication. In the user recognition stage, this paper uses False Rejection Rate (FRR), False Acceptance Rate (FAR), and Accuracy (Acc) to evaluate the recognition results, which are given as follows:
F R R = F N T P + F N
F A R = F P F P + T N
A c c = T P + T N T P + F P + T N + F N
where TP is the number of true positive samples, FN is the number of false negative samples, FP is the number of false positive samples, and TN is the number of true negative samples. FRR represents the percentage of legal users misclassified as illegal in the total number of positive samples. FAR represents the percentage of illegal users misclassified as legal in the total number of negative samples. The lower the FRR and FAR, the more user-friendly and invulnerable the user recognition model will be. In addition, Acc represents the proportion of illegal users misclassified as legal users in the total number of illegal user samples, which is used to evaluate the overall classification performance of the algorithm.
The Acc and FRR can still be used in the confidence-based strategy phase. However, FAR cannot continue to be used for evaluation because when tested, each attacker cannot unlock the device after it is locked, so none of the rest can be certified. Therefore, for the evaluation of the performance of attacker authentication, we will also test how long the device accepts the illegal user’s possession of the device and analyze whether the device can be locked in time to block the illegal user’s intrusion.

4.2. User Recognition across Multiple Devices

The overall evaluation of the user recognition models for single and multiple devices is shown in Table 4. Both the FRR and FAR of smartphones and tablets with the multi-device user recognition model are lower than those in the single-device model, and the accuracy is higher than that of the single-device model. The results show the feasibility of the proposed scheme for the problem of multi-device sensor data applying to user identification, and the accuracy of multi-device user recognition is improved compared with that of single devices.
The FRR, FAR, and Acc of each user recognition are shown in Figure 8. Among the 20 people with smartphone user recognition, the FRR of single-device user recognition was higher than or equal to that of the multi-device user recognition for 16 people, compared to 14 people for tablets; the FAR of single-device user recognition was higher than or equal to that of the multi-device user recognition for 14 people, compared to 15 people for tablets. In addition, in terms of Acc, the Acc of single-device user recognition was lower than that of the multi-device user recognition for 17 people, compared to 14 people for tablets. Therefore, the multi-device model of recognition is better for most users.
The multi-device authentication scheme uses mixed data from multiple devices for the training of the user recognition model, and each device is authenticated in a uniform and efficient manner. Compared with the single-device recognition model, the multi-device one not only provides more flexibility in updating motion data but also improves authentication accuracy to a certain extent. The degradation in the recognition performance of the multi-device model that occurs between several users is because the multi-device data contains inter-device differences in user motion that do not exist in the single-device data. It interferes with the extraction of common behavioral features by the neural network and reduces user recognition accuracy. Therefore, the confidence-based strategy is necessarily introduced to further process the user recognition results to resolve the problem and improve authentication effectiveness and efficiency.

4.3. Confidence-Based User Authentication

Figure 9 shows result sequences for each user in the user recognition phase and confidence-based authentication phase of our authentication scheme. Based on the historical trust value, the higher the probability that the user recognition result matches the expected identity, the more the trust value increases; therefore, the trust value of most users keeps increasing during legal user holding.
As is shown in Subplots (c) and (d) of Figure 9, in the early stage of user authentication with a low trust value, the authentication errors brought by drops in trust value are synchronized with recognition errors. However, in the late stage of authentication with a high trust value, these drops just disturb user authentication lightly while the legal user uses the device. Significantly, it can still prevent the device from accepting illegal users for a long time. Therefore, no authentication error occurs in the late stage of authentication with the confidence-based strategy. Compared to the number of user recognition errors, the number of confidence-based authentication errors of both the smartphone and the tablet decreased a lot. This result indicates that, for legitimate users, the confidence-based strategy improves the system’s fault tolerance for user recognition and allows for more accurate authentication.
The Acc and FRR results of the confidence-based authentication and user recognition are compared and shown in Figure 10. As it demonstrates, the FRR of legitimate users on each device under the confidence-based strategy is lower than that of user recognition. It shows that the Acc of legitimate users on each device under the confidence-based strategy is better than that of user recognition. That means that the authentication accuracy of all users is improved under the confidence-based strategy.
While the confidence-based strategy improved the accuracy of authentication of legal users, it may also allow illegal users to be accepted by the device for a more extended period of time. To verify the effectiveness of the confidence-based strategy on the authentication of illegal users, the time taken for the device to refuse the illegal user is analyzed. Taking users except for the legal user as illegal users for the attack test, the time for one authentication is about 2.3 s, and the illegal user takes 2.3 s for each escape of authentication.
With the confidence-based strategy, the number of attacks accepted by the device with different attack tolerance times is shown in Figure 11. It takes at most 4.6 s for each user to deny the illegal user in a limited number of 258,303 attack attempts for smartphones versus 257,127 attempts for tablets. Under the confidence-based strategy, the period when the trust value often stays within the interval of (0.8,0.9] is the early stage of authentication, at which time the device takes approximately 2.3 s to disable access to illegal users; the period when the trust value usually stays within the interval of (0.9,1.0] is the late stage of authentication, at which time the device needs more time (4.6 s) to block the access to illegal users. No illegal user can pass the authentication three times in a row under the confidence-based strategy. These results show that the confidence-based strategy improves the accuracy and stability of authentication for legitimate users while preventing illegal user attacks on time.

4.4. Confidence-Based Strategy Adjustments

The same settings for the confidence-based strategy likely will not be suitable for every device. For tablets, the authentication accuracy is only 98.6% under the preliminary setting of the strategy, while it is 99.8% for smartphones. That is because the user recognition accuracy of tablets is lower than that of smartphones before the confidence-based strategy is implemented. Setting the appropriate parameters for the confidence-based strategy will better balance ease of use and reliability for tablet authentication.
Leave T and d o w n _ v a l u e unchanged and under different u p _ r a t e of confidence-based strategy, the FRR and Acc of authentication are shown in Figure 12. As the u p _ r a t e continues to increase, the authentication accuracy first increases, then flattens, and then continues to increase. When the u p _ r a t e is 0.10 maximum, the accuracy of authentication increases to 0.999, and FRR decreases to 0.00115. However, the reliability of authentication is compromised at this point. The trend of Acc and FRR changes with u p _ r a t e demonstrates the effectiveness of the confidence-based strategy. When u p _ r a t e is between 0.05 and 0.09, Acc and FRR keep flat, due to the finite error of user recognition. As u p _ r a t e rises again, the number of authentication errors does not change. When the u p _ r a t e is increased to equal the d o w n _ v a l u e , Acc is close to 1, while FRR is close to 0, because the increase in the trust value of legitimate users is enough to offset the decrease in trust value caused by user misidentification. At the point where the u p _ r a t e is 0.03 in Figure 12, it can provide a better balance between ease of use and reliability of authentication by adjusting the u p _ r a t e to the value that causes Acc to rise the most and FRR to drop the most.
Then we set the u p _ r a t e to a fixed value of 0.03. With the settings of different d o w n _ v a l u e and the same threshold T, the FRR and Acc of the confidence-based authentication are shown in Figure 13. As the d o w n _ v a l u e increases, the Acc of authentication continues to decrease or remains flat. The flat situation is due to the fact that the decline in trust values does not affect the number of passed certifications. When the d o w n _ v a l u e is 0.20, the Acc of authentication decreases to 0.963 and FRR increases to 0.037. At this point, the confidence-based strategy does not improve the ease of use for authentication because the drop in trust value caused by a single misidentification is sufficient to prevent the authentication from passing. A suitable point for d o w n _ v a l u e should be the point corresponding to the right endpoint of each horizontal segment in Figure 13. For example, if d o w n _ v a l u e is 0.11, it will be beneficial to improve the reliability of authentication without changing its ease of use.
We tested again the duration that illegal users can hold onto the tablet and compared the results with those obtained before adjusting the strategy. As shown in Figure 14, after increasing the u p _ r a t e and the d o w n _ v a l u e , the number of times the tablet allows illegal users to hold for 2.3 s slightly decreases, while the number of times it allows for 4.6 s slightly increases. This is because the increased u p _ r a t e causes the trust value to enter the early stage of the confidence-based authentication earlier. Meanwhile, no illegal user has been able to escape authentication two times in a row. This is because the d o w n _ v a l u e is large enough.
On the whole, for tablets, when the confidence-based strategy takes an u p _ r a t e of 0.03 and a d o w n _ v a l u e of 0.11, it can better improve the ease of use of authentication. Increasing the u p _ r a t e means that the trust value rises faster, which also means that legitimate users will reach high trust levels faster. In addition, increasing the d o w n _ v a l u e means that the trust value drops more sharply, and illegal users will be detected by devices earlier. Therefore, in order to ensure both the ease of use and reliability of authentication, it is better to increase the values of u p _ r a t e and d o w n _ v a l u e rather than decrease them. When we increase the value of both appropriately, the Acc of user authentication will be improved to some extent, but the device does not need a longer time to detect the illegal user. Through the adjustment of the confidence-based strategy parameters, the optimal authentication accuracy of the tablet reached 99.2%, and at the same time, FRR was 0.00808.

4.5. Compared to Existing Work

Currently, most studies that authenticate user identity based on motion sensor data from smart devices only serve a single device. The authentication performances of several studies are given in Table 5. These studies all collected the required data on their own. Li et al. [24] used the mobile phone accelerometer for gait authentication and achieved a success rate of 93.63% on a dataset of 30 people. The authentication time of this work ranged from 1 to 2 s, but the accuracy was relatively low. Lee et al. [25] used the accelerometer and gyroscope data from a smartphone, achieving an authentication accuracy of 83.2%. Then, by combining it with a smartwatch for supplementary authentication, they improved the accuracy to 92.1%. Additionally, the authentication time required to achieve this accuracy was 6 s. Ehatisham-ul-Haq et al. [35] proposed a continuous authentication scheme using the accelerometer, gyroscope, and magnetometer sensors of a mobile phone. In their walking dataset with 10 individuals, the authentication time was approximately 5 s, and the accuracy reached 99.4%. Sara et al. [36] re-authenticated users in mobile applications using motion sensor data. In the dataset of 47 individuals, users were re-authenticated with 96.70% accuracy within 20 s. Obviously, the re-authentication time was relatively long.
In addition, for the authentication of the single tablet device, Dee et al. [5] exploited the consistent keystroke data generated by on-screen soft keyboard interaction to authenticate the user, using the distance indicators of touch pressure, position, and time. The study achieved 100% accuracy in 3.9 s, but the number of experimental users was small—only four people.
These methods achieve good authentication performance, but they are all based on a single device. In the multi-device authentication scheme in this paper, the authentication accuracy is 99.8% for smartphones and 99.2% for tablets. At the same time, our method takes about 2.3 s to realize user authentication, and the device can be locked in approximately 4.6 s to prevent access by unauthorized users.

5. Conclusions and Future Work

In this paper, we proposed a continuous authentication system across multiple smart devices with a unique motion model captured by inbuilt sensors—accelerometers and gyroscopes. It monitors the user’s motion during walking and then authenticates him or her in real time. With an Acc of 99.8% and 99.2% for smartphones and tablets separately, as well as rejecting illegal users within two authentications, the system is proven to be user-friendly and reliable. Moreover, it is designed to be extensible so that more devices can join the system. While most existing works certificate users for every single device in isolation, we authenticated users seamlessly across multiple devices by taking these smart devices as a whole. In the future, we will adapt the system to more scenarios, such as using the device with the body staying static.

Author Contributions

Y.W. performed the data gathering and preprocessing, contributed to the design of the algorithms, executed the detailed analysis, and wrote most sections. X.Z. set the objectives of the research, designed the paper, wrote some sections, and performed the final corrections. H.H. contributed to the design of the algorithms. All authors have read and agreed to the published version of the manuscript.

Funding

This research was funded by the “National Natural Science Foundation of China”, grant number 61802252.

Data Availability Statement

The data presented in this study are available on request from the corresponding author. The data are not publicly available due to privacy or ethical restrictions.

Conflicts of Interest

The authors declare no conflict of interest. The funders had no role in the design of the study; in the collection, analyses, or interpretation of data; in the writing of the manuscript, or in the decision to publish the results.

References

  1. Consumer Electronics—Statistics & Facts. Available online: https://www.statista.com/topics/4408/consumer-electronics/#topicOverview (accessed on 24 November 2022).
  2. Algaradi, T.S.; Rama, B. Big Data Security: A Progress Study of Current User Authentication Schemes. In Proceedings of the 2018 4th International Conference on Applied and Theoretical Computing and Communication Technology (iCATccT), Mangalore, India, 6–8 September 2018; pp. 68–75. [Google Scholar]
  3. Breitinger, F.; Tully-Doyle, R.; Hassenfeldt, C. A survey on smartphone user’s security choices, awareness and education. Comput. Secur. 2020, 88, 101647. [Google Scholar] [CrossRef]
  4. Acar, A.; Aksu, H.; Uluagac, A.S.; Akkaya, K. A Usable and Robust Continuous Authentication Framework Using Wearables. IEEE Trans. Mob. Comput. 2021, 20, 2140–2153. [Google Scholar] [CrossRef]
  5. Dee, T.; Richardson, I.; Tyagi, A. Continuous Transparent Mobile Device Touchscreen Soft Keyboard Biometric Authentication. In Proceedings of the 2019 32nd International Conference on VLSI Design and 2019 18th International Conference on Embedded Systems (VLSID), Delhi, India, 5–9 January 2019; pp. 539–540. [Google Scholar]
  6. Belman, A.K.; Phoha, V.V. DoubleType: Authentication Using Relationship Between Typing Behavior on Multiple Devices. In Proceedings of the 2020 International Conference on Artificial Intelligence and Signal Processing (AISP), Amaravati, India, 10–12 January 2020; pp. 1–6. [Google Scholar]
  7. Wang, X.; Yu, T.; Mengshoel, O.; Tague, P. Towards continuous and passive authentication across mobile devices: An empirical study. In Proceedings of the 10th ACM Conference on Security and Privacy in Wireless and Mobile Networks, Boston, MA, USA, 18–20 July 2017; pp. 35–45. [Google Scholar]
  8. Incel, O.; Gunay, S.; Akan, Y.; Barlas, Y.; Basar, O.; Alptekin, G.; Isbilen, M. DAKOTA: Sensor and Touch Screen Based Continuous Authentication on a Mobile Banking Application. IEEE Access 2021, 9, 38943–38960. [Google Scholar] [CrossRef]
  9. Keykhaie, S.; Pierre, S. Mobile Match on Card Active Authentication Using Touchscreen Biometric. IEEE Trans. on Consum. Electron. 2020, 66, 376–385. [Google Scholar] [CrossRef]
  10. Ananya; Singh, S. Keystroke Dynamics for Continuous Authentication. In Proceedings of the 2018 8th International Conference on Cloud Computing, Data Science & Engineering (Confluence), Noida, India, 11–12 January 2018; pp. 205–208. [Google Scholar]
  11. Lu, L.; Yu, J.; Chen, Y.; Liu, H.; Zhu, Y.; Kong, L.; Li, M. Lip Reading-Based User Authentication Through Acoustic Sensing on Smartphones. IEEE/ACM Trans. Netw. 2019, 27, 447–460. [Google Scholar] [CrossRef]
  12. Shuwandy, M.; Aljubory, H.; Mohammed Hammash, N.; Salih, M.; Altaha, M.; Alqaisy, Z. BAWS3TS: Browsing Authentication Web-Based Smartphone Using 3D Touchscreen Sensor. In Proceedings of the 2022 IEEE 18th International Colloquium on Signal Processing & Applications (CSPA), Selangor, Malaysia, 11 May 2022; pp. 425–430. [Google Scholar]
  13. Chen, Y.; Shen, C.; Wang, Z.; Yu, T. Modeling interactive sensor-behavior with smartphones for implicit and active user authentication. In Proceedings of the 2017 IEEE International Conference on Identity, Security and Behavior Analysis (ISBA), New Delhi, India, 22–24 February 2017; pp. 1–6. [Google Scholar]
  14. Vhaduri, S.; Dibbo, S.; Cheung, W. HIAuth: A Hierarchical Implicit Authentication System for IoT Wearables Using Multiple Biometrics. IEEE Access 2021, 9, 116395–116406. [Google Scholar] [CrossRef]
  15. Abuhamad, M.; Abuhmed, T.; Mohaisen, D.A.; Nyang, D. AUToSen: Deep-Learning-Based Implicit Continuous Authentication Using Smartphone Sensors. IEEE Internet Things J. 2020, 7, 5008–5020. [Google Scholar] [CrossRef]
  16. Luzbashev, A.; Filippov, A.; Kogos, K. Continuous User Authentication in Mobile Phone Browser Based on Gesture Characteristics. In Proceedings of the 2018 Second World Conference on Smart Trends in Systems, Security and Sustainability (WorldS4), London, UK, 30–31 October 2018; pp. 90–95. [Google Scholar]
  17. Dybczak, J.; Nawrocki, P. Continuous authentication on mobile devices using behavioral biometrics. In Proceedings of the 2022 22nd IEEE International Symposium on Cluster, Cloud and Internet Computing (CCGrid), Taormina, Italy, 16–19 May 2022; pp. 1028–1035. [Google Scholar]
  18. Herath, C.; Dulanga, K.G.C.; Tharindu, N.V.D.; Ganegoda, G.U. Continuous User Authentication using Keystroke Dynamics for Touch Devices. In Proceedings of the 2022 2nd International Conference on Image Processing and Robotics (ICIPRob), Colombo, Sri Lanka, 12–13 March 2022; pp. 1–6. [Google Scholar]
  19. Ali, Z.; Payton, J. Task-Based Continuous Authentication Using Wrist-Worn Devices. In Proceedings of the 2021 IEEE International Conference on Pervasive Computing and Communications Workshops and Other Affiliated Events (PerCom Workshops), Kassel, Germany, 22 March 2021; pp. 642–647. [Google Scholar]
  20. Baek, D.; Musale, P. You Walk, We Authenticate: Lightweight Seamless Authentication Based on Gait in Wearable IoT Systems. IEEE Access 2019, 7, 37883–37895. [Google Scholar] [CrossRef]
  21. Sprager, S.; Juric, M.B. Inertial Sensor-Based Gait Recognition: A Review. Sensors 2015, 15, 22089–22127. [Google Scholar] [CrossRef] [PubMed]
  22. Bianchi, A.; Oakley, I. Wearable authentication: Trends and opportunities. Inf. Technol. 2016, 58. [Google Scholar] [CrossRef]
  23. Abuhamad, M.; Abusnaina, A.; Nyang, D.; Mohaisen, D. Sensor-Based Continuous Authentication of Smartphones’ Users Using Behavioral Biometrics: A Contemporary Survey. IEEE Internet Things J. 2021, 8, 65–84. [Google Scholar] [CrossRef]
  24. Li, H.; Yu, J.; Cao, Q. Intelligent Walk Authentication: Implicit Authentication When You Walk with Smartphone. In Proceedings of the 2018 IEEE International Conference on Bioinformatics and Biomedicine (BIBM), Madrid, Spain, 3–6 December 2018; pp. 1113–1116. [Google Scholar]
  25. Lee, W.-H.; Lee, R. Implicit Sensor-based Authentication of Smartphone Users with Smartwatch. In Proceedings of the Hardware and Architectural Support for Security and Privacy 2016, Seoul, Republic of Korea, 18 June 2016; p. 9. [Google Scholar]
  26. Zou, Q.; Wang, Y.; Wang, Q.; Zhao, Y.; Li, Q. Deep Learning-Based Gait Recognition Using Smartphones in the Wild. IEEE Trans. Inf. Forensics Secur. 2020, 15, 3197–3212. [Google Scholar] [CrossRef]
  27. Dai, D.; Chen, W.; Jiang, S.; Wang, R.; Tao, D. An Implicit Authentication Solution based on User’s Keystroke Behavior of Smartphone Usage. In Proceedings of the 2019 IEEE International Conference on Consumer Electronics—Taiwan (ICCE-TW), Yilan, Taiwan, 20–22 May 2019; pp. 1–2. [Google Scholar]
  28. Zhu, T.; Weng, Z.; Song, Q.; Chen, Y.; Liu, Q.; Chen, Y.; Lv, M.; Chen, T. EspialCog: General, Efficient and Robust Mobile User Implicit Authentication in Noisy Environment. IEEE Trans. Mob. Comput. 2022, 21, 555–572. [Google Scholar] [CrossRef]
  29. Wang, R.; Tao, D. Context-Aware Implicit Authentication of Smartphone Users Based on Multi-Sensor Behavior. IEEE Access 2019, 7, 119654–119667. [Google Scholar] [CrossRef]
  30. Anguita, D.; Ghio, A.; Oneto, L.; Parra, X.; Reyes-Ortiz, J.L. A Public Domain Dataset for Human Activity Recognition using Smartphones. In Proceedings of the The European Symposium on Artificial Neural Networks, Bruges, Belgium, 24–26 April 2013. [Google Scholar]
  31. Micucci, D.; Mobilio, M.; Napoletano, P. UniMiB SHAR: A Dataset for Human Activity Recognition Using Acceleration Data from Smartphones. Appl. Sci. 2017, 7, 1101. [Google Scholar] [CrossRef]
  32. Zhu, T.; Qu, Z.; Xu, H.; Zhang, J.; Shao, Z.; Chen, Y.; Prabhakar, S.; Yang, J. RiskCog: Unobtrusive Real-Time User Authentication on Mobile Devices in the Wild. IEEE Trans. Mob. Comput. 2020, 19, 466–483. [Google Scholar] [CrossRef]
  33. Sun, F.; Mao, C.; Fan, X.; Li, Y. Accelerometer-Based Speed-Adaptive Gait Authentication Method for Wearable IoT Devices. IEEE Internet Things J. 2019, 6, 820–830. [Google Scholar] [CrossRef]
  34. Zhu, J.; Wu, P.; Wang, X.; Zhang, J. SenSec: Mobile security through passive sensing. In Proceedings of the 2013 International Conference on Computing, Networking and Communications (ICNC), San Diego, CA, USA, 28–31 January 2013; pp. 1128–1133. [Google Scholar]
  35. Ehatisham-ul-Haq, M.; Awais Azam, M.; Naeem, U.; Amin, Y.; Loo, J. Continuous authentication of smartphone users based on activity pattern recognition using passive mobile sensing. J. Netw. Comput. Appl. 2018, 109, 24–35. [Google Scholar] [CrossRef]
  36. Amini, S.; Noroozi, V.; Pande, A.; Gupte, S.; Yu, P.S.; Kanich, C. DeepAuth: A Framework for Continuous User Re-authentication in Mobile Apps. In Proceedings of the 27th ACM International Conference on Information and Knowledge Management 2018, Torino, Italy, 22–26 October 2018. [Google Scholar]
Figure 1. Authentication framework. The top left corner shows the multi-device raw data. These data will be processed to the grayscale image on an authentication device for user authentication, or on a cloud server for user recognition model training. The right side shows the feature extraction and classification process of the user recognition model, and then the model is passed to each authentication device. The bottom left shows the process of confidence-based authentication by each device. The vertical dotted line defines the functional scope of smart devices and cloud servers.
Information 14 00274 g001
Figure 2. Sensor data. The three subplots in the first column are the signals from the accelerometer X, Y, and Z axes, and the three subplots in the second column are the signals from the gyroscope X, Y, and Z axes.
Information 14 00274 g002
Figure 3. Sensor raw data processing. During the data processing, the first part is the original sensor data of the smartphone and smart tablet, the second part is the sensor data after noise reduction, the third part is the interpolated sensor data, and the fourth part is the grayscale image obtained after transformation. The synchronization of sensor data from different devices before and after interpolation can be observed with the help of red vertical lines.
Information 14 00274 g003
Figure 4. Neural network structure. The network is composed of a concatenation of CNN and LSTM.
Information 14 00274 g004
Figure 5. Different image scales of neural network input. Subfigure (a) is a grayscale image of size 30 × 30 , and subfigure (b) is a grayscale image of size 60 × 60 .
Information 14 00274 g005
Figure 6. User data volume of different sizes on different devices.
Information 14 00274 g006
Figure 7. Confidence-based authentication process.
Information 14 00274 g007
Figure 8. User recognition assessment for each user. Subplots (a,b) show the FRR of user recognition for smartphones and tablets, respectively; Subplots (c,d) show the FAR of user recognition for smartphones and tablets, respectively; and Subplots (e,f) show the Acc of user recognition for smartphones and tablets, respectively. The green dashed line is the result of a multi-device recognition model, and the blue solid line is the result of a single-device recognition model.
Information 14 00274 g008aInformation 14 00274 g008b
Figure 9. Results of user recognition and confidence-based strategy for every user. Subplots (a,b) show the user recognition results of smartphones and tablets, respectively. Their red dots mark false identification, and points except for the red dots mean the recognition is right. Subplots (c,d) show the confidence-based user authentication results of smartphones and tablets, respectively. Their red dots mark false authentication, and the horizontal green line represents the confidence threshold T. Points above the line mean the authentication passed.
Information 14 00274 g009
Figure 10. Evaluation of user recognition and confidence-based authentication for every user. Subplots (a,b) show the FRR results on smartphones and tablets, and Subplots (c,d) show the Acc results on smartphones and smart tablets, respectively. The green dashed line is the result of the user recognition stage, and the blue solid line is the result of the confidence-based user authentication stage.
Information 14 00274 g010
Figure 11. The number of attacks accepted by devices with different attack tolerance times. It shows the distribution of the attacks that can escape authentication for different times with one authentication time of approx. 2.3 s.
Information 14 00274 g011
Figure 12. The FRR and Acc of confidence-based authentication corresponding to different u p _ r a t e . The u p _ r a t e has an incremental value of 0.01 and varies between 0.02 and 0.10. The value corresponding to the vertical line is the optimal u p _ r a t e .
Information 14 00274 g012
Figure 13. The FRR and Acc of confidence-based authentication corresponding to different d o w n _ v a l u e . The d o w n _ v a l u e has an incremental value of 0.01 and varies between 0.10 and 0.20. The value corresponding to the vertical line is the optimal d o w n _ v a l u e .
Information 14 00274 g013
Figure 14. The number of attacks accepted by tablet with different attack tolerance times before and after strategy adjustment.
Information 14 00274 g014
Table 1. The availability of accelerometers and gyroscopes in different devices.
DeviceAccelerometerGyroscopeNetwork and Transmission (Bluetooth or WIFI)
SmartphoneAvailableAvailableAvailable
TabletAvailableAvailableAvailable
SmartwatchAvailableAvailableAvailable
Smart braceletAvailableOptionalAvailable
Table 2. Overview of the data collection.
Experimental Setup ItemSettings
Number of Experimenters20
BehaviorHandheld walk
DurationApprox. 25 mins for each device
Age Group21 years to 30 years
GenderFemale: 9; Male: 11
Time SpreadApprox. 3 months
Experimental EquipmentLLD-AL00, KJR-W09
Acquisition Frequency100 Hz
Table 3. Overall accuracy of user recognition test.
Input SizeDevice for RecognitionScenariosRecognition Accuracy
30 × 30 SmartphoneSingle-device0.883
Multi-device0.871
TabletSingle-device0.865
Multi-device0.845
60 × 60 SmartphoneSingle-device0.967
Multi-device0.979
TabletSingle-device0.952
Multi-device0.963
Table 4. Overall assessment of user recognition for multiple devices and single devices.
Device for RecognitionScenariosFRRFARAccuracy
SmartphoneSingle-device0.033140.01740.967
Multi-device0.020570.001080.979
TabletSingle-device0.04850.002550.9515
Multi-device0.036950.001940.963
Table 5. Authentication performance in different methods.
WorkAccuracyAuthentication Time (s)DeviceMode of CarryingBehaviorUser Number
[24]0.9363(1, 2)SmartphoneHoldWalk30
[25]0.9216SmartphoneHoldUse20
[35]0.994≈5SmartphoneFixed at the wristWalk10
[36]0.967<20SmartphoneHoldUse47
Ours0.998,
0.992
≈2.3Smartphone, TabletHoldWalk20
Disclaimer/Publisher’s Note: The statements, opinions and data contained in all publications are solely those of the individual author(s) and contributor(s) and not of MDPI and/or the editor(s). MDPI and/or the editor(s) disclaim responsibility for any injury to people or property resulting from any ideas, methods, instructions or products referred to in the content.

