Article

Cavitation and Induced Excitation Force of Ice-Class Propeller Blocked by Ice

1
College of Shipbuilding Engineering, Harbin Engineering University, Harbin 150001, China
2
National Key Laboratory on Ship Vibration and Noise, China Ship Scientific Research Center, Wuxi 214082, China
*
Author to whom correspondence should be addressed.
J. Mar. Sci. Eng. 2021, 9(6), 674; https://doi.org/10.3390/jmse9060674
Submission received: 11 May 2021 / Revised: 9 June 2021 / Accepted: 15 June 2021 / Published: 19 June 2021

Abstract

:
The presence of broken ice in the flow field around a propeller causes severe blade erosion, shafting, and hull vibration. This study investigates the performance of the propeller of a ship sailing in the polar regions under the propeller–ice non-contact condition. To this end, we construct a test platform for the propeller-induced excitation force due to ice blockage in a large circulating water channel. The hydrodynamic load of the propeller, and the cavitation and propeller-induced fluctuating pressure, were measured and observed by varying the cavitation number and ice–propeller axial distance under atmospheric pressure and decompression conditions. The results show that the fluctuation range of the blade load increases with a decrease in cavitation number and ice–propeller axial distance. The decrease in the cavitation number leads to broadband characteristics in the frequency-domain curves of the propeller thrust coefficient and blade-bearing force. Under the combined effects of ice blockage and proximity, propeller suction, the circumfluence zone around the ice, and the Pirouette effect, propeller–hull vortex cavitation is generated between the ice and propeller. The decrease in cavitation number leads to a sharp increase in the amplitude of the high-order frequency of the propeller-induced fluctuating pressure.

1. Introduction

When polar-class ships navigate in frigid zones, broken fragments of ice frequently sink along the hull and gradually flow against its surface. The broken ice slowly approaches the propeller and interacts with it. This induces extreme loads on the latter, leading to a large cavitation area on the back of the blade and reducing its performance. Blockage of the propeller’s intake by ice aggravates the non-uniformity of the wake field. Consequently, the propeller begins to generate more severe periodic excitation forces. The blades bear the excitation force and transmit it to the hull, resulting in fatigue damage to the main components of the ship, difficulties in onboard operations, equipment failure, poor crew comfort and reduced safety, etc. [1,2]. Therefore, the study of cavitation and the induced excitation force of ice-class propellers under ice blockage is of significance to ship and marine engineering.
Research on the cavitation performance of ice-class propellers mainly involves experimentation. For example, Lindroos and Bjorkestam [3] first simulated the cavitation phenomenon of a propeller with ice–propeller interactions in a cavitation tunnel. They placed a flat plate in front of a ducted propeller to simulate the ice blockage effect. The results showed that the blocked flow increased the vibrations, cavitation, thrust, and torque of the propeller. They also demonstrated the importance of cavitation for studying the ice–propeller interactions. Walker et al. [4] discussed the influence of cavitation on the hydrodynamic load of an R-class propeller under blockage conditions and concluded that blocked flow can increase the propeller thrust and reduce the total thrust and efficiency of the system. Cavitation can reduce the average thrust and torque. With a decrease in cavitation number, the load of the propeller will became unstable. The variation law of propeller hydrodynamic load with cavitation is analyzed emphatically.
Doucet et al. [5] conducted an experimental study on cavitation erosion of open and ducted propellers under a blockage condition in a cavitation tunnel. The test results showed that given the same test conditions, the ducted propeller experienced more erosion than the open propeller. For both propellers, the amount of face erosion increased with increasing advance coefficient. The influence of cavitation on the erosion of two ice-class propellers was analyzed. Atlar et al. [6] and Sampson et al. [7,8] carried out blockage experiments on an ice-podded propulsor in a cavitation tunnel using unfrozen model ice. Thus, they demonstrated the variation curves of propeller hydrodynamics under different advance coefficients, cavitation numbers, axial distances, and depth of model ice recess. The results showed that blockage effect of ice blocks leads to the generation of sheet cavitation, tip vortex cavitation, and cloud cavitation. Cavitation changed the thrust and torque of the propeller, produced severe vibration and noise, and exposed the propeller and related equipment to potential fatigue-related hazards. They verified that the cavitation effect is an important factor in studying the mechanism of ice–propeller interaction.
Wu et al. [9] conducted an experiment on the influence of parameters related to ice blockage, i.e., the axial and vertical distances between the propeller and ice, on the hydrodynamic performance of the propeller. The propeller hydrodynamics did not change in any discernible manner with the ice–propeller distance even under heavy loads during cavitation. The cavitation effect of the blades reduced the degree of influence of the ice blockage effect. The above study focuses on the influence of cavitation on the hydrodynamic load of the whole propeller under the blockage condition; however, it does not analyze the change in the single blade load in the blocked or unblocked regions or the influence of the change in the single blade surface cavitation on the hydrodynamic load. To summarize, the mechanisms of cavitation and load change under sea-ice blockage are not clearly understood.
Moreover, there are a few significant results related to the induced excitation force of ice-class propellers. Numerical simulation methods such as CFD were the primary mode of analysis. For example, Wu et al. [10] simulated the unsteady cavitation and hydrodynamic performance of conventional propellers using the Reynolds-averaged Navier–Stokes (RANS) equations. They considered the influence of different ice axial positions and pressure environments in their simulation. The study mainly analyzed the fluctuating amplitude of the propeller thrust coefficient. The results showed that the order of the propeller cavitation excitation force significantly increased owing to ice blockage. The frequency of excitation moved to a higher order. Wang et al. [2,11] established a numerical model of the propeller-induced excitation force under ice–propeller interactions using the overlapping grid method. They analyzed the changes in the bearing force of the propeller and fluctuating pressure around the propeller with different advance coefficients. The results showed that the fluctuating amplitude of the bearing force gradually increased and that of the fluctuating pressure decreased with an increase in the advance coefficient under ice-blockage conditions. However, they did not analyze the variation in the propeller fluctuating pressure under different positions of ice at the bottom of the ship and under heavy load cavitation conditions, and the influence of ice–propeller interaction on ship vibration has not been revealed.
In view of this, we used a scaled model instead of a purely numerical model. To conduct the experiment, a test platform for induced excitation force of propeller under ice-blockage condition was built in a large circulating water tank. We study the influence of ice-blockage parameters, ice–propeller axial distance and cavitation number, on the propeller hydrodynamic performance, cavitation, and excitation force under different operating conditions. The model test provided data to predict the propeller performance in a polar environment.

2. Test Model and Test Equipment

2.1. Propeller Model
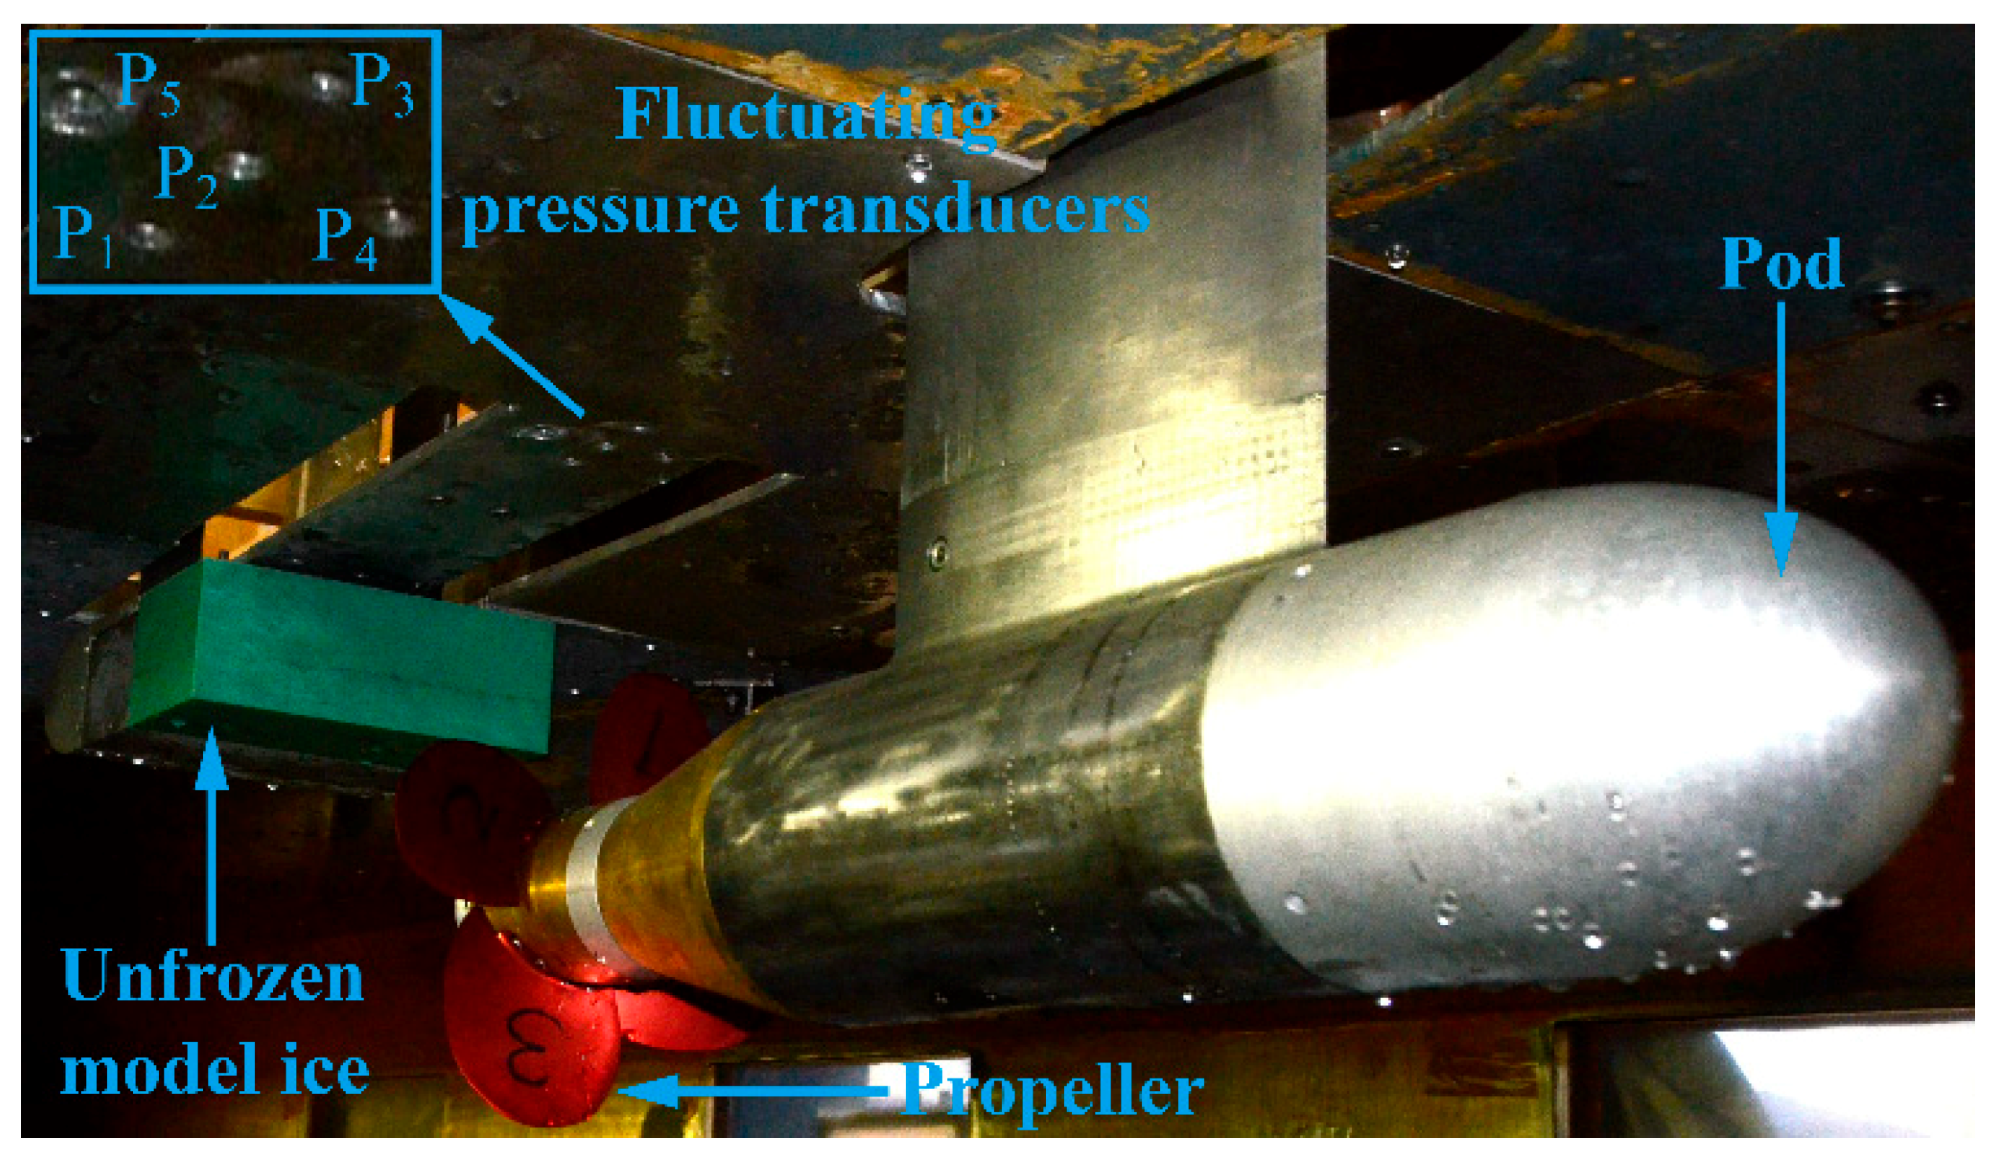
The model for this study was a 1:16.46 scaled and locally corrected version of the ice-class propeller of the Canadian Coast Guard R-class icebreaker [6,12,13]. The diameter of the full-scale propeller is 4.115 m. Therefore, the model had a diameter D of 0.25 m, four blades, a propeller area ratio of 0.699, a pitch ratio of 0.775, and a hub diameter ratio of 0.368. The model was made of an Al alloy. Because the objective of the study required testing the load on a single blade, each blade of the propeller model was designed and fabricated separately (Figure 1). Figure 2 illustrates the propeller model after blade installation.

2.2. Test Equipment

The propeller cavitation and induced excitation force under ice-blockage conditions were measured in a large circulating water channel of the China Ship Science Research Center. Figure 3 illustrates the shape of the test section of the channel. The circulating tank at the Center is the largest cavitation experimental facility in China and offers low turbulence and background noise. The facility can be used to measure hydrodynamic performance, pressure fluctuations, and noise, and make cavitation observations for all types of underwater vehicles and whole ship models with thrusters. It also has equipment to measure frequency responses in the interactions of offshore engineering structures and fluids. Moreover, it can achieve the experiments under the number of real ship cavitation, but the conventional cavitation tunnel and circulating water channel are difficult to meet. The length, width, and height of the working section of the large circulating water channel were 10.5 m × 2.2 m × 2.0 m, the pressure was 10–400 kPa, the water velocity was 1.0–15.0 m/s, the non-uniformity of velocity was less than 1.0%, and the minimum cavitation number was 0.07 (the water velocity was 15 m/s, and the top pressure 10 kPa) [14].
Figure 4 illustrates the ice-blockage device and the force-measuring device. A deflector was installed in the upstream direction. A C-frame and a fixing plate were tightly connected to clamp and fix the model ice. Before the model test, we tested the reliability of the ice clamber to ensure the model ice did not detach and fall. The height of the ice chamber’s driving mechanism was adjusted by a vertical linear module, with a range of motion of h = 0–70 mm. The axial distance was adjusted by a horizontal linear module, with a range of motion of L = 0–400 mm. The entire driving device was connected to the circulating water channel’s mounting plate through the mobile device mounting bracket.
The dynamometer was powered by a motor. It was used to rotate the propeller shaft via the bevel gear. A force-balance device was installed on the right side of the sliding bearing to measure the thrust and torque of the whole propeller. The thrust and torque were in the ranges of 0–1500 N and 0–50 N·m, respectively. The hub and blade were machined separately. The hub was hollow and equipped with a five-component force balance. The key blade was fixedly connected to the force balance. The roots of the other blades were equipped with counterweight structures, which were fixedly connected to the hub screw to realize the overall dynamic balance of the hub. The force and thrust values of the five-component force balance were in the ranges of 0–800 N, 0–800 N, and 0–30 N·m, 0–30 N·m, and 0–10 N·m, respectively.
The unfrozen model ice used in this experiment is nylon model. The length, width, and thickness of the model ice were 250 mm × 200 mm × 90 mm, respectively. In the process of ice position adjustment, the centerlines of the propeller shaft and propeller disk were used as the vertical and axial reference positions, respectively. The distances between the bottom face of the model ice and the center of the propeller shaft, and the ice surface near the side of the propeller and the propeller disk were defined as the vertical and axial relative positions of the ice–propeller, respectively. The origin of the coordinate system is at the center of the propeller disk. The positive direction of the X-axis is the direction from the pod to the propeller, the positive direction of the Z-axis is upward, and the direction of the Y-axis is determined according to the right-hand rule, as shown in Figure 4.
For the propeller fluctuating-pressure test, a fluctuating pressure transducer was attached to the flat plate directly above the propeller model. The vertical distance between the transducer and the center line of the propeller shaft was 250 mm. The point of inter-section between the center line of the propeller shaft and the propeller radiation reference line was taken as the center of the prism. The axial and transverse dimensions of the prism were 0.15D [15]. Five pressure transducers were arranged at the four corners and center of the prism (Figure 5).

3. Experimental Method

3.1. Similarity Criteria

The simulation of ice–propeller–flow interaction must meet the similarity criteria, i.e., geometric similarity, motion similarity, viscous force similarity, and cavitation similarity of the propeller.
(1) Geometric similarity
The scale of the propeller model, i.e., 1:16.46, ensured the geometric similarity between the full-scale propeller and the model.
(2) Motion similarity
The dimensionless advance coefficient J of the model is the same as that of the actual propeller, which ensures it has the same motion as the full-scale propeller. The dimensionless coefficients of the thrust and torque of the propeller and the single blade were defined as follows:
J = V n D
K T = T ρ n 2 D 4
K Q = Q ρ n 2 D 5
K T X _ B L A D E = T X ρ n 2 D 4
K T T _ B L A D E = T T ρ n 2 D 4
K Q X _ B L A D E = Q X ρ n 2 D 5
K Q Y _ B L A D E = Q Y ρ n 2 D 5
K Q Z _ B L A D E = Q Z ρ n 2 D 5
where V is the inflow velocity; n is the propeller rotational speed; D is the propeller diameter; T and Q are the propeller thrust and torque, respectively; KT and KQ are the propeller thrust and torque coefficients, respectively; ρ is the density of water; TX is the axial thrust of blade in the X direction; TT is the tangential force of blade; KTX_BLADE and KTT_BLADE are the axial thrust and tangential force coefficients of the blade, respectively; QX, QY, and QZ are the torques of blade in the X, Y, and Z directions, respectively; and KQX_BLADE, KQY_BLADE, and KQZ_BLADE are the torque coefficients of the blade in the three directions, respectively.
(3) Viscous force similarity
Because the condition of the Reynolds number cannot be satisfied in the model test, the Reynolds number Rn(0.75R) of the blade section at a chord length of 0.75R was required to exceed the critical Reynolds number, i.e.,
R n ( 0.75 R ) = L 0.75 R V 2 + ( 0.75 π n D ) 2 ν > 3.0 × 10 5
where L0.75R is the chord length of the blade section at 0.75R, and ν is the kinematic viscosity coefficient of water.
(4) Cavitation similarity
The cavitation number of the rotational speed of the flow passing through the propeller disk and at a radius of 0.8R directly above the propeller axis is equal to that of the full-scale ship [14,16], i.e.,
Full-scale : σ n s ( 0.8 R ) = p a + ρ s g ( h s 0.4 D s ) p v 0.5 ρ s ( 0.8 π n s D s ) 2
Model : σ n m ( 0.8 R ) = p 0 ( 0.8 R ) p v 0.5 ρ m ( 0.8 π n m D m ) 2
σ n s ( 0.8 R ) = σ n m ( 0.8 R )
where Pa is the atmospheric pressure, Pv is the vaporization pressure of water, hs is the center depth of the full-scale propeller shaft, and P0(0.8R) is the static pressure of the 0.8R radial blade section at the 12 o’clock position. ρs and ρm are the densities of seawater and fresh water, respectively; Ds and Dm are the diameters of the full-scale propeller and model propeller, respectively; and ns and nm are the rotational speeds of the full-scale propeller and model propeller, respectively.

3.2. Test Method and Operating Conditions

Before the test, the pod package and the guide rail of the ice blockage device were fixed to the model mounting bracket. The bracket was hoisted to the test section of the circulating water channel. The position of the connecting rod on the mounting bracket was adjusted to make the centerline of the pod parallel to the axis of this section. The guide rail and the propeller shaft center line were regarded as the same line from top to bottom in the circulating water channel. The centerline of the fixed pod-package propeller shaft was approximately 750 mm above the center of the circulating water channel. After adjusting the relative position of the ice and the propeller, two groups of full-scale ship operating conditions of the experimental ice-class propeller model were selected [17,18] (Table 1) to test the performance of the propeller under ice-blockage conditions.
The pressure of the circulating water channel was adjusted according to the specified cavitation number of the rotational speed. The fluid velocity in the test section was adjusted according to the advance coefficient and rotational speed. Changes in the axial dynamic force, cavitation, and excitation force of the propeller with varying ice–propeller axial distances under atmospheric pressure, cavitation numbers of rotational speed σ = 0.44 and 0.33 were measured respectively. Table 2 presents the operating conditions.

4. Results and Analysis

4.1. Hydrodynamic Load Analysis of Propeller

Taking cases 1 to 3 in Table 2 as examples, the influence of the ice–propeller axial distance on the hydrodynamic performance of the propeller was analyzed. Figure 6, Figure 7, Figure 8 and Figure 9 illustrate the mean value and time-domain comparison curves of the propeller and single blade hydrodynamic performance with different ice–propeller axial distances under atmospheric pressure and cavitation number of rotational speed, σ = 0.44. These values are compared with the open-water experimental values of the propeller with the same advance coefficient.
As indicated in Figure 6, at atmospheric pressure and under blockage conditions, the mean values of the thrust and torque coefficients increase with the decrease in L/D. The smaller the L/D, the more distinct the increase. There are two main reasons for the increase in propeller thrust coefficient and torque coefficient. One is the blockage effect; this is because of the blockage effect of model ice on the inflow decreases the inflow velocity in front of the propeller, increase the angle of attack of the blade section, and increases the propeller thrust. When the blade rotates, the separation of the fluid at the back of the blade will also intensify, resulting in an increase in the torque of the propeller. Nonetheless, the wall effect (or boundary effect) shows that the flow velocity between the ice and the propeller increases, which makes the flow field between the propeller and the ice occur in a high-speed wake area, thereby increasing the thrust and torque of the propeller [4,19,20]. When σ = 0.44, the mean values of the propeller thrust and torque coefficients also increase with the decrease in L/D, which is higher than the atmospheric pressure. The main reason is that the blade back begins to cavitate at its local position as the cavitation number decreases; however, in the first stage of cavitation development, the lift coefficient continues to increase [21]. Compared with the open-water condition, the thrust and torque coefficients of the propeller increased under the two blockage conditions, but the propeller efficiency decreased (Figure 6c). In Figure 6c, at atmospheric pressure, the propeller efficiency decreases with a decrease in L/D. The main reason is that the smaller the L/D, the more obvious the ice-blockage affects, and the smaller the inflow velocity in front of the propeller, the higher the angle of attack of the blade section; this reduces the lift drag ratio is, which leads to a reduction in propeller efficiency. When σ = 0.44, the propeller efficiency remains nearly constant even as L/D changes; however, it is still less than the propeller efficiency at atmospheric pressure.
As indicated in Figure 7, in the three states, the axial thrust is approximately 1.8 times the tangential force. The torque in the Y direction is approximately 3.7 times the torque in the X direction and 6.4 times the torque in the Z direction. The force and torque changes in different directions are of the same order of magnitude. At atmospheric pressure and σ = 0.44, and under blockage conditions, the variation of the five-component force of a single blade with L/D is the same as that of the thrust and torque coefficients of the propeller. The hydrodynamic performance of the blade at σ = 0.44 is greater than that at atmospheric pressure. Compared with the open-water condition, at atmospheric pressure and σ = 0.44, and under blockage conditions, the axial thrust and tangential force coefficients and the torque coefficients in the X and Y directions of the single blade increased significantly. Under the same conditions, the torque coefficient in the Z direction of the single blade is different. At atmospheric pressure, when L/D > 5/8, the change in L/D had little impact on the torque coefficient in the Z direction of the single blade, which remained almost unchanged. When σ = 0.44, the torque in the Z direction gradually increased with a decrease in L/D.
Based on Figure 6 and Figure 7, the time-domain variation curves of the axial thrust coefficient and torque coefficient in the Y direction of the single blade during propeller stabilization for L/D = 1/8, 3/8, and 7/8 under atmospheric conditions were extracted. To analyze the load variation law in detail, the time-domain variation curve of the six periods of the blade is illustrated in Figure 8. Meanwhile, for L/D = 1/8, the time-domain curves of the single blade in the three states are compared in Figure 9.
Figure 8 illustrates the time-domain curves of the thrust coefficient and torque coefficient in the Y direction of a single blade at different distances between the ice and the propeller under atmospheric pressure. As shown in Figure 8, when L/D is fixed, the peak amplitude of the thrust coefficient and torque coefficient in the Y direction of the single blade in each cycle is almost equal, and the variation range is small, whereas the fluctuation range of the wave trough is notably different. The main reason for this difference is that the ice–propeller interaction process is complex, and the hydrodynamic load of the blade in the unblocked region is sensitive to this interaction. The reason is also closely related to the periodic vortex shedding of ice [19,22]. As L/D decreased, the peak amplitude of the thrust coefficient and torque coefficient in the Y direction of the single blade increased, the fluctuation range near the peak increased, and the amplitude phase changed to a certain extent. The primary cause of the amplitude phase change is the increasing blockage range of the ice as L/D decreases as well as the change in the flow field structure around the propeller. The latter results in a change in the position of the maximum pressure difference between the blade back and the blade surface [10,13]. The amplitude of the wave trough of the thrust coefficient and torque coefficient in the Y direction of the blade also exhibited a larger fluctuation range as L/D decreased. It can be concluded that the stronger the blockage effect of ice, the wider the fluctuation range of the blade load, and the more unstable the load is.
The trend in Figure 9 led us to conclude that the peak shape of the thrust coefficient and torque coefficient in the Y direction of the single blade in the open-water working condition was regular and the time-domain curve was smoother. The curve gradually becomes unsmooth in the trough. When the ice and propeller interacted, whether its atmospheric pressure or decompression, the absolute values and amplitudes of the axial thrust coefficient and torque coefficient in the Y direction of the single blade changed significantly. In the same vein, the amplitude phase also changed to a certain extent. At atmospheric pressure, two peaks and one trough appeared in the main peaks of the thrust coefficient and torque coefficient in the Y direction, and there are many peaks and troughs in the main trough, and the main troughs of each period of the blade are different. When σ = 0.44, the periodic variation regularity of the thrust coefficient and torque coefficient in the Y direction with time is similar to that of atmospheric pressure, but the curve becomes more unsmooth. The variation range of the peak and trough on the main peak of the thrust coefficient and torque coefficient in the Y direction is larger, and the amplitude is greater than that of the atmospheric pressure. However, the change rule of the main wave troughs of the thrust and torque coefficient in the Y direction are different in each rotation cycle of a single blade, and the absolute value and amplitude in the wave troughs are not substantially greater than those in the atmospheric pressure.

4.2. Cavitation Analysis of Propeller

By taking case 4 in Table 2 as an example, i.e., the rotational speed cavitation number σ = 0.44, vertical distance h/D = 5/16, propeller rotational speed n = 19.36 r/s, and inflow velocity V = 1.36 m/s and recording the cavitation shape on the propeller through stroboscopic video, we analyzed the influence of the change in the ice–propeller axial distance on the blade surface cavitation. The axial distance was L/D = 1, 5/8, 3/8, and 1/8. Figure 10 presents images of the experiment.
When L/D = 1, as shown in Figure 10a, sheet and tip vortex cavitation occur at 0.9R of the leading edge at the back of the blade. Because of the large distance between the ice and the propeller, blockage due to ice has little influence on the wake field of the propeller disk. Therefore, when the blade is in the blocked region, the area of the blade sheet and tip vortex cavitation is small. With a decrease in L/D, when L/D = 3/8, the blade back cavitates more severely in the blocked region. The area of sheet cavitation increases, whereas the change in the tip vortex cavitation is small. Similarly, the blade back cavitates more severely when L/D = 1/8, and a large area with sheet cavitation emerges in the form of cloud cavitation at the trailing edge close to the blade tip position. In other words, the presence of ice affects the shape of cavitation in the blocked region, i.e., it results in an increase in the blade cavitation area. Meanwhile, propeller–hull vortex cavitation occurs between the ice and the propeller. This and the blade sheet cavitation together form a larger area of sheet cavitation, and the whole body emerges along the blade’s trailing edge as an agglomerate shape. To further analyze the generation, movement, and collapse of the propeller–hull vortex cavitation between the ice and the propeller, we take L/D = 1/8. In this case, the four processes of blade in the unblocked region, rotation into the blocked region, the blocked region, exit from the blocked region are analyzed (Figure 11).
Figure 11 illustrates the cavitation morphology of the blade at four different positions. The blockage effect of ice was relatively small when the blade was in the unblocked region. Meanwhile, the blade mainly produced stable tip vortex cavitation but no propeller–hull vortex cavitation. When the blade rotates into the blocked region, as depicted in Figure 11b, propeller–hull vortex cavitation appears, extending from the leading edge to the front surface of the ice. As the blade rotates, the propeller–hull vortex cavitation gradually migrates from the leading edge of the blade to the trailing edge (Figure 11c). When the end of the propeller–hull vortex cavitation reaches the blade’s trailing edge, it combines with the blade sheet cavitation and emerges along the trailing edge as an agglomerate shape (Figure 11d).
The primary cause of the propeller–hull vortex cavitation between the ice and the propeller is the decrease in L/D, which led to the stronger the blockage effect on the propeller, a smaller axial inflow velocity, a smaller actual advance coefficient, and a larger hydrodynamic load on the blade, and the hydrodynamic interaction between the blade and the ice is continuously increased [4,7,9,13]. Considering the effect of propeller suction, the flow of water into the propeller disk from both sides of the ice was bound to increase under the blockage condition. Simultaneously, an acceleration zone was formed on the bottom surface of the ice, and an upward roll was formed at the end [10]. Because ice is a bluff body, the recirculation zone on its upper surface is related to its length and velocity. Meanwhile, a recirculation zone may also appear [19,22]. The fluid with these types of motion is strongly coupled between the ice and the propeller, which may form a flow hysteresis point, i.e., a fluid layer with a flow velocity of zero [23,24]. This layer was induced at the flow stagnation point by the rotation of the propeller itself, forming a vortex. Then, under the continuous action of the Pirouette effect [25], the pressure of the flow field near the tip of the blade decreases, and this vortex extends to the propeller and finally reaches the blade. When the pressure drops below the saturated vapor pressure, propeller–hull vortex cavitation is formed. In the Pirouette effect, the rotation of the vortex core is constantly accelerated, which leads to an increased vortex strength, in the process of stretching and thinning of a large vortex, similar to the tornado phenomenon. The existence of the propeller-hull vortex cavitation makes blade hydrodynamic load unstable, as shown in Figure 9.

4.3. Analysis of Propeller-Induced Excitation Force

Taking cases 2, 3, and 5 in Table 2 as the research object, the excitation force induced by the propeller with different axial gaps between the ice and the propeller at atmospheric pressure and σ = 0.44 and σ = 0.33 was tested.

4.3.1. Atmospheric Condition

At atmospheric pressure, the time-domain curves of the propeller- and single blade-bearing forces under different blockage conditions were transformed into the frequency-domain curves by the fast Fourier transform (FFT) (Figure 12). According to the main fluctuating frequency in Figure 12, the fluctuating amplitude of each order of the propeller bearing force with varying distance between the ice and the propeller was extracted and plotted as a column figure (Figure 13). Table 3 lists the fluctuating amplitudes of each order of the single-blade bearing force.
Figure 12 illustrate the frequency-domain curves of the bearing forces of the propeller and single blade under the blockage condition (L/D = 1/8). Figure 12a,b led us to conclude that, at atmospheric pressure, the main fluctuating frequencies of the propeller thrust coefficient are the first-order shaft frequency (rotational speed n = 19.36 r/s, 19.36 Hz) and the first- (four-blade propeller, 76.98 Hz), second-, and third-order blade frequencies. The blade passage frequency (BPF) had the largest fluctuating amplitude, followed by the second-order blade frequency (2BPF). This amplitude was gradually attenuated. The variation trend of each order of the frequency-domain curve of the propeller torque coefficient was different from that of the thrust coefficient. The fluctuating amplitudes of the first-order shaft frequency (APF), second-order shaft frequency (2APF), BPF, and fifth-order shaft frequency (5APF) were the most distinguishable. The fluctuating amplitude of higher-order quantities after 5APF can be ignored. The main reason for the apparent fluctuating amplitude of 5APF is that the propeller torque is mainly due to the resistance of the propeller airfoil during its rotation. In the process of ice-blocking the propeller, the wake behind the ice may form a flow related to the resistance direction of the airfoil, thereby increasing the lateral force and bending moment of the propeller. At the same time, the instability of the propeller’s forward inflow velocity results in very severe vibrations at higher frequencies; that is, the fluctuating amplitude of 5APF increases. The increase in fluctuating amplitude at 5APF is closely related to the relative position of the ice–propeller, inflow velocity, rotational speed of the propeller, and shape of the ice. Figure 12c,d illustrate the frequency-domain curves of the single-blade-bearing force. As observed in the figures, the five-component force coefficients of the single blade have different amplitudes at the integral multiples of the APF. The amplitudes at APF, 2APF, and 3APF are the most distinct, and they gradually attenuate subsequently; however, the fluctuating amplitude increases again near the third-order blade frequency (3BPF). By comparing the fluctuating amplitude of the single blade five-component force bearing forces, we observed that the pulsation amplitudes of the axial thrust coefficient and torque coefficient in the Y direction of the single blade are larger than those of other directional forces and torques.
Figure 13 highlights the variation of the main-order fluctuating amplitude of the propeller bearing force with different L/D (1/8, 3/8, 5/8, and 7/8). An investigation of Figure 14 revealed that the BPF amplitude of the propeller thrust coefficient was significantly larger than that of the other orders. The closer the ice was to the propeller disk, the greater the difference in amplitude between each order. However, the 5APF amplitude of propeller torque coefficient is the largest. With the decrease in the L/D, the APF, BPF, and 2BPF of the propeller thrust coefficient showed a gradually increasing trend, and the variation trend of the BPF was the most significant. When the L/D was small (e.g., L/D =1/8), the amplitude of the 3BPF increased sharply. As the L/D decreased, the BPF amplitude of the propeller torque coefficient slowly increased, whereas the APF and 5APF amplitudes did not show any distinguished changes. The 2APF amplitude first decreased and then increased. Therefore, the smaller the L/D, the stronger the blockage by ice, and the more distinct the increase in the BPF amplitude of the propeller bearing force.
As in Table 3, when L/D is fixed, the APF, 2APF, and 3APF amplitudes of the single blade-bearing force do not change significantly, but the 3BPF amplitude decreases signifi-cantly. In addition to the torque coefficient in the Z direction, as L/D decreased, the APF, 2APF, and 3APF amplitudes of the other force and torque coefficients of the single blade showed a gradually increasing trend, whereas the 3BPF amplitude showed a variable trend. However, the 3BPF fluctuating amplitude was the largest when L/D was small (e.g., L/D = 1/8). With the increase in L/D, the 3BPF amplitude rapidly decreased and gradually tended to zero. Therefore, we concluded that the main fluctuating frequencies of the blade-bearing force were APF, 2APF, and 3APF.
As P1 is located above the ice when L/D = 1/8, the BPF, 2BPF, 3BPF, and 4BPF ampli-tudes of the five measurement points induced by the propeller for L/D = 3/8, 5/8, and 7/8 were analyzed to study the influence of different L/D values on the fluctuating pressure at different measurement points. Figure 14 presents the test results.
As indicated in Figure 14, the amplitudes of the fluctuating pressures at the BPF of the five measurement points were much larger than those at the other frequencies; as the frequency increased, the amplitude of the fluctuating pressure presented a gradually de-creasing trend. At 4BPF, the amplitude rapidly decreased and tended to zero. In Figure 14a, the amplitude of the fluctuating pressure undergoes subtle changes at the five measurement points. However, the P3 fluctuating pressure is the extreme value, and the existence of the maximum and minimum values is closely related to L/D. The P3 fluctuating pressure was at its maximum when L/D was large (e.g., L/D = 5/8 and 7/8) and minimum when L/D was small (e.g., L/D = 3/8). By comparing the pressure of each measurement point, we obtained the law of variation of pressure near the hull surface. When L/D = 5/8 and 7/8, the pressure at P3 in the axial direction was the largest, followed by P2, whereas that at P1 was the smallest. The main reason for this trend is that ice could not effectively blocked the flow field around the propeller at large L/D values [4,9,21]. Owing to the influence of the propeller wake, pressure at P3 at the propeller exhaust was higher than that at P1 at the intake.
The pressure at P3 in the radial direction was the largest, followed by P4, whereas that at P5 was the smallest, which was due to the impact of water flow driven by the clockwise of the propeller. The fluctuating pressure at different measurement points varied in a similar manner as that in the full scale hull-propeller–rudder system [26], which indirectly validates the test results. When L/D was smaller than the maximum (e.g., L/D = 3/8), the blockage effect of ice had a significant influence on the flow field structure at both the intake and the exhaust of the propeller, which changes the pressure at each measurement point. In addition, by comparing the influence of the L/D ratio on the fluctuating pressure at each measurement point, the amplitude of the fluctuating pressure at each measurement point presents a gradually increasing trend with a decrease in L/D. The smaller the L/D, the greater the amplitude of the increase. In Figure 14b, the law of variation of the 2BPF amplitude at each measurement point is as follows: the pressure at P3 is the largest at different L/D values. At no measurement point did the amplitude of the fluctuating pressure demonstrate a gradual increasing trend with a decrease in L/D. However, the amplitude at the measurement points was the largest when L/D was the smallest. In Figure 14c,d, because the amplitudes of the fluctuating pressure at 3BPF and 4BPF are much less than the 2BPF, the influence on the pressure near the hull surface is relatively small. Therefore, we did not analyze the amplitudes at those frequencies.

4.3.2. Rotational Speed Cavitation Number σ = 0.44

At the rotational speed cavitation number of σ = 0.44, the frequency-domain curves and the fluctuating amplitude of each order of the propeller- and single blade-bearing force under different ice blockage conditions were analyzed. Figure 15 and Figure 16 present the results.
In Figure 15, compared with the trend under atmospheric pressure, at σ = 0.44, the main fluctuating frequency in the frequency-domain curve of the propeller- and blade-bearing forces does not change. However, broadband characteristics appear near the 3BPF of the propeller thrust coefficient and blade-bearing force. The fluctuating amplitude of the frequency in this broadband was larger. Particularly, the amplitude near the 3BPF in the frequency-domain curve of the propeller thrust coefficient was larger than that of the BPF. The main reason for this trend is that the blockage and proximity effects of ice on the propeller are clear when L/D is small. The propeller–hull vortex cavitation may appear between the ice and the propeller. This and the blade sheet cavitation combine to form a larger area of sheet cavitation (Figure 11). The broadband characteristics of the frequency-domain curve induced by sheet cavitation bursting are distinct. However, the broadband characteristics of the propeller torque in the frequency-domain curve are not obvious. The main reasons for this are that the pitch of propeller blade is relatively small, the thrust pressure is relatively large, the rotational speed is relatively fast, the shear force is relatively small, and the shear force induced by cavitation bursting is not very strong. In addition, compared with the atmospheric pressure (Figure 12), the decrease in the cavitation number also leads to a clear decrease in the fluctuating amplitude of the BPF of the propeller thrust coefficient. The decrease in the amplitude of the main fluctuating frequency of the propeller torque coefficient and the single blade-bearing force is not clear. Therefore, we do not perform a separate analysis of the amplitude of the main fluctuating frequency of the single blade-bearing force below.
As shown in Figure 16, when σ = 0.44, the APF, BPF, 2BPF, and 3BPF amplitudes of the propeller thrust coefficient show a gradually increasing trend with a decrease in L/D, which is different from that under atmospheric pressure. The BPF amplitude of the thrust coefficient is not at its maximum at different L/D values. The maximum fluctuating amplitude of each order is closely related to L/D. Compared with the trend under the atmospheric pressure condition (Figure 13), the decrease in the cavitation number under this condition leads to a decrease in the BPF and 2BPF amplitudes of the thrust coefficient and an increase in the APF amplitude, whereas the 3BPF amplitude in the broadband increases significantly when L/D is large. As L/D decreased, the BPF amplitude of the propeller torque coefficient increased gradually, which was consistent with the trend under atmospheric pressure. However, compared with the trend under the atmospheric pressure, the BPF amplitude of the torque coefficient under this condition decreased significantly.
To analyze the variation of each order amplitude of the propeller-induced fluctuating pressure at σ = 0.44 and the influence of decompression on the fluctuating pressure at any given measurement point, the fluctuating pressures at that measurement point under atmospheric pressure and decompression are compared in Figure 17. The atmospheric pressure data are provided in Figure 14.
In Figure 17, the amplitudes of BPF of the fluctuating pressure at the five measurement points are larger than those at the other frequencies. The difference between the amplitude of the 2BPF and 3BPF is related to L/D. Meanwhile, the fluctuating amplitude of the 4BPF no longer tends to zero and is of the same order of magnitude as the BPF. When σ = 0.44, the amplitude of each order of the fluctuating pressure at P3 reached its maximum as L/D was varied. In the axial direction, P2 takes the second place and P1 is the smallest. In the radial direction, P5 takes the second place, and P4 is the smallest, which is different from the trend under atmospheric pressure. As L/D decreased, the amplitude of the fluctuating pressure at other frequencies gradually increased, except for the 2BPF. Compared with the trend under atmospheric pressure, when L/D is small (e.g., L/D = 3/8 and 5/8), the cavitation number decreases. Thus, the amplitude of each order of the fluctuating pressure at the given measurement point is higher than that at atmospheric pressure. When L/D is large (e.g., L/D = 7/8), the amplitude of each order of the fluctuating pressure at the given measurement point is higher than that at atmospheric pressure because of the decrease in the cavitation number, except for the BPF. In addition, in Figure 17, regardless of the variation of L/D, the decrease in cavitation number leads to a sharp increase in the amplitude of the fluctuating pressure at the 2BPF, 3BPF, and 4BPF. Therefore, reducing or preventing cavitation in the ice-class propeller and improving the cavitation performance of the propeller will effectively reduce the fluctuating pressure induced by the propeller. This will in turn reduce the vibrations in the hull.

4.3.3. Rotational Speed Cavitation Number σ = 0.33

In this section, we analyze the frequency-domain curves of the bearing forces of the propeller and the single blade, the variation in the fluctuating amplitude of each order, and the amplitude of each order of the induced fluctuating pressure under different ice blockage conditions at the rotational speed cavitation number of σ = 0.33 (Figure 18, Figure 19 and Figure 20; Table 4).
As shown in Figure 18, when σ = 0.33 and L/D = 1/8, the BPF amplitude (rotational speed n = 22.15 r/s, four-blade propeller, frequency = 88.6 Hz) of the thrust coefficient and the broadband characteristics near the 3BPF (265.8 Hz) are more distinct. However, the amplitudes of the APF and 2BPF do not change significantly. The variation trend of the main fluctuating frequency in the frequency-domain curve of the propeller thrust coefficient at σ = 0.33 is different from that at σ = 0.44 (Figure 15a), and the amplitude is larger than that near the 3BPF when σ = 0.44. The main fluctuating frequency of the propeller torque coefficient and the single blade-bearing force is still distinguishable, which is similar to the characteristics when σ = 0.44. However, the 3BPF of the bearing force in the single blade has a more distinct broadband characteristic.
In Figure 19, the BPF fluctuating amplitude of the propeller thrust coefficient is the largest when σ = 0.33. With a decrease in L/D, the BPF fluctuating amplitude presented a gradually increasing trend, whereas the variation trends of APF, 2BPF, and 3BPF were closely related to L/D. However, the 3BPF amplitudes of smaller axial distances (e.g., L/D = 1/8) were significantly larger than those of the larger ones. With a decrease in L/D, the BPF amplitude of the propeller torque coefficient demonstrated a gradually increasing trend, and the 5APF amplitude was mostly unchanged, but it is still the maximum. The variation of the APF and 2APF amplitude was closely related to L/D, and its trend was similar to that of σ = 0.44 (Figure 16). However, compared with σ = 0.44, the decrease in cavitation number led to an increase in the BPF fluctuating amplitude of the thrust coefficient. This in turn led to an increase in the amplitude of the other frequencies, except the BPF in the torque coefficient.
Table 4 lists the main fluctuating frequency amplitudes of the single-blade bearing force with different L/D values when σ = 0.33. When L/D was fixed, the APF fluctuating amplitude of the single blade-bearing force was the largest, the amplitudes of the 2APF, 3APF, and 3BPF decreased, and the decrease in cavitation number led to a more significant difference between the fluctuating amplitudes of each order, which is different from the trend under atmospheric pressure (the difference between σ = 0.44 and atmospheric pressure is not obvious, so take atmospheric pressure as an example). Meanwhile, compared with the atmospheric pressure, the decrease in cavitation number led to an increase in the APF and 3BPF fluctuating amplitudes of the single blade-bearing force. The main fluctuating frequency amplitude of the single blade-bearing force gradually increased with the decrease in L/D, and the law of variation became obvious.
As shown in Figure 20, the amplitude of the fluctuating pressure at each measurement point shows a decreasing trend with an increase in frequency when σ = 0.33. Moreover, the amplitude of the fluctuating pressure no longer tends to zero at 4BPF. As L/D was varied, the amplitude of each order of the fluctuating pressure at P3 reached its maximum. The difference of amplitudes between P2 and P1 and between P4 and P5 were related to the order of the fluctuating pressure. As L/D was decreased, the fluctuating pressure amplitude of each frequency at each measurement point presented a gradually increasing trend. The variation in L/D from 3/8 to 7/8 increased the amplitude of the fluctuating pressure at each frequency of the measurement point by 2–3 times. Therefore, the stronger the ice blockage effect, the greater the fluctuating pressure at the measurement point, and the greater the hull vibration. In addition, comparing the amplitude of the fluctuating pressure at the measurement point at σ = 0.44 and 0.33 revealed that a decrease in the cavitation number led to a significant increase in the amplitudes of the APF, 2BPF, and 3BPF of the fluctuating pressure at the given measurement point. The main reason for this increase is closely related to the inflow velocity, rotational speed, and cavitation number at σ = 0.33.

5. Discussion

During the ice breaking voyage of polar ships, especially under tail icebreaking conditions, large pieces of sea ice will be close to the propeller and result in a blockage effect on the propeller. Owing to the complexity of the ice–propeller blockage condition, the related research is not satisfactory; furthermore, the influence factors and related mechanisms of hydrodynamic performance, as well as the cavitation and excitation force due to ice–propeller blockage are not well-understood. The experimental data obtained in this study can therefore help us understand the influence of ice–propeller blockage condition on the performance of propellers. Ice blocked the inflow of the propeller, resulting in a decrease in the axial inflow of the propeller disk, an increase in the angle of attack in the local area of the blade, and an increase of the thrust of the propeller. When the blade rotates, the separation of the fluid at the back of the blade also intensifies, resulting in a small increase in the torque of the propeller; especially when the blockage effect is large, the cavitation of the propeller will occur and the bearing force will increase. According to this result, the angle of attack of the blade section—that is, pitch ratio of the propeller—must be reduced; increasing the propeller area ratio can reduce the occurrence of cavitation.
It is worth noting that the propeller excitation force will induce total and local vibrations of the hull, especially the stern vibration of the hull. Usually, this kind of vibration can cause problems such as cabin vibration in excess of the standard, failure of machinery and equipment, and fatigue of structural members. The uneven wake field and generation of variable cavitation at the stern are the catalysts for the sharp increase in excitation force. In the process of ice blocked the propeller, the occurrence of cavitation on the blade leads to a significant increase in the fluctuating pressure and a change in the phase. This is especially so for heavy load propellers operating in the wake with significant non-uniformity; that is, when the blade enters the high wake area after the ice, cavitation will inevitably appear. As the blade leaves the high wake area, the cavitation disappears again. This time-varying unsteady cavitation leads to a sharp increase in the amplitude of the high-order frequency of the propeller-induced fluctuating pressure, which is the main reason for the larger excitation force of the ice-class propeller. Therefore, according to the test results, during the process of ice-class propeller design, the rake of the blade should be properly adjusted, and the distance between the tip of the blade and the stern plate should be increased to reduce the influence of propeller-induced excitation force. At the same time, when the cavitation of the propeller is considered, the influence of propeller-induced excitation force can also be reduced by increasing the skew of the propeller.

6. Conclusions

We studied the propeller cavitation and induced excitation force under ice-blockage conditions in a large circulating water channel. The changes in the hydrodynamic load of the propeller and single blade, cavitation, and excitation force with the change in the ice–propeller axial distance and cavitation number were analyzed. The main conclusions are as follows:
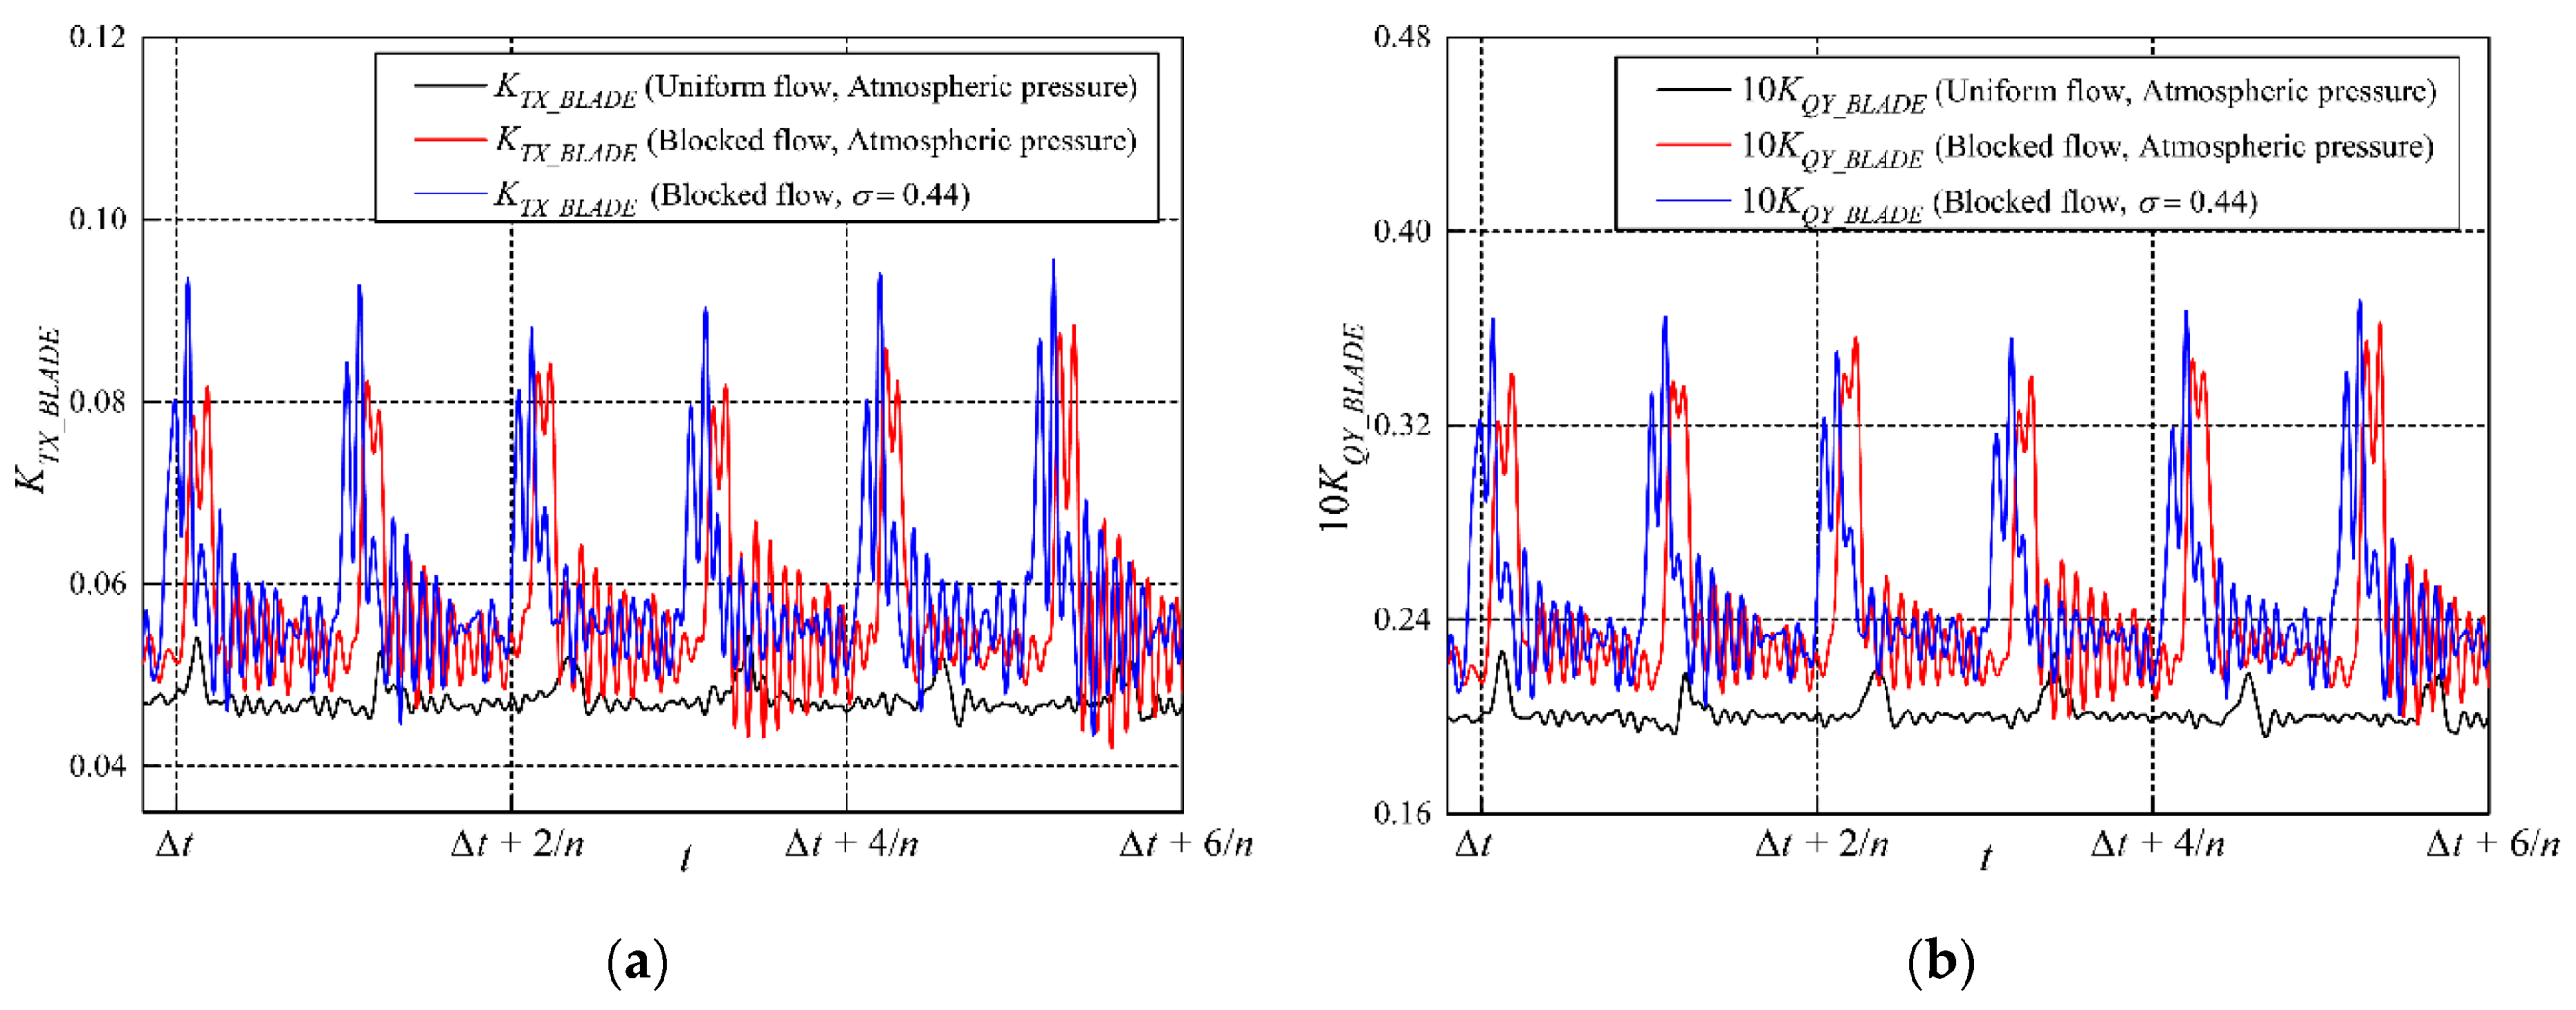
  • At atmospheric pressure and σ = 0.44, and under blockage conditions, the smaller the ice–propeller axial distance, the larger the propeller thrust coefficient, torque coefficient, and blade five-component force coefficient. However, the propeller efficiency gradually decreased at atmospheric pressure and was almost unchanged at σ = 0.44. The propeller efficiency in the two blockage conditions was less than that in the open-water condition. Compared with the trend under atmospheric pressure, the decrease in the cavitation number led to an increase in the propeller thrust coefficient, torque coefficient, and blade five-component force coefficient, but a decrease in propeller efficiency. The fluctuation range of the blade load increased with the decrease in the axial space between the ice and the propeller and the cavitation number.
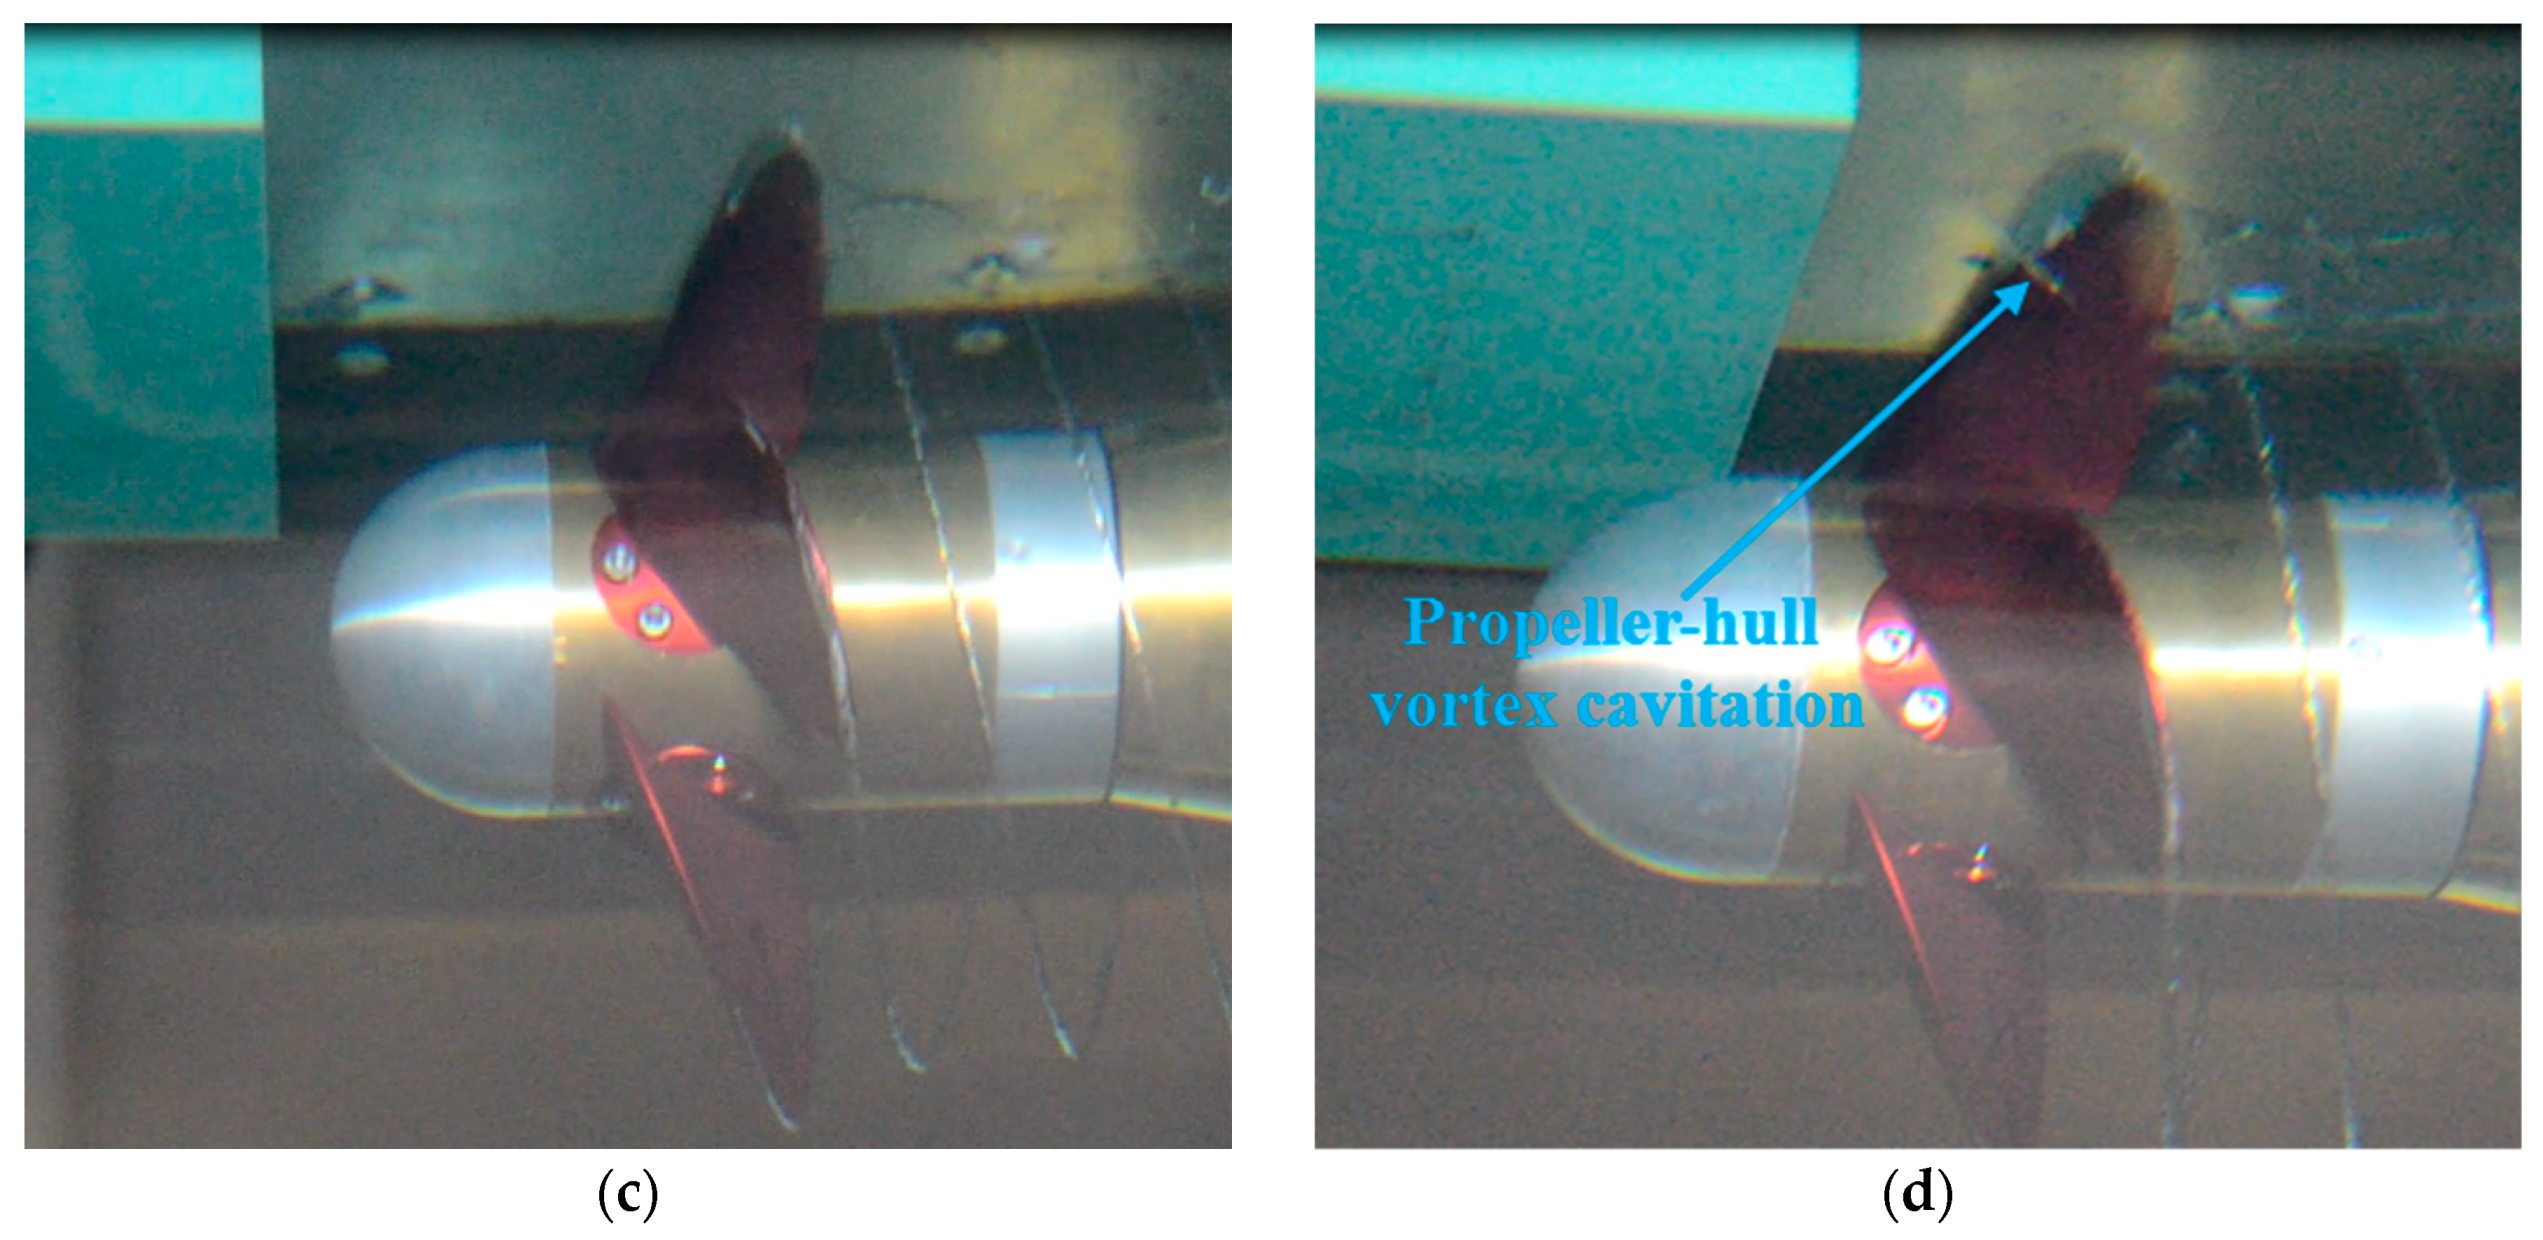
  • At the rotational speed cavitation number of σ = 0.44, and under blockage conditions, propeller–hull vortex cavitation is induced between the ice and the propeller when the axial distance and vertical distance of ice–propeller are 1/8D and 5/16 D, respectively. The propeller–hull vortex cavitation is the result of the combined effects of ice blockage, proximity, propeller suction, the circumfluence zone around ice, and the Pirouette effect.
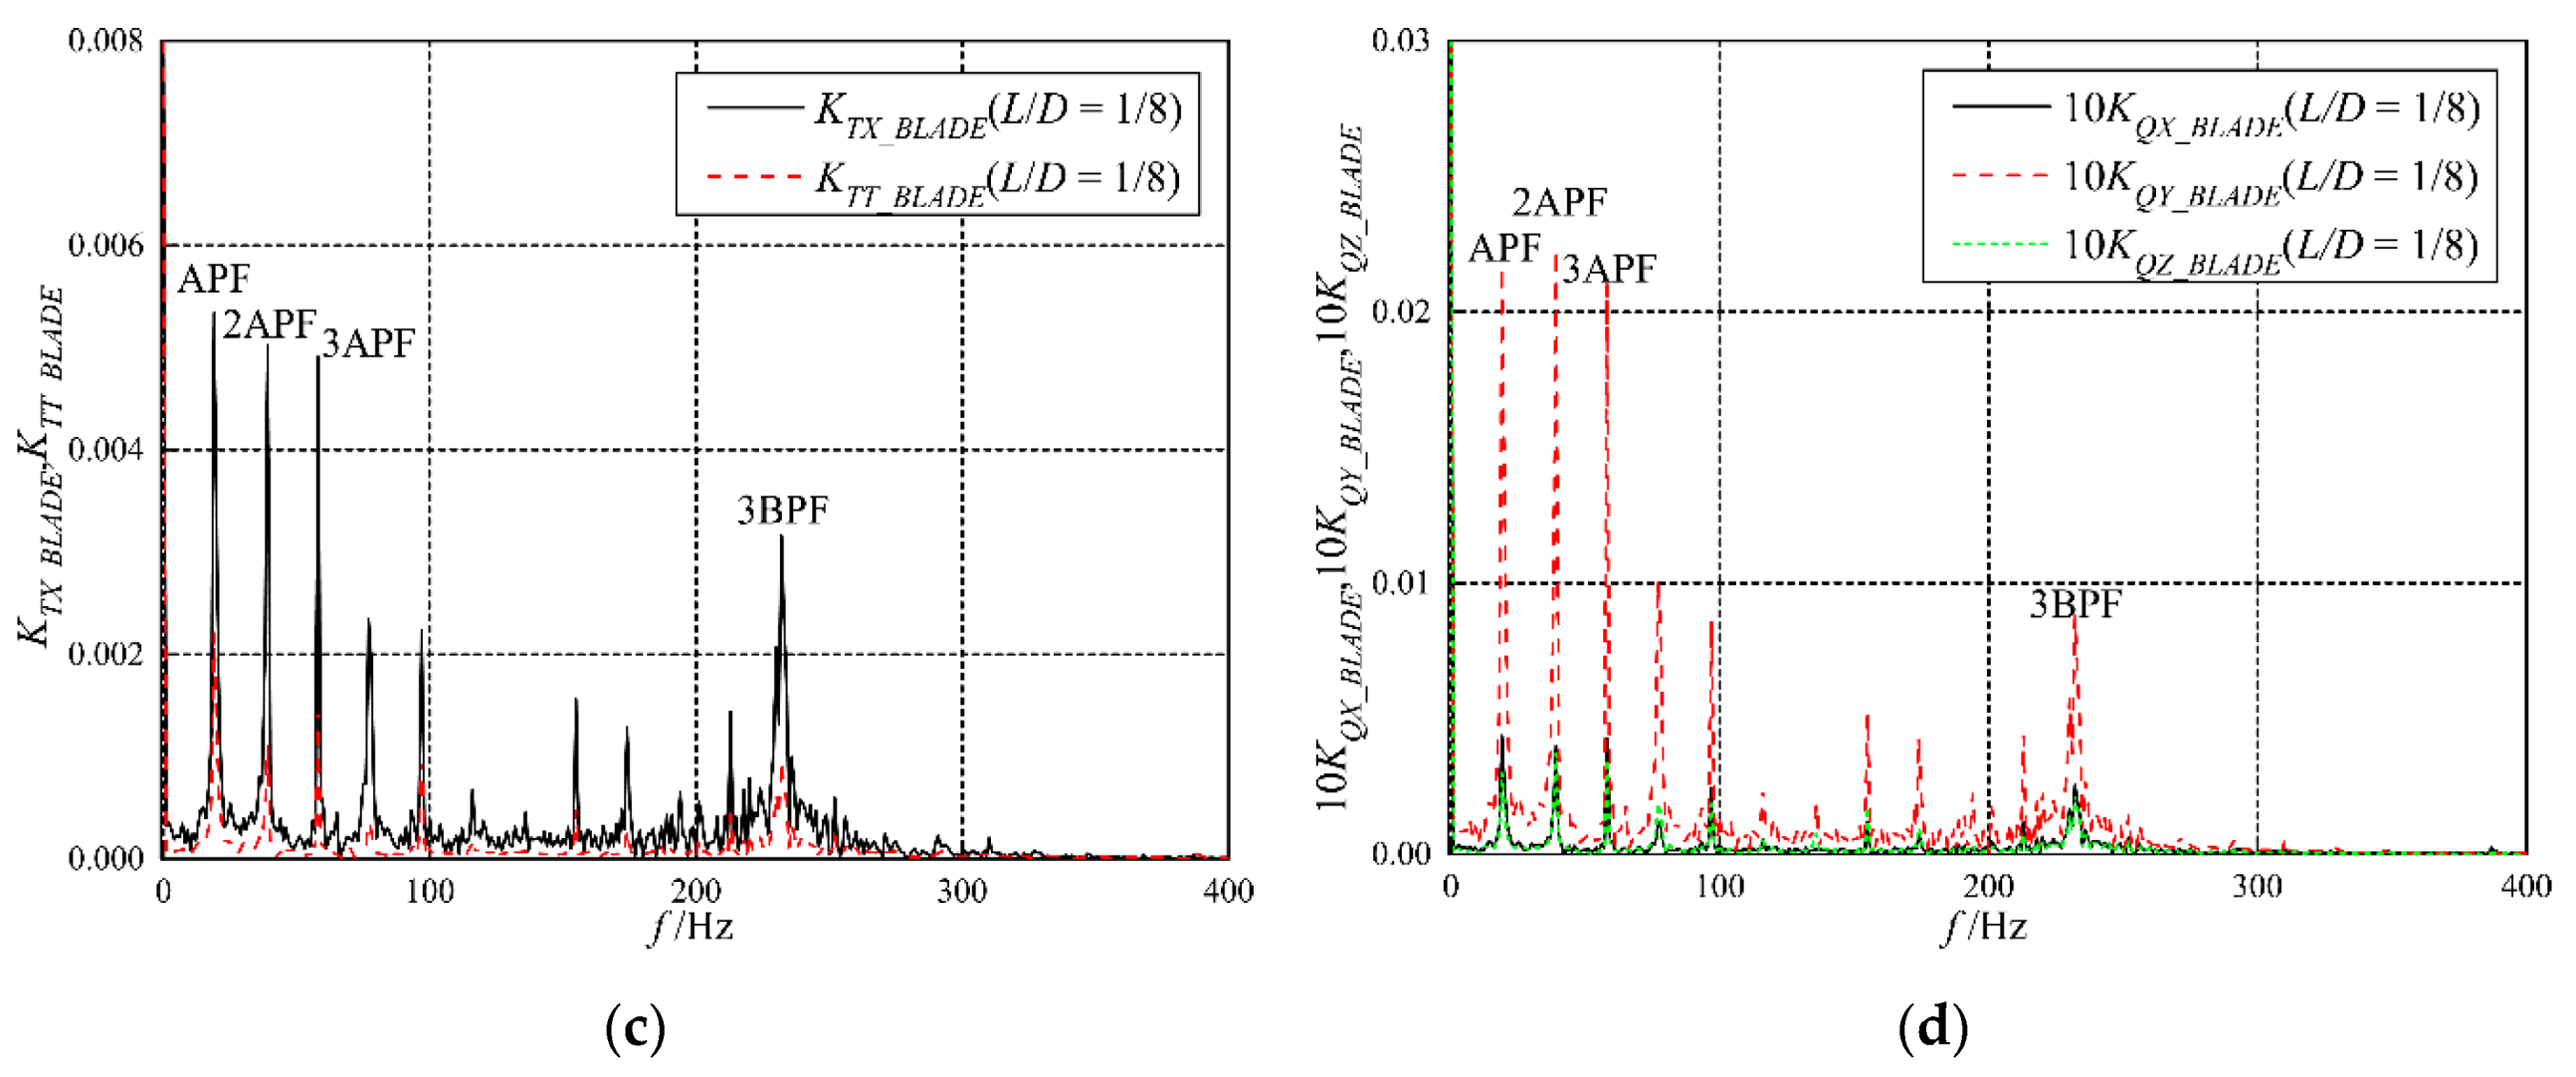
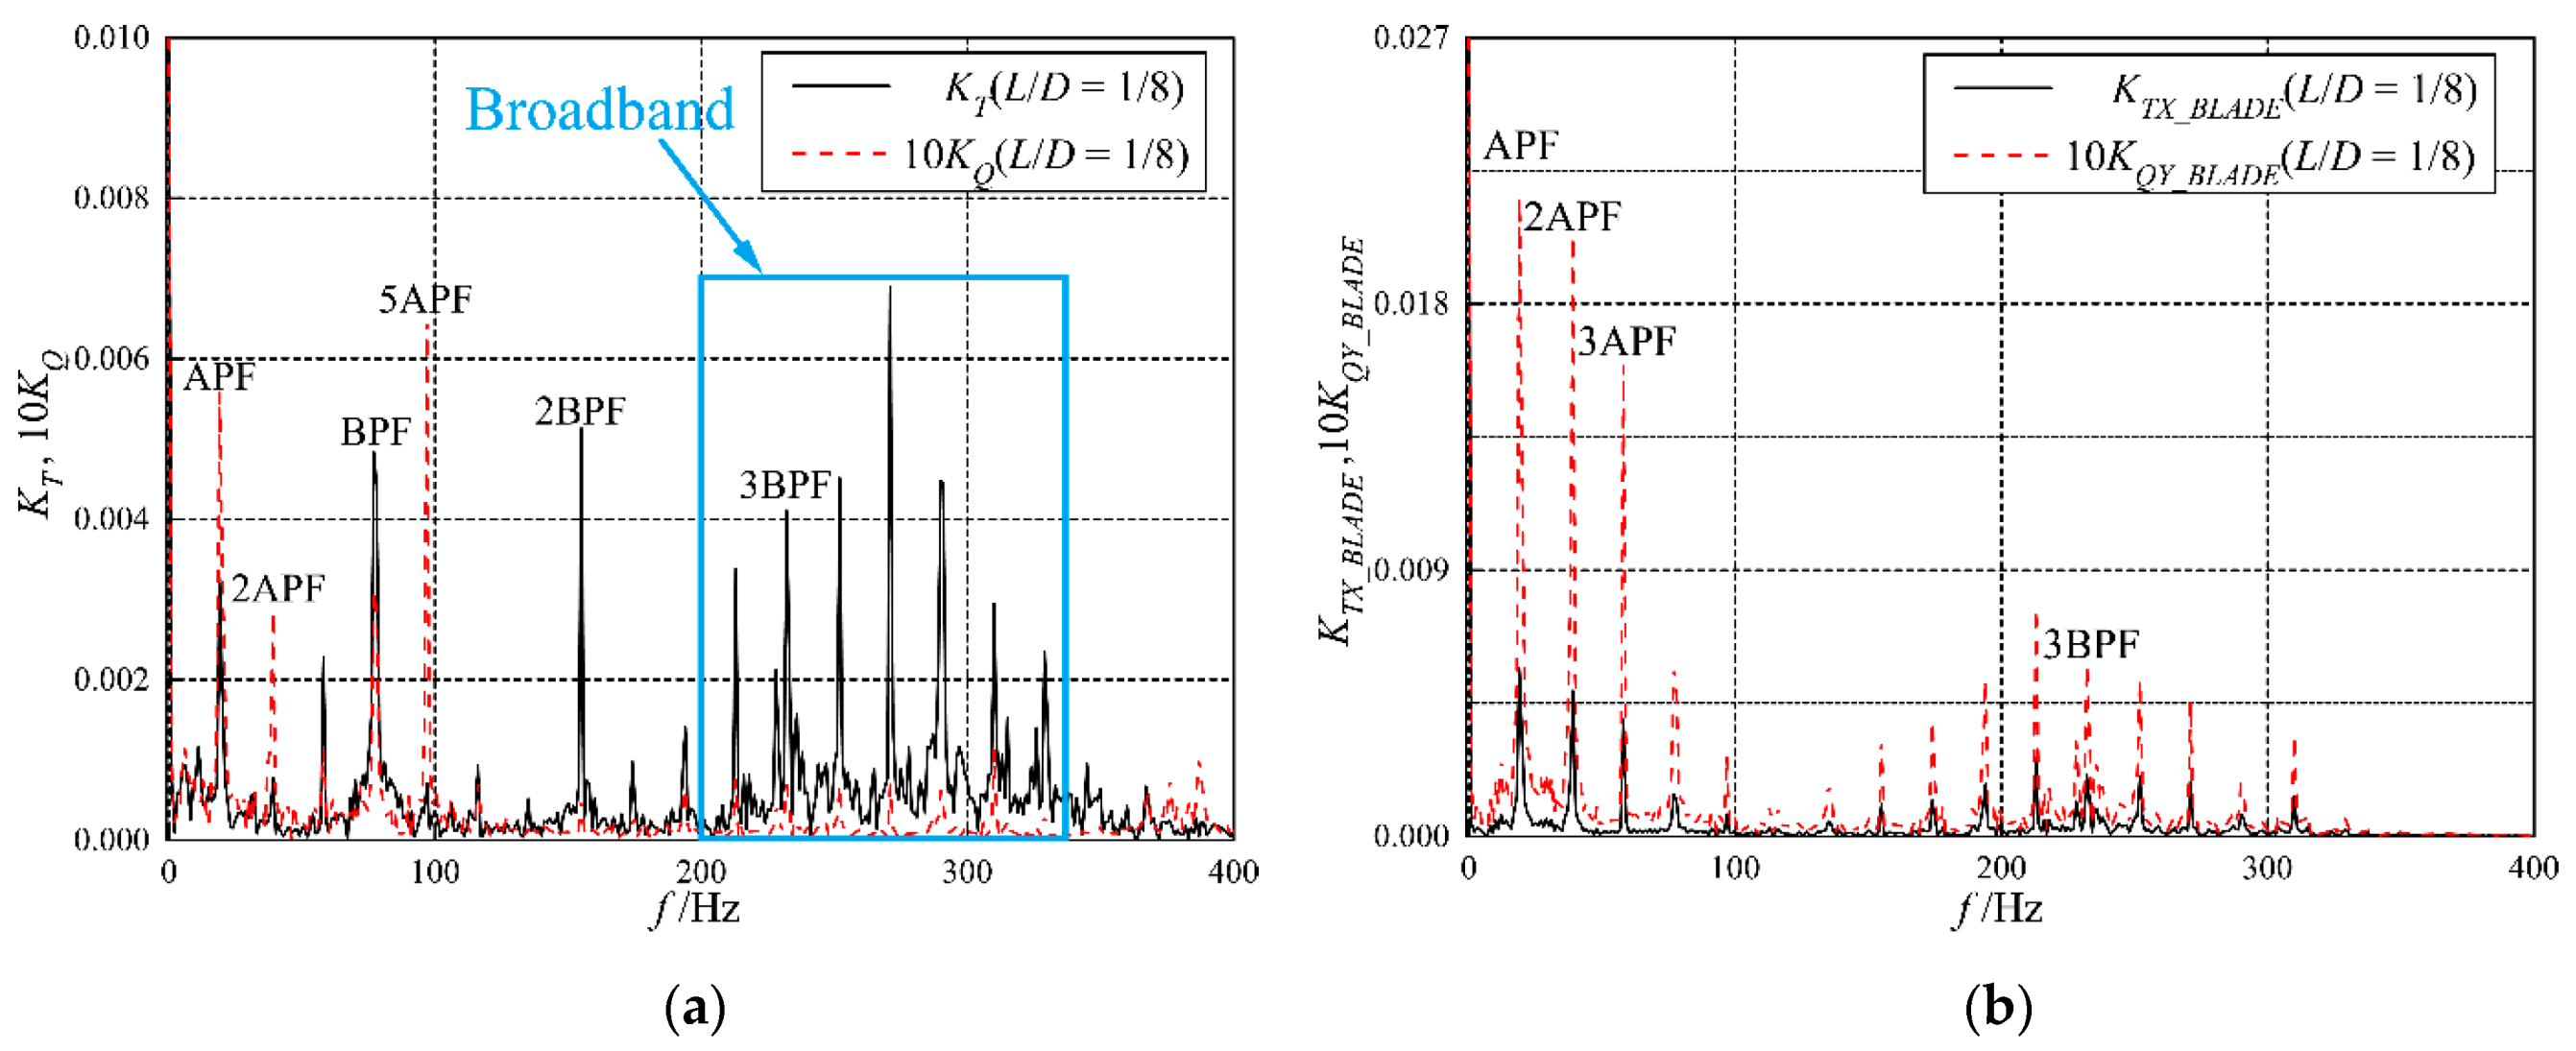
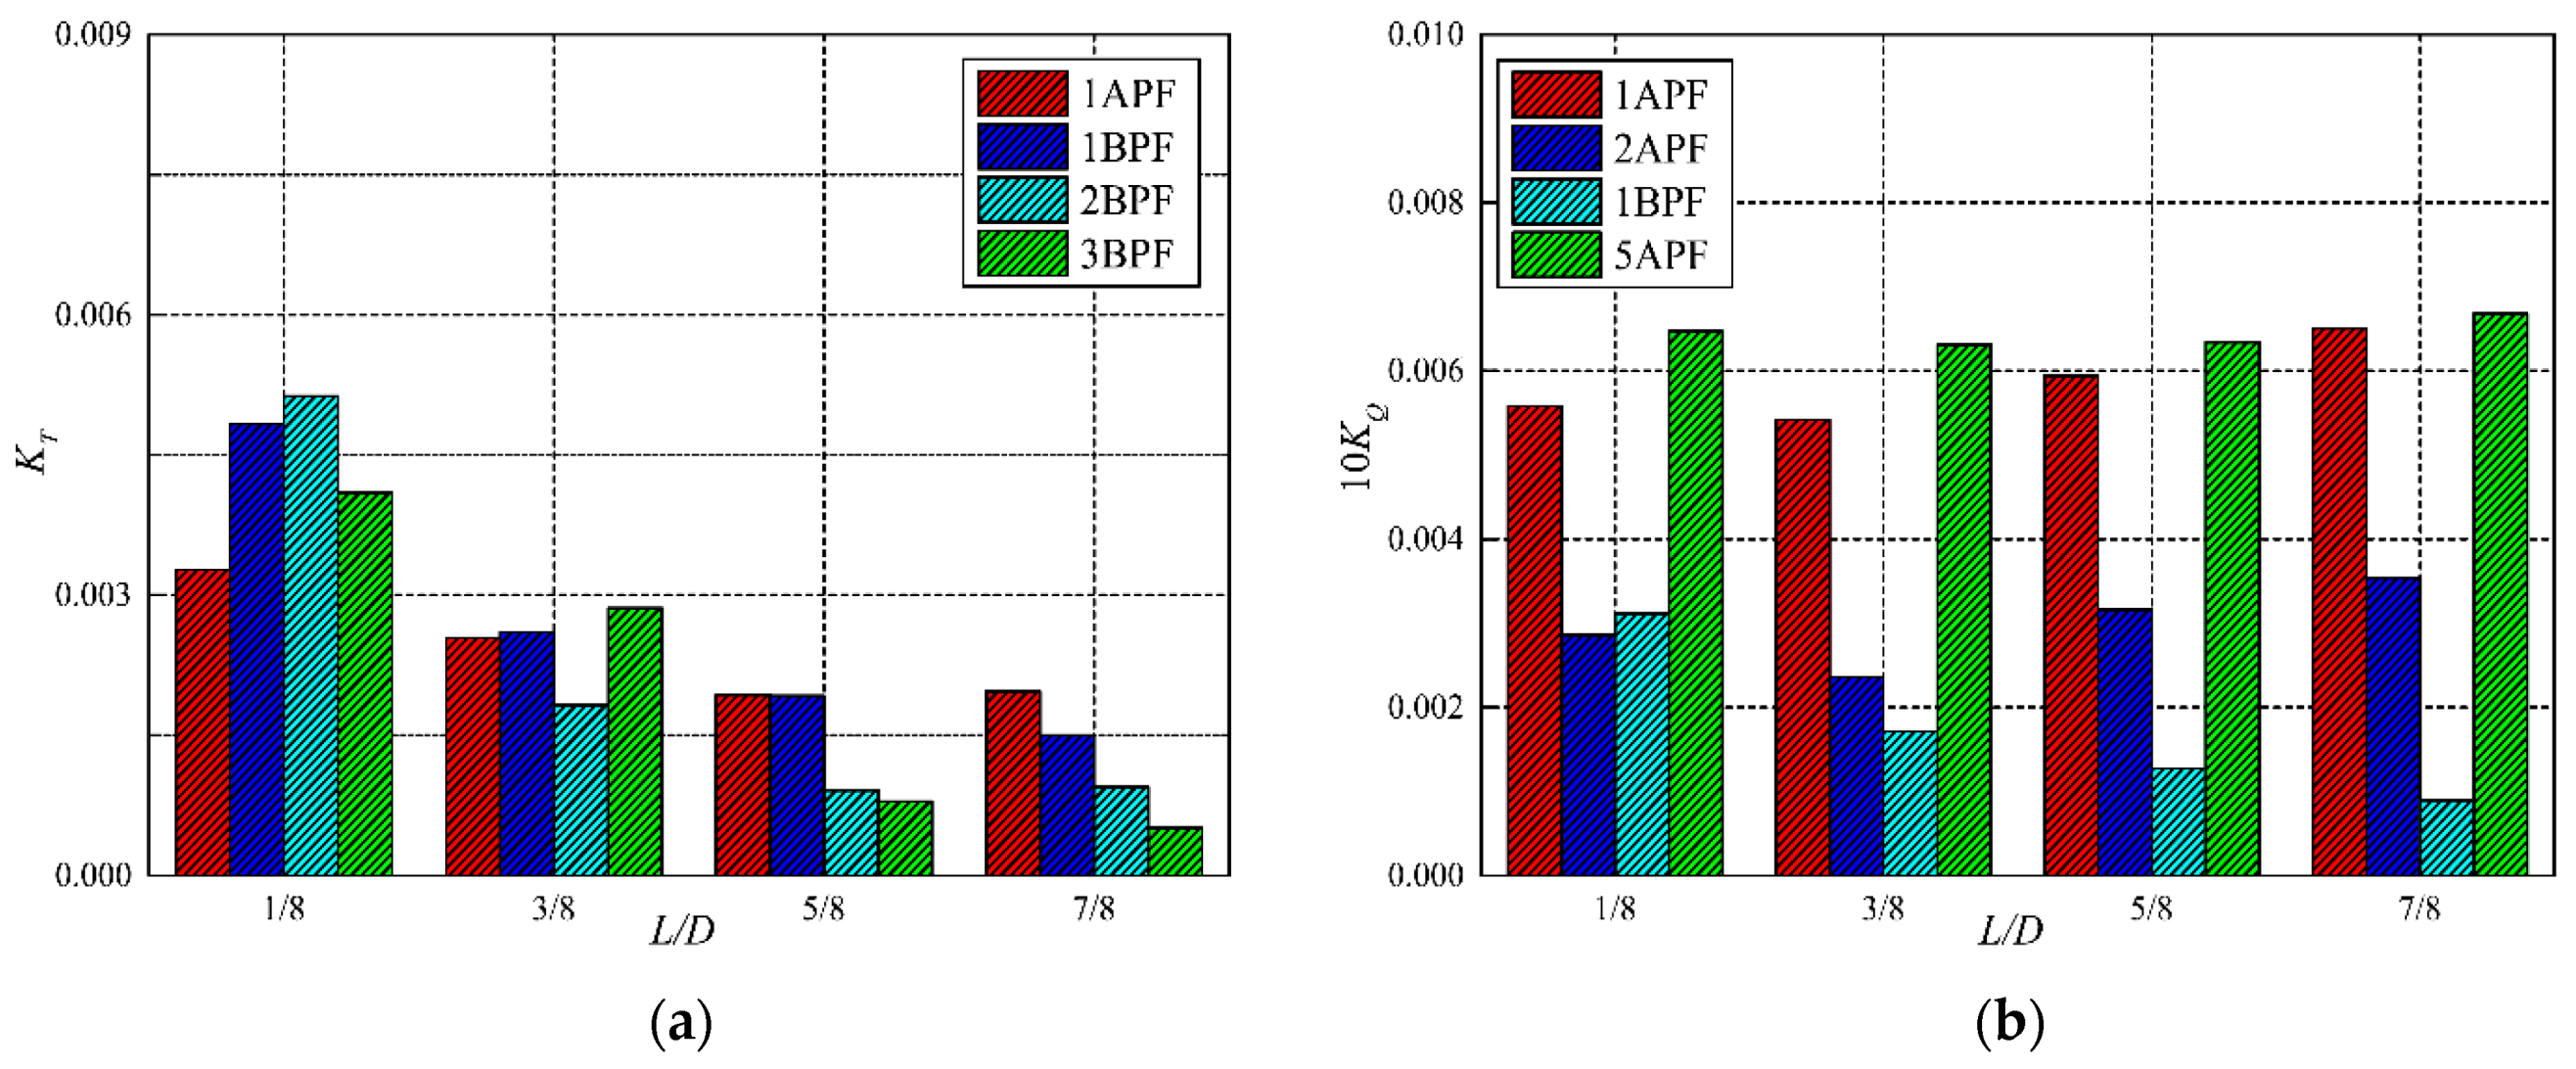
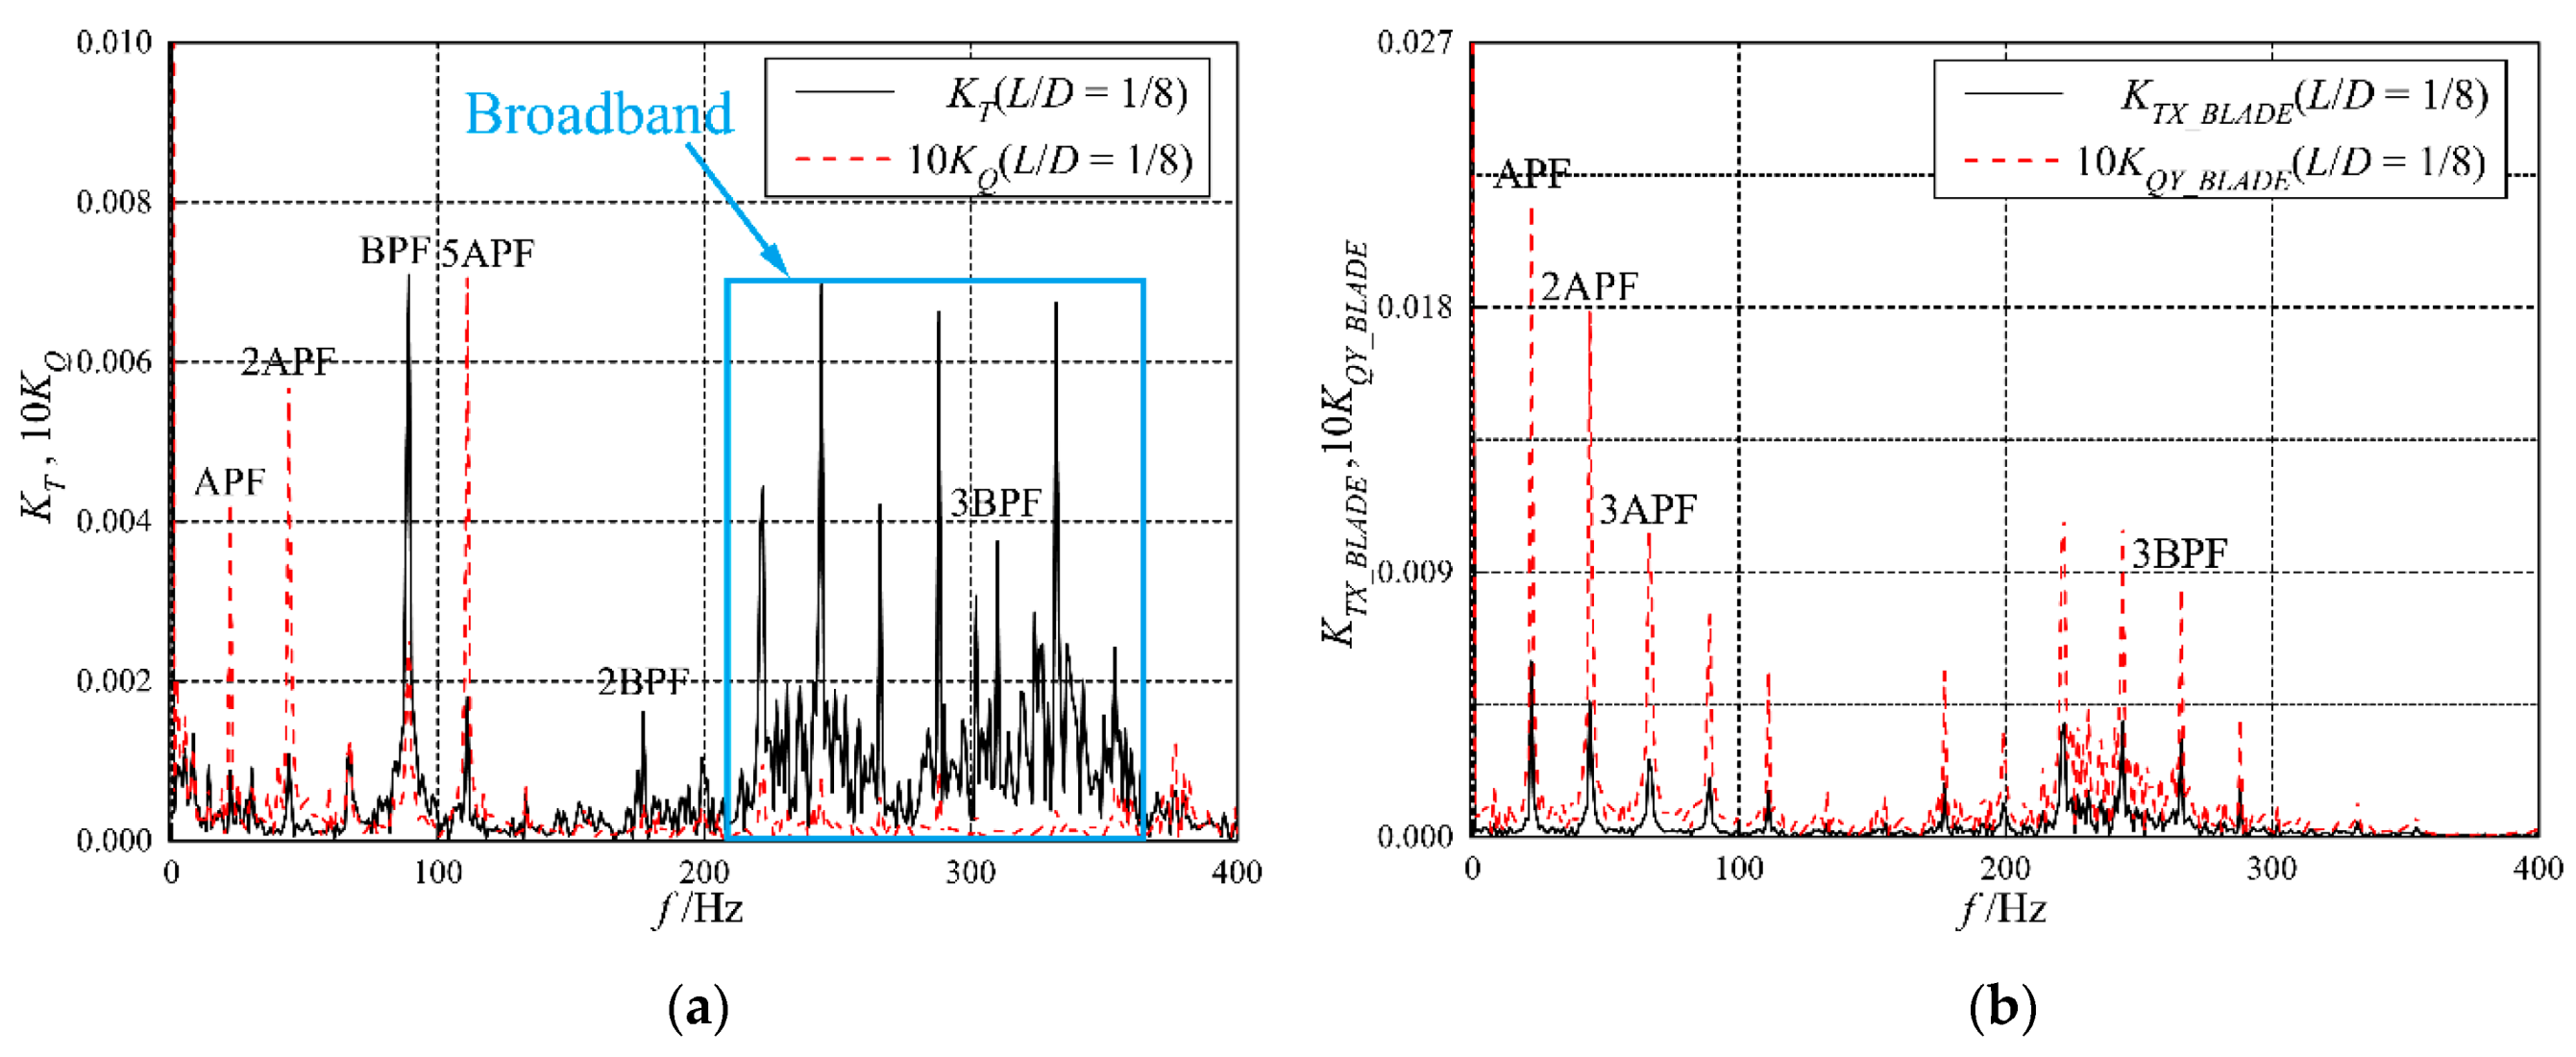
  • Under atmospheric pressure and decompression in the blockage condition, the smaller the ice–propeller axial distance, the larger the amplitude of the BPF of the propeller bearing force and the APF of the single blade. Compared with the trend under atmospheric pressure, the decrease in the cavitation number led to the appearance of broadband characteristics near the 3BPF of the propeller thrust coefficient and blade-bearing force. The smaller the cavitation number, the more distinct the broadband characteristics. When the ice–propeller axial distance was small, the amplitude of the 3BPF of the propeller thrust coefficient and blade-bearing force sharply increased.
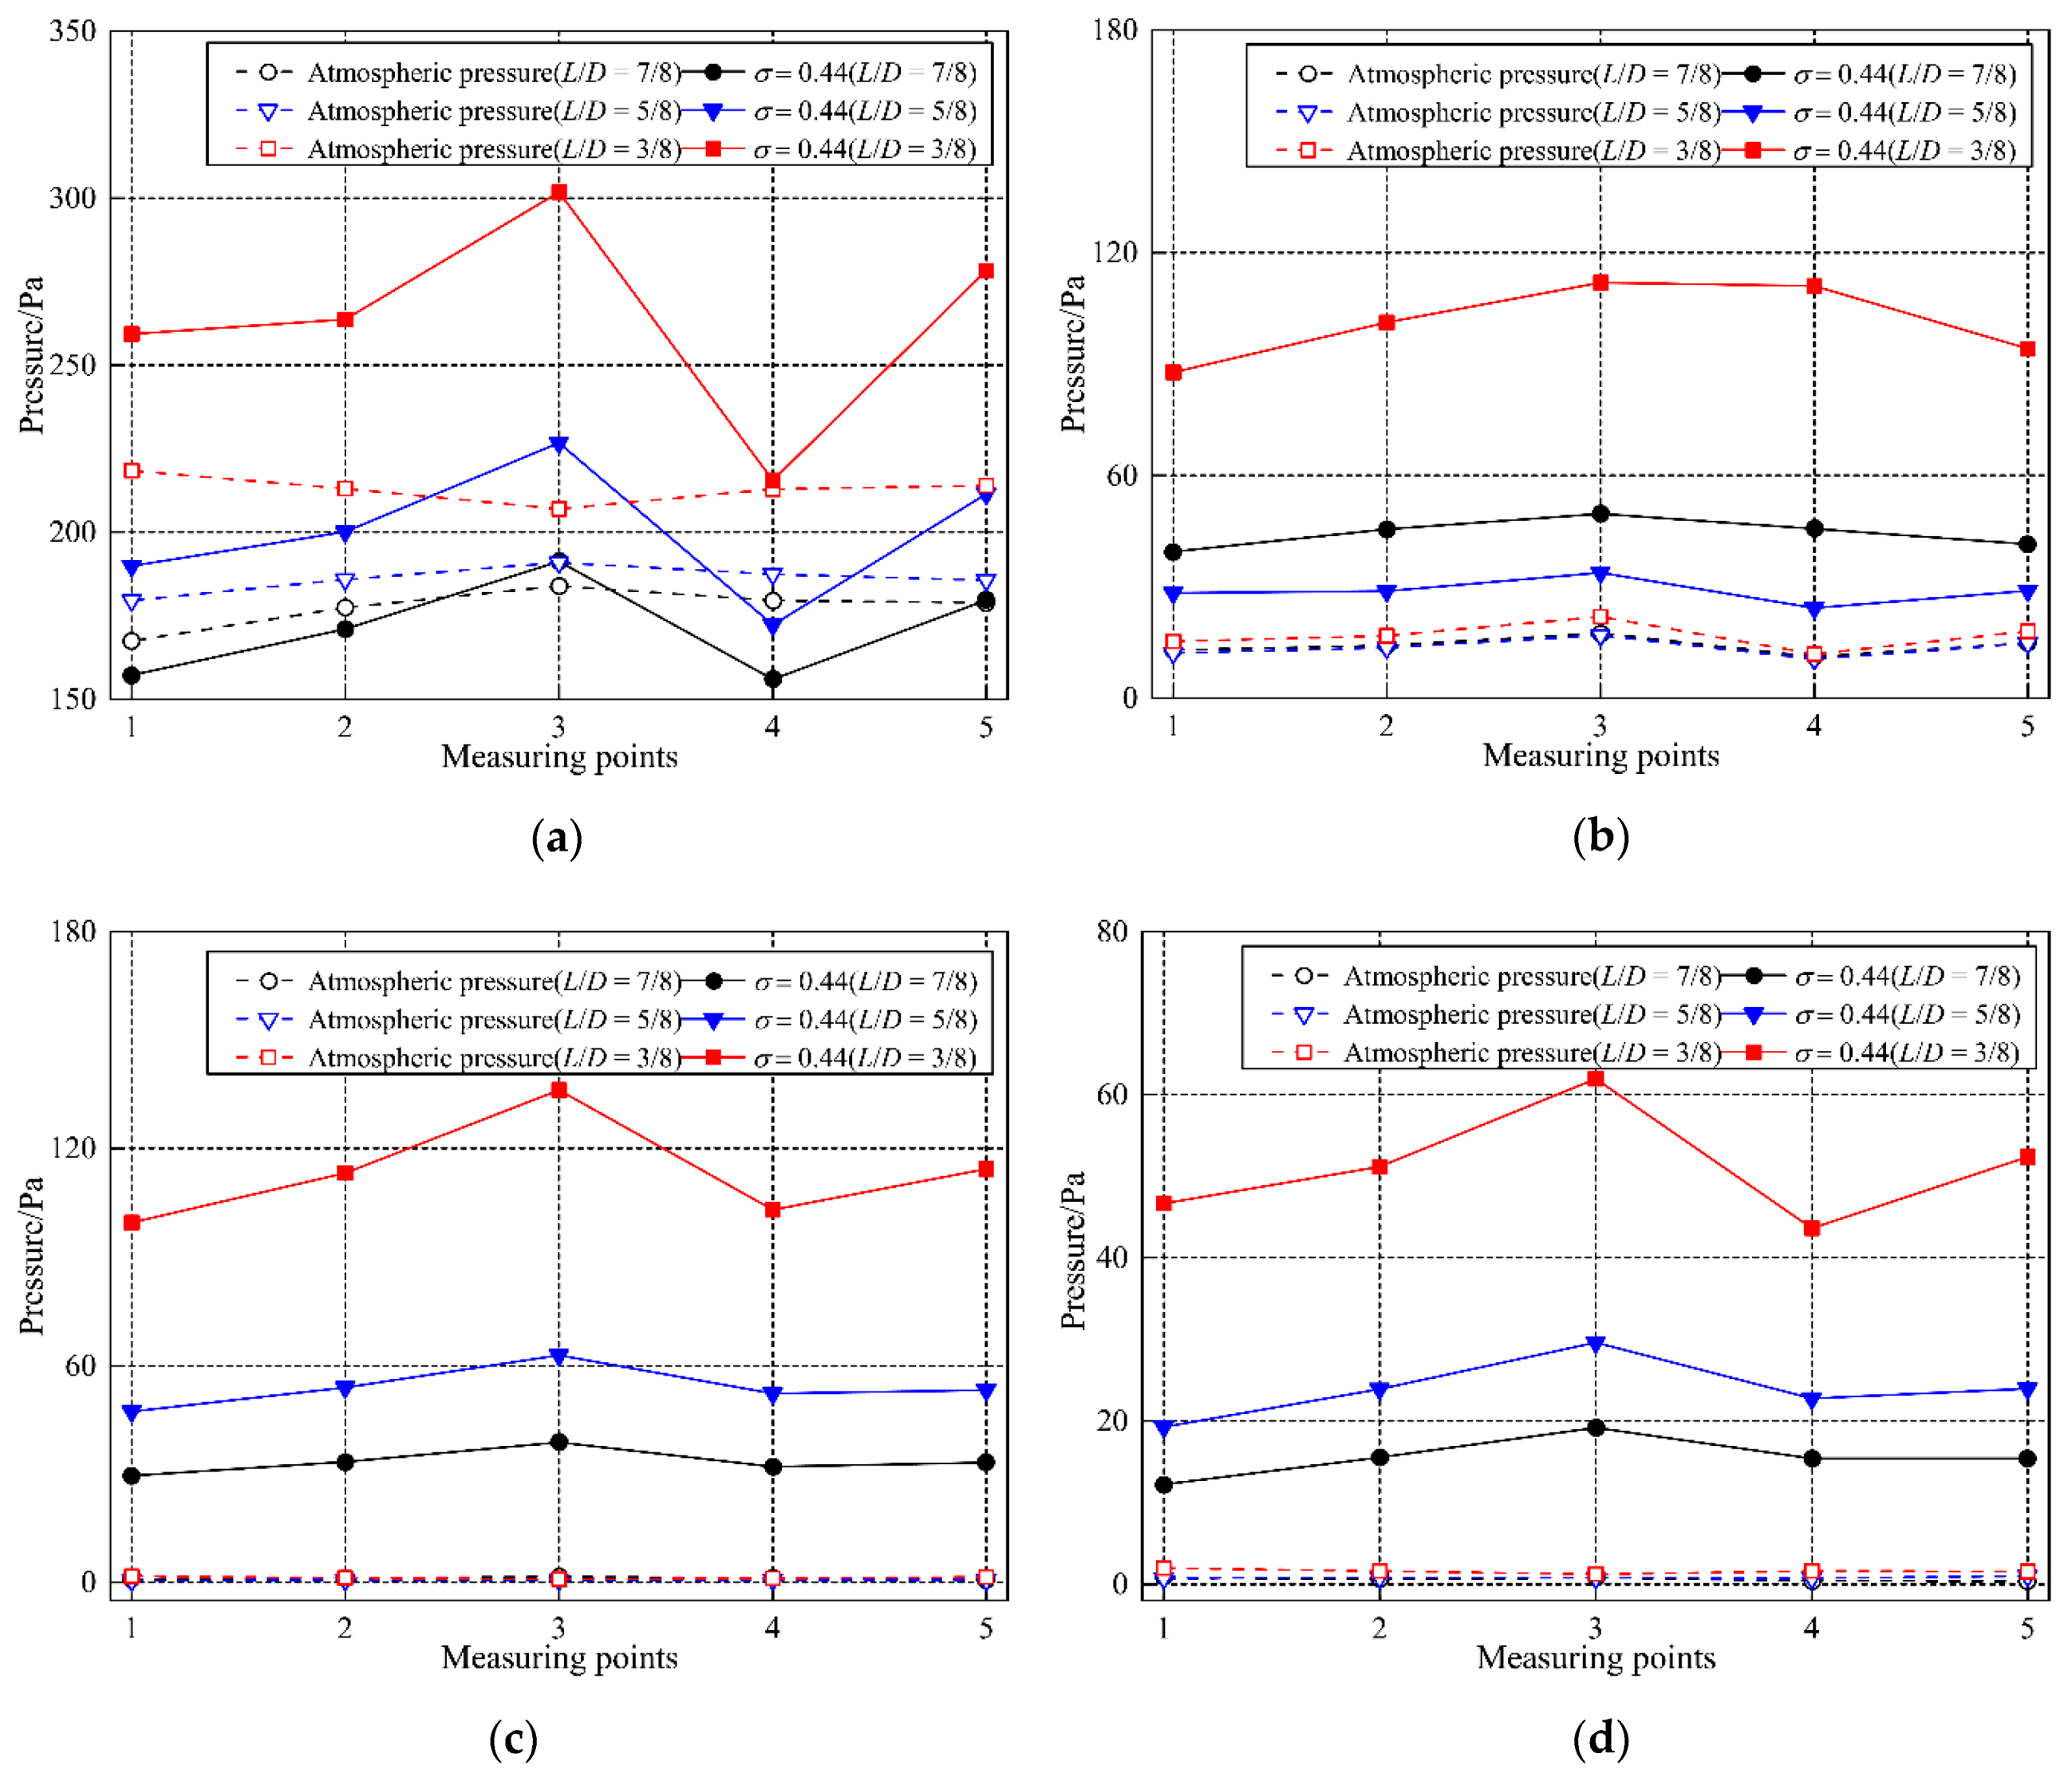
  • Under atmospheric pressure and decompression in the blockage condition, the BPF amplitude of the fluctuating pressure induced by the propeller was the largest. With a decrease in the ice–propeller axial distance, the larger the amplitude of the BPF, and the closer it is to the propeller disk, the faster the amplitude of the BPF increases. Compared with the trend under atmospheric pressure, the decrease in cavitation number leads to a sharp increase in the amplitude of the high-order frequency of the propeller-induced fluctuating pressure. Under atmospheric pressure, the fluctuating pressure at the measurement point behind the propeller is an extreme value, which is closely related to the ice–propeller axial distance. The decrease in the cavitation number led to maximization of the fluctuating pressure at the measurement point behind the propeller, which had the most obvious effect on the hull vibration.
Therefore, the results obtained from model test are expected to provide some experimental guidance and technical support for improving the comprehensive design level of ice-class propeller efficiency and ice load-carrying capacity and improving the safety and rapidity of polar-class ships in frigid zones.
Furthermore, this study focused on the analysis of changes in propeller cavitation and induced excitation force under ice-blockage conditions. During the test, the ice asymptotic motion was constrained, and the degree of freedom of ice was curtailed. In the future, an experimental study on the cavitation and induced excitation force of the propeller can be carried out when the ice in free motion is close to the propeller via suction.

Author Contributions

Writing—original draft preparation, P.X.; writing—revision and review, C.W.; data curation, L.Y.; formal analysis, C.G.; provided the experimental guidance, W.X. and S.W. All authors have read and agreed to the published version of the manuscript.

Funding

This research was funded by the National Natural Science Foundation of China, grant numbers 51809055 and 51909043. China Postdoctoral Science Foundation, grant numbers 2019M651266 and 2020M681082.

Institutional Review Board Statement

Not applicable.

Informed Consent Statement

Not applicable.

Data Availability Statement

Not applicable.

Acknowledgments

The authors really appreciate the anonymous reviewers for their valuable comments and suggestions that can improve the quality of this manuscript.

Conflicts of Interest

The authors declare that there are no conflicts of interest regarding the publication of this paper.

References

  1. Foeth, E.J.; Bosschers, J. Localization and Source-Strength Estimation of Propeller Cavitation Noise Using Hull-Mounted Pressure Transducers. In Proceedings of the 31st Symposium on Naval Hydrodynamics, Monterey, CA, USA, 11–16 September 2016; pp. 11–16. [Google Scholar]
  2. Wang, C.; Li, X.; Chang, X.; Xiong, W.P. Numerical simulation of propeller exciting force induced by milling-shape ice. Int. J. Nav. Arch. Ocean. 2019, 11, 294–306. [Google Scholar] [CrossRef]
  3. Lindroos, H.; Björkestam, H. Hydrodynamic loads developed during ice-clogging of a propeller nozzle and means to prevent the clogging. In Proceedings of the Polartech ‘86, The International Offshore and Navigation Conference and Exhibition, Helsinki, Finland, 27–30 October 1986; pp. 1061–1092. [Google Scholar]
  4. Walker, D.; Bose, N.; Yamaguchi, H. Influence of Cavitation on Canadian R-Class Propellers. J. Offshore Mech. Arct. 1995, 116, 185–189. [Google Scholar] [CrossRef]
  5. Doucet, J.M. Cavitation Erosion Experiments in Blocked Flow with Two Ice-Class Propeller Models. Ph.D. Thesis, Memorial University of Newfoundland, St. John’s, NL, Canada, July 1996. [Google Scholar]
  6. Atlar, M.; Prasetyawan, I.; Aryawan, W.D.; Sasaki, N. Cavitation in Ice-Milling with a Podded Propulsor. In Proceedings of the ASME FEDSM’03 4th ASME/JSME Joint Fluids Engineering Conference, Honolulu, HI, USA, 6–10 July 2003; pp. 269–278. [Google Scholar]
  7. Sampson, R.; Atlar, M.; Sasaki, N. Ice blockage tests with a podded propulsor-effect of recess. In Proceedings of the 26th International Conference on Offshore Mechanics and Arctic Engineering, San Diego, CA, USA, 10–15 June 2007; pp. 195–204. [Google Scholar]
  8. Sampson, R.; Atlar, M.; Sasaki, N. Propeller Ice Interaction–Effect of Blockage Proximity. In Proceedings of the First International Symposium on Marine Propulsors-smp’09, Trondheim, Norway, 22–24 June 2009; pp. 1–8. [Google Scholar]
  9. Wu, S.; Zeng, Z.B.; Zhang, G.P. Experimental research on the influence of ice block parameters on propeller hydrodynamic performance. J. Ship Mech. 2018, 22, 156–164. [Google Scholar]
  10. Wu, S.; Rui, W.; Zeng, Z.B. Investigation on the characteristics of cavitation excited force of propeller in ice block condition. Ship Sci. Technol. 2019, 41, 21–26. [Google Scholar]
  11. Wang, C.; Ye, L.Y.; Chang, X.; Li, X. Test of hydrodynamic loads under non-contact propeller-ice interaction. J. Harbin Eng. Univ. 2017, 38, 1190–1196. [Google Scholar]
  12. Li, Z.; Wang, F.; Diao, F.; Ding, S.F.; Yu, H.; Zhou, Y. Simulation of Ice-Propeller Collision with Cohesive Element Method. J. Mar. Sci. Eng. 2019, 7, 1–21. [Google Scholar]
  13. Wang, C.; Sun, S.X.; Chang, X.; Ye, L.Y. Numerical simulation of hydrodynamic performance of ice class propeller in blocked flow using overlapping grids method. Ocean. Eng. 2017, 141, 418–426. [Google Scholar]
  14. Huang, H.B.; Wu, Y.X.; Wang, J.F.; Fan, X.B. Research on cavitation performance of podded propeller in CLCC. J. Ship Mech. 2017, 21, 396–406. [Google Scholar]
  15. He, Y.S.; Wang, G.Q. Propeller Exciting Force; Shanghai Jiaotong University Press: Shanghai, China, 1987; pp. 252–253. [Google Scholar]
  16. Zheng, C.S.; Liu, D.C.; Huang, H.B. The Numerical Prediction and Analysis of Propeller Cavitation Benchmark Tests of YUPENG Ship Model. J. Mar. Sci. Eng. 2019, 7, 387. [Google Scholar] [CrossRef] [Green Version]
  17. De Waal, R.J.O.; Bekker, A.; Heyns, P.S. Indirect load case estimation for propeller-ice moments from shaft line torque measurements. Cold Reg. Sci. Technol. 2018, 151, 237–248. [Google Scholar] [CrossRef] [Green Version]
  18. Williams, F.; Spencer, D.; Mathews, S.; Bayly, I. Full Scale trials in Level Ice with Canadian R-Class Icebreaker. Soc. Nav. Archit. Mar. Eng. Trans. 1992, 100, 293–313. [Google Scholar]
  19. Guo, C.Y.; Xu, P.; Wang, C.; Wang, L.Z.; Zhang, C.S. Influence of Ice Size Parameter Variation on Hydrodynamic Performance of Podded Propulsor. China Ocean. Eng. 2020, 34, 30–45. [Google Scholar] [CrossRef]
  20. Khan, G.A.; Hisette, Q.; Streckwall, H.; Liu, P.F. Numerical investigation of propeller-ice interaction effects. Ocean. Eng. 2020, 216, 1–14. [Google Scholar] [CrossRef]
  21. Sheng, Z.B.; Liu, Y.Z. Ship Principle; Shanghai Jiaotong University Press: Shanghai, China, 2013; pp. 68–70. [Google Scholar]
  22. Minelli, G.; Dong, T.; Noack, B.R.; Krajnović, S. Upstream actuation for bluff-body wake control driven by a genetically inspired optimization. J. Fluid Mech. 2020, 893, 1–29. [Google Scholar] [CrossRef]
  23. Xue, Q.Y.; Wu, S.; Gu, X.N.; Zhai, S.C. Analysis on the mechanisms of propeller-hull vortex cavitation induced in ice block environments. Chin. J. Ship Res. 2020, 15, 90–95. [Google Scholar]
  24. Guo, C.Y.; Xu, P.; Wang, C.; Xiong, W.P. Experimental Investigation of the Effect of Ice Blockage on Propeller Hydrodynamic Performance. Math. Probl. Eng. 2019, 2019, 1–19. [Google Scholar] [CrossRef]
  25. Huse, E. Propeller-hull vortex cavitation. Int. Shipbuild. Prog. 1972, 19, 111–125. [Google Scholar] [CrossRef]
  26. Sun, C.; Wang, C.; Sun, S.X.; Chang, X.; Zhang, L. Numerical prediction analysis of the fluctuating pressure and rudder force of full-scale hull-propeller-rudder system. Ocean. Eng. 2018, 147, 580–590. [Google Scholar] [CrossRef]
Figure 1. Single blades.
Jmse 09 00674 g001
Figure 2. Propeller model photograph and three-dimensional schematic diagram.
Jmse 09 00674 g002
Figure 3. Test section of the large circulating water channel.
Jmse 09 00674 g003
Figure 4. Schematic diagram of the test platform for propeller-induced excitation force.
Jmse 09 00674 g004
Figure 5. Installation of fluctuating pressure transducer.
Jmse 09 00674 g005
Figure 6. Variation of KT,10KQ and η with L/D: (a) KT; (b) 10KQ; (c) η.
Jmse 09 00674 g006
Figure 7. Variation of five-component force of single blade with L/D: (a) KTX_BLADE; (b) KTT_BLADE; (c) 10KQX_BLADE; (d) 10KQY_BLADE; (e) 10KQZ_BLADE.
Jmse 09 00674 g007
Figure 8. Time-domain curves of KTX_BLADE and 10KQY_BLADE with different L/D (atmospheric pressure under blockage conditions): (a) KTX_BLADE; (b) 10KQY_BLADE.
Jmse 09 00674 g008
Figure 9. Time-domain curves of KTX_BLADE and 10KQY_BLADE (Open-water conditions, atmospheric pressure and σ = 0.44 under blockage conditions): (a) KTX_BLADE; (b) 10KQY_BLADE.
Jmse 09 00674 g009
Figure 10. Variation in blade cavitation with different L/D (σ = 0.44): (a) L/D = 1; (b) L/D = 5/8; (c) L/D = 3/8; (d) L/D = 1/8.
Jmse 09 00674 g010aJmse 09 00674 g010b
Figure 11. Change process of the propeller–hull vortex cavitation during blade rotation (σ = 0.44): (a) Unblocked region; (b) Rotation into the blocked region; (c) Blocked region; (d) Exit from the blocked region.
Jmse 09 00674 g011
Figure 12. Frequency-domain curves of propeller and blade bearing force under blockage condition (J = 0.281, atmospheric pressure): (a) KT curve in frequency-domain; (b) 10KQ curve in frequency-domain; (c) KTX_BLADE, KTT_BLADE curves in frequency-domain; (d)10KQX_BLADE, 10KQY_BLADE, 10KQZ_BLADE curves in frequency-domain.
Jmse 09 00674 g012aJmse 09 00674 g012b
Figure 13. Variation of fluctuating amplitude of propeller bearing force with L/D (J = 0.281, atmospheric pressure): (a) Fluctuating amplitude of KT; (b) Fluctuating amplitude of 10KQ.
Jmse 09 00674 g013
Figure 14. Variation of fluctuating pressure at measuring point with L/D (J = 0.281, atmospheric pressure): (a) BPF; (b) 2BPF; (c) 3BPF; (d) 4BPF.
Jmse 09 00674 g014
Figure 15. Frequency-domain curves of propeller and blade bearing force under blockage condition (J = 0.281, σ = 0.44): (a) KT, 10KQ curves in the frequency-domain; (b) KTX_BLADE,10KQY_BLADE curves in the frequency-domain.
Jmse 09 00674 g015
Figure 16. Variation of fluctuating amplitude of propeller bearing force with L/D (J = 0.281, σ = 0.44): (a) Fluctuating amplitude of KT; (b) Fluctuating amplitude of 10KQ.
Jmse 09 00674 g016
Figure 17. Variation of fluctuating pressure at measuring point with L/D (J = 0.281, atmospheric pressure and σ = 0.44): (a) BPF; (b) 2BPF; (c) 3BPF; (d) 4BPF.
Jmse 09 00674 g017
Figure 18. Frequency-domain curves of propeller and blade bearing force under blockage condition (J = 0.325, σ = 0.33): (a) KT, 10KQ curves in the frequency-domain; (b) KTX_BLADE, 10KQY_BLADE curves in the frequency-domain.
Jmse 09 00674 g018
Figure 19. Variation of fluctuating amplitude of propeller bearing force with L/D (J = 0.325, σ = 0.33): (a) Fluctuating amplitude of KT; (b) Fluctuating amplitude of 10KQ.
Jmse 09 00674 g019
Figure 20. Variation of fluctuating pressure at measuring point with L/D (σ = 0.44 and σ = 0.33): (a) BPF; (b) 2BPF; (c) 3BPF; (d) 4BPF.
Jmse 09 00674 g020aJmse 09 00674 g020b
Table 1. Operating conditions of full-scale ship.
Cavitation Number of Rotational Speed at 0.8RAdvance Coefficient JFull-Scale Propeller Rotational Speed ns(r/s)Full-Scale Ship Speed Vs(m/s)
σ = 0.330.3251623.61
σ = 0.440.2811412.72
Table 2. Operating conditions of the test.
Test ConditionsAxial Distance L/DVertical
Distance h/D
Cavitation Number Rotational Speed at 0.8RAdvance Coefficient JRotational Speed nm(r/s)Speed
Vm(m/s)
Case 100Open-water condition0.28119.361.36
Case 21/8, 2/8, 3/8, 4/8, 5/8, 6/8, 7/8, 17/16Atmospheric pressure0.28119.361.36
Case 37/16σ = 0.440.28119.361.36
Case 45/16σ = 0.440.28119.361.36
Case 57/16σ = 0.330.32522.151.8
Table 3. Variation of fluctuating amplitude of single blade-bearing force with varying L/D.m (J = 0.281, atmospheric pressure).
APF2APF
L/D1/83/85/87/81/83/85/87/8
KTX_BLADE0.00530.00340.00240.00160.00500.00300.00190.0012
KTT_BLADE0.00220.00180.00160.00140.00110.00070.00050.0004
10KQX_BLADE0.00440.00300.00260.00240.00400.00240.00150.0011
10KQY_BLADE0.02170.01280.00850.00540.02230.01270.00820.0051
10KQZ_BLADE0.00300.00120.00120.00130.00370.00150.00090.0006
3APF3BPF
L/D1/83/85/87/81/83/85/87/8
KTX_BLADE0.00490.00280.00180.00120.00320.00030.00010.0002
KTT_BLADE0.00150.00090.00070.00050.00100.000100
10KQX_BLADE0.00420.00250.00180.00130.00260.00030.00010.0002
10KQY_BLADE0.02100.01140.00750.00480.00850.00090.00030.0005
10KQZ_BLADE0.00350.00140.00090.00060.00210.00020.00010.0001
Table 4. Variation of fluctuating amplitude of blade-bearing force with L/D (J = 0.325, σ = 0.33).
APF2APF
L/D1/83/85/87/81/83/85/87/8
KTX_BLADE0.00600.00450.00290.00240.00460.00280.00170.0013
10KQY_BLADE0.02160.01630.01050.00830.01790.01140.00700.0054
3APF3BPF
L/D1/83/85/87/81/83/85/87/8
KTX_BLADE0.00260.00130.00080.00060.00330.00060.00040.0003
10KQY_BLADE0.01040.00550.00350.00240.00880.00120.00110.0009
Publisher’s Note: MDPI stays neutral with regard to jurisdictional claims in published maps and institutional affiliations.

