Article

Exploring Possible Influence of Dust Episodes on Surface Marine Chlorophyll Concentrations

1
Marine Section, Hellenic National Meteorological Service, El. Venizelou 14, 16777 Hellinikon, Greece
2
Department of Marine Sciences, School of the Environment, University of the Aegean, University Hill, 81100 Mytilene, Greece
*
Author to whom correspondence should be addressed.
J. Mar. Sci. Eng. 2019, 7(2), 50; https://doi.org/10.3390/jmse7020050
Submission received: 31 December 2018 / Revised: 11 February 2019 / Accepted: 12 February 2019 / Published: 20 February 2019
(This article belongs to the Section Physical Oceanography)

Abstract

:
Desert dust deposition is thought to act as fertilizer for phytoplankton growth, since it is rich in the required nutrients. The Mediterranean Sea is a nutrient poor marine environment—with its eastern part being the most oligotrophic—which is subject to dust transport. The Hellenic Seas are part of this low-nutrient, low-chlorophyll environment and they are also affected by dust deposition events. Thus, the dust fertilizing effect can be particularly important, especially during the stratification period, when the nutrients needed for phytoplankton growth are not imported from deeper layers. Some individual dust events are examined here in respect of their possible influence on phytoplankton, through the observed variations of satellite derived chlorophyll concentrations. Two strong dust events that were also extreme weather events and three events in the June–September stratification period are examined for the Hellenic Seas as well as a strong dust event in the Central Mediterranean Sea. The results, only when based on absolute chlorophyll differences above 50%, show that dust events seem to favour phytoplankton abundance mainly during the low productive period; however, these differences are area-limited. The difficulty of reaching safe results through specific dust events and discriminating between other meteorological factors favouring phytoplankton growth are also discussed.

1. Introduction

Phytoplankton is the basis of the marine food chain, with its photosynthesis being comparable with that of the terrestrial plants [1]. Its growth is controlled by the availability of light and the macronutrients nitrogen (N) and phosphorous (P), plus the micronutrient iron (Fe) that is required in small amounts for cellular processes [2]. The sources and mechanisms by which these nutrients are made available to phytoplankton are subject to continuous research. For most of the oceanic regions, atmospheric deposition is the main source of nutrients [3] and especially dust deposition since it contains all the required ingredients [4,5]. The relevant research started on the high-nutrient, low-chlorophyll (HNLC) marine areas, characterized by low primary production and at the same time by high nutrient availability. For these regions, Fe was recognized as the limiting nutrient and was found to increase chlorophyll concentrations proportionally to its added amount [6]. The “iron limitation hypothesis” was formulated with possible effects even on climate, as a result of the drawdown of atmospheric carbon dioxide (CO2) due to great phytoplankton abundance caused by Fe-dust enrichment [7]. Experiments were conducted and supported the iron limitation hypothesis, for example, [8,9,10,11], while several studies dealt with its connection to climate variability, for example, [4,12].
The research was expanded to low-nutrient low-chlorophyll (LNLC) areas, that is, to the oligotrophic 60% of the global ocean [13], where Fe can only have a co-limiting role for phytoplankton [14]. The dust impacted LNLC areas usually have enough Fe and their primary production is mainly controlled by the availability of P and N [15,16,17]. Since desert dust contains these nutrients, the “iron limitation hypothesis” was reformed to the “dust fertilization hypothesis” and was tested in LCLN regions, usually with supportive results [14,18,19,20].
The Mediterranean Sea is a LNLC environment in which higher chlorophyll-a (chl-a) concentrations—a proxy for phytoplankton abundance—are observed during late winter-early spring [21] and its central and eastern parts have in general been identified as non-blooming areas [22]. A large part of this phytoplankton variability can be explained by the winter-spring water column mixing and the differences in the mixed layer depth (MLD) [23], which is deeper in the eastern part of the basin [24]. The Sea presents a high N:P ratio suggesting that P is the limiting factor, especially for its eastern part, where this ratio is unusually high [25]. Thus, P is thought to be the main limiting nutrient for phytoplankton growth with decreasing concentrations from west to east [26] similar to the eastward enhancement of the oligotrophic conditions [27]. The low nutrient concentrations in the Mediterranean—the lowest being over the eastern part—[28] reveals the importance of the atmospheric nutrient deposition, especially during the stratification period. The presence of desert dust particles characterizes the Mediterranean atmosphere [29,30] and the Sea is subject to a high rate of desert dust deposition [31] mainly favoured in winter and spring, when dust is transferred close to the surface [32]. Increased frequency of large and very large dust deposition events has been found in autumn and winter [33]. Dust deposition over the Mediterranean presents a decreasing gradient to the north and the Central Mediterranean has been found to be the most affected by dust deposition events [34]. According to the study in Reference [33] the frequency of large deposition events is higher over the western basin, while very large events characterize its central and eastern parts. Thus, the Mediterranean Sea offers an ideal LNLC environment for testing the dust fertilization hypothesis.
Experiments and observations in the Mediterranean have shown that dust can provide seawaters with N, P or both [35,36,37,38,39,40,41,42] that are of particular importance, especially during the stratification period when nutrients cannot be transferred from deeper waters to the surface. As far as Fe is concerned, its concentrations in the Sea due to dust addition or atmospheric deposition rather exclude Fe-limitation [38,42]. However, it has been argued that although this is the case during the stratification period, in spring the increased biological activity can decrease the dissolved Fe even to limited levels for phytoplankton [43]. It has also been suggested that dust derived Fe, by absorbing P, could even be the reason for the high N:P ratio in the Eastern Mediterranean, that is unfavourable for phytoplankton growth [25].
Experiments conducted over LNLC areas of the NW Mediterranean Sea and mainly under stratification conditions were in general supportive to the dust fertilization hypothesis: two successive wet dust additions both favoured phytoplankton species [44,45] and wet deposition resulted in significant increases of chl-a concentration and primary production [46]; Saharan dust and Fe plus P inputs favoured primary production, although the environment remained oligotrophic [35]; dust amended favoured both autotrophic and heterotrophic communities and chlorophyll concentration was remarkably increased after high dust inputs [39]; high dust and P additions favoured the autotrophic community [47]. On the contrary, dust events primarily favoured heterotrophic bacteria [48]; low dust additions were found to first favour the heterotrophic community [47] and dry dust deposition caused no changes in chl-a concentration [46]. Experiments and measurements in the Eastern Mediterranean Sea have shown more contradictory results: a significant increase in chl-a concentration was observed after the addition of both N and P [49]; chl-a increased linearly to the added fresh dust and after a dust storm a slight increase in chl-a and bacterial was observed [42]; the atmospheric deposition of N and P seemed to increase primary production [40]. On the other side: no phytoplankton increase was detected after dust events [37]; after a P-addition no change in chl-a was found [50]; a P addition resulted in an increase in bacterial and a chlorophyll decline [51]; after dry and wet deposition events little or no phytoplankton response was observed [52].
Studies based on satellite derived chlorophyll data for the entire Mediterranean have also ended up showing contradictory results: negative correlations were found between chlorophyll concentration and aerosol optical depth (as proxy for the presence of dust in the atmosphere) [53]; the significant correlations between aerosol optical thickness and chlorophyll concentrations at near-zero time lag were interpreted as an artefact caused by the impact of dust on the satellite data, while the significant correlations at greater time lags were few and indicative of a rather insignificant dust role [54]. In contrary: chlorophyll increases were observed shortly after dust deposition events [55]; weekly chlorophyll concentration data and model dust deposition data were found correlated in quite large areas especially of the Eastern Mediterranean and the Central part of the Sea was characterized as “the most responsive to dust deposition” [56]; small positive statistically significant correlations were found between chlorophyll and dust deposition, mainly in spring and for the Central and Eastern basins, with the seasonally detrended chlorophyll data resulting in lower and more limited correlations [57]; significant chlorophyll peaks in respect to the week before were found after very large dust events along with a possible pattern of an eastward decrease in the Sea’s responsiveness to high deposition dust events [33].
The Hellenic Seas, part of the LNLC eastern Mediterranean, are poorly studied regarding the possible effects of dust on phytoplankton growth. A significant dust transport in May 2013 over the area when dust load was high for almost 15 days, in respect to May 2012 when no significant dust load was observed, resulted in approximately doubled monthly chl-a concentrations even over the less productive areas of South Aegean Sea [58]. In the current study, the possible influence of dust events on phytoplankton is examined as revealed by satellite derived chlorophyll concentrations. The study is focused on the Hellenic Seas, while a strong event over the Central Mediterranean Sea is also assessed. It is noted that such a research focusing on the Hellenic Seas is missing from literature. Two strong events in March characterized also by extreme weather conditions and three events during the stratification period (one in June and two in September), when dust nutrients are supposed to have the maximum influence on the marine environment, are examined for the Hellenic Seas. Care was taken in the selection of the episodes during the June-September period in order not to be accompanied by high winds and heavy rainfall; these weather conditions can also favour phytoplankton growth by introducing nutrients from deeper layers or from the atmosphere to the surface waters. Chlorophyll differences before and after the events were calculated for the dust-affected areas and separately for the subareas of wet dust deposition. The results show both increases and decreases in chlorophyll concentrations after the events; however, when based on the area-limited absolute chlorophyll differences above 50%, they indicate a possible favourable effect of dust on phytoplankton, mainly during the low productive period. The present paper contributes to the relevant research through the study of specific events that is quite rare especially for the Hellenic Seas; the difficulties in drawing a safe conclusion are highlighted as well.

2. Materials and Methods

The marine area of about 460,000 km2 lying between 41.1°N, 19.5°E, 34°N and 29.6°E, herein referred to as “the Hellenic Seas,” is the main study area for the dust episodes; it is shown in Figure 1 along with the nineteen years (1998–2016) chlorophyll mean from June to September calculated from Copernicus Marine Environment Monitoring Service (CMEMS) monthly products. The area of the Central Mediterranean that is also examined was determined by dust Aerosol Optical Depth (AOD) values >0.8. In summary, for each dust episode recognized through dust AOD values—plus particulate matter (PM10) measurements for the Hellenic area—percentage differences of weekly satellite derived chlorophyll concentrations before and after the event were computed. Such differences were also calculated for the areas impacted by rain and account for wet deposition. For the episodes over the Hellenic Seas, daily chlorophyll differences were also computed. Absolute percentage chlorophyll differences above 50% were considered “significant” and are presented separately. The major part of data analysis was implemented in a Geographic Information System (GIS) environment.

2.1. Data

For the presence of dust in the atmosphere, near-real-time data of the “Dust Aerosol Optical Depth at 550nm” (dust AOD), available from the Copernicus Atmosphere Monitoring Service (CAMS) were used. It is noted that the typical dust AOD values are 0.1–1, with values <0.1 denoting there is virtually no dust at all; however, they can be >1 showing very high dust concentrations. In addition, PM10 station data (Figure 1) of the Greek Ministry of Environment and Energy through http://www.ypeka.gr were used. These measurements are conducted very close to the surface and the stations are situated in urban or suburban mainland areas. The chlorophyll data is multi satellite observations from CMEMS, L4 for the weekly data and L3 for the daily ones, computed via regional (Mediterranean) ocean colour algorithms. Data from the European Centre for Medium-Range Weather Forecasts interim reanalysis (ECMWF-ERA Interim project) plus daily accumulated precipitation of the Global Precipitation Measurement (GPM) product from giovanni.gsfc.nasa.gov were employed to define areas with precipitation. The Extreme Forecast Index (EFI) of the ECMWF ensemble prediction system was used for the identification of areas impacted by extreme precipitation or winds for the March episodes. The description of the weather conditions was also based on data from the Hellenic National Meteorological Service (HNMS) plus satellite Advanced Scatterometer (ASCAT) wind measurements.

2.2. Method

The first two dust episodes, that have taken place in March, were selected as extreme episodes that affected all the study area. Strong dust episodes, in winter and spring, are accompanied by gale winds, heavy rains or strong thunderstorms, that can also favour primary production importing nutrients to the surface layers through mixing processes from deeper layers or through precipitation from the atmosphere. Therefore, it was difficult to disentangle between the meteorological factors possibly affecting phytoplankton growth. Thus, the next three dust events studied were selected to have taken place in June-September period for two reasons: (a) because of the water column stratification during summer and early fall that highlights the role of dust imported nutrients and (b) because during this period it is quite possible to find individual dust events not accompanied by gale winds and heavy rainfall. The disadvantage is that, during this time of the year, dust transport can be above a certain level and deposition can be quite limited. It was difficult to select such dust episodes, since some strict criteria were set: the episodes were not to have been accompanied by gale winds, heavy rains or strong thunderstorms and if possible such phenomena to be also excluded before and after the events. It is noted that high winds were found together with dust events when chlorophyll increases were observed and their effects could not be disentangled [55,59]. The episode concerning the Central Mediterranean was selected for being strong and reported in the ECMWF-CAMS validation report of March–May 2017 as well captured by the dust AOD data.
A minimum dust AOD value of 0.3 was set—where needed—in defining the areas impacted by dust to ensure the presence of dust in the atmosphere over the Hellenic Seas. Evaluations of the ECMWF/MACC (Monitoring Atmospheric Composition and Climate) AOD re-analysis at visible wavelengths against measurements and observations showed that it presents an overestimation when dust load is low especially during spring, summer and autumn and an underestimation for values >0.3 [60], while a root mean square difference from observations of about 0.25 was reported for Thessaloniki AERONET (AErosol RObotic NETwork) station [61]. In addition, during the summer and autumn events of the present study, PM10 values <50 were observed when the forecasted dust AOD was <0.25. For the dust episode over the Central Mediterranean, the study was conducted for the region with dust AOD >0.8, in order to define an area with more than doubled AOD values during the event compared to the weeks before and after it, although during these weeks the values were <0.2 over the greater part of the region. Since high atmospheric dust loads revealed through AOD values do not necessarily account for deposition, the latter was confirmed with the use of PM10 station data. The use of these data is especially important for the June and September events when dust travels at higher altitudes in the atmosphere and is usually not accompanied by precipitation [62], facts that could result in low or near zero deposition.
Dust influence on chlorophyll concentration has been found to last about a week [46,47]; thus, weekly chlorophyll percentage differences for the weeks before and after the events were calculated. Since the absolute percentage differences reported between in situ observations and chlorophyll satellite data is approximately 50% [63], the chlorophyll differences above this level, are separately presented and hereafter mentioned as “significant.” The area indicated for precipitation during the episodes by both ECMWF and Giovanni data was considered as area of wet deposition and weekly chlorophyll differences were separately calculated. A statistical paired-t test was applied to the weekly chlorophyll values, in order to check whether their means over the dust affected areas differ significantly before and after the events. For the first two episodes, that were extreme weather events for Greece, weekly chlorophyll differences were also calculated for the area impacted by extreme rain or by extreme wind, as indicated by the precipitation EFI and the wind EFI respectively. In addition, for all cases of the Hellenic Seas, chlorophyll differences were calculated between some day before the event and the 3rd up to 6th day after the event depending on the availability of the daily chlorophyll data in a quite wide area. It is noted that chlorophyll responses to dust addition have been found after 3 to 4 days [33,35,42,45,47,49]. Taking in mind the possible disturbance in satellite derived chl-a concentrations caused by dust mimicking chlorophyll and increasing the extracted values that has been referred in the past, for example, [54,64], care was taken in order the daily satellite data used not to be affected by the presence of dust in the atmosphere. Thus, the selected days before and after the event were characterized by dust AOD <0.1 over a large region, while all chlorophyll data in areas with AOD >0.1 were excluded. It is noted that daily data was used in order to capture possible temporary chlorophyll increases that had no particular influence on the weekly concentrations. However, the relevant calculation presents two disadvantages: the smaller amount of available data and the possibility chlorophyll variations not to have taken place on these days. Last but not least, the prevailing weather before-during and after the events was taken into account in order to comment on other possible influences, except the ones of dust, on chl-a concentration.

3. Results

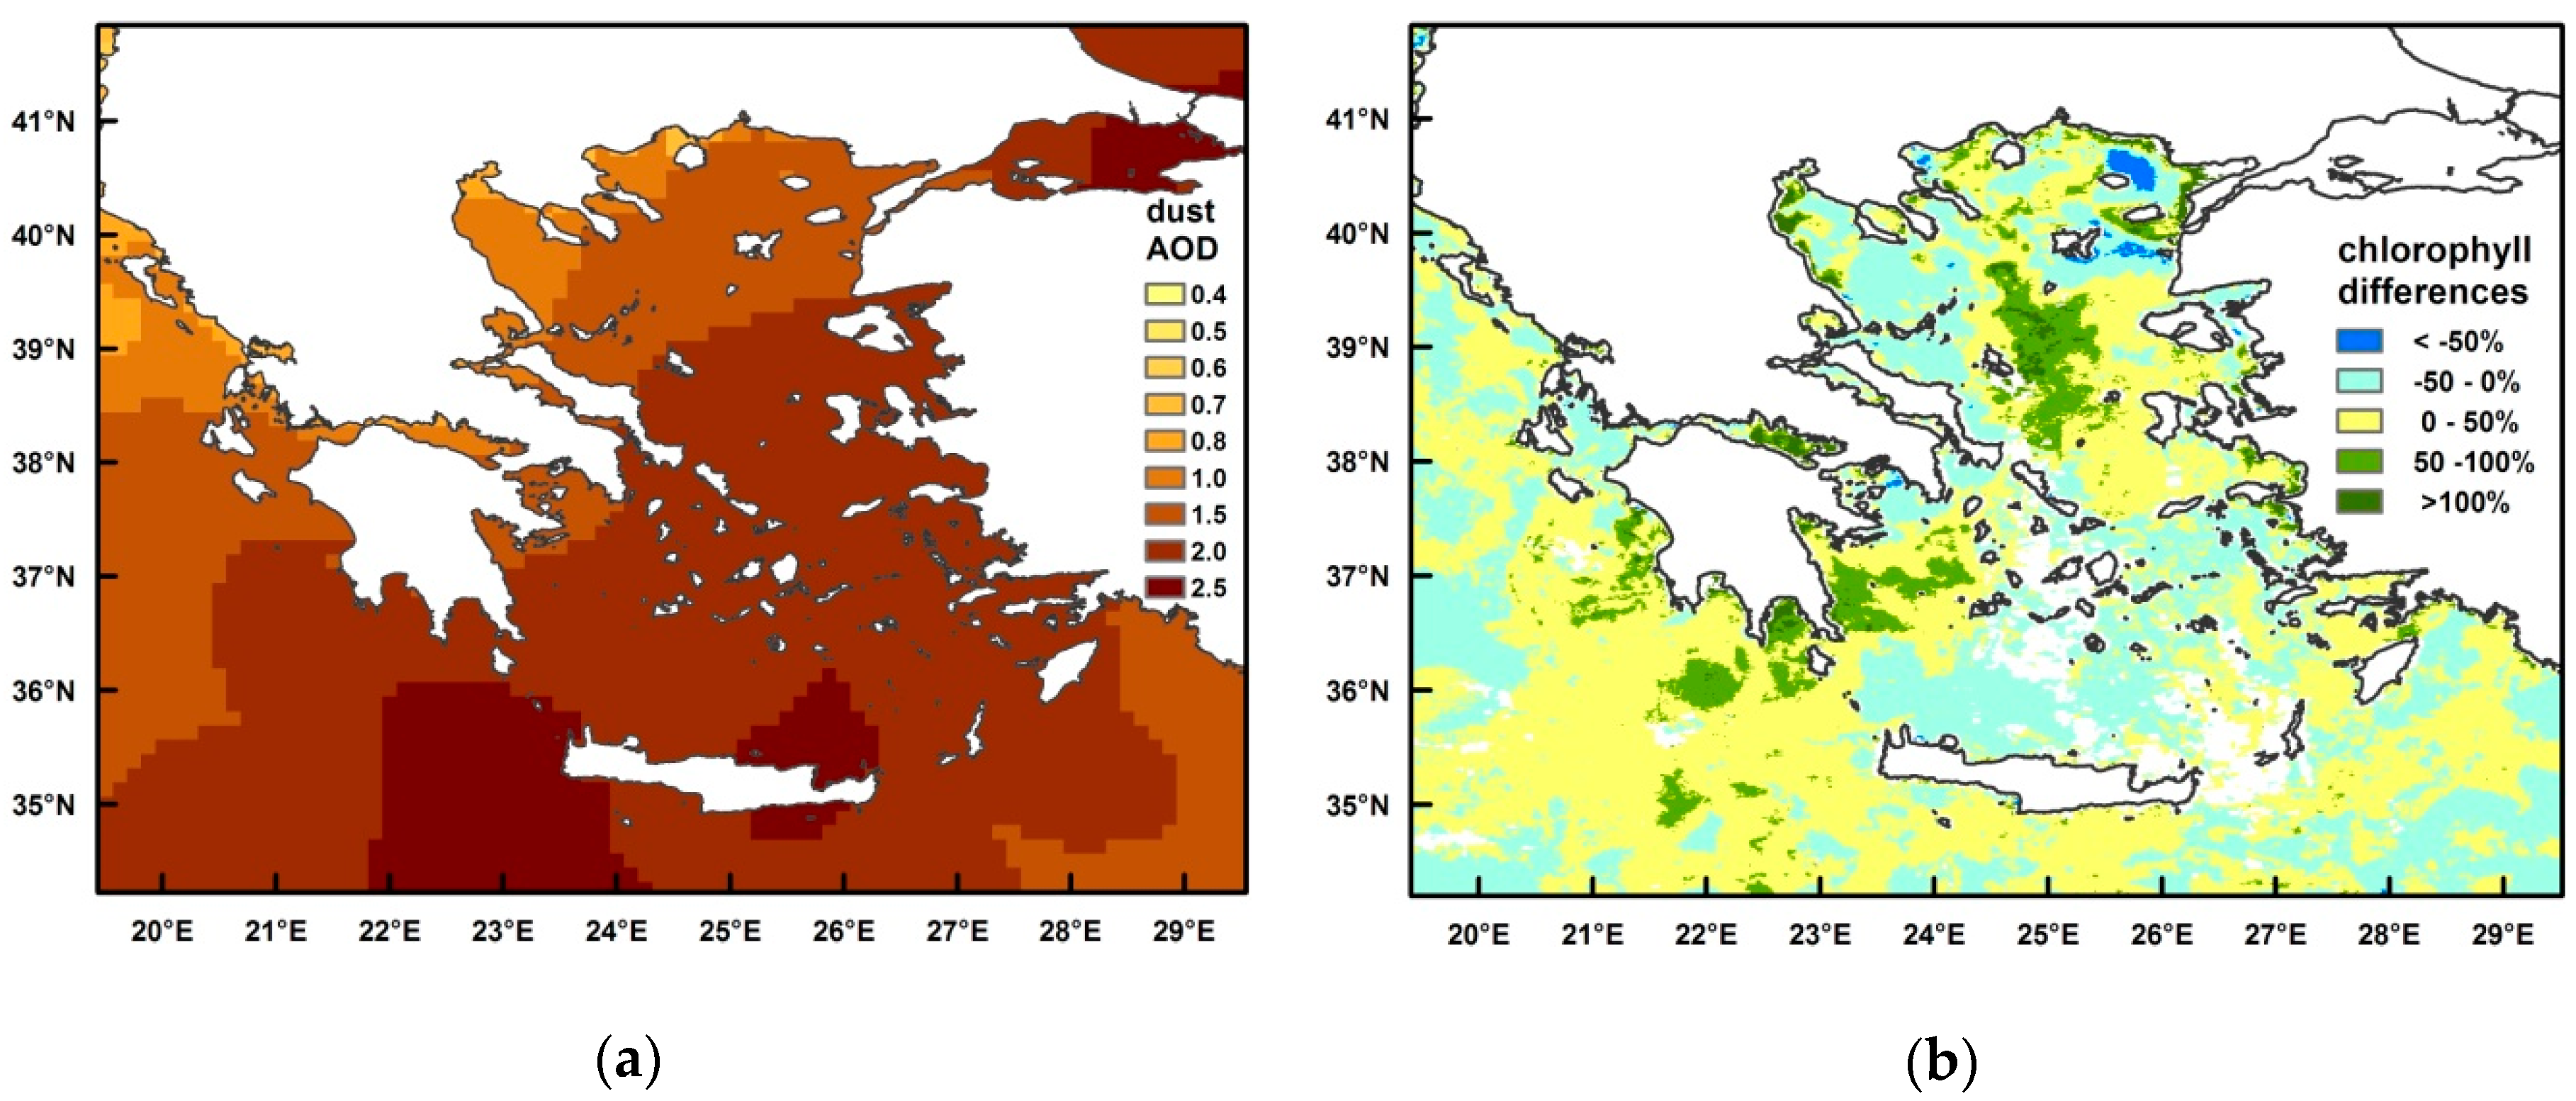
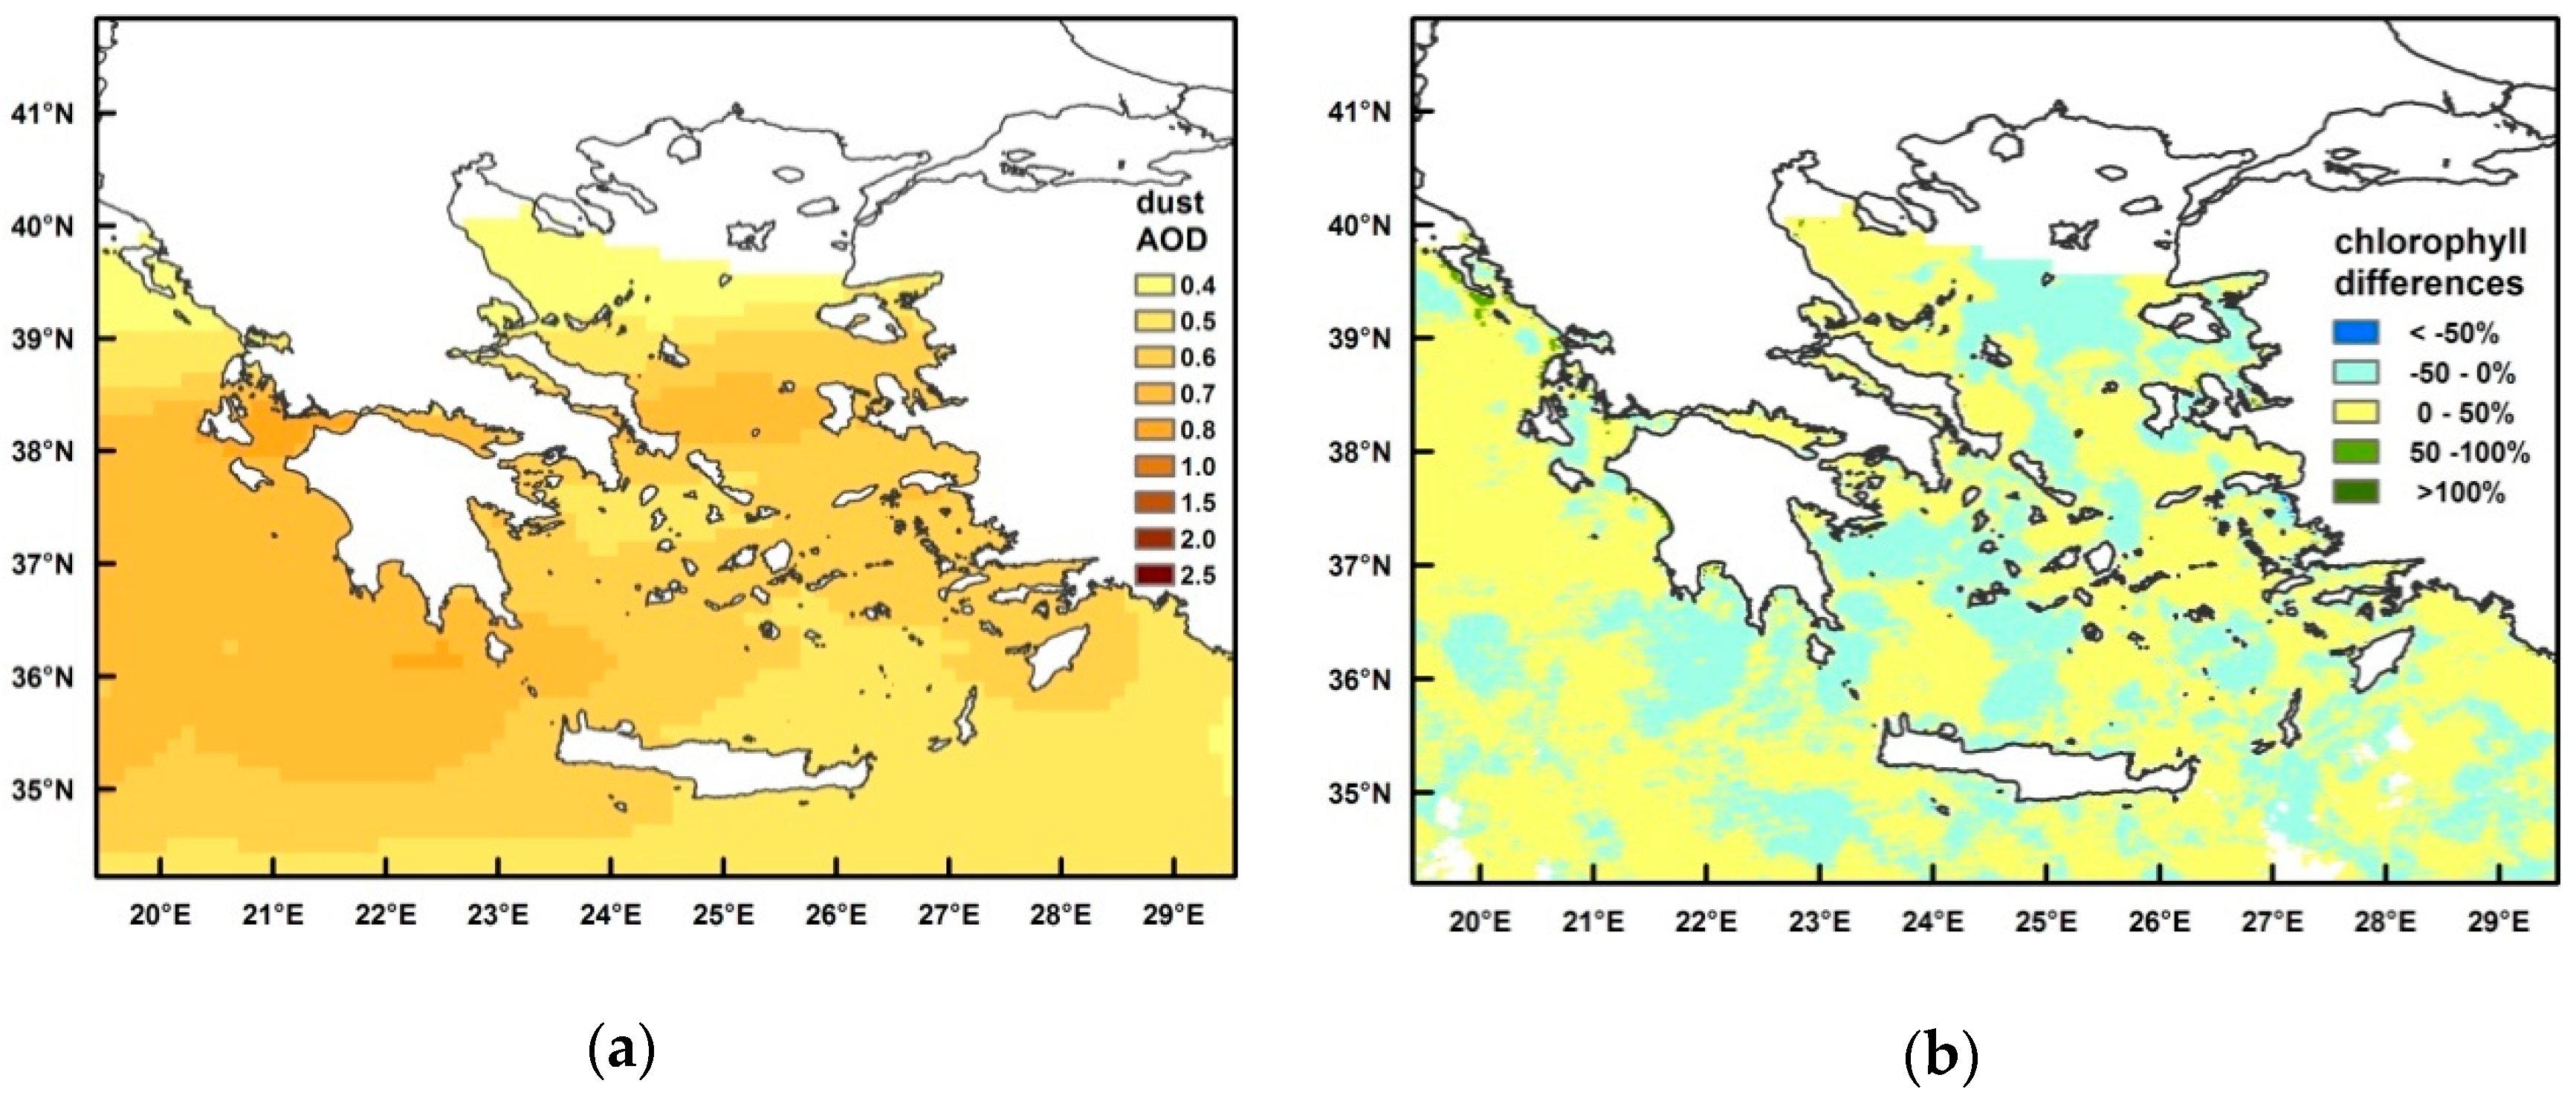
3.1. Heavy Rainfall and Dust: 25–28 March 2015

From 25 to 28 March 2015 an extreme weather event was recorded for Greece, with heavy rains and thunderstorms, gale southeasterlies that reached 9 Beaufort (Bf) over the Ionian and the S Aegean and 8 Bf over the N Aegean plus African dust transport over the country. The southern part of a highly meridional pattern at 500 hPa extending from north Europe down to Africa with cold air masses of −25 °C developed a cut-off low of 540 gpdm and a 1005 hPa surface depression southwest of Greece. This well-organized system moved north-eastwards affecting Greece with extreme weather and caused the dust transport. The event was mainly characterized by abnormal heavy rainfall regarding the season. Ending the episode, northerlies up to 7 Bf prevailed for one day overseas. The following week was characterized by low to moderate winds that at times reached 7 Bf only over the south parts, some local rains and a lot of shiny intervals. By the end of the week after the event, meteorological conditions were again favourable to dust transportation and southerlies reinforced to 8 Bf over the Aegean.
PM10 measurements gave maximum values of 112 μg/m3 for Patras and 123 μg/m3 for Attica region. It is noted that over the north-northwest part of the country, PM10 concentrations, compared to the AOD values, indicated a less strong episode. The maximum dust AOD during the episode and the chlorophyll percentage differences between the week that followed (30 March–6 April 2016) and the previous one (14–21 March 2016) are given in Figure 2, while chl-a concentrations of the week before the episode are shown in Figure S1. An increase in chlorophyll concentrations was recorded the week after the event in respect to the one before over the 59.9% of the region. The significant chl-a differences referred to the 7.7% of the data and were increases for the 94.4%, mainly over areas with low initial chl-a concentrations (as shown in Figure S1). It is noted that since precipitation was recorded over all areas, the above results account also for wet dust deposition. The mean chlorophyll concentration of the affected area was statistically significant higher after the event for both the above comparisons; over the area presenting absolute percentage chl-a differences above 50% this increase is larger.
The daily chlorophyll differences before and after the event were computed between 19 or 20 March—from 21 to 24 March AOD values implied the presence of some dust over the west and south parts—and 31 March or 1 April, that is, three or four days after the event. The chl-a percentage differences between 20 March and 31 March referred to the Ionian Sea (Figure S2a) and were increases for the 59.2% of the region, with the significant ones (7% of the data) being increases by 97.9%, not presenting large differences from the weekly calculations. Between 19 March and 1 April, the available data referred to the Aegean Sea and revealed an increase in chl-a over the 66.9% of the region, with the significant chlorophyll differences (15.5% of the data) being increases by 92.9% (Figure S2b). A quite larger area presenting significant chl-a increases was revealed in respect to the weekly differences, showing in addition that large temporal increases have taken place over the south-eastern part of the study area.
Over the area impacted by extreme rainfall as defined by the precipitation EFI, the weekly chlorophyll differences were increases for the 62.2% of the region, with the significant ones (9.5% of the data) being increases by 94.5% (Figure S3a,b). These results are quite similar to those for the whole area, since its greater part was affected by heavy rains. The area indicated by the wind EFI for extreme winds, presented an increase in chl-a over the 61.9%, with the significant chlorophyll differences referring to the 4.0% of the data and being increases by 98.1% (Figure S3c,d). It is noted that the latter area was also affected by extreme rainfall.
In all calculation cases more than 59.2% of the areas presented chlorophyll increases after the event and the significant chl-a differences—although limited to a maximum of 15.5% of the data—were increases at a percentage exceeding 92.9%. The above results imply that the dust episode could have had an impact on phytoplankton growth; however, it is difficult to disentangle between dust and extreme rainfall as favouring factors.

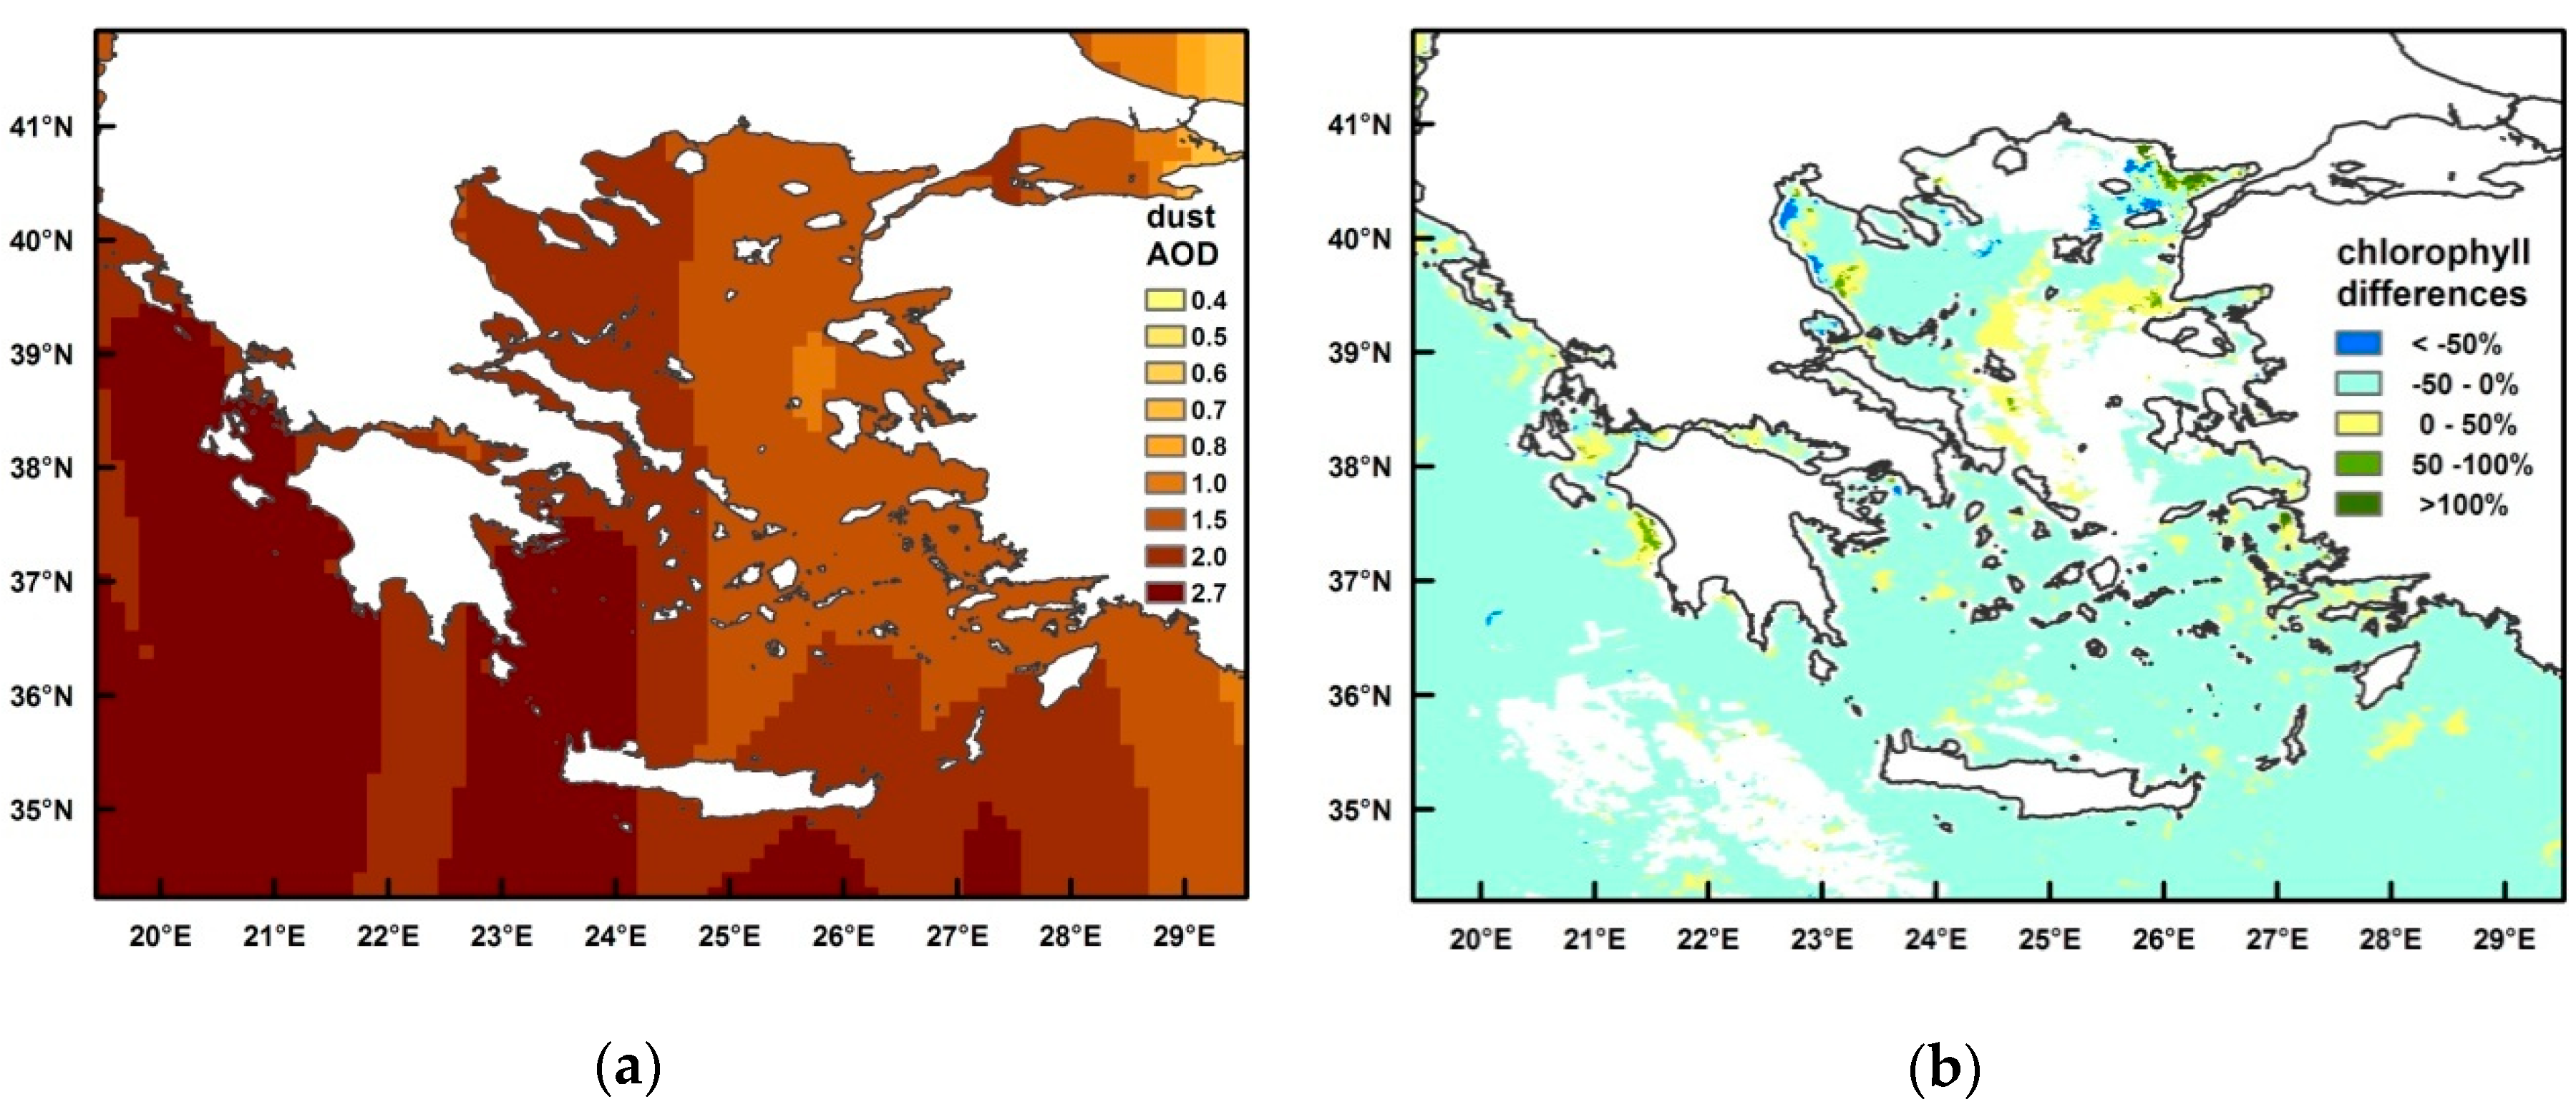
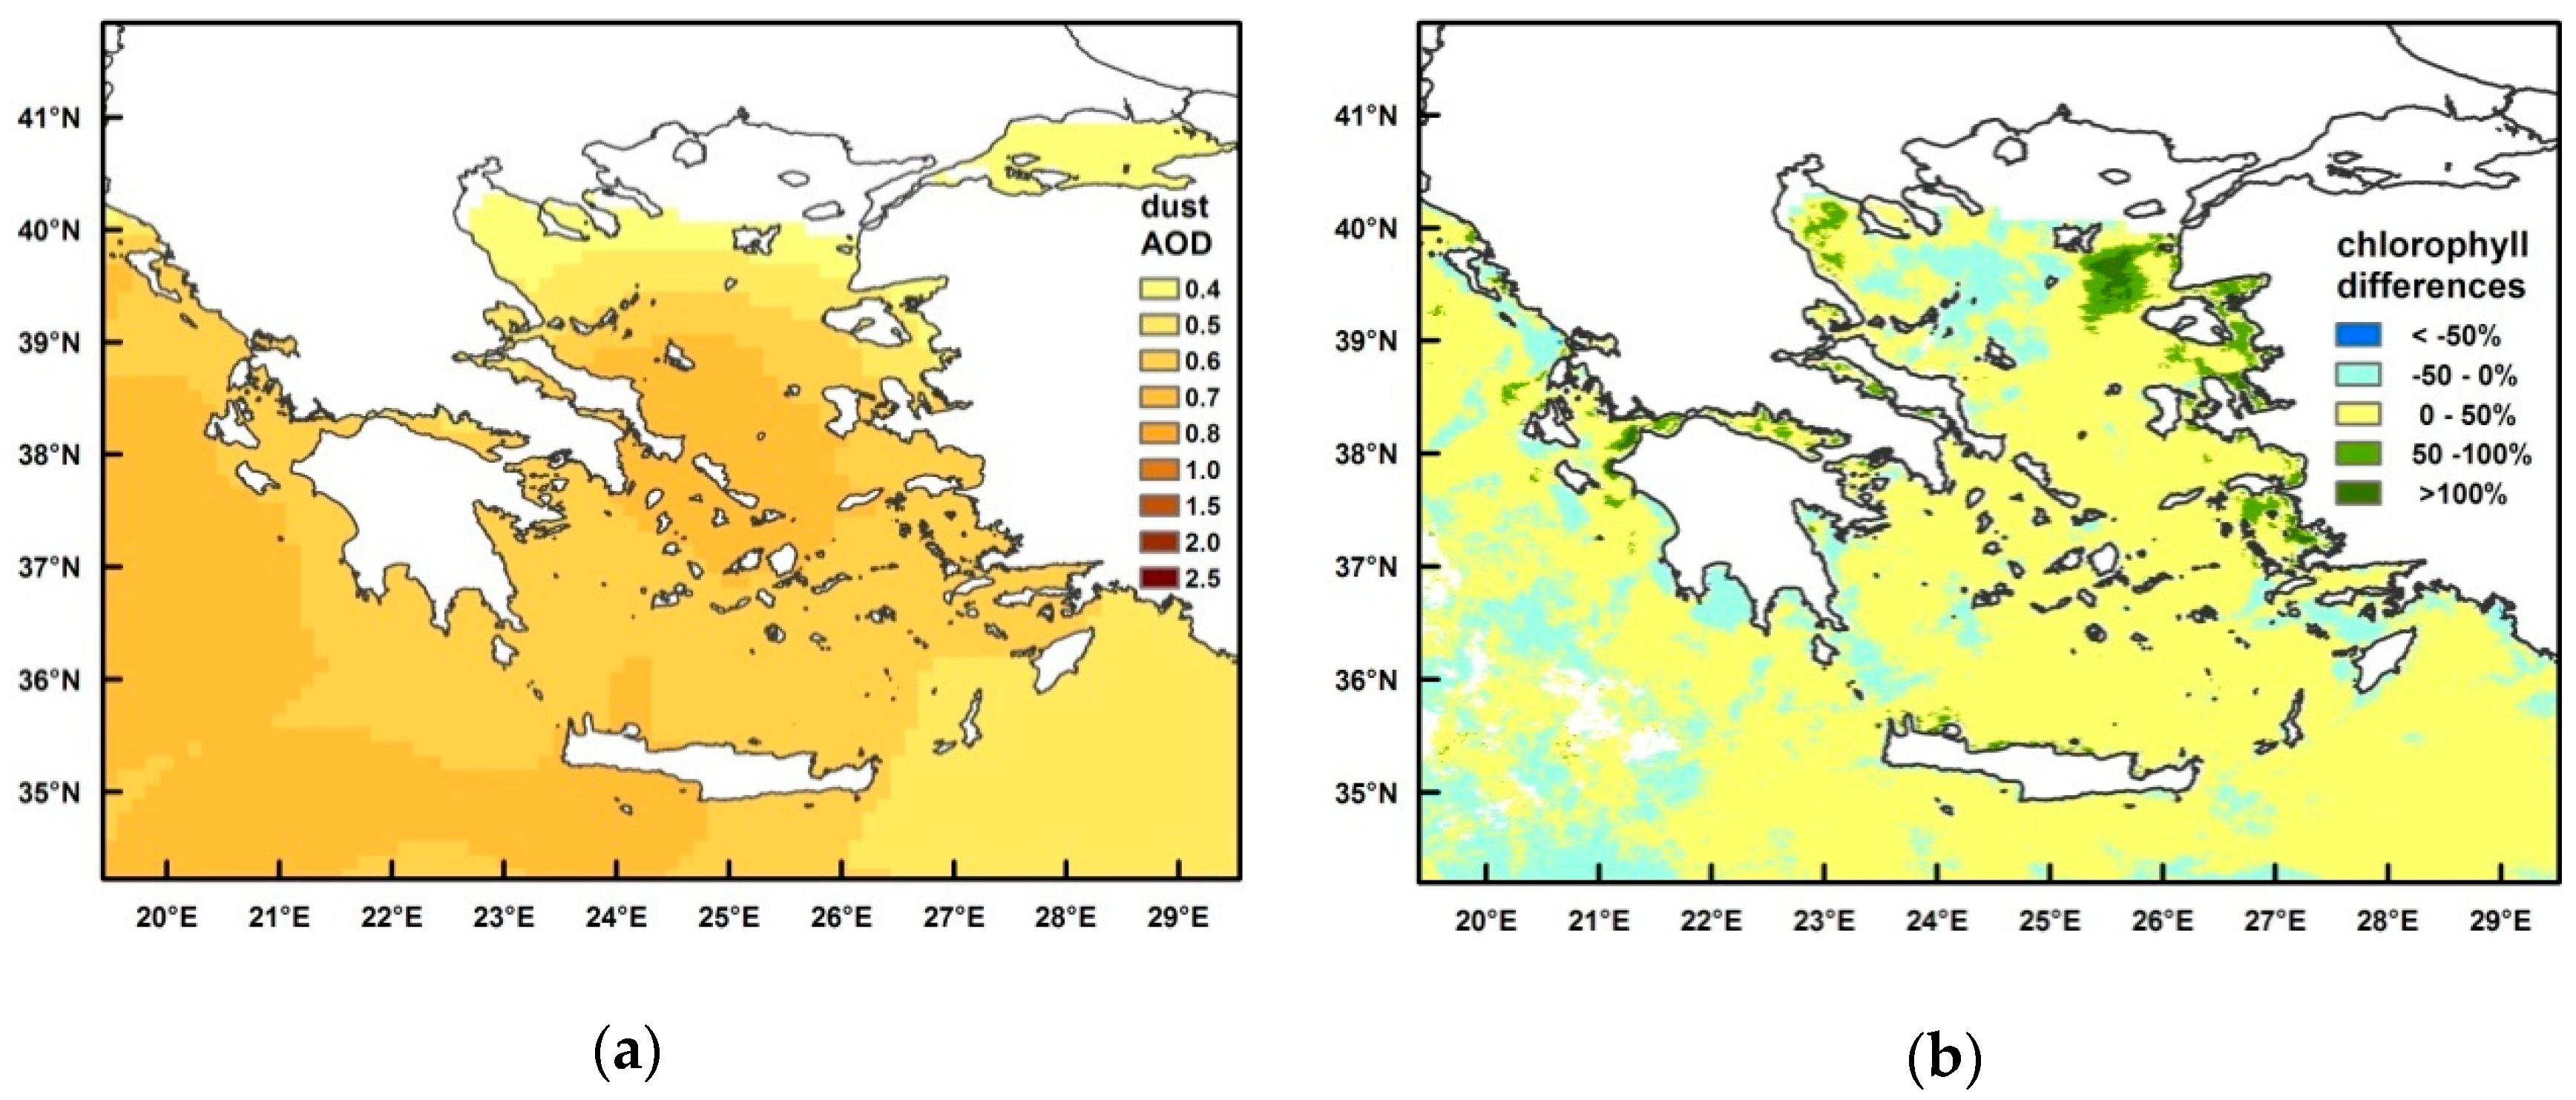
3.2. Strong Gale Winds and Large Amounts of Dust: 22–24 March 2016

A mid-level trough with SW-NE orientation, minimum height of 532 gpdm at 500 hPa and cold air masses (−25 °C) affected the study area. It developed an extended 995 hPa surface depression over NW Greece accompanied by a cold front that passed through the country, causing high impact weather. The dust transport episode initiated on 22 March together with south southeasterlies 7–8 Bf overseas and absence of rain. It continued up to 24 March with surface winds that over the Aegean reached 9 Bf with gusts up to 11 Bf and some rains and storms at places; the rainfall was of no particular intensity, except over the Ionian Sea—as far as marine areas were concerned—and the west and north mainland. Compared to the episode of March 2015, significant smaller precipitation amounts were recorded overseas and stronger southerlies prevailed especially over the Aegean Sea. The main characteristic of this event was the strong gale winds. Ending the episode north-northwesterlies (locally up to 7 Bf over the S Aegean) and unstable weather with some rains and storms prevailed. The following week was characterized by a lot shiny intervals and winds that locally reached 7 Bf over the Aegean for one day, that is, quite similar weather conditions with the ones of the corresponding week of the previous case examined.
During this dust episode, visibilities were reduced to 2 km and even lower on 23 March—according to HNMS station data—a rare phenomenon for Greece. The maximum values of PM10 concentrations recorded were: over Attica region 806 μg/m3; over west Greece 243 μg/m3 for Patras and 174 μg/m3 for Ioannina; over central mainland 94 μg/m3 for Livadeia, 79 μg/m3 for Lamia and 66 μg/m3 for Volos; over north Greece 132 μg/m3 for the Thessaloniki region. The above measurements denote an extended and extreme dust episode over the country, much stronger than the one previously examined.
In Figure 3 are shown the maximum dust AOD values during the event and the percentage chl-a differences of the week after the event (29 March–5 April 2016) in respect to the week before (13–20 March 2016); the initial chlorophyll concentrations of the week before the event are given in Figure S4a. An increase in chlorophyll was observed only over the 7.6% of the area, while the very few significant chl-a differences (0.9% of the data) were increases by 56.7%. For the region with precipitation, accounted as area of wet deposition (Figure S4b), the above percentages were quite higher: increases in chlorophyll cover the 11.1% of the area, the significant chl-a differences were the 1.7% of the data and were increases by 57.7%. Area’s chlorophyll means before and after the event were statistically significant different; however, they revealed a decrease when all data were considered and an increase when only the data referring to absolute chl-a differences above 50% were taken into account.
The above results, being controversial to the ones of the previous case, led to the calculation of the chlorophyll differences between several pairs of days before and after the event, in an effort to reveal possible temporal chlorophyll increases; all calculations were made under the condition of AOD <0.1. Although chlorophyll data were not available over wide areas, their differences between 20 and 28 plus 19 and 28 March—4 days after the event—and 19 and 30 plus 20 and 30 March—6 days after the event—were calculated. The analytical results (Figure S5a–d) are included in Table 1 of the discussion section. The maximum percentages were: chlorophyll increases for the 37.8% of the area between 19 and 28 March, significant chl-a differences for the 4.6% of the data between the same days and significant increases for the 68.6% of the data between 20 and 28 March. The latter revealed a wider region with increased chl-a values over the S Aegean than the weekly data, denoting a probable temporal increase although differences are not >50%.
Extreme rainfall impacted a small area of the Ionian Islands and coastal areas. For this area, chlorophyll increases covered the 19.2% and the significant chl-a differences were the 3.4% of the data with the 73.3% of them being increases (Figure S6a,b). The percentage of the area presenting an increase in chlorophyll was higher here but this fact can also be attributed to nutrients brought to the Ionian near coast sea area by heavy rains and/or river discharges. Extreme winds impacted almost all areas and the results were comparable to the ones of the weekly calculations (Figure S6c,d): chlorophyll increases for the 7.5% of the region, significant chl-a differences for the 0.9% and 58.4%.of them increases.
This very strong dust episode did not favour chlorophyll concentrations. Compared to the previous case examined that has possibly favoured phytoplankton growth, this dust event was more intense and characterized by stronger winds and lower precipitation.

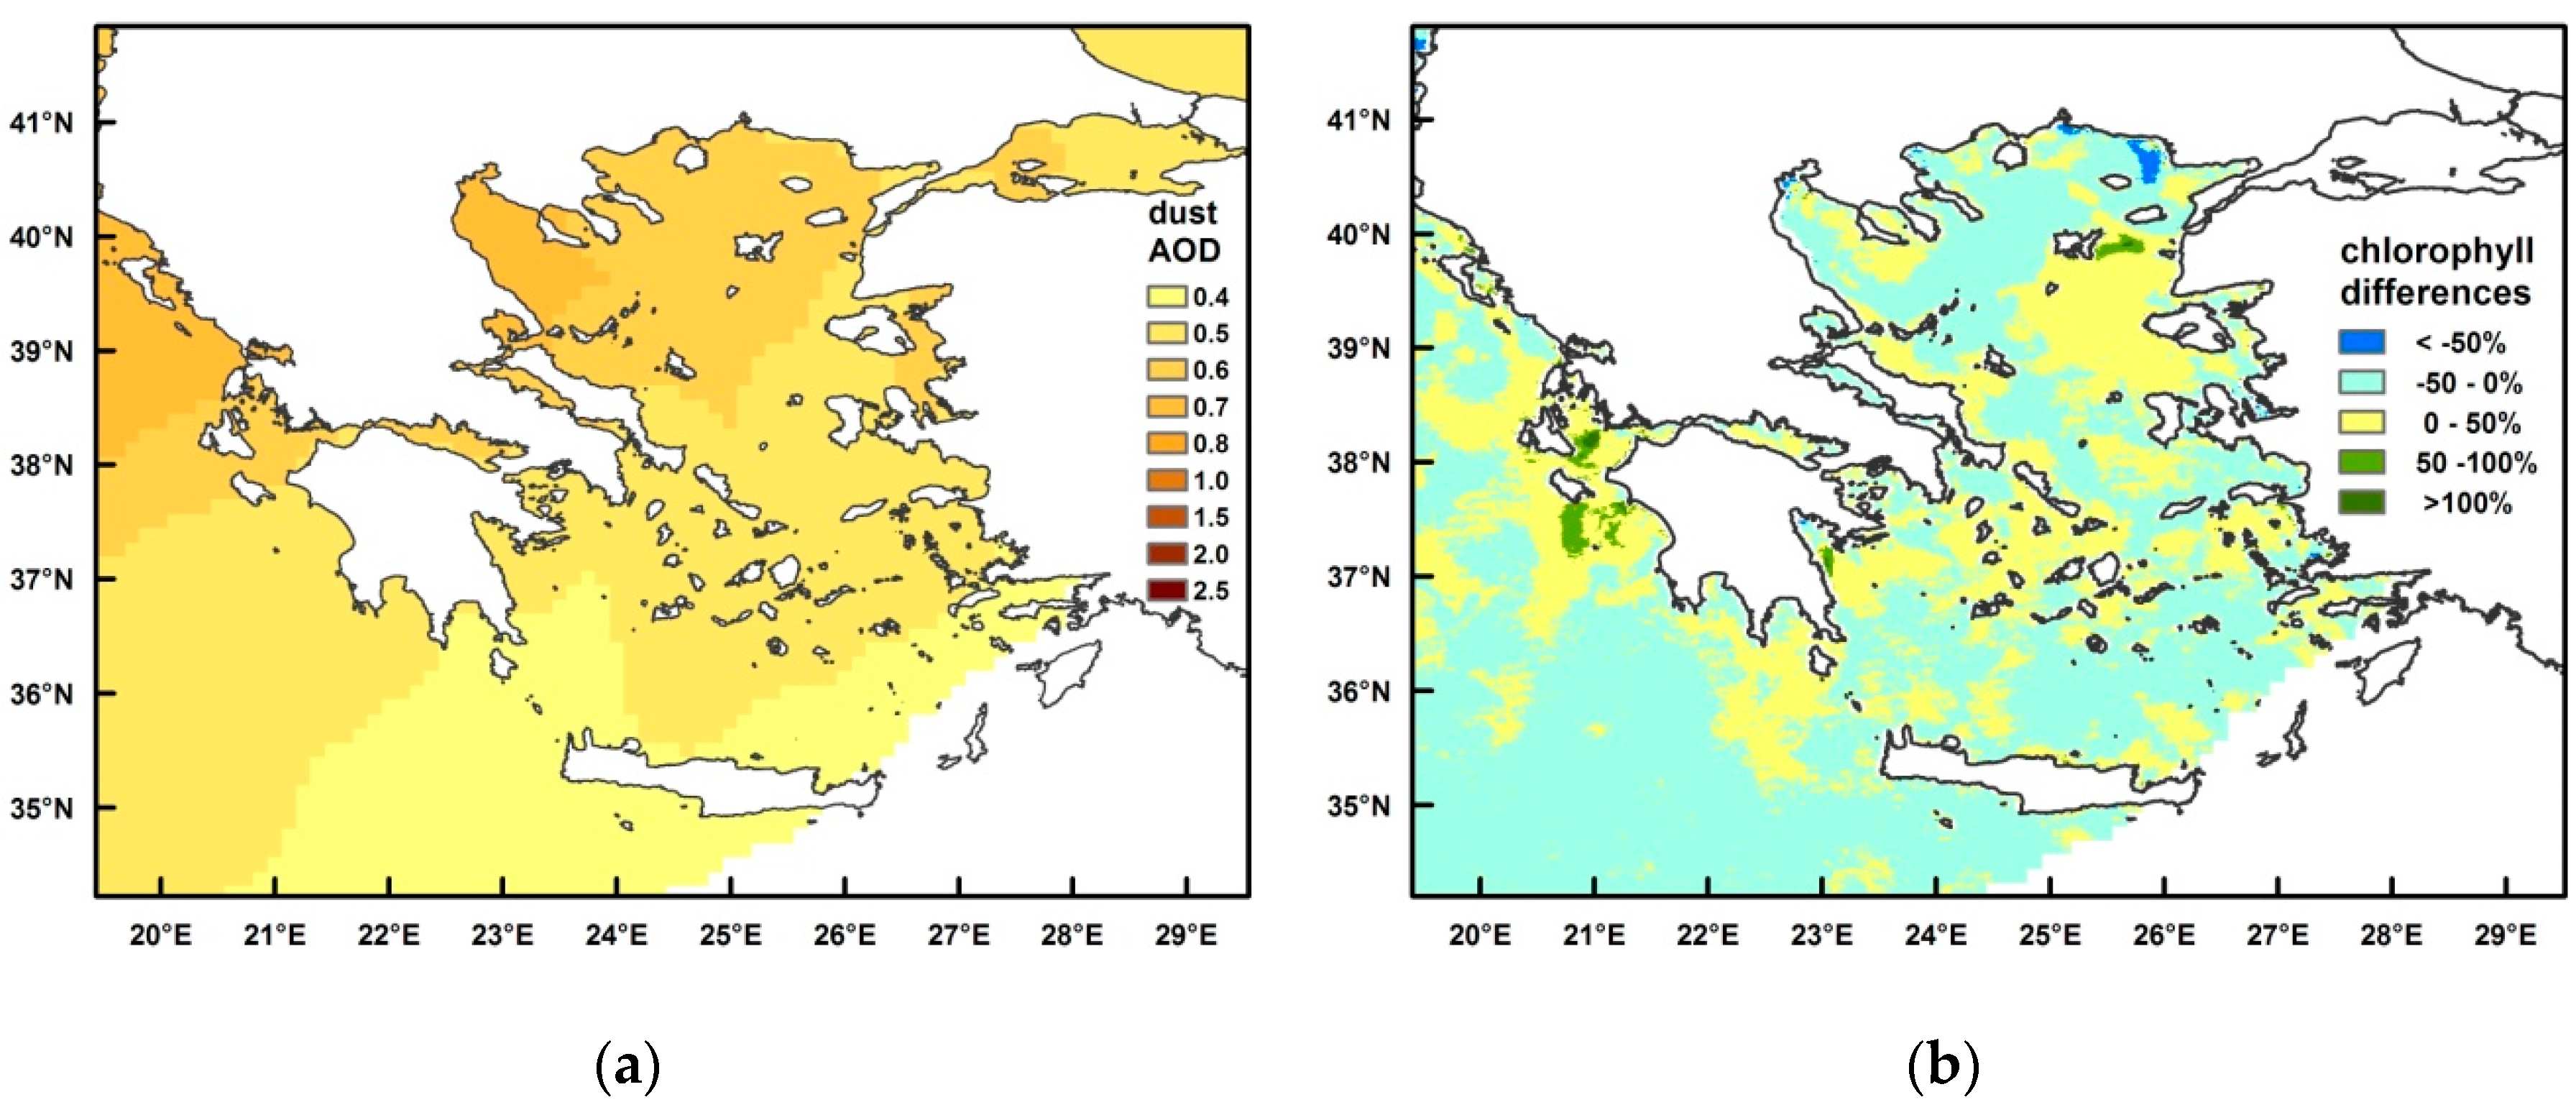
3.3. Early Summer Heat Wave and Dust: 18–21 June 2016

An extended 500 hPa ridge over Greece together with a thermal ridge at 850 hPa and a quite smooth surface pressure field causing light northerlies overseas depict the synoptic conditions of the 18–21 June 2016 dust event. A heat wave was recorded during this episode with temperatures up to 41 °C over mainland and 37 °C over islands. Before the event, the measured chlorophyll could have been positively influenced by winds from south directions that reached 6 Bf over the Ionian and 7 Bf over the Aegean plus some strong storms over the Ionian Sea. The dust episode and the heat wave ended by 21 June from the north part, with north winds reaching locally 6 Bf over the Ionian and 7 Bf over the Aegean Seas until 23 June.
The available PM10 data showed concentrations that reached 172 μg/m3 over Attica region, 79 μg/m3 over Thessaloniki region and 83 μg/m3 over Patras. The maximum dust AOD during the episode and the chlorophyll percentage differences of the weeks before (9–16 June 2016) and after (25 June–2 July 2016) the event are presented in Figure 4. The chl-a values of the week before the event and the chlorophyll differences for the area accounted for wet deposition are given in Figure S7a,b. The weekly chlorophyll differences showed increases for the 33.3% of the area, while the significant chl-a differences (1.6% of the data) were by 74.8% increases. The area of wet deposition was not an extended one and was characterized by higher percentages of chlorophyll increases (44.2% of the region) as well as of significant differences (4.8% of the data) and quite the same percentage of significant increases (74.2%); these results probably show a more favourable influence of wet deposition on chlorophyll concentrations. Comparing the chlorophyll means over the affected area before and after the event, the statistically significant results revealed a small decrease when all data were considered and a larger increase when the data corresponding to absolute percentage chl-a differences above 50% were used.
The daily chlorophyll differences, calculated between 16 and 24 June 2016—3 days after the event—referred to the Aegean and revealed a significant chlorophyll increase over its E-NE part (Figure S8) where the initial concentrations were quite low, that was not shown by the weekly data. The daily results presented a greater area of chlorophyll increases (51.3% of the region), as well as of significant chl-a differences (9.9% of the data) and increases (96.2%) than the weekly data, denoting that chlorophyll concentrations could have temporarily been favoured by the dust episode. At this time of year, chlorophyll is in a decreasing face and the marine environment is in general oligotrophic. Thus, the temporal character of the chl-a increase could be attributed to the quick phytoplankton consumption by the upper trophic levels. It is noted that although the wind intensity after the event was comparable to the one before, the strong northerlies, that prevailed over the Aegean Sea just after it, could have caused upwelling over the area presenting the significant chl-a increases revealed by the daily data. However, during the summer period the nutricline is deep and upwelling is not capable of importing nutrients to the surface layers [65,66].

3.4. Late Summer Heat Wave and Dust: 6–8 September 2015

A 500 hPa anticyclonic pattern, an 850 hPa ridge together with warm air masses from Africa and light to moderate northerlies overseas were the synoptic conditions of the 6–8 September 2015 episode that was accompanied by a heat wave. Although dust transport was favoured at higher altitudes in the atmosphere, it was already intense at 850 hPa. In most areas winds before and after the event did not vary significantly and some heavy rains were recorded over the N Aegean parts. The important to be noticed is the reinforcement of southerlies on 9 September (just after the event) over the Ionian to 6–7 Bf and over its western parts to 8–9 Bf and the heavy rains over this area from 9 to 11 September, that could have also affected positively the observed chl-a after the event.
PM10 data was very limited; however, over Attica region the concentration reached 69 μg/m3. In Figure 5 are shown the maximum dust AOD values during the episode and the percentage chlorophyll differences between the weeks before (29 August–5 September 2015) and after (14–21 September 2015) the event. The chl-a concentrations of the week before the event are presented in Figure S9a. The weekly chlorophyll differences were increases for the 66.1% of the area, with the significant ones—extremely limited to the 0.4% of the data—showing increase for the 95.0%. All the calculated percentages were higher for the small area of wet deposition (Figure S9b): chlorophyll increases over the 69.6% of the area with the significant chl-a differences, limited to the 0.5% of the data, being all increases. A possible important role of wet deposition is again implied though based on a very small amount of data. In all comparisons, the area-averaged chlorophyll values were statistically significant higher after the event; the increase was larger when only the data referring to significant differences were taken into account.
Daily chlorophyll differences (Figure S10) calculated between 4 and 12 September 2015—4 days after the event—showed less chlorophyll increases (18.7% of the area), more significant chl-a differences (3.5% of the data) and less significant increases (73.4%). In addition, they revealed a large part of the N Ionian Sea with chlorophyll increases even >100% that was not shown by the weekly data. However, this area was affected by heavy rains after the event and south winds were also reinforced. In consequence, the possible favouring factor for these significant chlorophyll increases cannot be determined. It is noted that extreme weather events this time of the year have been found to cause an increase in chl-a and sign the start of the chlorophyll increasing phase [67].

3.5. Fair Weather and Dust: 21–23 September 2014

An anticyclonic pattern at 500 hPa as well as at 850 hPa extended over the western central and southern parts of the country, with warm air masses and a smooth surface pressure field with light winds, were the synoptic weather conditions that favoured dust transport during 21–23 September 2014. Before the episode a few quite strong rains were recorded over the Ionian and the N Aegean Seas while northerlies reached at times 7 Bf locally over the Aegean. The episode ended with northerlies that temporarily reached 7–8 Bf over the Aegean and rainy weather over the north parts of the country. The days that followed—25 to 27 September—a 500 hPa trough affected the area, resulting in heavy rainfall and thunderstorms while gale winds prevailed the following days. The rains and thunderstorms together with the gale winds just after the episode could have also positively influenced the observed chlorophyll concentrations. Thus, the chlorophyll variations calculated for this episode could be very much affected by the prevailing weather conditions just after it.
PM10 concentration during the episode reached 87 μg/m3 over Attica region, 72 μg/m3 over Ioannina, 96 μg/m3 over Patras and 74 μg/m3 over Larissa. The maximum dust AOD during the episode and the chlorophyll percentage differences of the weeks before (30 September–7 October 2014) and after (14–21 September 2014) the events are shown in Figure 6. In Figure S11 are presented the chlorophyll concentrations of the week before the event and the weekly chlorophyll differences for the area accounted for wet deposition. The week that followed the event, chlorophyll presented an increase over the 80.0% of the region, with the significant chl-a differences (2.8% of the data) being by 99.1% increases. For the region accounted for wet deposition, which was a very limited one, the percentages were higher: increases in chlorophyll for the 87.8% of the area and the significant chl-a differences (8.8% of the data) were all increases. Similar to the previous case, the area-averaged chlorophyll values were statistically significant higher after the event in all comparisons; larger chlorophyll increases resulted from the data referring to significant differences.
The daily chlorophyll differences between 18 and 28 September (Figure S12) revealed significant increases over the south-eastern part of the study area, that were not shown by the weekly data. The 75.8% of the area presented an increase in chlorophyll and the significant chl-a differences (7.7% of the data) were by 98.7% increases.
The results here are quite supportive of the dust fertilizing role and especially the one of wet deposition; however, the weather conditions just after the event were also favourable for phytoplankton growth. It is noted that regardless the care taken for the selection of dust episodes not to be accompanied by strong rains and winds, it is very difficult such weather conditions not to be present before and after the dust events.

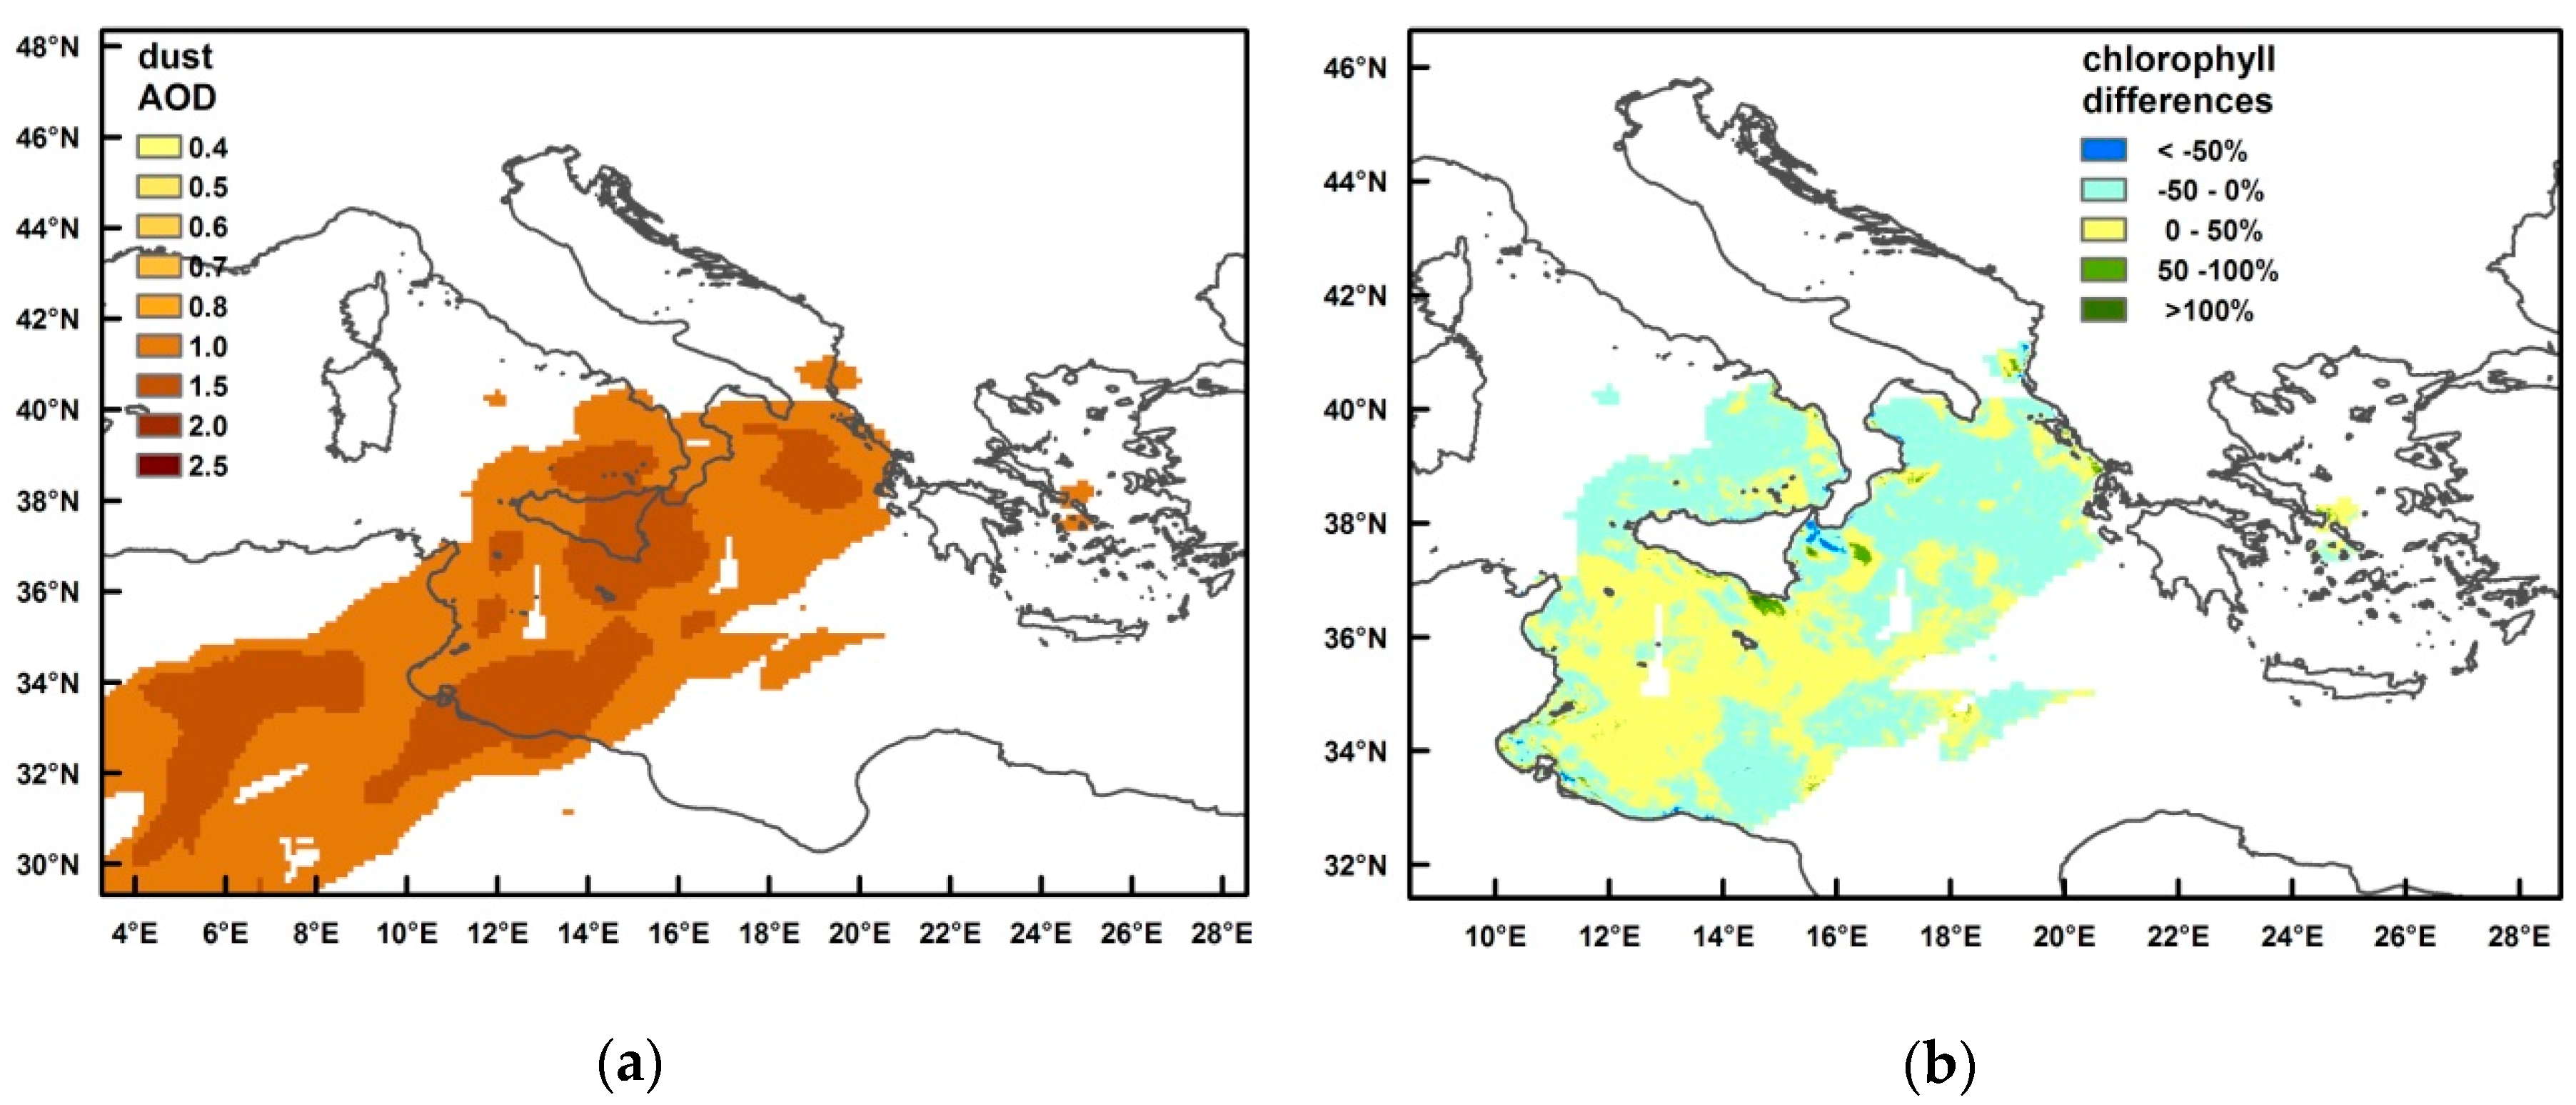
3.6. Dust over Central Mediterranean: 11–13 May 2017

The episode studied here is the one mentioned in the CAMS validation report as “Dust event over Tropical North Atlantic and Central Mediterranean: 9–12 May 2017”; it was characterized as a strong one and well captured by the model. The area studied was determined by dust AOD values >0.8 between 11 and 13 May 2017 when this strong dust episode affected the Central Mediterranean.
A strong NW flow at 500 hPa, an 850 hPa ridge with warm air masses and strong surface southerlies characterized the episode and favoured dust transport through lower and higher atmospheric levels. The week before the event, winds locally reached 7 Bf for one or two days and some rains were recorded over the Ionian Sea. During the episode southerlies 7–8 Bf prevailed over the study area and precipitation was recorded almost everywhere. The week that followed was quite rainy over the north parts and winds reached locally 7 Bf for one day. It is noted that the wind reinforcement during the event could have also affected positively chlorophyll concentrations.
The examined area of dust AOD >0.8 and the chlorophyll percentage differences between the weeks before (1–8 May 2017) and after the event (17–24 May 2017) are shown in Figure 7; the chl-a concentrations of the week before are presented in Figure S13a. The weekly chlorophyll differences were increases for the 44.4% of the area and the significant chl-a differences (limited to the 1.4% of the data) were by 74.9% increases. Wet deposition characterized the major part of the area where a chlorophyll increase was recorded over the 47.0% and the significant chl-a differences (1.8% of the data) were increases by 74.7% (Figure S13b). It is noted that the areas with lower initial chl-a concentrations mainly presented increases. The area’s mean chl-a concentration was statistically significant different after the event only for the data referring to absolute chlorophyll differences above 50% and revealed an increase.
For proving that dust can positively affect phytoplankton growth, more pronounced chlorophyll increases would have been expected after such an extreme event. Only based on the significant chlorophyll differences—that were area limited—one can argue in favour of the fertilizing dust effect.

4. Discussion and Conclusions

The results of the study are summarized in Table 1.
The two March’s events that were also extreme weather events gave contradictory results and made clear that no safe conclusion can be drawn when other favouring factors such as strong winds and heavy rains are involved, although all of them could have led to chlorophyll increases. The most extreme dust episode of March 2016, characterized by strong gale winds and limited heavy rainfall, did not favour chlorophyll concentrations which presented a decrease over large areas. Significant chl-a differences (a small amount of the data) presented increases over wider areas only in two cases: over the 73.3% of the area of extreme rainfall—that being a coastal one could have also been affected by river discharges—and over the 68.6% of the area as revealed through the daily calculations. Contradictory results were extracted from the March 2015 episode, characterized mainly by extreme rainfall, where the area presenting chl-a increases was larger than the one of decreases and the significant chlorophyll differences (up to 15.5% of the data) were increases at least by 92.9%. Although during these dust events, there were also other meteorological factors (winds and rainfall) that could have favoured primary production, chlorophyll did not increase after the stronger dust episode of March 2016. It is noted that for the Eastern Mediterranean Sea the lower chlorophyll responses to large dust addition events have been found [33]. In the same study [33], chlorophyll peaks were temporary even after very large dust events, while a slight chlorophyll decrease was found for two events; in addition, no pattern of larger amount of dust leading to greater chlorophyll increases was observed. For this area and this period of the year, when chlorophyll concentrations over the Hellenic Seas have elevated values, only a few positive correlations between chlorophyll concentration and dust deposition were found and concern the N Ionian Sea [57]. It is noted that the MLD is the deepest in March at least for the Aegean [24]; it is possible that under the enhanced mixing induced of the strong gale winds of the March 2016 episode, nutrients were quickly scattered through the deep mixed layer and their effects on surface waters could not be seen. It is also possible that nutrients from dust, compared to the available ones from the deeper layers, can rather cause unimportant increases at this time of the year. On the other hand, in an experimental study, dust accompanied by high winds (turbulence) was likely to stronger affect phytoplankton [39]. One, arguing in favour of the dust fertilizing effect, could propose as an explanation for the non-increased chlorophyll after the stronger event, that the environment had become Fe limited; evidences found in the study of [68] denoted that large dust deposition events may sink the surface dissolved iron. In any case, during these episodes there were also strong winds and rainfall and their effects cannot be disentangled from the ones of dust.
For the early summer heat wave and dust episode of June 2016, only by the significant chlorophyll differences (again a limited amount of data) being increases by more than 74.2% can be assumed a possible favourable influence of dust. It is noted that daily differences revealed a quite larger area (9.9%) of differences >50% that were by 96.2% increases, including areas not shown by the weekly data. In the ultraoligotrophic and stratified June environment with low chlorophyll concentrations in a further decreasing phase, when dust nutrients are supposed to have a dominant role, the increased primary production is expected to be quickly transferred to upper trophic levels. Thus, it is possible that temporal chlorophyll increases could not be seen neither in the weekly differences nor in the examined daily differences. It is noted that statistically significant correlations between dust deposition and chlorophyll concentration have been found for the area for the April-June period [57]. Two September dust episodes were studied here, the late summer heat wave of September 2015 and the fair weather one of September 2014; the latter’s results are very much “contaminated” by the weather conditions that followed. For both, the chlorophyll differences were for most areas increases, with the significant ones being almost all increases and for the limited areas of wet deposition all increases. Since in September the quite low chlorophyll concentrations of the area are in an increasing phase and the end of the stratification period begins, it is easier for the marine environment to sustain the increased primary production. A more favouring effect of wet deposition can be implied by the increase of both the percentages of the chlorophyll’s significant differences and the significant increases, as in other studies [46]. For the July-September period, a relevant statistical analysis did not result in significant correlations between chlorophyll and dust for the region [57]. It is also noted that in the oligotrophic environment of the Eastern Mediterranean, bacteria can be firstly favoured by the dust nutrients [42,69] and that the area is at times subject to air pollutants that can inhibit phytoplankton growth [69].
For the strong dust episode of May 2017 over the Central Mediterranean Sea, only the area-limited significant chlorophyll differences were by 74.9% increases, while these increases could also be attributed to the gale southerlies during the event. It is noted that the area was found to present significant positive relationships between chlorophyll concentrations and dust deposition for this time of the year [57] and in May presents quite low chlorophyll values in a decreasing phase.
Comparing the chlorophyll differences found before and after the dust events studied, no safe conclusion can be drawn, since increases as well as decreases were both present. A more favouring role of wet dust deposition was implied by the heavy rainfall March event and the June-September episodes. The significant chl-a differences for all cases were in high percentages increases (above 74.2% of the data if the very extreme dust episode of March 2016 is excluded). However, these significant differences corresponded, again for all cases, to a small amount of data (maximum 15.5% and in majority much smaller. A possible favouring effect of dust on chlorophyll could be assumed from the five out of six events and only by the significant differences; the two heat wave and dust episodes of September 2015 and June 2016 stronger support this outcome. Since there are studies suggesting that chlorophyll variations due to dust events even of moderate strength can hardly be detected from satellite observations [42,70], maybe one should trust these significant chlorophyll differences. It is also noted that for the area presenting absolute chlorophyll differences above 50%, the weekly mean chl-a concentration after the events was statistically significantly higher than the one before in all cases (Table 1). However, some of these significant increases could be also related to other factors favouring phytoplankton growth, such as strong winds and heavy rainfall. Even if the studied episodes of the June-September period were carefully selected in order other favouring meteorological conditions for phytoplankton growth to be excluded, this could not be completely achieved especially regarding the weather conditions that followed the September 2014 event. The method followed here could be applied in any region for examining the influence of dust on primary production. Since there are difficulties in discriminating between the influence of dust and of other meteorological factors, the results would be safer for regions or time periods characterized by more stable weather conditions. Statistical methods applied in long time-series of dust plus wind and precipitation data are rather more suitable for disentangling the influence of these factors on chlorophyll concentrations.
The work presented here was an effort to explore the possible influence of desert dust on marine chlorophyll concentrations through the study of specific dust events. According to authors’ knowledge, it is the first time that such a study is conducted for the Hellenic Seas. The prevailing weather before-during and after the events was taken into account and emphasis was given to the meteorological factors of wind and precipitation that can also lead to chlorophyll increases. The results showed both sign—positive and negative—chlorophyll variations; nevertheless, when based on the area-limited significant chlorophyll differences, one could argue in favour of the “dust fertilization effect” mainly during the low productive period. The study revealed also the difficulty in discriminating between dust and other meteorological factors favouring phytoplankton growth and reach safe conclusions. The possible fertilizing effect of dust remains a questionable matter as discussed in the introduction section and as revealed from the present study of specific events.

Supplementary Materials

The following are available online at https://www.mdpi.com/2077-1312/7/2/50/s1, Figure S1: Chl-a concentrations of the week before the event of 25–28 March 2015, Figure S2: Daily chlorophyll % differences between: (a) 20 and 31 March 2015; (b) 19 March and 1 April 2015, Figure S3: For the episode of 25–28 March 2015: (a) maximum values of precipitation EFI during the episode; (b) weekly chlorophyll % differences over the area of extreme rainfall as defined by EFI; (c) same as (a) for wind EFI; (d) same as (b) over the area of extreme wind; Figure S4: (a) Chl-a concentrations of the week before the event of 22–24 March 2016; (b) chl-a % differences between the weeks before (13–20 March 2016) and after (29 March–5 April 2016) the event for the area of wet deposition; Figure S5: Daily chlorophyll % differences between: (a) 20 and 28 March 2016; (b) 19 and 28 March 2016; (c) 19 and 30 March 2016; (d) 20 and 30 March 2016, Figure S6: For the episode of 22–24 March 2016: a) maximum values of precipitation EFI during the episode; (b) weekly chlorophyll % differences over the area of extreme rainfall as defined by EFI; (c) same as (a) for wind EFI; (d) same as (b) over the area of extreme wind, Figure S7: (a) Chl-a concentrations of the week before the event of 18–21 June 2016; (b) chl-a % differences between the weeks before (9–16 June 2016) and after (25 June–2 July 2016) the event for the area of wet deposition, Figure S8: Daily chlorophyll % differences between 16 and 24 June 2016, Figure S9: (a) Chl-a concentrations of the week before the event of 6–8 September 2015; (b) chl-a % differences between the weeks before (29 August–5 September 2015) and after (14–21 September 2015) the event for the area of wet deposition, Figure S10: Daily chlorophyll % differences between 4 and 12 September 2015, Figure S11: (a) Chl-a concentrations of the week before the event of 21–23 September 2014; (b) chl-a % differences between the weeks before (14–21 September 2014) and after (30 September–7 October 2014) the event for the area of wet deposition, Figure S12: Daily chlorophyll % differences between 18 and 28 September 2014, Figure S13: (a) Chl-a concentrations of the week before the event of 11–13 May 2017; (b) chl-a % differences between the weeks before (1–8 May 2017) and after (17–24 May 2017) the event for the area of wet deposition.

Author Contributions

Conceptualization, Dionysia Kotta; Data curation, Dionysia Kotta; Formal analysis, Dionysia Kotta; Investigation, Dionysia Kotta; Methodology, Dionysia Kotta; Project administration, Dionysia Kotta and Dimitra Kitsiou; Resources, Dionysia Kotta; Supervision, Dionysia Kotta and Dimitra Kitsiou; Validation, Dionysia Kotta and Dimitra Kitsiou; Visualization, Dionysia Kotta; Writing—original draft, Dionysia Kotta; Writing—review & editing, Dionysia Kotta and Dimitra Kitsiou.

Funding

This research received no external funding.

Acknowledgments

ECMWF, Copernicus Marine Environment Monitoring Service, Copernicus Atmosphere Monitoring Service, Greek Ministry of Environment and Energy and HNMS are acknowledged for the data. It is also noted that part of the analyses and visualizations for precipitation were produced with the Giovanni online data system, developed and maintained by the NASA GES DISC.

Conflicts of Interest

The authors declare no conflict of interest.

References

  1. Behrenfeld, M.J.; Randerson, J.T.; McClain, C.R.; Feldman, G.C.; Los, S.; Tucker, C.; Falkowski, P.G.; Field, C.B.; Frouin, R.; Esaias, W.; et al. Biospheric primary production during an ENSO transition. Science 2001, 291, 2594–2597. [Google Scholar] [CrossRef] [PubMed]
  2. Raven, J.A.; Evans, M.C.W.; Korb, R.E. The role of trace metals in photosynthetic electron transport in O2-evolving organisms. Photosyn. Res. 1999, 60, 111–149. [Google Scholar] [CrossRef]
  3. Duce, R.A.; Tindale, N.W. Atmospheric transport of iron and its deposition in the ocean. Limnol. Oceanogr. 1991, 36, 1715–1726. [Google Scholar] [CrossRef] [Green Version]
  4. Jickells, T.D.; An, Z.S.; Andersen, K.K.; Baker, A.R.; Bergametti, G.; Brooks, N.; Cao, J.J.; Boyd, P.W.; Duce, R.A.; Hunter, K.A.; et al. Global Iron Connections Between Desert Dust, Ocean Biogeochemistry and Climate. Science 2005, 308, 67–71. [Google Scholar] [CrossRef] [PubMed]
  5. Mahowald, N.; Jickells, T.D.; Baker, A.R.; Artaxo, P.; Benitez-Nelson, C.R.; Bergametti, G.; Bond, T.C.; Chen, Y.; Cohen, D.D.; Herut, B.; et al. Global distribution of atmospheric phosphorus sources, concentrations and deposition rates, and anthropogenic impacts. Glob. Biogeochem. Cycles 2008, 22, GB4026. [Google Scholar] [CrossRef]
  6. Martin, J.H.; Fitzwater, S.E. Iron deficiency limits phytoplankton growth in the northeast Pacific subarctic. Nature 1988, 331, 341–343. [Google Scholar] [CrossRef]
  7. Martin, J.H. Glacial-interglacial CO2 change: The iron hypothesis. Paleoceanography 1990, 5, 1–13. [Google Scholar] [CrossRef]
  8. Martin, J.H.; Coale, K.H.; Johnson, K.S.; Fitzwater, S.E.; Gordon, R.M.; Tanner, S.J.; Hunter, C.N.; Elrod, V.A.; Nowicki, J.L.; Coley, T.L.; et al. Testing the iron hypothesis in ecosystems of the equatorial Pacific Ocean. Nature 1994, 371, 123–129. [Google Scholar] [CrossRef] [Green Version]
  9. Coale, K.H.; Johnson, K.S.; Fitzwater, S.E.; Gordon, R.M.; Tanner, S.; Chavez, F.P.; Ferioli, L.; Sakamoto, C.; Rogers, P.; Millero, F.; et al. A massive phytoplankton bloom induced by an ecosystem-scale iron fertilization experiment in the equatorial Pacific Ocean. Nature 1996, 383, 495–501. [Google Scholar] [CrossRef]
  10. de Baar, H.J.W.; Boyd, P.W.; Coale, K.H.; Landry, M.R.; Tsuda, A.; Assmy, P.; Bakker, D.C.E.; Bozec, Y.; Barber, R.T.; Brzezinski, M.A.; et al. Synthesis of iron fertilization experiments: From the Iron Age in the Age of Enlightenment. J. Geophys. Res. 2005, 110, C09S16. [Google Scholar] [CrossRef]
  11. Boyd, P.W.; Jickells, T.D.; Law, C.S.; Blain, S.; Boyle, E.A.; Buesseler, K.O.; Coale, K.H.; Cullen, J.J.; de Baar, H.J.W.; Follows, M.; et al. Mesoscale iron enrichment experiments 1993–2005: Synthesis and future directions. Science 2007, 315, 612–617. [Google Scholar] [CrossRef] [PubMed]
  12. Watson, A.; Bakker, D.; Ridgwell, A.; Boyd, P.; Law, C. Effect of iron suplly on Southern Ocean CO2 uptake and implications for glacial atmospheric CO2. Nature 2000, 407, 730–733. [Google Scholar] [CrossRef] [PubMed]
  13. Longhurst, A. Seasonal cycles of pelagic production and consumption. Prog. Oceanogr. 1995, 36, 77–167. [Google Scholar] [CrossRef]
  14. Mills, M.M.; Ridame, C.; Davey, M.; LaRoche, J.; Geider, R.J. Iron and phosphorous co-limit nitrogen fixation in the eastern tropical North Atlantic. Nature 2004, 429, 292–294. [Google Scholar] [CrossRef] [PubMed]
  15. Aumont, O.; Maier-Reimer, E.; Blain, S.; Monfray, P. An ecosystem model of the global ocean including Fe, Si, P colimitations. Glob. Biogeochem. Cycles 2003, 17, 1060. [Google Scholar] [CrossRef]
  16. Moore, J.K.; Doney, S.C.; Lindsay, K. Upper ocean ecosystem dynamics and iron cycling in a global three-dimensional model. Glob. Biogeochem. Cycles 2004, 18, GB4028. [Google Scholar] [CrossRef]
  17. Aumont, O.; Bopp, L.; Schulz, M. What does temporal variability in aeolian dust deposition contribute to sea-surface iron and chlorophyll distributions? Geophys. Res. Lett. 2008, 35, L07607. [Google Scholar] [CrossRef]
  18. Blain, S.; Guieu, C.; Claustre, H.; Leblanc, K.; Moutin, T.; Quèguiner, B.; Ras, J.; Sarthou, G. Availability of iron and major nutrients for phytoplankton in the northeast Atlantic Ocean. Limnol. Oceanogr. 2004, 49, 2095–2104. [Google Scholar] [CrossRef] [Green Version]
  19. Moore, C.M.; Mills, M.M.; Langlois, R.; Milne, A.; Achterger, E.P.; LaRoche, J.; Geider, R.J. Relative influence of nitrogen and phosphorus availability on phytoplankton physiology and productivity in the oligotrophic sub-tropical North Atlantic Ocean. Limnol. Oceanogr. 2008, 53, 291–305. [Google Scholar] [CrossRef]
  20. Marañón, E.; Fernández, A.; Mouriño-Carballido, B.; Martínez-García, S. Degree of oligotrophy controls the response of microbial plankton to Saharan dust. Limnol. Oceanogr. 2010, 55, 2339–2352. [Google Scholar] [CrossRef] [Green Version]
  21. Barale, V.; Jaquet, J.M.; Ndiaye, M. Algal blooming patterns and anomalies in the Mediterranean Sea as derived from the SeaWiFS data set (1998–2003). Remote Sens. Environ. 2008, 112, 3300–3313. [Google Scholar] [CrossRef]
  22. D’Ortenzio, F.; Ribera D’Alcalà, M. On the trophic regimes of the Mediterranean Sea: A satellite analysis. Biogeosciences 2009, 6, 139–148. [Google Scholar] [CrossRef]
  23. Volpe, G.; Nardelli, B.B.; Cipollini, P.; Santoleri, R.; Robinson, I.S. Seasonal to interannual phytoplankton response to physical processes in the Mediterranean Sea from satellite observations. Remote Sens. Environ. 2012, 117, 223–235. [Google Scholar] [CrossRef]
  24. D’Ortenzio, F.; Ludicone, D.; de Boyer Montegut, C.; Testor, P.; Antoine, D.; Marullo, S.; Santoleri, R.; Madec, G. Seasonal variability of the mixed layer depth in the Mediterranean Sea as derived from in situ profiles. Geophys. Res. Lett. 2005, 32, L12605. [Google Scholar] [CrossRef]
  25. Krom, M.D.; Kress, N.; Brenner, S.; Gordon, L.I. Phosphorus limitation of primary productivity in the eastern Mediterranean Sea. Limnol. Oceanogr. 1991, 36, 424–432. [Google Scholar] [CrossRef] [Green Version]
  26. Krom, M.D.; Herut, B.; Mantoura, R.F.C. Nutrient budget for the Eastern Mediterranean: Implications for P limitation. Limnol. Oceanogr. 2004, 49, 1582–1592. [Google Scholar] [CrossRef]
  27. Bosc, E.; Bricaud, A.; Antoine, D. Seasonal and interannual variability in algal biomass and primary production in the Mediterranean Sea, as derived from 4 years of SeaWIFS observations. Glob. Biogeochem. Cycles 2004, 18, GB1005. [Google Scholar] [CrossRef]
  28. Pujo-Pay, M.; Conan, P.; Oriol, L.; Cornet-Barthaux, V.; Falco, C.; Ghiglione, J.F.; Goyet, C.; Moutin, T.; Prieur, L. Integrated survey of elemental stoichiometry (C, N, P) from the western to eastern Mediterranean Sea. Biogeosciences 2011, 8, 883–899. [Google Scholar] [CrossRef] [Green Version]
  29. Antoine, D.; Nobileau, D. Recent increase of Saharan dust transport over the Mediterranean Sea, as revealed from ocean color satellite (SeaWiFS) observations. J. Geophys. Res. Atmos. 2006, 111, D12214. [Google Scholar] [CrossRef]
  30. Engelstaedter, S.; Tegen, I.; Washington, R. North African dust emissions and transport. Earth-Sci. Rev. 2006, 79, 73–100. [Google Scholar] [CrossRef]
  31. Guerzoni, S.; Chester, R.; Dulac, F.; Herut, B.; Loÿe-Pilot, M.D.; Measures, C.; Migon, C.; Molinaroli, E.; Moulin, C.; Rossini, P.; et al. The role of atmospheric deposition in the biogeochemistry of the Mediterranean Sea. Prog. Oceanogr. 1999, 44, 147–190. [Google Scholar] [CrossRef] [Green Version]
  32. Alpert, P.; Kishcha, P.; Shtivelman, A.; Krichak, S.O.; Joseph, J.H. Vertical distribution of Saharan dust based on 2.5-year model predictions. Atmos. Res. 2004, 70, 109–130. [Google Scholar] [CrossRef]
  33. Gallisai, R.; Volpe, G.; Peters, F. Large Saharan dust storms: Implications for chlorophyll dynamics in the Mediterranean Sea. Glob. Biogeochem. Cycles 2016, 30. [Google Scholar] [CrossRef]
  34. Pey, J.; Querol, X.; Alastuey, A.; Forastiere, F.; Stafoggia, M. African dust outbreaks over the Mediterranean Basin during 2001–2011: PM10 concentrations, phenomenology and trends, and its relation with synoptic and mesoscale meteorology. Atmos. Chem. Phys. 2013, 13, 1395–1410. [Google Scholar] [CrossRef] [Green Version]
  35. Bonnet, S.; Guieu, C.; Chiaverini, J.; Ras, J.; Stock, A. Effect of atmospheric nutrients on the autotrophic communities in a low nutrient, low chlorophyll system. Limnol. Oceanogr. 2005, 50, 1810–1819. [Google Scholar] [CrossRef] [Green Version]
  36. Pulido-Villena, E.; Baudoux, A.C.; Obernosterer, I.; Landa, M.; Caparros, J.; Catala, P.; Georges, C.; Harmand, J.; Guieu, C. Microbial food web dynamics in response to a Saharan dust event: Results from a mesocosm study in the oligotrophic Mediterranean Sea. Biogeosciences 2014, 11, 337–371. [Google Scholar] [CrossRef]
  37. Heussner, S.; Charriere, B.; Radakovitch, O.; Taupier-Letage, I.; Sempere, R.; Jeandel, C.; Loÿe-Pilot, M.D.; Cachier, H.; Guieu, C.; Bouloubassi, I.; et al. Atmospheric Deposition and Impact of Pollutants and Key Elements and Nutrients on the Open Mediterranean Sea (ADIOS) Final Report Section 6: Detailed Report Related to Overall Project Duration; Tech. Rep. EVK3-CT-2000-00035; Centre National de la Recherche Scientifique: Perpignan, France, 2003; 99p. [Google Scholar]
  38. Guieu, C.; Loÿe-Pilot, M.D.; Benyahya, L.; Dufour, A. Spatial variability of atmospheric fluxes of metals (Al, Fe, Cd, Zn and Pb) and phosphorus over the whole Mediterranean from a one-year monitoring experiment: Biogeochemical implications. Mar. Chem. 2010, 120, 164–178. [Google Scholar] [CrossRef]
  39. Romero, E.; Peters, F.; Marrasé, C.; Guadayol, T.; Gasol, J.M.; Weinbauer, M.G. Coastal Mediterranean plankton stimulation dynamics through a dust storm event: An experimental simulation. Estuar. Coast. Shelf Sci. 2011, 93, 27–39. [Google Scholar] [CrossRef]
  40. Christodoulaki, S.; Petihakis, G.; Kanakidou, M.; Mihalopoulos, N.; Tsiaras, K.; Triantafyllou, G. Atmospheric deposition in the Eastern Mediterranean. A driving force for ecosystem dynamics. J. Mar. Syst. 2013, 109–110, 78–93. [Google Scholar] [CrossRef]
  41. Herut, B.; Collier, R.; Krom, M.D. The role of dust in supplying nitrogen and phosphorus to the South East Mediterranean. Limnol. Oceanogr. 2002, 47, 870–878. [Google Scholar] [CrossRef]
  42. Herut, B.; Zohary, T.; Krom, M.D.; Fauzi, R.; Mantoura, C.; Pitta, P.; Psarra, S.; Rassoulzadegan, F.; Tanaka, T.; Thingstad, T.F. Response of east Mediterranean surface water to Saharan dust: On-board microcosm experiment and field observations. Deep Sea Res. 2005, 52 Pt II, 3024–3040. [Google Scholar] [CrossRef]
  43. Bonnet, S.; Guieu, C. Atmospheric forcing on the annual iron cycle in the Mediterranean Sea. A one-year survey. J. Geophys. Res. 2006, 111, C09010. [Google Scholar] [CrossRef]
  44. Guieu, C.; Dulac, F.; Ridame, C.; Pondaven, P. Introduction to the project DUNE, a DUst experiment in a low Nutrient, low chlorophyll Ecosystem. Biogeosciences 2013, 10, 12491–12527. [Google Scholar] [CrossRef]
  45. Giovagnetti, V.; Brunet, C.; Conversano, F.; Tramontano, F.; Obernosterer, I.; Ridame, C.; Guieu, C. Assessing the role of dust deposition on phytoplankton ecophysiology and succession in a low-nutrient low-chlorophyll ecosystem: A mesocosm experiment in the Mediterranean Sea. Biogeosciences 2013, 10, 2973–2991. [Google Scholar] [CrossRef]
  46. Ridame, C.; Dekaezemacker, J.; Guieu, C.; Bonnet, S.; L’Helguen, S.; Malien, F. Phytoplanktonic response to contrasted Saharan dust deposition events during mesocosm experiments in LNLC environment. Biogeosciences 2014, 11, 753–796. [Google Scholar] [CrossRef] [Green Version]
  47. Lekunberri, I.; Lefort, T.; Romero, E.; Vázquez-Domínguez, E.; Romera-Castillo, C.; Marrasé, C.; Peters, F.; Weinbauer, M.; Gasol, J.M. Effects of a dust deposition event on coastal marine microbial abundance and activity, bacterial community structure and ecosystem function. J. Plankton Res. 2010, 32, 381–396. [Google Scholar] [CrossRef] [Green Version]
  48. Pulido-Villena, E.; Wagener, T.; Guieu, C. Bacterial response to dust pulses in the western Mediterranean: Implications for carbon cycling in the oligotropic ocean. Glob. Biogeochem. Cycles 2008, 22, GB1020. [Google Scholar] [CrossRef]
  49. Zohary, T.; Herut, B.; Krom, M.D.; Mantoura, R.F.C.; Pitta, P.; Psarra, S.; Rassoulzadegan, F.; Stambler, N.; Tanaka, T.; Thingstad, T.F.; et al. P-limited bacteria but N and P co-limited phytoplankton in the Eastern Mediterranean—A microcosm experiment. Deep Sea Res. 2005, 52 Pt II, 3011–3023. [Google Scholar] [CrossRef]
  50. Psarra, S.; Zohary, T.; Krom, M.D.; Mantoura, R.F.C.; Polychronaki, T.; Stambler, N.; Tanaka, T.; Tselepides, A.; Thingstad, T.F. Phytoplankton response to a Lagrangian phosphate addition in the Levantine Sea (Eastern Mediterranean). Deep Sea Res. 2005, 52 Pt II, 2944–2960. [Google Scholar] [CrossRef]
  51. Thingstad, T.F.; Krom, M.D.; Mantoura, R.F.C.; Flaten, G.A.F.; Groom, S.; Herut, B.; Kress, N.; Law, C.S.; Pasternak, A.; Pitta, P.; et al. Nature of Phosphorus Limitation in the Ultraoligotrophic Eastern Mediterranean. Science 2005, 309, 1068–1071. [Google Scholar] [CrossRef]
  52. Eker-Develi, E.; Kideys, A.E.; Tugrul, S. Role of Saharan dust on phytoplankton dynamics in the northeastern Mediterranean. Mar. Ecol. Prog. Ser. 2006, 314, 61–75. [Google Scholar] [CrossRef] [Green Version]
  53. Cropp, R.A.; Gabric, A.J.; McTainsh, G.H.; Braddock, R.D. Coupling between ocean biota and atmsopheric aerosols: Dust, dimethylsulphide, or artifact? Glob. Biogeochem. Cycles 2005, 19, GB4002. [Google Scholar] [CrossRef]
  54. Volpe, G.; Banzon, V.F.; Evans, R.H.; Santoleri, R.; Mariano, A.J.; Sciarra, R. Satellite observations of the impact of dust in a low-nutrient, low-chlorophyll region: Fertilization or artifact? Glob. Biogeochem. Cycles 2009, 23, GB3007. [Google Scholar] [CrossRef]
  55. Dulac, F.; Moulin, C.; Planquette, H.; Schulz, M.; Tartar, M. African Dust Deposition and Ocean Colour in the Eastern Mediterranean. In Rapport de la Commission Internationale de la Mer Méditerranée; Commission Internationale pour l’Exploration Scientifique de la Méditerranée: Monaco, Monaco, 2004; Volume 37, p. 190. [Google Scholar]
  56. Gallisai, R.; Peters, F.; Basart, S.; Baldasano, J.M. Mediterranean basin-wide correlations between Saharan dust deposition and ocean chlorophyll concentration. Biogeosciences 2012, 9, 8611–8639. [Google Scholar] [CrossRef]
  57. Gallisai, R.; Peters, F.; Volpe, G.; Basart, S.; Baldasano, J.M. Saharan Dust deposition may affect phytoplankton growth in the Mediterranean Sea at ecological time scales. PLoS ONE 2014, 9, e110762. [Google Scholar] [CrossRef] [PubMed]
  58. Kotta, D.; Kitsiou, D.; Karydis, M. Influence of desert dust on the Aegean Sea chlorophyll concentrations. In Proceedings of the 12th International Conference on Protection and Restoration of the Environment, Skiathos, Greece, 29 June–3 July 2014; Book of Abstracts. p. 258. [Google Scholar]
  59. Singh, R.P.; Prasad, A.K.; Kayetha, V.K.; Kafatos, M. Enhancement of oceanic parameters associated with dust storms using satellite data. J. Geophys. Res. 2008, 113, C11008. [Google Scholar] [CrossRef]
  60. Georgoulias, A.K.; Tsikerdekis, A.; Amiridis, V.; Marinou, E.; Benedetti, A.; Zanis, P.; Alexandri, G.; Mona, L.; Kourtidis, K.A.; Lelieveld, J. A 3-D evaluation of the MACC reanalysis dust product over Europe, northern Africa and Middle East using CALIOP/CALIPSO dust satellite observations. Atmos. Chem. Phys. 2018, 18, 8601–8620. [Google Scholar] [CrossRef]
  61. Cesnulyte, V.; Lindfors, A.V.; Pitkänen, M.R.A.; Lehtinen, K.E.J.; Morcrette, J.J.; Arola, A. Comparing ECMWF AOD with AERONET observations at visible and UV wavelengths. Atmos. Chem. Phys. 2014, 14, 593–608. [Google Scholar] [CrossRef] [Green Version]
  62. Kaskaoutis, D.G.; Kosmopoulos, P.G.; Nastos, P.T.; Kambezidis, H.D.; Manish, S.; Waseem, M. Transport pathways of Sahara dust over Athens, Greece as detected by MODIS and TOMS. Geomat. Nat. Hazards Risk 2012, 3, 35–54. [Google Scholar] [CrossRef] [Green Version]
  63. Volpe, G.; Colella, S.; Forneris, V.; Tronconi, C.; Santoleri, R. The Mediterranean Ocean Colour Observing System—System development and product validation. Ocean Sci. 2012, 8, 869–883. [Google Scholar] [CrossRef]
  64. Claustre, H.; Morel, A.; Hooker, S.B.; Babin, M.; Antoine, D.; Oubelkheir, K.; Bricaud, A.; Leblanc, K.; Queguiner, B.; Maritorena, S. Is desert dust making oligotrophic waters greener? Geophys. Res. Lett. 2002, 29, 1469. [Google Scholar] [CrossRef]
  65. Skliris, N.; Mantziafou, A.; Sofianos, S.; Gkanasos, A. Satellite-derived variability of the Aegean Sea ecohydrodynamics. Cont. Shelf Res. 2010, 30, 403–418. [Google Scholar] [CrossRef]
  66. Androulidakis, Y.S.; Krestenitis, Y.N.; Psarra, S. Coastal upwelling over the North Aegean Sea: Observations and simulations. Cont. Shelf Res. 2017, 149, 32–51. [Google Scholar] [CrossRef]
  67. Kotta, D.; Kitsiou, D.; Kassomenos, P. First Rains as Extreme Events Influencing Marine Primary Production. In Proceedings of the 13th International Conference on Meteorology, Climatology and Atmospheric Physics, Thessaloniki, Greece, 19–21 September 2016; pp. 263–270. [Google Scholar] [CrossRef]
  68. Wagener, T.; Guieu, C.; Leblond, N. Effects of dust deposition on iron cycle in the surface Mediterranean Sea: Results from a mesocosm seeding experiment. Biogeosciences 2010, 7, 3769–3781. [Google Scholar] [CrossRef]
  69. Krom, M.D.; Shi, Z.; Stockdale, A.; Berman-Frank, I.; Giannakourou, A.; Herut, B.; Lagaria, A.; Papageorgiou, N.; Pitta, P.; Psarra, S.; et al. Response of the Eastern Mediterranean Microbial Ecosystem to Dust and Dust Affected by Acid Processing in the Atmosphere. Front. Mar. Sci. 2016, 3, 133. [Google Scholar] [CrossRef]
  70. Ternon, E.; Guieu, C.; Loÿe-Pilot, M.D.; Leblond, N.; Bosc, E.; Gasser, B.; Miquel, J.C.; Martín, J. The impact of Saharan dust on the particulate export in the water column of the North Western Mediterranean Sea. Biogeosciences 2010, 7, 809–826. [Google Scholar] [CrossRef] [Green Version]
Figure 1. The main study area together with the chlorophyll concentration 1998–2016 climatological mean from June to September plus the geographical locations of PM10 stations.
Jmse 07 00050 g001
Figure 2. (a) Maximum dust aerosol optical depth (AOD) during the episode 25–28 March 2015; (b) Chl-a % differences between the weeks before (14–21 March 2015) and after (30 March–6 April 2015) the event.
Jmse 07 00050 g002
Figure 3. (a) Maximum dust AOD during the episode 22-24 March 2016; (b) Chl-a % differences between the weeks before (13–20 March 2016) and after (29 March–5 April 2016) the event.
Jmse 07 00050 g003
Figure 4. (a) Maximum dust AOD during the episode 18–21 June 2016; (b) Chl-a % differences between the weeks before (9–16 June 2016) and after (25 June–2 July 2016) the event.
Jmse 07 00050 g004
Figure 5. (a) Maximum dust AOD during the episode 6-8 September 2015; (b) Chl-a % differences between the weeks before (29 August–5 September 2015) and after (14–21 September 2015) the event.
Jmse 07 00050 g005
Figure 6. (a) Maximum dust AOD during the episode 21–23 September 2014; (b) Chl-a % differences between the weeks before (14–21 September 2014) and after (30 September–7 October 2014) the event.
Jmse 07 00050 g006
Figure 7. (a) Maximum dust AOD >0.8 during the episode 11–13 May 2017 that defined the study area; (b) Chl-a % differences between the weeks before (1–8 May 2017) and after (17–24 May 2017) the event.
Jmse 07 00050 g007
Table 1. The results of all calculations are summarized. The cases presenting statistically significant differences in the mean chlorophyll concentrations before and after the events, as derived by the weekly data, are marked with an “s” (s-i for increase and s-d for decrease).
Dust EpisodeChlorophyll Increase (Area %)Significant Chlorophyll Difference (Area %)Significant Chlorophyll Increase (Area %)
Heavy rainfall and dust 25–28 March 2015
(dust AOD 0.8–2.5)
59.9 s-i7.794.4 s-i
59.9 s-i (wet deposition)7.794.4 s-i
62.2 (extreme rain)9.594.5
61.9 (extreme wind)4.098.1
59.2 * (Ionian Sea)7.0 *97.9 *
66.9 * (Aegean Sea)15.5 *92.9 *
Strong gale winds and large amounts of dust
22–24 March 2016
(dust AOD 1.0–2.7)
7.6 s-d0.956.7 s-i
11.1 s-d (wet deposition)1.757.7 s-i
19.2 (extreme rain)3.473.3
7.5 (extreme wind)0.958.4
26.2 * (20–28 March)1.0*68.6 *
37.8 * (19–28 March)4.6*43.1 *
21.7 * (19–30 March)1.9*58.7 *
4.9 *(20–30 March)0.6*51.1 *
Early summer heat wave and dust
18–21 June 2016
(dust AOD 0.3–0.7)
33.3 s-d1.674.8 s-i
44.2 s-d (wet deposition)4.874.2 s-i
51.3 * (Aegean Sea)9.9 *96.2 *
Late summer heat wave and dust
6–8 September 2015
(dust AOD 0.3–0.8)
66.1 s-i0.495.0 s-i
69.6 s-i (wet deposition)0.5100.0 s-i
18.7 *3.5 *73.4 *
Fair weather and dust
21–23 September 2014
(dust AOD 0.3–0.7)
80.0 s-i2.899.1 s-i
87.8 s-i (wet deposition)8.8100.0 s-i
75.8 *7.7 *98.7 *
Dust over Central Mediterranean
9–13 May 2017
(dust AOD 0.8–1.5)
44.41.474.9 s-i
47.0 (wet deposition)1.874.7 s-i
* Denotes daily data.

