Article

Semi-Analytical Methods for the Joint Strength and Sealing Performance in the Failure Process of the Subsea Pipeline Compression Connector

1
College of Mechanical and Electrical Engineering, Harbin Engineering University, Harbin 150001, China
2
College of Shipbuilding Engineering, Harbin Engineering University, Harbin 150001, China
3
Yantai Research Institute of Harbin Engineering University, Yantai 264006, China
*
Author to whom correspondence should be addressed.
J. Mar. Sci. Eng. 2023, 11(7), 1417; https://doi.org/10.3390/jmse11071417
Submission received: 20 June 2023 / Revised: 13 July 2023 / Accepted: 13 July 2023 / Published: 14 July 2023
(This article belongs to the Special Issue Frontiers in Deep-Sea Equipment and Technology II)

Abstract

:
Radial seals are sensitive to axial overload failure and may cause leaks. This paper presents two semi-analytical methods for the joint strength and sealing performance of the subsea pipeline compression connector under axial overload failure. The method for the joint strength consists of two parts: One is the analytical model for the joint strength of the connection and seal under axial tension and compression conditions. The models are based on membrane theory, considering the hardening and bending effects. The other is a two-dimensional, axisymmetric finite element model for the joint strength of the radial metal seal. The semi-analytical method for the overload sealing performance is derived using a finite element model and the Reynolds equation of the laminar flow. The effects of critical parameters on the joint strength and the overload sealing performance are analyzed. The experiments are carried out with specimens and prototypes to evaluate the evolution of the sealing interface and the joint strength. The results show that both the internally turned sealing surface and the deflection of the pipe can improve the joint strength. In addition, the compression-type connector can remain sealed under the maximum axial overload. The proposed methods allow the prediction and identification of the overload joint strength and the sealing condition of the compression-type connector and provide a better understanding of the radial metal seal under the axial overload condition.

1. Introduction

The axial force overload is a significant factor contributing to the pipeline failure in subsea connections [1]. For non-welded connectors [2], when subjected to the overload, connectors with axial seals may fail due to the separation of sealing surfaces, while connectors with radial seals may fail due to the axial sliding of sealing surfaces. This study is performed to analyze the joint strength and sealing performance during the axial overload of the subsea compression connector with the radial metal seal.
The key problem of the radial metal seal is the leakage, and the complexity of the metal seal derives from its surface topography [3]. Due to the existence of stochastic gaps at the sealing interface, the two sealing surfaces cannot be fully contacted on the microscopic scale, and the risk of leakage increases if the gaps are connected across the seal [4]. In the studies of the leakage ratio on randomly rough surfaces, the topography formed by turning shows unique sealing properties [5]. This issue can be traced back to the groundbreaking studies on the surface waviness theory [6] and its further developments on the surface roughness [7] and sealing design factors [8]. In the aspect of the gasket, through experimentation, Nakamura and Funabashi [9] studied the leakage on a spiral-like topography; then, Polycarpou and Etsion [10] developed a simplified semi-empirical model to analyze the leakage and emphasized the significance of micro-profile parameters in determining the sealing performance of the metal gasket. Arghavani et al. [11] compared the deformation and pressure distribution of the sealing surfaces of flanged gaskets manufactured by different machining methods, and the surface topographies were found to be the decisive factors affecting the leakage ratio. In terms of experiments, a polymer film method was introduced, and the spiral contact marks and leakage flow paths were proposed to observe the true contact condition of the topography on the gasket [12], and the real contact areas on the sealing surfaces were measured [13]. To provide further clarification on the sealing capabilities of the turning topography, Geoffroy and Prat [3] developed a model for the leakage of turning metal gaskets and identified the transition from radial to spiral leakage. One of the advantages of their progress is to establish a more realistic geometric model of local surfaces, which is considered a substitute for the geometrical representation of ideal surfaces. In addition, Robbe-Valloire and Prat [4] further studied the radial and circumferential leakage paths by specifying the typical contact patterns of metal static seals. Ledoux et al. [14] simulated the leakage ratios utilizing a modal discrete decomposition method and concluded that the leakage ratios can be greatly reduced if the turned-like waviness is controlled. Bourniquel et al. [15] studied the leakage prediction using a similar method, with the idea that the roughness may not have a significant effect on the overall leakage ratio.
The turning topography related to the studies of the asperity [16] and the probabilistic models [17] of rough surfaces. By creating a two-dimensional (2D) stochastic model, Lorenz and Persson [18] proved that the leakage ratio sensitively depended on the skewness in the height probability distribution. Then, by developing a three-dimensional (3D) finite element (FEA) model, Zhang et al. [19] proposed a novel approach to calculate the leakage ratio for specific surface topographies. Besides, multiscale and fractal methods are utilized as effective means for morphological analysis. Marie et al. [20] created a functional prototype and implemented a multiscale computational approach for the leakage ratio of the sealing structure. Liao et al. [21] proposed a technique for decomposing 3D surfaces into multiscale surfaces by the wavelets to predict surface functions and identify machining errors. Deltombe et al. [22] used a multiscale analysis to evaluate the performance of the seal, and micro-roughness played a major role in the leakage. Yan and Fan [23] used a multiscale model to investigate the impact of the fluid pressure on the sealing performance of pipe connections. In other respects, So and Liu [24] proposed an elastic–plastic model to consider the anisotropy of the rough contact surfaces. Shao et al. [25] predicted the processing surface by high-definition metrology. Tang et al. [26] developed a hydraulic–thermal FEA model for the sealing surface of connectors and showed that temperature was significant to the thermal deformation of both metal and non-metal sealing surfaces. Ernens et al. [27] conducted experiments for a variety of thread compounds and applied pin/box surface coatings to describe the sealing mechanism of the metal seals.
Scholars have also conducted important research on compression connections. Based on the elasticity superposition theorem, Wei et al. [28] derived the formula for the sealing pressure of a compression connector and determined the sealing condition using the FEA method. Wang et al. [29] developed an optimization method for the compression connector using a static metal sealing mechanism and created a FEA model with the zero-order method to optimize its structure. Weddeling et al. [30] developed an analytical model for calculating the required charging energy for a radial connection with a mandrel placed inside the pipe. In another study, Weddeling et al. [31] formulated a transferable load formula incorporating various groove shapes, using membrane theory. With the experimental data and FEA methods, Henriksen et al. [32] analyzed the forces and deformations involved in the process of connecting pipe flanges and found that the increased radial stiffness is the most reliable indicator of a clamped connection. Agrawal et al. [33] presented a novel approach for compression connectors and conducted both tension and compression tests, indicating that the compression connector exhibited a considerable strength with welded joints. Onyegiri et al. [34] studied compression connectors for sandwich pipes by incorporating 2D axisymmetric and 3D FEA models. Quispe et al. [35] presented a FEA model for a threaded compression connection with square teeth and a metal static seal. The model was specifically designed for connecting subsea sandwich pipes. Yan and Fan [23] used a multiscale model to investigate the impact of the fluid pressure on the sealing performance of a pipe connection. Liu et al. [36] enhanced the anchoring structure by implementing a nonlinear FEA technique. Li et al. [37] proposed a semi-analytical method to predict the radial sealing performance of the compression connector, and the leakage condition was obtained as a function of the minimum radial deflection. Wu et al. [38] presented a method for calculating the axial load capacity of the steel pipe-to-sleeve grouted connections.
For the compression connection, there is still no analytical method to determine the joint strength and the overload sealing performance. In practice, the FEA approach remains the exclusive choice in many instances. A more comprehensive understanding of the capacity for an enduring overload and sealing performance of compression connections is needed. In addition, most studies on metal seals focus on the axial sealing mechanisms. There is limited research available on radial seals.
This paper presents two semi-analytical methods for analyzing the joint strength and the overload sealing performance of the subsea compression-type connector. Specimen and prototype tests are carried out, and the results are analyzed and compared.

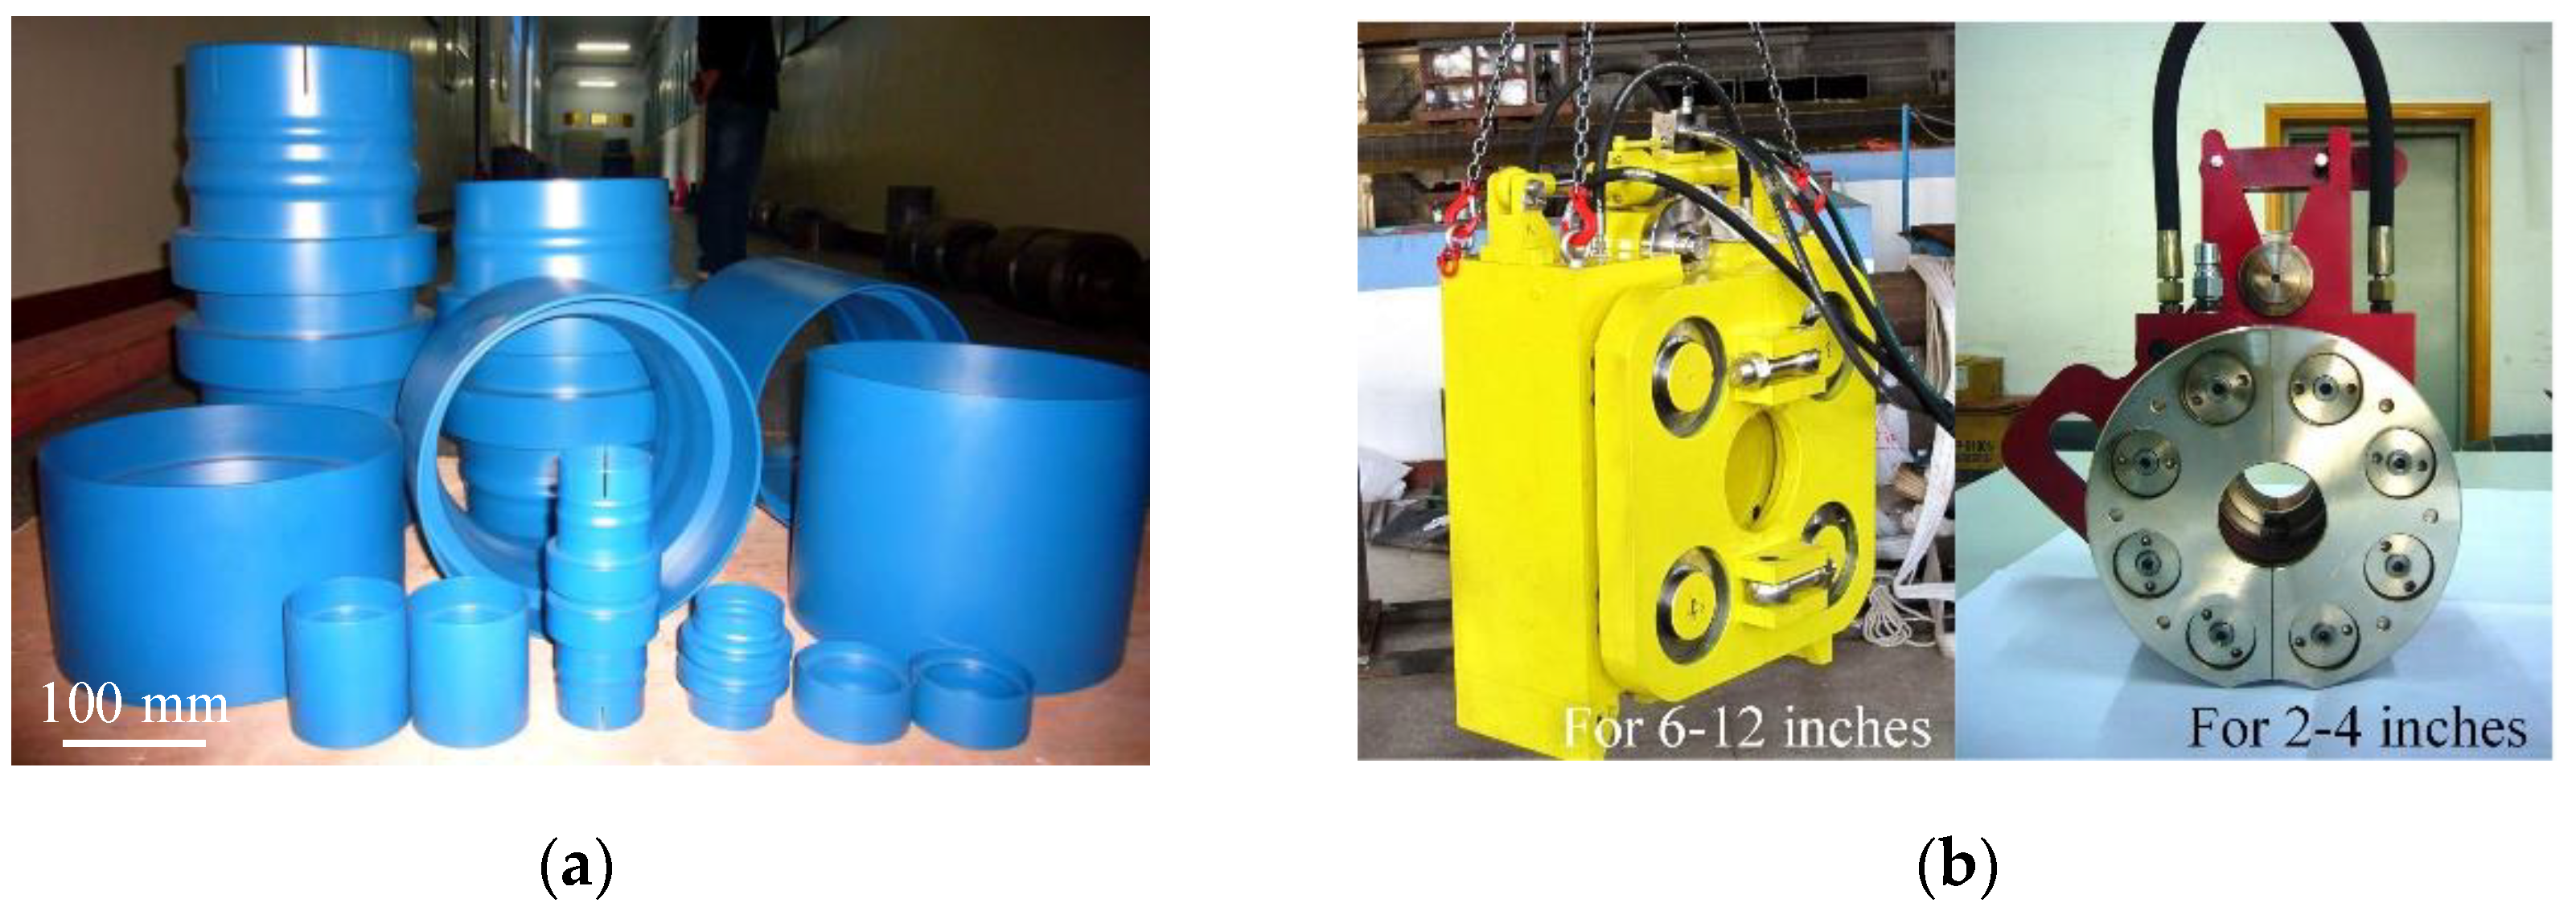
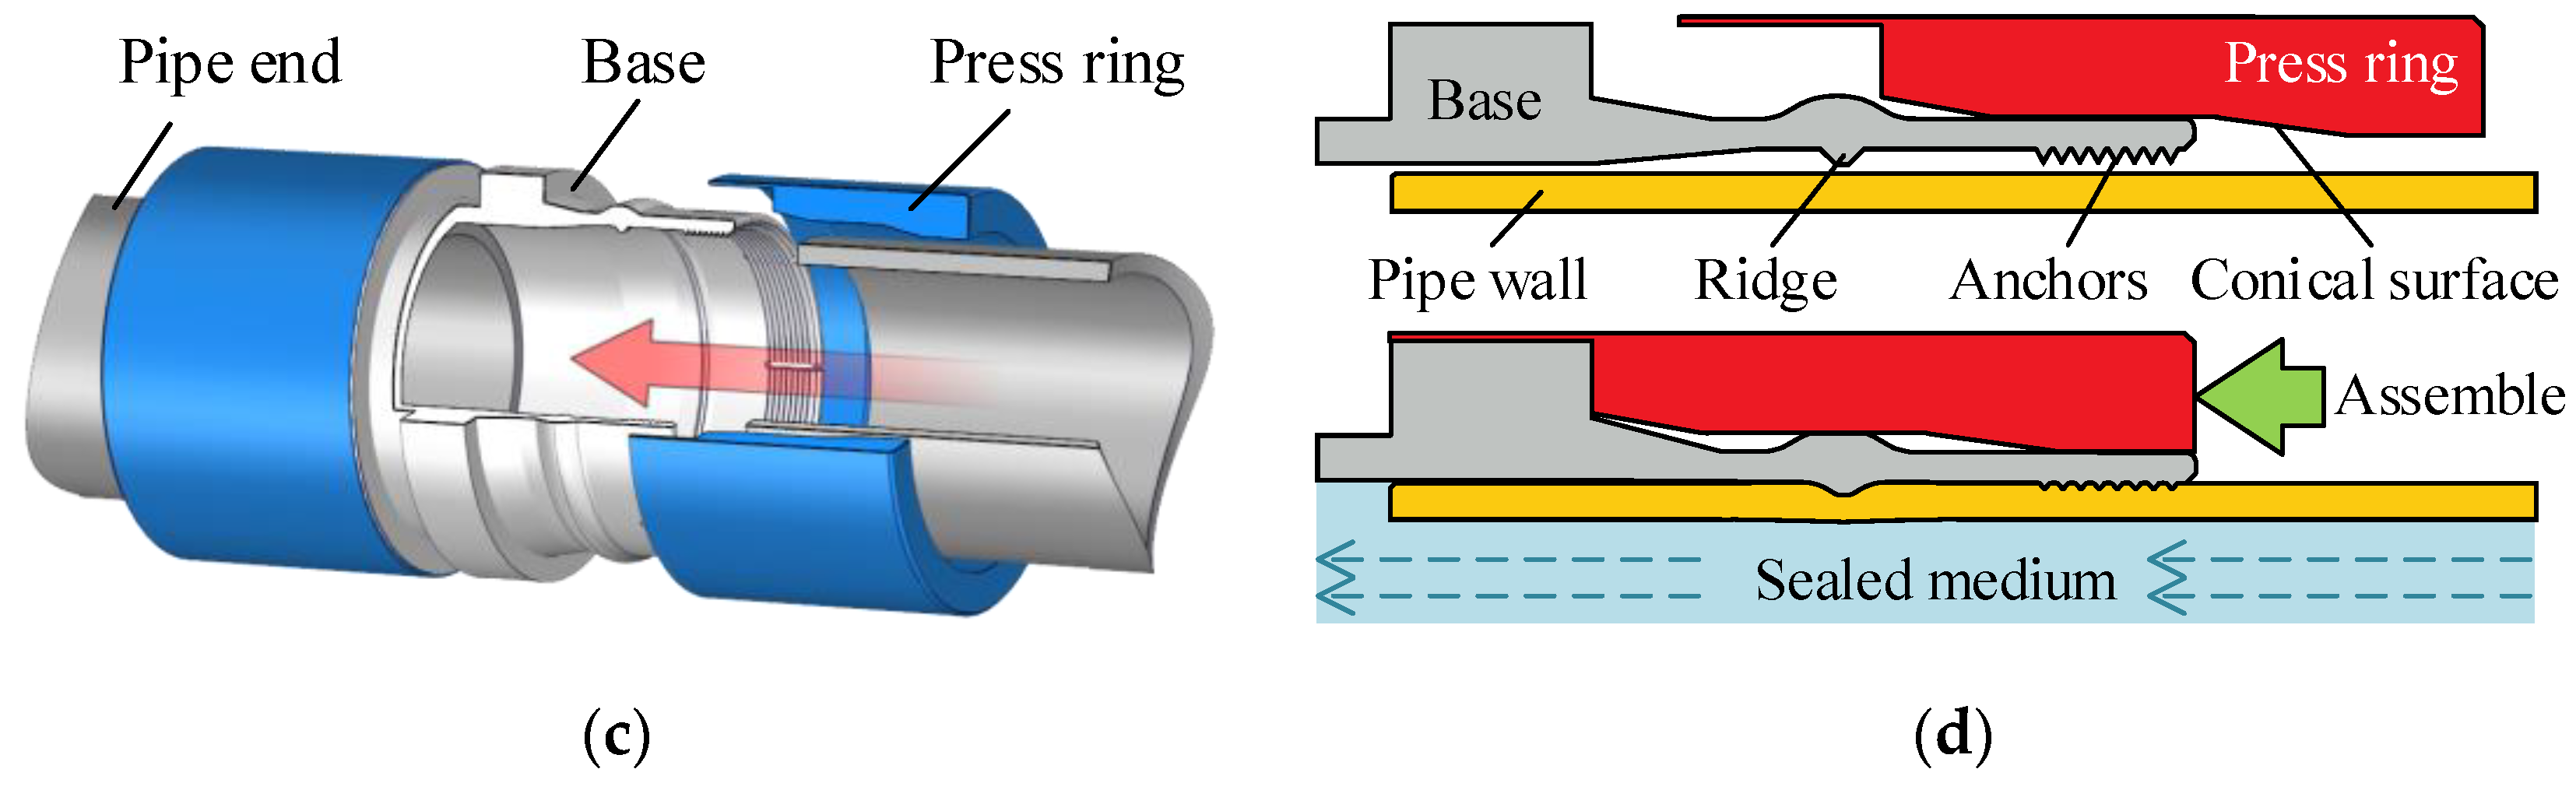
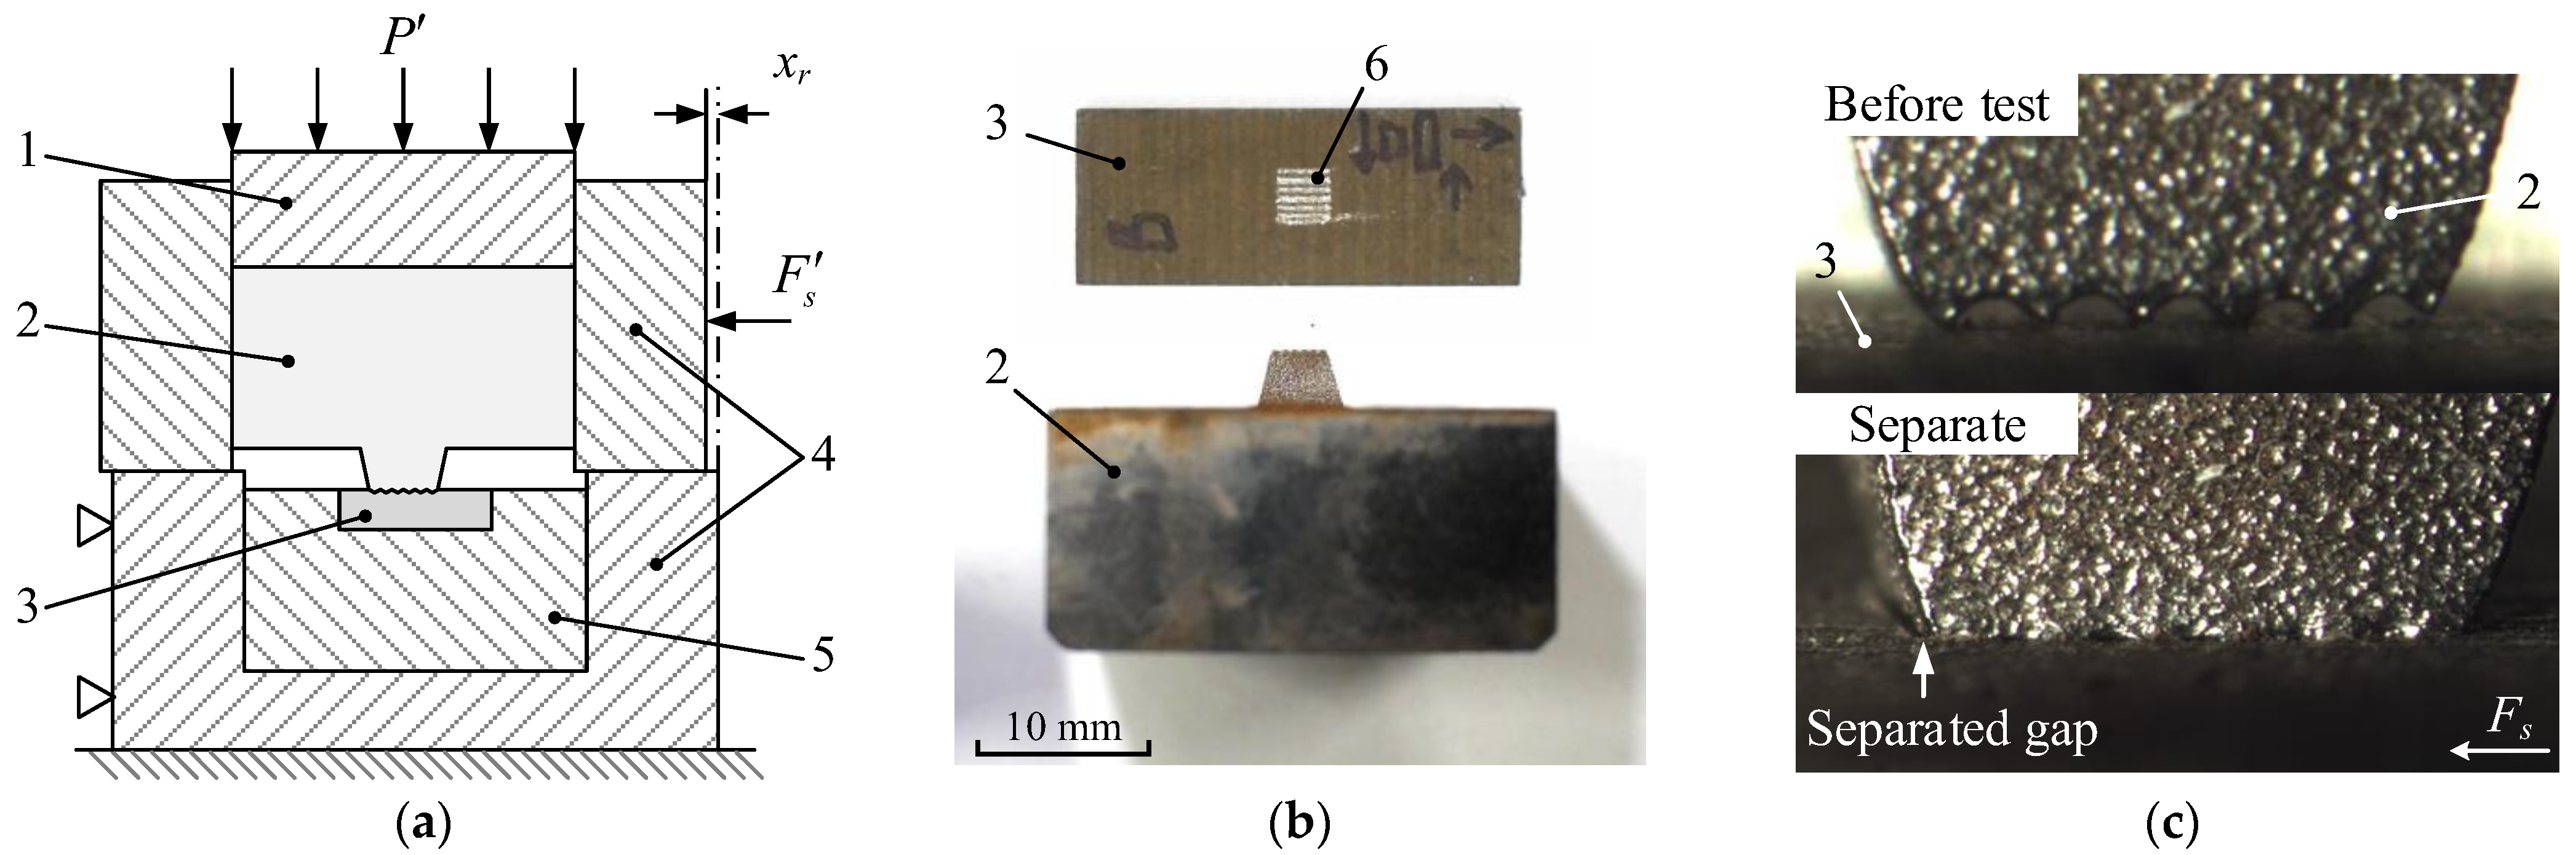
2. Structure and Mechanism of the Compression Connector

The compression pipeline connector is a mechanical connection (ASTM F1387 [39] and ISO 8434-1 [40]), which is used to connect two pipes, particularly in the underwater environment. This type has been developed by many well-known companies, including the Phastite® connector from Parker Hannifin (Columbus, OH, USA), the Tube-Mac® connector from PYPLOK® Corp. (Stoney Creek, Ontario, Canada), the compression connector from HAELOK® (Schlieren, Switzerland), etc.
The studied connector and its assembly tools, as well as the assembly process, are shown in Figure 1. It is designed to connect the single-wall subsea pipeline between 2 and 12 inches in diameter. The connector was directly attached to the pipe by the mechanical deformation and created a metal static seal at the same time [27]. The connector comprises a base and two press rings, as shown in Figure 1a,c, which are both made of metal and symmetrically positioned around the pipe, as shown in Figure 1c,d. The base features one or more sealing ridges. The dedicated assembly tools shown in Figure 1b were used for the automation of the assembly process.

3. Semi-Analytical Model of the Joint Strength

After assembly, the radial deflection of the connected pipe not only creates sealing pressure on the sealing ridge, but also provides partial joint strength in the axial direction. In our previous study [37], analytical models for the radial deflection of the base and pipe were developed. With these models, the joint strength of the deflected pipe can be derived. The relevant deflection formulas are introduced below.

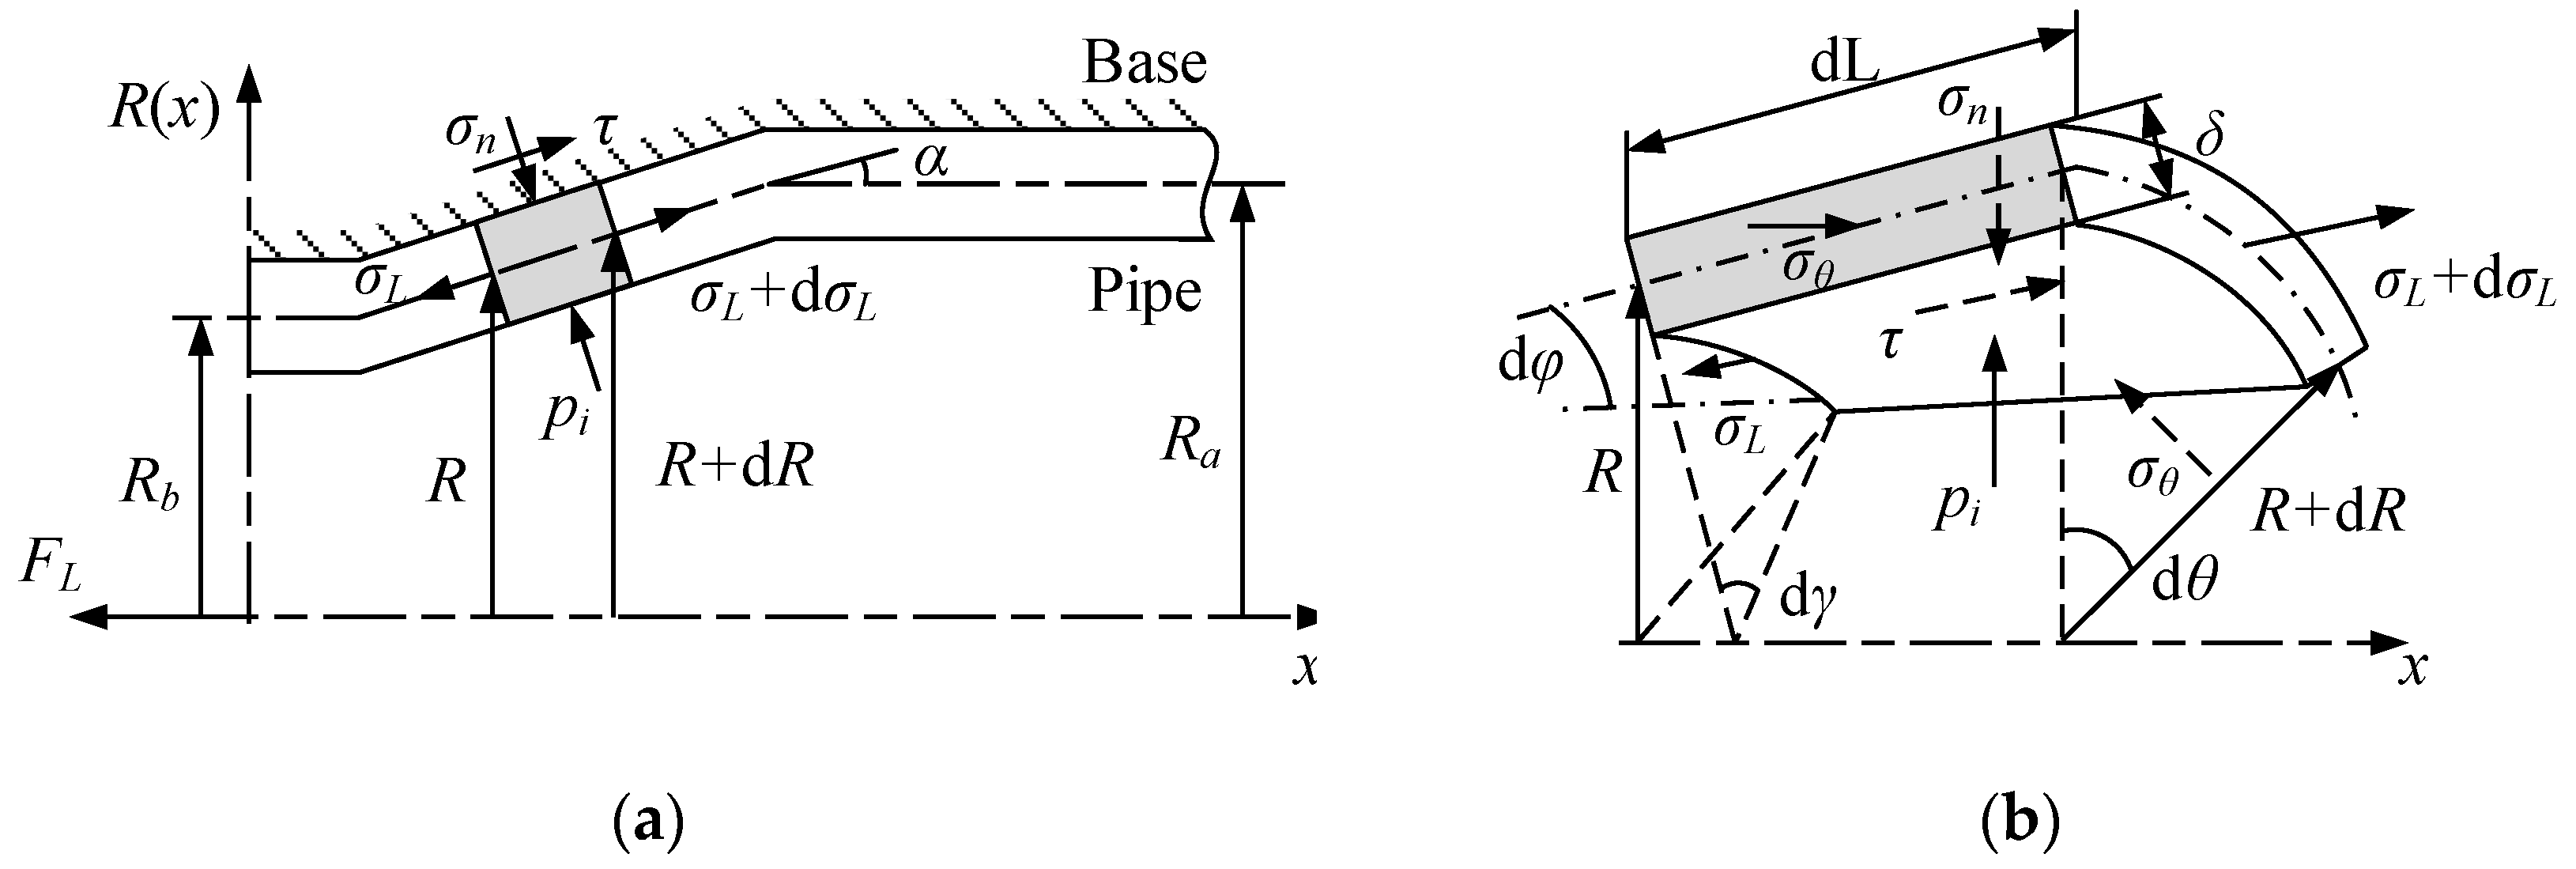
3.1. Analytical Model of the Pipe Deflection

In this study, the following basic assumptions were made:
  • The pipe is a cylindrical shell with an even thickness, and the stress distribution is uniform across the pipe thickness.
  • During the axial loading, the small clearance between the pipe and the base is ignored.
  • All surfaces are in the ideal condition without any heat treatment, coating, and defects.
  • The material of the pipe is isotropic and bilinear hardening.
  • The deformation is quasi-static, with strain rate > 10−2 s−1 (ASTM E8/E8M [41]).
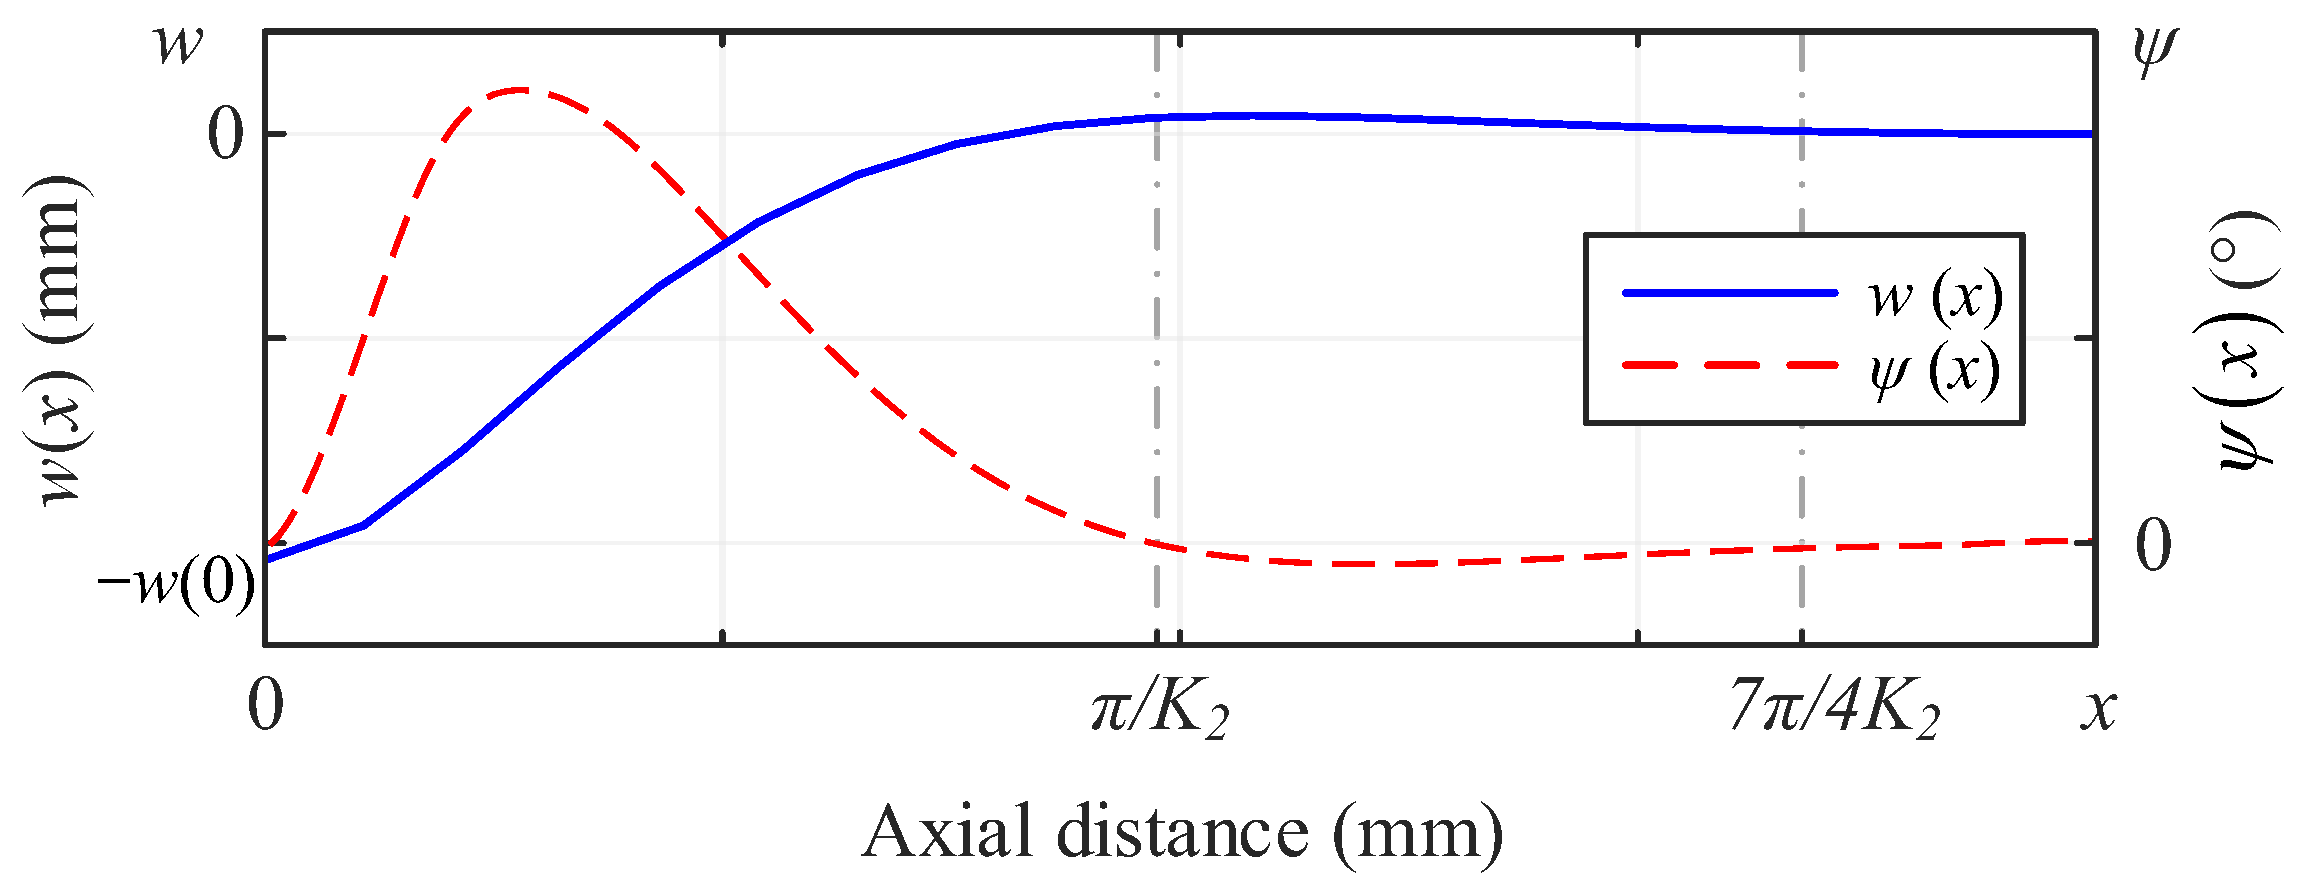
The pipe surface is assumed to be subjected to a concentrated radial sealing pressure, P , which is uniformly distributed in the circumferential direction, and the radial deflection of the connected pipe can be expressed as [37]:
w x = P 8 K 2 3 D e K 2 x cos K 2 x + sin K 2 x K 2 = E δ 4 R a 2 D 1 4 ,   D = E δ 3 12 1 υ 2 .
The model set the origin at the center of the sealing ridge, with the positive x-axis pointing to the right side of the pipe axis. P is the sealing pressure, w x is the deflection, with a positive direction pointing outside of the pipe, E is the Young’s modulus, D is the flexural rigidity, δ is the pipe thickness, υ is the Poisson’s ratio, and R a is the radius of the mid-surface of the pipe wall before deflection.
Assuming the half-cone angle of the deflection as an unsigned angle, ψ x , it can be expressed as:
ψ x = P 4 K 2 2 D e K 2 x sin K 2 x .
Accordingly, the deflection, w x , and half-cone angle, ψ x , are plotted in Figure 2.
The following conclusions were drawn from Figure 2:
  • The w x reached the maximum at x = 0 , and it was basically inversely proportional to x.
  • The influence length of the w x could be approximated as x ( 0 , 7 π 4 K 2 ) .
  • In the range: x 0 , π K 2 , the angle varied with x.
When subjected to axial overload, the deflected section will deform and provide additional resistance. To simplify the formulation, an average half-cone angle α = ψ x ¯ .

3.2. Joint Strength of the Connected Pipe

The joint strength of the deflected pipe can be derived from the above deflection parameters. Referring to studies on the connector that is supported by the inner mandrel [30,31], the membrane theory was used in the formulation, and material hardening and bending stress were also considered. Since the stress condition of the deflected pipe was different between tension and compression, they were separately derived.

3.2.1. Tension Strength Model

When the pipe was under the axial tension load, F L , the stress state was as illustrated in Figure 3. The origin was fixed at the projection of the ridge on the axis of the pipe. The positive x-axis was designated as the direction opposite to F L .
In Figure 3a, R b is the radius after deflection, R ( x ) is the radius of the deflection section, and p i is the internal pressure. A thin-walled cylindrical cell was taken from the deflected section of the pipe and shown in Figure 3b, where σ L is the stress parallel to the pipe surface, σ n is normal to the pipe surface, and σ θ is the circumferential stress.
The differential equilibrium equation normal to the pipe surface is:
σ L R d θ d L 2 σ θ s i n θ 2 δ d L c o s α = 0 .
The differential equilibrium equation parallel to the pipe surface is:
σ L + d σ L R + d R ( δ + d δ ) d θ σ L R d θ δ + 2 s i n d θ 2 s i n α σ θ δ d L + μ σ n R d θ d L = 0 ,
where μ is the friction coefficient.
We combined Equations (3) and (4) and ignored the second-order infinitesimal, which yielded:
R d σ L d R + σ L + σ θ 1 + μ c o t α = 0 .
For the plastic condition of the hardening, an isotropic bilinear hardening model [42] was adopted, and the constitutive relationship of the hardening took the form of:
σ T = σ s + K 1 · ε T ,
where σ T is the true stress, σ s is the yield strength, ε T is the accumulated plastic strain, and K 1 is the hardening modulus.
According to the Tresca yield criterion [43], the plastic state is:
σ L + σ θ = K 3 σ T ,
where the coefficient K 3 1 ,   3 2 [44]. Substituting Equations (6) and (7) into Equation (5) yielded:
R d σ L d R a 1 σ L a 2 R + a 3 = 0 ,
where:
a 1 = μ cot α a 2 = K 1 K 3 R i 1 + a 1 a 3 = K 3 σ s + K 1 1 + a 1 .
The antiderivative of Equation (8) is:
a 1 1 σ L = C R a 1 a 2 R + a 1 1 a 3 a 1 ,
where C is a constant. By setting the boundary conditions as R = R a and σ L = p i , the final expression for axial stress with hardening under the tension condition was derived as:
σ L = K 1 K 3 μ c o t α + 1 R a μ c o t α 1 R a R R a μ c o t α R + K 3 σ s + K 1 1 μ c o t α + 1 1 R R a μ c o t α p i R R a μ c o t α .
The bending moments at both ends of the curved section in Figure 3a also affected σ L . To describe the effect, for example, we took a bending section of the pipe at R = R a , as shown in Figure 4.
Within the bending area (from cross-section A-A to B-B), the curvature varied as the stress increased. Assuming the presence of a secondary stress, σ M , caused by the curvature, and that the curvature change was entirely caused by the work carried out by σ M , the equilibrium equation of work for the cross-section A-A is given by:
σ M δ R a d θ ρ α = M α ,
where ρ is the radius of curvature, and M is the bending moment. The equilibrium equation of forces for the cross-section B-B is:
σ L δ R a d θ ρ 1 c o s α = M ,
while the bending moment can be expressed as [45]:
M = δ 2 R a 4 d θ σ s .
Substituting Equation (14) into Equations (12) and (13) yielded:
σ M = σ L ( 1 c o s α ) .
Hence, the axial stress considering both hardening and bending is:
σ L M = ( 3 2 c o s α ) σ L .
Then, the strength under tension overload could be determined as:
F L = 2 π δ R σ L M .
The maximum tension strength along the deflected segment is:
F L m a x = 2 π δ R b σ L M .
The analytical model is validated by the FEA model in Section 4. The maximum axial strength of the FEA reached 5.08 × 10⁴ N, the corresponding theoretical value was 5.30 × 10⁴ N, and the relative error was 4.17%. Compared to the results without hardening, it was reduced by 4.37%. The error was caused by the simplification of the models, the average half-cone angle, etc.

3.2.2. Compression Strength Model

The axial compression load changed the stress in the pipe. We defined the axial pressure as σ P , and according to Figure 3a,b, the differential equilibrium equations both normal and parallel to the pipe surface can be expressed as:
σ n R d φ d R s i n α + 2 σ θ δ d R s i n α   sin d γ 2 = 0 σ P + d σ P R + d R δ d θ σ P δ R d θ 2 σ θ δ d R s i n α sin d φ 2 + σ n R d φ d R s i n α = 0 .
Since d φ = s i n α d θ and d γ = c o s α d θ , Equation (19) can be written as:
R d σ P d R + σ P σ θ 1 + μ c o t α = 0 .
Via the Tresca yield criterion with the material hardening:
σ θ σ n = K 3 σ s + K 1 1 R R a .
Ignoring the small quantity σ n , and substituting Equation (21) into Equation (20), yielded:
R d σ P d R + σ P K 3 σ s + K 1 1 R R a 1 + μ c o t α = 0 .
Integrating the equation with the boundary conditions: R = R b and σ P = p i , the axial stress under compression including the hardening is:
σ P = K 3 1 + μ c o t α 1 R b R σ s + K 1 1 R + R b 2 R a p i R b R .
Similar to Equation (16), the stress including the bending moment and material hardening is:
σ P M = ( 3 2 c o s α ) σ P .
The load capacity of the pipe is:
F P = 2 π R δ σ P M .
The maximum compression strength is:
F P m a x = 2 π R a δ σ P M .
The results are validated by the FEA in Section 4. During the overload process, the maximum axial strength of the FEA was 5.46 × 10⁴ N, while the theoretical value was 5.76 × 10⁴ N. The relative error was 5.23%.

3.3. Joint Strength of the Seal

In engineering applications, the turning topography is usually left on the sealing surface to achieve a better bonding strength [46]. The topography is an anisotropic helix pattern, similar to a thread [37]. In the assembly, the topography is embedded in the pipe surface. To determine the maximum shear strength of the sealing interface, as shown in Figure 5, the calculation method for the thread strength [47] was used.
Taking the dent on the pipe side as the study object, the width of the embedded streaks was much more than the height; thus, by disregarding the bending moment effect, the maximum of axial shearing force, F s , is given by:
F s m a x = 2 π R r 1 b n τ p .
where b is the turning feed rate, R r 1 is the radial radius of the bottom of the dent, n is the number of streaks, and τ p is the allowable shear stress of the material. The average axial overload on each streak, F s / n , is acting on the pitch radius, R r 2 .
The results are validated by the FEA in Section 4. The maximum axial strength of the FEA was 2.49 × 10⁵ N, compared to the analytic value of 2.47 × 10⁴ N. The relative error was only 0.96%. However, this method can only estimate the maximum strength before overload. Due to the nonlinear and prominent deformation of the topography, the F s changed during overload, so F s is further studied by the FEA method in Section 4.
Combining the models obtained in the previous sections and using the superposition theorem [28], a semi-analytical model for total axial joint strength, F, can be derived as follows:
F = F L , P + F s + F A .
where F L or F p need to be determined according to the force condition, F s is obtained by FEA, and F A is the strength of the anchor section according to its configuration, which was considered constant in this paper. This model can be used to obtain both the maximum axial strength and the strength variation during overload. It can also be used to predict the overload forces in sealing experiments, as in Section 6.

4. FEA Modeling

To validate the proposed models and obtain nonlinear evolution of the sealing interface under overload, FEA models were created. The numerical analysis was performed using ABAQUS®/Standard [48].

4.1. FEA Model for the Pipe

A simplified 2D axisymmetric model was created to investigate the axial overload behavior in the deflected section of the pipe, as shown in Figure 6. The model uses the CAX4R element, which is a four-node, bilinear, axisymmetric, quadrilateral element with reduced integration and hourglass control. The details of the ridge and sealing surfaces were ignored, and the base was considered rigid with a high yield strength.

4.2. FEA Model for Sealing Surface

To determine the evolution of the sealing interface during overload, a 2D axisymmetric FEA model featuring the turning topography was created, as shown in Figure 7. The new model retains the same element as the previous one and incorporates topography parameters from the validated FEA model in the previous study [37]. The mesh was optimized, as shown in Figure 7b–d. The mesh sensitivity was examined and verified.
The material and geometric parameters used in the theoretical analysis are listed in Table 1.
The sealing topography used in the leakage model is described in Section 5 to derive the theoretical sealing performance. The results of both models are compared with experiments in Section 6.

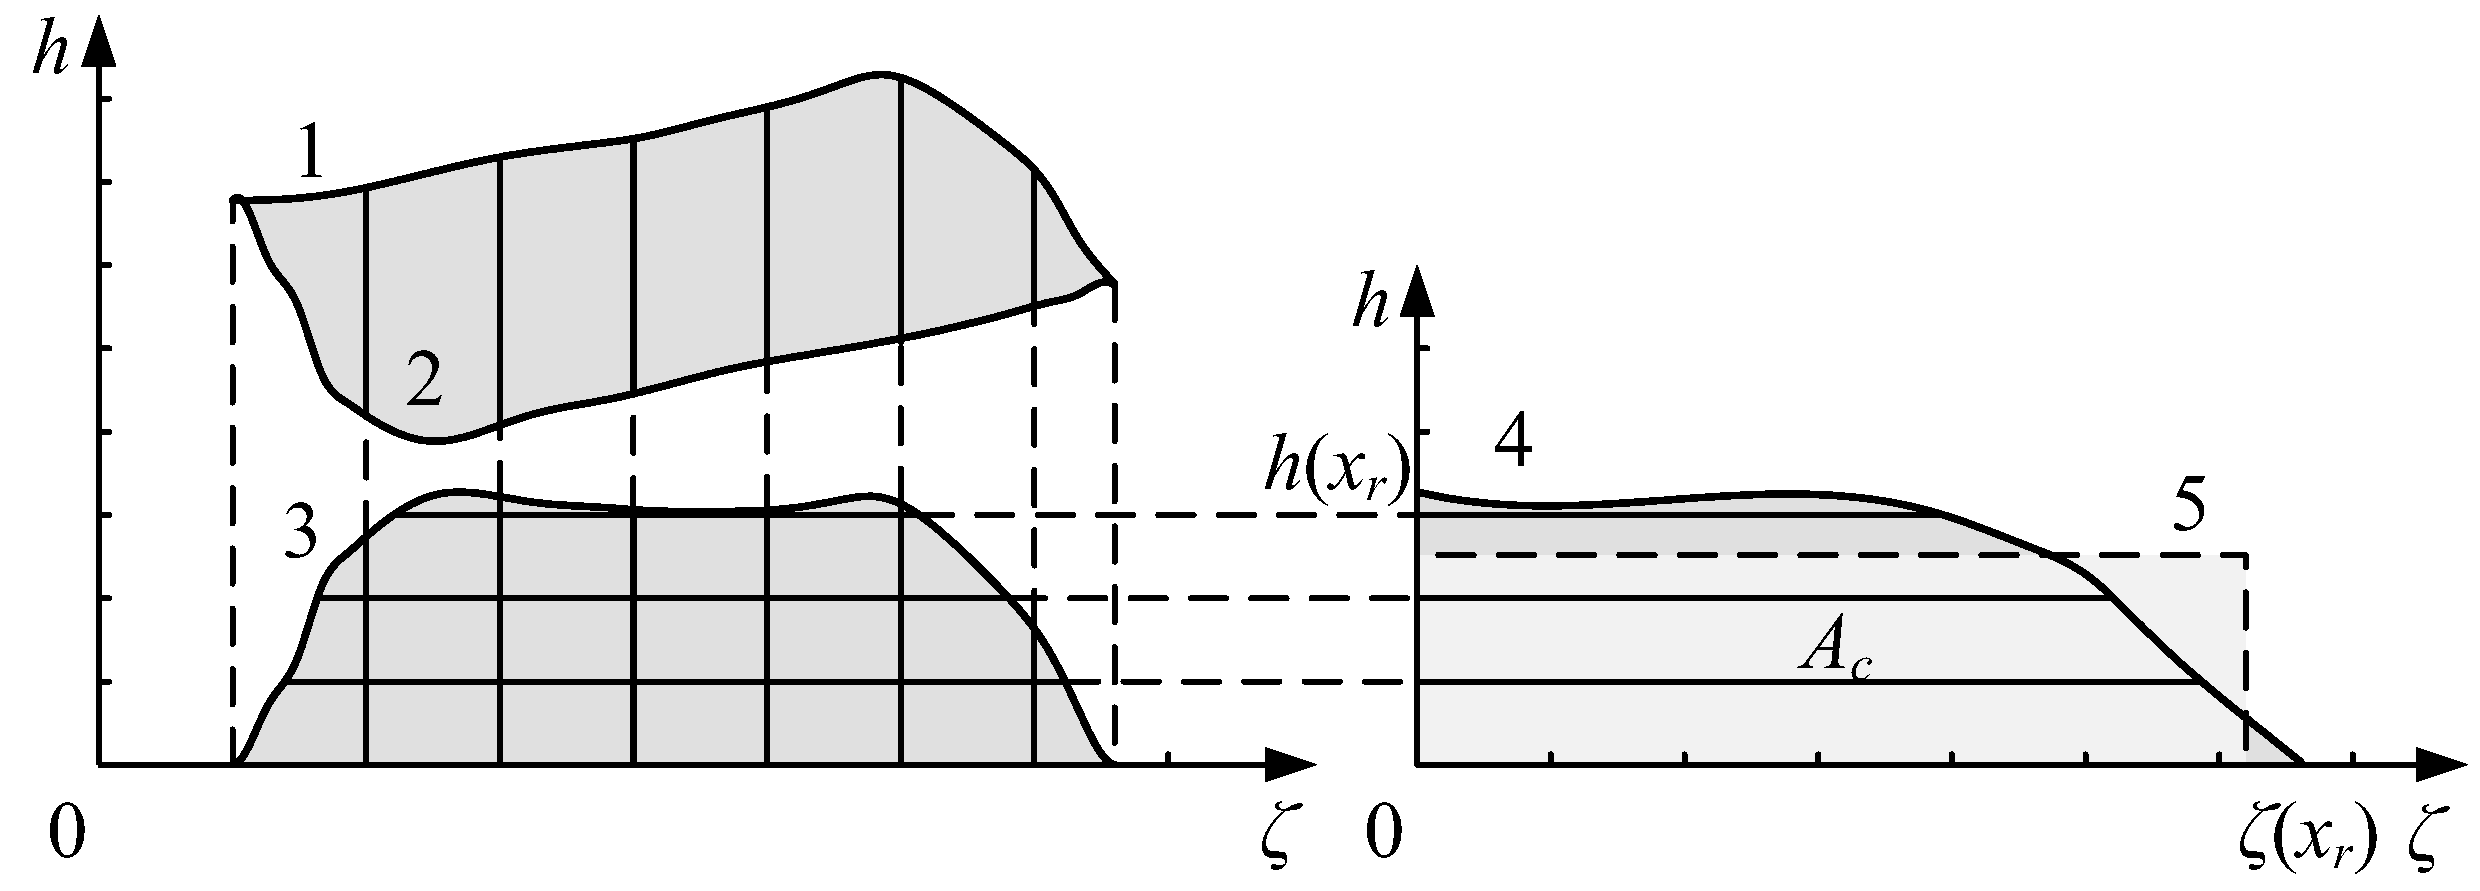
5. Semi-Analytical Model of the Leakage Ratio

A helical leakage channel was formed when there was relative sliding of the sealing surfaces. The cross-sectional area of this channel varied with the relative displacement, x r , between the sealing surfaces. Figure 8 shows a typical profile of a leakage channel, which is enclosed between curves 1 and 2. To facilitate the comparison, the Abbott–Firestone curve [49] was used. The leakage channel can be mapped to the positive, semi-axial curve 4 via curve 3. The area enclosed by the coordinate axes and curve 4 remained constant with the channel area.
The cross-section area, A c ( x r ) , can be expressed by the radial height, h x r , and the axial width, ζ x r , as:
A c = 0 ζ h   d x .
To determine the leakage ratio, the rectangular area (curve 5) can be used as an approximation of the cross-sectional shape of curve 4. The equivalent height of the rectangular leakage channel is:
h ¯ ( x r ) = A c ( x r ) ζ ( x r ) .
The length of the leakage channel is:
L c = 2 π R r 1 n 1 .
The governing equation for the laminar flow can be expressed by the Reynolds equations [50] as:
q v = 0 . ; q v = h 3 12 η p ;   p = p i ,     a t   x = x i ; p = p o ,     a t   x = x o ,
where q v is the volume flow ratio per unit width, η is the viscosity of the fluid, and p is the fluid pressure. The circumferential leakage ratio, Q c , as a function of x r , can be derived as:
Q c x r = p i 2 p o 2 ζ x r h ¯ 3 x r 48 η p o n 1 π R r 1 .

6. Results and Discussion

6.1. Parameter Analysis

In this section, the influence of the parameters on the joint strength was analyzed using the proposed strength models, and the overload sealing performance was also analyzed.
A critical sealing factor for radial seals is the maximum pipe deflection, which is also a critical factor for the axial strength. This study used a necking coefficient, w / R x = 0 , to examine the correlation between the deflection and the strengths, as shown in Figure 9a. The change rates for the strengths and w / R are presented in the semi-logarithmic coordinates in Figure 9b.
The following conclusions were drawn from Figure 9:
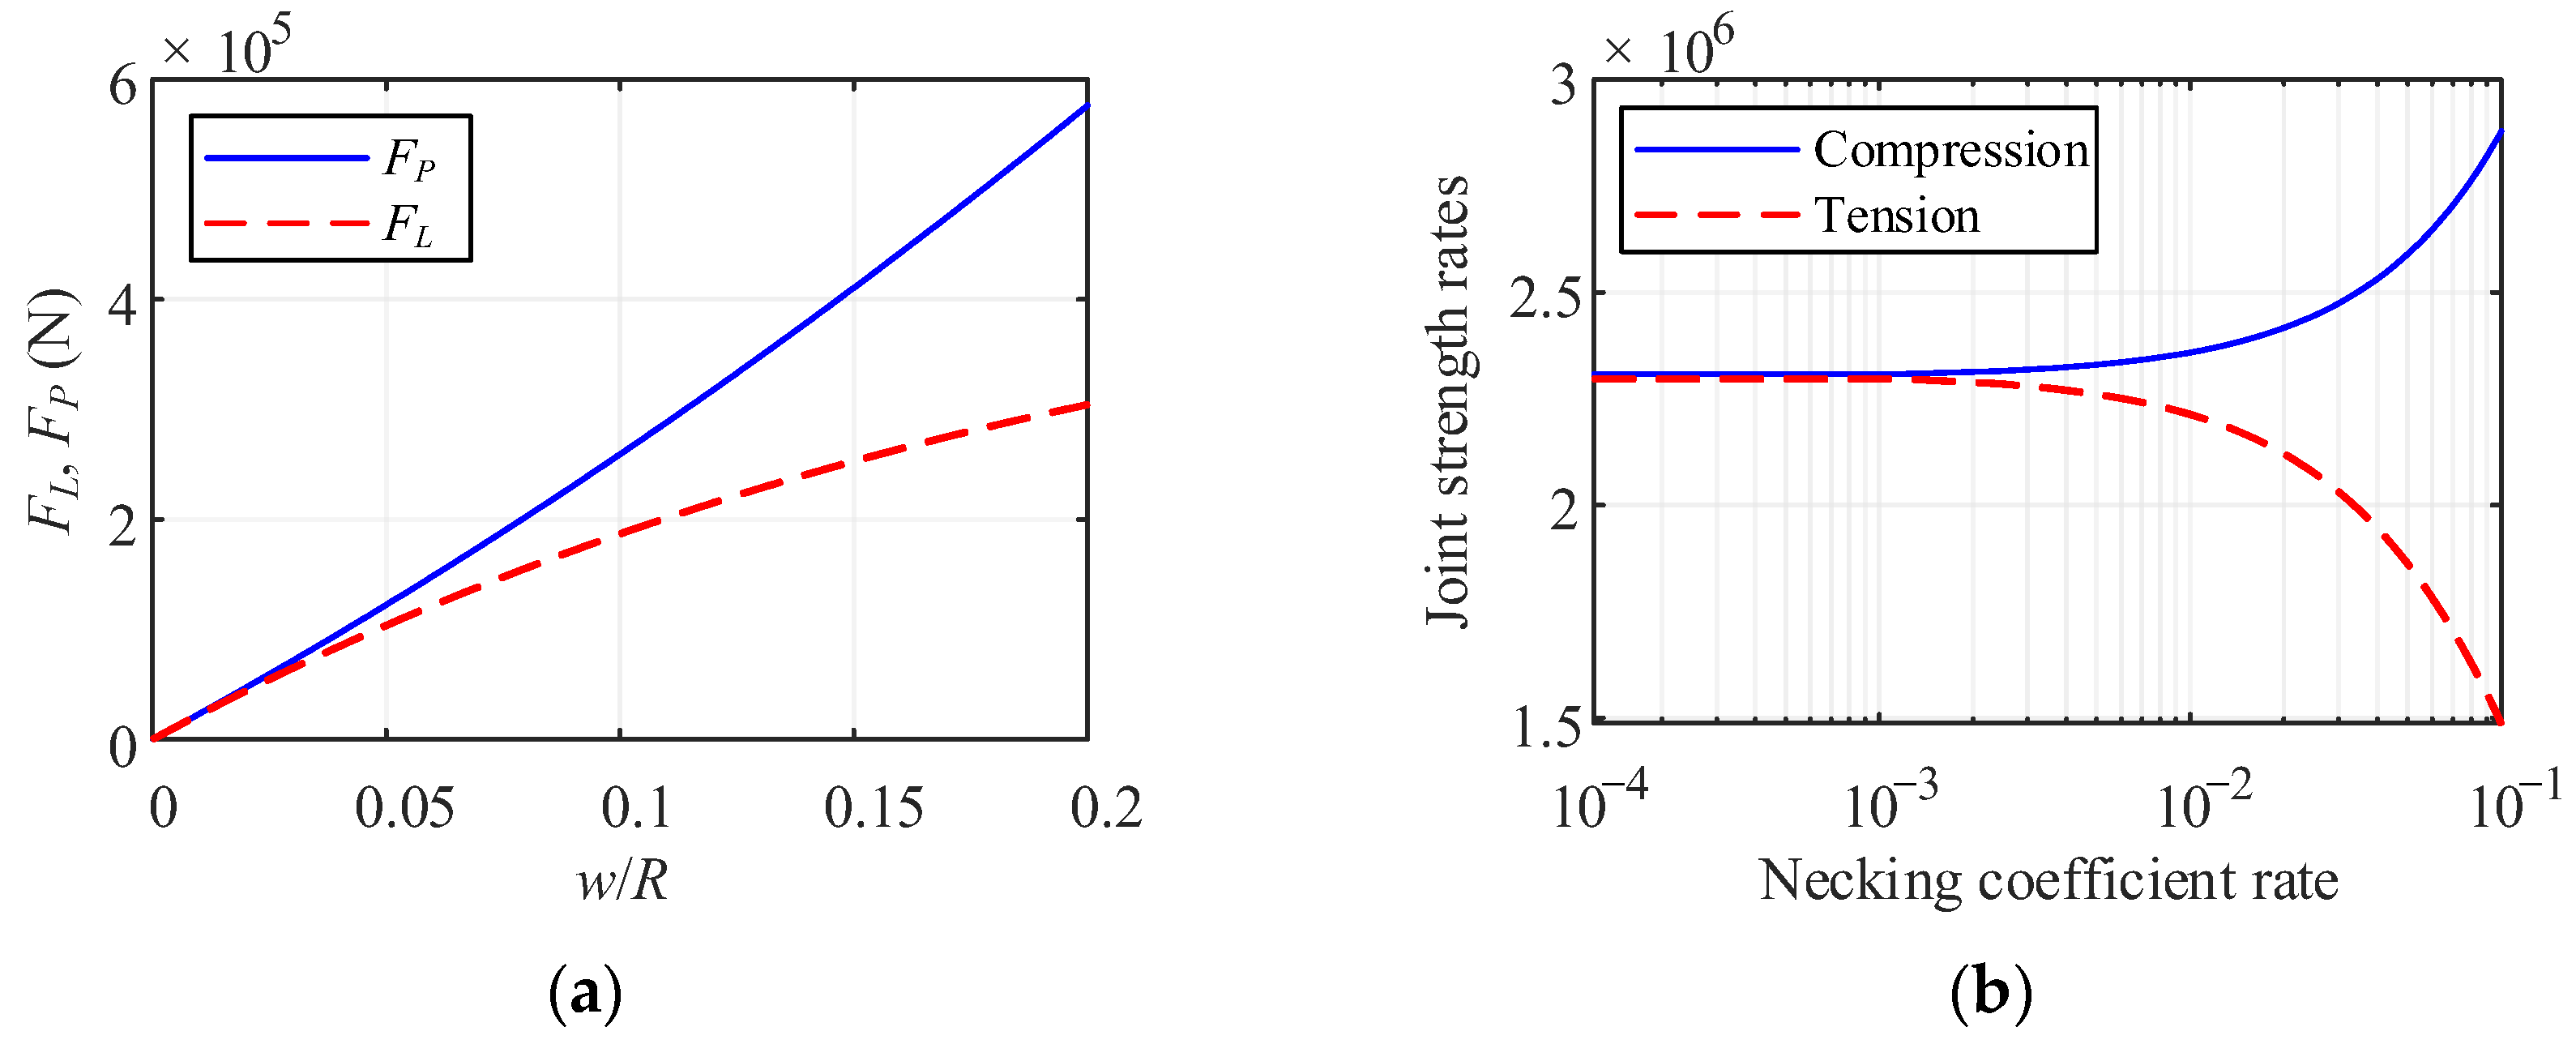
  • Compression strength was proportional to the w / R .
  • The correlation between strength and w / R was approximately linear for compression, and gradually decreased for tension.
  • Trends in the rates of tension and compression strength along with w / R were opposite, and there was a threshold for the w / R rate, within which the strength increase rate was independent of the w / R rate.
  • Compared to the crimped connector [31], a similar trend of F L was observed.
Thickness, δ , is also an important parameter that can affect the joint strength. The strengths as a function of the ratio of δ / R are illustrated in Figure 10a. The change rates of the strengths and δ / R are presented in the semi-logarithmic coordinates in Figure 10b.
The following conclusions were drawn from Figure 10:
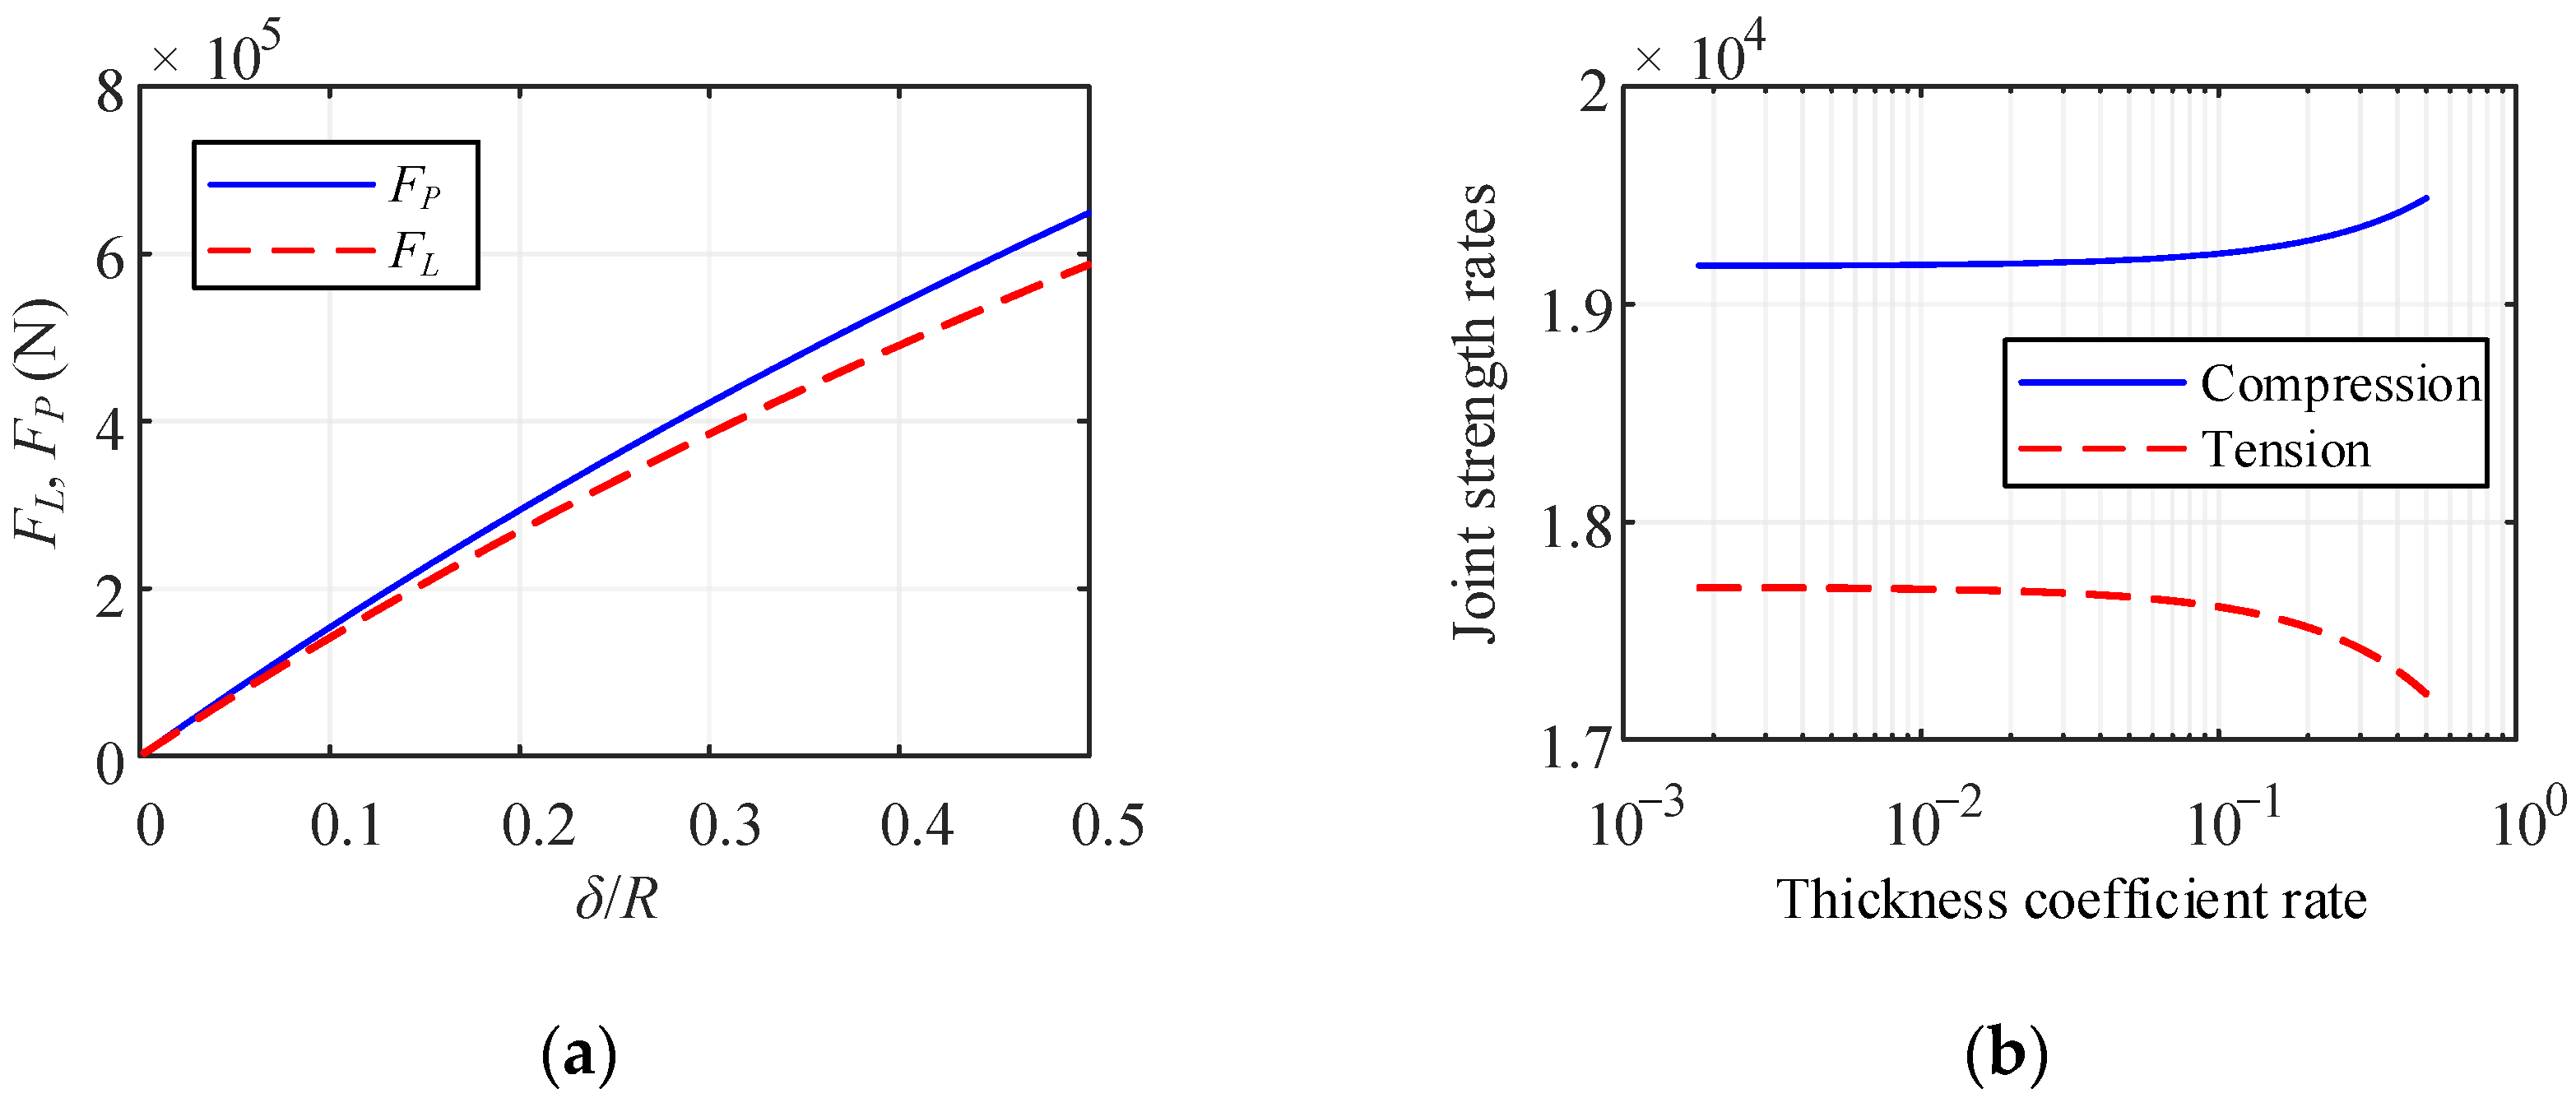
  • The joint strengths increased in proportion to δ / R , with an approximate quadratic relationship.
  • The trends of strengths with δ / R were similar to those with w / R . Within the thin-wall threshold [51], δ / R < 0.05 , the change rates of strengths tended to be constant; when the δ / R 0.05 , the change rates of strengths were inversely proportional to the rate of δ / R .
  • Comparing Figure 10 to Figure 9, the impacts of δ / R and w / R on the strengths were different in magnitude.
  • Compared to the crimped connector [31], a similar trend of δ / R was observed within δ / R < 0.4 , and since then, the trend changed due to the differences in the structure.
The influence of the average half-cone angle, α , is also an important control variable during design. The strengths as a function of α are shown in the Figure 11a, while the change rates of the strengths and α are presented in semi-logarithmic coordinates in Figure 11b.
The following conclusions were drawn from Figure 11:
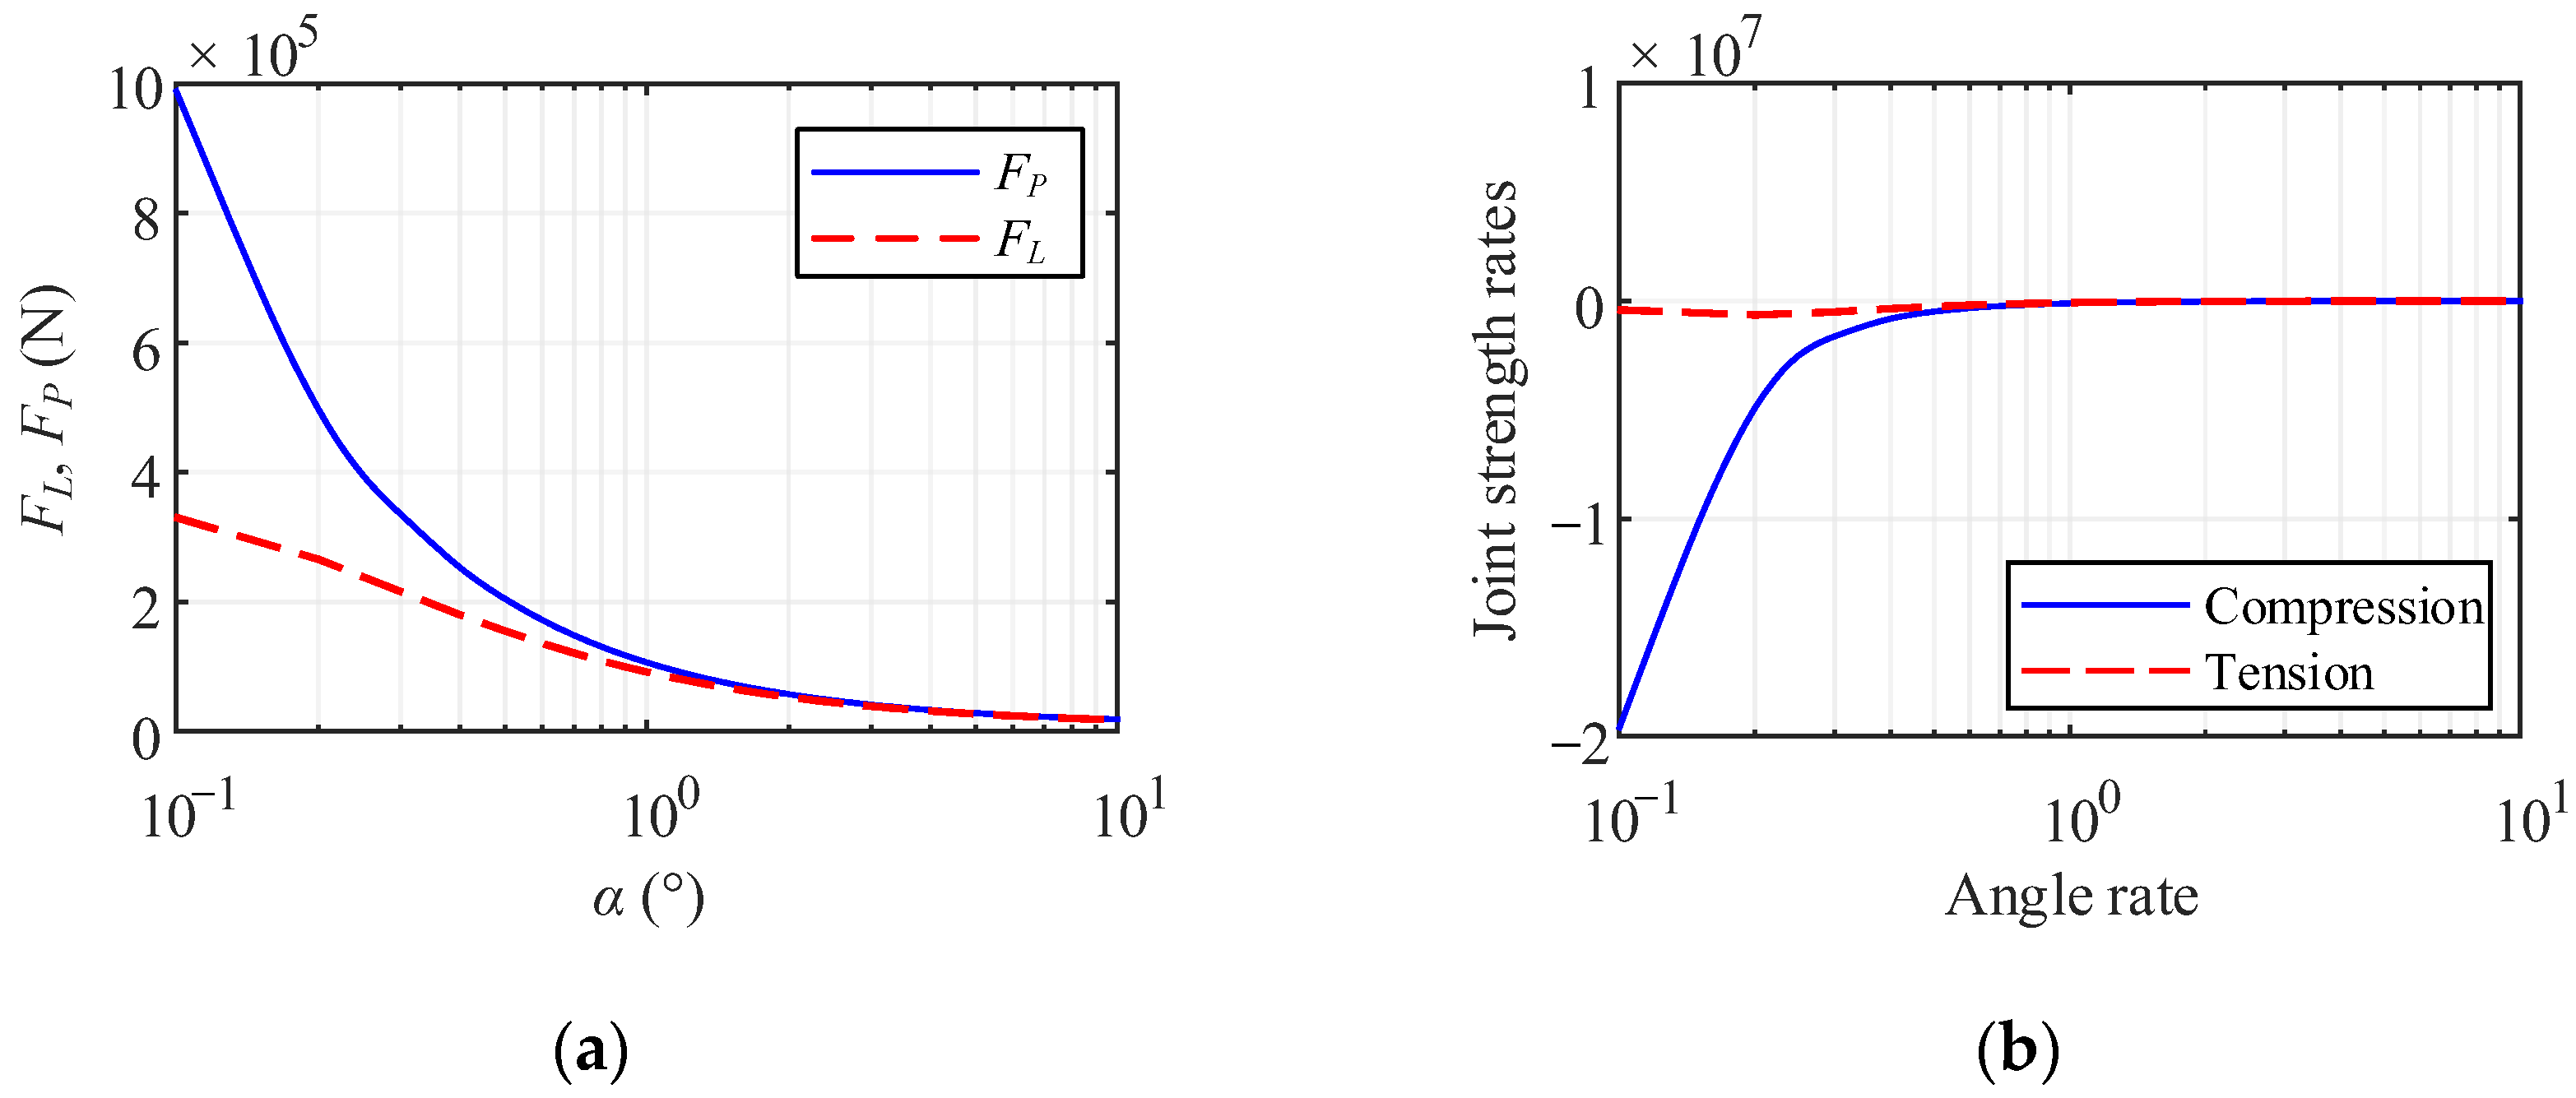
  • Trends in both strengths followed a similar pattern as α increased, and α had a significant impact on the strengths within α < 1 ° ; when α > 2 ° , α had a negligible impact on strength.
  • When α < 1 ° , there were obvious differences in the influence on strengths, and α affected the compression strength more than the tension.
Apart from these parameters, the principles governing the relationship in each formula are self-evident; here, we focus on the sealing performance under overload conditions. During the axial overload, there was a continuous evolution between the sealing surfaces. Figure 12a,b show the evolution of the sealing interface during the overload by Von Mises stress and axial displacement fields, respectively. The result shows that there was a gradual separation of the interface, leading to a slide between surfaces.
To demonstrate the evolution, six channel profiles at representative moments are presented, taken from the middle channel on the interface. Binary progression profiles are illustrated in Figure 13, with the white portion denoting the channel. The order of change is from labels a to f. The data below are the average of all channels along the seal.
According to Section 5, the channel profile in Figure 13 can be converted into the corresponding semi-axis curves, as shown in Figure 14. The height of the leakage channel, h ( x r ) , increased then decreased, while the width of the leakage channel, ζ ( x r ) , gradually increased.
Using the above procedure, the leakage ratio, Q c , under overload conditions was determined by sampling from the FEA results.
Next, the relative displacement under overload conditions was analyzed. Figure 15 shows the joint strength, F s , the axial displacement of the midpoint of the ridge sealing surface, x R , and the change rate of the relative displacement, x r , as a function of the axial displacement of the midpoint of the pipe sealing area, x P .
As shown in Figure 15, the development of the sealing interface can be classified into three stages: Follow (I), Separate (II), and Slide (III). The following conclusions were drawn:
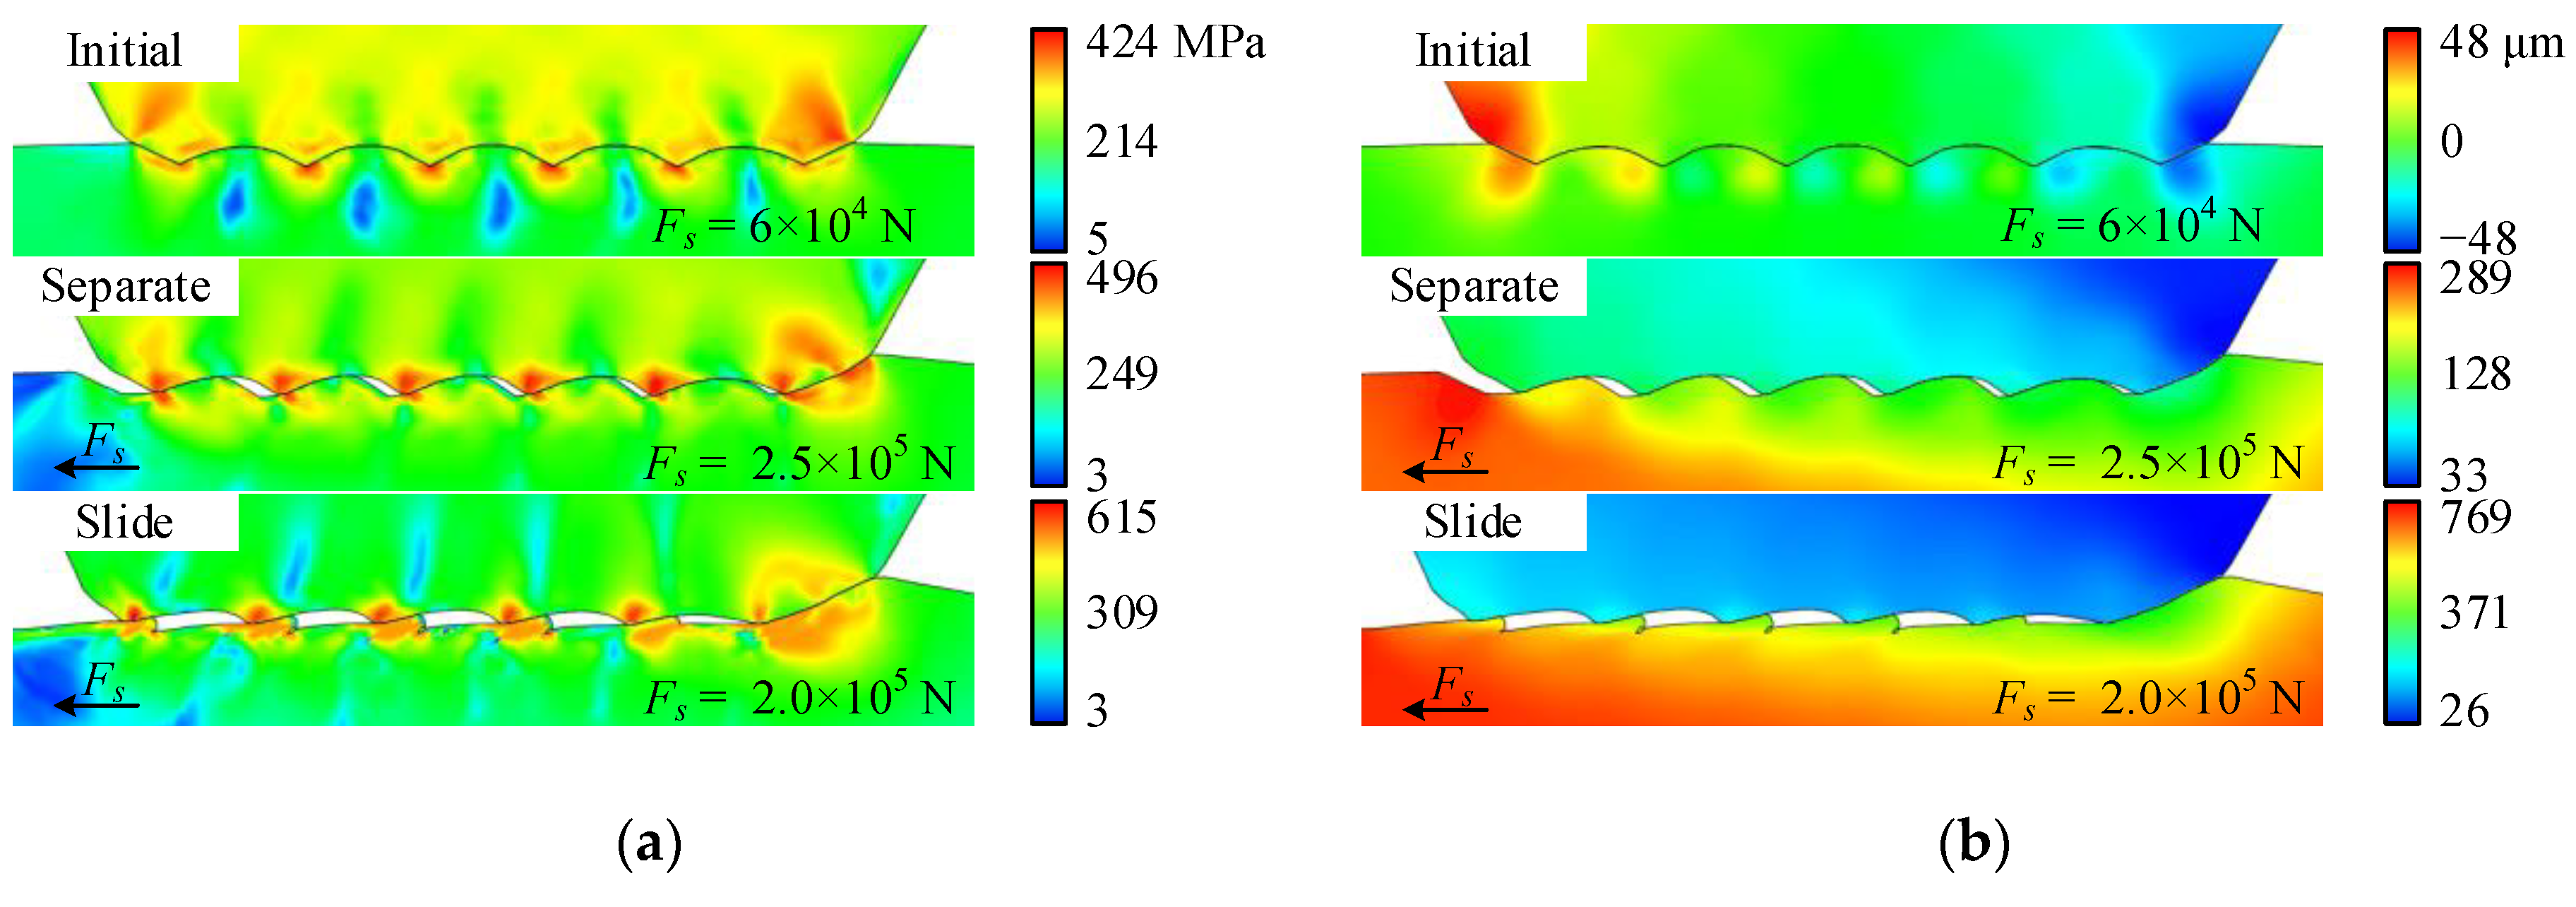
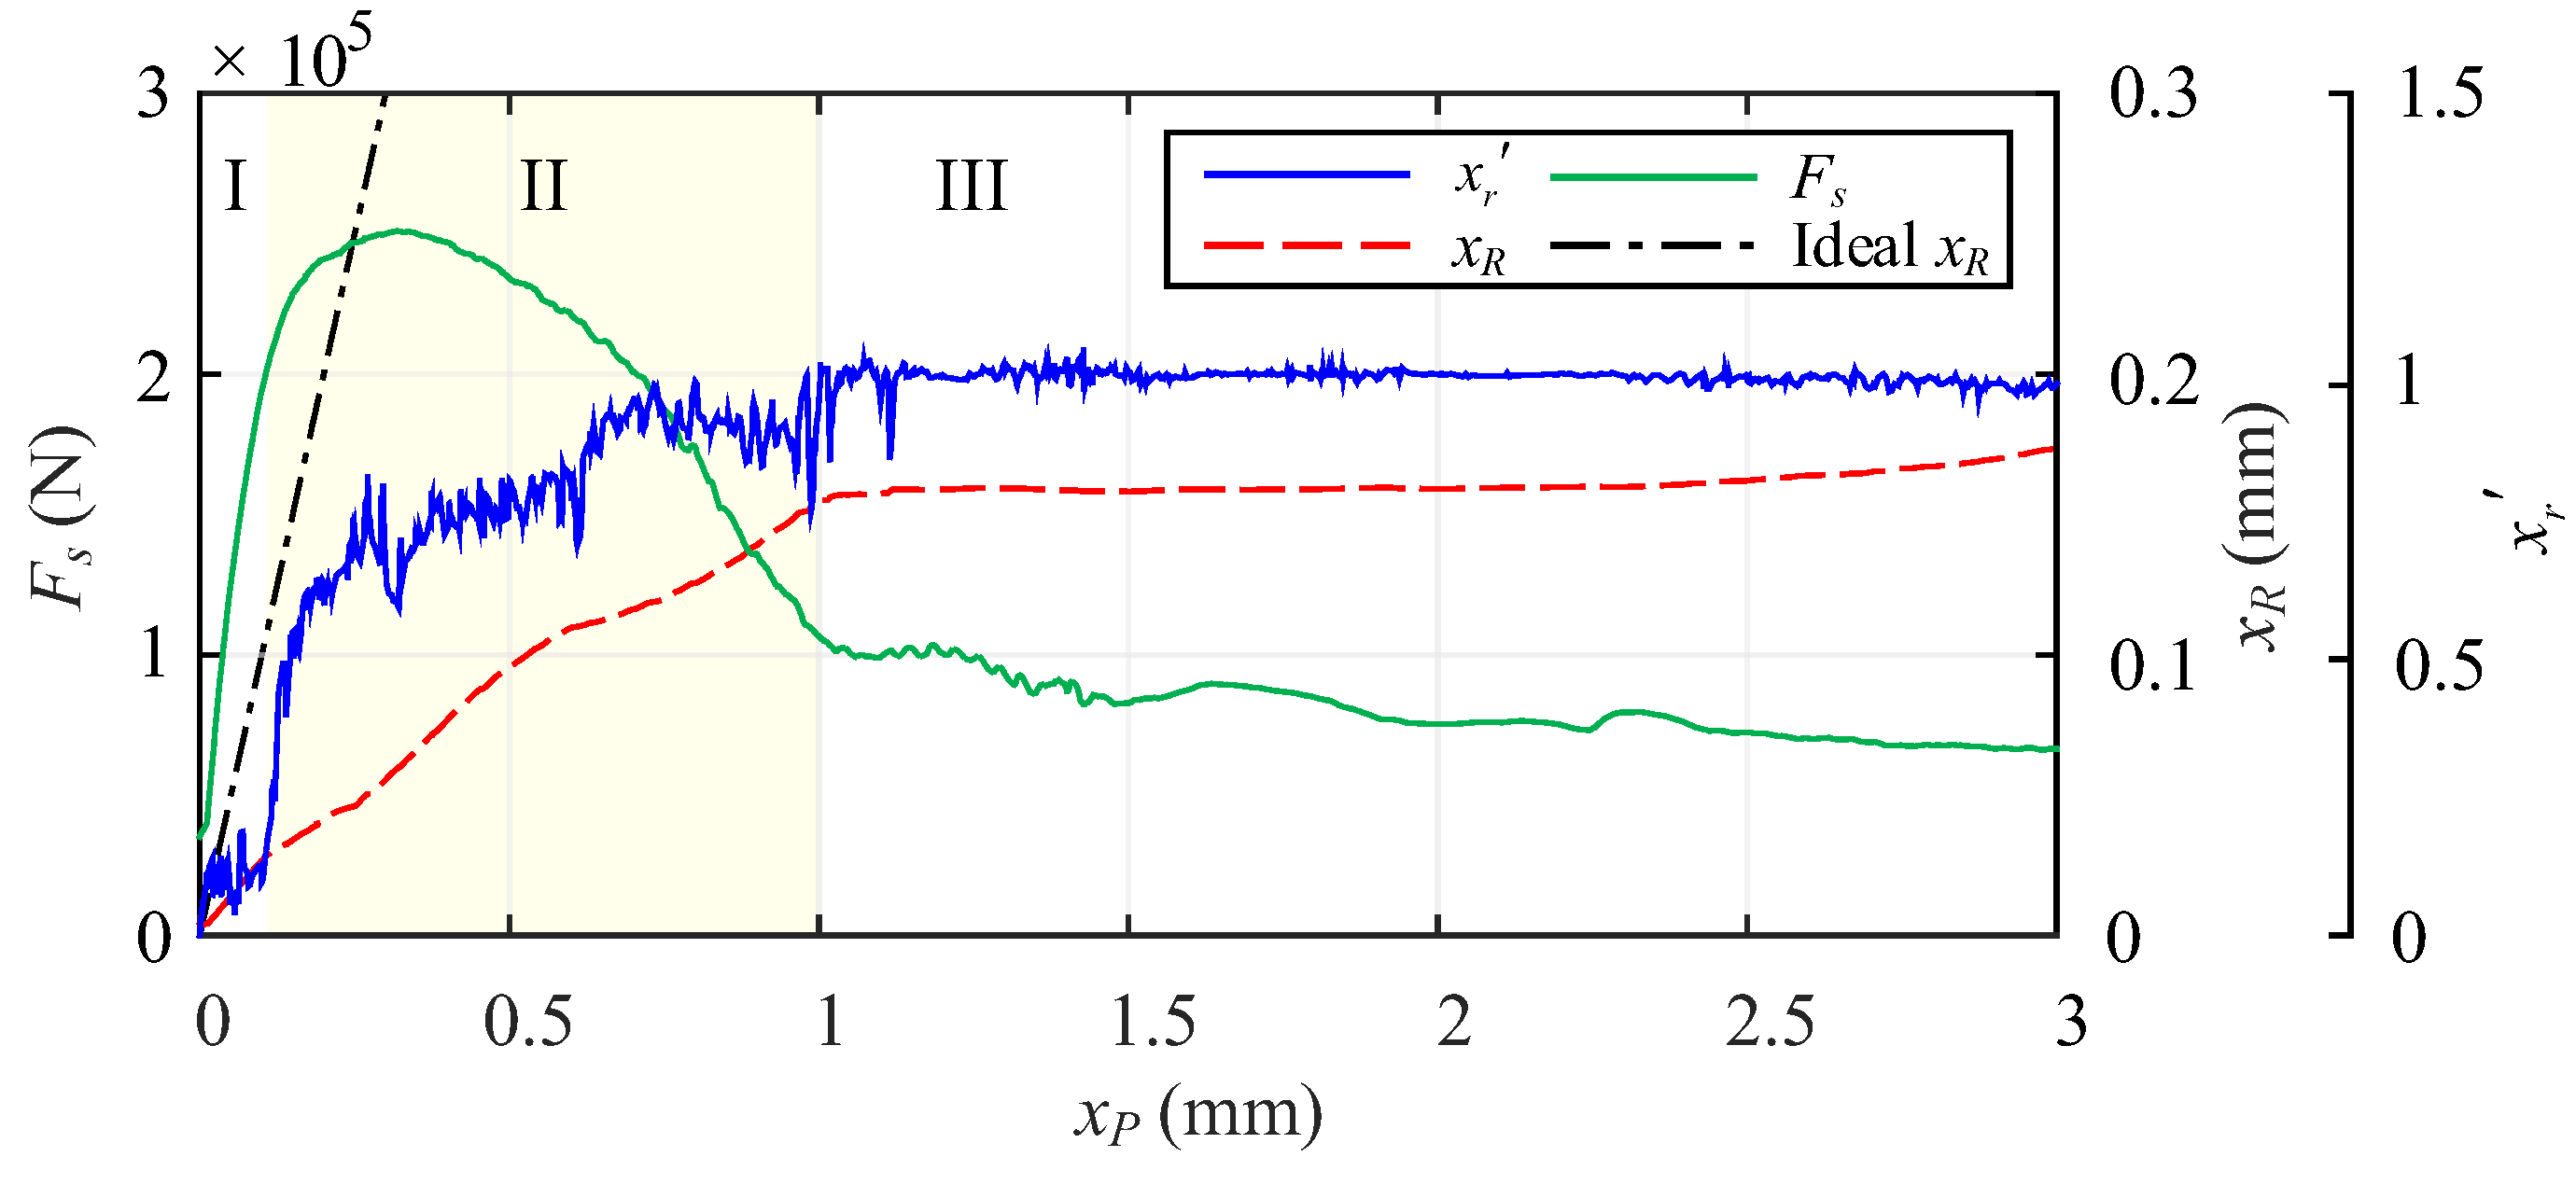
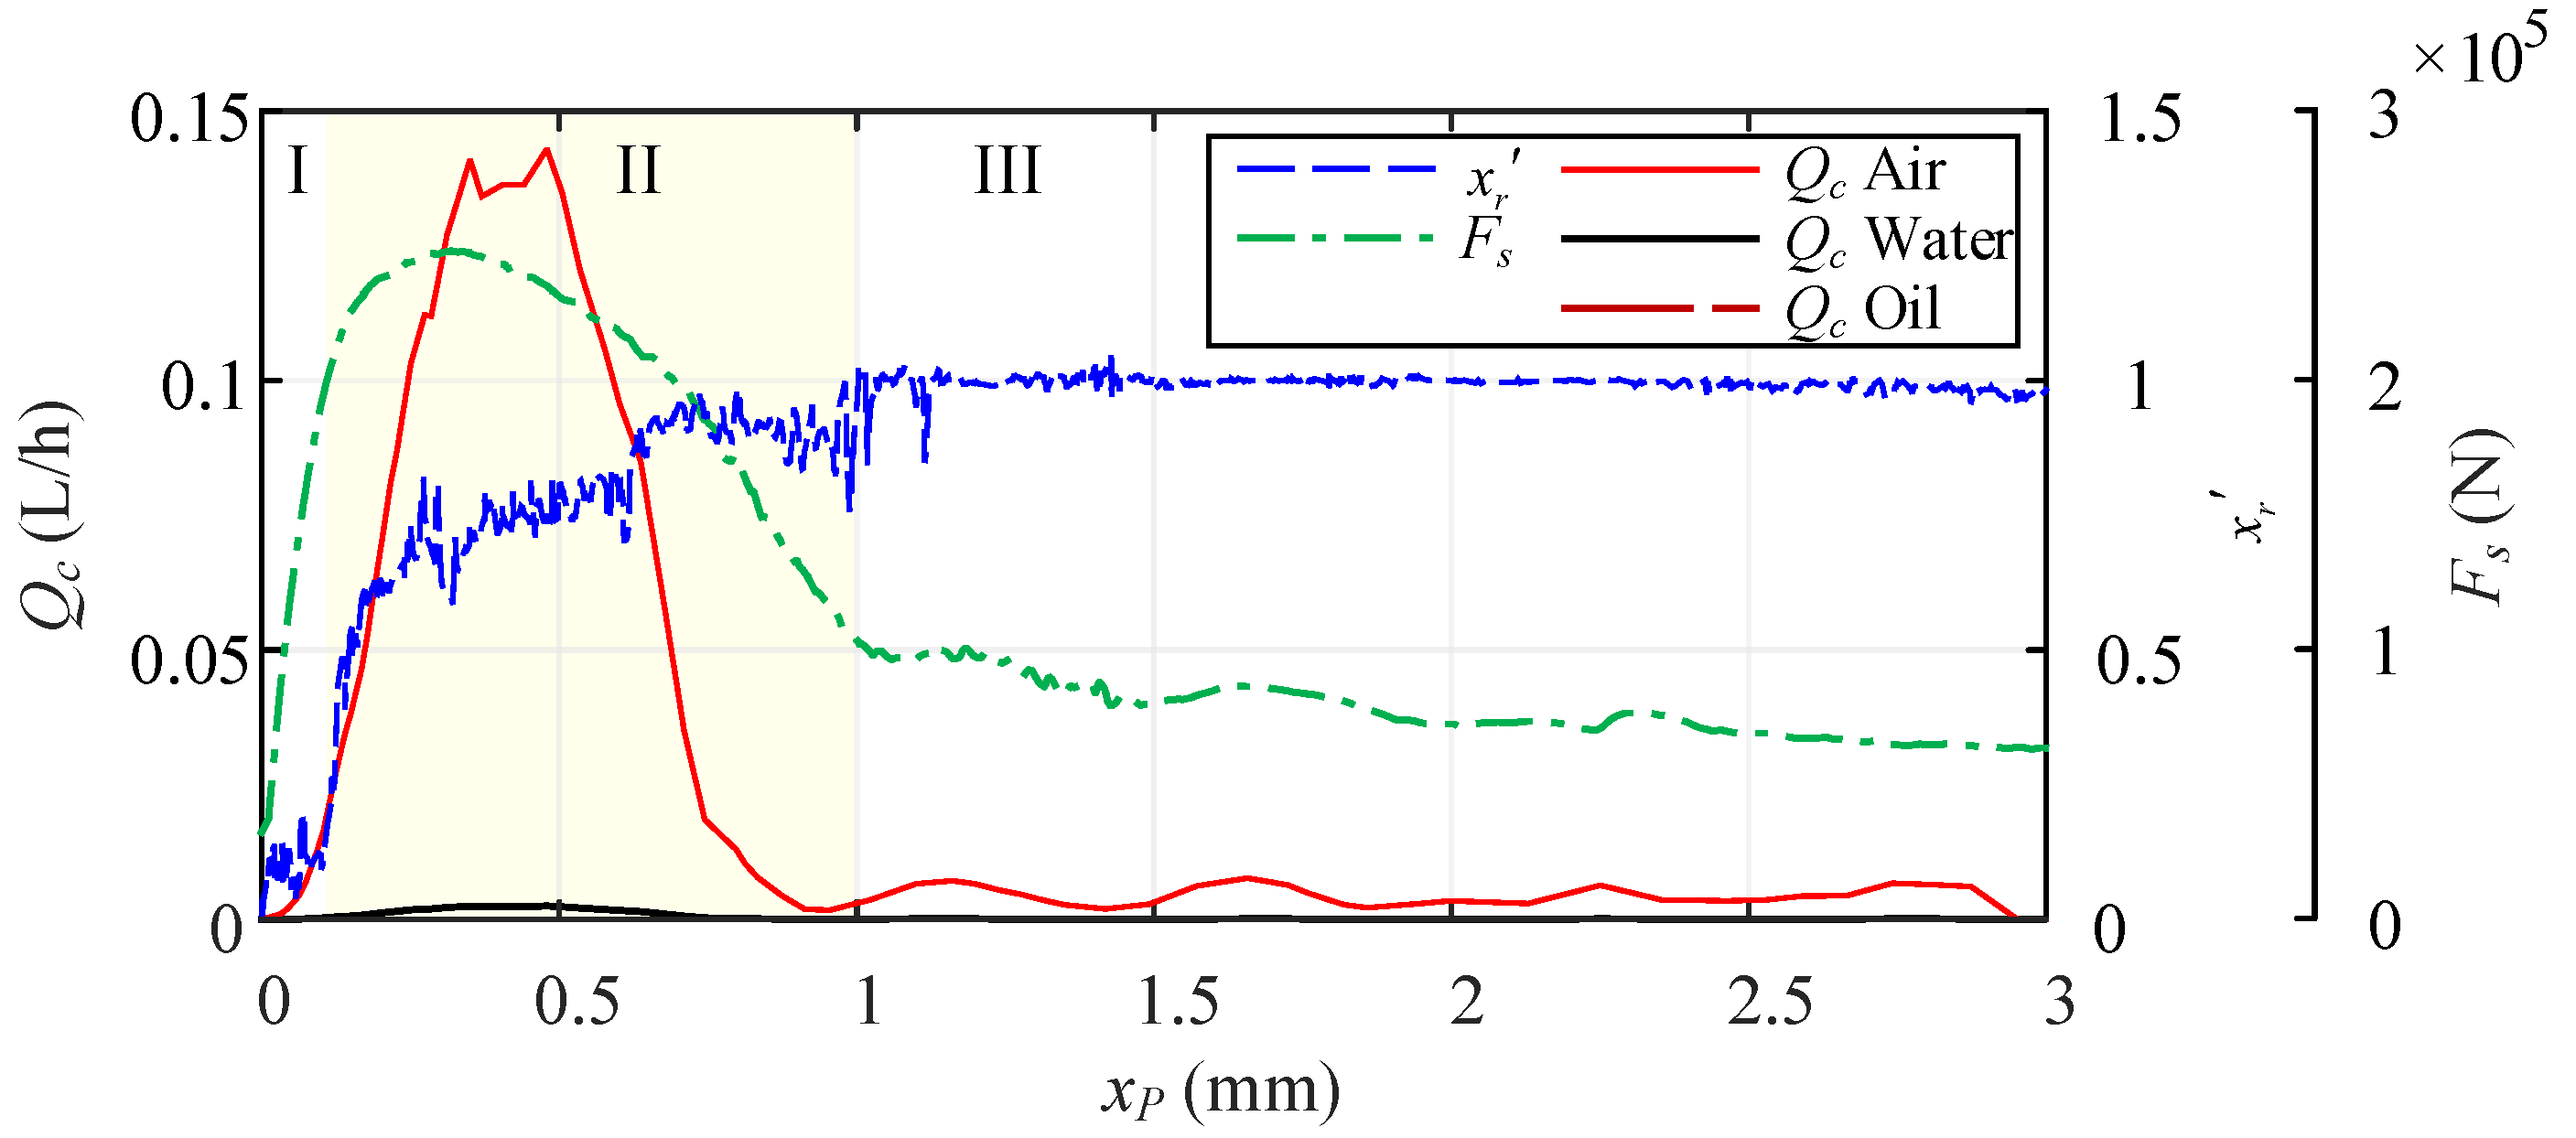
  • In the Follow stage (I), the ridge was pulled by the pipe and the two contact surfaces moved simultaneously. In this stage, F s m a x was reached.
  • In the Separate stage (II), x r was increasing but still less than one, with some plateau periods, indicating that the ridge was still following with the pipe. In this stage, the helical leakage channel occurred.
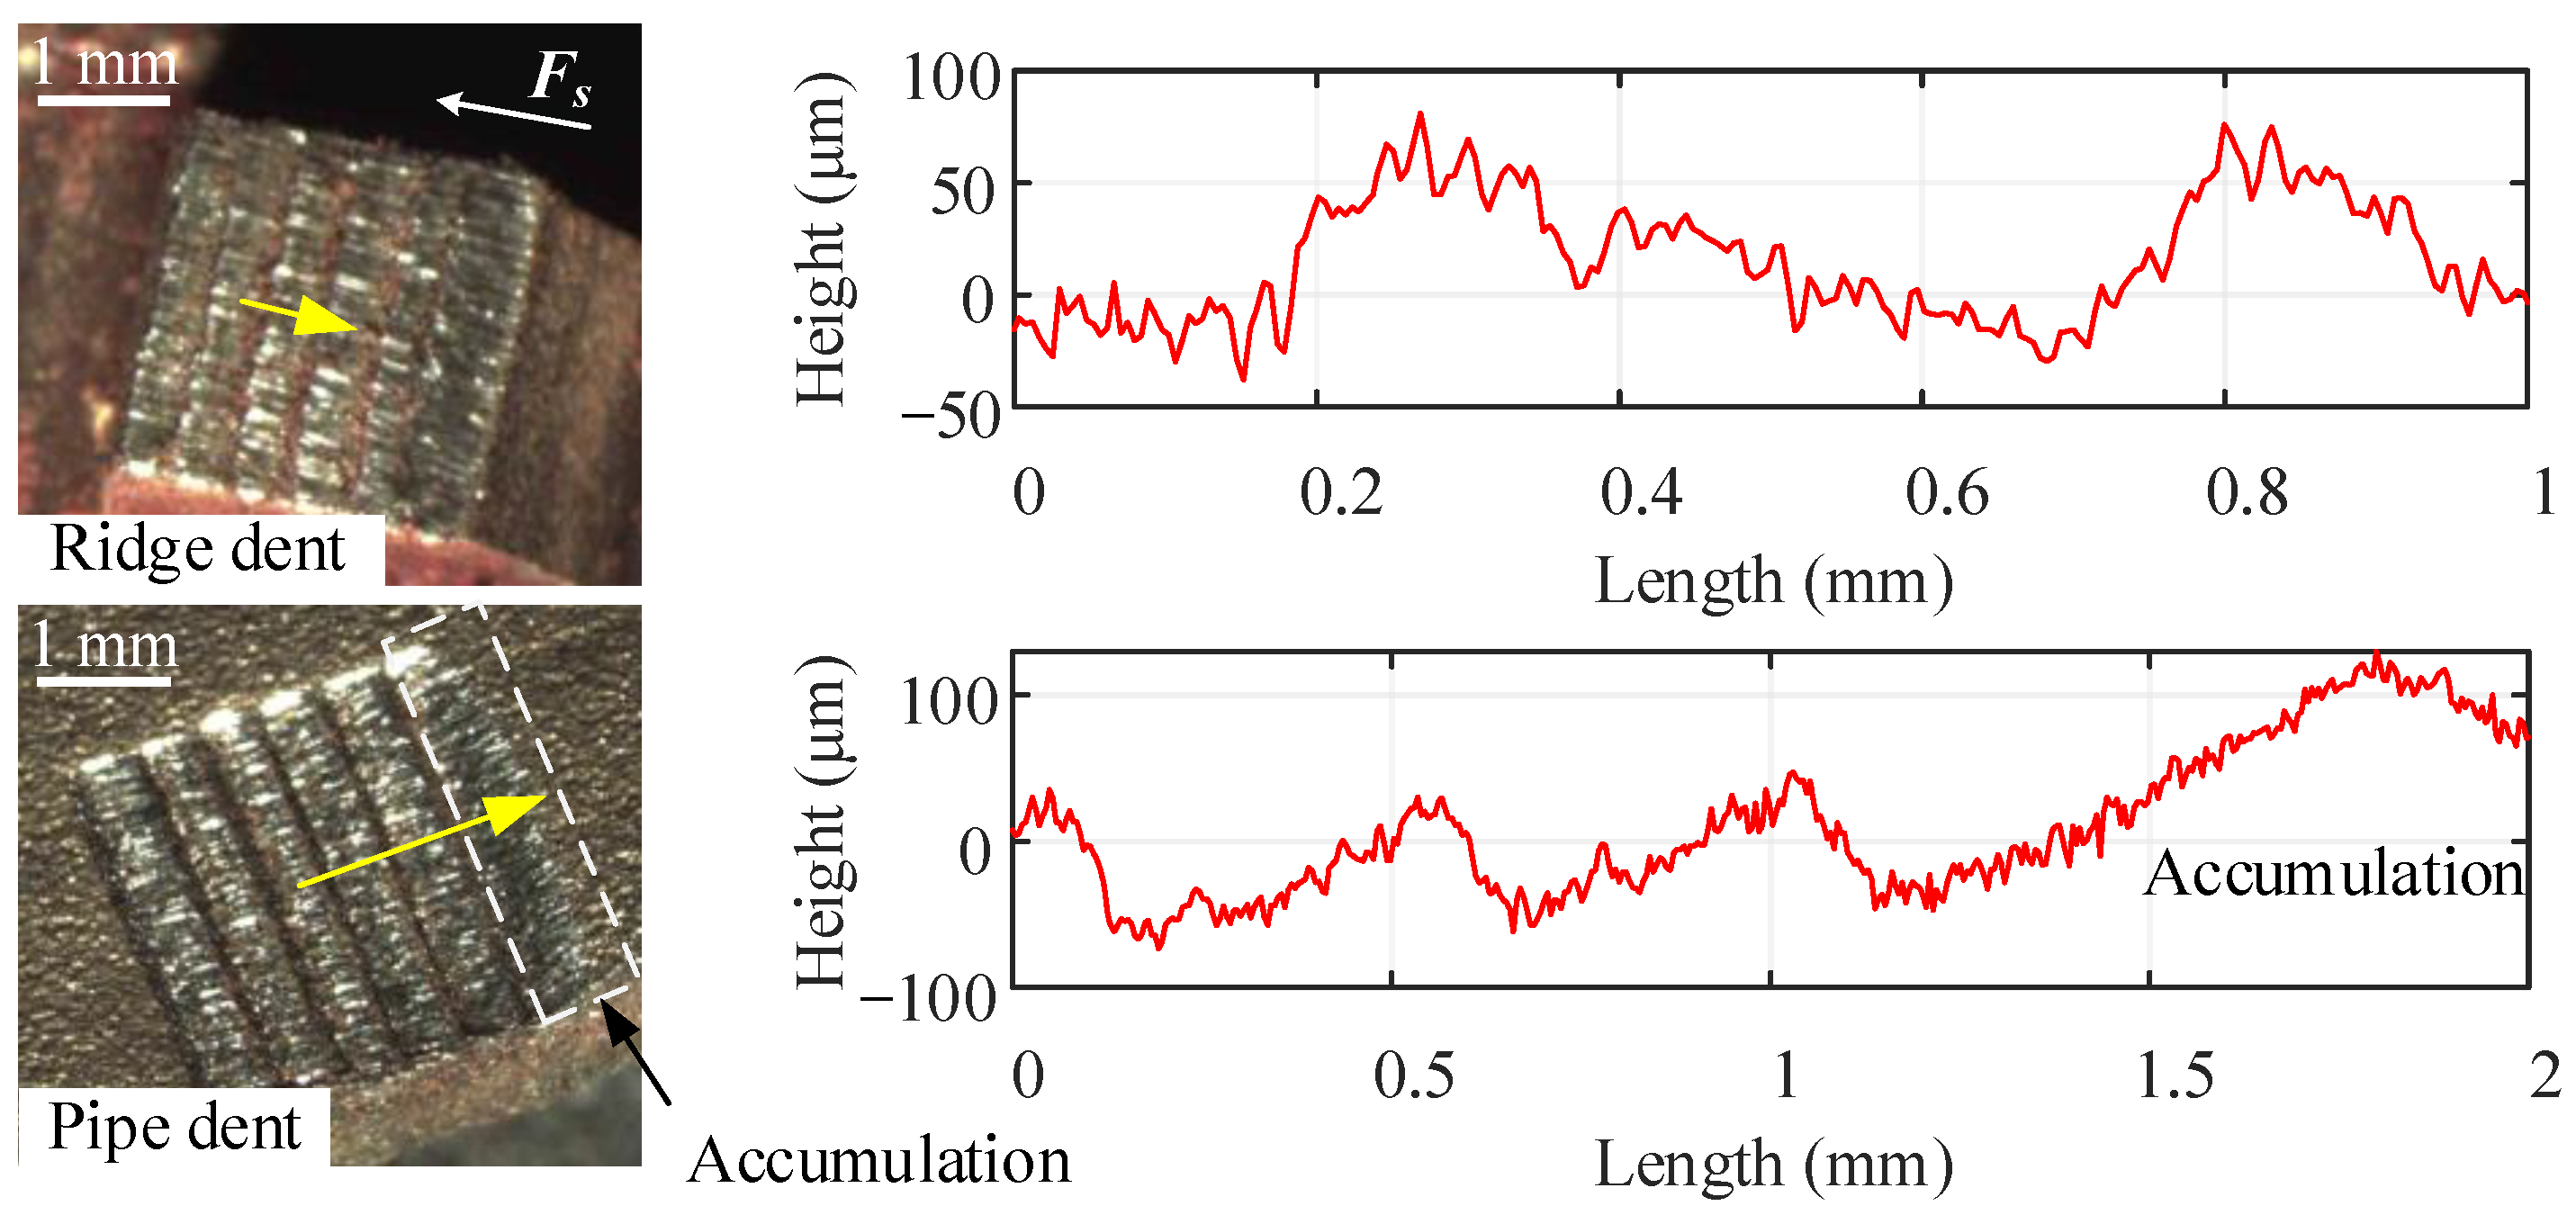
  • In the Slide stage (III), x r was close to one, indicating that the ridge was completely sliding relative to the pipe. The surfaces in this stage would be severely deformed, ploughed [52], and worn.
  • Besides, compared to the crimped connector [31] and the die-less connector [45], a similar trend of F s was observed within x p < 1 ; hence, it can be further analyzed by the force–strain curve [45] to identify the plastic deformation of the whole prototype and the beginning of the relative movement between the joint partners.
Based on the above analysis, the theoretical leakage ratio can be evaluated. The typical leakage ratios of air ( η = 1.77 × 10⁻⁵ Pa·s), water ( η = 1.01 × 10⁻³ Pa·s), and oil ( η = 1.50 Pa·s), with inlet pressure, p i = 1 MPa, and outlet pressure, p o = 101 kPa, were calculated and presented in the semi-logarithmic coordinates in Figure 16. The corresponding F s and x r are also displayed.
The following conclusions were drawn from Figure 16:
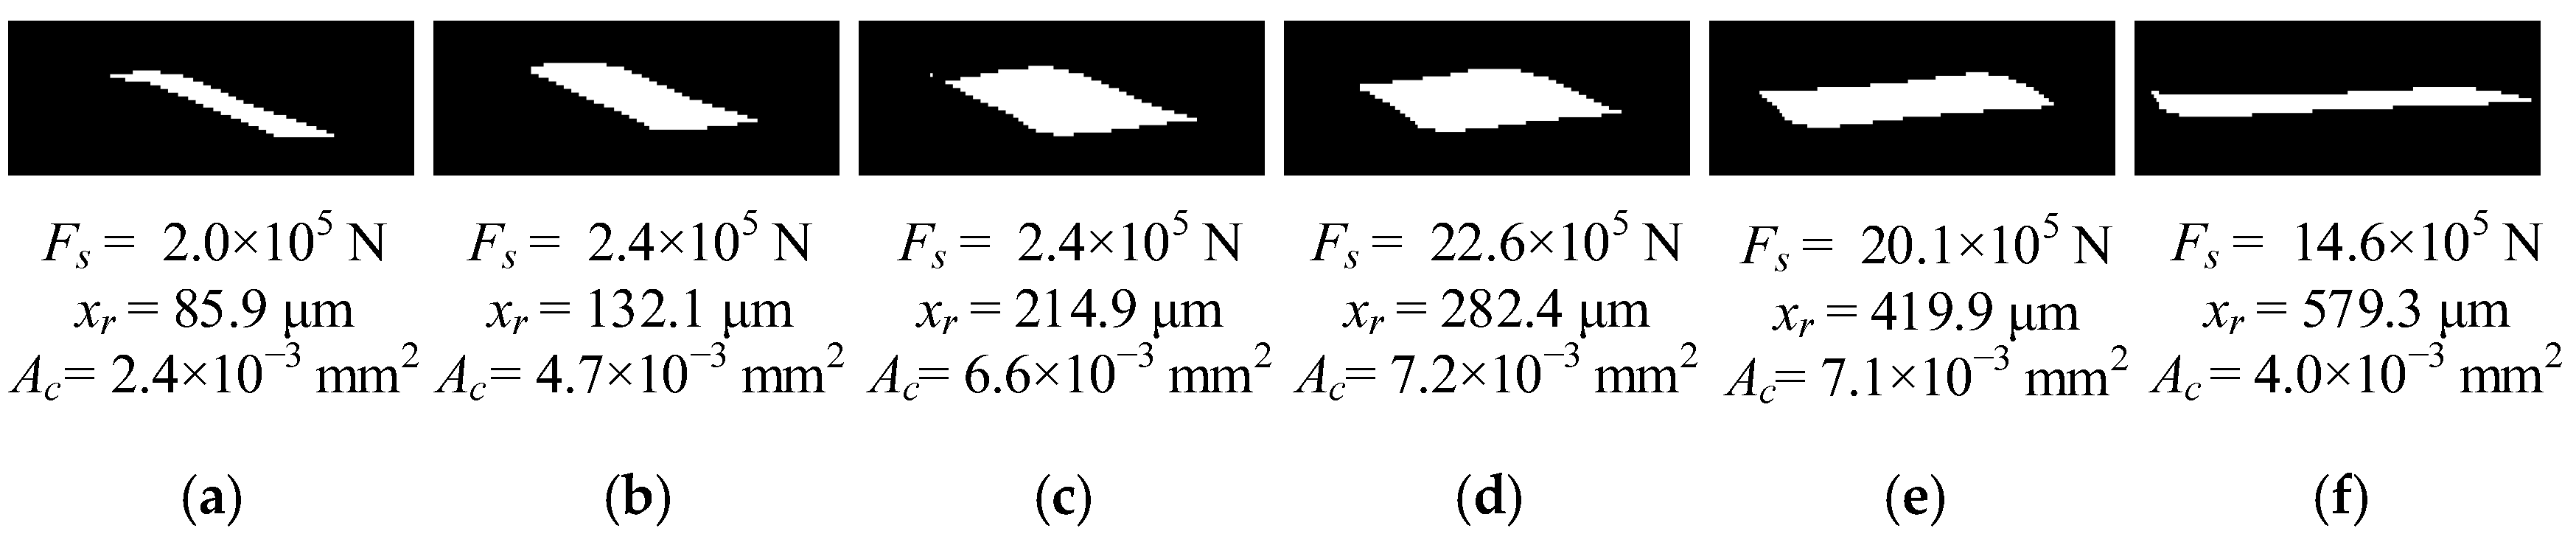
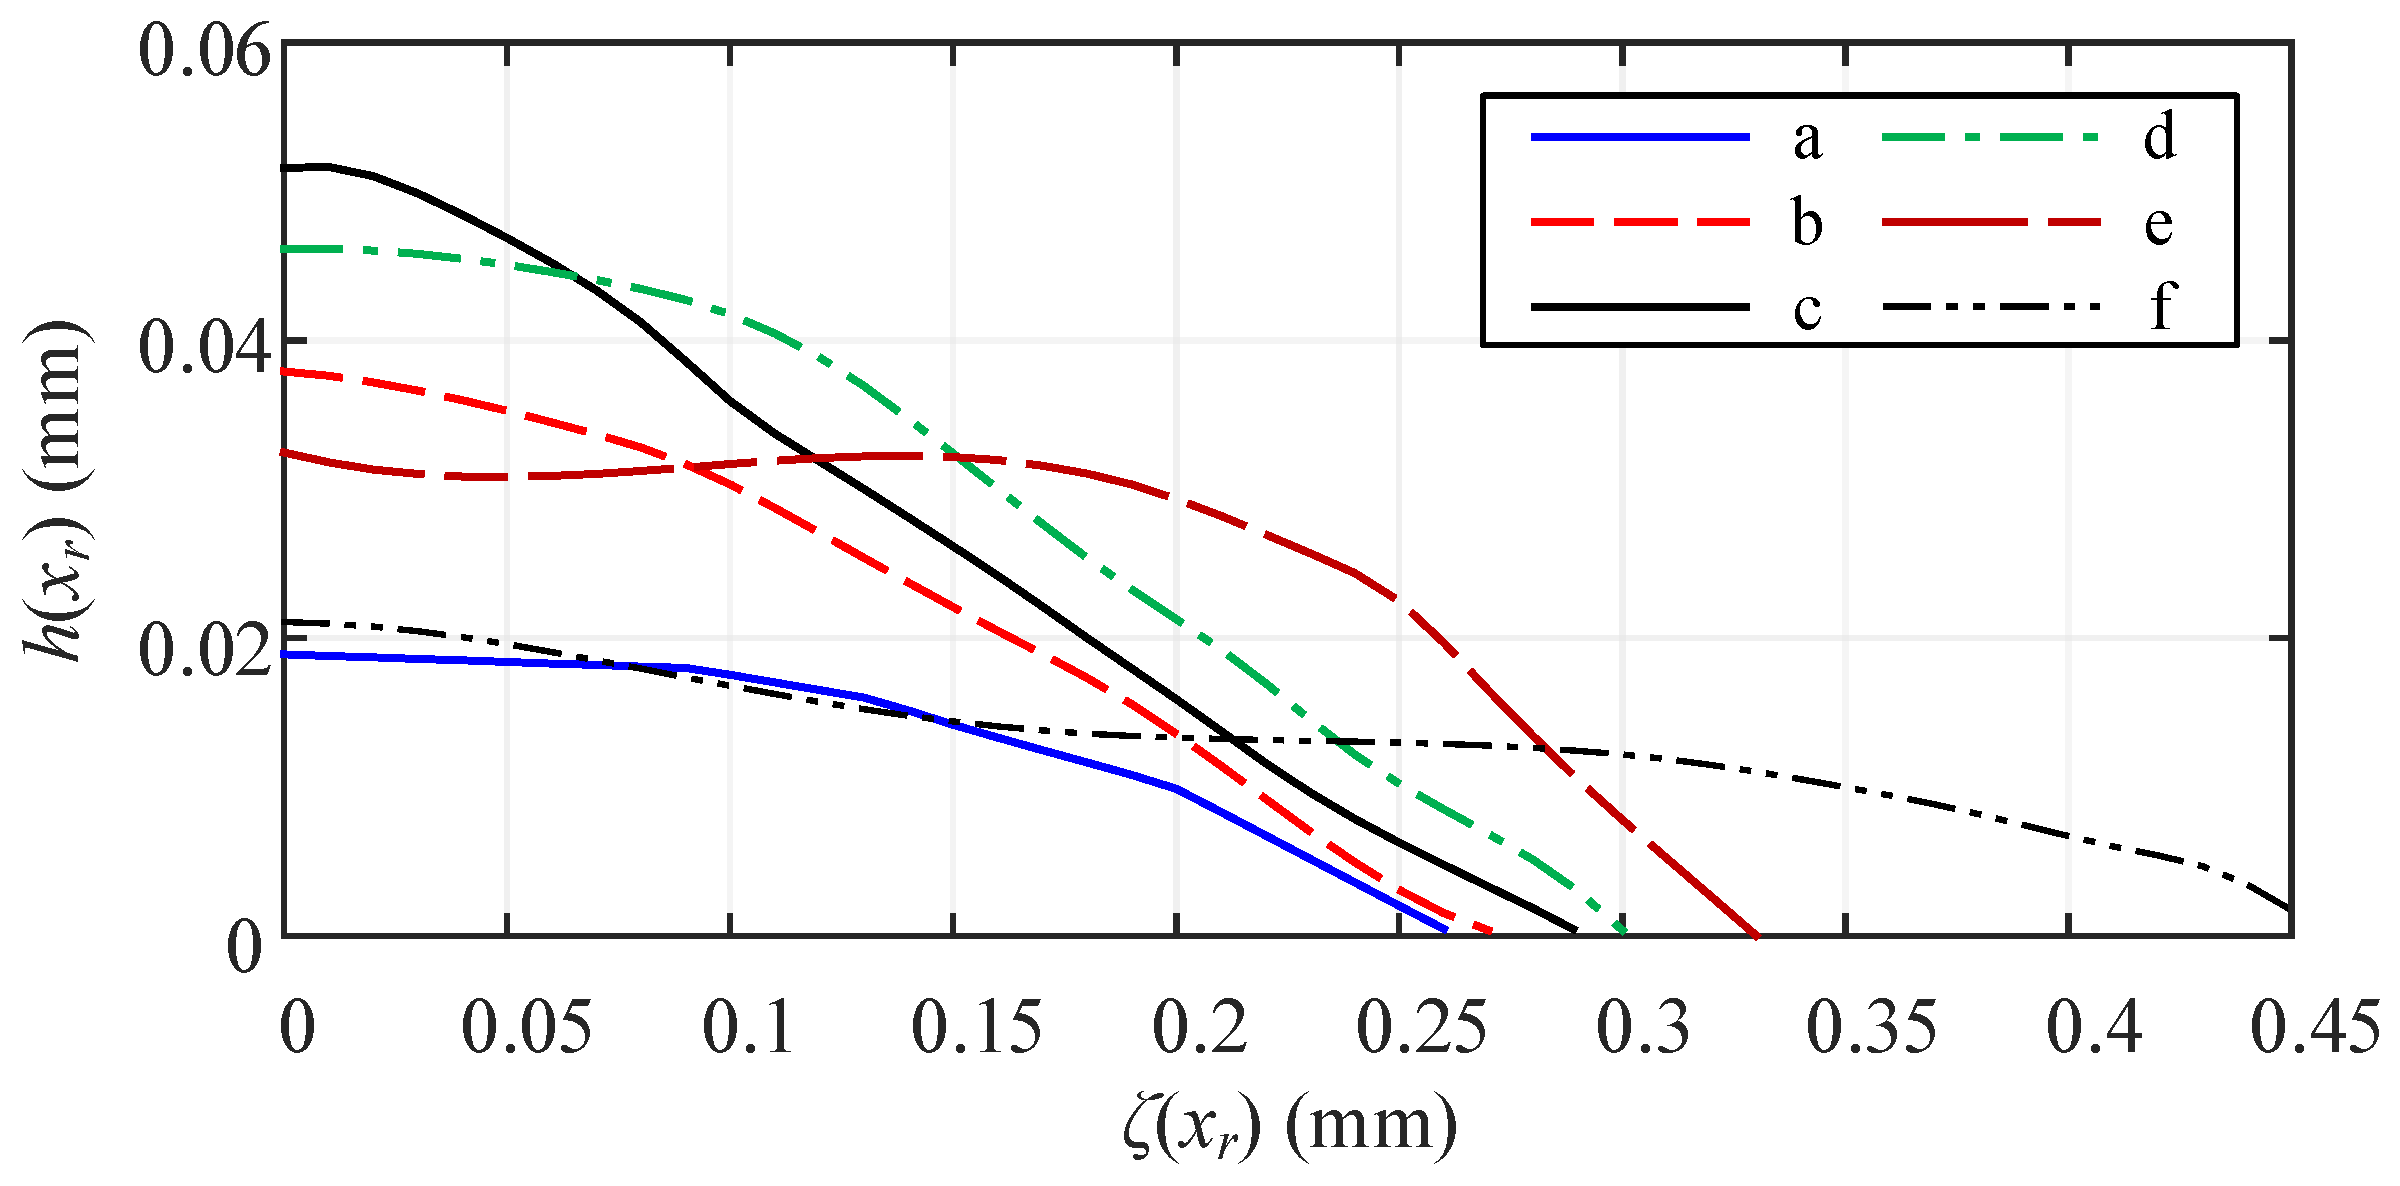
  • The highest leakage ratio occurred in the Separate stage, while the Follow and Slide stages had relatively low leakage ratios.
  • The maximum Q c occurred after F s m a x , indicating that the compression-type connector has an excellent overload ability.
  • In the Slide stage, Q c experienced minor fluctuations, in accordance with topography engagement. Although L c was shortened, the change in the leakage ratio was low because h ¯ was reduced.
In addition, the FEA results showed that there was a material accumulation on the colliding side where the sealing edge meets the ridge, potentially impacting the leak.

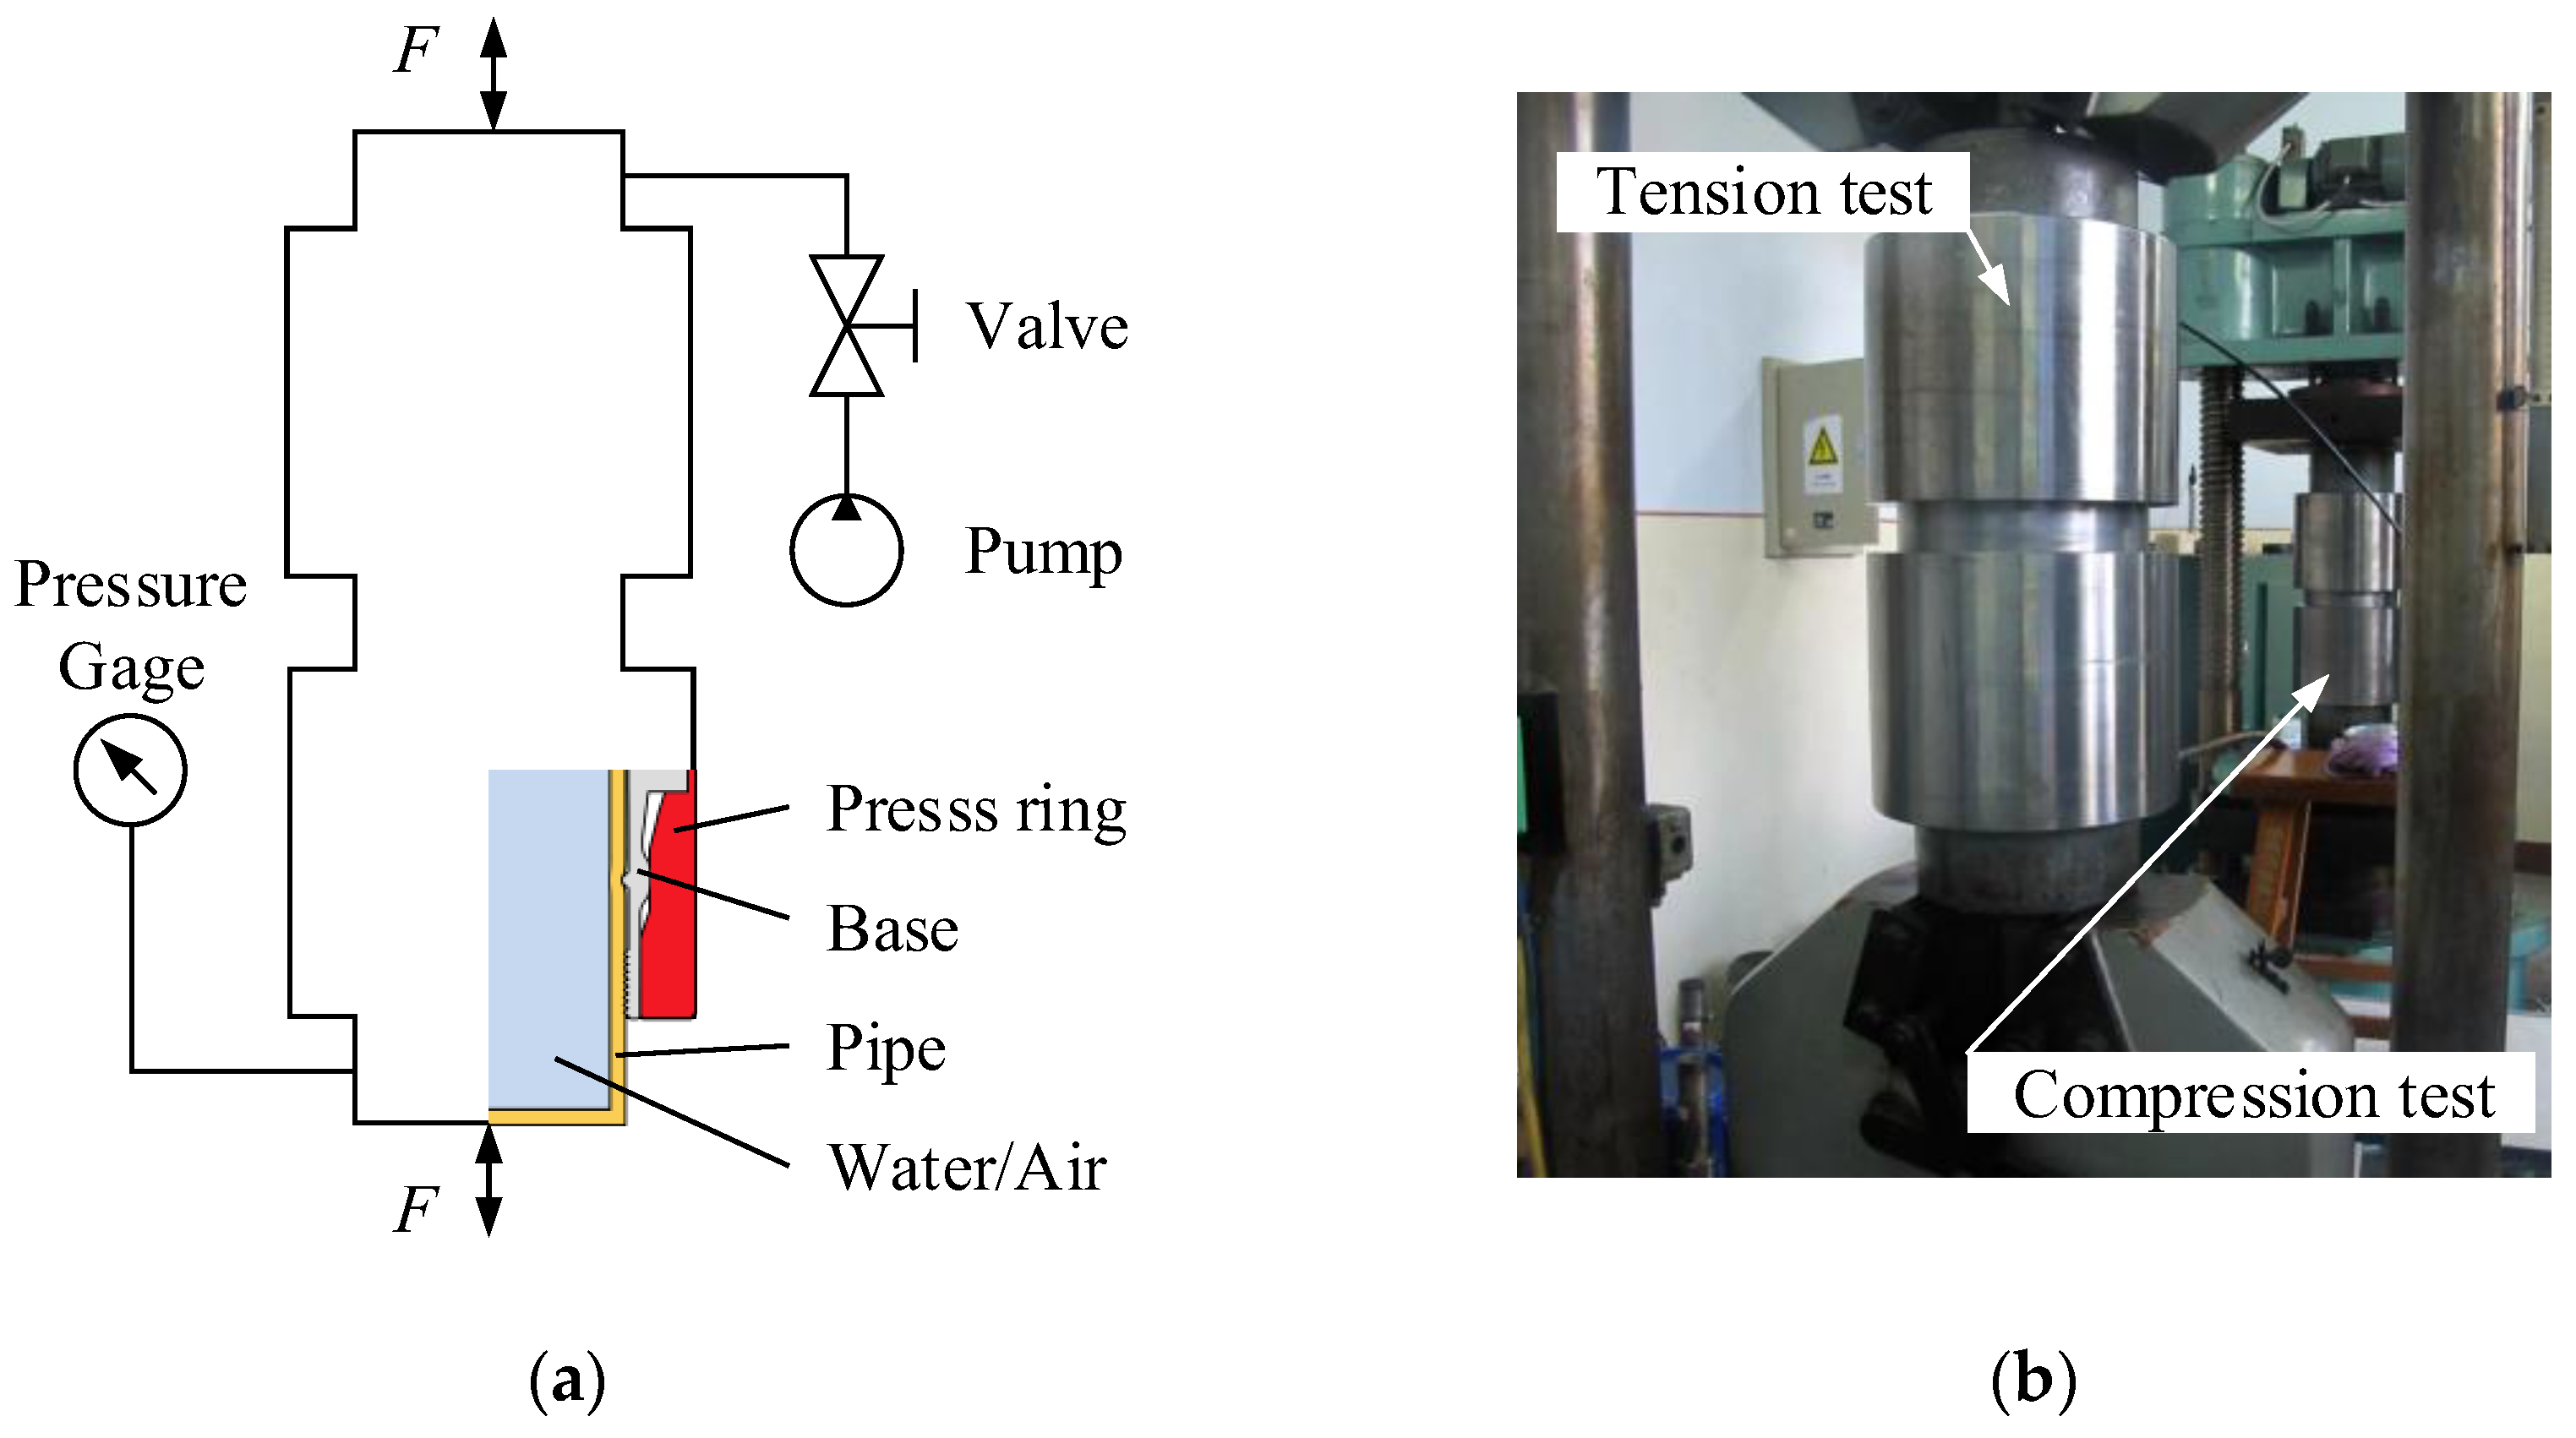
6.2. Experimental Tests

Two types of overload tests were conducted: one was an axial shear test that uses specimens to observe the topography evolution under the axial shear load, and the other was a tension and compression test that uses full-scale prototypes to qualitatively evaluate the overload sealing performance.

6.2.1. Axial Shear Test

The evolution of the sealing interface under the shear load was assessed using a common approximation method for bolted joints, which suggests flattening the sealing surface from the cylinder into a plane [53]. A schematic diagram of the test setup is shown in Figure 17a. The test process was to apply an equivalent vertical sealing pressure, P , to achieve the sealing state, followed by an equivalent horizontal shear force, F s , to induce the shear load at the interface and produce the relative displacement, x r . To apply loads and displacement, an YZJ-50 direct-shear device with a maximum capacity of 5 × 10⁵ N was used.
Specimens are shown in Figure 17b, and the local view of the seal is shown in Figure 17c. The turning surface was simplified to an even-square area with straight streaks. To enhance the identification of deformation, the streaks were made more obvious than the actual turning surface. The thickness of the pipe specimen was designed to minimize the impact on the surface deformation. All specimens were designed for the easy replacement.
To analyze the deformation of the topography, an optical stereomicroscope was used, the Stereo Discovery V. 12. Additionally, to compare the surface waviness and roughness, a Bruker Profile GT-K optical profiler with a maximum lateral resolution of 3.8 × 10⁻⁴ mm was used. To avoid the edge effect, the sampling was conducted in the middle of indentation. The measurement length was 1 mm, and the lateral resolution was 1.5 × 10⁻³ mm. The typical results are shown in Figure 18, Figure 19 and Figure 20, with arrows indicating the measuring location, direction, and length.
The initial condition of the specimens is shown in Figure 18, where we selected 1 mm as the evaluation length. For the pipe, the surface roughness, R a , was grade 6.3 [54], and the total profile height, R t = 37.78 mm; for the ridge, R t = 135.59 mm, and R a was grade 6.3 when sampled parallel to the streaks. For streaks, the mean height variation over all evaluation lengths was 2.64%, which was mainly due to the edge effect and the machining error.
For the vertical compacted surfaces shown in Figure 19, the streak peaks were slightly flattened. The surface roughness increased due to hardening, ranging from grades 6.3 to 12.5. For the waviness, the mean deviation between the test and the FEA results was 4.28% for the ridge and 4.62% for the pipe. The error was acceptable, and the deformation trend between the test and the FEA was consistent.
Figure 20 shows the topography after the overload by averaging multiple results. Both surfaces exhibited severe plastic deformation with a distinct bright contact area, suggesting the presence of the high-pressure zones. The amplitude of surface waviness further decreased, and there was a ploughing phenomenon [52] along the overload direction, resulting in an uneven increase in roughness. For the waviness, the mean deviation between the test and the FEA results was 5.93% for the ridge and 6.85% for the pipe. Accumulation was also observed on the colliding side of the specimens. The deformation trends of the test and the FEA were consistent. The area suffered severe plastic deformation and ploughing, and the width of the contact increased.
In order to examine the sealing pressure during the overload, the mean sealing pressure at each streak as a function of pipe displacement is shown in Figure 21 based on the FEA results.
The following conclusions were drawn from Figure 21:
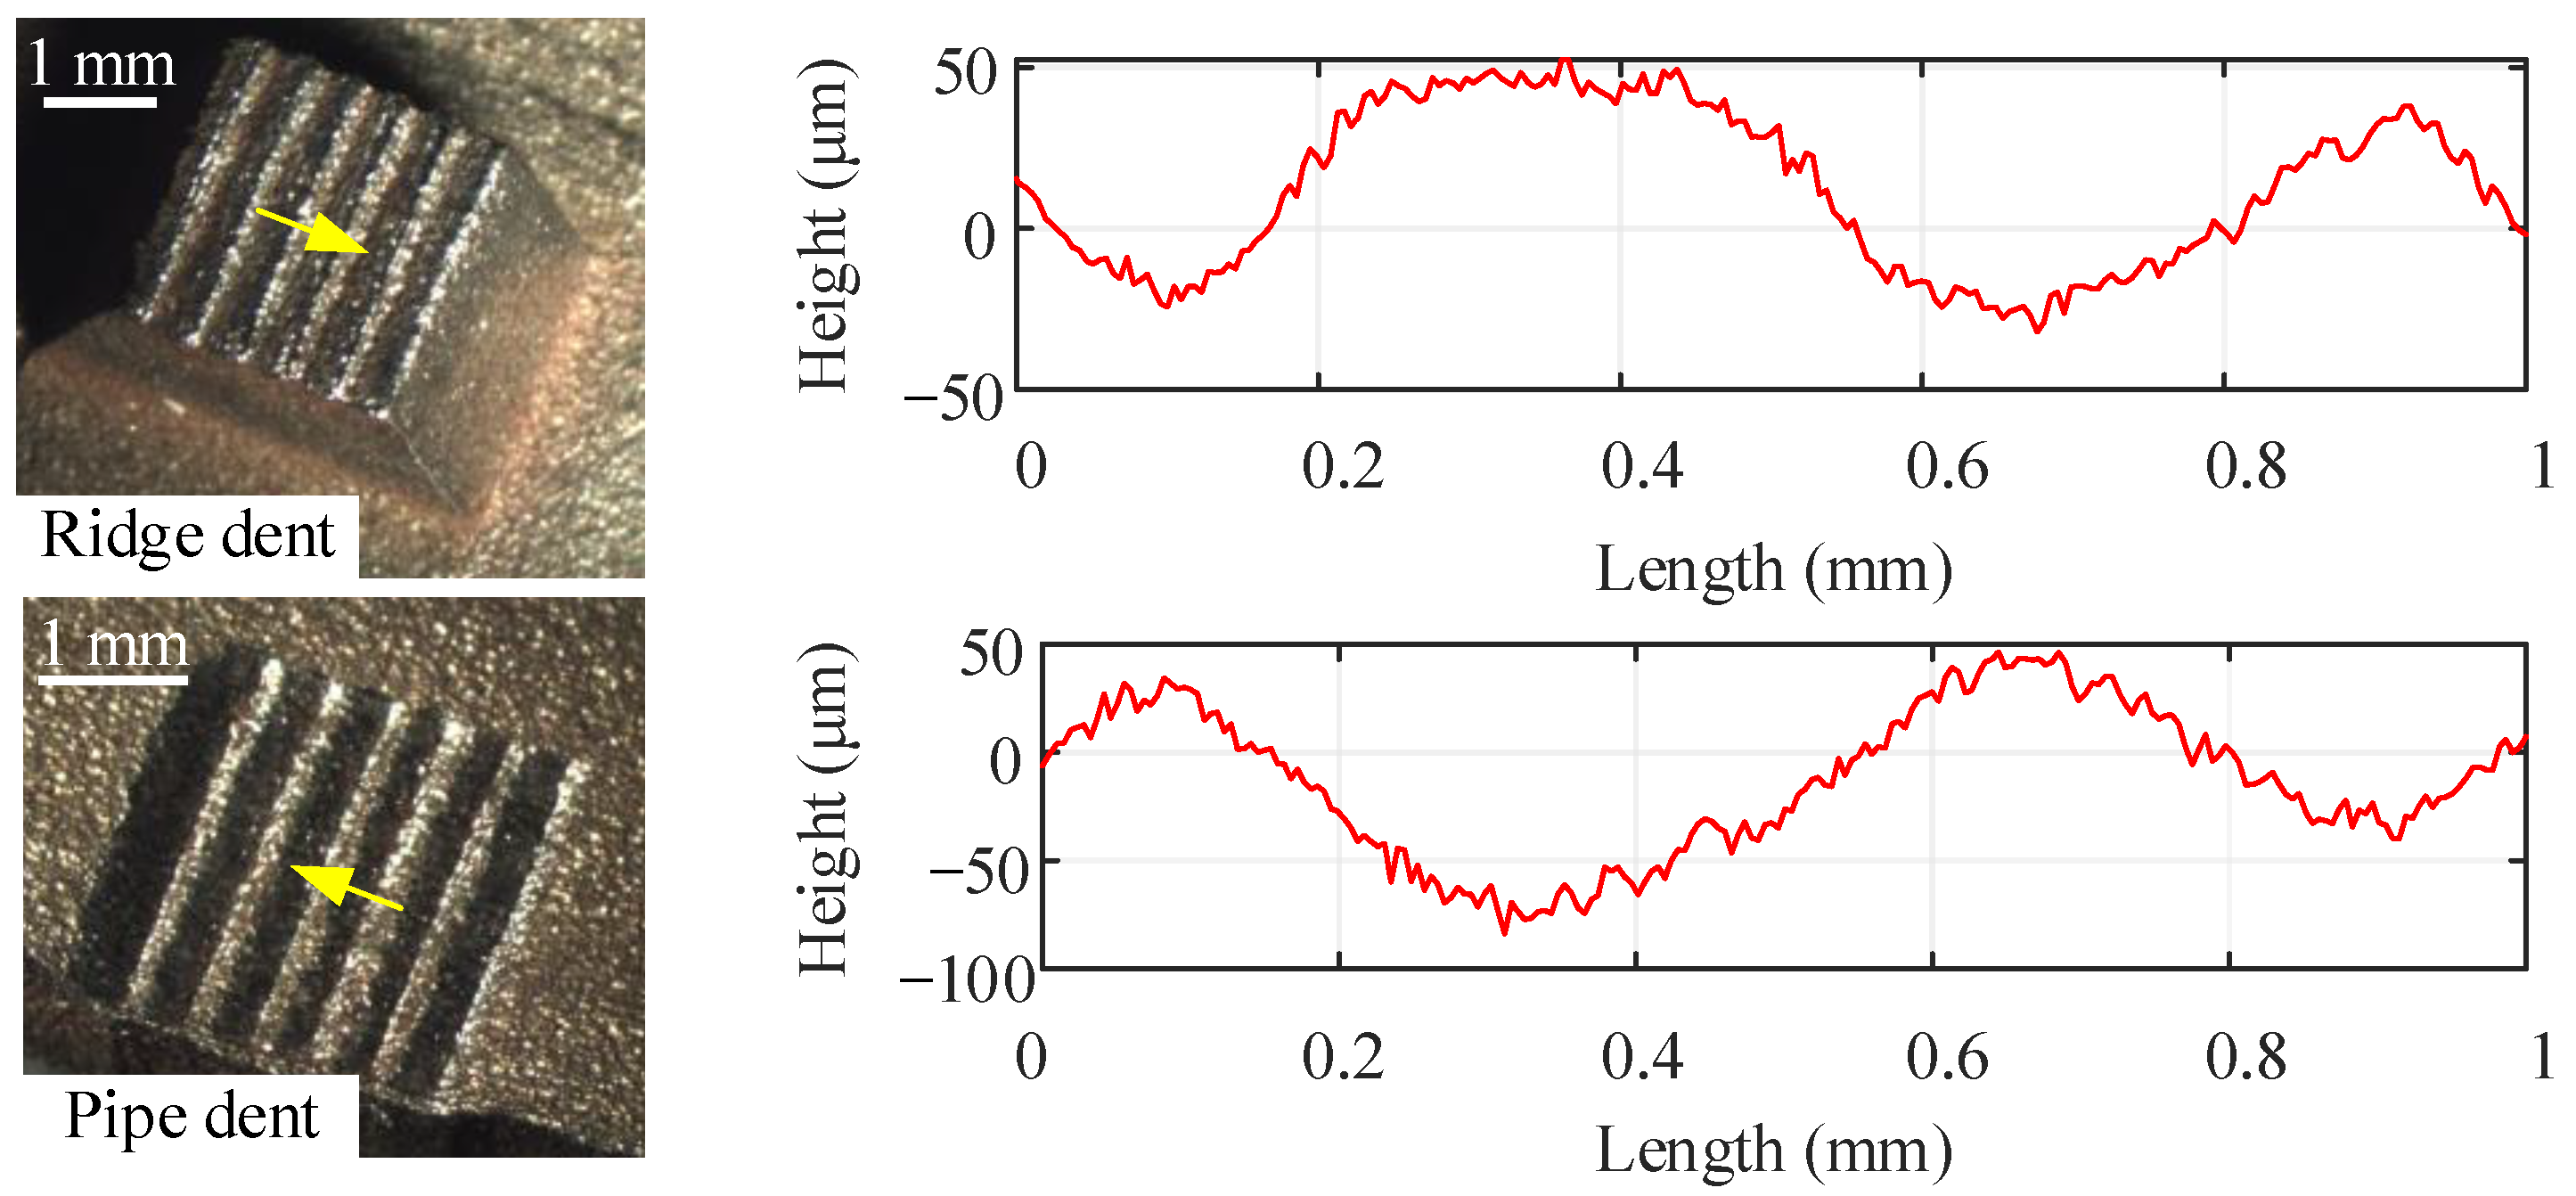
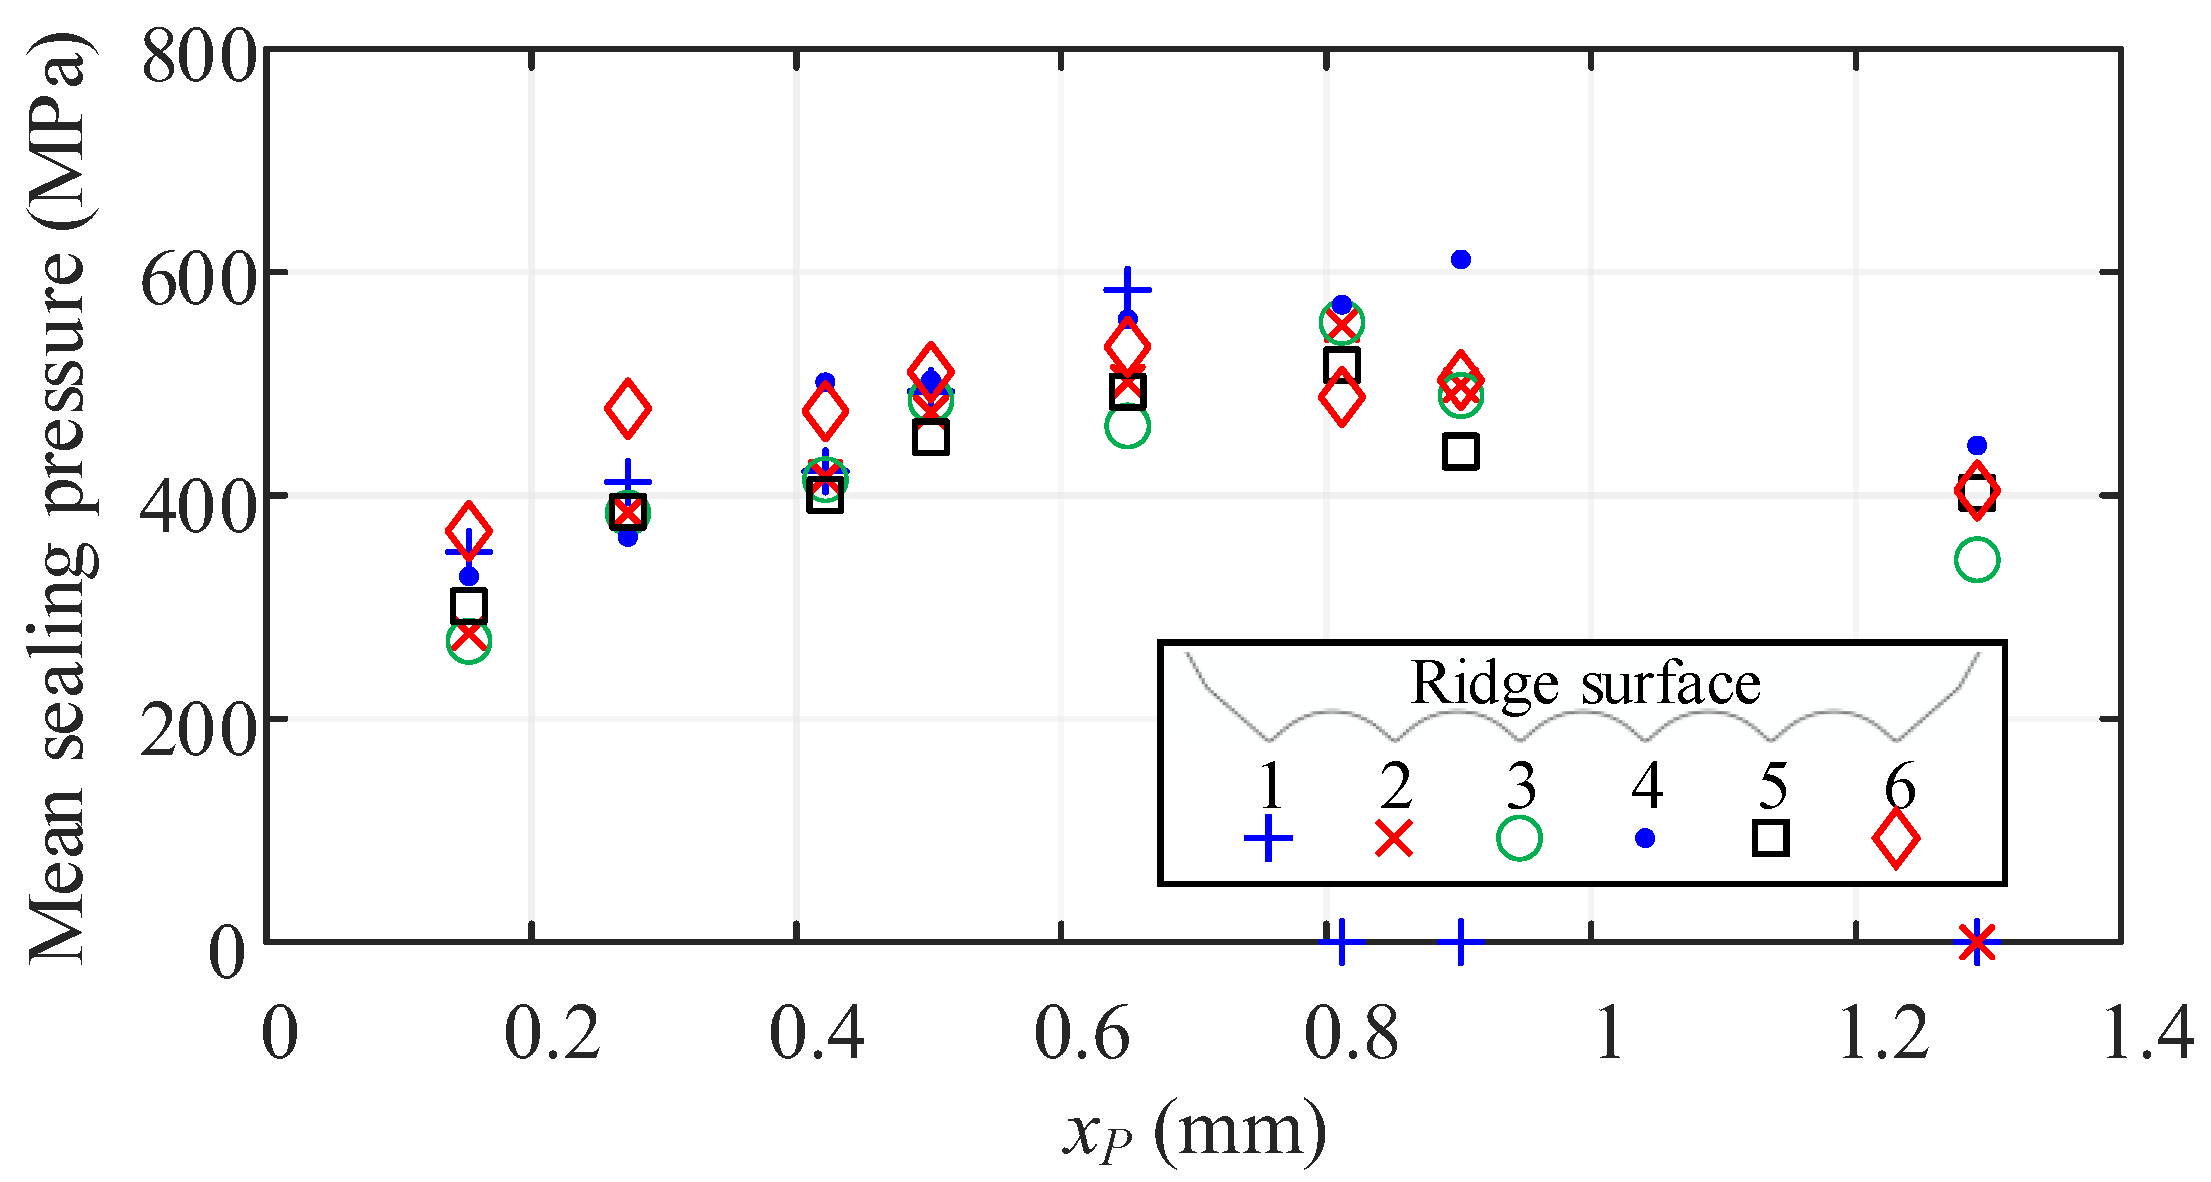
  • Mean sealing pressures rose and then fell within a narrow range, with the reason being that the contact area decreased due to the x r , and then increased due to wear and deformation.
  • During overload, the pressures at streaks 1 and 2 approached zero, indicating that separation occurred. Conversely, high pressure was consistently found on streaks 5 and 6, where the accumulation also occurred.
It can be inferred that the metal accumulation can cause a blockage at the end of the helical channel, allowing the connector to remain sealed, and this needs to be verified by a prototype test.

6.2.2. Tension and Compression Overload Test

Based on ISO 21329:2004 [55], full-scale prototypes of 3 to 8 inches were tested to assess the sealing performance under overload conditions. The sealing mediums used were water and air. Due to safety concerns, air tests were limited to compression tests, with restrictions on the air pressure and pipe diameter. Leakage detection was performed by the pressure drop and bubbling test (1 × 10⁻³ L/h), meeting the standard requirement (between 5.34 × 10⁻² and 0.4 L/h). All tests were conducted with the room temperature of 20 °C. The schematic diagram and experimental setup are shown in Figure 22.
The typical test results for these prototypes are presented in Table 2, Table 3 and Table 4. Samples from the prototypes were cut and observed, and the typical surface roughness and waviness are shown in Figure 23.
Comparing the results, both the joint strength and deformation trends of the sealing surface well-agreed with the analysis. The error was caused by the simplification of the methods, allowable geometrical and installation errors, etc. No leakage (≥1 mL/h) was observed under overload. The test results showed that the compression-type connector is capable of maintaining a sealed state even under maximum axial overload, setting it apart from other connection types, such as pipe flanges.

7. Conclusions

This paper presented two semi-analytical methods for analyzing the joint strength and the overload sealing performance of the subsea compression-type connector. Specimen and prototype tests were carried out. The following conclusions were drawn:
  • A semi-analytical method for predicting the joint strength of the subsea pipeline compression connector was proposed. On the one hand, the axial strengths of the connected pipe under the axial tension and compression conditions were separately deduced based on membrane theory, taking into account the effects of hardening and bending stress. On the other hand, the joint strength of the radial seal was analyzed based on the FEA method. Using the model, the effects of the critical parameters on the joint strength were analyzed.
  • A semi-analytical method of the leakage ratio under axial overload was derived based on the 2D axisymmetric FEA model combined with the Reynolds equation of the laminar flow. Using the model, the overload sealing performance was obtained.
  • The evolution of the sealing interface during the axial overload was divided into three stages: Follow, Separate, and Slide. The laws governing the joint strength, relative displacement, and the cross-section of the leakage channel, and their impacts on the leakage rate, were analyzed. The maximum leakage ratio occurred after reaching the maximum overload. Besides, the accumulation of the metal can cause an obstruction at the terminus of the helical leakage channel.
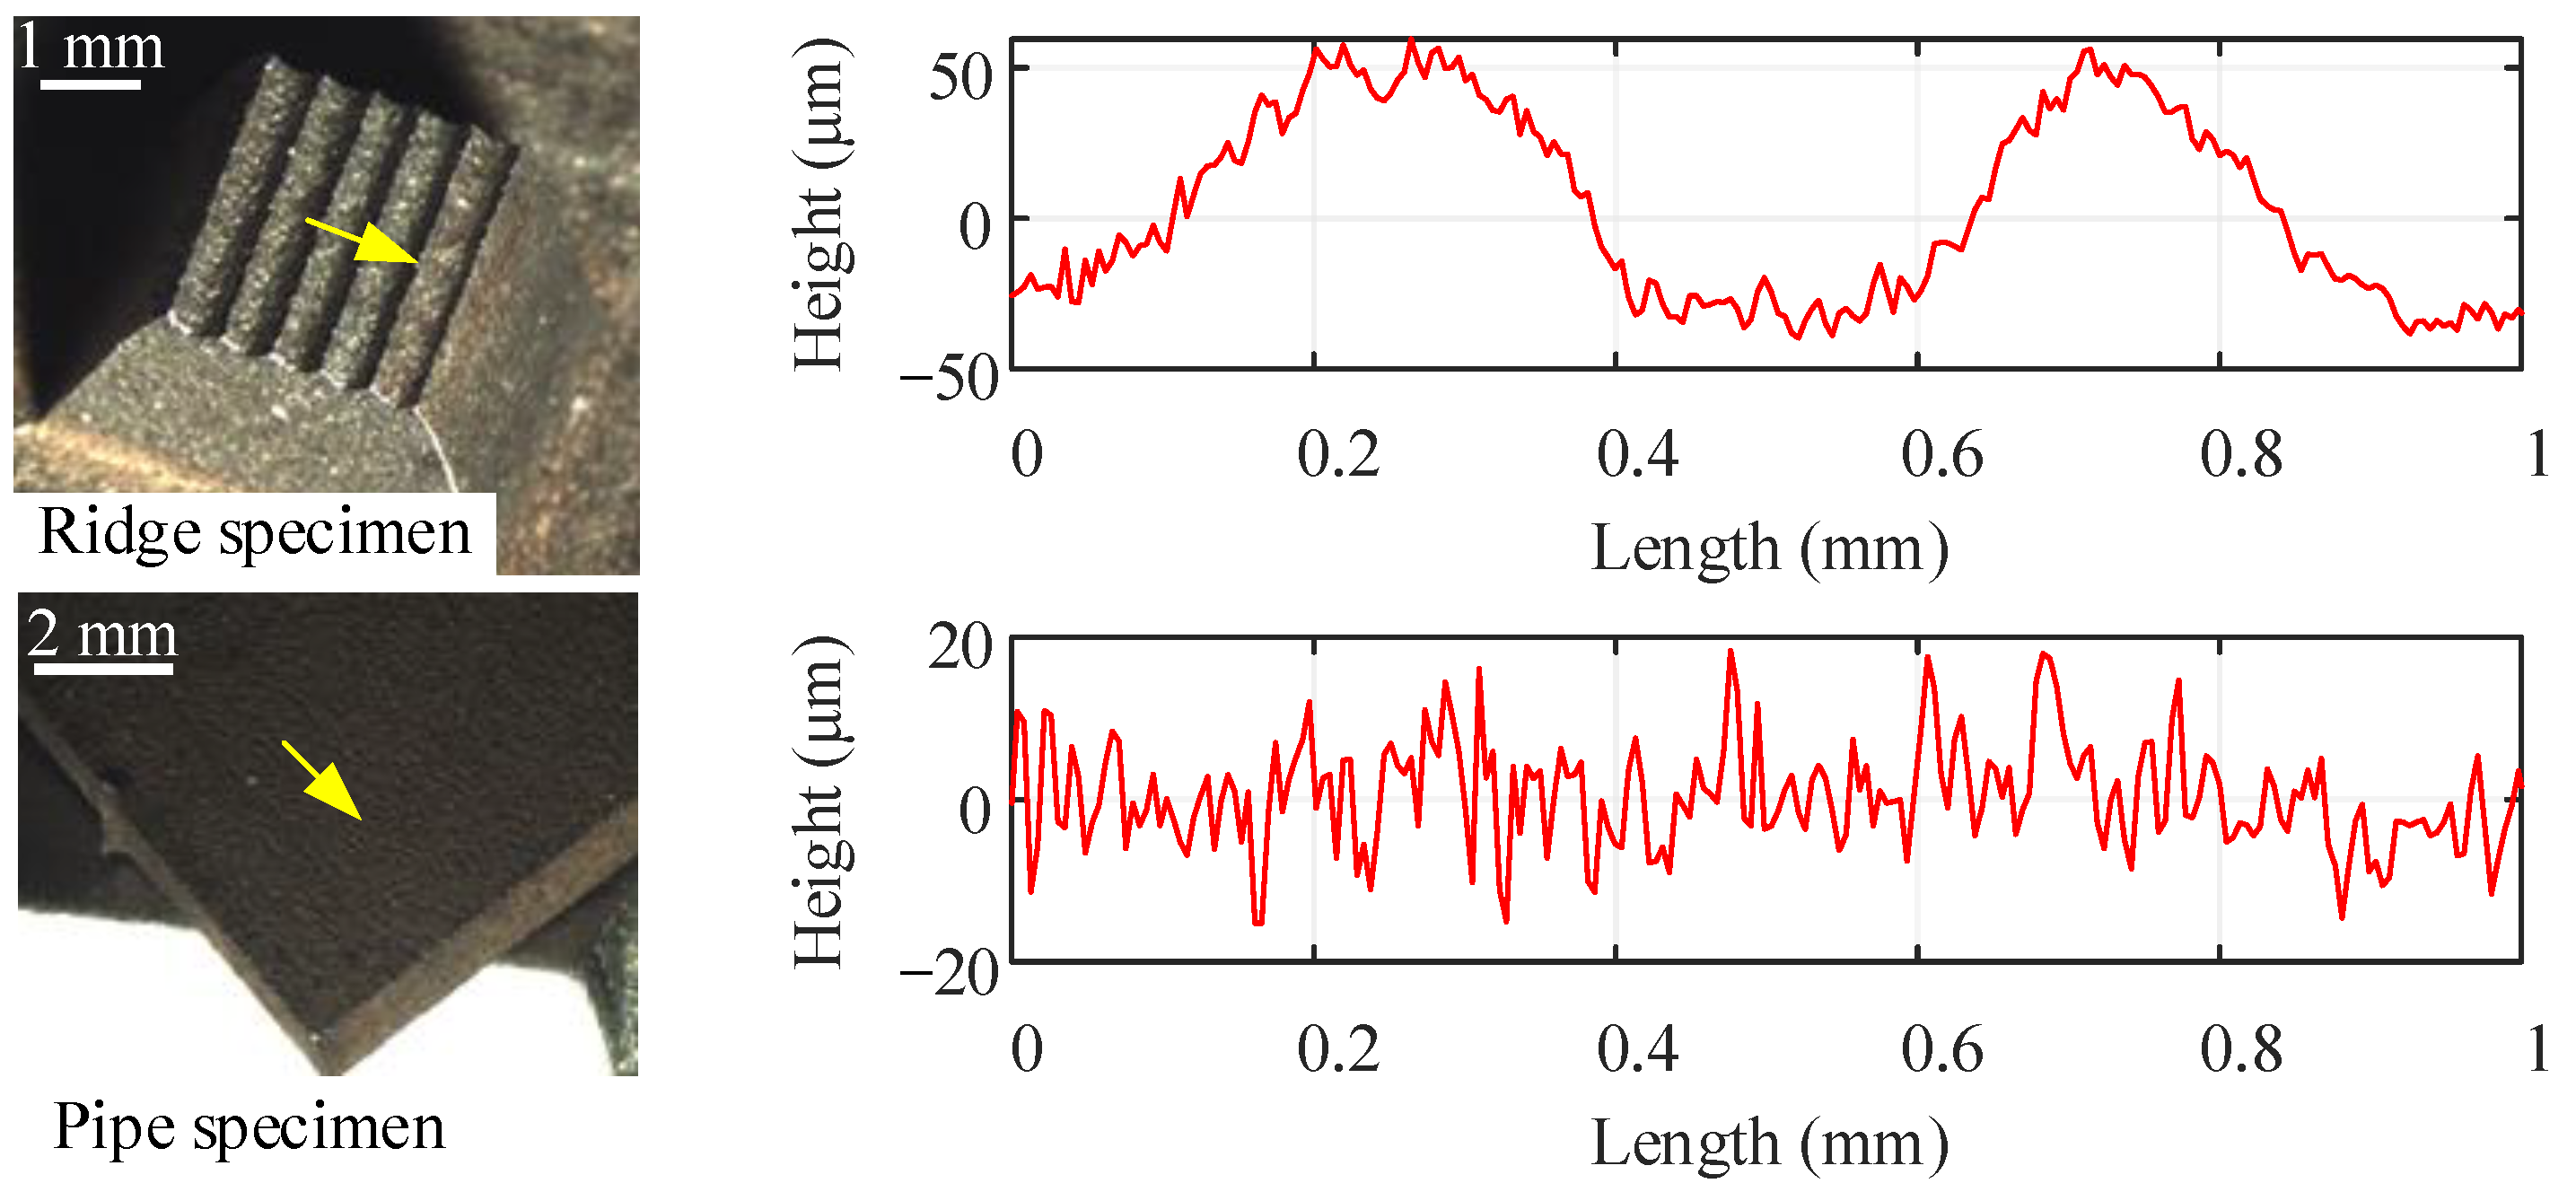
  • The axial shear test and axial overload test were carried out. Using the shear test, the characteristics of the surface roughness and the deformation of the interface under overload conditions were obtained. With the tension and compression overload test, the overload sealing performance of the prototype was tested. Through the experiments, the feasibility of the proposed methods was verified.
  • The study showed that the internally turned sealing surface and the deflection of the connected pipe can improve the joint strength of the compression-type connector. Moreover, a distinctive feature of this connection type is the ability to remain sealed even under the maximum axial load.
The proposed methods allowed the prediction and identification of the joint strength and overload sealing condition of the compression-type connector and provided a better understanding of the radial metal seal. The results can help optimize the FEA design process and improve the test efficiency in engineering applications.
The current study is only focused on the unidirectional load, and it is necessary to further determine the joint strength and sealing performance against impacts, alternating loads, wear, etc. In addition, a more precise and comparable test method and device are needed to quantify the leakage ratio.

Author Contributions

Conceptualization, Z.L., G.W. and L.W.; methodology, Z.L.; software, Z.L.; validation, Z.L. and L.W.; formal analysis, Z.L.; investigation, G.W.; resources, L.W. and X.W.; data curation, G.W. and S.Y.; writing—original draft preparation, Z.L.; writing—review and editing, S.Y.; visualization, Z.L.; supervision, P.J. and F.Y.; project administration, G.W.; funding acquisition, L.W. All authors have read and agreed to the published version of the manuscript.

Funding

This research was funded by the National Natural Science Foundation of China, grant numbers 51779064 and 52001089, and the China Postdoctoral Science Foundation, grant number 2020M670889.

Institutional Review Board Statement

Not applicable.

Informed Consent Statement

Not applicable.

Data Availability Statement

The data used to support the findings of this study are included within the article.

Conflicts of Interest

The authors declare no conflict of interest.

Nomenclature

A c Cross-sectional area of the leakage channel (mm2)
b Axial length of the streak (mm)
C Integration constant
D Flexural rigidity of the pipe (N·mm)
E Young’s modulus (MPa)
F Total joint strength (N)
F A Joint strength of the anchor (N)
F L , F P Joint strength of the pipe under tension and compression overloads, respectively (N)
F s Joint strength of the seal (N)
h Radial height of the leakage channel (mm)
h ¯ Height of the hypothetical rectangular channel (mm)
K 1 Hardening modulus (MPa)
K 2 Defection coefficient
K 3 Tresca criterion coefficient
L c Total length of the leakage channel (mm)
M Bending moment (N·mm)
n Number of the turns of the streaks
p i , p o Inlet and outlet pressures of the leakage channel (MPa)
P Sealing pressure (MPa)
Q c Leakage ratio (L/h)
R Radius of mid-surface of the pipe in the deflected section (mm)
R a , R b Radius of mid-surface of the pipe before and after deflection, respectively (mm)
R r 1 , R r 2 Radius of bottom of the dent and pitch radius of the streaks, respectively (mm)
R a Grade of the surface roughness (mm)
R t Total profile height of the surface roughness (mm)
w Deflection of the pipe (mm)
x r Relative displacement between the sealing surfaces (mm)
x r Change rate of the relative displacement
x P Axial displacement of the midpoint of the pipe sealing area (mm)
x R Axial displacement of the midpoint of the ridge surface (mm)
α Average half-cone angle of the deflection (°)
γ , θ , φ Rotations of cylindrical coordinates (°)
δ Thickness of the pipe (mm)
ε T Accumulated plastic strain
μ Friction coefficient
ρ Radius of curvature (mm)
σ T True stress (MPa)
σ L , σ P Axial stresses considering hardening under tension and compression overload, respectively (MPa)
σ L M , σ P M Axial stresses considering both hardening and bending, under tension and compression overload, respectively (MPa)
σ M Secondary stress caused by bending (MPa)
σ n Normal stress (MPa)
σ s Yield stress of the pipe (MPa)
σ θ Circumferential stress (MPa)
τ p Allowable shear stress (MPa)
υ Poisson’s ratio
ψ Half-cone angle of the pipe (°)
ζ Axial width of the leakage channel (mm)

References

  1. Chirkov, Y.A.; Kushnarenko, V.M.; Repyakh, V.S.; Chirkov, E.Y. Analysis of the Causes of Failure of a Pipeline Welded Joint. Met. Sci. Heat Treat. 2018, 59, 669–672. [Google Scholar] [CrossRef]
  2. Yun, F.; Liu, D.; Xu, X.; Jiao, K.; Hao, X.; Wang, L.; Yan, Z.; Jia, P.; Wang, X.; Liang, B. Thermal–Structural Coupling Analysis of Subsea Connector Sealing Contact. Appl. Sci. 2022, 12, 3194. [Google Scholar] [CrossRef]
  3. Geoffroy, S.; Prat, M. On the Leak through a Spiral-Groove Metallic Static Ring Gasket. J. Fluids Eng. 2004, 126, 48–54. [Google Scholar] [CrossRef]
  4. Robbe-Valloire, F.; Prat, M. A Model for Face-Turned Surface Microgeometry. Application to the Analysis of Metallic Static Seals. Wear 2008, 264, 980–989. [Google Scholar] [CrossRef]
  5. Okada, H.; Itoh, T.; Suga, T. The Influence of Surface Profiles on Leakage in Room Temperature Seal-Bonding. Sens. Actuators A Phys. 2008, 144, 124–129. [Google Scholar] [CrossRef]
  6. Lebeck, A.O. Hydrodynamic Lubrication in Wawy Contacting Face Seals-a Two Dimensional Iodei. J. Tribol. 1981, 103, 578–586. [Google Scholar] [CrossRef]
  7. Matsuzaki, Y.; Kazamaki, T. Effect of Surface Roughness on Compressive Stress of Static Seals. JSME Int. J. Ser. III 1988, 31, 99–106. [Google Scholar] [CrossRef]
  8. Yanagisawa, T.; Sanada, M.; Koga, T.; Hirabayashi, H. The Influence of Designing Factors on the Sealing Performance of C-Seal. In Proceedings of the SAE Technical Papers; SAE International: Warrendale, PA, USA, 1991. [Google Scholar]
  9. Nakamura, T.; Funabashi, K. Effects of Directional Properties of Roughness and Tangential Force on Pressure Flow between Contacting Surfaces. Lubr. Sci. 1991, 4, 13–23. [Google Scholar] [CrossRef]
  10. Polycarpou, A.A.; Etsion, I. A Model for the Static Sealing Performance of Compliant Metallic Gas Seals Including Surface Roughness and Rarefaction Effects. Tribol. Trans. 2000, 43, 237–244. [Google Scholar] [CrossRef]
  11. Arghavani, J.; Derenne, M.; Marchand, L. Effect of Surface Characteristics on Compressive Stress and Leakage Rate in Gasketed Flanged Joints. Int. J. Adv. Manuf. Technol. 2003, 21, 713–732. [Google Scholar] [CrossRef]
  12. Nitta, I.; Matsuzaki, Y.; Ito, Y. Observation of Real Contact Area at Gasket Surfaces Using the Thin PC Film. Trans. Jpn. Soc. Mech. Eng. Ser. C 2005, 71, 265–271. [Google Scholar] [CrossRef] [Green Version]
  13. Nitta, I.; Matsuzaki, Y. Experimental Study of the Performance of Static Seals Based on Measurements of Real Contact Area Using Thin Polycarbonate Films. J. Tribol. 2010, 132, 022202. [Google Scholar] [CrossRef]
  14. Ledoux, Y.; Lasseux, D.; Favreliere, H.; Samper, S.; Grandjean, J. On the Dependence of Static Flat Seal Efficiency to Surface Defects. Int. J. Press. Vessel. Pip. 2011, 88, 518–529. [Google Scholar] [CrossRef]
  15. Bourniquel, J.; Lasseux, D.; Rit, J.F. Prediction and Measurement of Sealing Properties of Joints Between Wavy Metal Surfaces. J. Press. Vessel. Technol. 2018, 140, 051203. [Google Scholar] [CrossRef] [Green Version]
  16. Beheshti, A.; Khonsari, M.M. Asperity Micro-Contact Models as Applied to the Deformation of Rough Line Contact. Tribol. Int. 2012, 52, 61–74. [Google Scholar] [CrossRef]
  17. Jackson, R.L.; Green, I. On the Modeling of Elastic Contact between Rough Surfaces. Tribol. Trans. 2011, 54, 300–314. [Google Scholar] [CrossRef]
  18. Lorenz, B.; Persson, B.N.J. On the Dependence of the Leak Rate of Seals on the Skewness of the Surface Height Probability Distribution. Europhys. Lett. 2010, 90, 38002. [Google Scholar] [CrossRef] [Green Version]
  19. Zhang, F.; Liu, J.; Ding, X.; Yang, Z. An Approach to Calculate Leak Channels and Leak Rates between Metallic Sealing Surfaces. J. Tribol. 2017, 139, 011708. [Google Scholar] [CrossRef]
  20. Marie, C.; Lasseux, D.; Zahouani, H.; Sainsot, P. An Integrated Approach to Characterize Liquid Leakage through Metal Contact Seal. Eur. J. Mech. Environ. Eng. 2003, 48, 81–86. [Google Scholar]
  21. Liao, Y.; Stephenson, D.A.; Ni, J. Multiple-Scale Wavelet Decomposition, 3D Surface Feature Exaction and Applications. J. Manuf. Sci. Eng. 2012, 134, 011005. [Google Scholar] [CrossRef]
  22. Deltombe, R.; Bigerelle, M.; Jourani, A. Analysis of the Effects of Different Machining Processes on Sealing Using Multiscale Topography. Surf. Topogr. Metrol. Prop. 2016, 4, 015003. [Google Scholar] [CrossRef]
  23. Yan, Y.; Fan, Y. Influence of Fluid on Seal and Assembly of Pipeline Fittings Based on the Multiscale Finite Element Model. Complexity 2020, 2020, 4960734. [Google Scholar] [CrossRef]
  24. So, H.; Liu, D.C. An Elastic-Plastic Model for the Contact of Anisotropic Rough Surfaces. Wear 1991, 146, 201–218. [Google Scholar] [CrossRef]
  25. Shao, Y.; Du, S.; Xi, L. 3D Machined Surface Topography Forecasting with Space-Time Multioutput Support Vector Regression Using High Definition Metrology. In Proceedings of the ASME Design Engineering Technical Conference, Cleveland, OH, USA, 6–9 August 2017; Volume 1. [Google Scholar]
  26. Tang, L.; He, W.; Zhu, X.; Zhou, Y. Sealing Performance Analysis of an End Fitting for Marine Unbonded Flexible Pipes Based on Hydraulic-Thermal Finite Element Modeling. Energies 2019, 12, 2198. [Google Scholar] [CrossRef] [Green Version]
  27. Ernens, D.; Pérez-Ràfols, F.; van Hoecke, D.; Roijmans, R.F.H.; van Riet, E.J.; Vande Voorde, J.B.E.; Almqvist, A.; de Rooij, M.B.; Roggeband, S.M.; van Haaften, W.M.; et al. On the Sealability of Metal-to-Metal Seals with Application to Premium Casing and Tubing Connections. SPE Drill. Complet. 2019, 34, 382–396. [Google Scholar] [CrossRef] [Green Version]
  28. Wei, Z.; Wang, L.; Guan, Y.; Yao, S.; Li, S. Static Metal Sealing Mechanism of a Subsea Pipeline Mechanical Connector. Adv. Mech. Eng. 2016, 8, 1–16. [Google Scholar] [CrossRef] [Green Version]
  29. Wang, L.Q.; Wei, Z.L.; Yao, S.M.; Guan, Y.; Li, S.K. Sealing Performance and Optimization of a Subsea Pipeline Mechanical Connector. Chin. J. Mech. Eng. (Eng. Ed.) 2018, 31, 18. [Google Scholar] [CrossRef]
  30. Weddeling, C.; Demir, O.K.; Haupt, P.; Tekkaya, A.E. Analytical Methodology for the Process Design of Electromagnetic Crimping. J. Mater. Process. Technol. 2015, 222, 163–180. [Google Scholar] [CrossRef]
  31. Weddeling, C.; Walter, V.; Haupt, P.; Tekkaya, A.E.; Schulze, V.; Weidenmann, K.A. Joining Zone Design for Electromagnetically Crimped Connections. J. Mater. Process. Technol. 2015, 225, 240–261. [Google Scholar] [CrossRef]
  32. Henriksen, J.; Hansen, M.R.; Thrane, F.C. Axial Load Capacity of Cold Formed Pipe Flange Connection. J. Press. Vessel. Technol. 2017, 139, 051201. [Google Scholar] [CrossRef]
  33. Agrawal, A.K.; Narayanan, R.G. Experimental and Numerical Studies on Joining Steel Tubes by End Forming. J. Constr. Steel Res. 2020, 167, 105792. [Google Scholar] [CrossRef]
  34. Onyegiri, I.; Kashtalyan, M. Threaded Connectors for Sandwich Pipes—Part 1: Parametric & Comparative Studies. Int. J. Press. Vessel. Pip. 2018, 168, 117–124. [Google Scholar] [CrossRef] [Green Version]
  35. Quispe, J.L.P.; Pasqualino, I.P.; Estefen, S.F.; de Souza, M.I.L. Structural Behavior of Threaded Connections for Sandwich Pipes under Make-up Torque, External Pressure, and Axial Load. Int. J. Press. Vessel. Pip. 2020, 186, 104156. [Google Scholar] [CrossRef]
  36. Liu, Z.; Zhang, L.; Wang, F.; Li, S.; Wang, P.; Cai, M.; Han, L.; Ma, Y.; Ma, Z.; Yan, B. Study on Optimization Design of Permanent Packer Slip Structure. J. Fail. Anal. Prev. 2020, 21, 50–60. [Google Scholar] [CrossRef]
  37. Li, Z.; Wang, G.; Yao, S.; Yun, F.; Jia, P.; Li, C.; Wang, L. A Semi-Analytical Method for the Sealing Performance Prediction of Subsea Pipeline Compression Connector. J. Mar. Sci. Eng. 2023, 11, 854. [Google Scholar] [CrossRef]
  38. Wu, L.; Guo, X.; Chen, H.; Liu, J.; Su, Y. Calculation Method for the Axial Load-Bearing Capacity of Steel Pipe-to-Sleeve Grouted Connections. Constr. Build. Mater. 2022, 314, 125621. [Google Scholar] [CrossRef]
  39. ASTM F1387; Standard Specification for Performance of Piping and Tubing Mechanically Attached Fittings. ASTM International: West Conshohocken, PA, USA, 2012.
  40. ISO 8434-1; Metallic Tube Connections For Fluid Power and General Use Part 1:24° Compression Fittings. International Organization for Standardization: Geneva, Switzerland, 2018.
  41. ASTM E8/E8M; Standard Test Methods for Tension Testing of Metallic Materials. American Society of Mechanical Engineers: New York, NY, USA, 2021.
  42. Rojíček, J.; Čermák, M.; Halama, R.; Paška, Z.; Vaško, M. Material Model Identification from Set of Experiments and Validation by DIC. Math. Comput. Simul. 2021, 189, 339–367. [Google Scholar] [CrossRef]
  43. Roostaei, A.A.; Jahed, H. Fundamentals of Cyclic Plasticity Models. In Cyclic Plasticity of Metals: Modeling Fundamentals and Applications; Elsevier: Amsterdam, The Netherlands, 2022; pp. 23–51. [Google Scholar]
  44. Yu, T.; Xue, P. Yield Criteria. In Introduction to Engineering Plasticity; Elsevier: Amsterdam, The Netherlands, 2022; pp. 67–87. [Google Scholar]
  45. Weddeling, C.; Gies, S.; Khalifa, N.B.; Tekkaya, A.E. Analytical Methodology for the Process and Joint Design of Form-Fit Joining by Die-Less Hydroforming. In Proceedings of the 9th ASME International Manufacturing Science and Engineering Conference (MSEC2014), Detroit, MI, USA, 9–13 June 2014; Web Portal ASME (American Society of Mechanical Engineers): New York, NY, USA, 2014. [Google Scholar]
  46. ASME B16.5; Pipe Flanges and Flanged Fittings. American Society of Mechanical Engineers: New York, NY, USA, 2020.
  47. Duan, W.; Joshi, S. Failure Analysis of Threaded Connections in Large-Scale Steel Tie Rods. Eng. Fail. Anal. 2011, 18, 2008–2018. [Google Scholar] [CrossRef]
  48. Abaqus, version 6.14. Software for Technical Simulation. Dassault Systemes: Vélizy-Villacoublay, France, 2014.
  49. Georgescu, C.; Cristea, G.C.; Dima, C.; Deleanu, L. Evaluating Lubricating Capacity of Vegetal Oils Using Abbott-Firestone Curve. IOP Conf. Ser. Mater. Sci. Eng. 2017, 174, 12057. [Google Scholar] [CrossRef]
  50. Prat, M.; Plouraboué, F.; Letalleur, N. Averaged Reynolds Equation for Flows between Rough Surfaces in Sliding Motion. Transp. Porous Media 2002, 48, 291–313. [Google Scholar] [CrossRef] [Green Version]
  51. Kumar, A.; Lal Das, S.; Wahi, P. Instabilities of Thin Circular Cylindrical Shells under Radial Loading. Int. J. Mech. Sci. 2015, 104, 174–189. [Google Scholar] [CrossRef]
  52. Wojciechowski, S.; Krajewska-Śpiewak, J.; Maruda, R.W.; Krolczyk, G.M.; Nieslony, P.; Wieczorowski, M.; Gawlik, J. Study on Ploughing Phenomena in Tool Flank Face—Workpiece Interface Including Tool Wear Effect during Ball-End Milling. Tribol. Int. 2023, 181, 108313. [Google Scholar] [CrossRef]
  53. Hoelz, K.; Kleinhans, L.; Matthiesen, S. Wood Screw Design: Influence of Thread Parameters on the Withdrawal Capacity. Eur. J. Wood Wood Prod. 2021, 79, 773–784. [Google Scholar] [CrossRef]
  54. ISO 468; Surface Roughness—Parameters, Their Values and General Rules for Specifying Requirements. International Organization for Standardization: Geneva, Switzerland, 1982.
  55. ISO 21329:2004; Petroleum And Natural Gas Industries—Pipeline Transportation Systems—Test Procedures for Mechanical Connectors. International Organization for Standardization: Geneva, Switzerland, 2004.
Figure 1. (a) Compression connector components, (b) assembly tools, (c) connector parts, and (d) connecting process.
Jmse 11 01417 g001aJmse 11 01417 g001b
Figure 2. Deflection, w x , and half-cone angle, ψ x , of the connected pipe.
Jmse 11 01417 g002
Figure 3. (a) Diagram of the deflected pipe under axial tension, and (b) a thin-walled cylindrical cell from (a).
Jmse 11 01417 g003
Figure 4. A bending section of the deflected pipe.
Jmse 11 01417 g004
Figure 5. Model of the engaged sealing interface.
Jmse 11 01417 g005
Figure 6. FEA of the axial strength components, F L and F p .
Jmse 11 01417 g006
Figure 7. (a) The FEA model for analyzing joint strength and leakage, (b) the local view of the sealing section, (c) the local view of the streaks, and (d) the view of the refinement.
Jmse 11 01417 g007
Figure 8. A typical profile of a leakage channel and its corresponding semi-axis curves.
Jmse 11 01417 g008
Figure 9. (a) Tension and compression joint strengths, F L and F p , as a function of the necking coefficient, w / R , and (b) change rates for the strengths and the necking coefficient, both at x = 0 .
Jmse 11 01417 g009
Figure 10. (a) Tension and compression joint strengths, F L and F p , as a function of the thickness coefficient, δ / R , and (b) change rates for the strengths and the thickness coefficient.
Jmse 11 01417 g010
Figure 11. (a) Tension and compression joint strengths, F L and F p , as a function of the average half-cone angle, α , and (b) change rates for the strengths and α .
Jmse 11 01417 g011
Figure 12. The evolution of the sealing interface during axial overload: (a) Von Mises stress field and (b) axial displacement field.
Jmse 11 01417 g012
Figure 13. Binary progression profiles of the cross-section of the leakage channel. The white portion denotes the channel, and the order of change is from labels (a) to (f).
Jmse 11 01417 g013
Figure 14. Semi-axis curves of the typical cross-sections.
Jmse 11 01417 g014
Figure 15. Joint strength, F s , displacement, x R , and change rate of the relative displacement, x r , of the seal under the overload condition.
Jmse 11 01417 g015
Figure 16. The leakage ratio, Q c , and the corresponding F s and x r of the seal during overload.
Jmse 11 01417 g016
Figure 17. (a) The schematic diagram of the test setup, (b) the specimens, and (c) the local view of the sealing interface. The structure consists of: (1) vertical compression part, (2) ridge specimen, (3) pipe specimen, (4) container, (5) specimen bed, and (6) dent area.
Jmse 11 01417 g017
Figure 18. The measured surface topography under initial conditions.
Jmse 11 01417 g018
Figure 19. The measured surface topography after vertical compression.
Jmse 11 01417 g019
Figure 20. The measured surface topography after axial overload.
Jmse 11 01417 g020
Figure 21. The mean sealing pressure at each streak as a function of pipe displacement, x P .
Jmse 11 01417 g021
Figure 22. (a) Schematic diagram and (b) experimental setup of the tension and compression overload tests.
Jmse 11 01417 g022
Figure 23. Turning topography of the ridge: (a) before the test and (b) after the test, (c) the pipe roughness before the test, and (d) the accumulation after the test.
Jmse 11 01417 g023
Table 1. Geometrical parameters and material properties.
NameUnitSymbolValue
Typeinch6
Sealing widthmm3
Radiusmm R a 82.5
Thicknessmm δ 5
Embedded depthmm2
Average half-cone anglerad α 0.034
Turning speedm/min100
Turning feedmm/r0.5
Depth of cutmm0.2
Yield strengthMPa σ s 235
Shear strengthMPa τ p 188
Young’s modulusMPa E 2.10 × 10⁵
Friction coefficient μ 0.2
Poisson coefficient υ 0.3
Table 2. Typical results of the tension overload test of the water medium.
Type
(Inch)
Nominal
Diameter
(mm)
Nominal
Thickness
(mm)
Medium
Pressure
(MPa)
Theoretical Tension
Joint Strength
(N)
Experimental
Mean Strength
(N)
Relative
Error
Leakage
(≥1 mL/h)
WaterPipeSealTotalInitialFinal
3892156.29 × 1021.04 × 1051.05 × 1051.11 × 1056.02%××
4114379.30 × 1032.01 × 1052.10 × 1052.18 × 1053.82%××
6168361.84 × 1042.96 × 1053.15 × 1053.31 × 1055.23%××
821944.56.59 × 1045.16 × 1055.82 × 1056.25 × 105 7.38%××
Table 3. Typical results of the compression overload test of the water medium.
Type
(Inch)
Nominal
Diameter
(mm)
Nominal
Thickness
(mm)
Medium
Pressure
(MPa)
Theoretical Compression
Joint Strength
(N)
Experimental
Mean Strength
(N)
Relative
Error
Leakage
(≥1 mL/h)
WaterPipeSealTotalInitialFinal
3892154.72 × 1021.04 × 1051.05 × 1051.11 × 1055.22%××
4114379.40 × 1032.01 × 1052.10 × 1052.19 × 1054.24%××
6168361.86 × 1042.96 × 1053.15 × 1053.27 × 1053.88%××
821944.56.73 × 1045.16 × 1055.84 × 1056.22 × 105 6.59%××
Table 4. Typical results of the compression overload test of the air medium.
Type
(Inch)
Nominal
Diameter
(mm)
Nominal
Thickness
(mm)
Medium
Pressure
(MPa)
Theoretical Compression
Joint Strength
(N)
Experimental
Mean Strength
(N)
Relative
Error
Leakage
(≥1 mL/h)
AirPipeSealTotalInitialFinal
38920.58.34 × 1031.04 × 1051.12 × 1051.17 × 1054.09%××
411430.51.62 × 1042.01 × 1052.17 × 1052.28 × 1055.14%××
Disclaimer/Publisher’s Note: The statements, opinions and data contained in all publications are solely those of the individual author(s) and contributor(s) and not of MDPI and/or the editor(s). MDPI and/or the editor(s) disclaim responsibility for any injury to people or property resulting from any ideas, methods, instructions or products referred to in the content.

