
Mechanical Behavior and Sealing Performance Study of Subsea Connector Core-Sealing Components under the Combined Action of Internal Pressure, Bending Moment, and Axial Load
 ,
,
Abstract
:1. Introduction
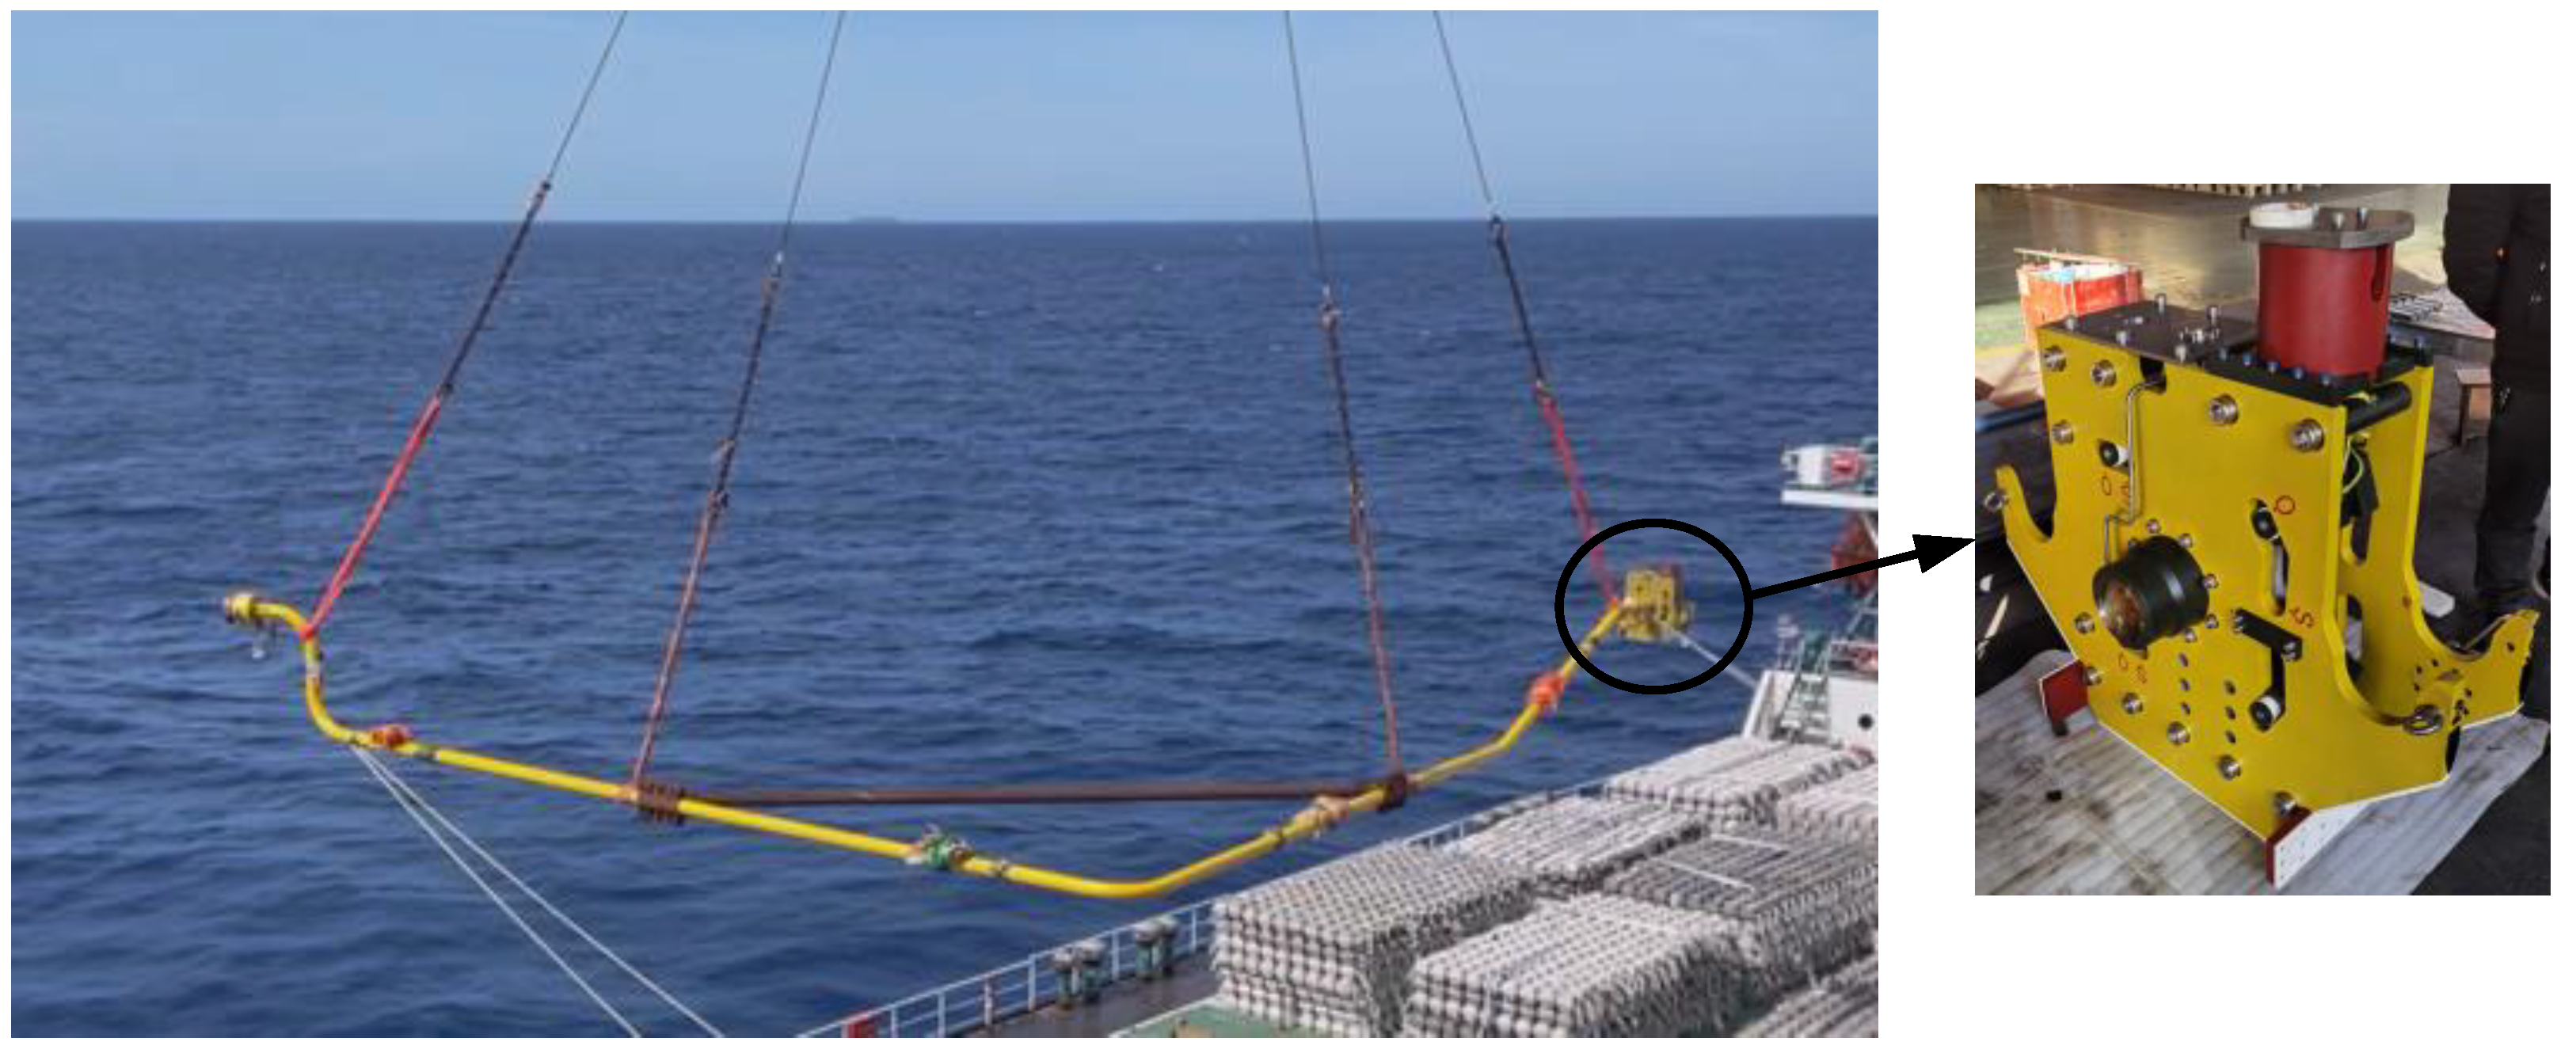
2. Subsea Connector Structure and Working Principle
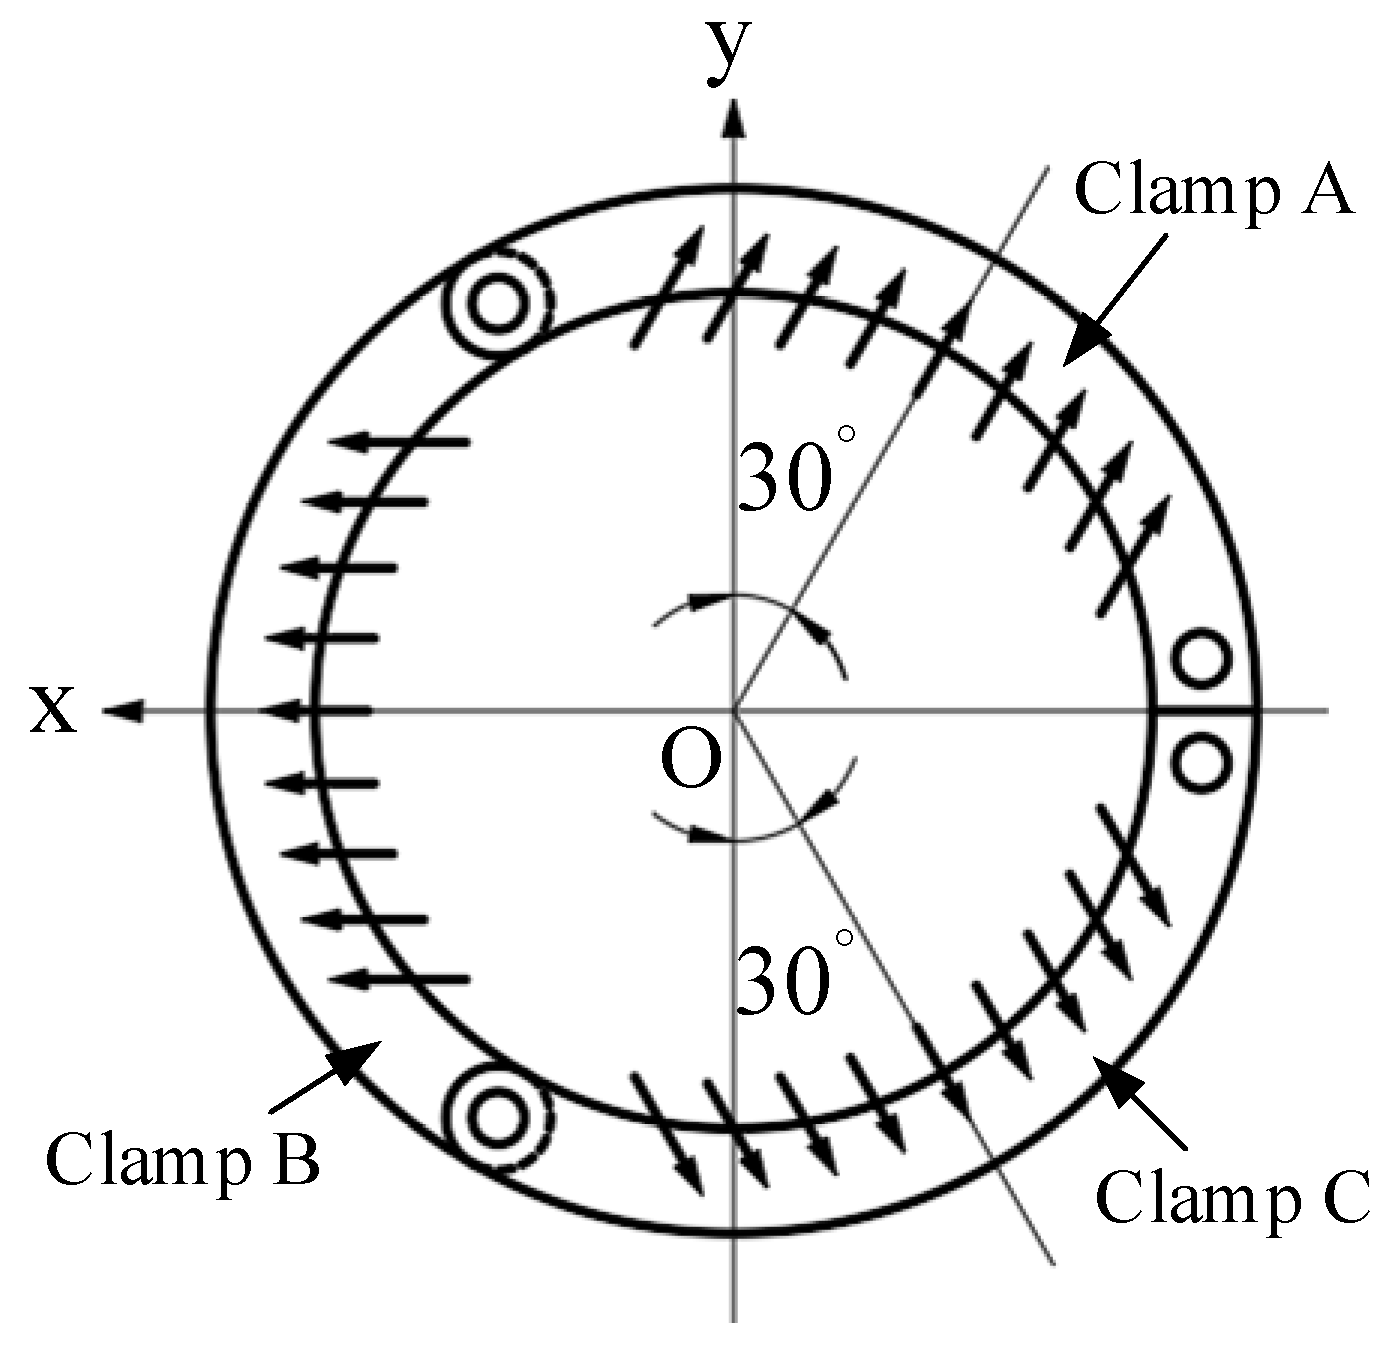
3. Study of Subsea Connector Load Transfer under Different Work Modes
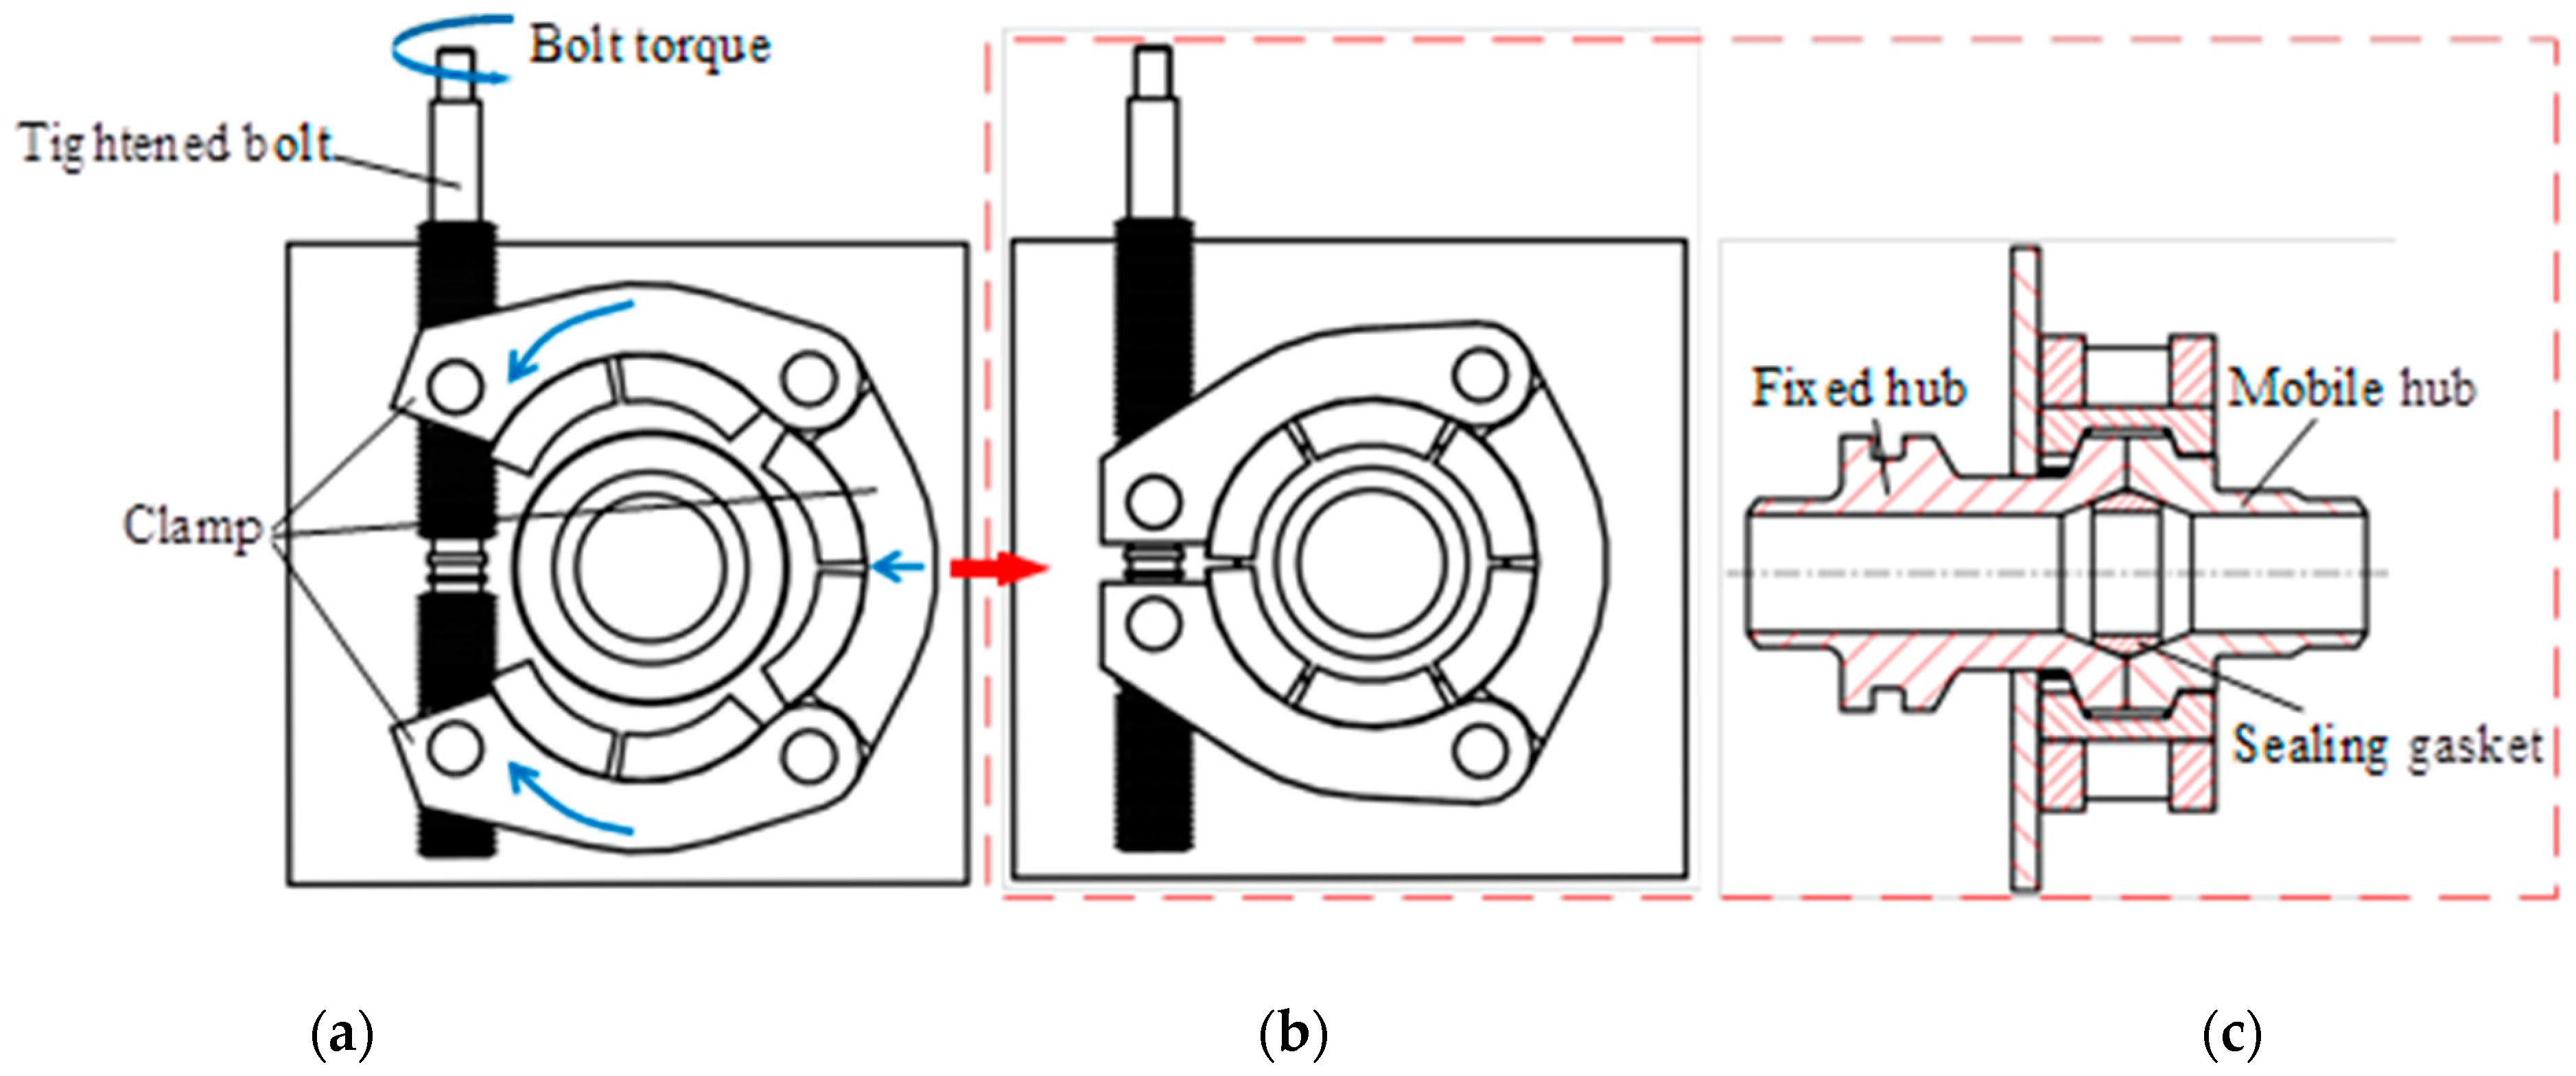
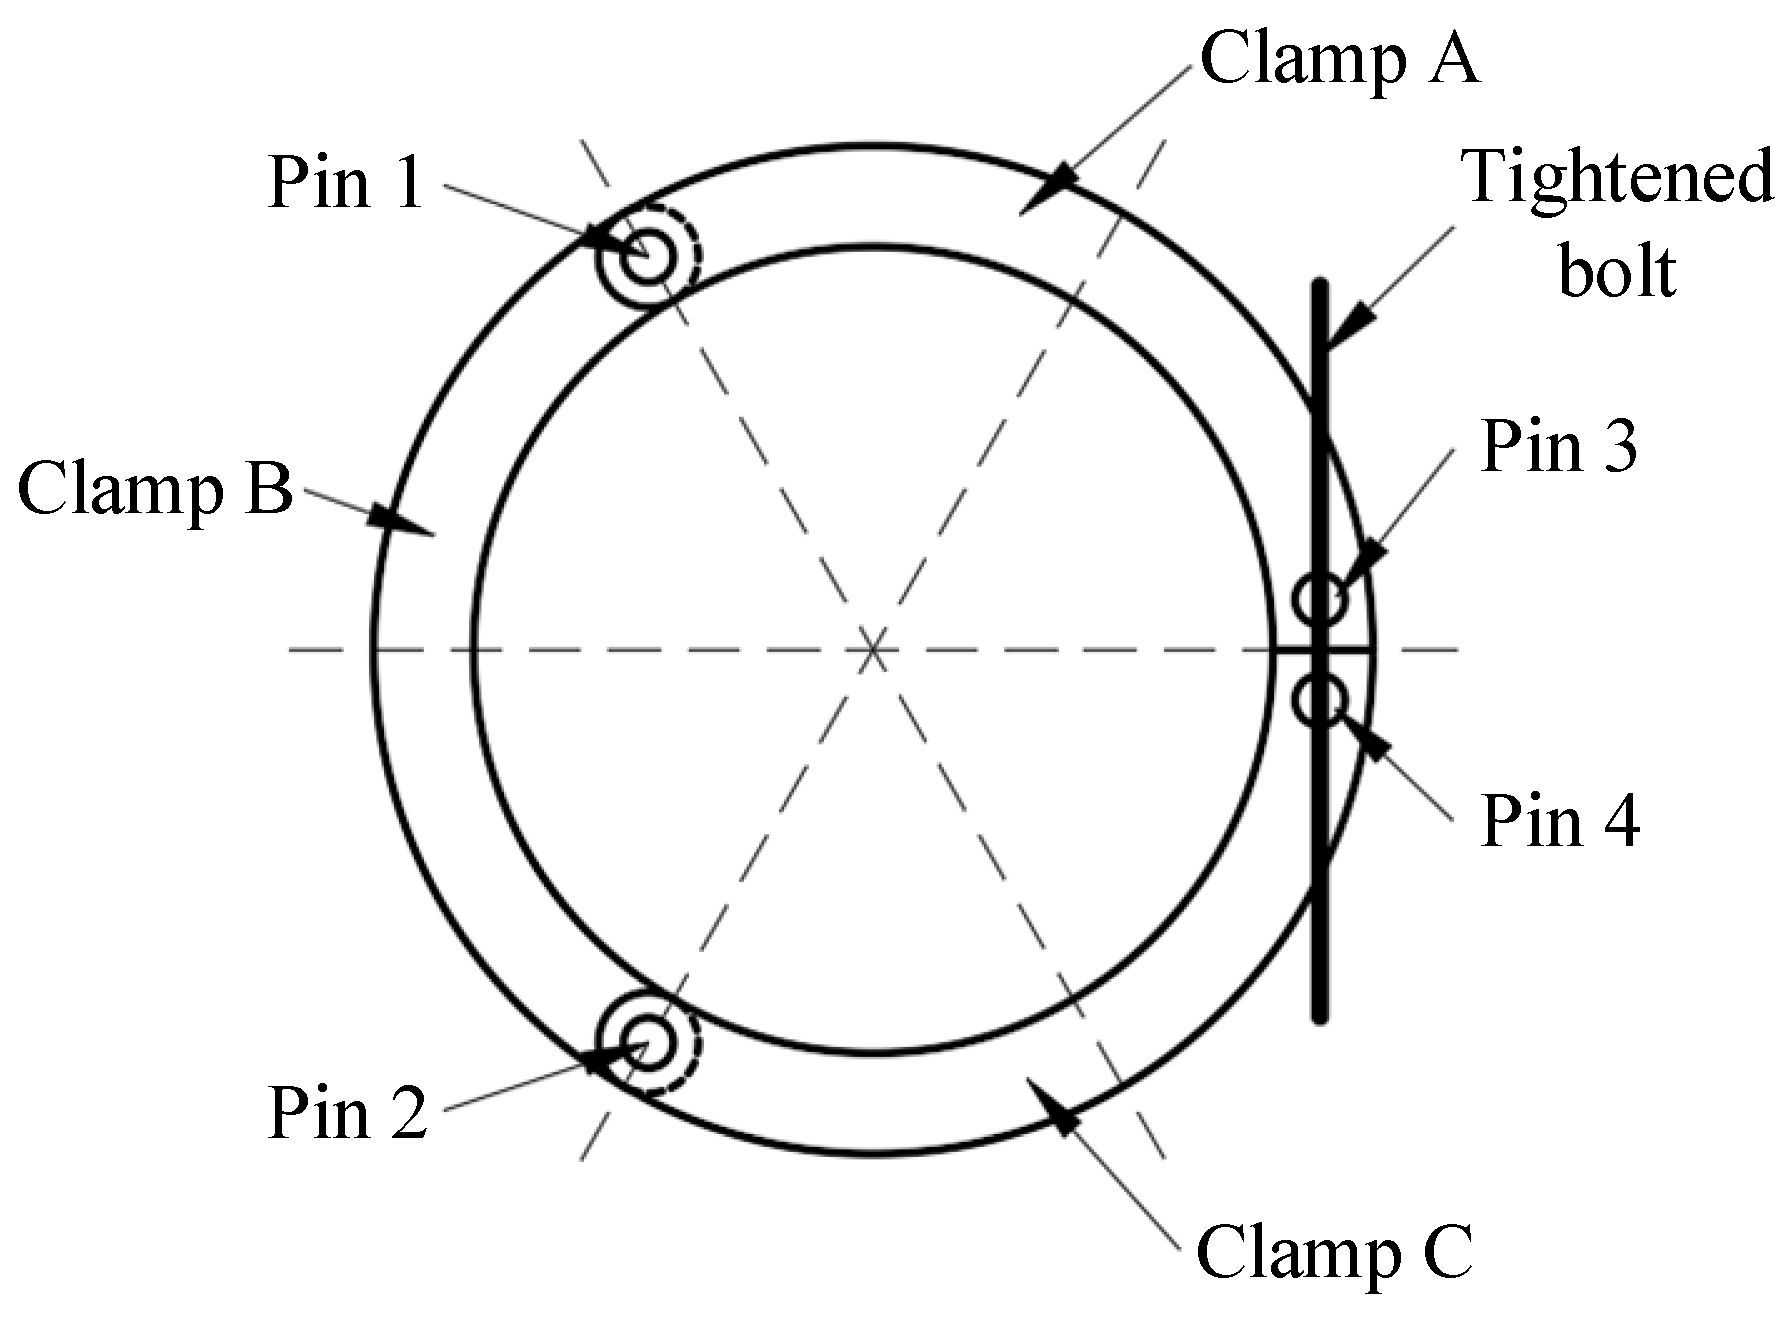
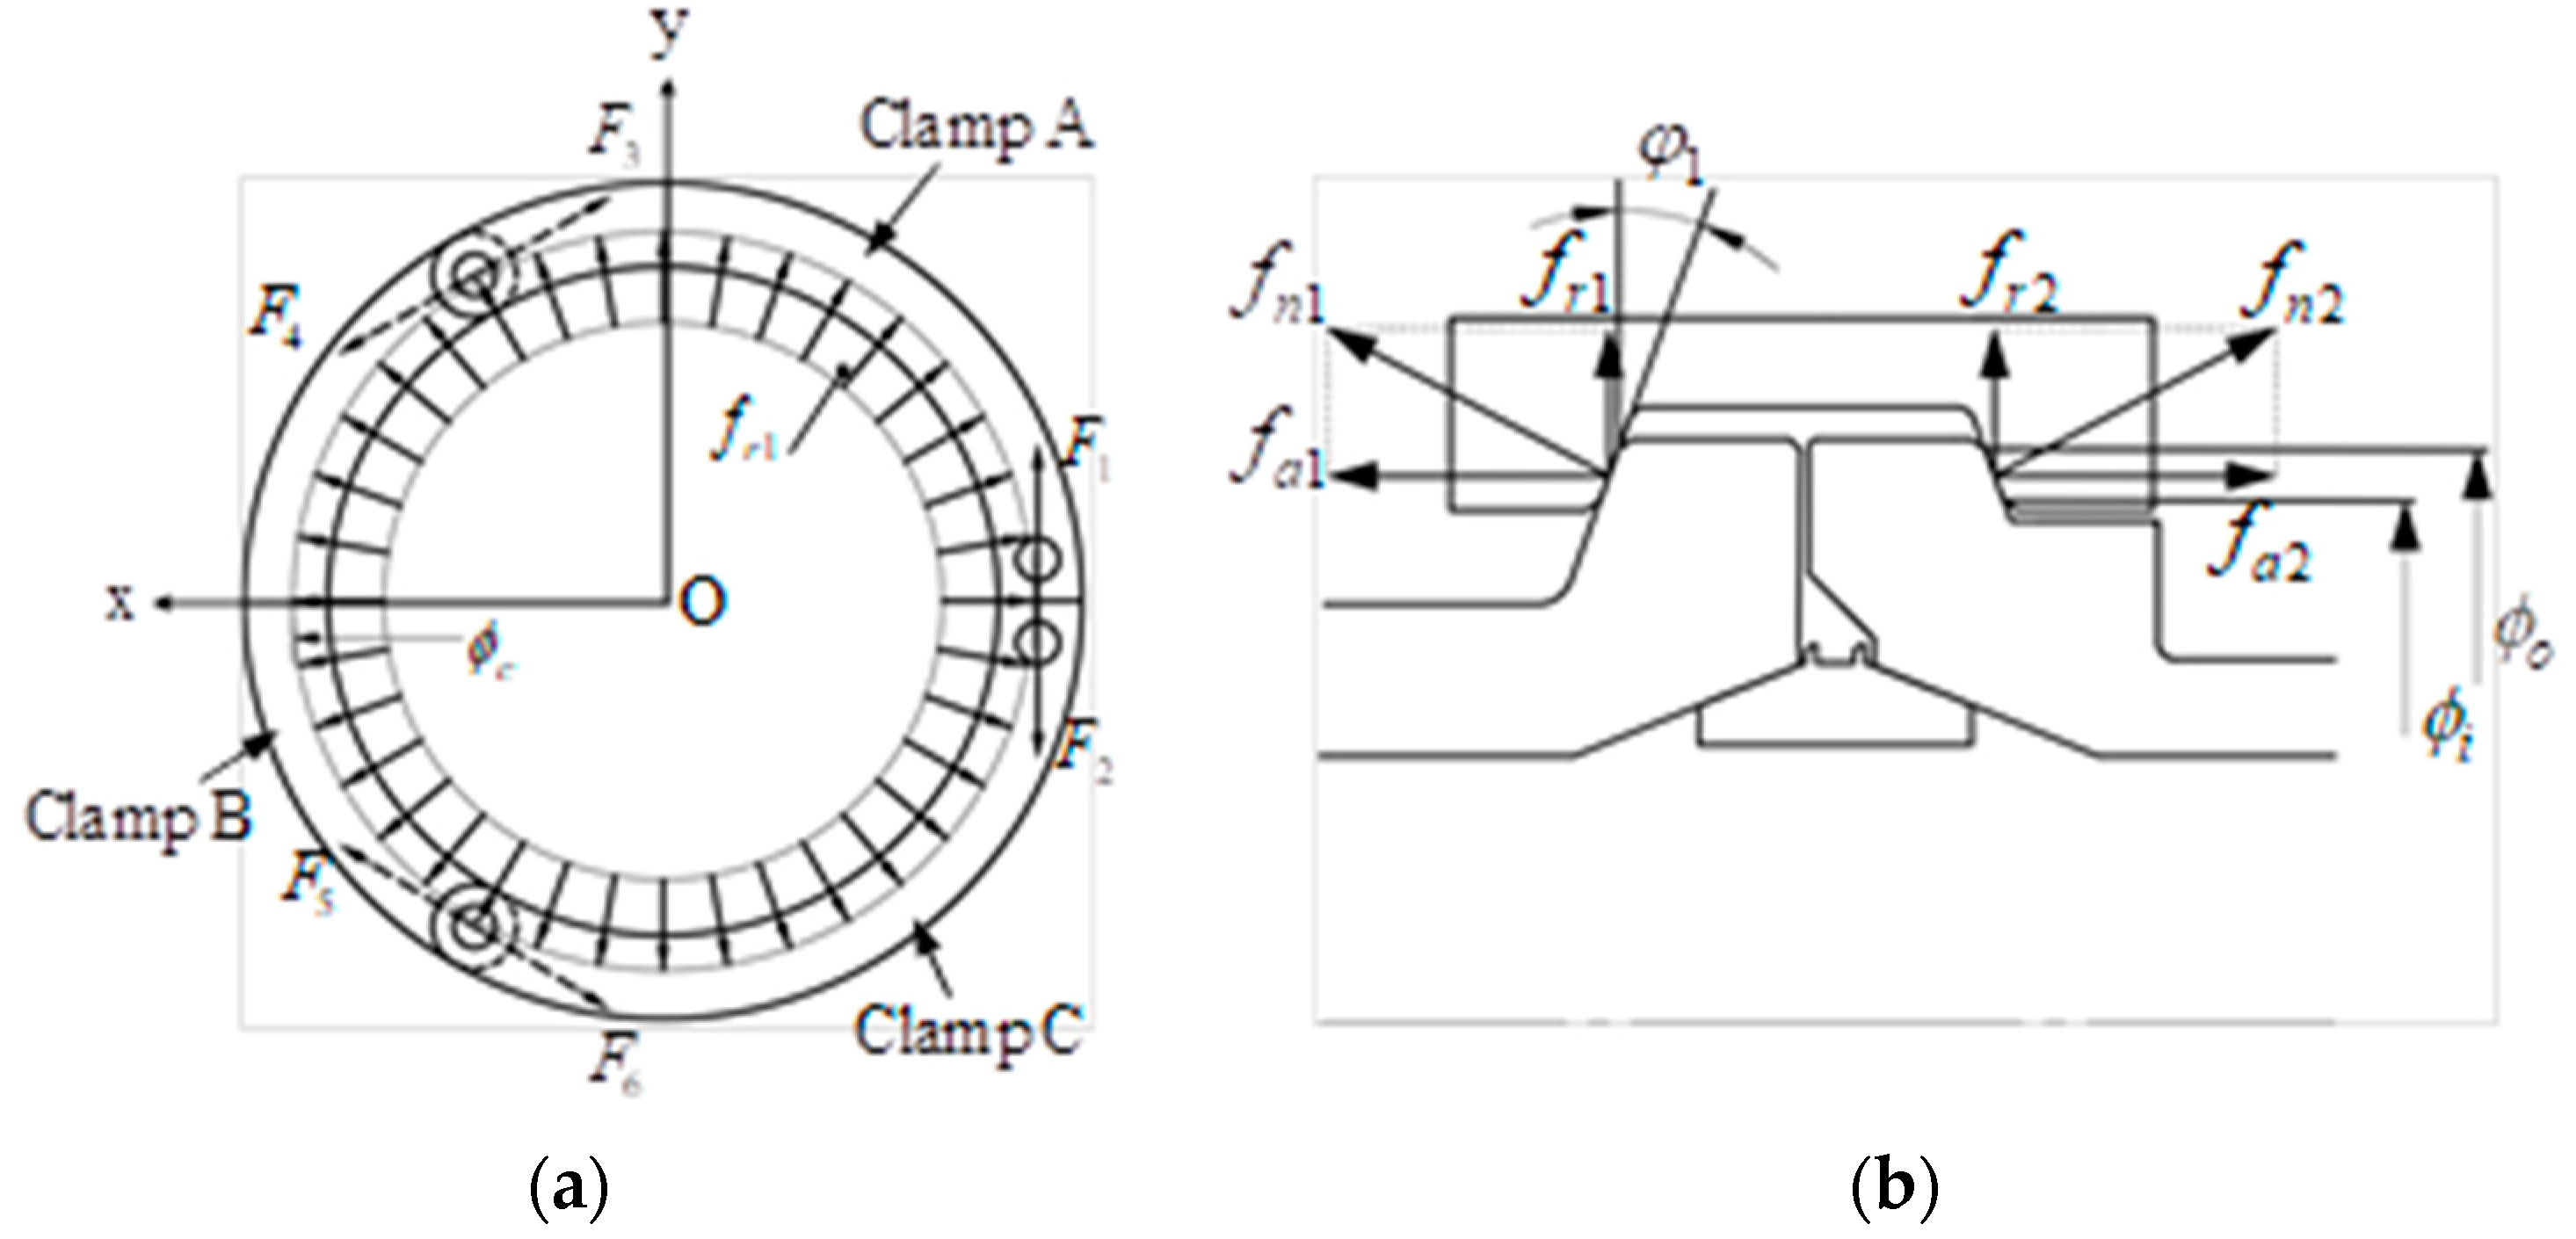
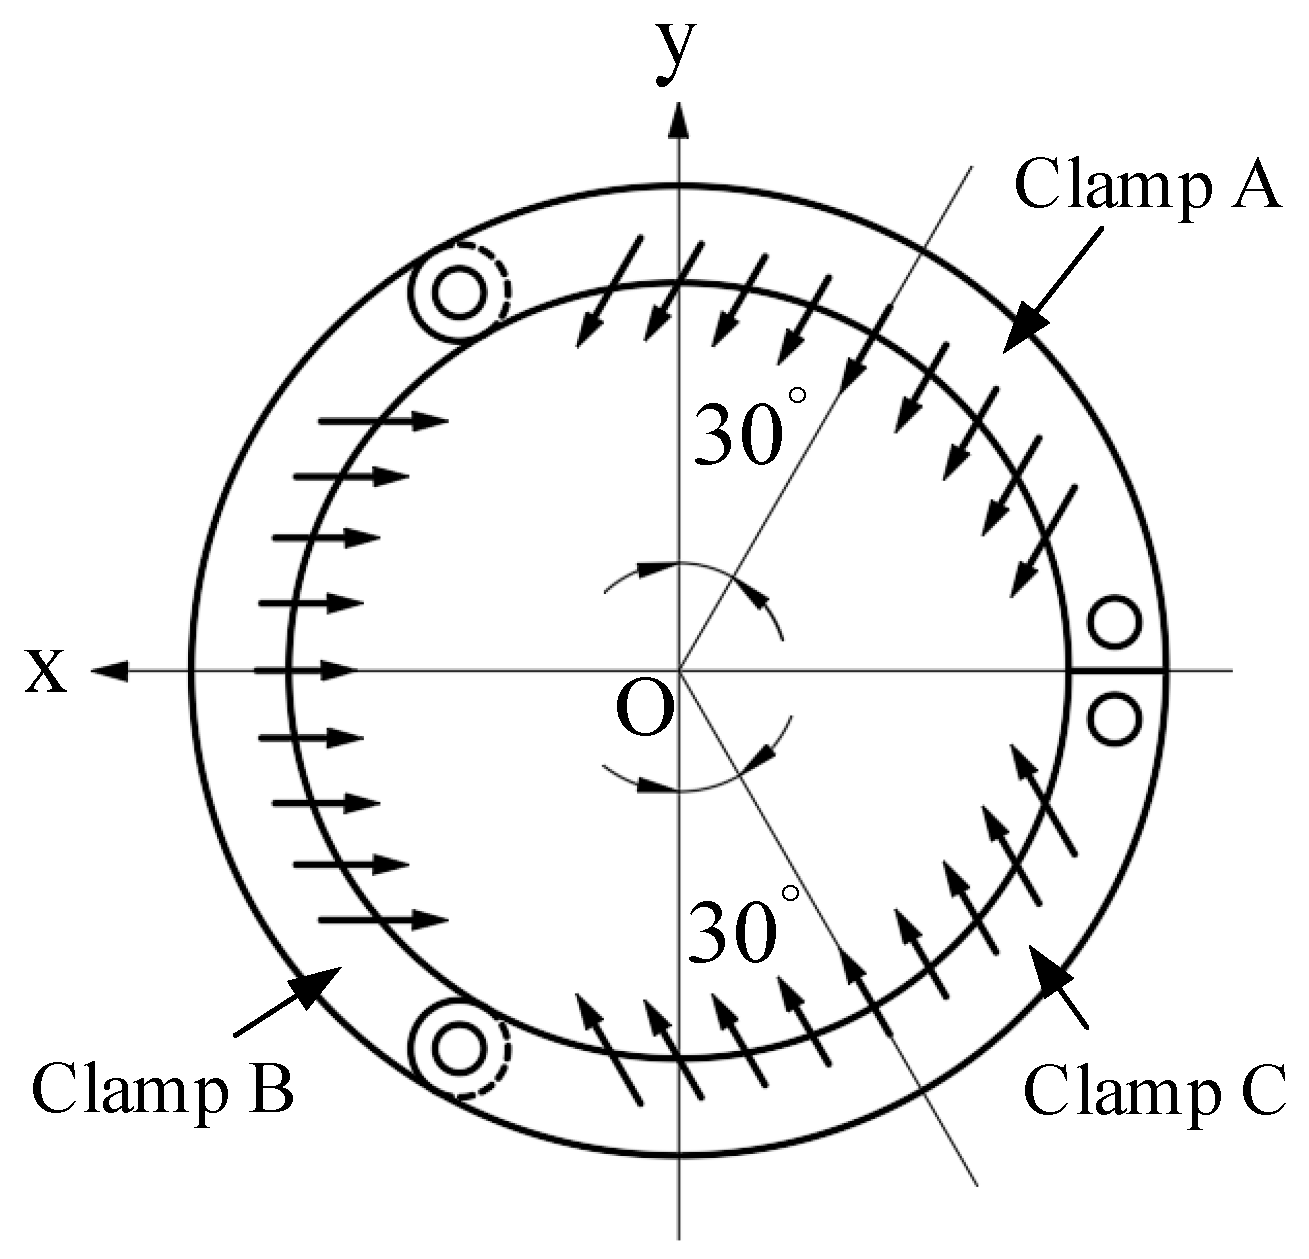
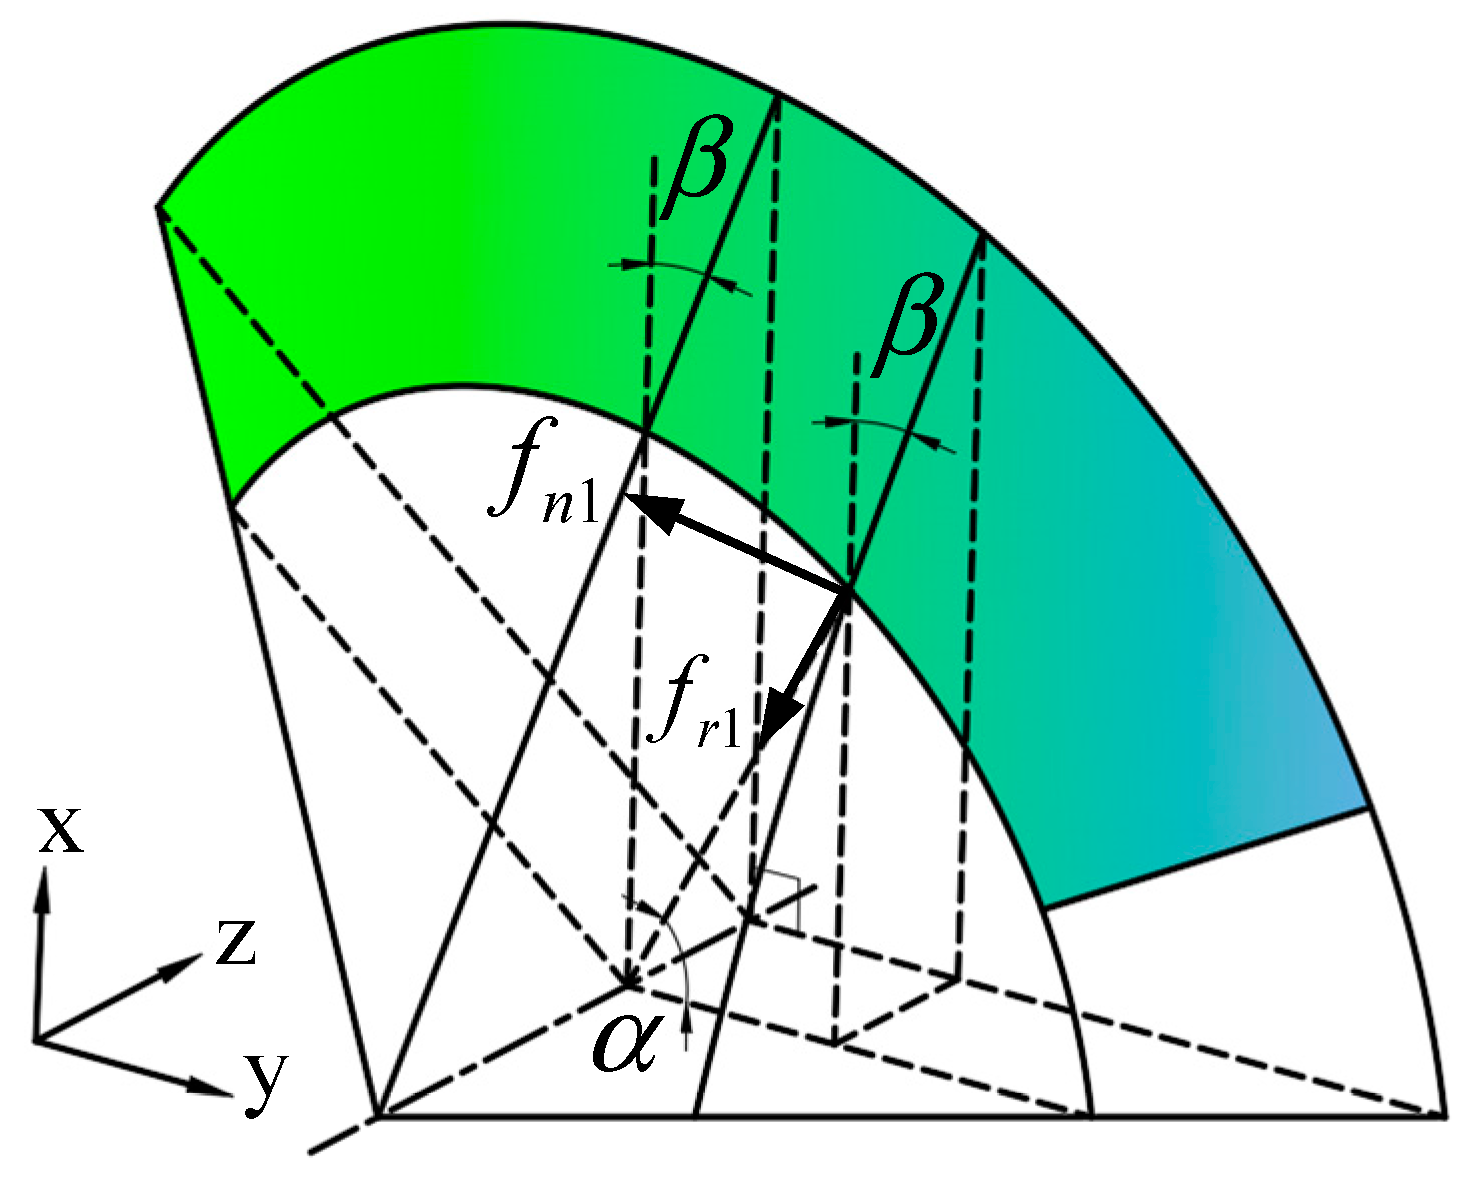
3.1. Analysis of Bolt to Clamp Force Transfer
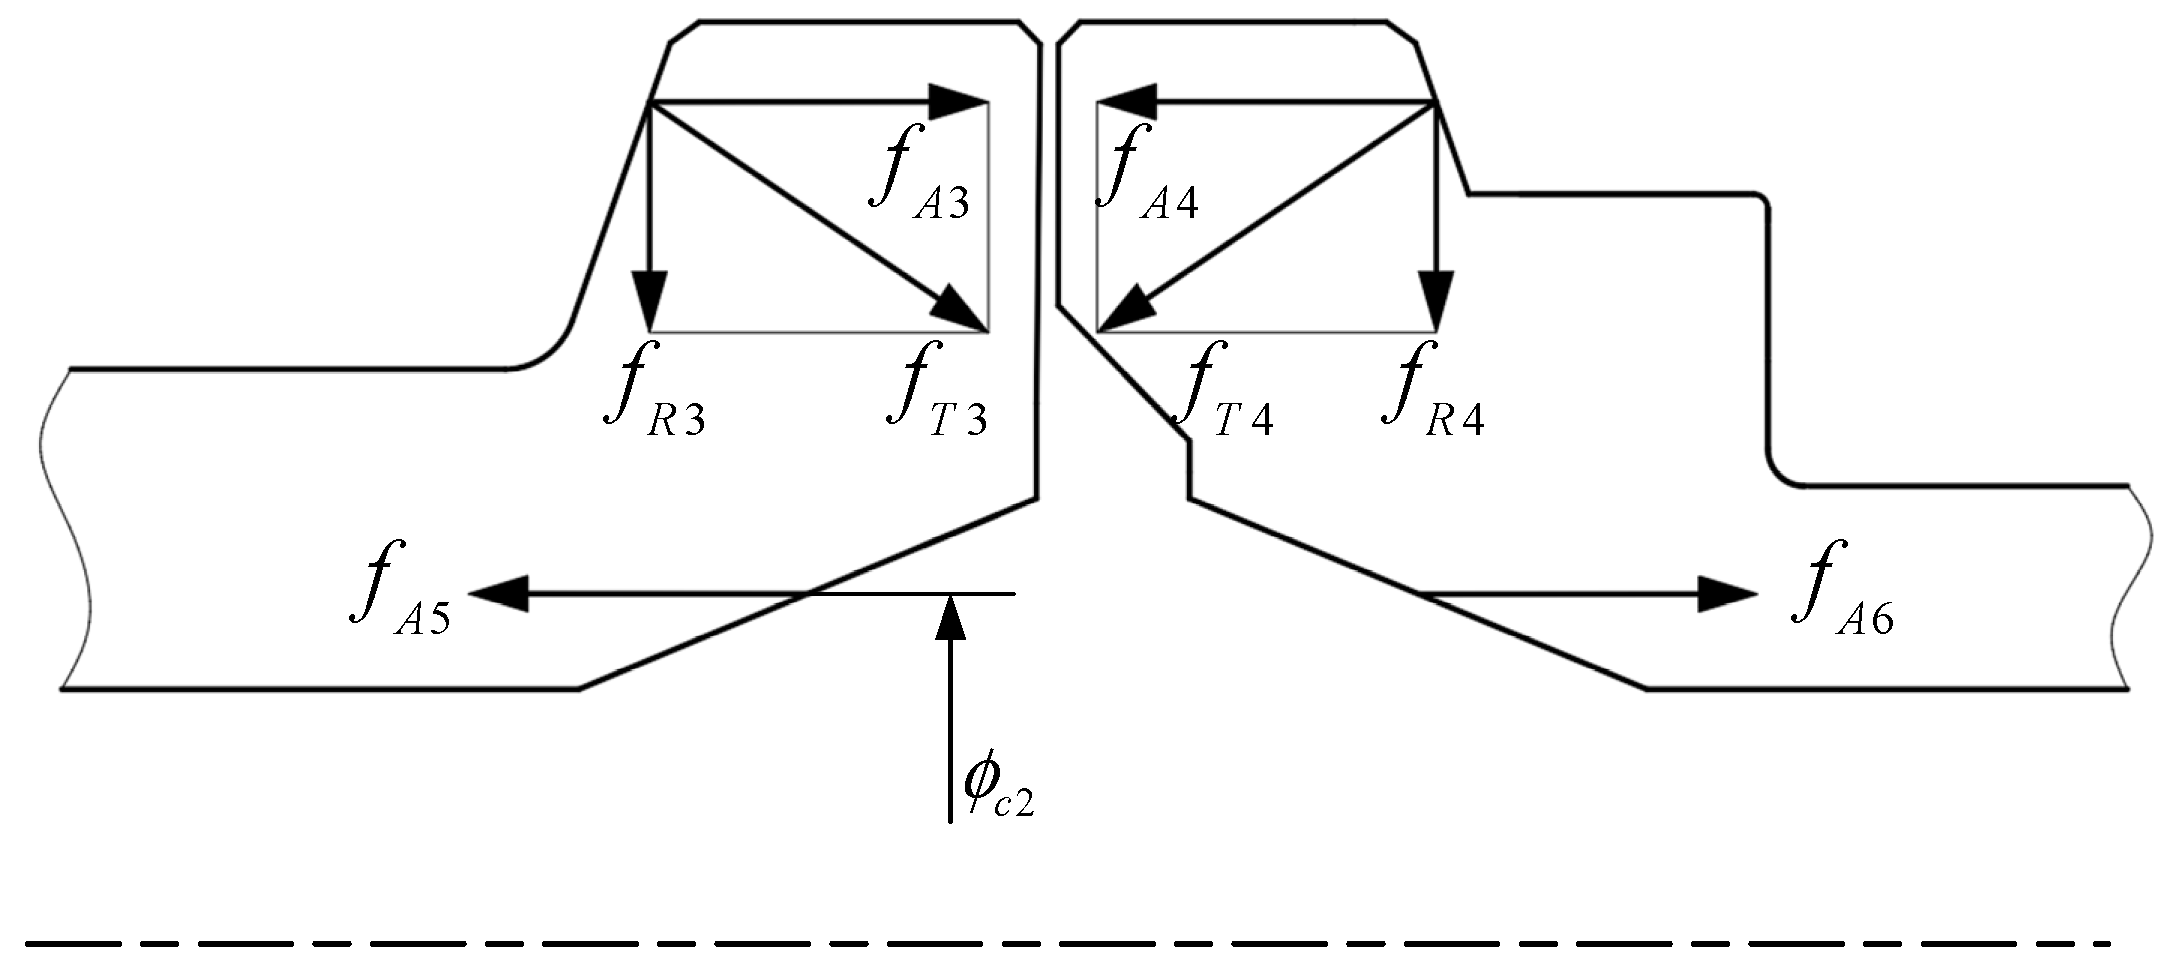
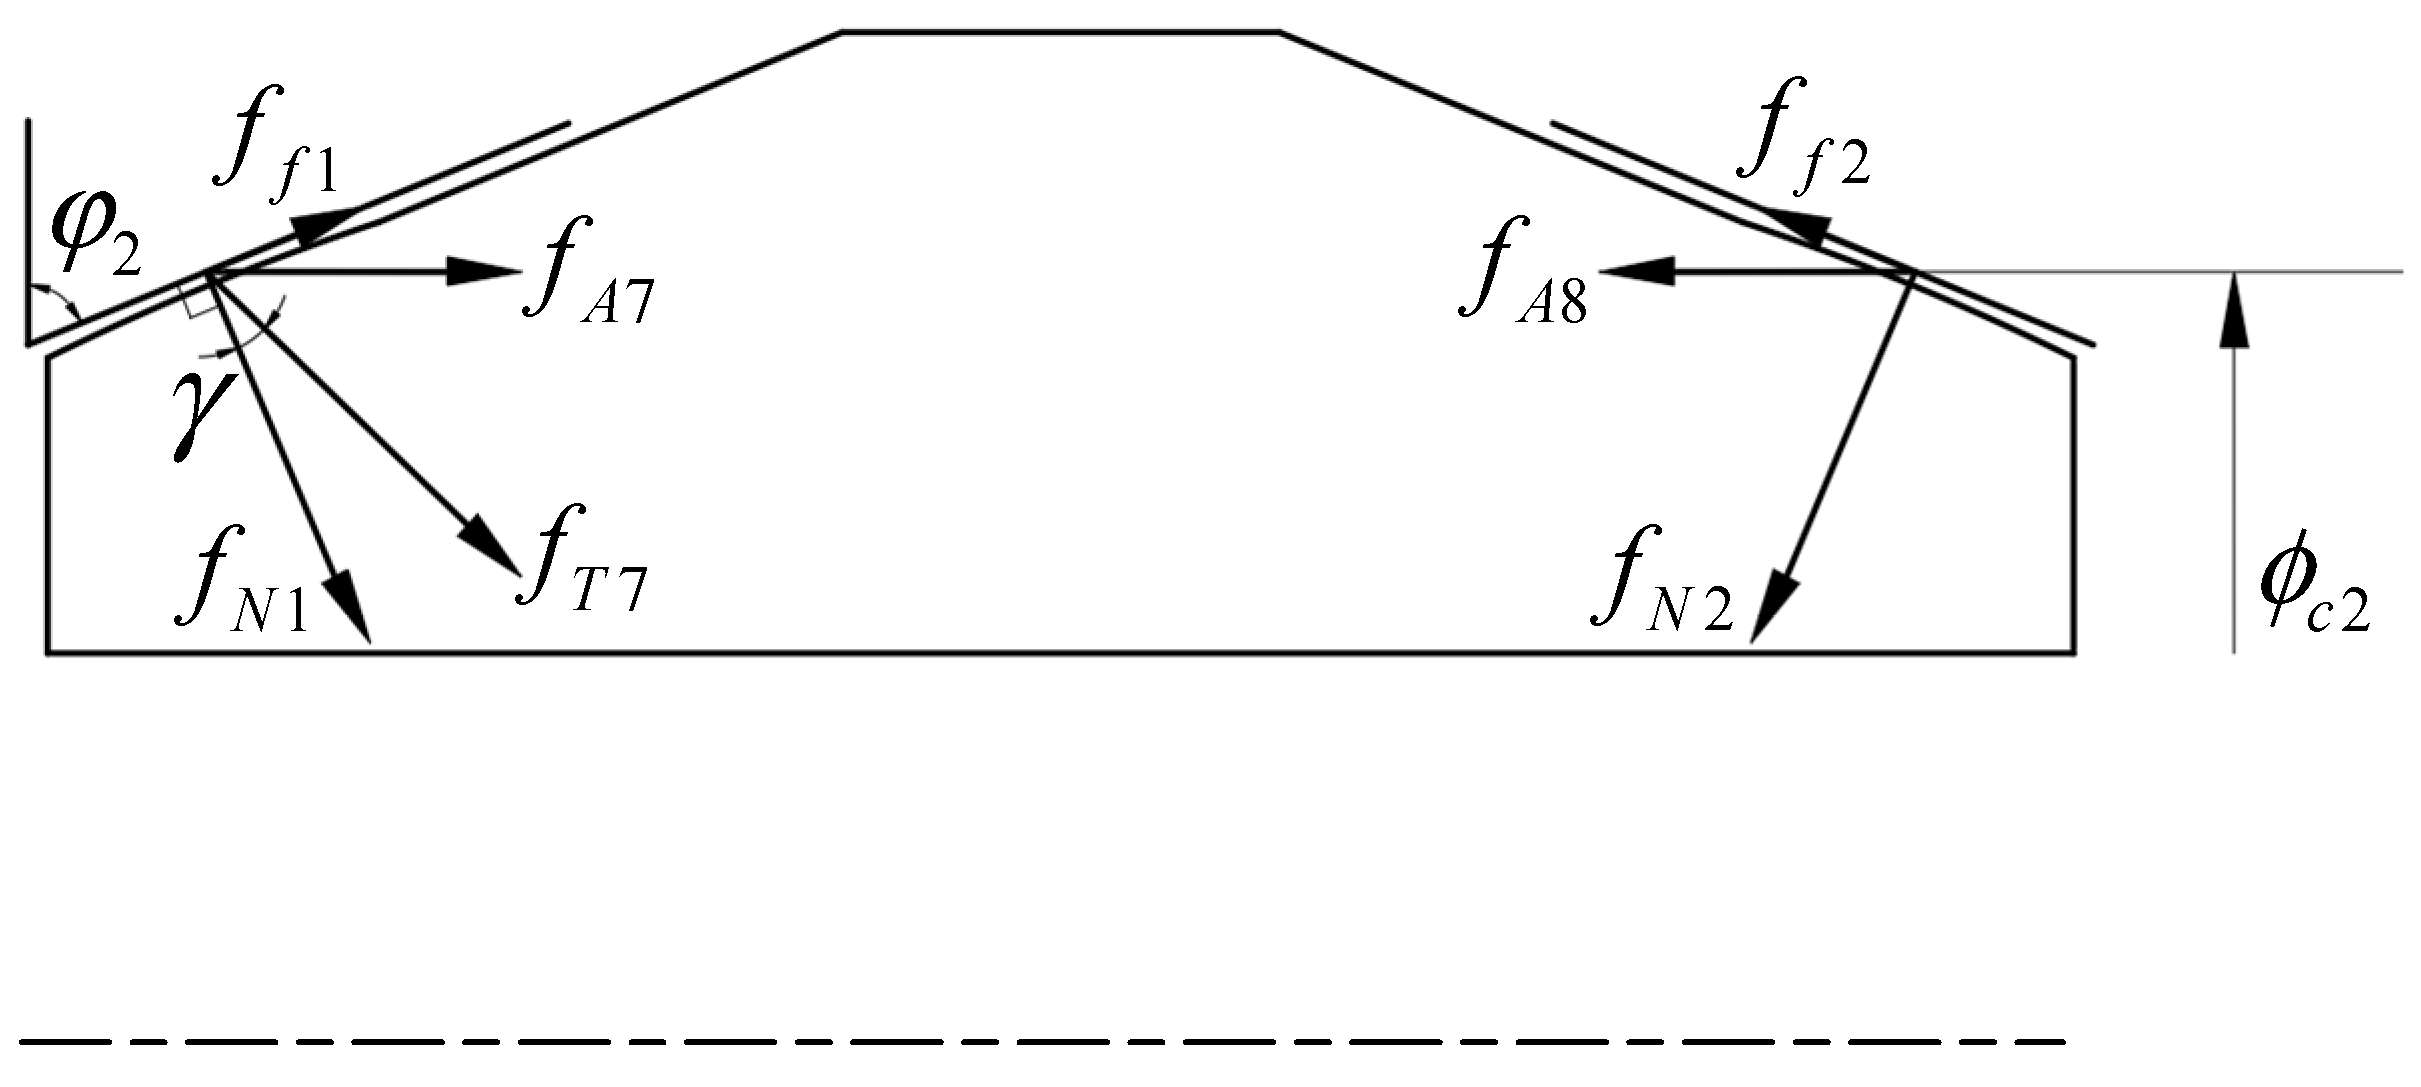
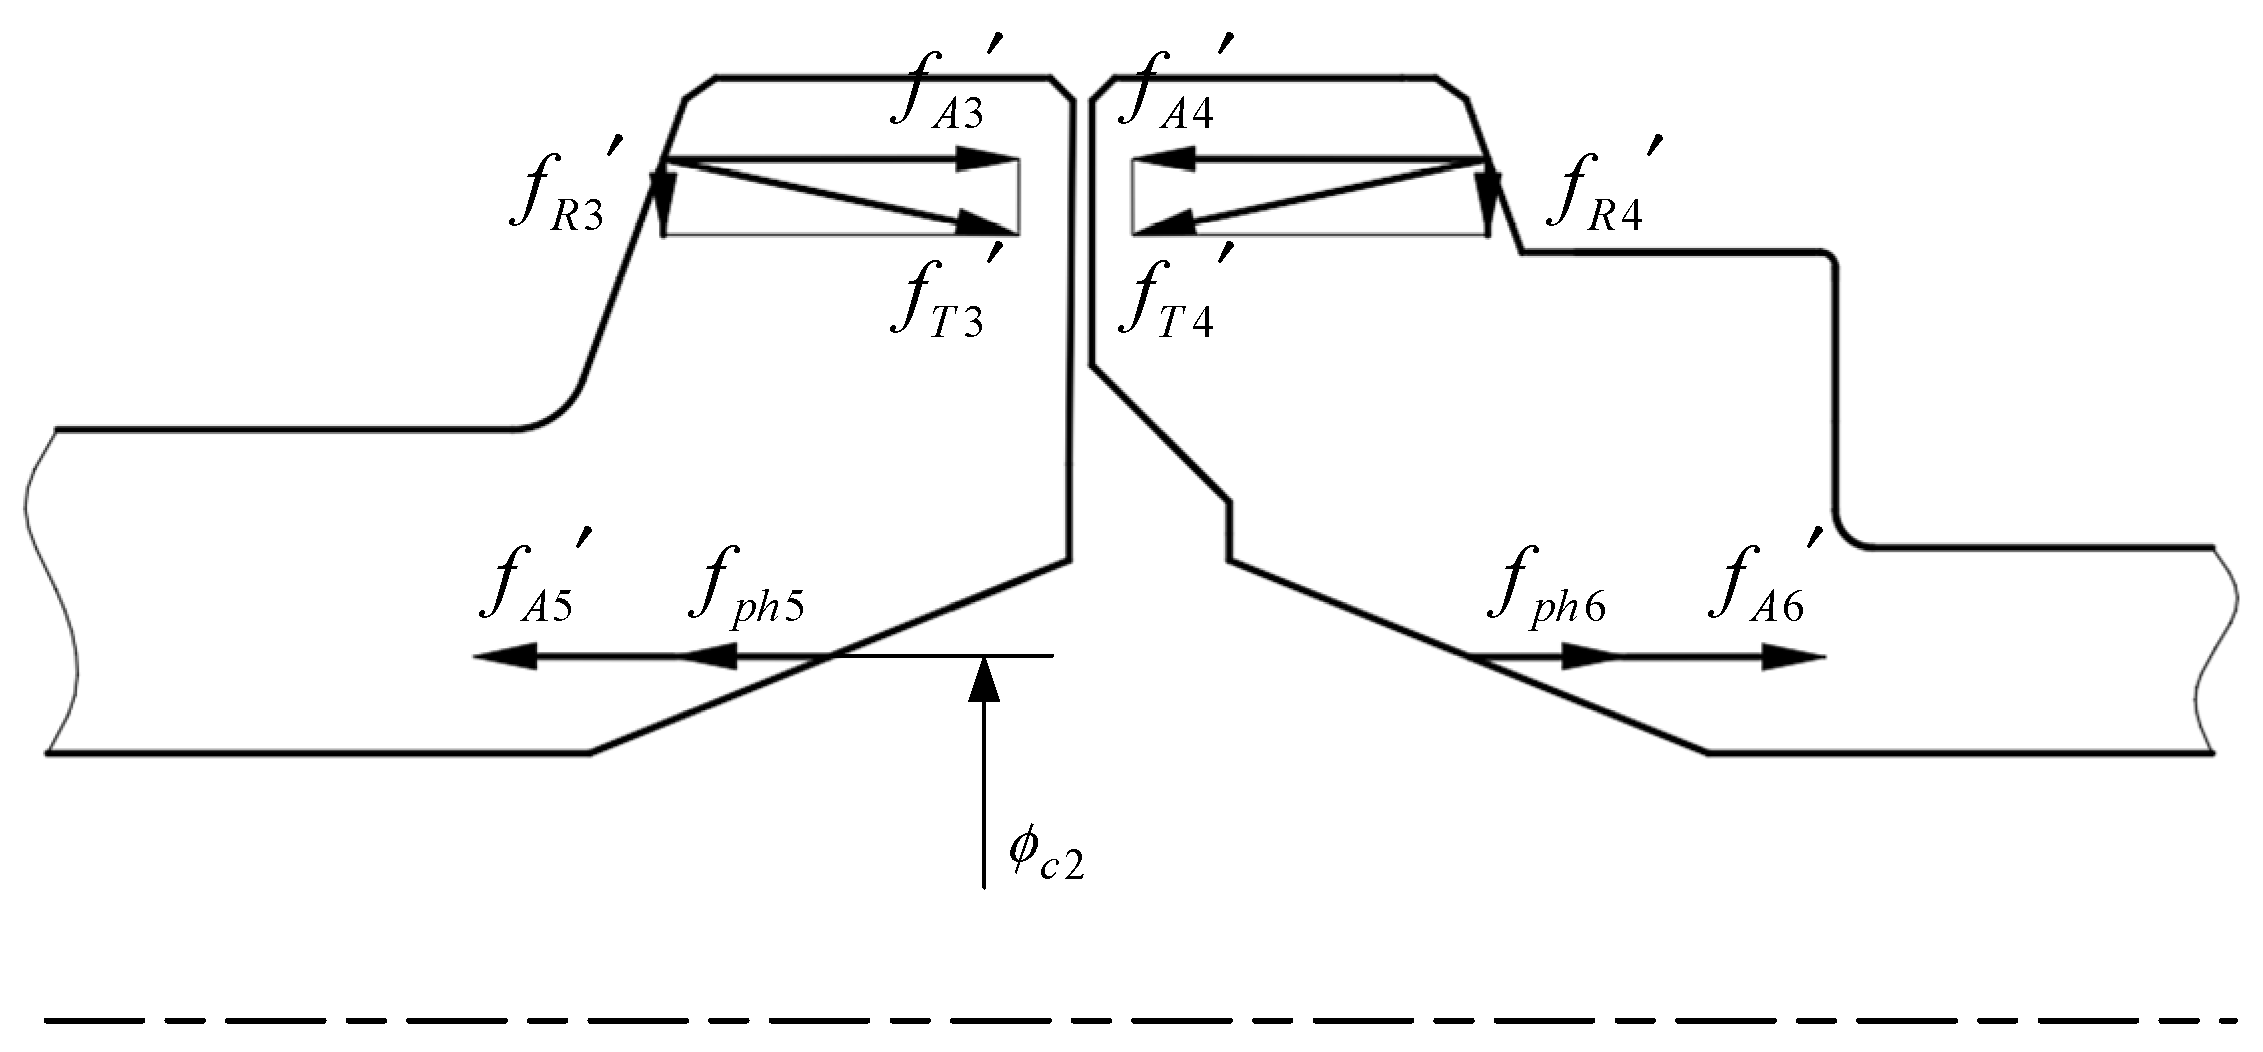
3.2. Analysis of Force Transfer from Clamp to Sealing Gasket under Preloading Mode
3.3. Analysis of Force Transfer from Clamp to Sealing Gasket under Operation Mode
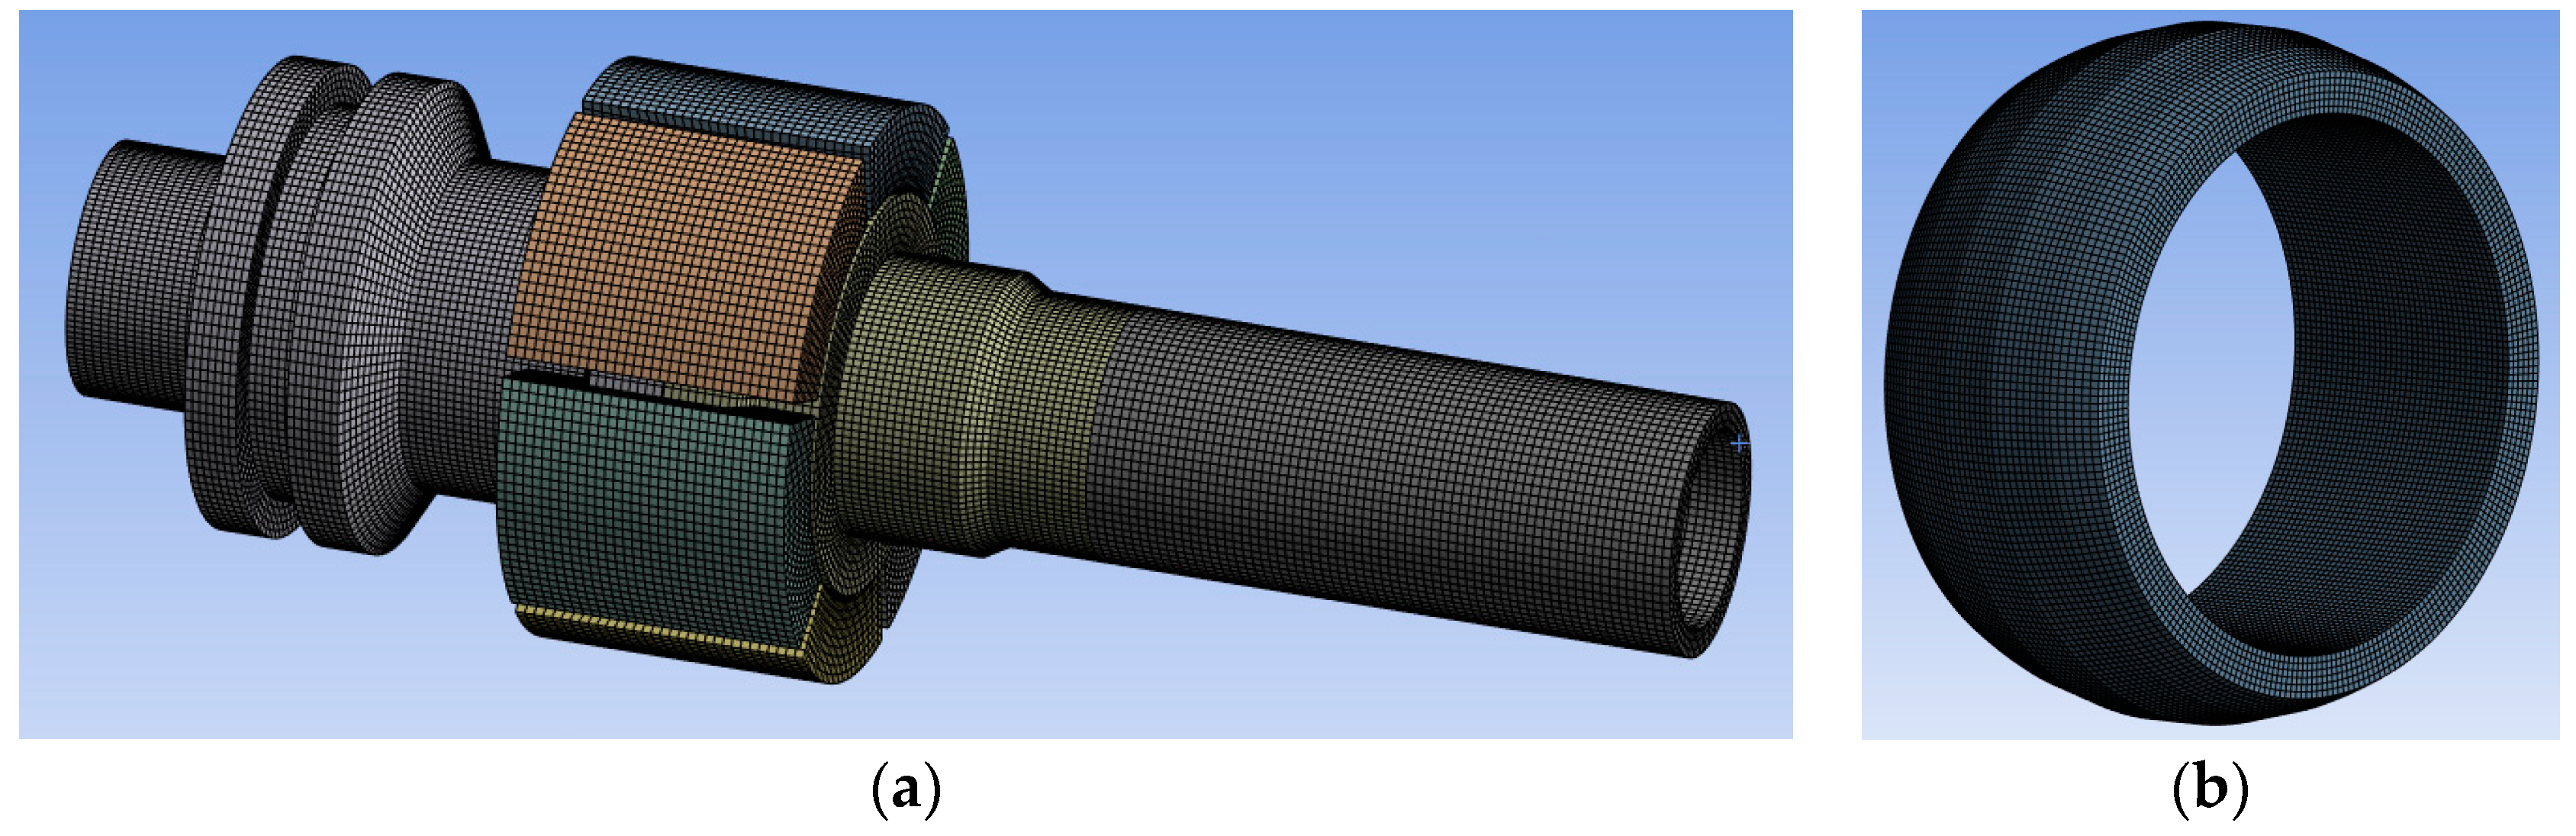
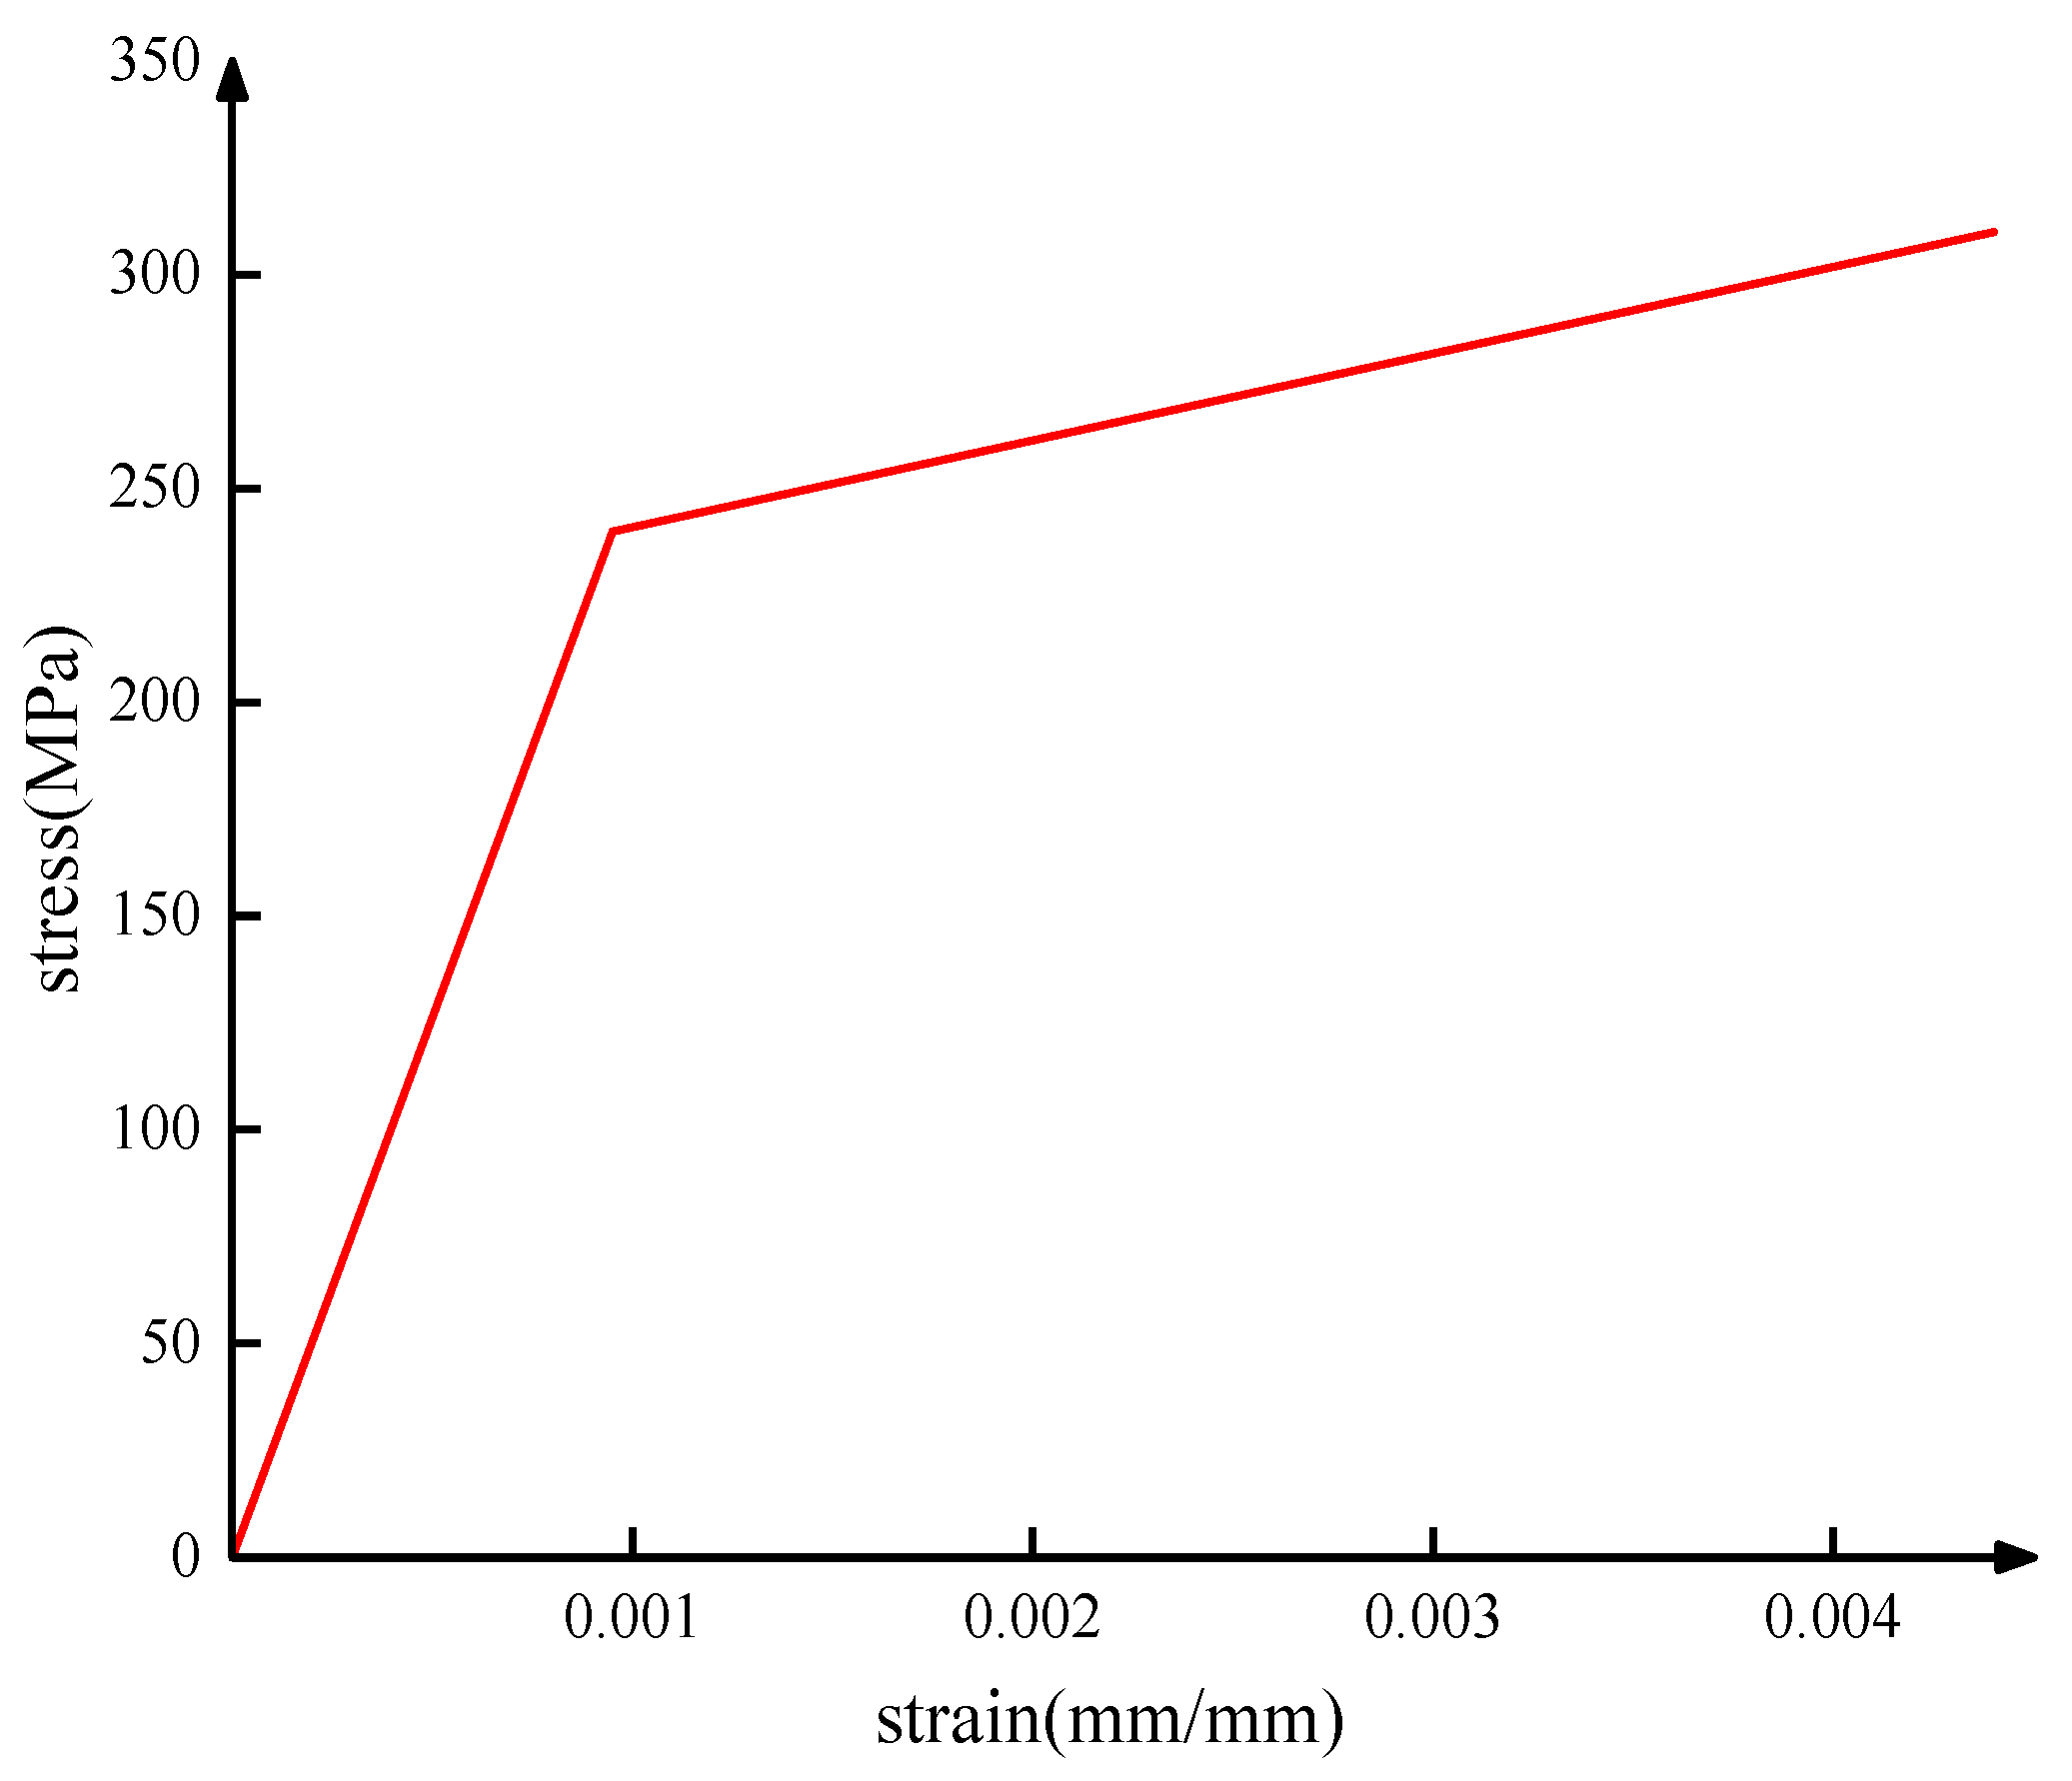
4. Finite Element Simulation
4.1. Three-Dimensional Finite Element Model
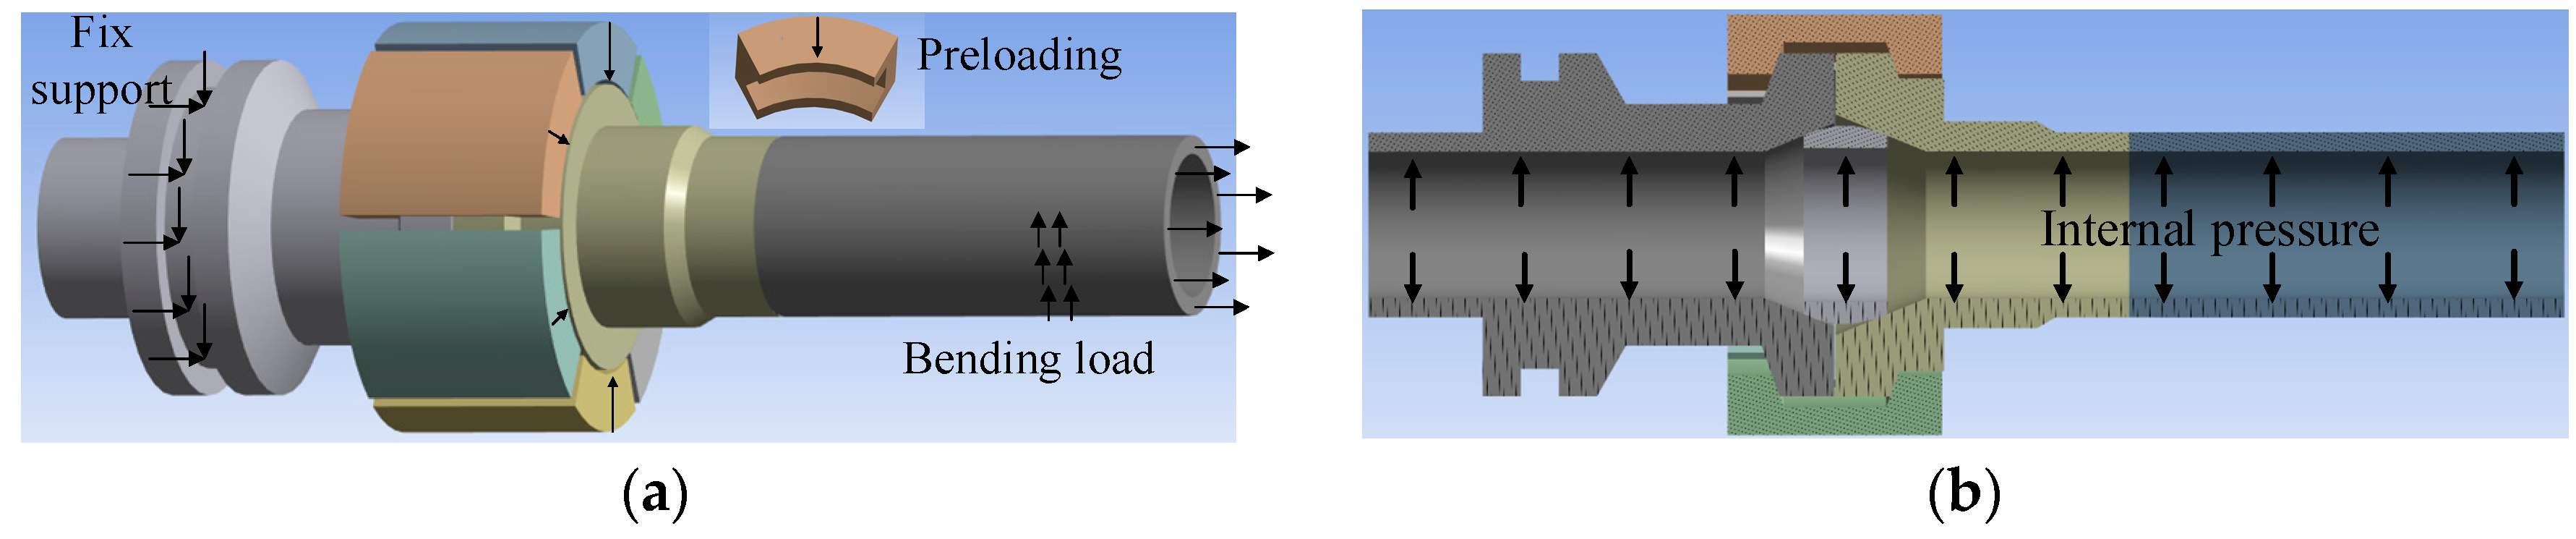
4.2. Boundary Conditions
4.3. Analysis of FE Simulation Results
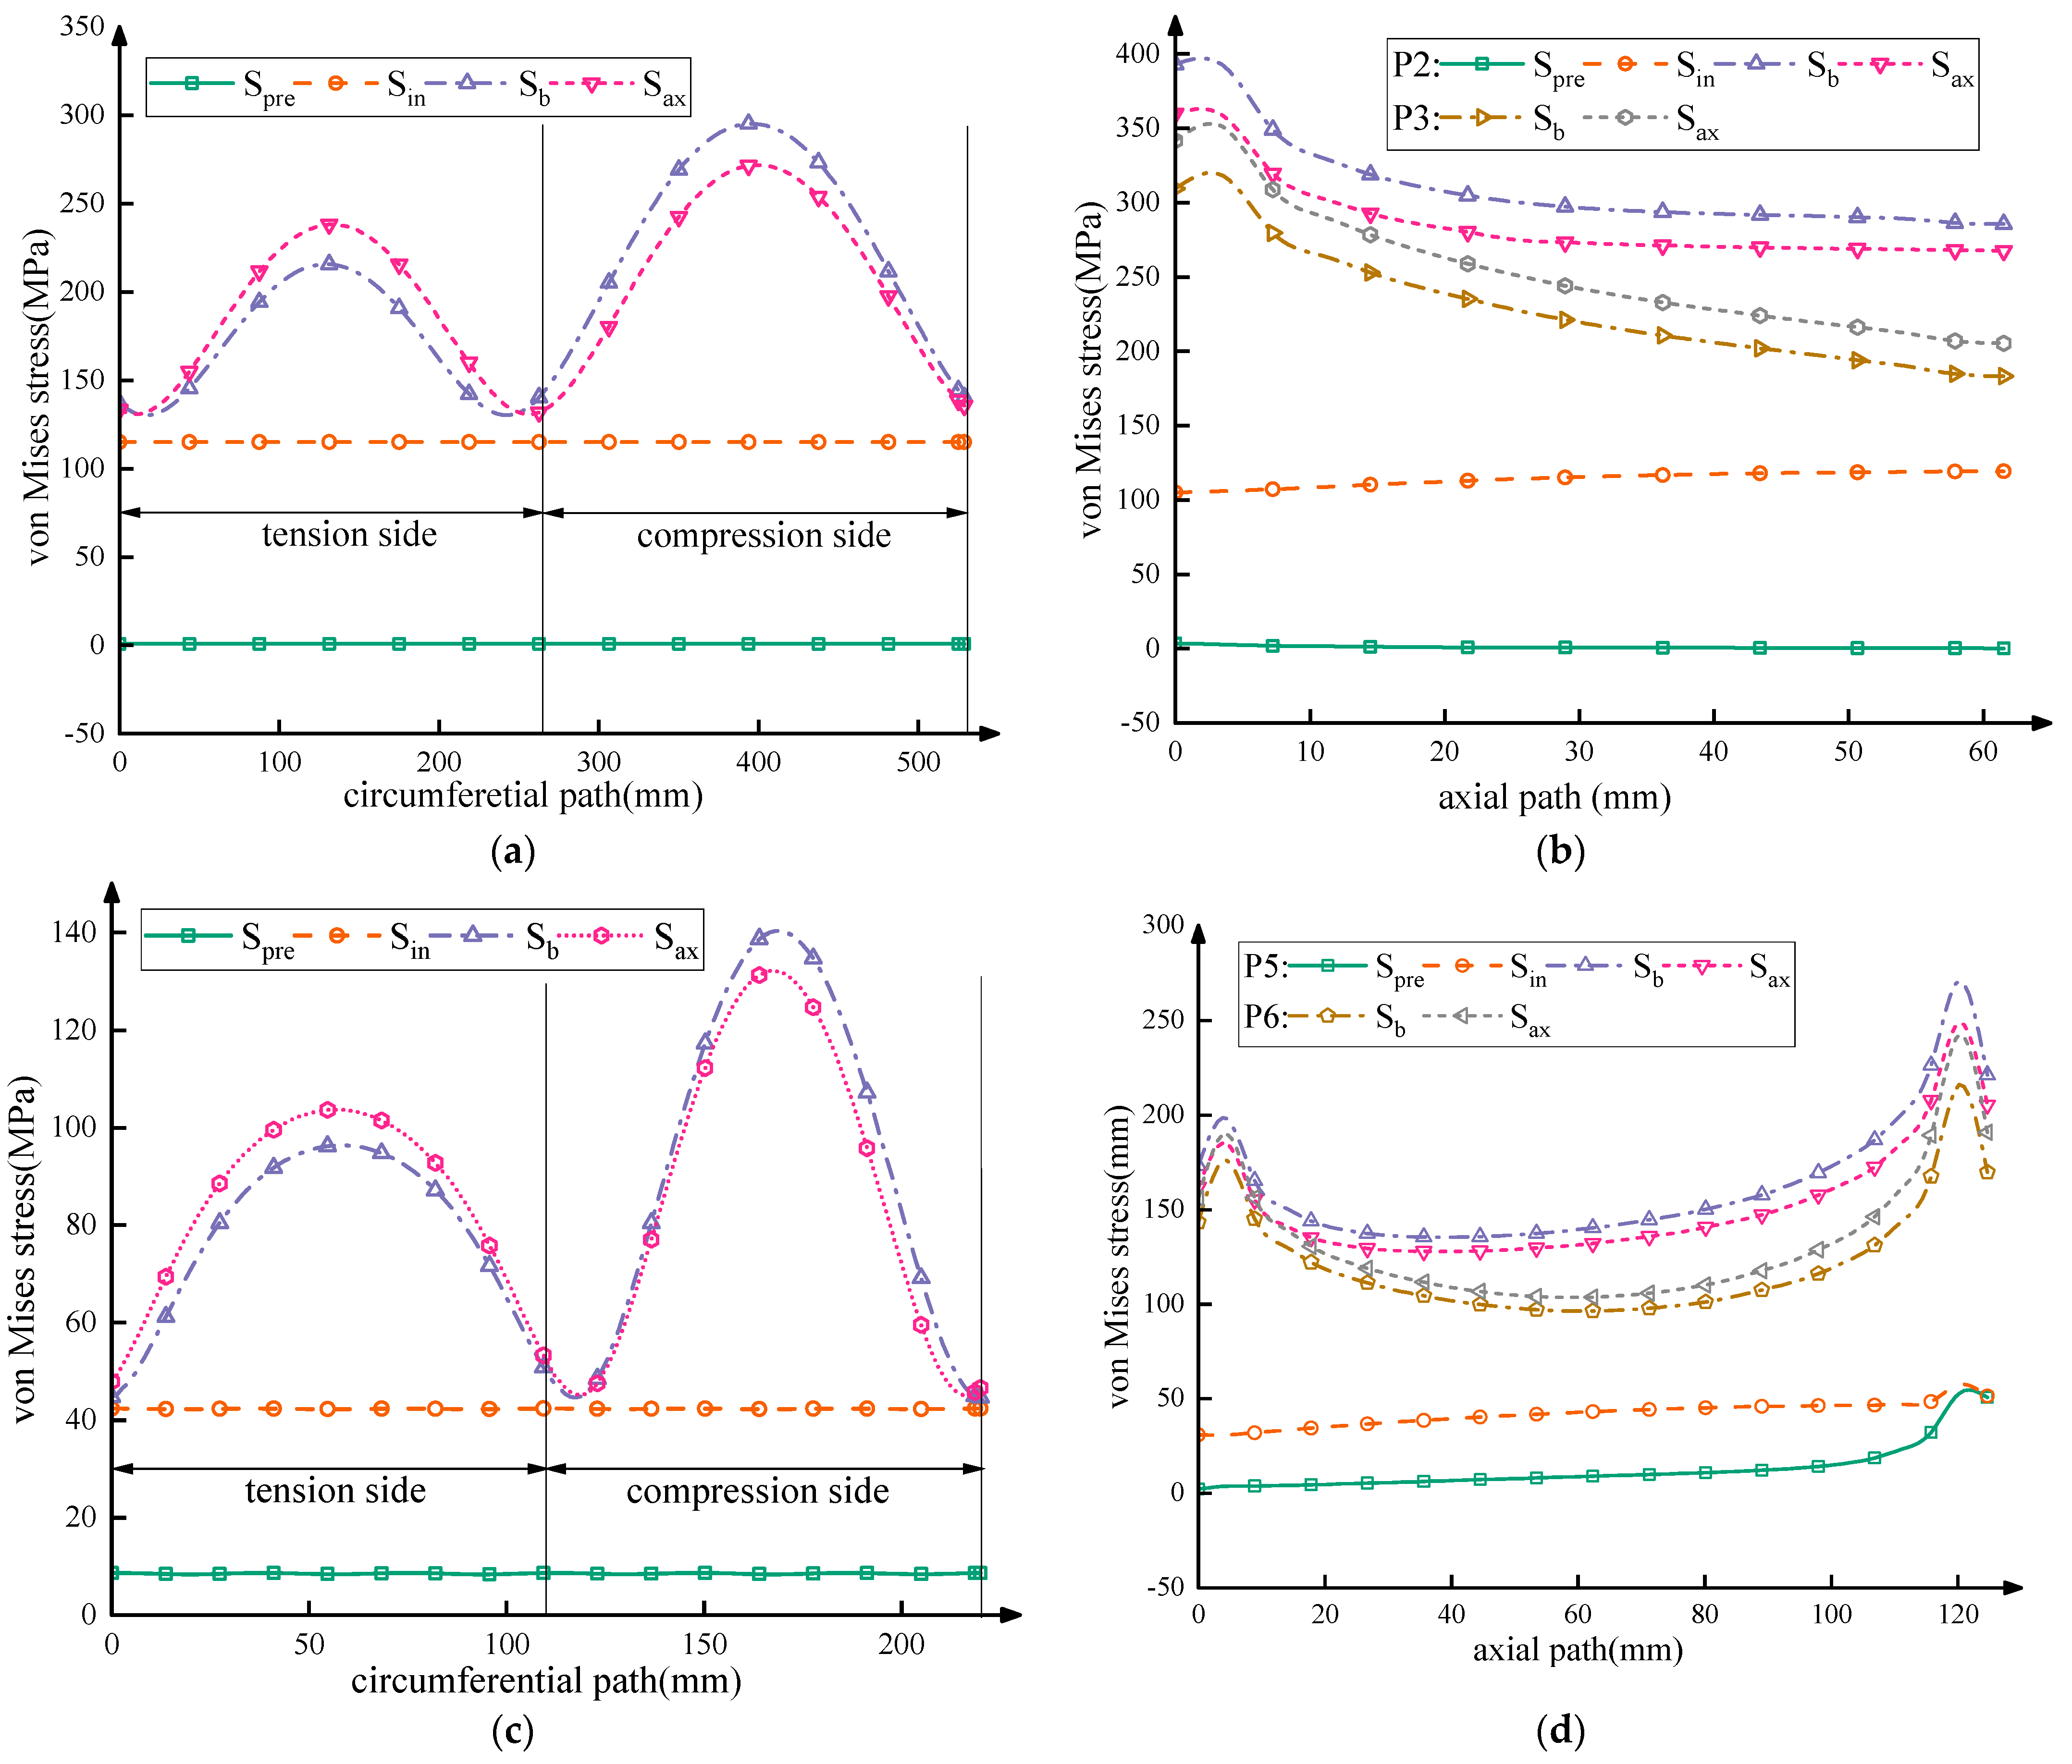
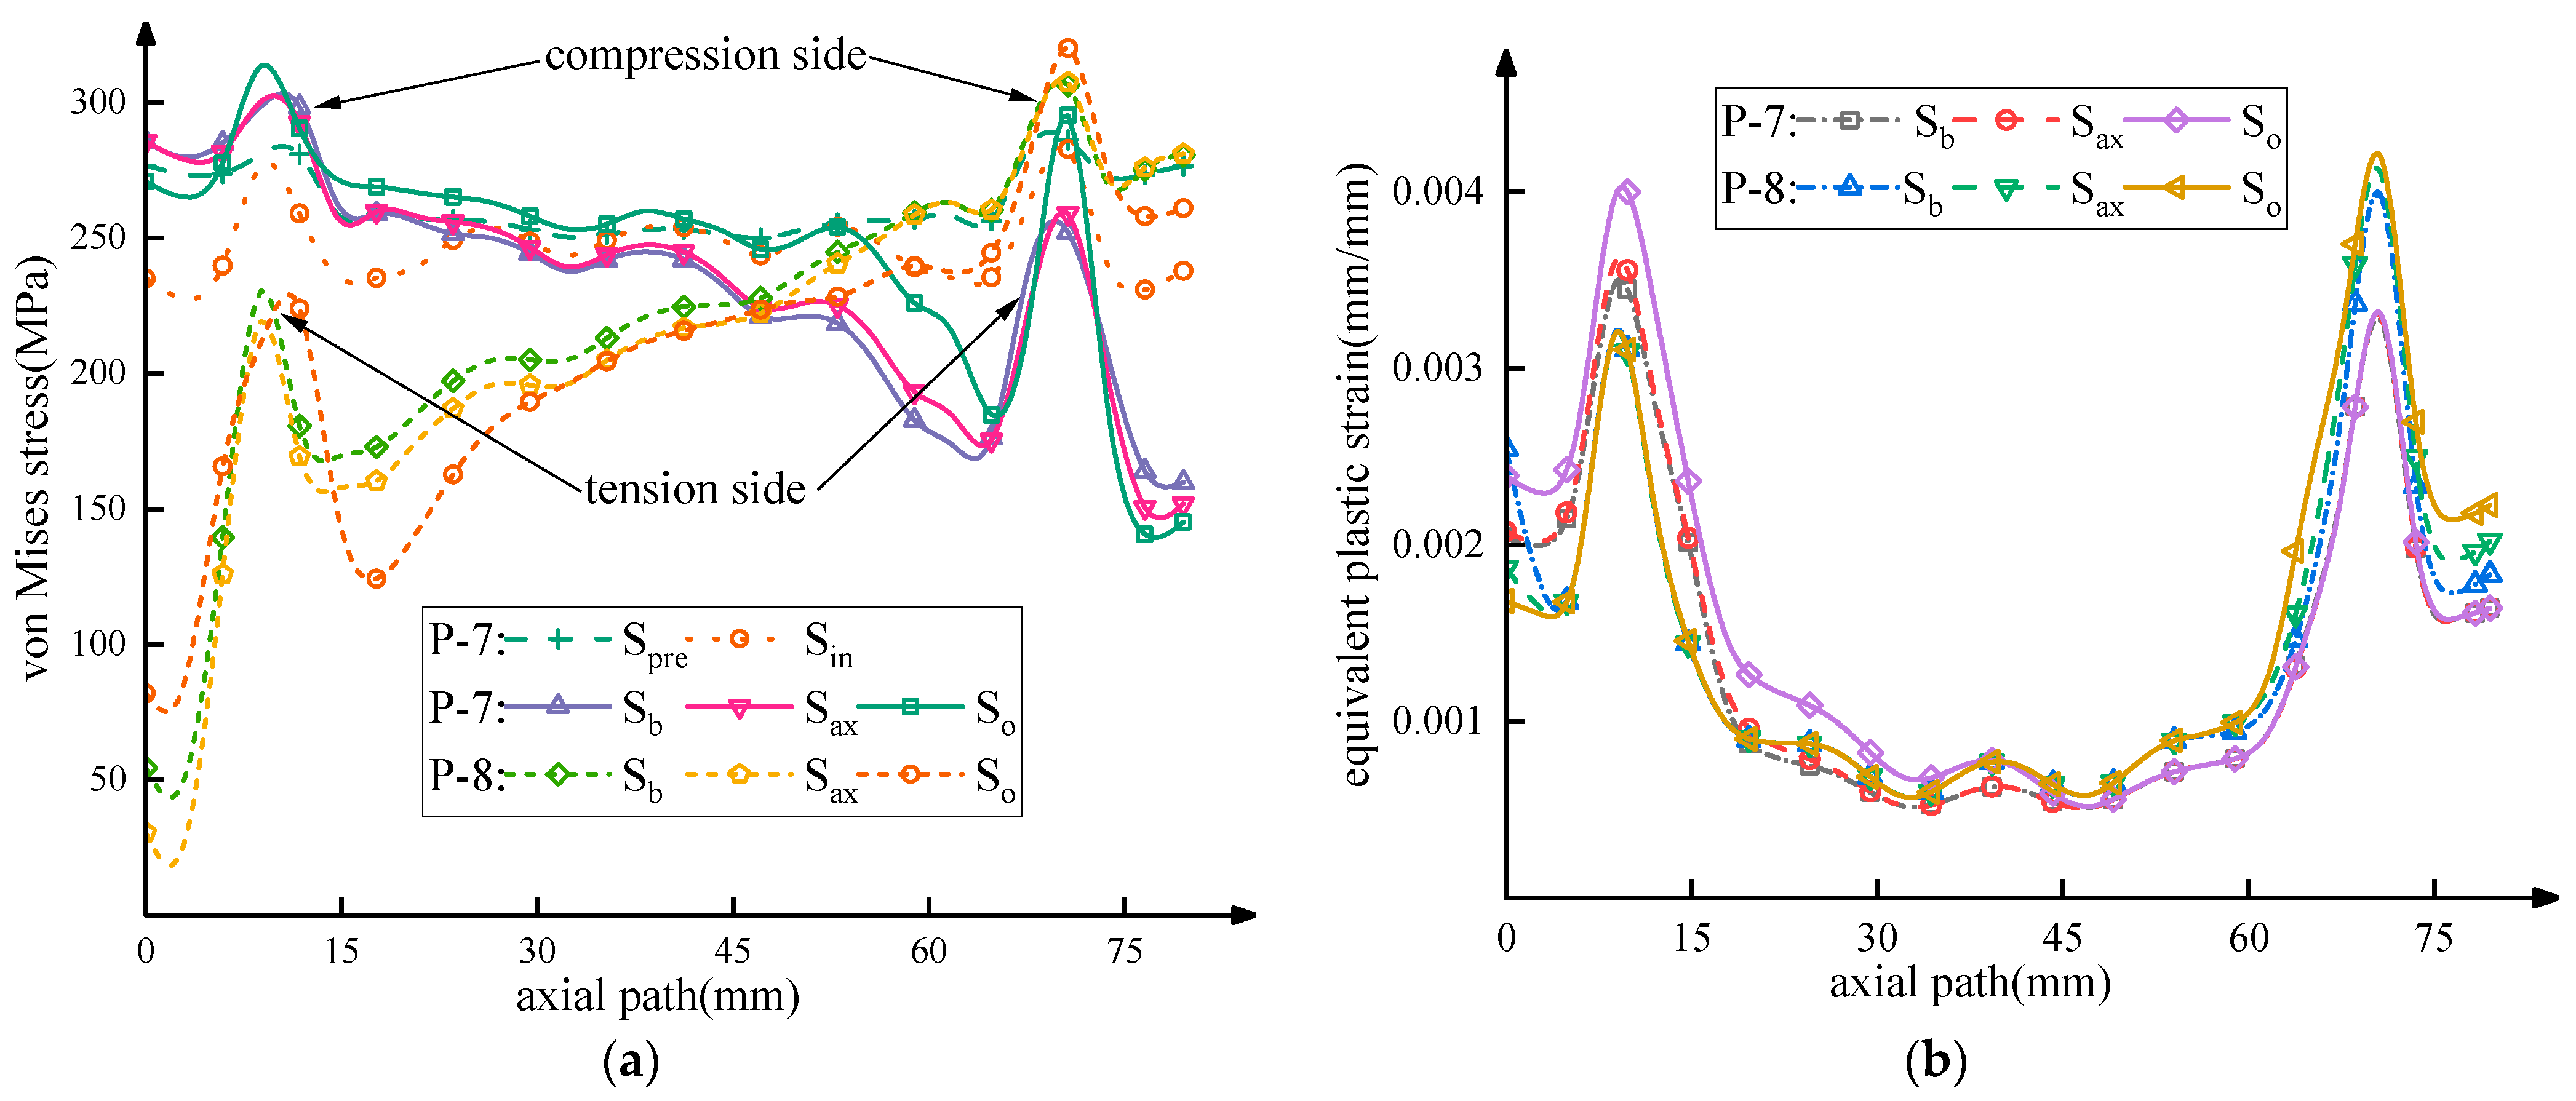
4.3.1. The Mechanical Properties Analysis on Hub Critical Path
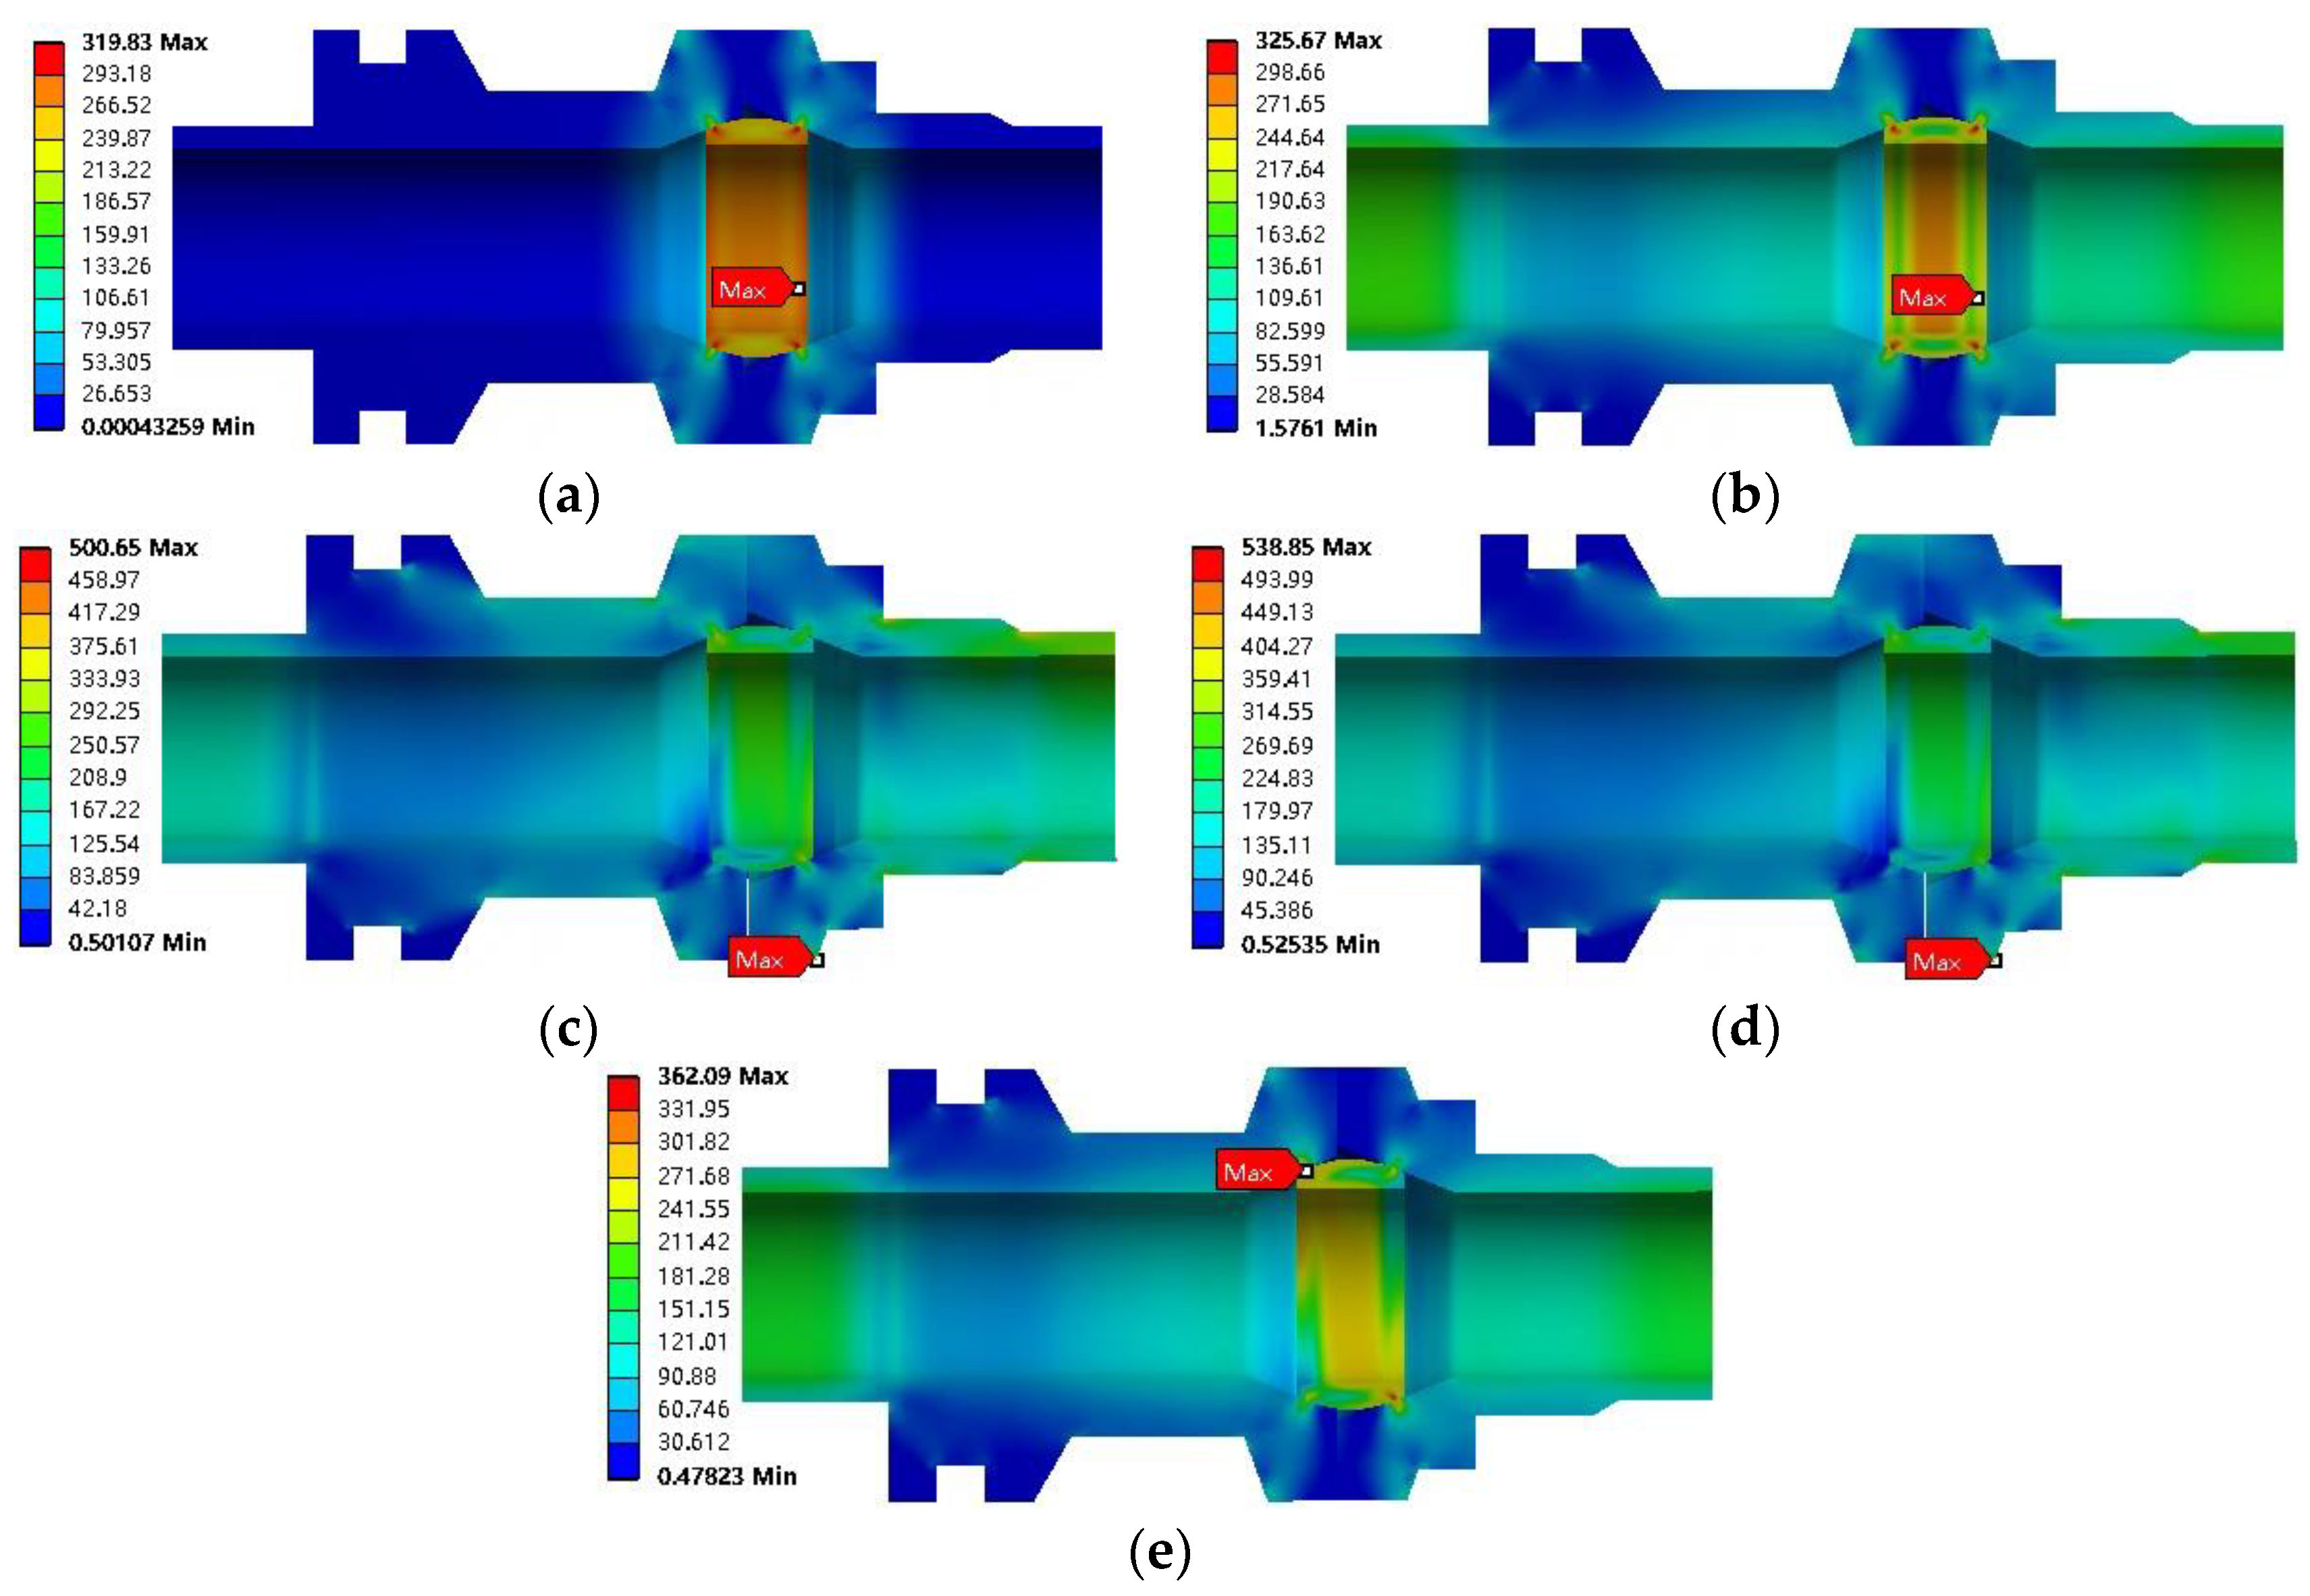
4.3.2. Mechanical Properties Analysis of the Metal Seal
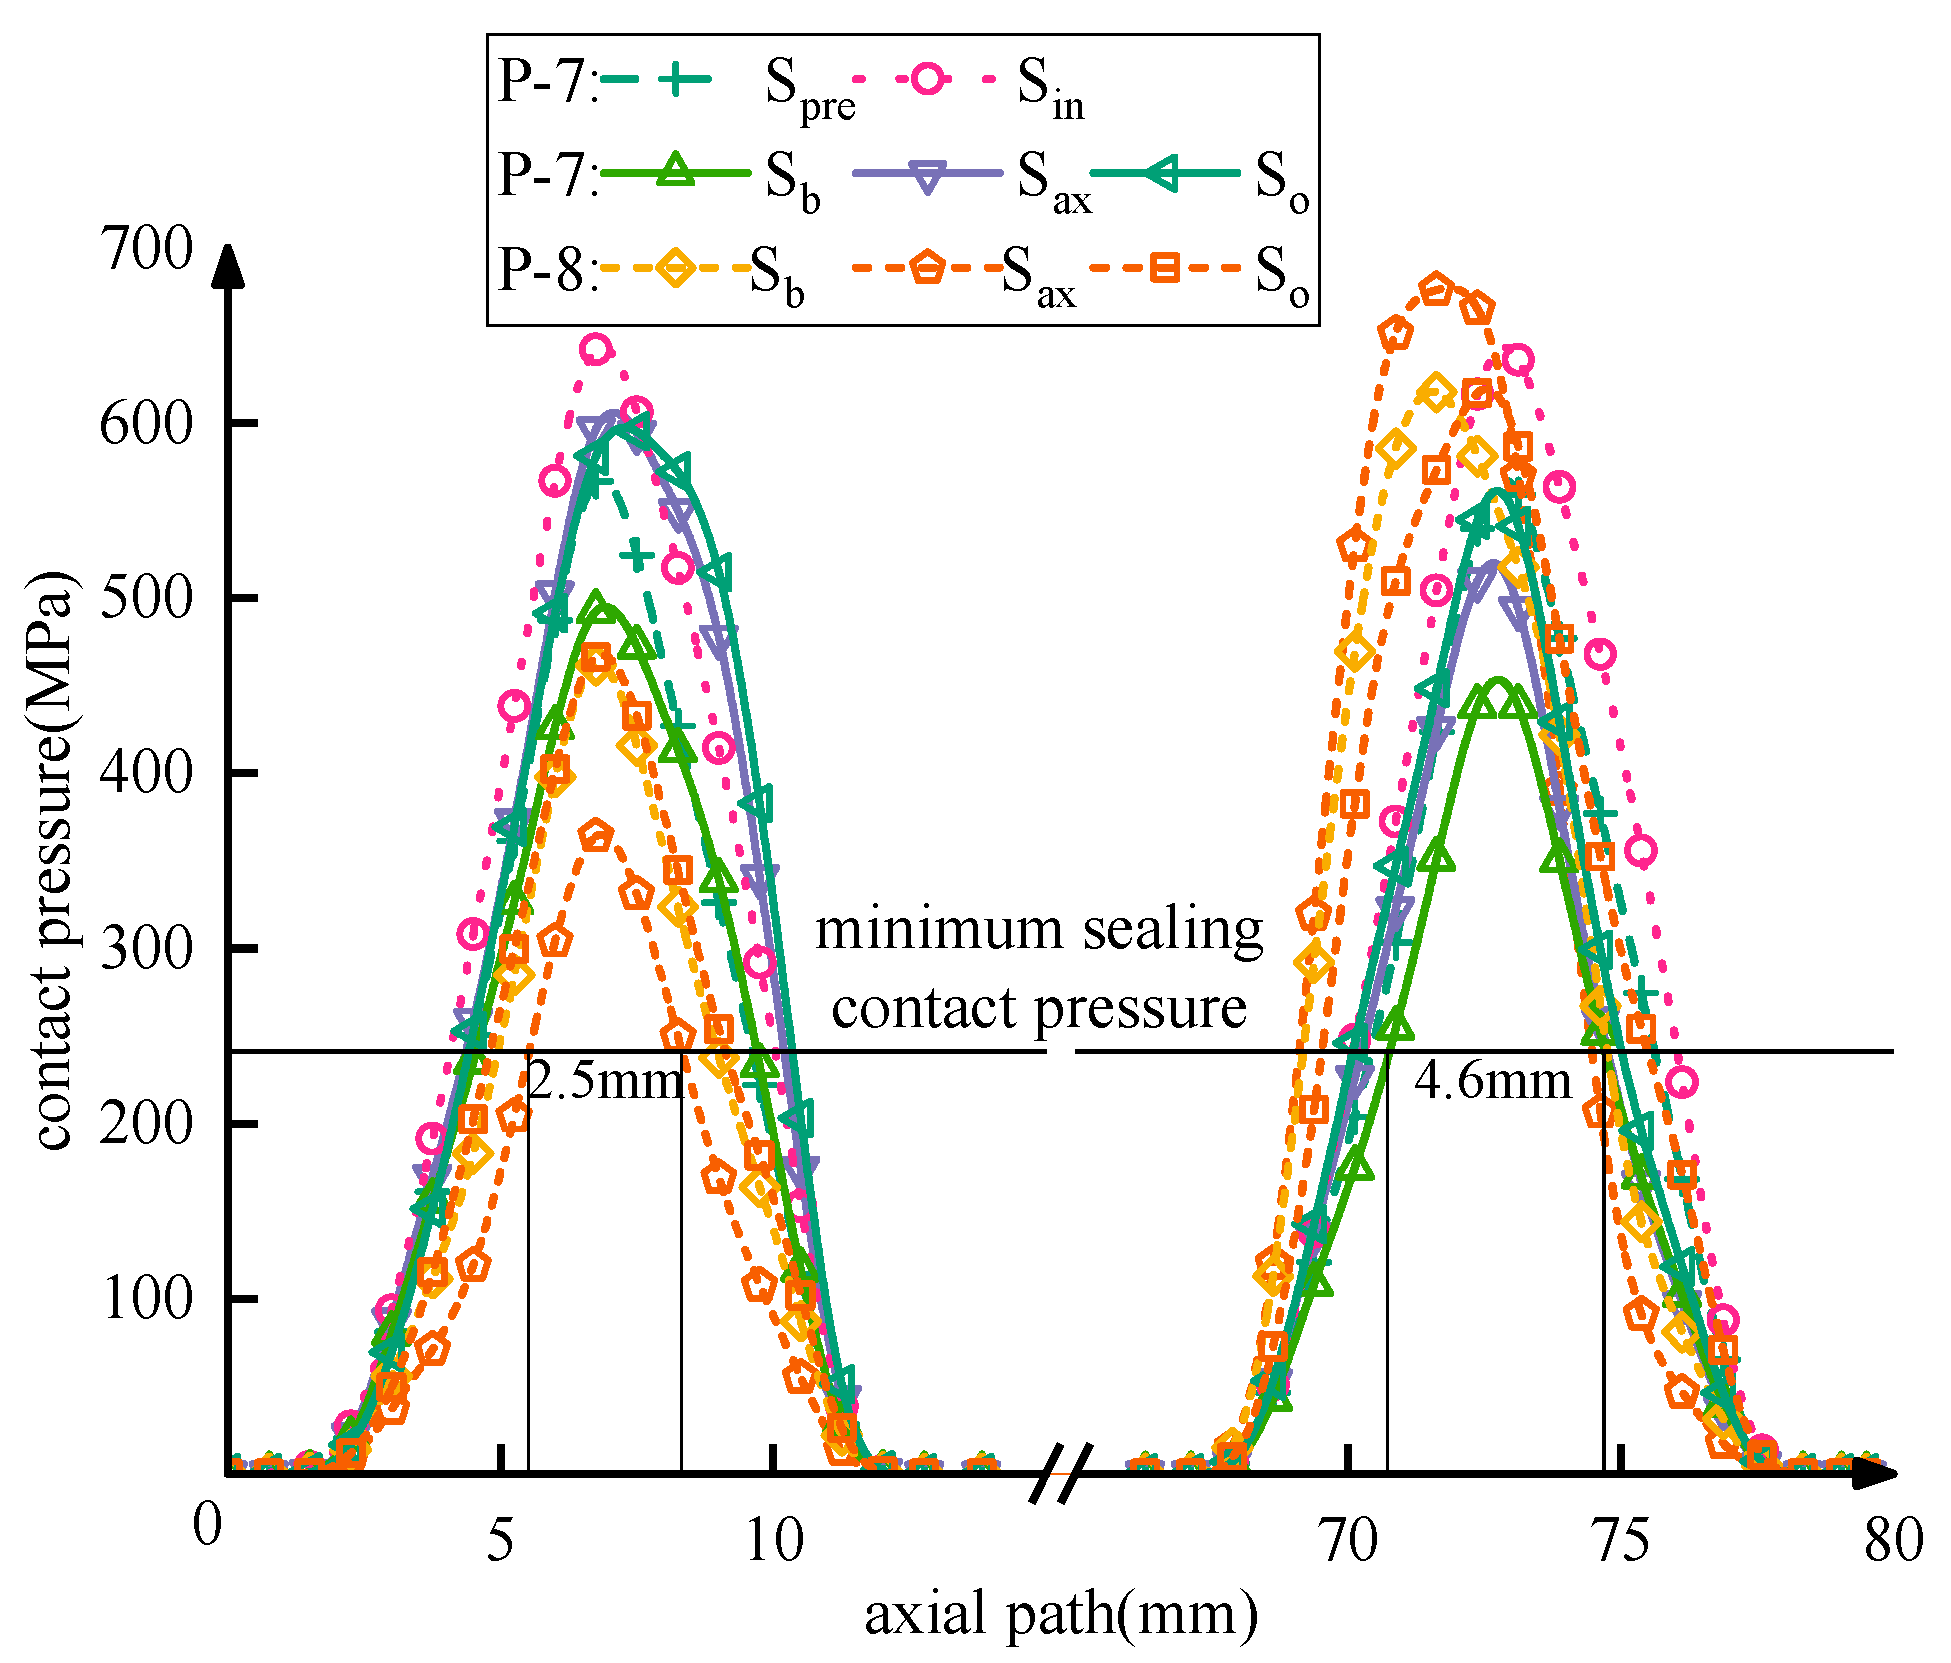
4.3.3. The Contact Properties Analysis of the Metal Seal
5. Experimental Study
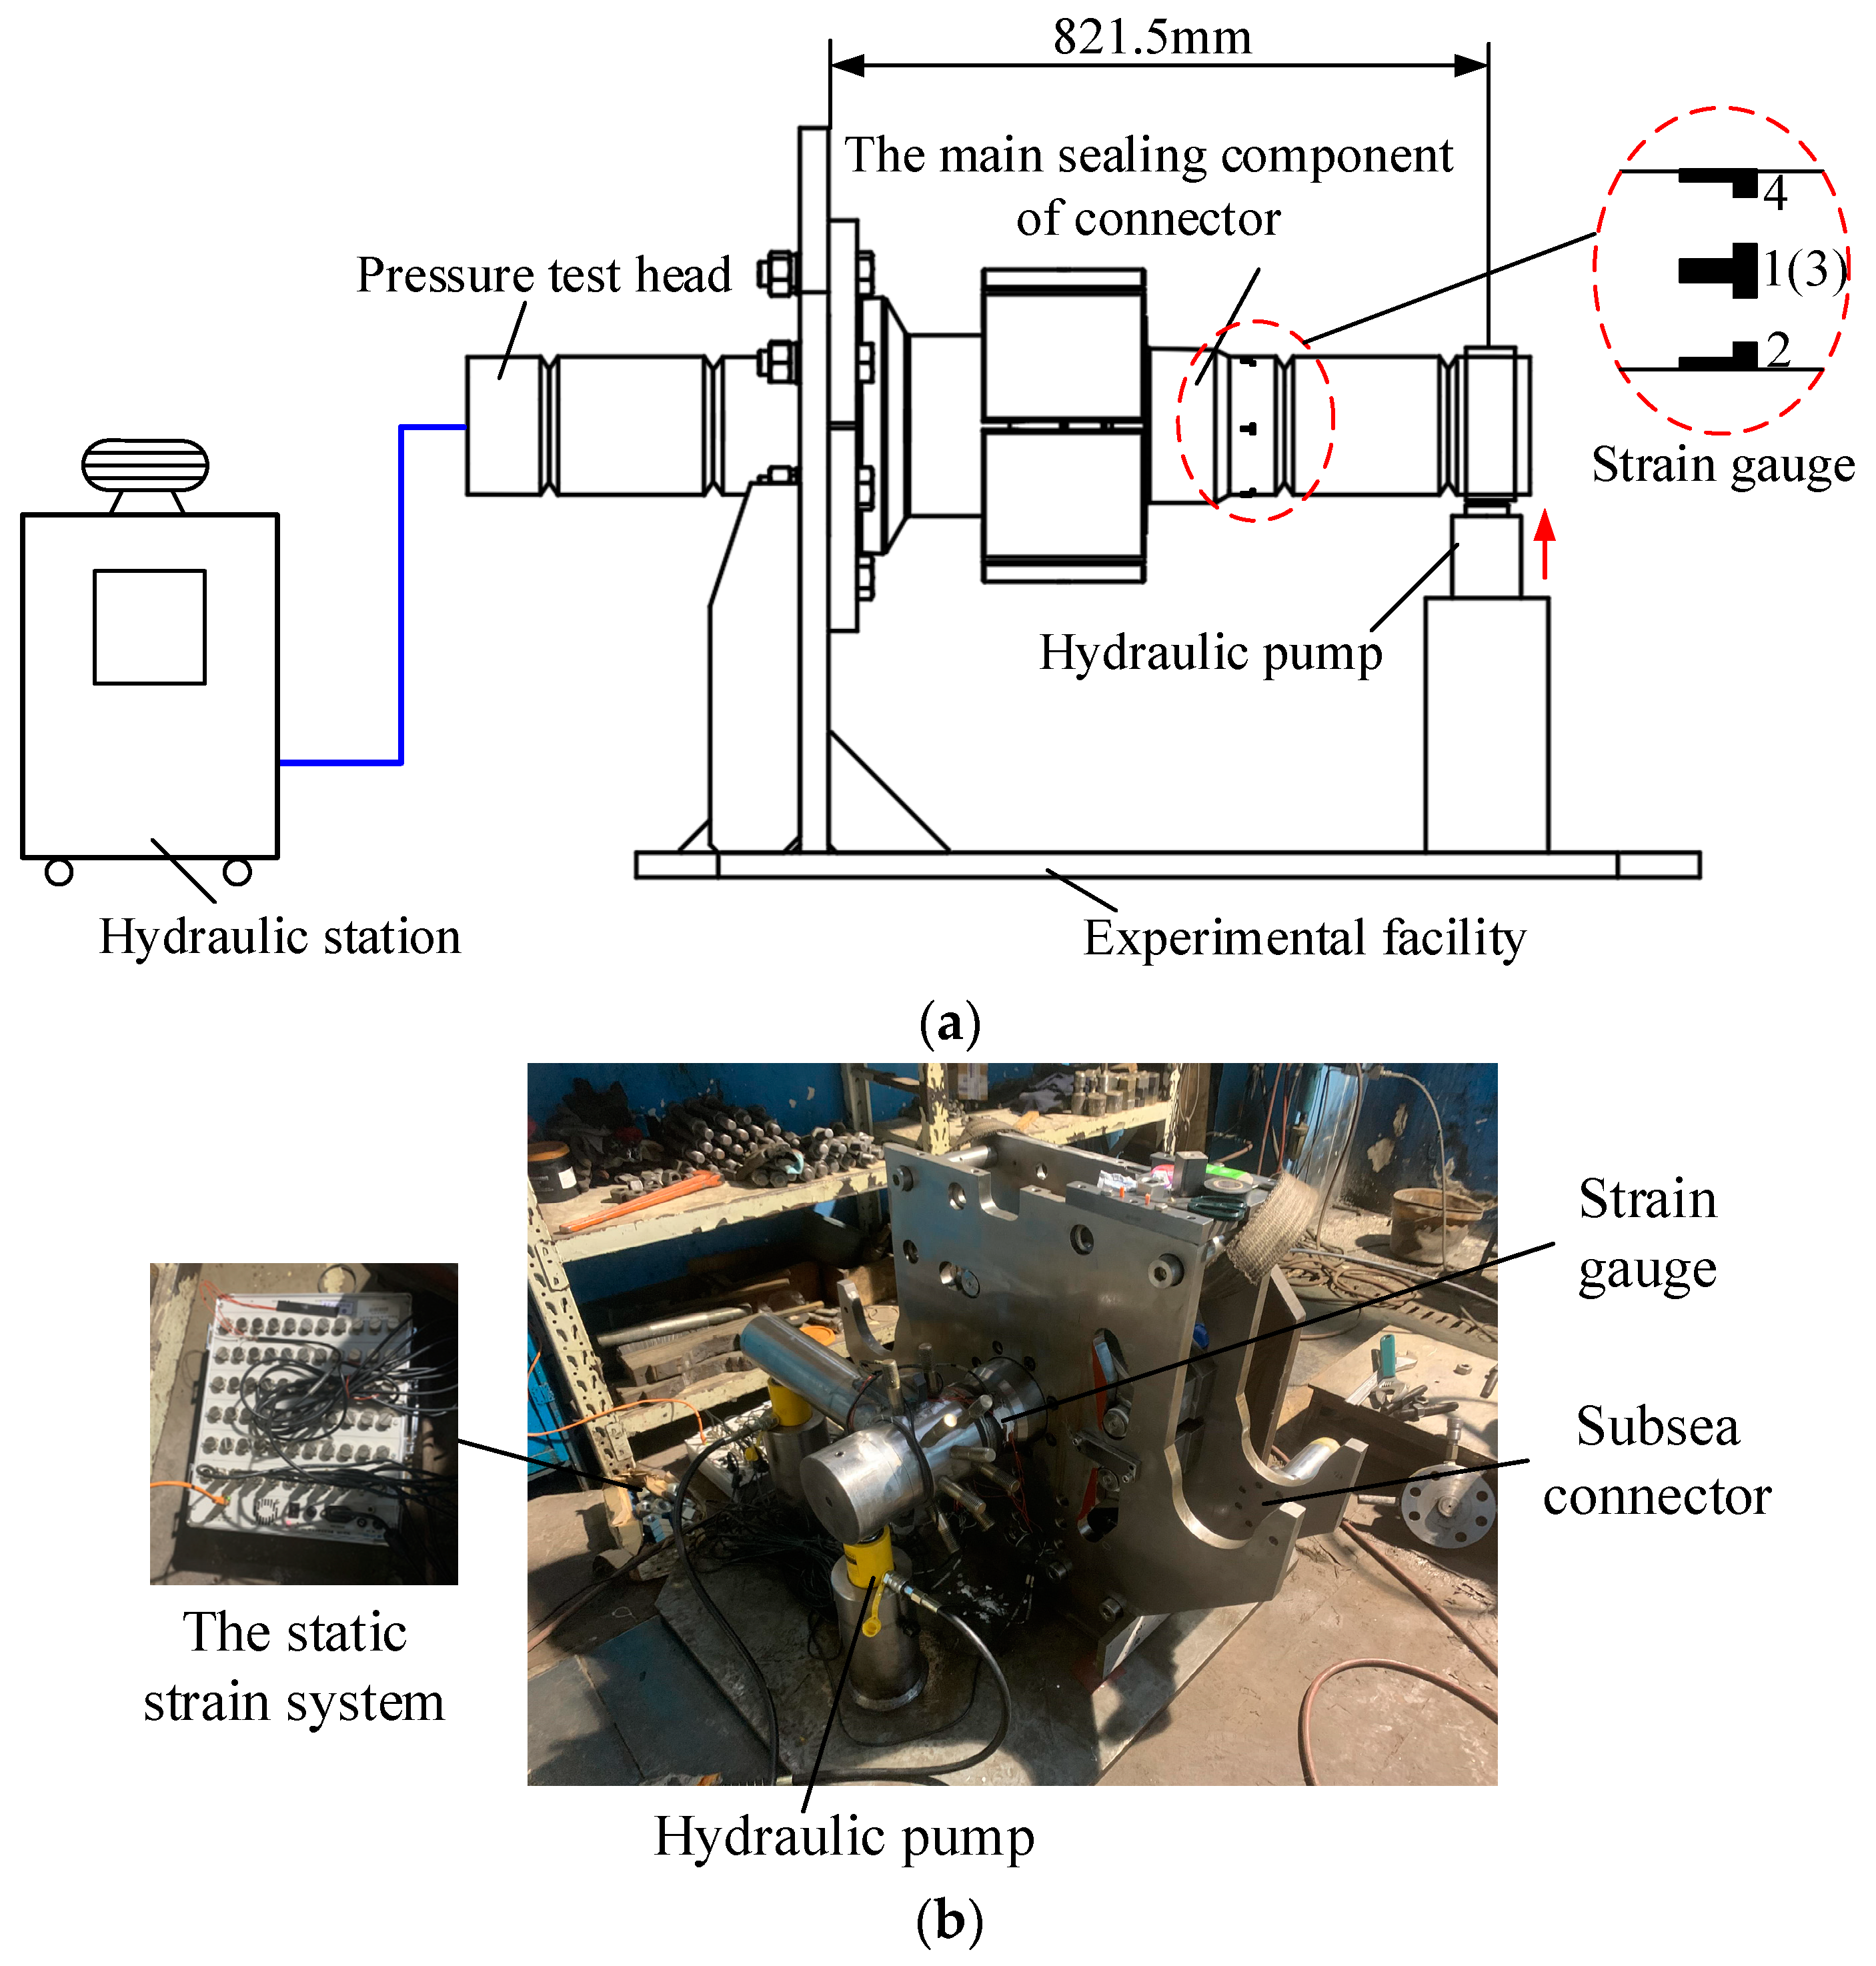
5.1. Experimental System
5.1.1. Experimental Equipment
5.1.2. Experimental Procedure
- Filling the hydraulic station with experimental water and starting the pressurization process;
- Stopping the pressurization process when the pressure sensor reached 100% of the rated working pressure (34.5 MPa), and holding the pressure for 15 min while checking for any leakage in the connector. The pressure data and strain data were recorded after the pressure-holding period;
- Applying the bending moment up to the theoretical limit (174 kNm) and holding the pressure for 15 min while checking for any leakage in the connector. The pressure data and strain data were recorded after the holding pressure was completed;
- Unloading the moment and pressure;
- Repeating the above steps (1)–(4) three times.
5.2. Discussion of Experimental Result
5.2.1. Sealing Capacity Discussion
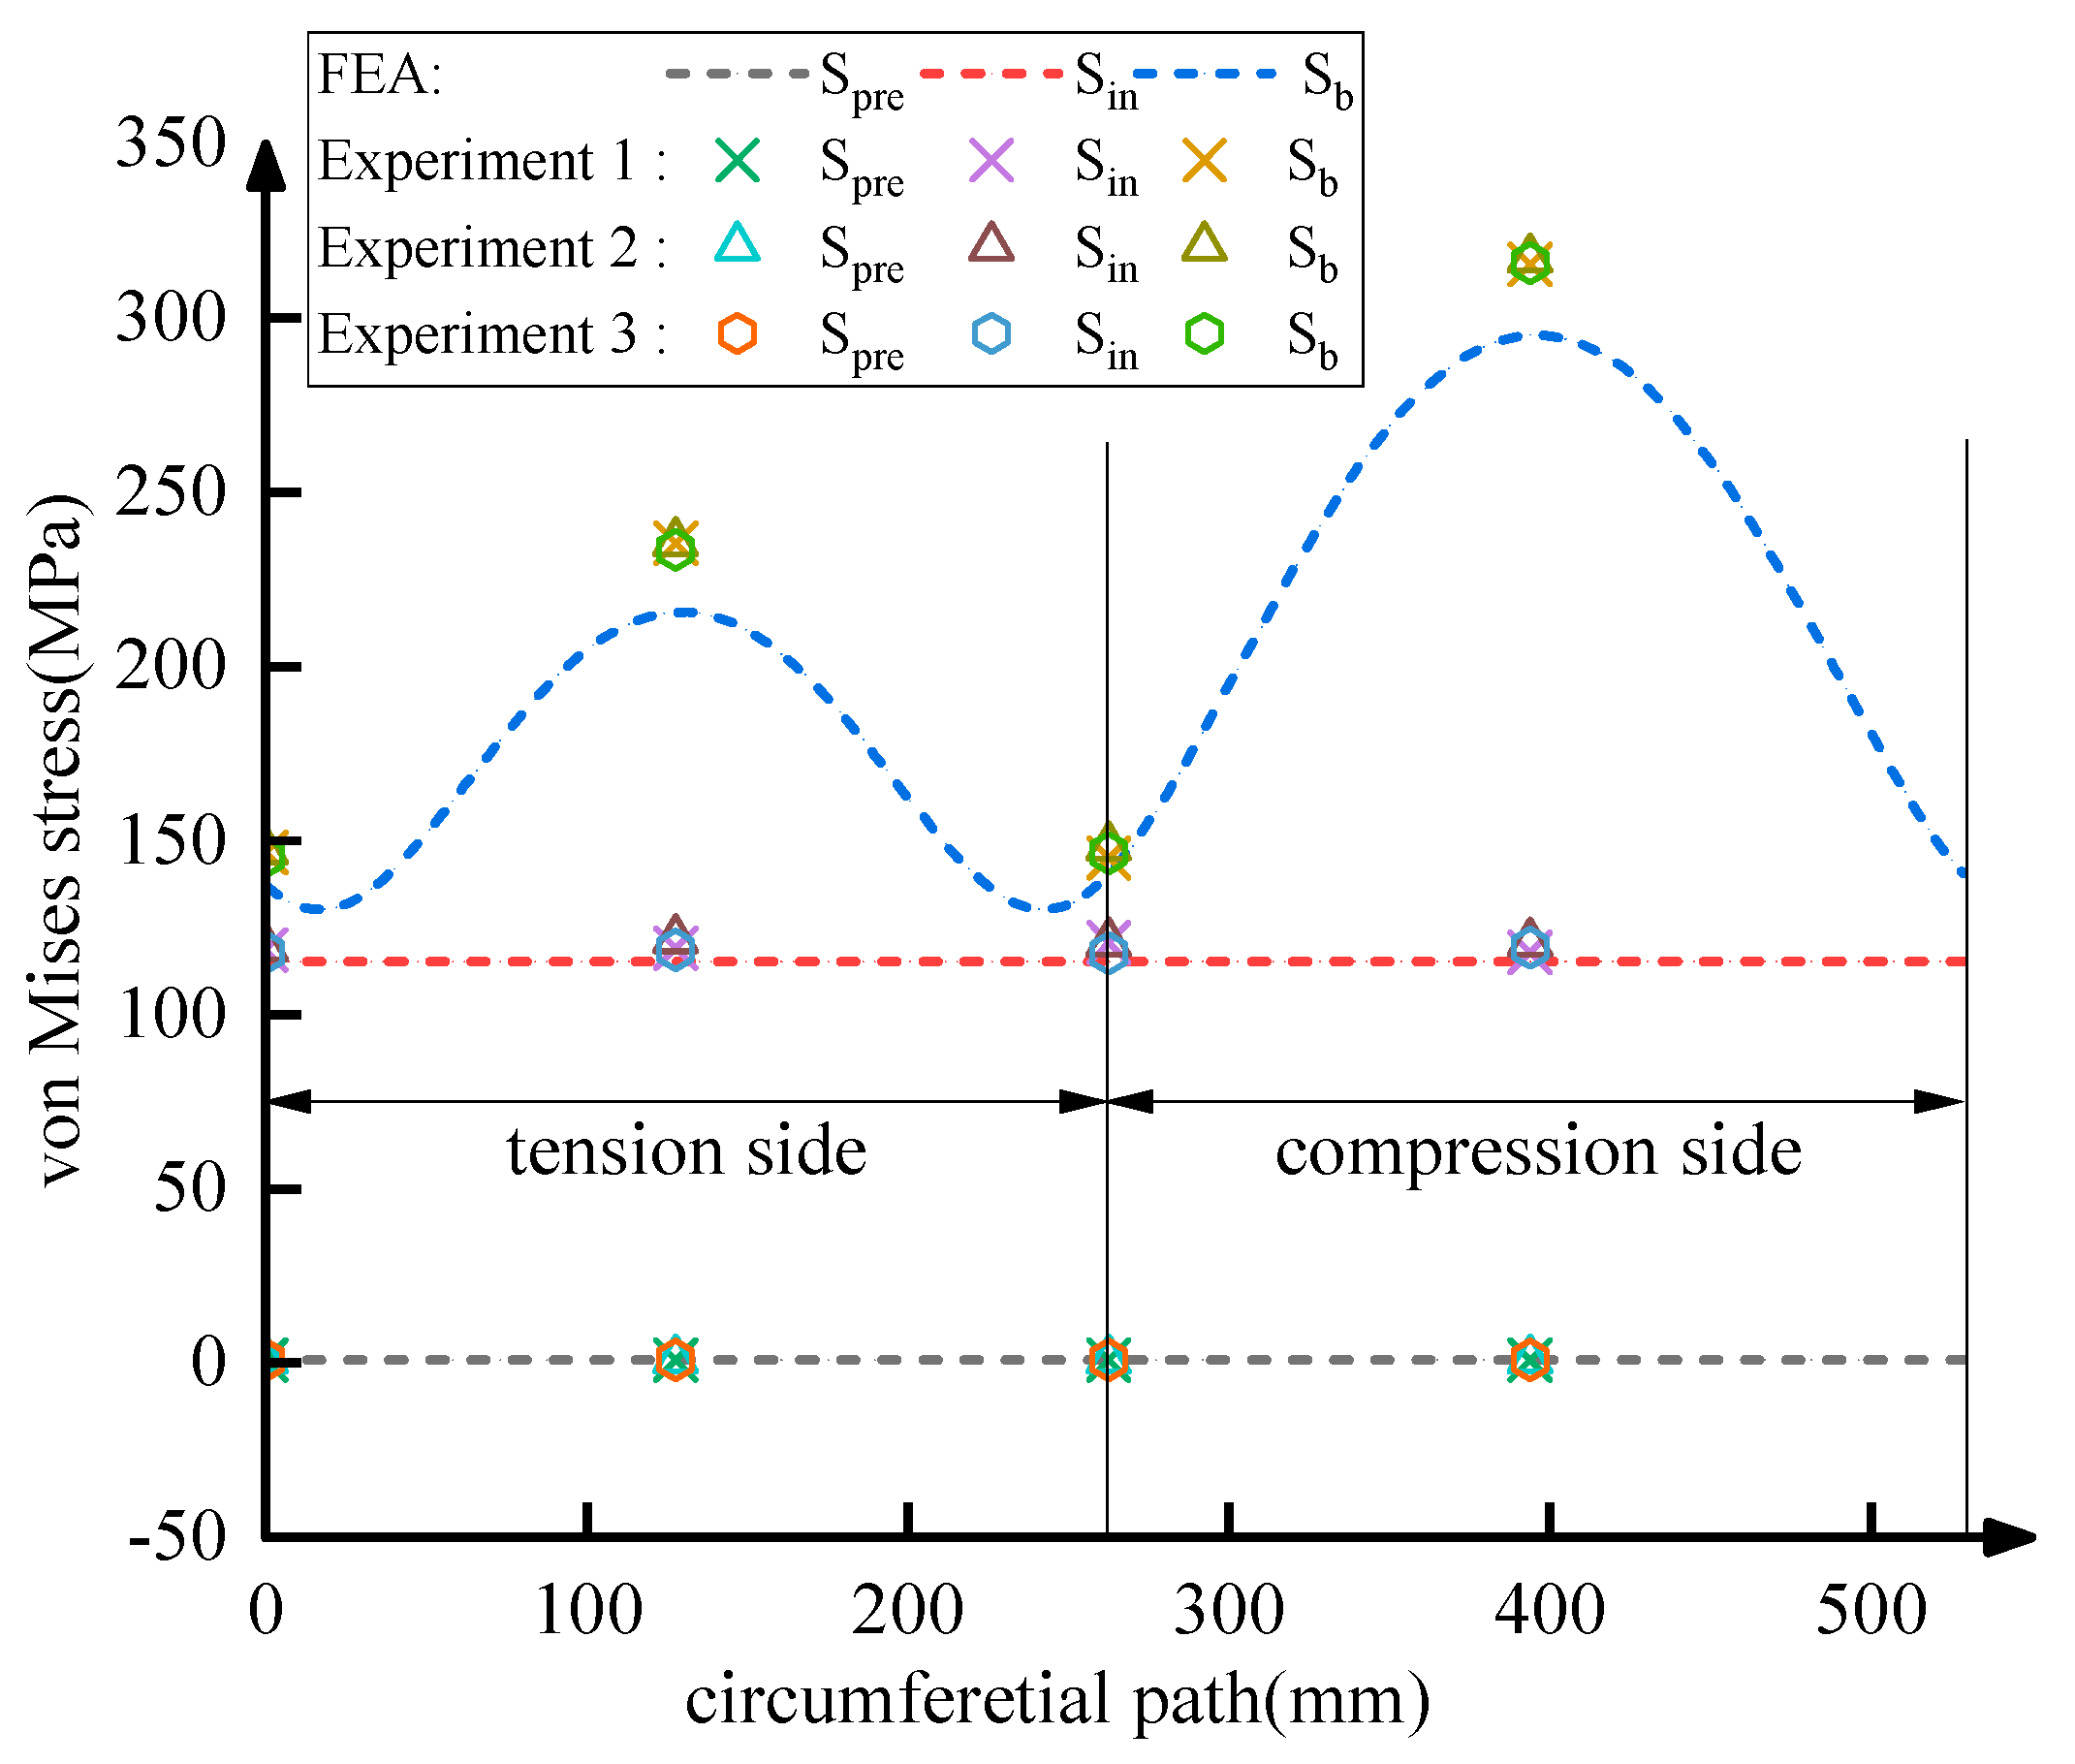
5.2.2. Strength Performance Discussion
6. Conclusions
Author Contributions
Funding
Institutional Review Board Statement
Informed Consent Statement
Data Availability Statement
Conflicts of Interest
References
- Wu, J.-H.; Zhen, X.-W.; Liu, G.; Huang, Y. Optimization design on the riser system of next generation subsea production system with the assistance of DOE and surrogate model techniques. Appl. Ocean Res. 2019, 85, 34–44. [Google Scholar] [CrossRef]
- Vedachalam, N.; Srinivasalu, S.; Ramesh, R.; Aarthi, A.; Ramadass, G.; Atmanand, M. Review and reliability modeling of maturing subsea hydrocarbon boosting systems. J. Nat. Gas Sci. Eng. 2015, 25, 284–296. [Google Scholar] [CrossRef]
- Cascales, D.H.; Militello, C. An accurate simple model to evaluate integral flange rotation. Int. J. Press. Vessels Pip. 1987, 30, 151–159. [Google Scholar] [CrossRef]
- Dekker, C.J.; Stikvoort, W.J. Improved design rules for pipe clamp connectors. Int. J. Press. Vessels Pip. 2004, 81, 141–157. [Google Scholar]
- Abid, M.; Chattha, J.A.; Khan, K.A. Finite element analysis of a gasketed flange joint under combined internal pressure and thermal transient loading. In Proceedings of the ASME Pressure Vessels and Piping Conference, San Antonio, TX, USA, 22–26 July 2007; pp. 261–267. [Google Scholar]
- Krishna, M.M.; Shunmugam, M.; Prasad, N.S. A study on the sealing performance of bolted flange joints with gaskets using finite element analysis. Int. J. Press. Vessels Pip. 2007, 84, 349–357. [Google Scholar] [CrossRef]
- Takagi, Y.; Torii, H.; Omiya, Y.; Kobayash, T.; Sawa, T. FEM Stress Analysis and the Sealing Performance Prediction of Pipe Flange Connections under External Bending Moments and Internal Pressure. J. Solid Mech. Mater. Eng. 2013, 7, 486–495. [Google Scholar] [CrossRef]
- Wang, Y.; Zong, L.; Shi, Y. Bending behavior and design model of bolted flange-plate connection. J. Constr. Steel Res. 2013, 84, 1–16. [Google Scholar] [CrossRef]
- Abid, M.; Awan, A.W.; Nash, D.H. Determination of load capacity of a non-gasketed flange joint under combined internal pressure, axial and bending loading for safe strength and sealing. J. Braz. Soc. Mech. Sci. Eng. 2014, 36, 477–490. [Google Scholar] [CrossRef]
- Peng, F.; Duan, M.; Wang, J.; Zhu, Y.; Wang, X. Optimisation method for mathematical model of deepwater collet connector locking mechanism. Ships Offshore Struct. 2015, 11, 575–590. [Google Scholar] [CrossRef]
- Nelson, N.R.; Prasad, N.S. Sealing behavior of twin gasketed flange joints. Int. J. Press. Vessels Pip. 2016, 138, 45–50. [Google Scholar]
- Yun, F.; Wang, L.; Yao, S.; Liu, J.; Liu, T.; Wang, R. Analytical and experimental study on sealing contact characteristics of subsea collet connectors. Adv. Mech. Eng. 2017, 9, 1–14. [Google Scholar] [CrossRef]
- Zhang, K.; Huang, H.; Duan, M.; Hong, Y.; Estefen, S.F. Theoretical investigation of the compression limits of sealing structures in complex load transferring between subsea connector components. J. Nat. Gas Sci. Eng. 2017, 44, 202–213. [Google Scholar] [CrossRef]
- Chen, W.; Di, Q.; Zhang, H.; Chen, F.; Wang, W. The sealing mechanism of tubing and casing premium threaded connections under complex loads. J. Pet. Sci. Eng. 2018, 171, 724–730. [Google Scholar] [CrossRef]
- Wang, L.-Q.; Wei, Z.-L.; Yao, S.-M.; Guan, Y.; Li, S.-K. Sealing Performance and Optimization of a Subsea Pipeline Mechanical Connector. Chin. J. Mech. Eng. 2018, 31, 18. [Google Scholar] [CrossRef]
- Li, Y.; Zhao, H.; Wang, D.; Xu, Y. Metal sealing mechanism and experimental study of the subsea wellhead connector. J. Braz. Soc. Mech. Sci. Eng. 2019, 42, 26. [Google Scholar]
- Liu, X.-C.; Cui, F.-Y.; Jiang, Z.-Q.; Wang, X.-Q.; Xu, L.; Shang, Z.-X.; Cui, X.-X. Tension–bend–shear capacity of bolted-flange connection for square steel tube column. Eng. Struct. 2019, 201, 109798. [Google Scholar]
- Liu, M.; Zhang, L.; Wang, L.; Liu, H.; Sun, Y.; Wang, Y. The leakage analysis of submarine pipeline connecter based on a new fractal porous media model. Desalin. Water Treat. 2020, 188, 390–399. [Google Scholar] [CrossRef]
- Duan, M.; Zhang, K.; Soares, C.G.; Paik, J.K. Theoretical investigation on hub structure design of subsea connectors. Thin-Walled Struct. 2020, 159, 107036. [Google Scholar] [CrossRef]
- Li, Y.; Su, H.; Wang, Y.; Mou, L.; Wang, Q.; Ren, Y. Research on bearing capacity and sealing contact characteristics of the subsea wellhead connector. Proc. Inst. Mech. Eng. Part M J. Eng. Marit. Environ. 2022, 237, 153–165. [Google Scholar] [CrossRef]
- Yun, F.; Liu, D.; Xu, X.; Jiao, K.; Hao, X.; Wang, L.; Yan, Z.; Jia, P.; Wang, X.; Liang, B. Thermal–Structural Coupling Analysis of Subsea Connector Sealing Contact. Appl. Sci. 2022, 12, 3194. [Google Scholar] [CrossRef]
- Zhang, K.; Cheng, H.; Liu, J.; Wang, H. Analytical calculation method for predicting contact loads and structural strength of metallic gasket of subsea connectors under thermal loads. Proc. Inst. Mech. Eng. Part M J. Eng. Marit. Environ. 2023. [Google Scholar] [CrossRef]
- Li, Y.; Su, H.; Jiang, W.; Cai, Z.; Chen, J. Sealing performance of subsea wellhead connector under thermal-structural coupling. Ocean Eng. 2023, 270, 113504. [Google Scholar] [CrossRef]
- Zhao, H.; Chen, R.; Luo, X.; Duan, M.; Lu, Y.; Fu, G.; Tian, H.; Ye, D. Metal sealing performance of subsea X-tree wellhead connector sealer. Chin. J. Mech. Eng. 2015, 28, 649–656. [Google Scholar] [CrossRef]
- Yun, F.; Wang, G.; Yan, Z.; Jia, P.; Xu, X.; Wang, L.; Sun, H.; Liu, W. Analysis of Sealing and Leakage Performance of the Subsea Collet Connector with Lens-Type Sealing Structure. J. Mar. Sci. Eng. 2020, 8, 444. [Google Scholar] [CrossRef]
- Murtagian, G.R.; Fanelli, V.; Villasante, J.A.; Johnson, D.H.; Ernst, H.A. Sealability of Stationary Metal-to-Metal Seals. J. Tribol. 2004, 126, 591–596. [Google Scholar] [CrossRef]
- Horgan, C.O. Recent Developments Concerning Saint-Venant’s Principle: An Update. Appl. Mech. Rev. 1989, 42, 295–303. [Google Scholar] [CrossRef]
- A.S. 6A; Specification for Wellhead and Tree Equipment. American Petroleum Institute: Washington, DC, USA, 2018.


| Name of Parameter | Parameter Value | Name of Parameter | Parameter Value |
|---|---|---|---|
| Lead angle | 1.27° | Clamp inclination angle | 20° |
| Equivalent friction angle | 8.83° | Sealing gasket inclination angle | 23° |
| Pitch diameter of thread | 57.402 mm | Thread friction coefficient | 0.15 |
| Clamp contact diameter | 295 mm | Friction coefficient between components | 0.15 |
| Seal contact diameter | 167 mm | Friction angle of sealing gasket | 8.53° |
| Material | Yield Strength (MPa) | Tensile Strength (MPa) | Poisson Ratio | Density (g/cm3) | Elastic Modulus (GPa) |
|---|---|---|---|---|---|
| X65 | 450 | 535 | 0.3 | 7.85 | 207 |
| Incoloy 825 | 241 | 586 | 0.275 | 8.14 | 205 |
| F22 | 552 | 689 | 0.286 | 7.85 | 211 |
| Step | Load | The Parameter Value |
|---|---|---|
| Spre | Preloading | 1799.39 Nm |
| Sin | Internal pressure | 34.5 MPa |
| Sb | Bending moment | 174 kNm |
| Sax | Axial tensile load | 212 kN |
| So | Unloading axial tension and bending load | / |
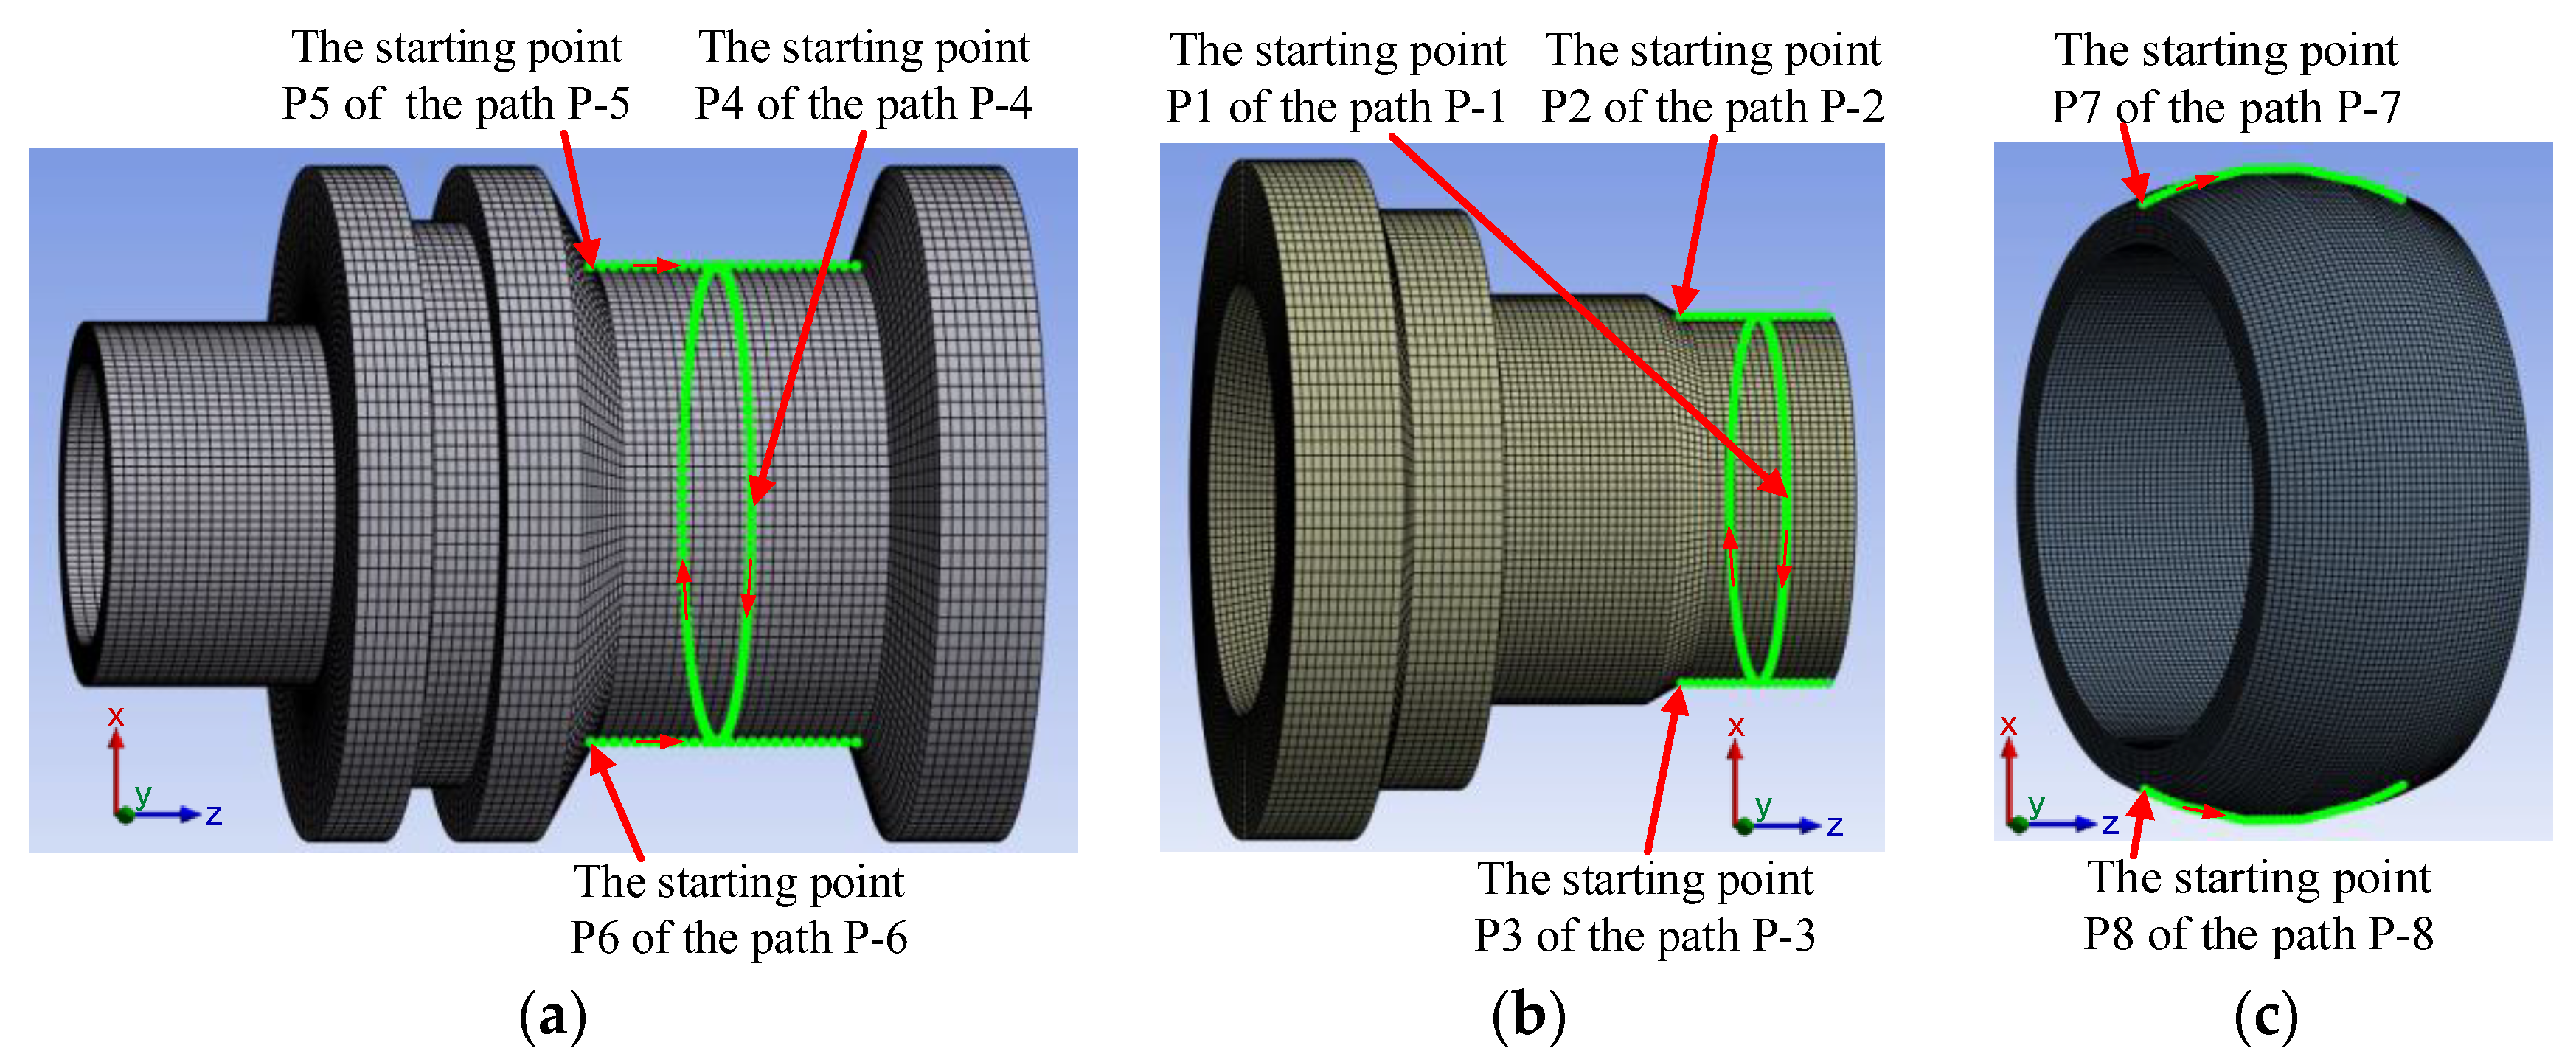
| Path Code | The Definition of Path | The Starting Point |
|---|---|---|
| P−1 | Mobile hub circulation direction | P1 |
| P−2 | Mobile hub axial side under compression | P2 |
| P−3 | Mobile hub axial side under tension | P3 |
| P−4 | Fixed hub circulation direction | P4 |
| P−5 | Fixed hub axial side under compression | P5 |
| P−6 | Fixed hub axial side under tension | P6 |
| P−7 | Connector compression side sealing gasket contact surface | P7 (Near the fixed hub) |
| P−8 | Connector tension side sealing gasket contact surface | P8 (Near the fixed hub) |
| Work Condition | Spre | Sin | Sb (P−7) | Sb (P−8) | Sax (P−7) | Sax (P−8) | So (P−7) | So (P−8) |
|---|---|---|---|---|---|---|---|---|
| average contact pressure (close to the fixed hub, MPa) | 340.17 | 407.70 | 318.08 | 262.75 | 395.16 | 240.25 | 401.23 | 268.35 |
| average contact pressure (close to the mobile hub, MPa) | 340.17 | 407.70 | 260.08 | 417.55 | 297.02 | 409.53 | 310.74 | 421.64 |
| seal band width (close to the fixed hub, mm) | 5.1 | 5.8 | 5.0 | 4.0 | 5.7 | 2.7 | 5.7 | 4.2 |
| seal band width (close to the mobile hub, mm) | 5.1 | 5.8 | 3.8 | 5.4 | 3.5 | 5.3 | 3.7 | 4.9 |
| Number of Experiments | Working Condition | Pressure before Pressure-Holding (MPa) | Pressure after Pressure-Holding (MPa) | Decreasing Pressure (MPa) | Pressure Variation (%) |
|---|---|---|---|---|---|
| 1 | Sin | 35.0 | 35.0 | 0 | 0 |
| Sb | 34.8 | 0.2 | 0.57 | ||
| 2 | Sin | 35.0 | 34.8 | 0.2 | 0.57 |
| Sb | 34.8 | 0.2 | 0.57 | ||
| 3 | Sin | 34.9 | 35.0 | 0 | 0 |
| Sb | 34.9 | 0.1 | 0.29 |
| Number of Experiments | Working Condition | Strain Gauge Position | Experimental Stress (MPa) | Finite Element Analysis Stress (MPa) | Error (%) |
|---|---|---|---|---|---|
| 1 | Spre | 1 | 0.90 | 0.91 | 1 |
| 2 | 0.90 | 1 | |||
| 3 | 0.91 | 0 | |||
| 4 | 0.91 | 0 | |||
| Sin | 1 | 118.69 | 115.30 | 2.5 | |
| 2 | 119.16 | 3.3 | |||
| 3 | 120.71 | 4.6 | |||
| 4 | 117.94 | 2.3 | |||
| Sb | 1 | 146.57 | 139.09 | 5.4 | |
| 2 | 235.38 | 221.24 | 6.4 | ||
| 3 | 145.01 | 139.09 | 4.3 | ||
| 4 | 315.33 | 297.28 | 6.1 | ||
| 2 | Spre | 1 | 0.91 | 0.91 | 0 |
| 2 | 0.91 | 0 | |||
| 3 | 0.91 | 0 | |||
| 4 | 0.92 | 1 | |||
| Sin | 1 | 119.24 | 115.30 | 3.4 | |
| 2 | 121.53 | 5.4 | |||
| 3 | 120.60 | 4.6 | |||
| 4 | 120.49 | 4.5 | |||
| Sb | 1 | 147.04 | 139.09 | 5.7 | |
| 2 | 235.50 | 221.24 | 6.4 | ||
| 3 | 148.11 | 139.09 | 6.4 | ||
| 4 | 317.03 | 297.28 | 6.6 | ||
| 3 | Spre | 1 | 0.90 | 0.91 | 1 |
| 2 | 0.91 | 0 | |||
| 3 | 090 | 1 | |||
| 4 | 0.92 | 0 | |||
| Sin | 1 | 117.98 | 115.30 | 2.3 | |
| 2 | 118.63 | 2.6 | |||
| 3 | 117.64 | 2.1 | |||
| 4 | 119.28 | 3.5 | |||
| Sb | 1 | 145.38 | 139.09 | 4.5 | |
| 2 | 233.56 | 221.24 | 5.6 | ||
| 3 | 146.46 | 139.09 | 5.3 | ||
| 4 | 315.89 | 297.28 | 6.3 |
Disclaimer/Publisher’s Note: The statements, opinions and data contained in all publications are solely those of the individual author(s) and contributor(s) and not of MDPI and/or the editor(s). MDPI and/or the editor(s) disclaim responsibility for any injury to people or property resulting from any ideas, methods, instructions or products referred to in the content. |
© 2023 by the authors. Licensee MDPI, Basel, Switzerland. This article is an open access article distributed under the terms and conditions of the Creative Commons Attribution (CC BY) license (https://creativecommons.org/licenses/by/4.0/).
Share and Cite
Hao, X.; Yun, F.; Jiao, K.; Chen, X.; Jia, P.; Wang, X.; Wang, L. Mechanical Behavior and Sealing Performance Study of Subsea Connector Core-Sealing Components under the Combined Action of Internal Pressure, Bending Moment, and Axial Load. J. Mar. Sci. Eng. 2023, 11, 1691. https://doi.org/10.3390/jmse11091691
Hao X, Yun F, Jiao K, Chen X, Jia P, Wang X, Wang L. Mechanical Behavior and Sealing Performance Study of Subsea Connector Core-Sealing Components under the Combined Action of Internal Pressure, Bending Moment, and Axial Load. Journal of Marine Science and Engineering. 2023; 11(9):1691. https://doi.org/10.3390/jmse11091691
Chicago/Turabian StyleHao, Xiaoquan, Feihong Yun, Kefeng Jiao, Xi Chen, Peng Jia, Xiangyu Wang, and Liquan Wang. 2023. "Mechanical Behavior and Sealing Performance Study of Subsea Connector Core-Sealing Components under the Combined Action of Internal Pressure, Bending Moment, and Axial Load" Journal of Marine Science and Engineering 11, no. 9: 1691. https://doi.org/10.3390/jmse11091691