Article

Evaluating the Service Capacity of Port-Centric Intermodal Transshipment Hub

1
School of Transportation and Logistics Engineering, Wuhan University of Technology, Wuhan 430063, China
2
State Key Laboratory of Maritime Technology and Safety, Wuhan University of Technology, Wuhan 430063, China
*
Author to whom correspondence should be addressed.
J. Mar. Sci. Eng. 2023, 11(7), 1403; https://doi.org/10.3390/jmse11071403
Submission received: 12 June 2023 / Revised: 6 July 2023 / Accepted: 7 July 2023 / Published: 12 July 2023
(This article belongs to the Special Issue Port Management and Maritime Logistics)

Abstract

:
Port-centric intermodal transshipment hubs are significant nodes in the global freight network and are likewise the gateway to a country’s external communications. It is vital to increase the service capacity of PCITHs, and it is necessary to assess the service capacity of port-centric intermodal transshipment hubs to respond to the growth of economies and global freight needs. This study provides a detailed definition of port-centric intermodal transshipment hubs through a review of relevant kinds of works from the literature and analyzes their primary functions. Based on the research perspective of sea–rail intermodal transportation, the three evaluation dimensions of service capacity of port-centric intermodal transshipment hubs are divided into radiation scale capacity, transportation connection capacity, and resource integration capacity, focusing on the functions of cargo aggregation, cargo transfer, and connection of different transportation modes. The service capacity evaluation indicators were then selected based on the three dimensions. The subjective and objective weightings were calculated by the G1 weighting method and the modified CRITIC method, and the combination weightings were determined based on game theory. The service capability of port-centric intermodal transshipment hubs was evaluated by the fuzzy matter element method, and the evaluation results were quantified by the Euclidean closeness degree. Finally, through the barrier degree model, the current indicators of PCITHs that urgently need improvement were explored, and targeted improvement suggestions are proposed in this paper. The results show that Tianjin Port has the highest service capacity, followed by Ningbo Zhoushan Port. The port rail dedicated line mileage is the most critical area that needs attention in Ningbo Zhoushan Port and Qingdao Port. Tianjin Port needs to improve the container sea–rail transportation volume, while Guangzhou Port and Xiamen Port need to improve the sea–rail container handling capacity.

1. Introduction

Port-centric intermodal transshipment hubs (PCITHs) are used to realize cargo transit through the smooth connection and convenient exchange between multiple modes of transportation, and the core of its operation is the port. The primary purpose is to promote the intermodal transportation of goods, improve transportation efficiency, and reduce logistics costs. PCITHs are critical nodes in intermodal transportation networks, with various functions such as cargo aggregation, transshipment, and distribution. They can aggregate and integrate inland cargo through domestic logistics networks and transport cargo to overseas destinations through international logistics networks. Intermodal transportation is a type of modern international freight transit that combines two or more modes of transportation to transfer goods, with containers used to provide a seamless connection between multiple forms of transportation. Intermodal transportation provides tremendous benefits in terms of enhancing transportation efficiency, boosting transportation benefits, and lowering transportation costs, and it has become a pillar of the global commerce chain [1,2]. Sea–rail intermodal transportation is one of the intermodal transportation modes and is an integral part of the intermodal transportation system. As long-distance cargo transportation, especially for bulk products, has been regarded as the most crucial measure to achieve sustainable transportation, sea–rail intermodal transportation is the trend of international cargo transportation now and in the future [3]. Intermodal transportation provides a high degree of flexibility, broad coverage, and competitive low-cost alternatives for the efficient and convenient movement of goods. The development of intermodal transportation decreases the negative impact of a single mode of transportation by replacing it with a less resource-consuming mode, resulting in economic and environmental benefits [4,5]. Sea–rail intermodal transportation is a mode of transportation in which goods are transported to coastal ports and wharves by rail and then transported to the destination port by ship, or goods are transported to coastal ports and wharves by ship and then transported to the final destination by rail. It only needs “one declaration, one inspection, one release” to complete the whole transportation process. Although rail–sea intermodal transportation is inferior in regard to the cargo consolidation time, because of its enormous transportation capacity, great operating efficiency, minimal emissions, and low cost, it has gained popularity around the world [6,7]. The port connects waterways and railroads, acting as the infrastructure for sea–rail intermodal transportation, which brings together various modes of transportation and facilitates the exchange of goods. The port is the link between port operations and landside operations, where port operations are the loading and unloading of goods, and landside operations are the loading and unloading of goods to other modes of transportation [8]. Ports serve as the starting point, transit station, and end point of marine networks, and they are an essential component of transportation networks and economic systems, particularly in international transportation networks. Ports are standard intermodal hubs that dominate the worldwide intermodal wave [9,10]. PCITHs are comprehensive transportation hubs with ports as the core, integrating different modes of transportation, such as sea, land, and air. Sea–rail intermodal transportation is their primary mode of intermodal transportation [11]. PCITHs provide a goods platform for interaction between different countries and help export-oriented nations in the area expand their market influence. Furthermore, as a virtual platform and carrier for the development of sea–rail intermodal transportation, PCITHs realize the organization and transformation of commodities across multiple modes of transportation. They are the basic for the operation of the sea–rail intermodal transportation system [8,12,13]. China’s overseas trade is growing at an alarming rate, and port throughput is increasing yearly; since 2003, China’s port container throughput has been the first in the world, accounting for more than 40% of global port container throughput [14]. The Port of Los Angeles and the Port of Hamburg sea–rail intermodal transportation accounted for as much as 35% and 30.4% of the top 20 international ports’ 2020 worldwide container throughput rankings, respectively, while China Qingdao Port’s sea–rail transportation share is at most 7.8%, which is far lower than other international ports. China has 27 major coastal ports, 20 of which have carried out container sea–rail operations, and in 2020 China’s container sea–rail transportation volume reached 6.87 million TEU. However, the ratio of container sea–rail transportation volume is only 2.6%, which is far below 20–40% in industrialized countries, as shown in Figure 1 [15,16]. Although China’s sea–rail intermodal transportation has much room for development, several issues, including limited railroad capacity, poor information integration, and coordination challenges, have hampered its growth and contributed to its poor performance. It is clear from Figure 1 that China’s share of the sea–rail transportation volume is low, and its development rate is also relatively slow. In this case, it will impact the rate at which cargo is turned over and the capacity of ports for consolidation, as well as cause considerable air pollution, a heavier burden on the transportation system at the port location, and other adverse effects. As a result, it is essential to assess and examine the service capacity of PCITHs in China. Container trade expansion in most nations has increased the demands on port logistics handling efficiency, and intermodal hub ports can handle increasing volumes of containers more effectively and conveniently by connecting to road and rail networks [17]. The development of intermodal nodes, particularly sea–rail intermodal hubs, is highly appreciated as a means of integrating and connecting numerous modes of transportation; moreover, the existing PCITHs have varying service capacities and need evaluation criteria to guide future development planning. The service capacity of PCITHs, as a necessary form of hub for future expansion, is critical to the entire development of intermodal transportation.
Based on the preceding analysis, this study intends to address the three concerns listed below in order to achieve two goals: The first is to identify a set of service capability evaluation indicator systems based on the critical functions of PCITHs; the second is to develop a combined service capability assessment method to provide a decision basis for the research subject’s future development in terms of both PCITHs service capability and the urgency of improving the indicators.
  • What are PCITHs, and what are their distinguishing features?
  • How about dividing the service capability evaluation dimensions and establishing an evaluation indicator system?
  • How do we identify urgent areas for improvement in the current service capabilities of PCITHs?
In order to solve the above problems, this paper first defines PCITHs. It summarizes the distinctive features of PCITHs by summarizing the previous research literature and consulting experts in conjunction with the operational processes of PCITHs. Since PCITHs are a complex multilayered system with many influencing factors, it will involve multiple parties in the operation. In order to evaluate the service capability of PCITHs more accurately, this paper takes sea–rail intermodal transportation as the study’s starting point. Specifically, PCITHs are distinguished by their broader transportation radius, cargo distribution capacity, resource integration capacity, more efficient transportation mode connection, and collaboration with the hinterland and other ports in the transportation network than standard ports. At the same time, to scientifically determine the weights of evaluation indicators, we propose a combination of subjective and objective weighting methods and determine the weights of the two different weighting methods based on the game theory method to make the weights of evaluation indicators more scientific and reasonable. Moreover, we choose the fuzzy matter element analysis method based on the Euclidean closeness degree to calculate and rank the service capacity of different evaluation objects, which can effectively deal with the challenge of the existence of fuzziness of evaluation indexes. Finally, we use the barrier degree model to measure the barrier factors of each evaluation object, which can help decision-makers to understand more clearly and intuitively the current indicators that need urgent improvement and provide decision-makers with a basis for decision-making. This paper provides a reference for future service capacity evaluation studies, thus filling the research gap in the service capacity evaluation of PCITHs.
This paper is organized as follows. Section 2 summarizes the essential literature to define the PCITHs and analyze the current state of service evaluation in the transportation industry. Furthermore, the current ways of service-related evaluation in the transportation sector are examined, and the benefits and drawbacks of each method are shown in the form of graphs and charts before the research method for this study is chosen. Section 3 describes the model’s application steps in this study. Section 4 describes the functional features of PCITHs and explains the service capacity in this context and the dimensions that delineate the service capacity in this context. The evaluation indicator system is discussed through the dimensions of service delineation, and the methods used in this paper’s study are described in detail. Section 5 discusses and analyzes the paper’s findings. Finally, the paper summarizes the shortcomings of the study and suggests improvement directions for future research.

2. Literature Review

The three core aspects of the evaluation study are clarifying the evaluation object, establishing a reasonable evaluation indicator system, and selecting a suitable evaluation method. In this section, we first review the previous research on PCITHs to understand more clearly the connotation and characteristics of PCITHs and to provide references for in-depth analyses of the primary functions. The following subsection introduces the service capability evaluation indicators in the transportation field, providing a reference for selecting the proper indicators. After that, standard analysis methods are reviewed to facilitate the selection of suitable evaluation methods for the evaluation objects. Finally, based on summarizing the current research results, this paper’s research ideas and methods are sorted out.

2.1. Port-Centric Intermodal Transshipment Hubs

A detailed definition of PCITHs is required to understand their service capacity better. Before proceeding, it is necessary to review the research on intermodal transportation and transshipment hubs. Sea–rail intermodal transportation has comprehensive coverage and various business processes, and it needs each relevant regional department’s coordinates and cooperation to complete such processes. The primary operation mode of sea–rail intermodal transportation is that the railroad is responsible for inland transportation, and the ship is responsible for sea transportation to cooperate and divide the work between the railroad network and port and form a perfect integrated water and railroad cargo transportation mode. Sea–rail intermodal transportation is not a simple combination of transportation modes; it is essential to realize the synchronization of planning and scheduling between sea transportation and railroad transportation and the seamless connection of the whole transportation chain, and the conversion operation between different transportation modes is essential to realize this seamless connection. Sea–rail intermodal transportation covers a wide area and has various business processes, requiring the coordination and cooperation of relevant regional departments to complete [18]. A higher level of service, information and communication technologies are needed to connect transportation modes and consolidate commodities for shipping. Due to issues with the entry and exit of goods, which need to be unloaded and to have paperwork prepared before continuing transit by another mode of transportation, cargo at the port may be interrupted briefly. Sea–rail intermodal transportation is to cope with these difficulties. Sea–rail intermodal transportation between different modes of transportation requires organization and effective interaction through the comprehensive specification and coordination of operations to achieve “one declaration, one inspection, one release” for the goods; this interaction needs the efficient integration of resources and information technology systems to achieve the support [19]. In transportation and logistics, hubs are often introduced in various forms, mainly important locations with storage functions, transportation organization functions, and coordination of operations, such as freight terminals, distribution centers, logistics centers, and intermodal terminals [20]. A transshipment hub is a centralized facility for aggregating, consolidating, transshipping, and distributing traffic between transportation nodes and where transportation modes can be changed. The direct interaction point of sea–rail intermodal transportation is the port, where all transportation modes are connected and merged, and the efficiency of the transportation mode connection directly affects the efficiency of the interaction point and the progress of the transportation [19,21,22]. Although some study material refers explicitly to the sea–rail terminal as a transshipment hub for sea–rail intermodal transportation, one or more terminals cannot act as a hub alone [23,24]. The transshipment hubs that perform sea–rail intermodal transportation focus on complex tasks such scale economies of transportation activities, attaining optimal resource allocation, coordination, and organization in addition to transshipment and integration [25,26]. According to Mokhtar et al. [27], hubs are centralized facilities for gathering and dispersing goods between nodes and processing items to switch transit modes. Through the use of many modes of transportation and economies of scale, hubs lower the operational and running costs of transportation networks. Rodrigue and Ashar [28] proposed that transshipment hubs are perhaps the most critical component of a container transport network. Transshipment enables traffic consolidation and associated economies of scale in ship size, rationalizes shipping routes and adjusts ship capacity to traffic density, and expands the number of ports covered by the shipping network. They also believed that ports that perform this transshipment function while also serving inland areas are the ones that will be used as hubs. In order to assess the effectiveness of hubs and the dynamic evolution of port hub status, Low et al. [29] used the network cooperation index and connectivity index. They proposed that ports with a high connectivity index should be classified as global hub ports, while ports with a low connectivity index but high cooperation index should be classified as regional hub ports with the potential to become global hub ports. Yang and Chen [30] concluded that hub ports are strategically located at the intersection of significant trunk and feeder system ports in locations with logistics parks or free trade zones in the port hinterland, providing integrated logistics services, export, and transit cargo operations, in addition to conventional imports, by examining global hub port assessment criteria in the different literature and analyzing their influencing factors. Angelini et al. [31] proposed seamless transportation as a critical factor for intermodal hubs in a study conducted to optimize the assessment of intermodal hubs, elevating seamlessness to the strategic objective level. Lu et al. [32] proposed that modern regional logistics hubs are hierarchical functional facilities that manage the flow of goods, transportation, information, and capital and that, in a regional logistics network, logistics hubs support the flow of goods from different regions through multiple transportation modes, such as rail, motor transportation, water transportation, and pipelines, to achieve overall operational efficiency. Liao et al. [33] defined intermodal hubs such as road transportation, rail transportation, waterway transportation, and air transportation as efficient intersections. As a special kind of logistics infrastructure, it can perform the integration function of cargo consolidation and classification and has an irreplaceable position in modern logistics, arguing that intermodal hubs influence the whole region, the social environment, and the development of logistics enterprises. According to Huber et al. [34], transportation logistics hubs are primarily employed for transshipment, although this critical role is overlooked in most freight transportation models. Hubs are frequently defined as infrastructure and node-linking locations in a logistics network. They generally function as transshipment sites for the transit of commodities, where not only storage but also ordering, bundling, and unbundling procedures take place. The China Implementation Plan for the Construction of National Logistics Hub Network, published in 2019, categorizes hubs into six types: dry port type, airport type, port type, production service type, trade service type, and land border crossing type, with port type hubs serving as areas for cargo distribution and international transshipment functions. Kreutzberger and Li et al. [25,35] proposed that each transportation corridor is connected by hubs in different countries and that hubs are important nodes for cargo consolidation and transshipment, arguing that hubs play an essential role in intermodal networks due to their transshipment and integration functions. Alumur et al. [36] showed that hubs typically act as sorting, transshipment, and consolidation points in transportation networks and that rather than sending goods directly between all origin and destination pairs, hub facilities integrate logistics to take advantage of economies of scale.
A study of the cited literature reveals that practically all studies highlight the transshipment hub’s capacity to combine and distribute goods, link various forms of transportation, and serve as a significant node in a vast network. In the process of defining PCITHs, we find that, in addition to the essential functions of hubs, such as cargo aggregation, cargo transfer, and connection of different modes of transportation, they also emphasize the driving and connecting functions of hubs to other transportation nodes and the radiation hinterland, i.e., the influence of hubs as central links to the surrounding area.

2.2. Service Capability Evaluation Indicators in the Field of Transportation

There are few recent research findings on the service capacity of PCITHs. This paper expands on the definition of the research object and research questions in this paper by drawing on service evaluation of other aspects such as service quality, port function, and competitiveness of cargo hubs port, as well as providing ideas for the establishment of the evaluation indicator system in this paper. Based on the analysis of the characteristics of regional port hubs and the development needs of intermodal container networks, Wan et al. [37] conducted an analysis of the key influencing factors from the standpoint of comprehensive consideration of the software and hardware strength of port hubs. They chose the evaluation indicator system that contains four aspects: business capacity, resources, infrastructure, and service quality. They concluded that the traditional infrastructure factors are no longer the most important, while the flexibility factors, such as transportation capacity and resource integration, are now more important. Zhang et al. [38] developed a combined qualitative and quantitative evaluation model from the standpoint of the supply chain, and they chose evaluation indicators affecting port capacity from four perspectives: port resource ownership, controlled management, integrated services, and innovation drive, which fully considered the service attributes affecting port capacity but poorly considered the hardware strength of the port itself. In their study of port service quality from the viewpoint of port users, Nguyen et al. [39] chose indicators in five categories: empathy, tangibles, assurance, reliability, responsiveness, and diversity. The evaluation results centered on how well the port met the users’ needs. Based on the user’s sense of quality, the evaluation results concentrate on how well the port satisfies the user’s needs. When compared to service quality, service capability is a gauge of the service subject’s overall capacity to deliver services. Service capability is a complex system that requires cooperation and coordination between resources, management, facilities, equipment, information, and other factors. Xia [40] established an evaluation indicator system through a selection of the literature, questionnaire survey, and expert consultation; gave the corresponding rank parameters of each indicator based on the fuzzy evaluation set; and finally obtained the total assessment score of port service capability. Huang [41] evaluated the service capacity of China’s major ports in the context of railroad transportation and established a comprehensive evaluation indicator system of multimodal transport capacity of ports based on railroad transportation in regard to four aspects, namely collection and distribution environment, intermodal transportation capacity, operational performance, and sustainability. However, less attention was paid to the supporting role of hardware equipment such as infrastructure on the intermodal transportation network. Yang et al. [42] redefined ports and their functions based on the definition of traditional ports, as well as the needs of economic and social development, defining ports as a dynamic service concept and arguing that the integrated hub function, logistics service function, and value-added services should be the focus of future development, strengthening the interface between transportation modes, and establishing a full logistics service system. Wang et al. [43] used the DPSIR model to establish evaluation indicators of logistics hubs from five aspects: driving force, pressure, state, influence and response, and the evaluation indicators reflect the industrial support role of hubs and the role of goods aggregation. Ren et al. [44] concluded that geographic characteristics such route accessibility, shipping capacity, and market support had a substantial impact on the competitiveness of ports in their assessment of the competitiveness of Asian container ports. Ji et al. [45] discussed the elements of port logistics service capability and competitiveness according to modern service theory, argued that service capability includes not only tangible factors but also intangible factors, explained the relationship between service capability and competitiveness, and established an indicator system for service capability evaluation from factor capability and operational capability. Abramović et al. [46] considered that the main problem of intermodal ports or terminals is the terminal or port reloading, i.e., the connection problem, and the main problems observed are organizational problems in management, operational problems, and problems related to infrastructure. Agatić et al. [47] re-explored the study of digital technology to improve the quality of seaport services, defining the service quality factors as reliability, flexibility, digital infrastructure, digital services, etc., emphasizing, in their study, the importance of digitalization and information technology for the improvement of seaport services. Ge et al. [48] investigated the practices and strategies of sea–rail intermodal transportation in ports and discovered that the legal system, service norms (including facility norms and institutional norms), inadequate infrastructure, coordination, and technology are the main barriers to the current development of sea–rail intermodal transportation. According to a review of the prior study literature by Feng et al. [49], policy, software (loading and unloading technologies and information construction), and hardware (infrastructure such as ports and railroads) are the key influences on sea–rail intermodal transportation. Schönemann [50] examined the significance of information flow in lowering vessel and rail transit times in sea–rail intermodal operations in German seaports, showing the critical role of information technology in intermodal sea–rail intermodal transportation. Dotoli et al. [51] emphasized the important role of information and communication technology for intermodal transportation systems, arguing that information and communication technology manages and controls intermodal transportation by integrating information and resources, and that incorporating information and communication technology into the system can improve the efficiency of intermodal transportation.
They have also adopted a multidisciplinary approach to evaluation. These studies help enrich the research content of this paper and provide a basis for designing evaluation indexes in this paper. In general, the existing studies have some limitations in constructing the indicator system and the selection of evaluation methods. For example, some studies focus on considering the internal factors of the port itself and ignore the external environmental factors; some studies rely too much on subjective judgment or have high data requirements; the interpretation and accuracy of some research results need to be improved.

2.3. Common Evaluation Methods

Currently, numerous approaches are employed in the research of transportation services, and research methods from diverse domains have been refined and applied to the evaluation of intermodal transportation hubs. Traditional single evaluation methods, such as TOPSIS, factor analysis, cluster analysis, grey correlation analysis, cloud model, fuzzy integrated evaluation, fuzzy object element method, and so on, no longer meet the requirements of the comprehensive evaluation of complex systems, and AHP-fuzzy integrated evaluation, fuzzy Bayesian, entropy TOPSIS, and other integrated methods have entered the picture. Table 1 provides the evaluation methods commonly used in the field of transportation, as well as the advantages and disadvantages of these methods.
When comparing sectoral research approaches in the research field, it is discovered that the combined method is more thorough and scientific in evaluating the service capacity of PCITHs than the single evaluation method. Based on earlier research, this work employs the G1-improved CRITIC method from a game theory perspective to estimate the weighting and the fuzzy matter element method to evaluate the service capability of PCITHs. The barrier degree model is used to investigate the barrier elements and clarify the constraint limitations in order to give policymakers a more scientific evaluation technique.

2.4. Review Summaries

Typically, managing incoming cargo after it has been discharged from the ship or train is part of the operational process at a sea–rail transportation terminal. These goods can be transferred immediately to another method of transportation or can first be temporarily stored in the yard [61]. Some researchers have defined intermodal transportation hubs as centralized facilities located relatively close to the geographic area they serve and within which consolidated deliveries are made [62]. With the growth of the economy and technology, transshipment hubs started to handle a lot of sea and railroad change operations, requiring a lot of goods in a short amount of time to achieve the loading or unloading of ships’ exchange operations, integrating logistics resources through the consolidation of goods, transit goods, or concentrated scattered goods to maximize the utilization of logistics resources and minimize costs [9]. From the surface, the sea–rail intermodal transportation can be carried out to achieve a specific area of sea cargo transport, and railroad cargo transport docking can be regarded as the sea–rail intermodal hub.
By analyzing what the primary literature covers, this paper defines PCITHs in the context of the research as those that rely on seaports or inland river ports as the backbone, utilizing nearby resources such as water and rail transportation, freight-transportation-supporting facilities, and logistics operators to form; achieve cargo consolidation and transshipment via sea–rail intermodal transportation; radiate a larger area of sea–rail intermodal operations; and realize that the port serves as a hub for the distribution and combination of freight, logistical data, and money flow. The fundamental aspects of PCITHs are the transfer of commodities, the connectivity of various forms of transportation, and the distribution of goods.
The researchers developed a set of indicators based on the comprehensive service level, soft and hard power, service process and quality, development potential, and critical impacts of port logistics. It provides ideas for us to select evaluation indicators. The evaluation results can determine the performance of each indicator and, thus, the overall service level. The results obtained from different evaluation indicator systems for the same target may differ. Service capability is a macro concept. However, PCITHs are a complex multilevel system, and the perception of the service capability of PCITHs cannot be expressed entirely by their overall service capability only. Considering that the main functions of PCITHs are cargo transshipment and aggregation and the connection of different transportation modes, this paper provides a more detailed perception of the service capability from the perspective of the transshipment and connection operations of PCITHs.

3. Service Capability Evaluation Methodology

The established measurement indicator system is used to build the service capacity evaluation model for PCITHs. By compiling the relevant literature and summarizing the evaluation methods, it is discovered that, due to the complexity of the PCITHs system, there are many factors affecting their service capacity; and their evaluation indicator system includes both quantitative and qualitative indicators, the qualitative indicators cannot be measured by exact values, and there is uncertainty. Because of the system’s complexity and ambiguity, as well as the link between indicators, it is more scientific and fair to use various weighting methods to assign weight to indications [63].
The combination weighting method [64,65] is a weights calculation method that combines the objective weighting method and the subjective weighting method with a specific set of calculation rules, and it compensates for the limitations of the subjective and objective assignment methods to some extent. It can make full use of objective information while reflecting the degree of importance assigned to the assessment indicators as much as possible through the combination. The objective weighting method alone focuses only on the analysis of objective information of the data. It relies excessively on objective data, which will make the objective factors in the results too large and cannot reflect decision-makers’ importance to different indicators. Sometimes the calculated weightings will be contrary to the fundamental importance of the indicators. The subjective weighting method alone focuses only on the mathematical analysis of the weighting results through expert ratings, which may cause too much interference of subjective factors in the results and often ignores the information contained in the numerical characteristics of the evaluation indicators themselves. In the indicator system constructed in this paper, qualitative indicators need to be measured based on expert experience scoring, and quantitative indicators need to be calculated by objective data. In order to avoid producing the above two kinds of results that do not conform to the existing law, the research in this paper adopts the G1 weighting method and the improved CRITIC method to calculate the objective weighting and subjective weighting of the influence of each factor on slope stability, respectively. Finally, game theory considers the subjective and objective weighting together to obtain the total weighting.
The G1 weighting approach [66] is appropriate for decision analysis processes in which the evaluation indicators are random and fuzzy and the number of indicators is significant, and it can better depict the sequential relationship between indicators. The G1 weighting method is an improved subjective weighting method based on AHP. Compared with the AHP method, this method does not require the construction of a matrix in the process of determining the weights of each indicator. It does not require consistency testing and maintains the order among the indicators. The calculation process is also more straightforward than that of the AHP method. The CRITIC method [67] takes into account the correlation and difference between indicators and analyzes the amount of information on indicators from two information perspectives, i.e., the comparison variable coefficient and conflict, and the idea of game theory can better avoid the bias of evaluation results caused by the weight assignment ground. Compared with the commonly used objective weighting methods, such as the entropy method, CRITIC does not have strict requirements on the amount of data and also considers the data fluctuation among indicators. In addition, alternative weighting methods make the ideal assumption—which is false in practice—that the indicators are independent. In contrast, the CRITIC method considers the correlation between indicators. Hence, it was chosen in this study to compute the weights more scientifically. Most of the coefficients for the subjective and objective weighting in other works from the literature that calculate weighting using the combined weighting method are either determined by experts or calculated directly by using coefficients of 0.5 for the subjective and objective weighting, respectively. In these instances, the calculated weights are not sufficiently scientific and are poorly interpreted. The idea of game theory [68] can better avoid the bias of evaluation results caused by the one-sidedness of weighting assignment and find the Nash equilibrium point of subjective and objective weighting so that subjective factors are taken into account without ignoring the inherent statistical laws between indicator data.
There are numerous widely used evaluation methods, among which the Bayesian network method and the BP neural network method can avoid tedious calculation but require a significant amount of historical data as samples, which is challenging to carry out in the case of insufficient information; the fuzzy comprehensive evaluation method can better solve the problem of fuzziness but does not take into account the quantification of index weights. The fuzzy mathematics-based evaluation method is also applicable to various multifactor and multigrade evaluations, and it can quantitatively express some qualitative indicators. It is necessary to select an evaluation method that can quantify the fuzzy data information and qualitative information due to the fuzzy boundary of the service capacity of PCITHs, the difficulty of obtaining data sources, and the difficulty of quantification. The fuzzy matter element method, as a typical fuzzy mathematical evaluation method, can precisely meet the needs of this research problem. Fuzzy matter element analysis [58,69] organically blends fuzzy mathematics and matter element analysis, intending to solve the fuzzy incompatibility problem and promote the change of things. The service capability of PCITHs is a fuzzy concept, and its evaluation indicators comprise quantitative and qualitative indicators, the latter of which are fuzzy and cannot be simply described by an accurate value, adding uncertainty and ambiguity to the evaluation results. Furthermore, there is no relationship across many indications, and employing a consistent standard to quantify them is impossible. Therefore, when evaluating the service capability of PCITHs, the ambiguity of the corresponding quantitative values of the evaluation object characteristics and the incompatibility between the established evaluation indicators should be considered. To that purpose, this work employs a combination of the methods, i.e., a G1-improved CRITIC method. It employs the game theory method to calculate the comprehensive optimal weights, thereby overcoming the drawbacks and limits of existing weight allocation methods.

3.1. G1 Weighting Method

The general steps of the G1 weighting method [70] are as follows:
Step 1: Determine the sequential relationship of the evaluation indicators; if the indicator set X 1 , X 2 , , X N is ranked in terms of the degree of influence on the evaluation object to obtain the ranking relationship:
X 1 > X 2 > > X n
This relationship is known as the relationship between the evaluations { X 1 , X 2 , , X n } between the evaluations identified in order of “>”.
Step 2: To derive the relative importance ratio between each evaluation indicator, the ratio of importance is derived by expert judgement of the importance of the evaluation indicator X k 1 and X k to the object of evaluation:
W k 1 W k = r k ( k = n , n 1 , , 3 , 2 )
It means that the weight of W k 1 is r k times that of W k . The reference values of r k are shown in Table 2.
Step 3: Calculate the weight coefficients of the evaluation indicators and find the subjective weights of the indicators based on the two steps above:
W n = [ 1 + k = 2 n ( i = k n r i ) ] 1
W k 1 = r k W k ( k = n , n 1 , , 3 , 2 )

3.2. Improved CRITIC Method

The CRITIC method is an objective weighting method, the basic idea of which is to assign weights according to the size of indicator information and the correlation between indicators. Considering the existence of a certain correlation between indicators in the established indicator evaluation system, it is more scientific and reasonable to adopt the CRITIC method to determine objective weights [67]. The traditional CRITIC method has low accuracy in reflecting the degree of variation of data, and the correlation is not reasonable enough. In order to make the results more scientific and accurate, the CRITIC method is improved by adopting the coefficient of variation to measure the discriminative power of the information of indicators and the correlation coefficient to measure the conflicting nature of indicators [71], and the specific steps are as follows:
Step 1. Construct the initial evaluation matrix: Assuming that there are m evaluation objects and n indicators are selected to evaluate the evaluation objects, the initial evaluation matrix is constructed as follows:
X = M 1 M 2 M m C 1 μ ( X 11 ) μ ( X 12 ) μ ( X 1 m ) C 2 μ ( X 21 ) μ ( X 22 ) μ ( X 2 m ) C n μ ( X n 1 ) μ ( X n 2 ) μ ( X n m )
Step 2. Normalization of the indicator data matrix: In order to eliminate the problem of inconsistencies in magnitudes and units among the indicators that make comparison impossible, the indicators were normalized. The evaluation indicators are divided into cost-based and benefit-based indicators, and Equations (6) and (7) are used to obtain the normalized standard matrix, B .
Cost-based (the smaller the better indicator):
a i j = max x j x i j max x i min x j
Benefit-based (the larger the better indicator):
a i j = x i j min x j max x j min x j
where a i j denotes the value of the j item of the i thing after forwarding; x i j denotes the corresponding quantity value of the j feature of the i thing; and m a x x i j and m i n x i j are the maximum and minimum values of the quantity value x i j corresponding to the j feature in each thing, respectively.
Step 3. Coefficient of variation calculation: The improved CRITIC uses a coefficient of variation, v j , to measure the discriminatory power of the indicator information quantity, calculated as follows:
v j = 1 m i = 1 m ( x i j 1 m i = 1 m x i j ) 2 1 m i = 1 m x i j = σ j x j ¯
where x j ¯ is the mean of indicator j .
Step 4. Conflict coefficient calculation: Conflict between indicators is reflected by constructing a quantitative expression characterizing the conflict based on the correlation coefficient between the indicators, calculated as follows:
C j = i = 1 n ( 1 | ρ i j | )
where ρ i j is the correlation coefficient between indicators. In the formula, taking the absolute value of ρ i j means that there will be a stronger correlation with other indicators, and the conflict is only related to the absolute value of the size of ρ i j and has nothing to do with being positive or negative. Taking the absolute value can avoid its negative when the conflict coefficient is caused by the adverse effects. Its calculation formula is as follows:
ρ i j = cov ( X i , X j ) ( σ i , σ j ) = k = 1 m x k i x k j m x i ¯ x j ¯ k = 1 m x k i 2 m x i ¯ 2 k = 1 m x k i 2 m x j ¯ 2
Step 5. Determination of objective weights: The weighting of the indicators is achieved with a comprehensive coefficient, Q j , which is calculated as follows:
Q j = v j C j
The objective matrix, β j , is calculated as follows:
β j = Q j j = 1 n Q j

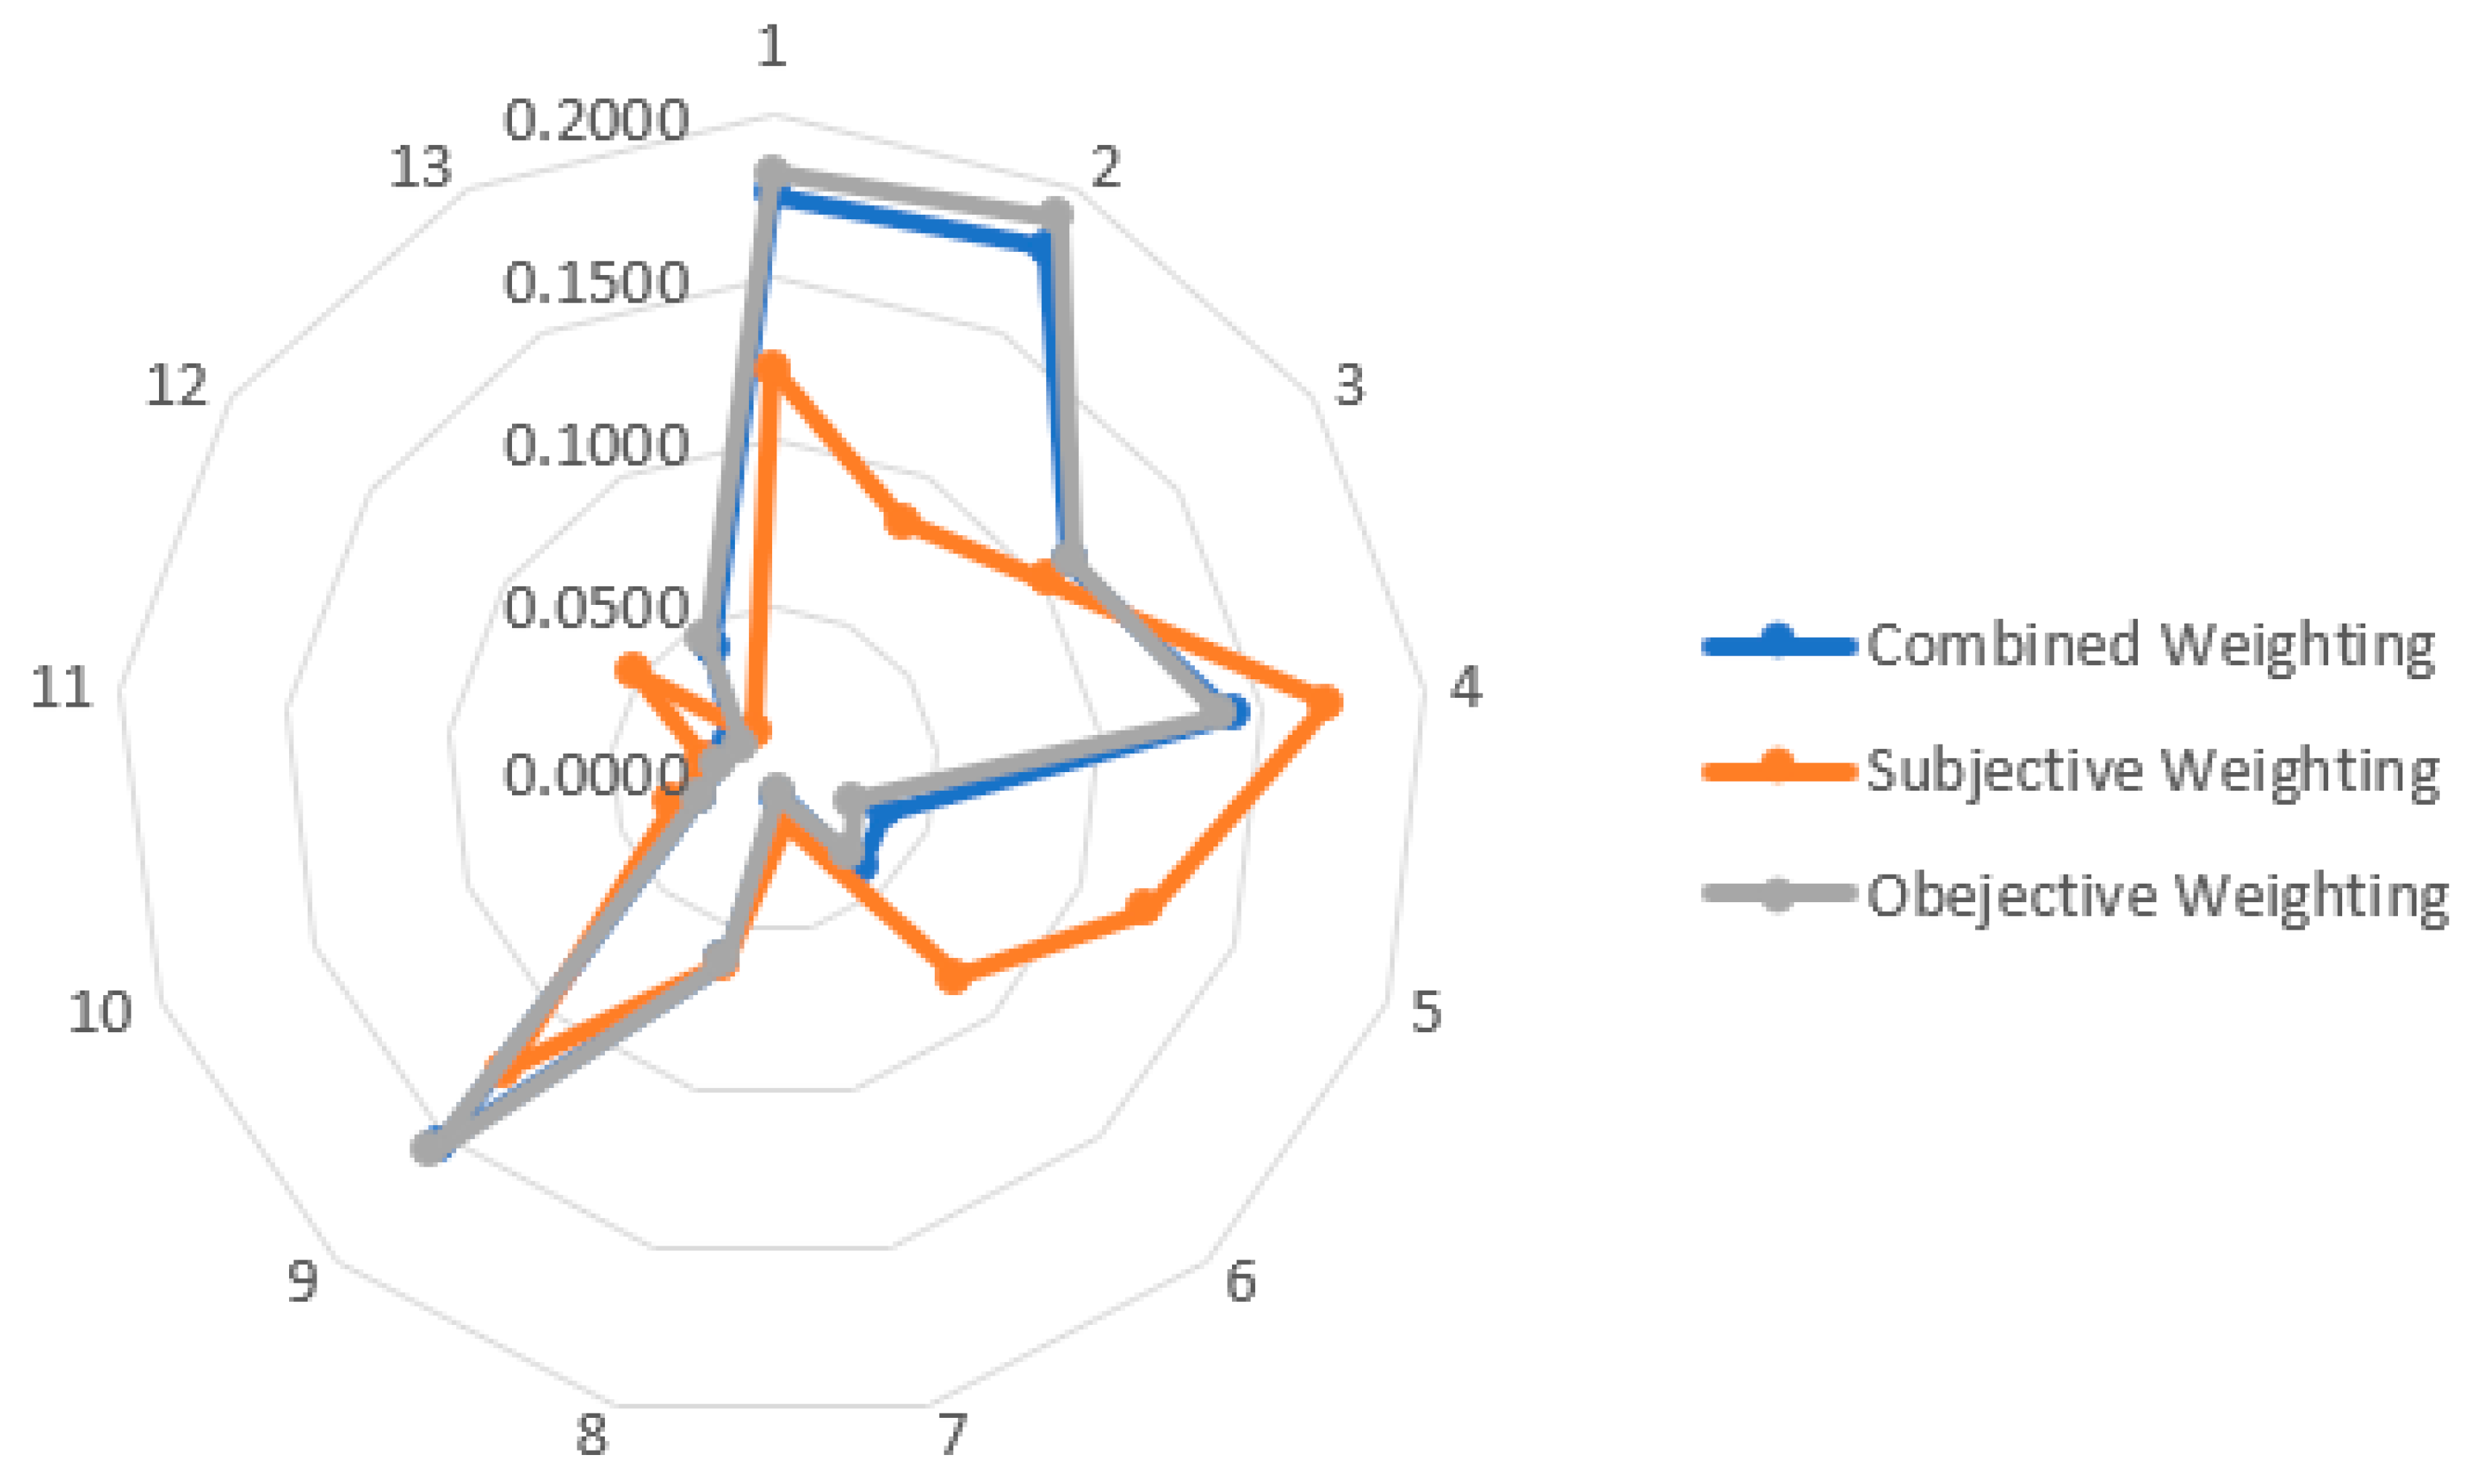
3.3. Determining the Combined Optimal Weights Based on a Game Theory Approach

The use of game theory to study the relationship between subjective and objective weighting methods that are in conflict and to find the common interests of both can take into account both subjective and objective weighting and can consider the interrelationship between indicators comprehensively, reduce subjective one-sidedness, and improve the scientific nature of indicator weighting [72].
According to the weight vectors W k and β from Equations (3) and (12), the linear combination of the two vectors is as follows:
Y = b 1 W k + b 2 β
where b 1 and b 2 are weighting factors, and b 1 + b 2 = 1 .
In order to minimize data dispersion, the linear combination of coefficients is optimized according to the basic ideas of game theory:
min | b 1 W k T + b 2 β T W k β | 2
The objective function can be transformed by taking the optimal first-order derivative of Equation (14) as follows:
W k W k T W k β T β W k T β β T b 1 b 2 = W k W T β β T
The calculation from Equation (15) leads to b 1 and b 2 , followed by the normalization of the linear combination coefficients b 1 and b 2 as follows:
b 1 = b 1 / ( b 1 + b 2 ) b 2 = b 2 / ( b 1 + b 2 )
The vested optimal combined weights are as follows:
Y = b 1 W k + b 2 β

3.4. Fuzzy Matter Element Model

The evaluation of the service capacity of PCITHs is a complex and multilevel system project, and the evaluation indicators involve multiple levels; the evaluation indicator system established is also fuzzy in nature, and it is reasonable to choose the fuzzy matter element model to evaluate the research objectives. Professor Cai Wen proposed the theory of substance analysis, which proposes a triad consisting of three basic elements: “things”, “features”, and “fuzzy values”. Some scholars combined the theory of matter element analysis and fuzzy set theory and used the affiliation theory of fuzzy mathematics to turn the uncertainty evaluation into a certainty evaluation [73], and the calculation steps are as follows:
Step 1. Constructing the original matter element model: Assume that R denotes a fuzzy matter element, M denotes a thing, C denotes a feature, and μ X denotes the fuzzy quantity value corresponding to it. If there are m things described by their common n features, C 1 , C 2 , , C n , and their corresponding fuzzy values, μ X i 1 , μ X i 2 , , μ ( X i n ) , are described, it is called the n -dimensional fuzzy composite element of m things, denoted as R n m :
R n m = M 1 M 2 M m C 1 μ ( X 11 ) μ ( X 12 ) μ ( X 1 m ) C 2 μ ( X 21 ) μ ( X 22 ) μ ( X 2 m ) C n μ ( X n 1 ) μ ( X n 2 ) μ ( X n m )
where R n m is the n -dimensional composite element of m things, M i is the i i = 1,2 , , m thing, C j is the j j = 1,2 , , n feature, and X i j is the quantity value corresponding to the j feature of the i thing.
Step 2. The principle of subordination: The degree of subordination refers to the degree of subordination of the corresponding characteristic value of every single indicator to the corresponding characteristic value of each corresponding indicator in the optimal solution. The subordinate degree is generally positive because of the characteristic value of each indicator for the evaluation results; some are the more significant, the better, and some are the smaller, the better; therefore, for different subordinate degrees, respectively, use different calculation formulas. The cost-based (the more minor, the better the indicator) and the benefit-based (the more significant, the better the indicator) are calculated using Equations (6) and (7).
Based on the affiliation calculation of the above indicators, the composite fuzzy matter element matrix can be transformed into an affiliation matrix, and the affiliation matrix is denoted by R n m ~ ; then, R n m ~ calculated as follows:
R n m ˜ = M 1 M 2 M m C 1 a 11 a 12 a 1 m C 2 a 21 a 22 a 2 m C n a n 1 a n 2 a n m
Step 3. Constructing optimal fuzzy matter elements: According to the affiliation matrix of Equation (19), the optimal fuzzy element, R 0 n , can be constructed. According to the affiliation calculation in this paper, regardless of whether the original indicator is positive or negative, the normalized one is all positive indicators, and the direction of action is the same. Therefore, according to this, only the maximum value of the indicator affiliation is taken, and the optimal fuzzy matter element is as follows:
R n 0 = M 0 C 1 μ 10 C 2 μ 20 C n μ n 0
Step 4. Difference-squared composite fuzzy matter elements: If we denote i j ( i = 1,2 , , m ; j = 1,2 , , n ) the square of the difference between the optimal fuzzy object element, R n 0 , and each of the compound subordinate fuzzy composite elements, a i j , then the difference squared compound fuzzy object element, R , is calculated as follows:
R Δ = M 1 M 2 M m C 1 Δ 11 Δ 12 Δ 1 m C 2 Δ 21 Δ 22 Δ 2 m C n Δ n 1 Δ n 2 Δ n m
where i j = ( μ i 0 a i j ) 2 ; i = 1,2 , , n ; j = 1,2 , , m .
Step 5. Calculation of Euclidean closeness: The Euclidean closeness calculated using fuzzy matter elements indicates the closeness between each thing and the optimal thing; the greater the Euclidean closeness, the greater the service capability. The calculation formula is as follows:
d H j = 1 i = 1 n Y Δ i j , j = 1 , 2 , , m

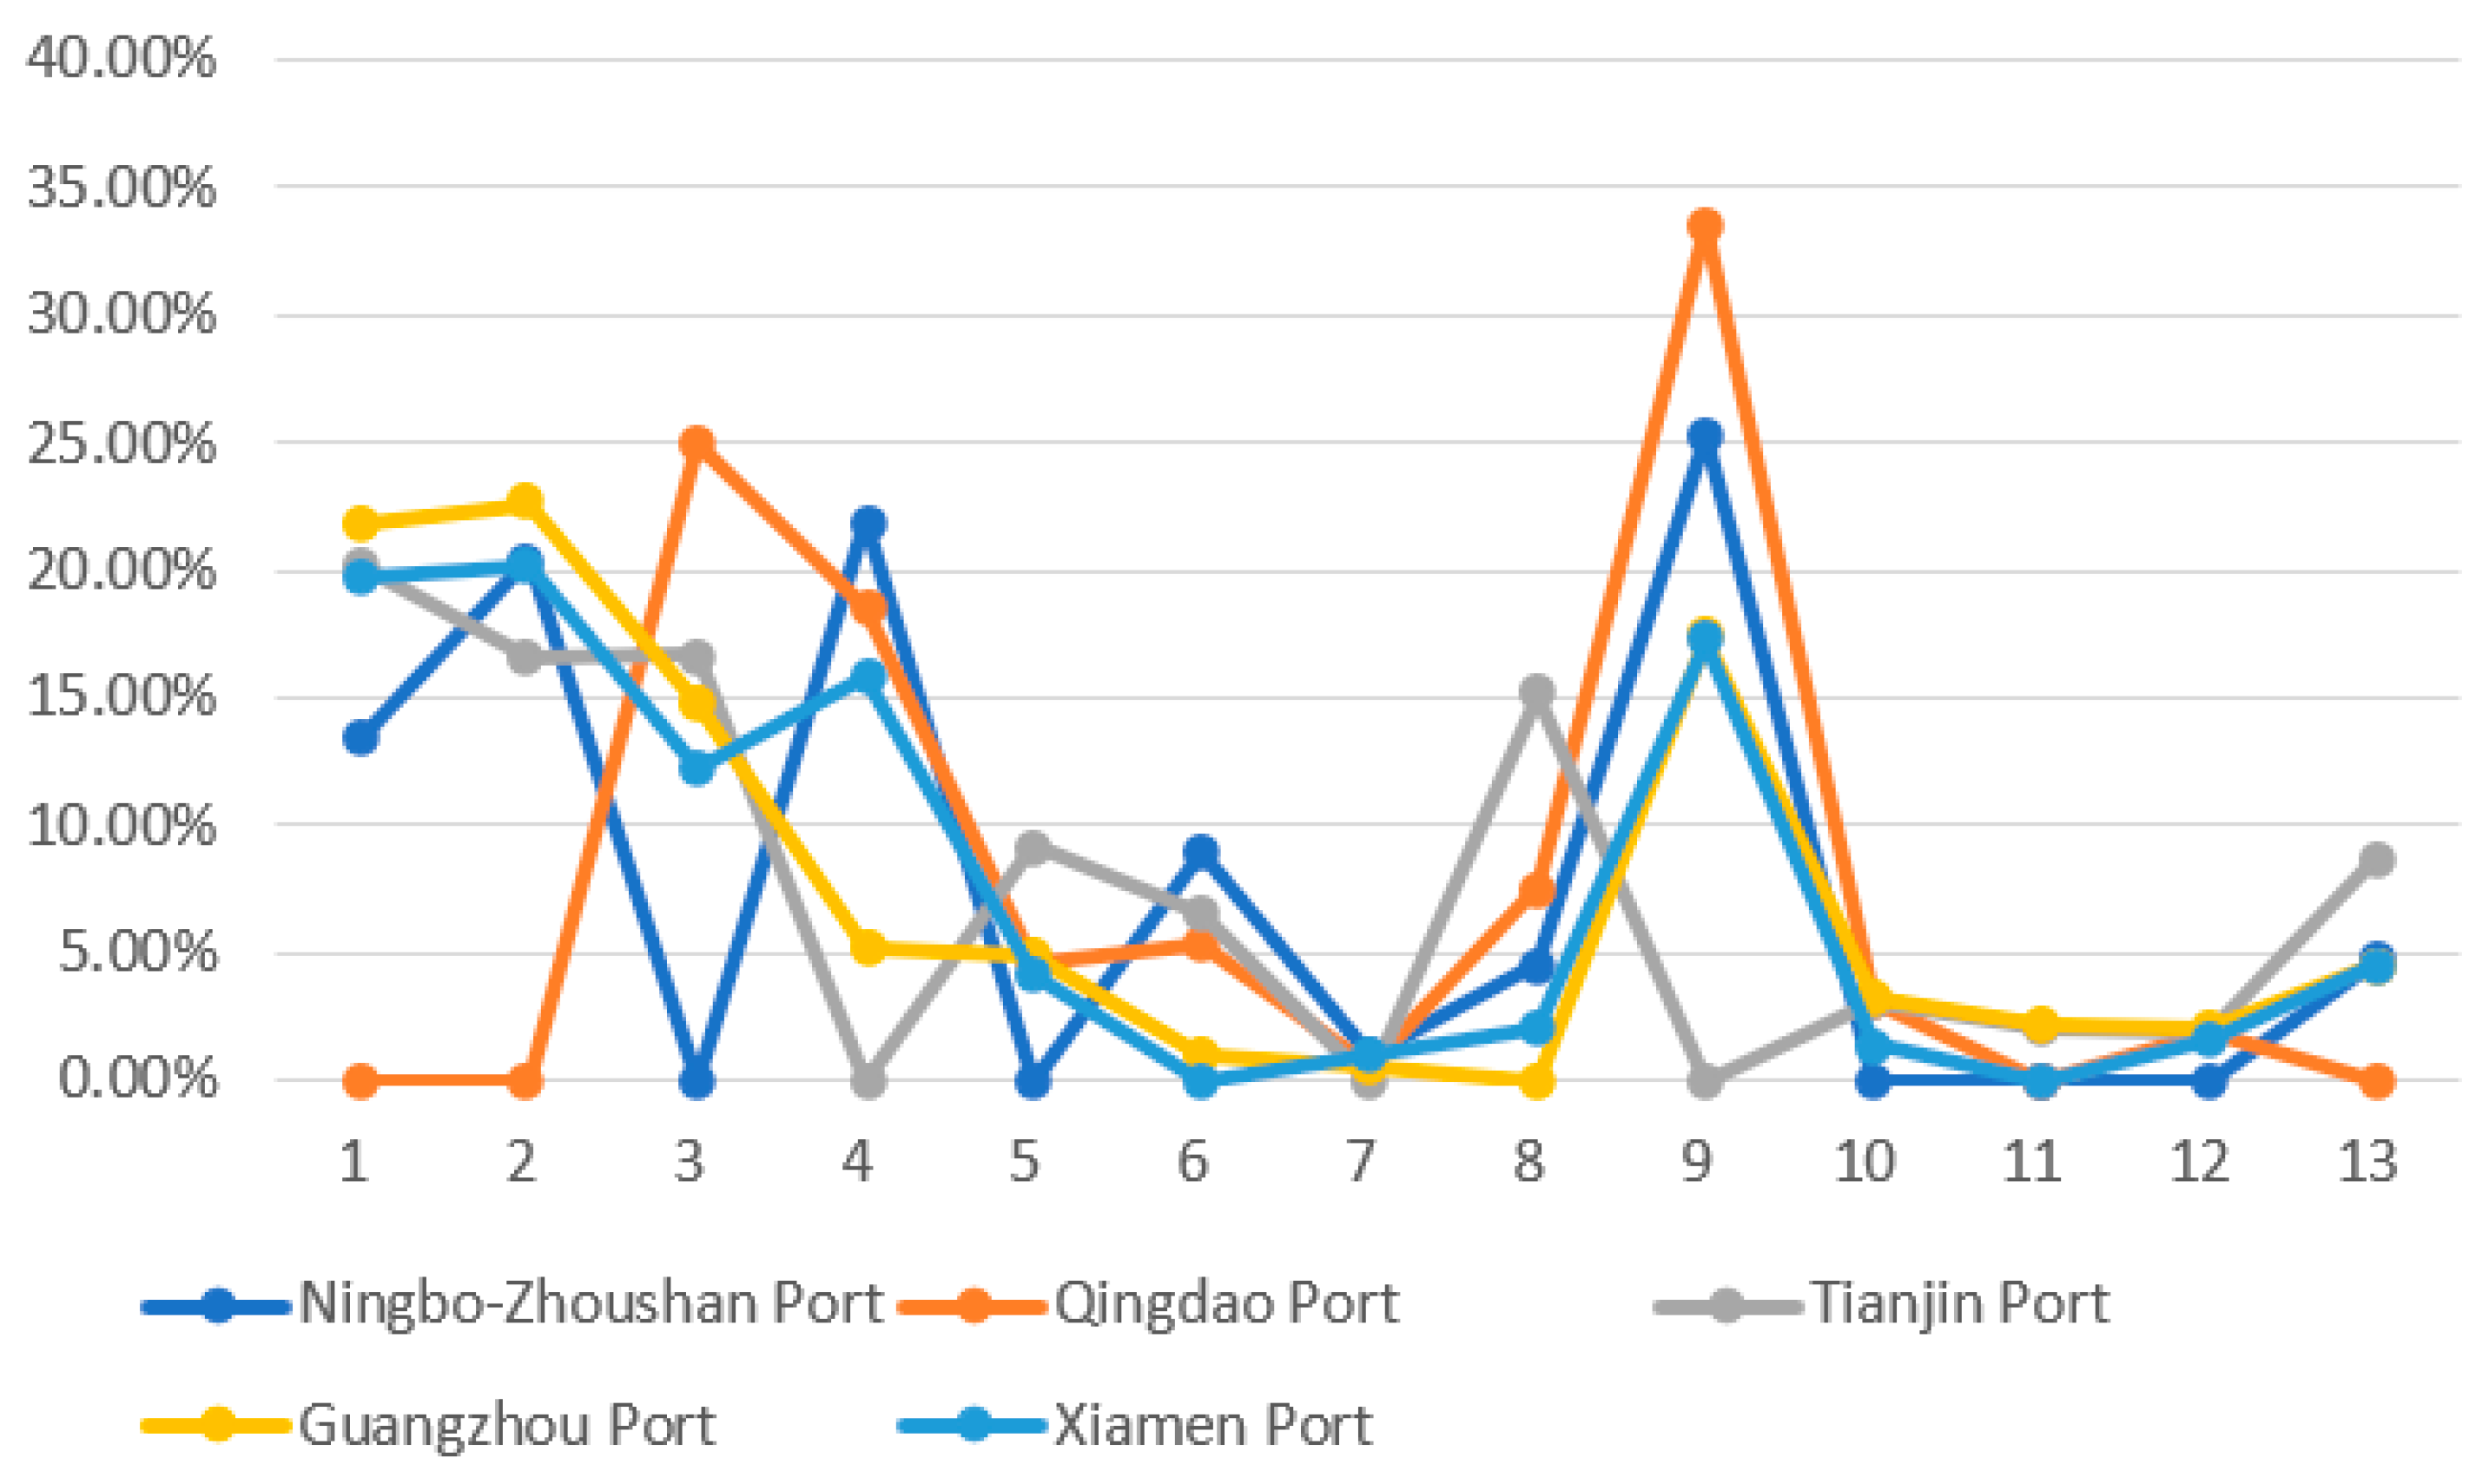
3.5. Barrier Degree Model of Service Capability

The barrier degree analysis is a further analysis after the evaluation of the service capacity of PCITHs. Using the barrier degree model, the barrier factors and barrier degrees affecting the service capacity can be diagnosed and measured to provide a reference for targeted improvement of the service capacity. This paper introduces the factor contribution degree, indicator deviation degree, and barrier degree to study and analyze the barrier factors [74]. Among them, the factor contribution degree indicates the contribution of a certain indicator to the overall target, which can usually be expressed by the weight of the indicator; the indicator deviation degree is the difference between the actual value of each indicator and the optimal value, and the one selected in this paper is the optimal value, which can be expressed as the difference between the optimal value one and the standardized value of each indicator; and the barrier degree indicates the degree to which each indicator affects the service capacity [75]. The formula calculates the barrier degree of each indicator:
O i j = D i Y i D i Y i
D i = 1 a i t
O i j indicates the indicator barrier score, a i t is the standardized value of the secondary indicator, and Y i indicates the weight of the indicator.

4. Indicator System for Evaluating the Service Capacity of PCITHs

Before developing the PCITHs service capacity evaluation indicator system, we first needed to thoroughly analyze and comprehend the relevant concepts of PCITHs and their service capacity and then enrich the selection of indicators through the expression of critical concepts. Due to the study’s intricacy and specificity, erroneous conclusions due to single or unrepresentative indications needed to be avoided. The service capacity evaluation indicators should reflect the service capacity of the critical functions of the research object from the perspective of the primary functions of the PCITHs, as well as the features of sea–rail intermodal transportation and hubs.

4.1. Theories Related to the Service Capacity of PCITHs

Operation of Sea–Rail Intermodal Transportation in PCITHs

A majority of current service evaluations are focused on service level and service quality, with few studies on service capacity. Service level, service quality, and service capability are three distinct ideas that are evaluated in terms of the key factors of the evaluation, such as the service provider’s size, authentic performance, and internal capacity. The primary focus of service capability should be on the service provider’s capabilities and the service provider’s internal management and resource allocation capabilities. In order to provide practical, efficient, and convenient logistics services, PCITHs must have complete infrastructure, equipment, and operation and management capabilities. At the same time, PCITHs’ service capability includes their performance in terms of connecting numerous forms of transportation and coordinating many logistics ties. As a result, the service capability of PCITHs is a broad notion that encompasses the performance and capability of numerous factors. Given that service capability is not a fixed and specific concept, the definition of service capability often varies significantly from one position to the next, and there are many ways of classifying the dimensions of service capability. It should be noted that these points of view are not contradictory but rather result from different research objectives and contexts.
It is clear that the main characteristics of PCITHs are as follows:
  • It is the intersection of multiple transport lines passing through or connecting in the intermodal transportation network and is the general part of the comprehensive transportation system, connecting the flow of goods and information in the network.
  • It is in the process of intermodal transportation for at least two modes of transportation interface, and the traffic conditions are relatively perfect in the vital port, an important distribution center for goods.
  • It undertakes the gathering and integrating of goods at the location, transit, centralized distribution, and traffic operations outside the region, among other things.
The study of the service capacity of PCITHs in this work begins with the sea–rail intermodal transportation system. The fundamental procedure of a PCITH’s functioning is as follows: initially, rail transportation is used to coastal ports, followed by a switch to container ships for sea transportation, and finally, after arriving at the target port, a switch to rail transportation. Railroads are typically used on the land side, and the supply node transports the goods centrally to the hub of the supply region. After integration at the hub, they are transported together to the hub of the receiving region, realizing the transit transportation of goods. Finally, the goods are transported to the destination through the centralized distribution of the hub of the receiving region. This process embodies “hub” and “sea–rail intermodal transportation” joint operations. By summarizing the research literature and consulting experts, we found that all operations of PCITHs revolve around the interchange and distribution of cargo and the connection of different modes of transportation, and the perfection of the function of changing cargo and connecting modes of transportation in PCITHs is the focus of carrying out sea–rail intermodal transportation, which is essential after the development of sea–rail intermodal transportation to a particular scale. PCITHs are a multi-to-multi transportation system that is set up in order to achieve economies of scale and provide special facilities for the transit of goods; facilitates the dismantling, sorting, and consolidation services; is a variety of transportation modes or multiple transportation trunk line intersections; and can handle the freight operations of the comprehensive service sites. Through the hub, the role of the collection and distribution, the transport network of different starting points of the goods, the hub can be combined to the same endpoint. In contrast, the same starting point of different endpoints of the goods sent to the hub of the path can be unified to achieve economies of scale in the transportation process. Improving the function of PCITHs is the key to constructing a sea-rail intermodal transportation network, especially the agglomeration and radiation effect of the hub. The construction of sea–rail intermodal transportation is explicitly to improve the function of cargo interchange and transportation mode connection, which is the key to the smooth implementation of sea–rail intermodal transportation. The evaluation of the functions is the key to understanding the PCITHs’ overall service capability since the service capability is an integrated expression of all of its various functions. By dividing the evaluation index system from the perspective of function, the gaps between different functions can be identified so that the optimization strategy of service capacity construction can be proposed in a targeted manner. Therefore, this paper selects the radiation scale capacity, transportation connection capacity, and resource integration capacity as the evaluation index selection dimensions under the consideration of sea–rail intermodal transportation and from the perspective of the functions of PCITHs. By analyzing the performance of different functions, the overall service level can be accurately judged, and targeted improvement strategies can be formulated, thus providing both a theoretical and practical basis for continuing to promote the development of PCITHs.

4.2. Design of Evaluation Indicators

According to the literature or port operation practice, this paper classifies the functional performance of port hubs into three dimensions: radiation scale capacity, transportation connection capacity, and resource integration capacity. The multidimensional functional performance can provide a comprehensive picture of the service capacity. Thus, with the advice of industry experts, several indicators were constructed, and the constructed service capacity evaluation system of PCITHs is shown in Table 3, which can not only reflect the performance level of each function but also further evaluate the system service capacity comprehensively, and the specific interpretation of each indicator is as follows.

4.2.1. Radiation Scale Capacity

The radiation scale capability of PCITHs refers to the logistics transportation flow or capacity that the hub can support, the current operational handling capacity, and the transit radiation range. It has two meanings: one is the scale of operation of PCITHs, and the other is the radiation scale of PCITHs. The scale of operation represents the capacity of PCITHs to handle cargo, and PCITHs also need to have a land and water distribution network covering a wide area. The larger the network size, the more node cities and cargo sources are connected and the stronger the radiation capacity. The radiation scale capacity affects the breadth and depth of service capability. It is crucial to developing the connection of regional transportation networks, strengthening regional economic ties, encouraging intra-regional industrial development, and achieving coordinated regional development. By improving the radiation scale capability, multimodal transportation hubs can handle more logistics and transportation needs, broaden transportation services’ scope, expand transportation networks’ radiation, improve logistics and transportation efficiency and service levels, and increase hub performance. The radiation scale capability of PCITHs is examined according to four aspects: container sea–rail transportation volume, sea–rail intermodal container handling capacity, the number of productive berths of 10,000 tons and above, and the number of sea–rail transportation lines and mechanical equipment service level, as shown in the figure below.
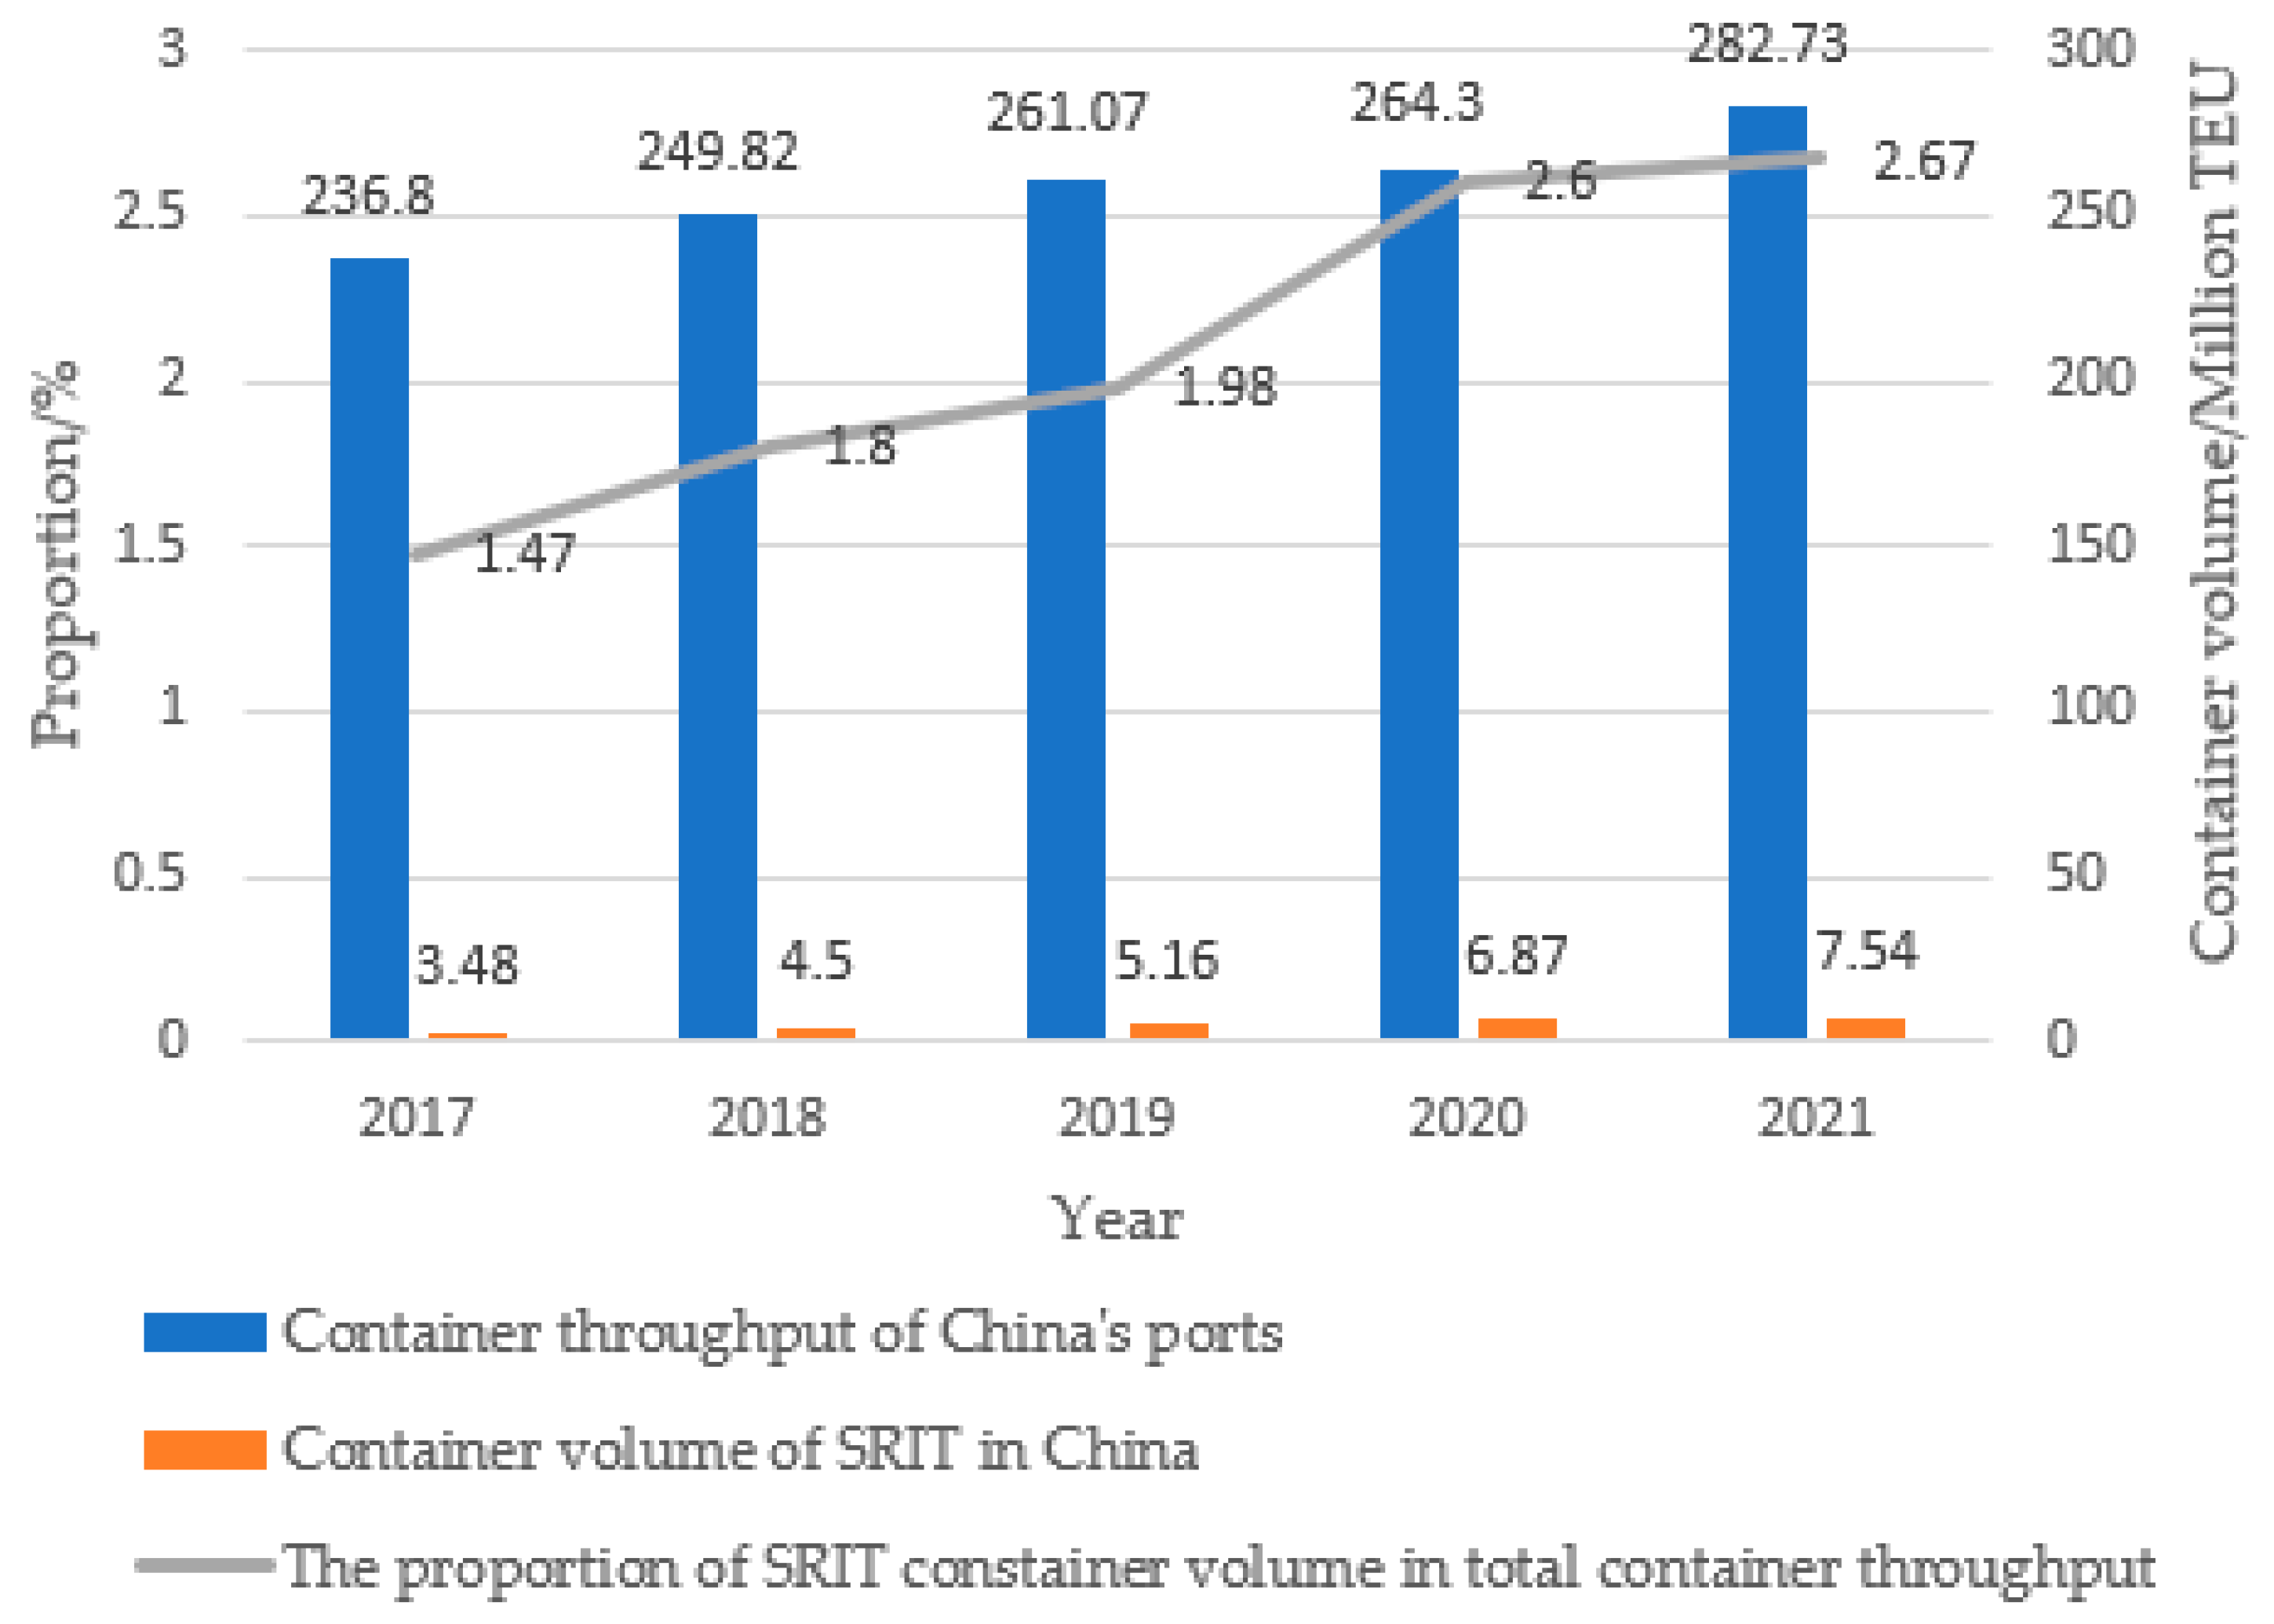
  • Container sea–rail transportation volume: The container sea–rail transportation volume is completed through the hub, measuring the PCITHs’ radiation scale capacity of one of the essential indications. In a sense, the larger the container sea–rail transportation volume is, the more extensive the intermodal transportation hub’s radiation scale, its attraction, and service customer groups are, which can drive the expansion of the hub transportation network, improve its transportation services radiation area, and increase transportation radiation capacity. Furthermore, as the volume of intermodal container transportation by sea and rail increases, so will economies of scale, the network effect, and the development of adjacent sectors. Furthermore, this indicator can show whether the PCITHs have enough storage, loading and unloading, transportation, and other facilities and equipment to satisfy the flow of goods.
  • Sea–rail container handling capacity: The sea–rail container handling capacity is related to the container handling capacity in the sea–rail intermodal transportation business, which reflects the degree of cargo aggregation and the handling efficiency of PCITHs. Because the container handling capacity directly affects the quantity of cargo handled by PCITHs and the operation capacity, the sea–rail container handling capacity will directly affect the service quality and operational efficiency of PCITHs. If PCITHs have a high sea–rail container handling capacity, they can handle many containers quickly and efficiently to improve transportation efficiency and quality. This also indicates its large transportation scale capacity and extensive radiation of transportation services.
  • Number of productive berths of 10,000 tons and above. The total number of productive berths equipped at the hub that can take container vessels weighing 10,000 tons or more reflects the hub’s capacity and degree of service in the large container vessel market. The number of berths is proportional to the port or terminal’s cargo throughput and shipping capacity. More berths of 10,000 tons or more mean that the hub can accommodate larger vessels and handle more cargo, which plays an important role in improving the intermodal hub’s operational scale, increasing the service capacity of large vessels, meeting more logistics needs, and increasing cargo throughput and efficiency. Production berths are dedicated to ship loading and unloading operations and are essential to realize the port’s production function. The construction of such berths is the material basis for the development of mega-ship transport and the improvement of port throughput capacity, and its role is to support the efficient loading and unloading of ships and high port output. The classification of productive berths is not directly linked to the deadweight of a ship. It is mainly judged by the berth’s ability to meet the berthing and handling requirements of the ship. Therefore, the more enormous the ship’s tonnage is, the higher the berthing requirements are; the specific berthing requirements for ships in the same tonnage range may vary depending on the ship type, cargo type, and loading/unloading mode. In light of the functions of PCITHs and the examination of sea–rail intermodal transportation, this paper chooses the radiation scale function, transportation connection function, and resource integration function as the evaluation index selection dimensions. The total service level may be correctly assessed by evaluating the performance of various functions, and targeted improvement plans can then be developed. This creates a theoretical and practical foundation for advancing the development of PCITHs. If the number of berths is insufficient, difficulties such as stranded goods and waiting for loading and unloading may occur, resulting in a reduction in the operational scale capacity of PCITHs.
  • Number of sea–rail transportation lines: The number of sea–rail transportation lines operated by PCITHs refers to the number of rail lines connecting the port to the rail network for the operation of intermodal trains and indicates the scale and capacity of the hub in the intermodal container transport market. The operation of sea–rail intermodal lines can connect PCITHs to other ports or regions, allowing for faster transshipment and consolidation of cargo. The opening of more lines expands the transportation network of PCITHs, thus increasing the radius of their transportation services and improving their transportation capacity. As a result, more freight options are available to meet the needs of different customers, generating more freight demand, improving freight efficiency, increasing freight throughput, and promoting the growth of PCITHs.
  • Mechanical equipment service level: The level of service of mechanical equipment refers to the performance and operating condition of mechanical equipment in PCITHs and the effectiveness and reliability of mechanical equipment provided for the cargo interchange, aggregation, and interconnection of different transportation modes. Mechanical equipment includes various kinds of equipment, such as cranes, loading and unloading equipment, and vehicles. Mechanical equipment is the basis for the operation of PCITHs. Advanced and perfect mechanical loading and unloading equipment can complete a more significant cargo transfer and handling in a shorter period and improve cargo handling capacity. High-performance and intelligent mechanical handling equipment allow the hub to quickly and efficiently realize the connection between maritime and railroad transport, thus allowing for the hub to access a broader range of maritime and railroad lines, expanding the intermodal network, and increasing the possibilities and opportunities for intermodal transportation. The machinery and equipment level reflects the equipment’s sophistication and adaptability to the business process. In PCITHs, machinery and equipment have the characteristics of large quantity and many types, and a statistical analysis of the quantity or type of machinery and equipment alone cannot explain the use of machinery and equipment and the benefits to PCITHs, so this paper chooses to evaluate the level of machinery and equipment services.

4.2.2. Transportation Connection Capacity

As a platform for transferring between modes of transportation, PCITHs must have transportation connection capabilities to ensure an effective connection and transfer between modes of transportation within the hub, ensuring the smooth and fast connection and transfer of goods during the transfer process and, thus, improving logistics, transportation efficiency, and service quality. PCITHs with good transportation connection capacity can quickly and efficiently transfer goods from one transportation mode to another in order to meet the various logistics needs of customers, minimize the time loss of goods transferred between different transportation modes, and improve the logistics system’s overall operational efficiency. The choice of transportation connection capacity as the evaluation dimension can accurately reflect the degree of cooperation between hub ports and various transportation modes in promoting intermodal transportation. The following is a four-dimensional examination of PCITHs’ connection capacity: connection time, connection cost, vessel at berth time, and port rail dedicated line mileage.
  • Connecting time: The time it takes for products to move from one form of transportation to another is referred to as connecting time. The articulation time in the sea–rail hub refers to the time it takes for commodities to be connected between numerous modes of transportation, from the time they enter the hub until they are completed. For example, when switching from trucking to train transportation, the connection time comprises unloading, boxing, transporting, unloading, and loading. The short connection time can increase cargo transportation efficiency and transit capacity, minimize cargo detention and waiting time, reduce cargo loss and transportation costs, and improve logistics accuracy and reliability. At the same time, it can increase cargo turnover and customer satisfaction in intermodal transportation hubs while also improving service capacity. When expressed in terms of vessel time in port, this indication can focus on the overall efficiency of port facilities and equipment, pilotage, dispatching, loading and unloading, marshaling and port clearance, and so on.
  • Connection costs: In the hub, as it involves the connection between different transportation modes, the assessment and control of the connection costs can indicate the current situation of the sea–rail hub in regard to providing connection services. The higher the connection cost, the higher the time and cost loss borne by the shipper in the hub for intermodal transit, resulting in a reduction in the cargo attraction of the hub and a decrease in the transportation connection capacity. The high connection cost will inhibit ports and railroads from further open sea–rail intermodal transportation channels and increase the density of the shuttle bus enthusiasm, affecting the formation of a wide range of intermodal transport network hubs and limiting its ability to cover a wider area. In addition, high connection costs mean that the connection between maritime and railroad transportation at the hub is poor, and the cargo transit process is more complicated and takes longer, weakening the continuity of transportation and affecting the overall transportation efficiency and the transportation connection capacity of the hub.
  • Vessel at berth time: The vessel at berth time is the overall length of time from the ship’s arrival at the berth for loading and unloading operations to the completion of operations away from the berth, demonstrating the hub’s technical level and efficiency in container ship handling and transit. The shorter the berthing time, the greater the hub’s transportation connection capacity, meaning that more frequent ship loading and unloading and intermodal railway transportation can be achieved, thus accelerating the development of port services, storage and transit, railway freight, and other related industries. Ships that remain at berth for an extended period of time cause port congestion and disrupt the berthing and departure of other ships, thus limiting the PCITHs’ transportation connection capacity. This indicator primarily represents the efficiency of port loading and unloading activities while berthing.
  • Port rail dedicated line mileage: This is the length of the rail line connecting the port to the rail network, and it is a crucial measure of infrastructure investment in the hub and the density of the rail network. Suppose that the calculation is based on the entire length of railroad lines in the port area. In that case, it may include the length of non-productive function railroads, resulting in inaccurate total mileage, which is difficult to reflect the intermodal railroad conditions truly. For calculating port rail dedicated line mileage, only the length of the railroad lines directly related to the main sea–rail terminals and container operation areas of the port are selected and summed up as the mileage of the port rail dedicated line. The mechanism of the port rail line to the hub is to realize the infrastructure connection of intermodal transportation, expand the coverage of the transportation network, reduce the barrier of cargo transfer, and promote more transportation flow convergence in the hub. The construction of port rail dedicated line mileage also creates conditions for the hub to further connect with more transportation modes and expand its service network, thus allowing the hub’s transportation connection function to be continuously improved.

4.2.3. Resource Integration Capacity

PCITHs frequently necessitate the integration of numerous modes of transportation, as well as information sharing and management via logistics information technology, in order to optimize logistics transportation, improve transportation efficiency, and reduce logistical costs. A vital resource integration enables the hub to actively integrate transportation resources such as ports, railways, and highways in order to better fulfill its role in the distribution and transshipment of goods, to achieve a closer and more efficient transportation combination and connection, and to better fulfill the function of the interface between different modes of transportation. Resource integration includes not only hardware resources but also software resources, such as information systems, technical resources, and management resources. A vital resource integration capability enables the hub to integrate more transportation and related industrial resources in the region, resulting in a strong agglomeration effect and the construction of a transportation network with broader coverage to support regional industrial development. The resource integration capacity reflects the ability of PCITHs to plan and efficiently utilize resources in all areas, including personnel, facilities, information, and systems. The resource integration capacity of PCITHs is examined in four ways, as follows: the degree of resource integration, the level of information construction, the level of inter-port cooperation, and the efficiency of resource utilization.
  • Degree of resource integration: The degree of resource integration determines whether PCITHs can efficiently collect and integrate diverse intermodal elements. Different types of resources in PCITHs have differences and contradictions that must be integrated and coordinated so that these resources can operate together to maximize their benefits. When integrating multiple resources in PCITHs, the degree of resource integration can be defined as the degree of coordination and integration between different types of resources, representing the depth of resource allocation and coordination in the hub. Goods, cars, people, facilities, technology, and so on are examples of resources. The degree of resource integration represents the PCITHs’ capabilities and amount of resource integration. The level of resource integration has a direct impact on the PCITHs’ service capacity and operational efficiency. A high level of resource integration enables more efficient and coordinated operation of the hub’s numerous resources, potentially reducing duplication of operations and resource waste. A low level of resource integration suggests inefficient resource allocation, idle equipment, or other issues that hinder the intermodal hub’s service capacity and efficiency.
  • The level of informatization: The level of information construction can be defined as the hub’s level of investment and development in information technology and systems, and this level reflects the hub’s digital and intelligence level. The level of information construction entails the development of information systems, the gathering, and processing of data, and the sharing and exchange of information. Informatization will be an unavoidable tendency in the development of PCITHs in the future. Technology and information technology play a vital supportive role in the operation and management of PCITHs. Information technology plays a critical role in resource allocation and resource integration. The greater the level of informatization, the greater the hub’s potential to achieve resource digitization and effective integration of digital resources, thus helping to improve the precision and coordination of resource allocation and strengthens the ability to integrate resources. Higher-informatization hubs offer more significant potential for digital operation and service innovation. To maintain its competitive edge, PCITHs must accelerate the process of informatization, build smart ports and intelligent logistics, establish a data center and operational ecosystem, and promote the transformation of the traditional business into a digital business.
  • Level of inter-port cooperation: The level of inter-port cooperation of PCITHs can be understood as the degree of cooperation between the hub and other ports in other regions regarding resource sharing, information exchange, and business collaboration, which reflects the hub’s ability to expand its cooperation network and improve resource utilization. A higher level of inter-port cooperation indicates that the hub can integrate port resources on a broader scale, which helps the hub to continuously expand the scale of resource integration, improve the comprehensive effect of resource allocation, and enhance its resource integration capability. A high level of inter-port cooperation also means that it is possible to create synergies between resources and markets in the broader area, which is conducive to hubs working with neighboring ports to change regional market patterns, building a more comprehensive coverage transportation network with neighboring ports, and achieving synergies between resources and business on a larger scale, which is conducive to hubs generating more significant economies of scale.
  • Resource utilization efficiency: Resource utilization efficiency refers to a specific period of time, the hub of various types of resources in the production and operation activities generated by the advantages. It is a key metric for assessing the extent and efficiency of resource utilization. A high level of resource utilization efficiency indicates that the hub’s various resources have had a high synergistic effect on the production and operation process, which is conducive to the hub’s continuous deepening of resource integration, improving the scientific nature of resource allocation and efficiency of resource utilization, and enhancing resource integration capacity. The operating-revenue-to-operating-cost ratio of each research object in 2021 is employed in this work. Improving resource utilization efficiency in PCITHs can effectively boost the resource integration capacity and operational scale capacity.

4.3. Data Sources

In this paper, Tianjin Port, Ningbo Zhoushan Port, Qingdao Port, Guangzhou Port, and Xiamen Port are taken as the research objects, the research ports are taken as five things to be evaluated, the 13 indicators selected above are taken as 13 characteristics, the data of each port hub in 2021 are selected for the research, and the corresponding indicator data are taken as the characteristic values. The quantitative indicators were obtained by consulting the official websites of the relevant ports, statistical yearbooks, and relevant government data and statistics websites to find out the indicator data of the study ports. In order to better explore the influence of qualitative indicators on the service capability of PCITHs, this paper adopts an expert consultation scoring method for this issue, as accurate numbers cannot measure qualitative indicators. Five experts and scholars in intermodal transportation, port operation, and management were invited to score the qualitative evaluation indexes of service capability based on their professional knowledge and experience. To this end, this paper designs a questionnaire on the performance rating of qualitative indicators of five evaluation subjects. It divides nine different performance ratings to analyze the qualitative indicators quantitatively. The comments of the qualitative indicators were divided into nine levels (excellent, great, very good, good, average, poor, very poor, specially poor, and extremely poor). The related levels corresponded to the interval of [1, 9], corresponding to the scores of {9, 8, 7, 6, 5, 4, 3, 2, 1}. After obtaining the comments of five experts, we transformed their comments into the corresponding score cases; several experts’ evaluation opinions were combined using the arithmetic mean method. The final data of all indicators of PCITHs were obtained, as shown in Table 4, and then the weights of different indicators could be calculated.

5. Results and Discussion

Based on the rationale of the G1 method, a panel of five domain experts with in-depth knowledge and experience in the subject was first consulted to rank each indicator according to its importance in the overall evaluation. Through iterative discussions among the panel, a unique ranking was determined, and this ranking process ensured that the most relevant and essential metrics were prioritized, thereby increasing the validity and reliability of the research results. Specifically, to establish a unique ranking relationship, the expert group first selected the most relevant and essential indicators from the ( X 1 X 13 ) set and then selected the most critical remaining indicators from the remaining 11 indicators, and so on, until all 13 indicators were ranked. At the end of this process, a unique sequential relationship was determined, representing the expert panel’s collective assessment of the importance of the indicators. After establishing the unique sequential relationship, the panel discussed the proportion of importance between adjacent indicators. This step is critical because it provides a nuanced understanding of the relative importance of adjacent indicators. To facilitate the discussion, the expert group referred to the reference table of relative importance in Table 5. After this deliberation, the expert group arrived at an importance distribution for each indicator, as shown following:
X 4 > X 1 > X 9 > X 5 > X 3 > X 2 > X 6 > X 8 > X 12 > X 10 > X 11 > X 7 > X 13
According to the relative importance values of the indicators obtained in Table 5, the subjective weights of each indicator can be obtained by combining Equations (3) and (4), and the results are shown in Table 6.
The objective weights were subsequently determined by the improved CRITIC method. Based on the initial data of indicators, the criteria matrix, B , was established by Equations (6) and (7).
B = 0.66 1 0.54 0.07 0 0.49 1 0.63 0.06 0 1 0.11 0.4 0 0.01 0.3 0.48 1 0.73 0 1 0.5 0 0 0 0 0.48 0.35 0.83 1 0.5 0.75 1 0.5 0 0.66 0.51 0 1 0.69 0.26 0.14 1 0.15 0 1 0.5 0.5 0 0.5 1 1 0.5 0 1 1 0.5 0.5 0 0 0.48 1 0.15 0.17 0
Equations (8) and (9) are used to calculate the coefficient of variation ( v j ) and the conflict coefficient ( C j ), and finally, the objective weights are obtained by Equation (12), as shown in Table 6.
The subjective and objective weights of the PCITHs service capacity evaluation indicator system obtained from the G1 subjective weighting method and the improved CRITIC objective weighting method are combined with Equations (13)–(16) to obtain subjective and objective weighting coefficients ( b 1 = 0.1 , b 2 = 0.9 ) based on the idea of game theory. Finally, the combination weights are obtained by game theory, as shown in Table 6, and the subjective weights, objective weights, and combination weights are compared.
In order to compare the weight calculation results more clearly, the weight results from Table 6 were visualized to obtain a radar plot of the weighting results, as shown in Figure 2.
Combined with the table of weighting results (Table 6) and the radar chart of indicator weights in Figure 2, the weights of radiation scale capacity ( Z 1 ), transportation connection capacity ( Z 2 ), and resource integration capacity ( Z 3 ) are 0.6423, 0.2613, and 0.0964, respectively, indicating that the radiation scale capacity is the core factor affecting the service capacity of PCITHs, meaning that it is the key to improving PCITHs. This means that the key to improving the service capacity of PCITHs lies in the improvement of the radiation scale capacity. From the weights of the secondary evaluation indicators, the four indicators of container sea–rail transportation volume ( X 1 ), sea–rail container handling capacity ( X 2 ), number of sea–rail transportation lines ( X 4 ), and port rail dedicated line mileage ( X 9 ) have greater weights compared to other indicators, and among the four indicators with greater influence, most of them are PCITHs’ infrastructure related to sea–rail intermodal transportation. This indicates that the infrastructure service capacity of PCITHs has a more significant impact and validates why most intermodal operations are carried out at sizeable integrated hub ports, which are supported by good infrastructure. In the future, when planning and building the service capacity of PCITHs, we should pay attention to the development of these aspects and make corresponding improvements to improve the service capacity of PCITHs and promote the rapid and efficient development of intermodal hubs.
After assigning weights to the service capability evaluation indicators, an affiliation matrix is first established. The data relating to the service capability of PCITHs are processed using Equations (6) and (7) to establish an affiliation matrix, R n m ~ . The optimal fuzzy element, R n 0 , takes the maximum value of the affiliation degree; i.e., the optimal fuzzy element has an indicator with an affiliation degree of 1, and the optimal fuzzy element R n 0 is constructed.
After this, we need to construct the difference squared conforming fuzzy object element. According to Equation (21), to calculate the difference squared value between each evaluation object fuzzy object element and each indicator of the optimal fuzzy object element, and in order to construct the difference squared composite fuzzy object element, R , we get R as follows:
R Δ = 0.12 0 0.21 0.87 1 0.26 0 0.14 0.89 1 0 0.79 0.36 1 0.98 0.49 0.27 0 0.07 1 0 0.25 1 1 1 1 0.27 0.43 0.03 0 0.25 0.06 0 0.25 1 0.11 0.24 1 0 0.09 0.55 0.74 0 0.72 1 0 0.25 0.25 1 0.25 0 0 0.25 1 0 0 0.25 0.25 1 1 0.27 0 0.72 0.68 1
Finally, the Euclidean proximity needs to be calculated. The Euclidean proximity, d H j , between each port hub and the optimal thing is calculated according to Equation (22) by combining the composite weights of the indicators obtained through game theory with the difference-squared composite fuzzy elements, which represent the service capability evaluation value of each port-type sea–rail hub. The Euclidean proximity composite fuzzy element, R d H , for the service capacity is obtained as follows:
R d H = 0.4706 0.4681 0.4923 0.1842 0.0677
The service capability of the analyzed PCITHs is Tianjin Port > Ningbo Zhoushan Port > Qingdao Port > Guangzhou Port > Xiamen Port based on the magnitude of Euclidean closeness. Tianjin Port, as one of North China’s main ports, provides a convenient transit network and a diverse market. Its railway network is more developed, with several railway trunk lines and branch lines closely connected to Tianjin Port, and its railway radiation range has more obvious advantages than Qingdao Port and Ningbo Zhoushan Port, as well as a closer connection with the inland; Ningbo Zhoushan Port is one of China’s major ports, and its container throughput is among the top in China, and it has obvious advantages. The port of Xiamen is near the bottom of the list, and its current position is examined. The port of Xiamen is constrained by limited land resources, the resources available to the port are diminishing, and a lack of resource integration has hampered the port’s expansion and development of its business. Moreover, there are shortcomings in the construction of fixed facilities, which affect the development of sea–rail intermodal transportation, and in the face of competitors such as Yangtze River ports and Pearl River Delta ports. Price, operational efficiency, and comprehensive service capability are all under strain.
A comprehensive approach for evaluating a PCITHs’ service capacity analyzes not only the service capacity but also its future development. To address this issue, we diagnose and identify the barrier factors affecting the development of the service capacity of PCITHs based on an assessment of the service capacity of the five major port hubs, and we identify and analyze the top three indicator layer barrier factors to investigate the current impediments. The principal obstruction factors for each port were determined using Equations (23) and (24), and they are displayed in Table 7. The barrier degrees of all indicators for each evaluation object are shown in Table A1.
As can be seen in Figure 3 and Table 7, the five largest indicators affecting the degree of barriers to service capacity development in the five major port hubs are container sea–rail transportation volume ( X 1 ), sea–rail container handling capacity ( X 2 ), number of productive berths of 10,000 tons and above ( X 3 ), number of sea–rail transportation lines ( X 4 ), vessel at berth time ( X 8 ), and port rail dedicated line mileage ( X 9 ).
In order to address the issue of the lack of productive berths of 10,000 tons and above, choose suitable sites for berth construction, give priority to the development of deep-water berths to ensure the demand for capacity under the trend of larger ships, optimize berth scheduling, fairly allocate berth resources, and improve berth utilization, increase the number of berths by adopting harbor–pool separation and artificial island construction, and renovate existing berths to improve berth utilization. Technology advancements are used to meet the need for bigger vessels. To improve the number of sea–rail transportation lines and the port rail dedicated line mileage, the hubs need to strengthen cooperation with railroad management and transportation companies to promote the opening of new sea–rail intermodal trains and expand the coverage and frequency of the trains; support and encourage port operators to cooperate with logistics companies and railroad companies to establish a stable sea–rail intermodal transportation network; strengthen information sharing and coordination mechanisms to improve the scheduling and operational efficiency of sea–rail intermodal trains; further improve the connection between special railroad lines and ports; and increase the safety stopping of the trains. Considering the problems of the port rail dedicated line mileage, we can increase the investment in the port railroad line; increase the construction scale and mileage of the line; expand the model of the train; improve the capacity of a single train; optimize the layout and design of the line to ensure a close and efficient connection with the port and improve the transportation efficiency; strengthen the cooperation with the railroad management department; coordinate and solve the problems and issues in the construction of the line and speed up the construction progress of the line; and renovate and upgrade the existing port railroad line to improve the transportation capacity, such as increasing the number of tracks, upgrading the signal system, and other measures. The container sea–rail transportation volume in the five major ports urgently needs upgrading, and the container sea–rail intermodal transport handling capacity needs to catch up, which aligns with the actual situation. The volume of container sea–rail intermodal transport represents, to a certain extent, the level of sea–rail intermodal transport development in the region, and the sea–rail intermodal transport business needs to be given high priority. To improve the volume of container sea–rail intermodal transport, we need to improve the infrastructure, expand the width of the network, improve the operational efficiency, increase the customer base, optimize the pricing strategy, and strengthen marketing and publicity. These interdependent aspects constitute a system to improve the volume of sea–rail intermodal transport, which needs to be systematically promoted and improved to produce synergistic effects.
In summary, improving the service capacity of PCITHs requires systematic consideration of hub and facility configuration, operation mechanism, infrastructure, information technology, etc., and strengthening the synergy and optimization between these elements, which is conducive to the role of hub ports in promoting regional economic development. The above suggestions are only some possible solutions to the problem. However, they also need to be combined with the actual situation of specific analysis, the development of practical improvement measures, and actively take targeted measures to improve the sea–rail intermodal transportation infrastructure and operational services to further play the function of the port intermodal transportation hub.
In this paper, we select the service capability evaluation indicators of PCITHs mainly for sea–rail intermodal transportation and choose the evaluation dimensions from the perspective of functions so that we can compare the competitiveness with rival ports for each function, find out the advantages and shortcomings, and provide the basis for improving the competitiveness. This is beneficial to the positioning of the port; the port should be clear about its main functions and business direction to achieve differentiated development. The core function of PCITHs is to provide services such as cargo aggregation, interchange, and transportation mode connection so that the selection of evaluation indexes from the perspective of these primary functions can reflect the port’s business level and service capability more comprehensively. The multidimensional function performance can portray the service capability comprehensively and accurately. For example, policy improvement can enhance the volume of container sea–rail intermodal transport, increase the frequency of intermodal transport, develop new routes, etc. The three evaluation dimensions selected in this paper can comprehensively reflect the comprehensive ability of PCITHs to provide cargo transportation services, thus helping us make an objective assessment of the overall operation level of the hubs and better identify the problems in the operation of the hubs so that we can propose targeted improvement measures to improve the operational efficiency of the hubs. The indicators of these three dimensions are complementary, thus helping to form a more complete and systematic evaluation system and providing strong support for optimizing and upgrading PCITHs.
PCITHs is a relatively complete and complex system, which often encounters problems of randomness, fuzziness, and incomplete statistics of evaluation factors in the evaluation process. The fuzzy matter element method is very suitable for solving the problems of fuzzy indicators and correlation of evaluation indicators of such complex systems, and the fuzzy matter element method is superior to other methods. At the same time, we consider the disadvantage that the weight determination of the fuzzy matter element method is too subjective and affects the evaluation results, so we use the G1-improved CRITIC combination weighting determination method based on game theory, which considers both the numerical logic of indicators and the importance of experts to different indicators and finds the Nash equilibrium point through the game theory method to make the weight more scientific and accurate. Moreover, compared with the general evaluation results, which only illustrate the overall situation of the evaluation objects, this paper addresses the incomplete evaluation process. It illustrates the indicators that each evaluation object urgently needs to improve with the barrier degree model, which makes the analysis results more scientific and provides targeted directions for decision-makers.

6. Conclusions

This research presents an assessment approach for the service capability of PCITHs. The assessment indicators system essentially consists of three aspects: radiation scale capacity, transit connection capacity, and resource integration capacity. Based on the fuzzy element analysis, the Euclidean closeness of each port to be evaluated is combined with the Euclidean closeness of the optimal, and the combined weights are determined by the G1 weighting method based on game theory and the improved CRITIC weighting method, which does not only avoid the uncertainty of the weights due to subjective judgments but also reflects the relative importance of each evaluation indicator in the evaluation and, at the same time, does so on the basis of its service capacity. Based on the assessment of the service capacity, the barrier degree model is used to determine the barrier causes. Barrier degrees impact service capability, which offers a reference for focused improvement. This assessment approach may objectively, thoroughly, and scientifically evaluate the service capability of PCITHs, and give decision support for the development of PCITHs. The service capacity of PCITHs is evaluated through the evaluation indicator system of three aspects, namely radiation scale capacity, transportation connection capacity, and resource integration capacity, and then the service capacity of Tianjin Port > Ningbo Zhoushan Port > Qingdao Port > Guangzhou Port > Xiamen Port is obtained. After identifying and analyzing the barrier factors, we determined that the number of sea–rail transportation trains, the connection time, and the degree of integration of resource structure are the three factors with the highest barrier degree, and the future planning counter-war should focus on improving these factors.
There are still some limitations in this study. Firstly, the evaluation indexes and weights selected during the establishment of the research model may be subjective, which may affect the objectivity and reliability of the evaluation results. In the subsequent research, the evaluation index system should be enriched, and more influencing factors should be considered, such as the supporting role of the hinterland to the hub, the coverage of the hub transportation network, the information processing system, the specific situation of the container for articulation at the hub, etc. Secondly, the perspective of this paper is to evaluate the main functions of PCITHs in highlighting their “intermodal transportation” and “hub” status. In the future, it is necessary to broaden the research perspective to examine the service capacity of PCITHs in the overall transportation network, taking into account the relationship between PCITHs and hinterland cities and regional transportation networks, in addition to the service capacity perception of users and ecological benefits. In this paper, averaging the data obtained from expert consultation in determining the weights of qualitative indicators has certain limitations, and the weights assigned to each expert should be considered in the future to determine the weights more scientifically. This study adopted the fuzzy matter element analysis combined with Euclidean proximity to quantify the service capability, and this approach has its limitations; for example, it can only analyze the overall service capability but not express the capability trend of each indicator well, and it is difficult to analyze each service capability dimension. We will consider extending and improving the model in the future so that the evaluation results can fully reflect the overall service capability and each dimension of service capability. The future will consider extending and improving the model so that the evaluation results can fully reflect the overall service capability and each dimension of service capability.

Author Contributions

Conceptualization, T.L. and H.W.; methodology, T.L.; formal analysis, T.L. and H.W.; investigation, T.L.; data curation, T.L. and H.W.; writing—original draft preparation, T.L.; writing—review and editing, H.W.; supervision, H.W. All authors have read and agreed to the published version of the manuscript.

Funding

The research is financially supported by the National Natural Science Foundation of China (52272423).

Institutional Review Board Statement

Not applicable.

Informed Consent Statement

Not applicable.

Data Availability Statement

Not applicable.

Acknowledgments

The authors would like to express their special appreciation to all participants joining this study. We also thank the editors and the anonymous reviewers for their constructive suggestions on improving the paper.

Conflicts of Interest

The authors declare no conflict of interest.

Appendix A

Table A1. Degree of service capacity indicator barriers for different evaluation hubs (%).
M 1 M 2 M 3 M 4 M 5
X 1 13.42020.1921.8319.73
X 2 20.39016.6122.6220.16
X 3 024.9416.6614.7212.27
X 4 21.8918.5205.1515.88
X 5 04.649.174.884.10
X 6 8.905.286.580.920
X 7 0.930.5300.560.94
X 8 4.527.5215.0902.08
X 9 25.2133.55017.3817.19
X 10 03.143.103.301.39
X 11 002.022.150
X 12 01.881.861.981.66
X 13 4.7408.714.514.59
Note: The data in this table are presented as “%”; the data are retained in the form of four decimal places.

References

  1. Lin, C.-C.; Lin, S.-W. Two-stage approach to the intermodal terminal location problem. Comput. Oper. Res. 2016, 67, 113–119. [Google Scholar] [CrossRef]
  2. Han, B.; Wan, M.; Zhou, Y.; Su, Y. Evaluation of multimodal transport in China based on hesitation fuzzy multiattribute decision-making. Math. Probl. Eng. 2020, 2020, 1823068. [Google Scholar] [CrossRef]
  3. Mathisen, T.A.; Hanssen, T.-E.S. The academic literature on intermodal freight transport. Transp. Res. Procedia 2014, 3, 611–620. [Google Scholar] [CrossRef] [Green Version]
  4. Vidović, M.; Zečević, S.; Kilibarda, M.; Vlajić, J.; Bjelić, N.; Tadić, S. The p-hub model with hub-catchment areas, existing hubs, and simulation: A case study of Serbian intermodal terminals. Netw. Spat. Econ. 2011, 11, 295–314. [Google Scholar] [CrossRef]
  5. Zhou, J.; Jiang, Y.; Shen, Y.; Pantelous, A.A.; Liu, Y.; Huang, C.; Mei, L. Intermodal hub-and-spoke logistic network design with differentiated services: The case of China Railway Express. Inf. Sci. 2022, 612, 796–815. [Google Scholar] [CrossRef]
  6. Li, X.-j.; Zhou, R.; Zhu, L.-q. Multi-modal Transport International Experience and Reference to China. In Proceedings of the 2022 41st Chinese Control Conference (CCC), Hefei, China, 25–27 July 2022; pp. 7526–7531. [Google Scholar]
  7. Zhaoa, S.; Ashrafb, M.A. Study on optimization of multimodal transportation of marine container considering carbon emission. Desalination Water Treat. 2021, 219, 84–89. [Google Scholar] [CrossRef]
  8. Abu Aisha, T.; Ouhimmou, M.; Paquet, M.; Montecinos, J. Developing the seaport container terminal layout to enhance efficiency of the intermodal transportation system and port operations—Case of the Port of Montreal. Marit. Policy Manag. 2022, 49, 181–198. [Google Scholar] [CrossRef]
  9. Chen, G.; Cheung, W.; Chu, S.-C.; Xu, L. Transshipment hub selection from a shipper’s and freight forwarder’s perspective. Expert Syst. Appl. 2017, 83, 396–404. [Google Scholar] [CrossRef]
  10. Martínez-López, A.; Chica González, M. Articulating intermodal chains through short-sea shipping: A method for assessing the performance of East African ports. Marit. Policy Manag. 2023, 50, 235–253. [Google Scholar] [CrossRef]
  11. Wang, J.; Yang, Y.; Sun, D. Multimodal Transport Hub and Developing Situation in China. China Transp. Rev. 2016, 38, 42–45+54. [Google Scholar]
  12. Bouchery, Y.; Woxenius, J.; Fransoo, J.C. Identifying the market areas of port-centric logistics and hinterland intermodal transportation. Eur. J. Oper. Res. 2020, 285, 599–611. [Google Scholar] [CrossRef]
  13. Wang, G.W.; Zeng, Q.; Li, K.; Yang, J. Port connectivity in a logistic network: The case of Bohai Bay, China. Transp. Res. Part E Logist. Transp. Rev. 2016, 95, 341–354. [Google Scholar] [CrossRef]
  14. Nan, Y. Discussion on countermeasures for the development of port container rail-water intermodal transportation in China under the new situation. Railw. Transp. Econ. 2021, 43, 35–41. [Google Scholar]
  15. Liu, C.; Geng, Y.; Wu, H.; Yuan, Z.; Ge, B.; Li, Y.; Wang, R.; Xu, X.; Geng, Z. Build a Path of Integrated and Intelligent Low-Carbon Waterway Transportation System. In Advances in Intelligent Systems, Computer Science and Digital Economics IV; Springer: Berlin/Heidelberg, Germany, 2023; Volume 158, pp. 558–572. [Google Scholar]
  16. Yu, N.; Jiao, W. Comparative study on reasonable proportion of container rail-water intermodal transport between China and America. In Proceedings of the 2nd International Conference on Internet of Things and Smart City (IoTSC 2022), Xiamen, China, 18–20 February 2022; pp. 936–941. [Google Scholar]
  17. Teye, C.; Bell, M.G.H.; Bliemer, M.C.J. Urban intermodal terminals: The entropy maximising facility location problem. Transp. Res. Part B Methodol. 2017, 100, 64–81. [Google Scholar] [CrossRef]
  18. Wu, H.; Liu, G. Container sea-rail transport volume forecasting of Ningbo port based on combination forecasting model. In Proceedings of the International Conference on Advances in Energy, Environment and Chemical Engineering, Changsha, China, 26–27 September 2015; pp. 449–454. [Google Scholar]
  19. Pencheva, V.; Asenov, A.; Sladkowski, A.; Ivanov, B.; Georgiev, I. Current Issues of Multimodal and Intermodal Cargo Transportation. In Modern Trends and Research in Intermodal Transportation; Springer: Berlin/Heidelberg, Germany, 2022; pp. 51–124. [Google Scholar]
  20. Nam, H.-S.; Song, D.-W. Defining maritime logistics hub and its implication for container port. Marit. Policy Manag. 2011, 38, 269–292. [Google Scholar] [CrossRef]
  21. Fang, X.; Cao, C.; Chen, Z.; Chen, W.; Ni, L.; Ji, Z.; Gan, J. Using mixed methods to design service quality evaluation indicator system of railway container multimodal transport. Sci. Prog. 2020, 103, 0036850419890491. [Google Scholar] [CrossRef]
  22. Li, H.; Wang, Y. Hierarchical Multimodal Hub Location Problem with Carbon Emissions. Sustainability 2023, 15, 1945. [Google Scholar] [CrossRef]
  23. Ližbetin, J. Methodology for determining the location of intermodal transport terminals for the development of sustainable transport systems: A case study from Slovakia. Sustainability 2019, 11, 1230. [Google Scholar] [CrossRef] [Green Version]
  24. Jakara, M.; Brnjac, N. Foliated Transport Networks in Intermodal Freight Transport. Sustainability 2023, 15, 7384. [Google Scholar] [CrossRef]
  25. Li, L.; Wang, J.; Wang, H.; Jin, X.; Du, L. Intermodal transportation hub location optimization with governments subsidies under the Belt and Road Initiative. Ocean Coast. Manag. 2023, 231, 106414. [Google Scholar] [CrossRef]
  26. Basallo-Triana, M.J.; Vidal-Holguín, C.J.; Bravo-Bastidas, J.J. Planning and design of intermodal hub networks: A literature review. Comput. Oper. Res. 2021, 136, 105469. [Google Scholar] [CrossRef]
  27. Mokhtar, H.; Redi, A.P.; Krishnamoorthy, M.; Ernst, A.T. An intermodal hub location problem for container distribution in Indonesia. Comput. Oper. Res. 2019, 104, 415–432. [Google Scholar] [CrossRef] [Green Version]
  28. Rodrigue, J.-P.; Ashar, A. Transshipment hubs in the New Panamax Era: The role of the Caribbean. J. Transp. Geogr. 2016, 51, 270–279. [Google Scholar] [CrossRef]
  29. Low, J.M.; Lam, S.W.; Tang, L.C. Assessment of hub status among Asian ports from a network perspective. Transp. Res. Part A Policy Pract. 2009, 43, 593–606. [Google Scholar] [CrossRef]
  30. Yang, Y.-C.; Chen, S.-L. Determinants of global logistics hub ports: Comparison of the port development policies of Taiwan, Korea, and Japan. Transp. Policy 2016, 45, 179–189. [Google Scholar] [CrossRef]
  31. Angelini, A.; Elias, D.; Hauger, G.; Nadler, B.; Nadler, F. Assessment System for the Optimization of Logistical, Operational and Administrative Processes at Multimodal Hubs. IOP Conf. Ser. Mater. Sci. Eng. 2019, 471, 062003. [Google Scholar] [CrossRef]
  32. Lu, H.; Li, L.; Zhao, X.; Cook, D. A model of integrated regional logistics hub in supply chain. Enterp. Inf. Syst. 2018, 12, 1308–1335. [Google Scholar] [CrossRef]
  33. Liao, Z.; Zhou, Z. A Study on Classification of Guangxi Multimodal Transport Hub Based on Cluster Analysis. In Proceedings of the 6th International Conference on Mechatronics, Computer and Education Informationization (MCEI 2016), Shenyang, China, 11–13 November 2016; pp. 208–212. [Google Scholar]
  34. Huber, S.; Klauenberg, J.; Thaller, C. Consideration of transport logistics hubs in freight transport demand models. Eur. Transp. Res. Rev. 2015, 7, 32. [Google Scholar] [CrossRef] [Green Version]
  35. Kreutzberger, E.; Konings, R. The challenge of appropriate hub terminal and hub-and-spoke network development for seaports and intermodal rail transport in Europe. Res. Transp. Bus. Manag. 2016, 19, 83–96. [Google Scholar] [CrossRef]
  36. Alumur, S.A.; Kara, B.Y.; Karasan, O.E. Multimodal hub location and hub network design. Omega Int. J. Manag. Sci. 2012, 40, 927–939. [Google Scholar] [CrossRef] [Green Version]
  37. Wan, M.; Kuang, H.; Yu, Y.; Zhang, R. Evaluation of the competitiveness of the container multimodal port hub. Sci. Rep. 2022, 12, 19334. [Google Scholar] [CrossRef] [PubMed]
  38. Zhang, L.; Qu, S.; Dai, J. Port capability evaluation from the perspective of supply chain. Discret. Dyn. Nat. Soc. 2021, 2021, 7633202. [Google Scholar] [CrossRef]
  39. Nguyen, T.Q.; Ngo, L.T.T.; Huynh, N.T.; Quoc, T.L.; Hoang, L.V. Assessing port service quality: An application of the extension fuzzy AHP and importance-performance analysis. PloS ONE 2022, 17, e0264590. [Google Scholar] [CrossRef] [PubMed]
  40. Xia, Y. Study on Evaluation of Port Logistics Service Capability of Qinhuangdao. In Proceedings of the 2nd Asia-Pacific Conference on Image Processing, Electronics and Computers, Dalian, China, 14–16 April 2021; pp. 268–272. [Google Scholar]
  41. Huang, M. Research on the Comprehensive Capacity Evaluation of Multimodal Transportation in China’s Ports Under the Background of Railway Transportation. In Proceedings of the 2020 International Conference on Wireless Communications and Smart Grid (ICWCSG), Qingdao, China, 12–14 June 2020; pp. 282–291. [Google Scholar]
  42. Yang, Q.; Wu, J.; Su, B. Study on function evaluation and development directions of Chinese ports. IOP Conf. Ser. Mater. Sci. Eng. 2019, 688, 044001. [Google Scholar] [CrossRef]
  43. Chuanlei, W.; Chunmeng, Z.; Yin, D. Research on Quality Construction of National Logistics Hub in Yangtze River Delta Based on DPSIR Model. Int. J. Data Sci. Technol. 2022, 8, 1–13. [Google Scholar] [CrossRef]
  44. Ren, J.; Dong, L.; Sun, L. Competitiveness prioritisation of container ports in Asia under the background of China’s Belt and Road initiative. Transp. Rev. 2018, 38, 436–456. [Google Scholar] [CrossRef]
  45. Ji, G.; Wang, W.; Feng, W. A study on service competence and competitiveness of port logistics. In Proceedings of the 2010 7th International Conference on Service Systems and Service Management, Tokyo, Japan, 28–30 June 2010; pp. 1–6. [Google Scholar]
  46. Abramović, B.; Lovrić, I.; Stupalo, V. Analysis of intermodal terminals service quality in the republic of Croatia. Promet-Traffic Transp. 2012, 24, 253–260. [Google Scholar] [CrossRef]
  47. Agatić, A.; Kolanović, I. Improving the seaport service quality by implementing digital technologies. Pomorstvo 2020, 34, 93–101. [Google Scholar] [CrossRef]
  48. Ge, J.; Wang, X.; Shi, W.; Wan, Z. Investigating the practices, problems, and policies for port sea—Rail intermodal transport in China. Transp. Res. Rec. 2020, 2674, 33–44. [Google Scholar] [CrossRef]
  49. Feng, X.J.; Fan, X.J.; Zhang, Y.; Jiang, L.P. Sensitivity analysis on key factors of sea-rail intermodal transport system of dry bulk. Appl. Mech. Mater. 2014, 641, 715–720. [Google Scholar] [CrossRef]
  50. Schönemann, R. Integrating railway services into the supply chain at the last mile of the transshipment interface seaport-rail. Logistyka 2010, 4, CD-CD. [Google Scholar]
  51. Dotoli, M.; Fanti, M.P.; Mangini, A.M.; Stecco, G.; Ukovich, W. The impact of ICT on an Intermodal Transportation System: An analysis by Petri Nets. In Proceedings of the 2009 IEEE International Conference on Automation Science and Engineering, Bangalore, India, 22–25 August 2009; pp. 513–518. [Google Scholar]
  52. Lee, S.-Y.; Tongzon, J.L.; Chang, Y.-T. Assessing port service quality by process component: The case of Korean and Chinese ports. Int. J. Shipp. Transp. Logist. 2013, 5, 137–154. [Google Scholar] [CrossRef]
  53. Wang, T.-C.; Pham, Y.T.H. An Application of Cluster Analysis Method to Determine Vietnam Airlines’ Ground Handling Service Quality Benchmarks. J. Adv. Transp. 2020, 2020, 4156298. [Google Scholar] [CrossRef]
  54. De Ona, J.; de Ona, R.; Lopez, G. Transit service quality analysis using cluster analysis and decision trees: A step forward to personalized marketing in public transportation. Transportation 2016, 43, 725–747. [Google Scholar] [CrossRef]
  55. Zhou, H.; Li, Y.; Gu, Y. Research on evaluation of airport service quality based on improved AHP and Topsis methods. Proc. Inst. Civ. Eng. Transp. 2021, 174, 267–278. [Google Scholar] [CrossRef]
  56. Huang, M.-J.; Huang, W.-C.; Teng, J.-Y.; Wu, S.-C. Competitiveness evaluation for Eastern Asian container ports by using grey relational analysis method. J. Grey Syst. 2002, 14, 139–150. [Google Scholar]
  57. Hu, X.; Chen, X.; Zhao, J.; Yu, K.; Long, B.; Dai, G. Comprehensive Service Quality Evaluation of Public Transit Based on Extension Cloud Model. Arch. Transp. 2022, 61, 103–115. [Google Scholar] [CrossRef]
  58. Lv, H.; Guan, X.; Meng, Y. Comprehensive evaluation of urban flood-bearing risks based on combined compound fuzzy matter-element and entropy weight model. Nat. Hazards 2020, 103, 1823–1841. [Google Scholar] [CrossRef]
  59. Huang, W.; Shuai, B.; Sun, Y.; Wang, Y.; Antwi, E. Using entropy-TOPSIS method to evaluate urban rail transit system operation performance: The China case. Transp. Res. Part A Policy Pract. 2018, 111, 292–303. [Google Scholar] [CrossRef]
  60. Xiaoning, Z.; Xiudan, L. Multi-hierarchy Fuzzy Comprehensive Evaluation for Quality of Station Freight Service Based on AHP. In Proceedings of the 2010 International Conference on Intelligent System Design and Engineering Application, Changsha, China, 13–14 October 2010; pp. 972–975. [Google Scholar]
  61. Yan, B.; Zhu, X.; Lee, D.-H.; Jin, J.G.; Wang, L. Transshipment operations optimization of sea-rail intermodal container in seaport rail terminals. Comput. Ind. Eng. 2020, 141, 106296. [Google Scholar] [CrossRef]
  62. Rao, C.; Goh, M.; Zhao, Y.; Zheng, J. Location selection of city logistics centers under sustainability. Transp. Res. Part D Transp. Environ. 2015, 36, 29–44. [Google Scholar] [CrossRef]
  63. Tao, J.; Sun, X.-H.; Cao, Y.; Ling, M.-H. Evaluation of water quality and its driving forces in the Shaying River Basin with the grey relational analysis based on combination weighting. Environ. Sci. Pollut. Res. 2022, 29, 18103–18115. [Google Scholar] [CrossRef] [PubMed]
  64. Wang, J.; Pang, W.; Wang, L.; Pang, X.; Yokoyama, R. Synthetic Evaluation of Steady-state Power Quality Based on Combination Weighting and Principal Component Projection Method. CSEE J. Power Energy Syst. 2017, 3, 160–166. [Google Scholar] [CrossRef]
  65. Gang, L.; Jianping, L.; Xiaolei, S.; Meng, Z. Research on a combined method of subjective-objective weighing and the its rationality. Manag. Rev. 2017, 29, 17–26+61. [Google Scholar]
  66. Dou, J.; Ma, H.; Yang, J.; Zhang, Y.; Guo, R. An Improved Power Quality Evaluation for LED Lamp Based on G1-Entropy Method. IEEE Access 2021, 9, 111171–111180. [Google Scholar] [CrossRef]
  67. Shuqiang, Z.; Shanfa, T. Comprehensive evaluation of transmission network planning scheme based on improved analytic hierarchy process, CRITIC method and TOPSIS. Electr. Power Autom. Equip. 2019, 39, 143–148. [Google Scholar]
  68. Feng, Y.; Lang, K.; Zhang, Y.; Xing, S. Optimal selection model for life emergency rescue ship based on game theory and VIKOR method. In Proceedings of the 6th International Conference on Electromechanical Control Technology and Transportation (ICECTT 2021), Chongqing, China, 14–16 May 2022; pp. 1039–1048. [Google Scholar]
  69. Liu, M.; Fu, S. Comprehensive evaluation and research of the rural logistics capability in Hebei province. In Proceedings of the 2015 International Conference on Logistics, Informatics and Service Sciences (LISS), Barcelona, Spain, 27–29 July 2015; pp. 1–5. [Google Scholar]
  70. Jing, L.; Yao, W. A safety assessment of China’s crude oil import Based on G1 method. Procedia Soc. Behav. Sci. 2013, 96, 1738–1744. [Google Scholar] [CrossRef] [Green Version]
  71. Lu, H.; Zhao, Y.; Zhou, X.; Wei, Z. Selection of agricultural machinery based on improved CRITIC-entropy weight and GRA-TOPSIS method. Processes 2022, 10, 266. [Google Scholar] [CrossRef]
  72. Zhu, D.; Wang, R.; Duan, J.; Cheng, W. Comprehensive weight method based on game theory for identify critical transmission lines in power system. Int. J. Electr. Power Energy Syst. 2021, 124, 106362. [Google Scholar] [CrossRef]
  73. Han, H.; Li, H.; Zhang, K. Urban Water Ecosystem Health Evaluation Based on the Improved Fuzzy Matter-Element Extension Assessment Model: Case Study from Zhengzhou City, China. Math. Probl. Eng. 2019, 2019, 7502342. [Google Scholar] [CrossRef]
  74. Zhou, Y.; Wang, J.; Gao, J.; Jialing, R. Evaluation and obstacle factor diagnoses of low carbon transport development based on DPSIR: A case study of Beijing. Ecol. Econ. 2020, 4, 13–18. [Google Scholar]
  75. Wang, D.; Li, Y.; Yang, X.; Zhang, Z.; Gao, S.; Zhou, Q.; Zhuo, Y.; Wen, X.; Guo, Z. Evaluating urban ecological civilization and its obstacle factors based on integrated model of PSR-EVW-TOPSIS: A case study of 13 cities in Jiangsu Province, China. Ecol. Indic. 2021, 133, 108431. [Google Scholar] [CrossRef]
  76. Hu, G.; Sun, W.; Jiang, J. Research on the current situation and development measures of rail-water intermodal transport in Guangzhou Port Group. IOP Conf. Ser. Mater. Sci. Eng. 2020, 782, 052003. [Google Scholar] [CrossRef]
  77. Xu, W.; Gong, X. Factor cluster analysis of qingdao port logistics competitiveness. Logistics 2020, 4, 26. [Google Scholar] [CrossRef]
  78. Liu, X. Research on logistics service innovation of international major ports under marine economic strategy. J. Coast. Res. 2020, 115, 283–285. [Google Scholar] [CrossRef]
Figure 1. Container volume and proportion of sea–rail intermodal transportation in China for 2017–2021.
Jmse 11 01403 g001
Figure 2. Radar plot of weighting results.
Jmse 11 01403 g002
Figure 3. Hub for each service capacity barrier degree line graph.
Jmse 11 01403 g003
Table 1. Service evaluation methods and their characteristics in the transportation sector.
CategoriesMethodsAdvantagesDisadvantagesSource
Mathematical and statistical analysisFactor analysis methodReducing redundant information; reducing the relevance of indicators; quantifying the degree of influence of indicators on the composite factor.There are cases where information has not been extracted and data accuracy is required; there are certain requirements for the quantity and quality of data; the extracted results may not be intuitive.[52]
Cluster analysis methodAutomatic identification of the optimal number of categories without predetermining the number of categories; identification of commonalities and differences between different transportation services through the results of cluster analysis.Sensitive to the initial value of the sample data; distance-based metric, sensitive to correlation and weighting between indicators.[53,54]
Systems engineeringTOPSISHigh applicability; low loss of information and quantifiable and objective results.The method of standardizing indicator data is sensitive; if there are non-linear relationships or interactions between indicators, this may affect the accuracy of the results.[55]
Grey correlation analysisGood adaptability to complex evaluation factors and incomplete information on indicators.Highly subjective; optimal values are difficult to determine.[56]
Fuzzy mathematicsCloud modelsIt can overcome the ambiguity and randomness of evaluation results and can quantify the qualitative indicators, which can deal with uncertainty and random data well.Difficulties in interconversion of qualitative and quantitative indicators for cloud model discrimination.[57]
Fuzzy matter element methodConverting indicator measures into affiliations; dealing effectively with incompatibilities.The application of AHP to determine the weights is more subjective.[58]
Combination methodsEntropy weights–TOPSISOvercomes the problem of subjective weighting and enhances comparative analysis between indicators.Clear and complete data are required; there is a problem with the reverse order of the new program.[59]
AHP–fuzzy comprehensive evaluationThe combination of qualitative description and quantitative analysis, taking full account of uncertainties, makes the evaluation more comprehensive.The determination of weights is highly subjective.[60]
Table 2. Allocation table for r k .
r k Meaning of the Assignment
1.0Indicator X k 1 is as important as indicator X k
1.2Indicator X k 1 is slightly more important than indicator X k
1.4Indicator X k 1 is more important than indicator X k
1.6Indicator X k 1 is much more important than indicator X k
1.8Indicator X k 1 is extremely more important than indicator X k
Table 3. PCITHs service capacity evaluation indicators system.
Primary
Indicators
Secondary IndicatorsIndicators MeasurementPropertySource
Radiation scale capacity, Z 1 Container sea–rail transportation volume, X 1 Number of containers handled by sea–rail transportation in the year (million TEU)+[2,30,40,41]
Sea–rail container handling capacity, X 2 Ratio of the annual volume of sea–rail containers handled to the total volume of containers handled in the year (%)+[2,41,76]
Number of productive berths of 10,000 tons and above, X 3 Number of productive berths of 10,000 tons or above owned by the port (pcs)+[41]
Number of sea–rail transportation lines, X 4 The number of sea–rail liner lines opened at the port (pcs)+[30,13,77]
Mechanical equipment service level, X 5 Measurement of the performance of machinery and equipment and the level of operation of machinery and equipment+[40]
Transportation connection capacity, Z 2 Connection time, X 6 The total time between the arrival of a ship at its anchorage in port and its departure from its berth after completion of loading and unloading operations (day)[40,41]
Connection cost, X 7 Cost of loading and unloading a 20 ft fully loaded TEU (yuan)[30]
Vessel at berth time, X 8 Total time between arrival at berth for loading and unloading operations and completion of operations and departure from berth (day)[40]
Port rail dedicated line mileage, X 9 Length of railroad lines directly related to the main sea–rail terminals and container operation areas of the port (km)+[41]
Resource integration capacity, Z 3 Degree of resource integration, X 10 The degree of matching and coordinated operation between the resources integrated in PCITHs when integrating various resources+[78]
Level of information construction, X 11 The extent to which the hub has invested in and developed information technology and systems applications+[43,50,51]
Level of inter-port cooperation, X 12 The extent of cooperation with other ports in other regions in terms of resource sharing, information exchange, and operational collaboration+[40]
Resource utilization efficiency, X 13 Economic benefits gained through resource consumption over a certain period of time and operating revenue/operating costs+[78]
Note: “+” is a positive indicator; “−” is a negative indicator; X 5 , X 10 , X 11 , X 12 indicators are qualitative indicators; and the rest are quantitative indicators.
Table 4. Raw data on the service capacity of PCITHs.
Primary IndicatorsSecondary IndicatorsNingbo Zhoushan Port M 1 Qingdao Port M 2 Tianjin Port M 3 Guangzhou Port M 4 Xiamen Port M 5
Radiation scale capacityContainer sea–rail transportation volume/million TEU120.44181.9100.115.63.17
Sea–rail container handling capacity/%3.887.674.940.680.26
Number of productive berths of 10,000 tons and above/pcs198931278081
Number of sea–rail transportation lines/pcs2127443511
Mechanical equipment service level98777
Transportation connection capacityConnection time/day2.161.771.881.491.35
Connection cost/yuan490480470490510
Vessel at berth time/day1.071.171.500.851.05
Port rail dedicated line mileage/km56.8546.5812047.634.8
Resource integration capacityDegree of resource integration87767
Level of information construction887.578
Level of inter-port cooperation87.57.577
Resource utilization efficiency1.231.471.081.091.01
Table 5. Assignment result for r k .
r k r 2 r 3 r 4 r 5 r 6 r 7 r 8 r 9 r 10 r 11 r 12 r 13
1.41.01.01.21.21.01.41.21.61.61.21.4
Table 6. Results of subjective and objective weightings and combined weighting settlement.
X 1 X 2 X 3 X 4 X 5 X 6 X 7 X 8 X 9 X 10 X 11 X 12 X 13
W k 0.12220.08490.10180.17110.12220.08490.01640.06060.12220.03160.01970.05050.0119
β j 0.18130.18970.11100.13780.02690.03500.00750.05990.15630.02390.01570.01080.0440
Y 0.17540.17920.11010.14120.03650.04000.00840.06000.15290.02470.01610.01480.0408
Table 7. Key barrier factors and barrier degrees for the top three in each port hub.
First Barrier FactorSecond Barrier FactorThird Barrier Factor
FactorBarrier
Degree (%)
FactorBarrier
Degree (%)
FactorBarrier
Degree (%)
Ningbo-Zhoushan Port X 9 25.21 X 4 21.89 X 2 20.39
Qingdao Port X 9 33.55 X 3 24.94 X 4 18.52
Tianjin Port X 1 20.19 X 3 16.66 X 8 15.09
Guangzhou Port X 2 22.62 X 1 21.83 X 9 17.38
Xiamen Port X 2 20.16 X 1 19.73 X 9 17.19
Disclaimer/Publisher’s Note: The statements, opinions and data contained in all publications are solely those of the individual author(s) and contributor(s) and not of MDPI and/or the editor(s). MDPI and/or the editor(s) disclaim responsibility for any injury to people or property resulting from any ideas, methods, instructions or products referred to in the content.

