
Exploring the Failure Mechanism of Container Port Logistics System Based on Multi-Factor Coupling

Abstract
:1. Introduction
2. Literature Review
2.1. Research of Risk Analysis Methods for Port Logistics
2.1.1. Risk Analysis Methods in the Port Area
2.1.2. Application of Bayesian Network Model
2.2. Risk Factors Associated with Port Logistics
2.2.1. Internal Risk Factors of the Port Logistics
2.2.2. External Risk Factors
2.3. Research Gap
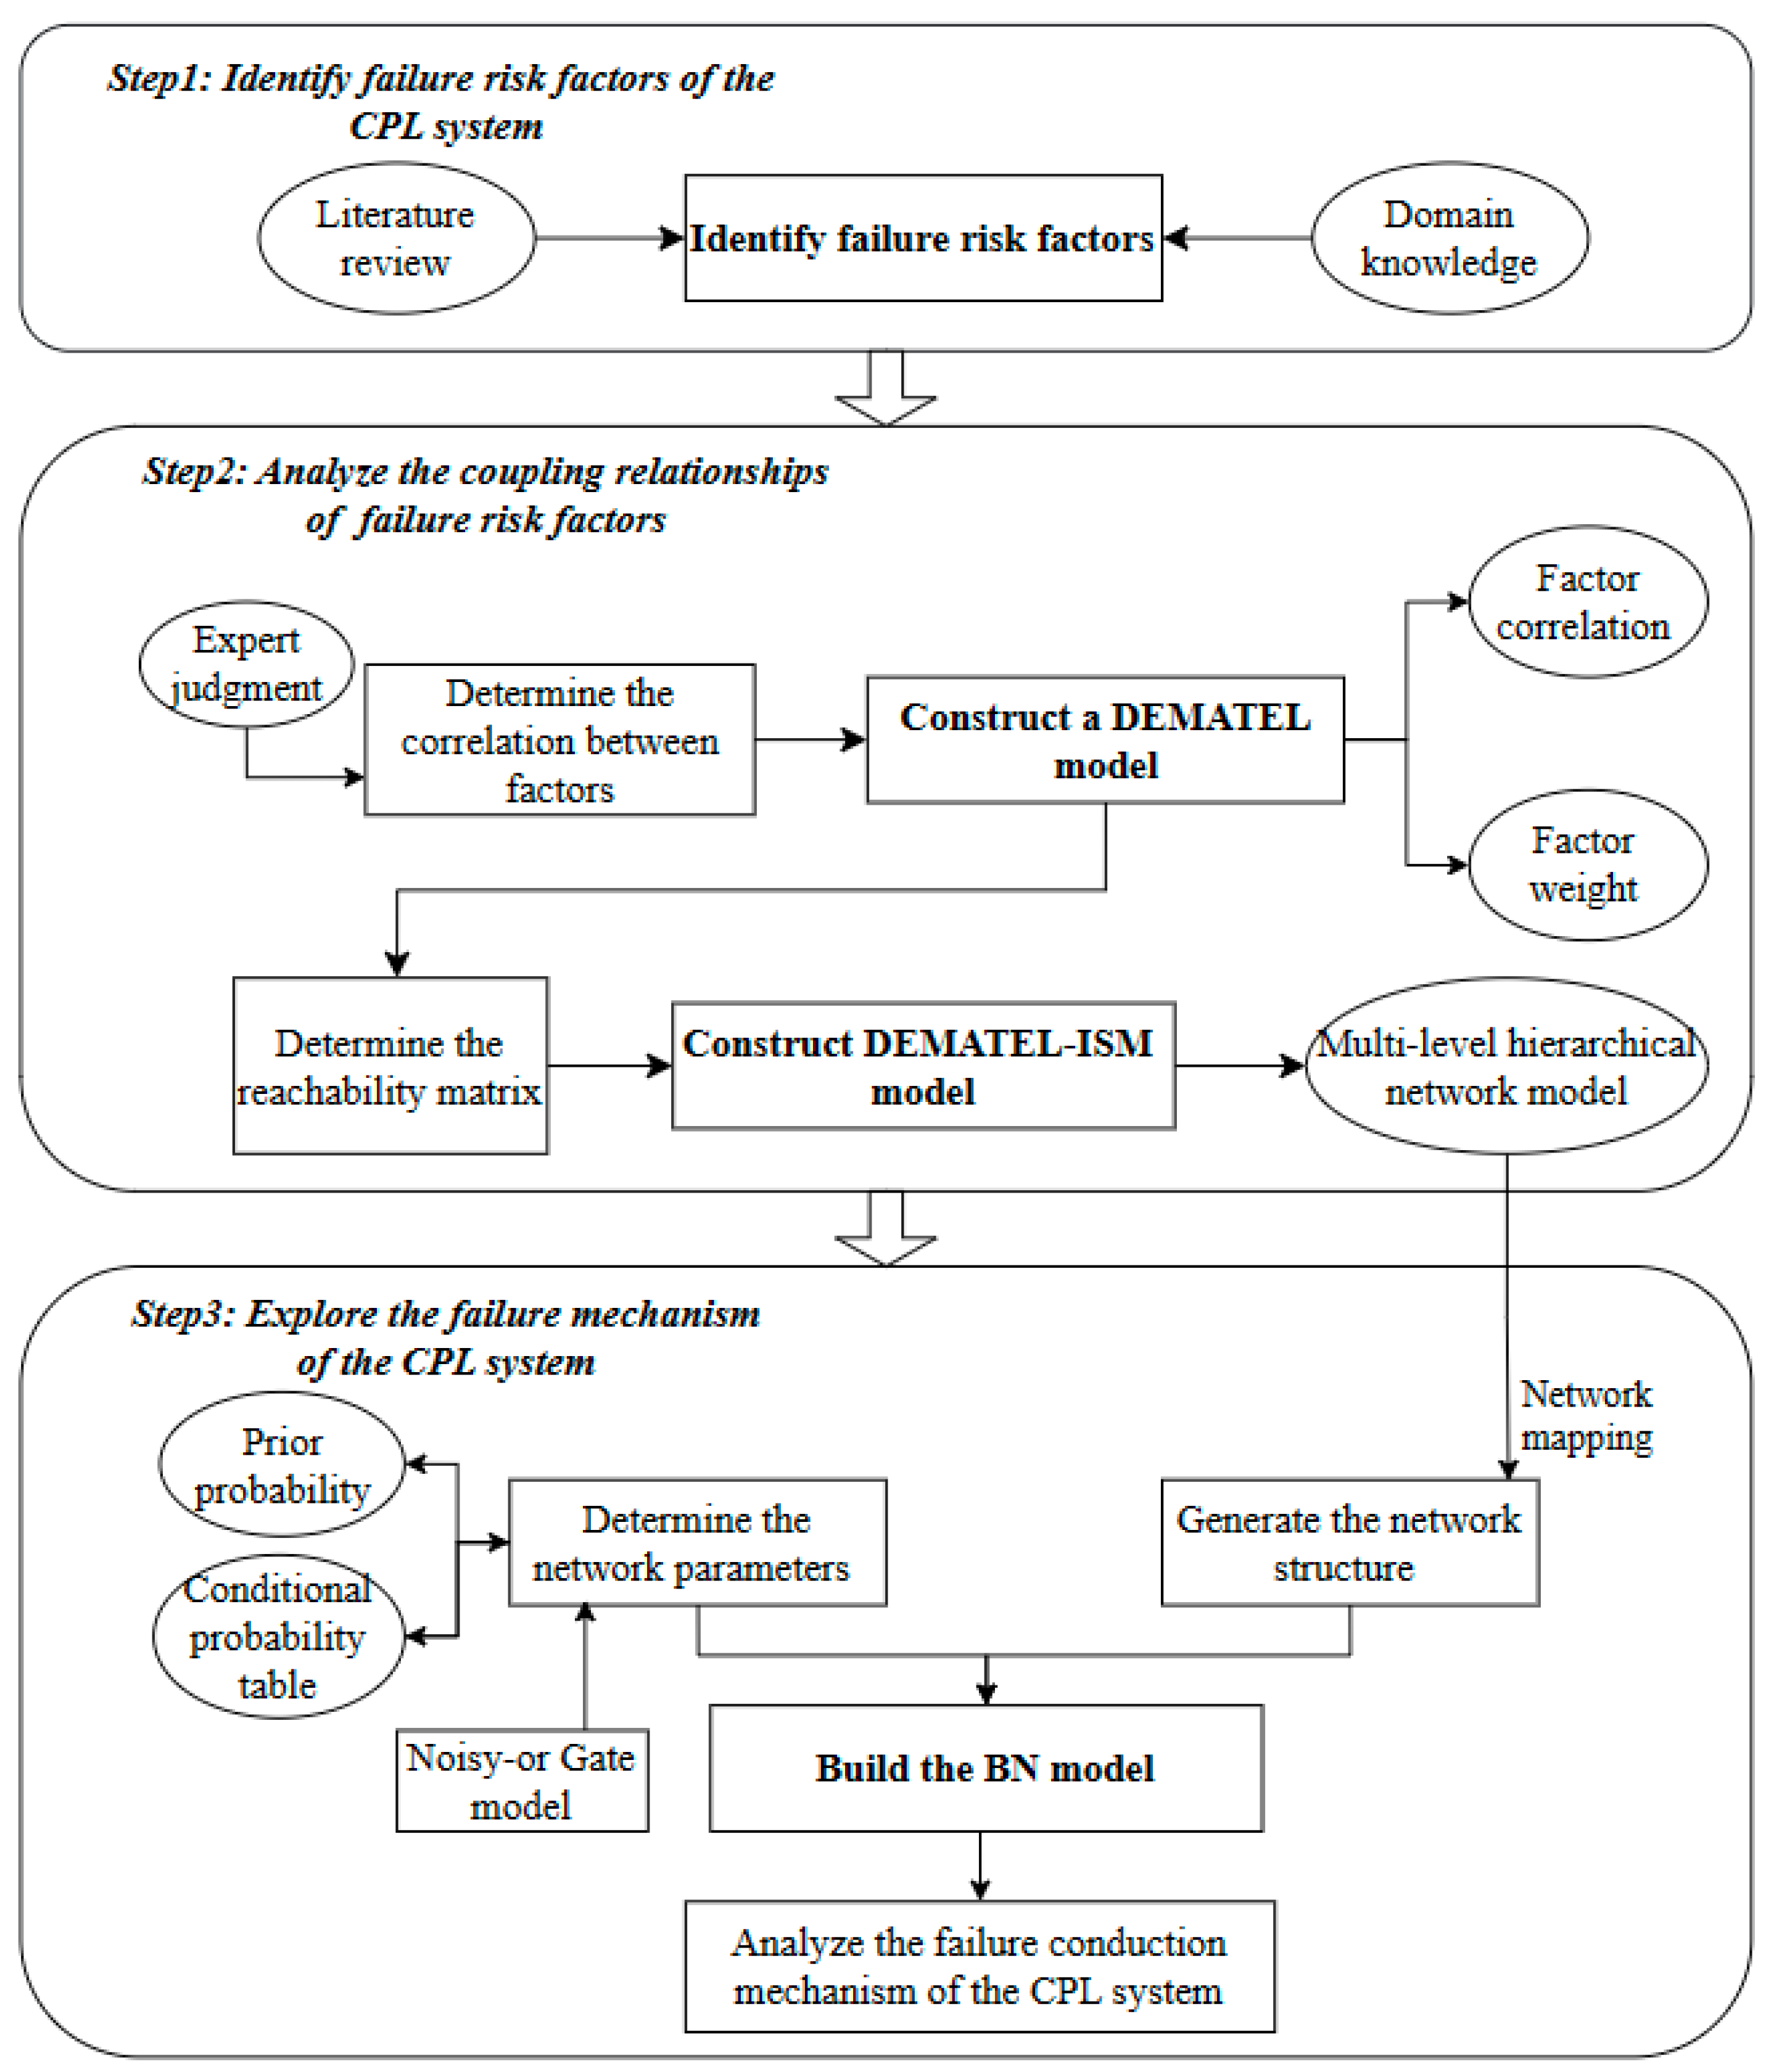
3. Methodology
3.1. Risk Identification
3.2. Data Collection
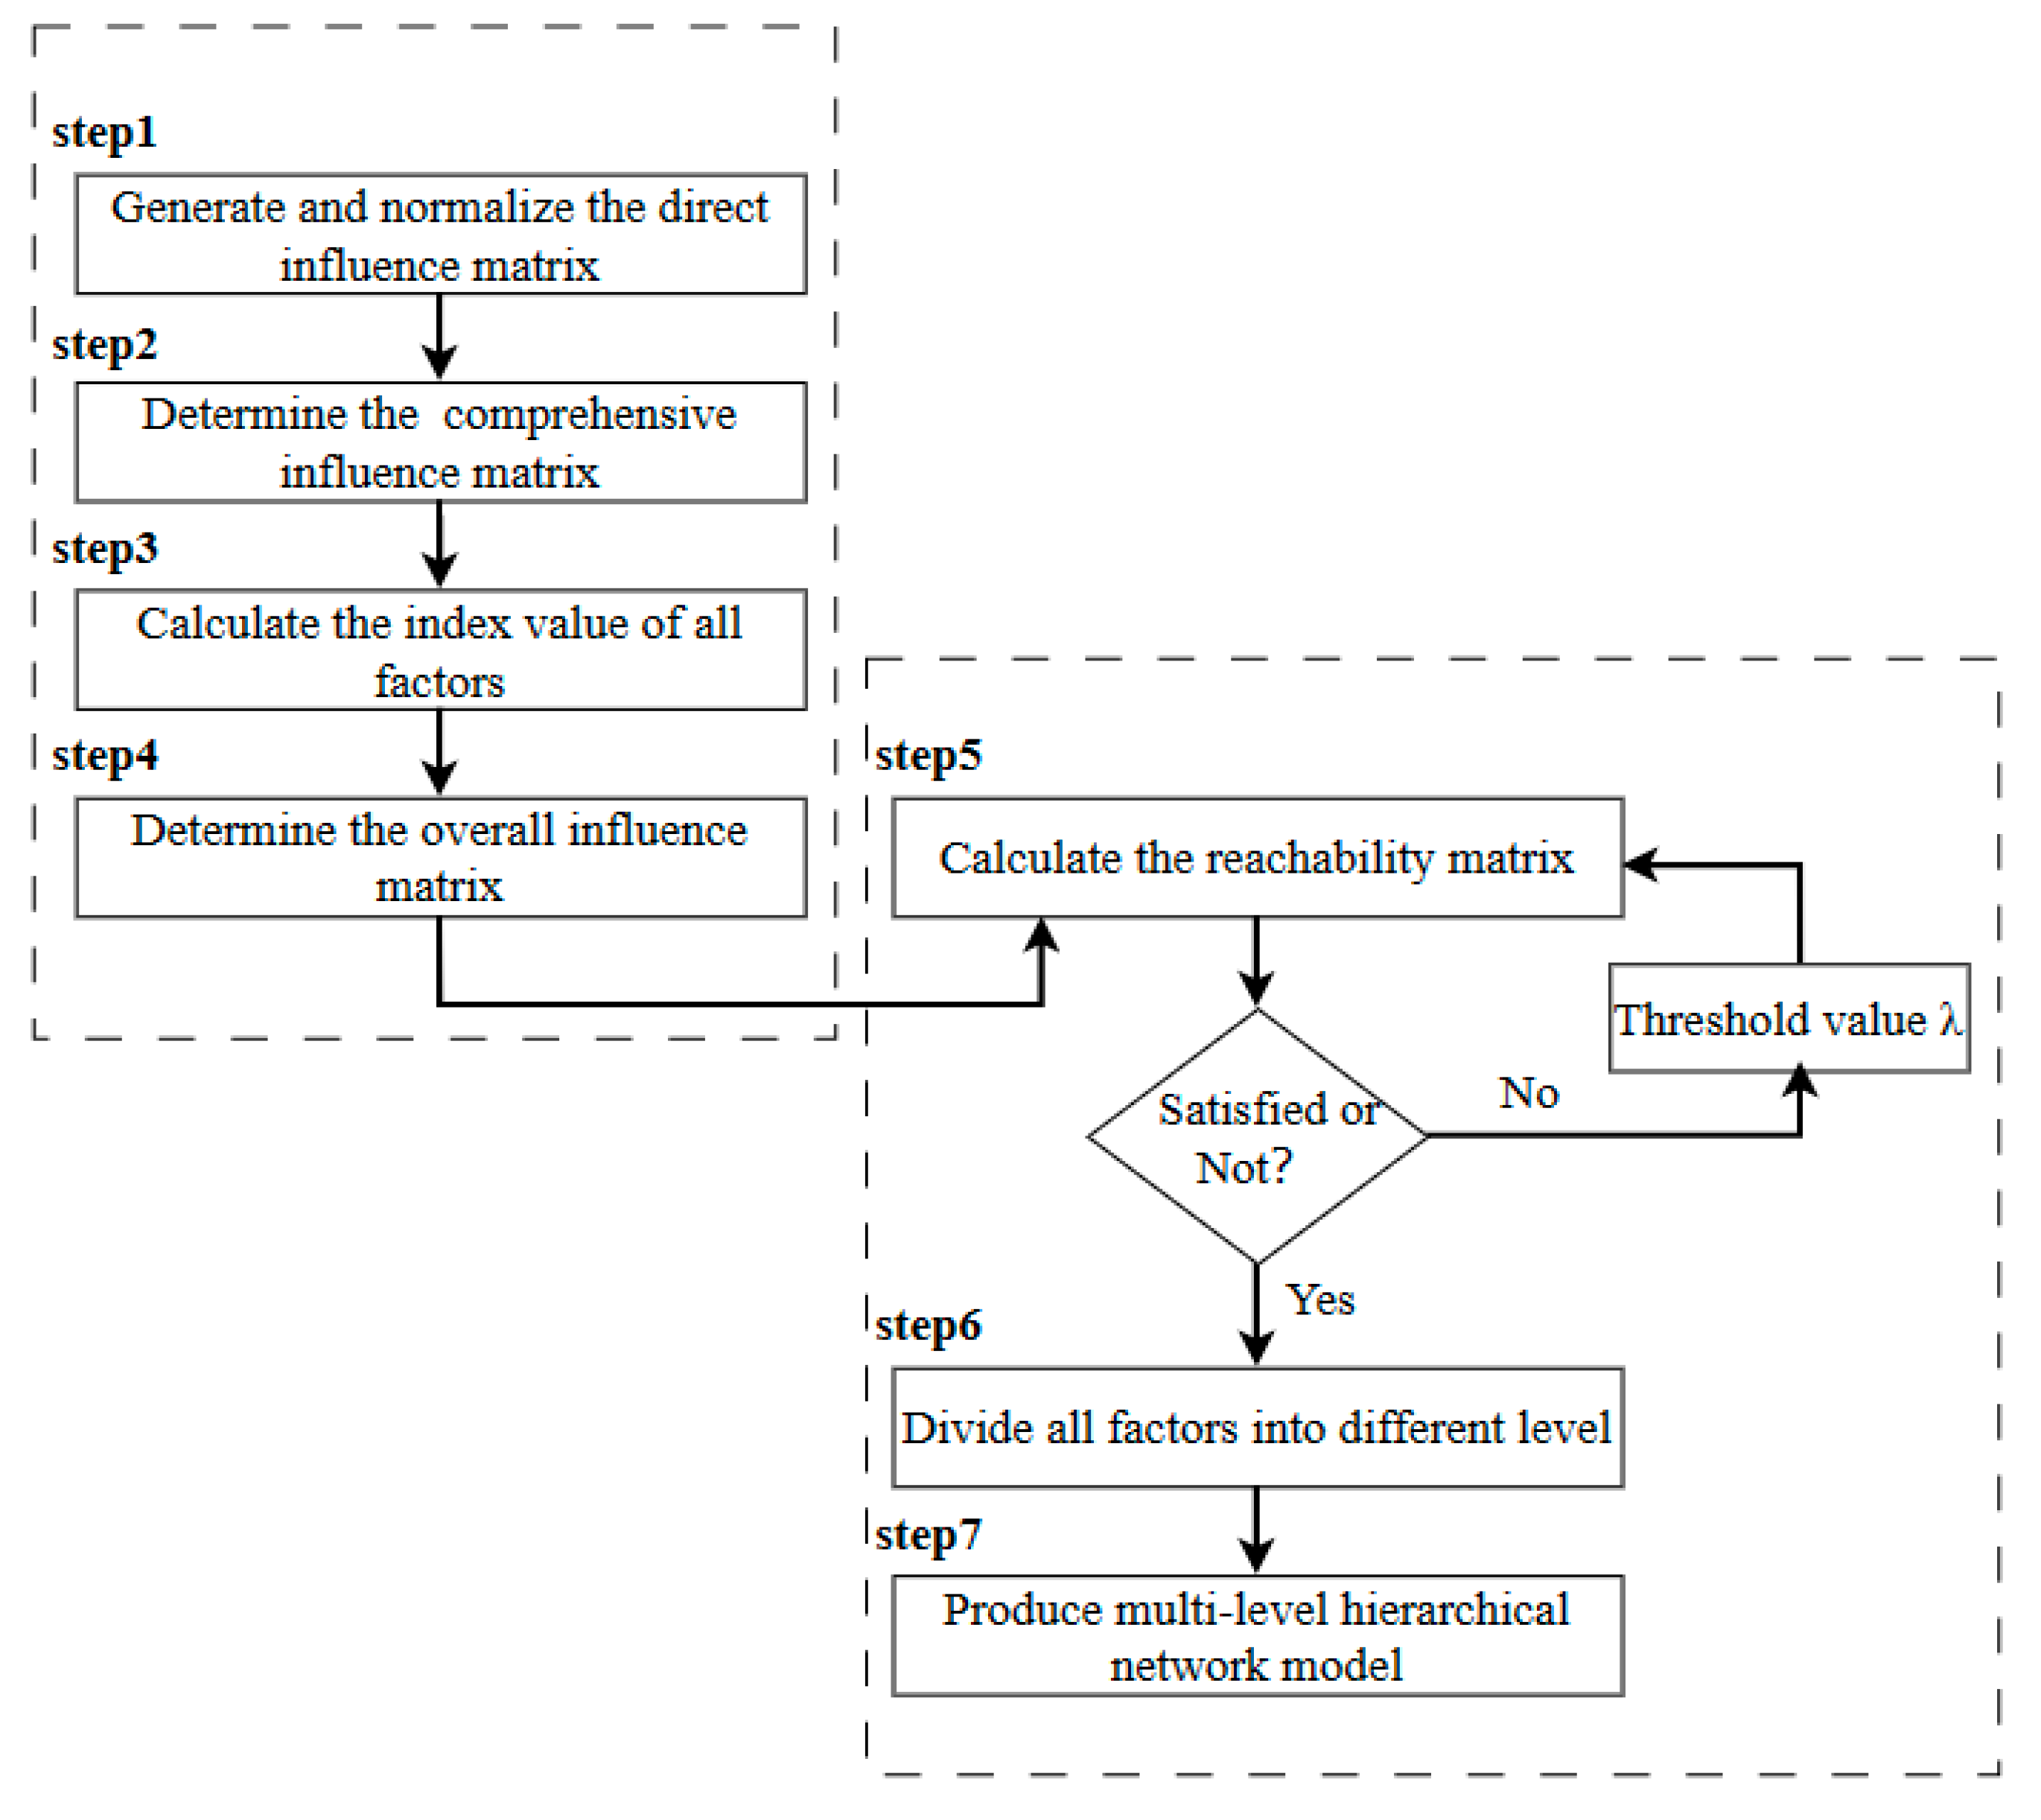
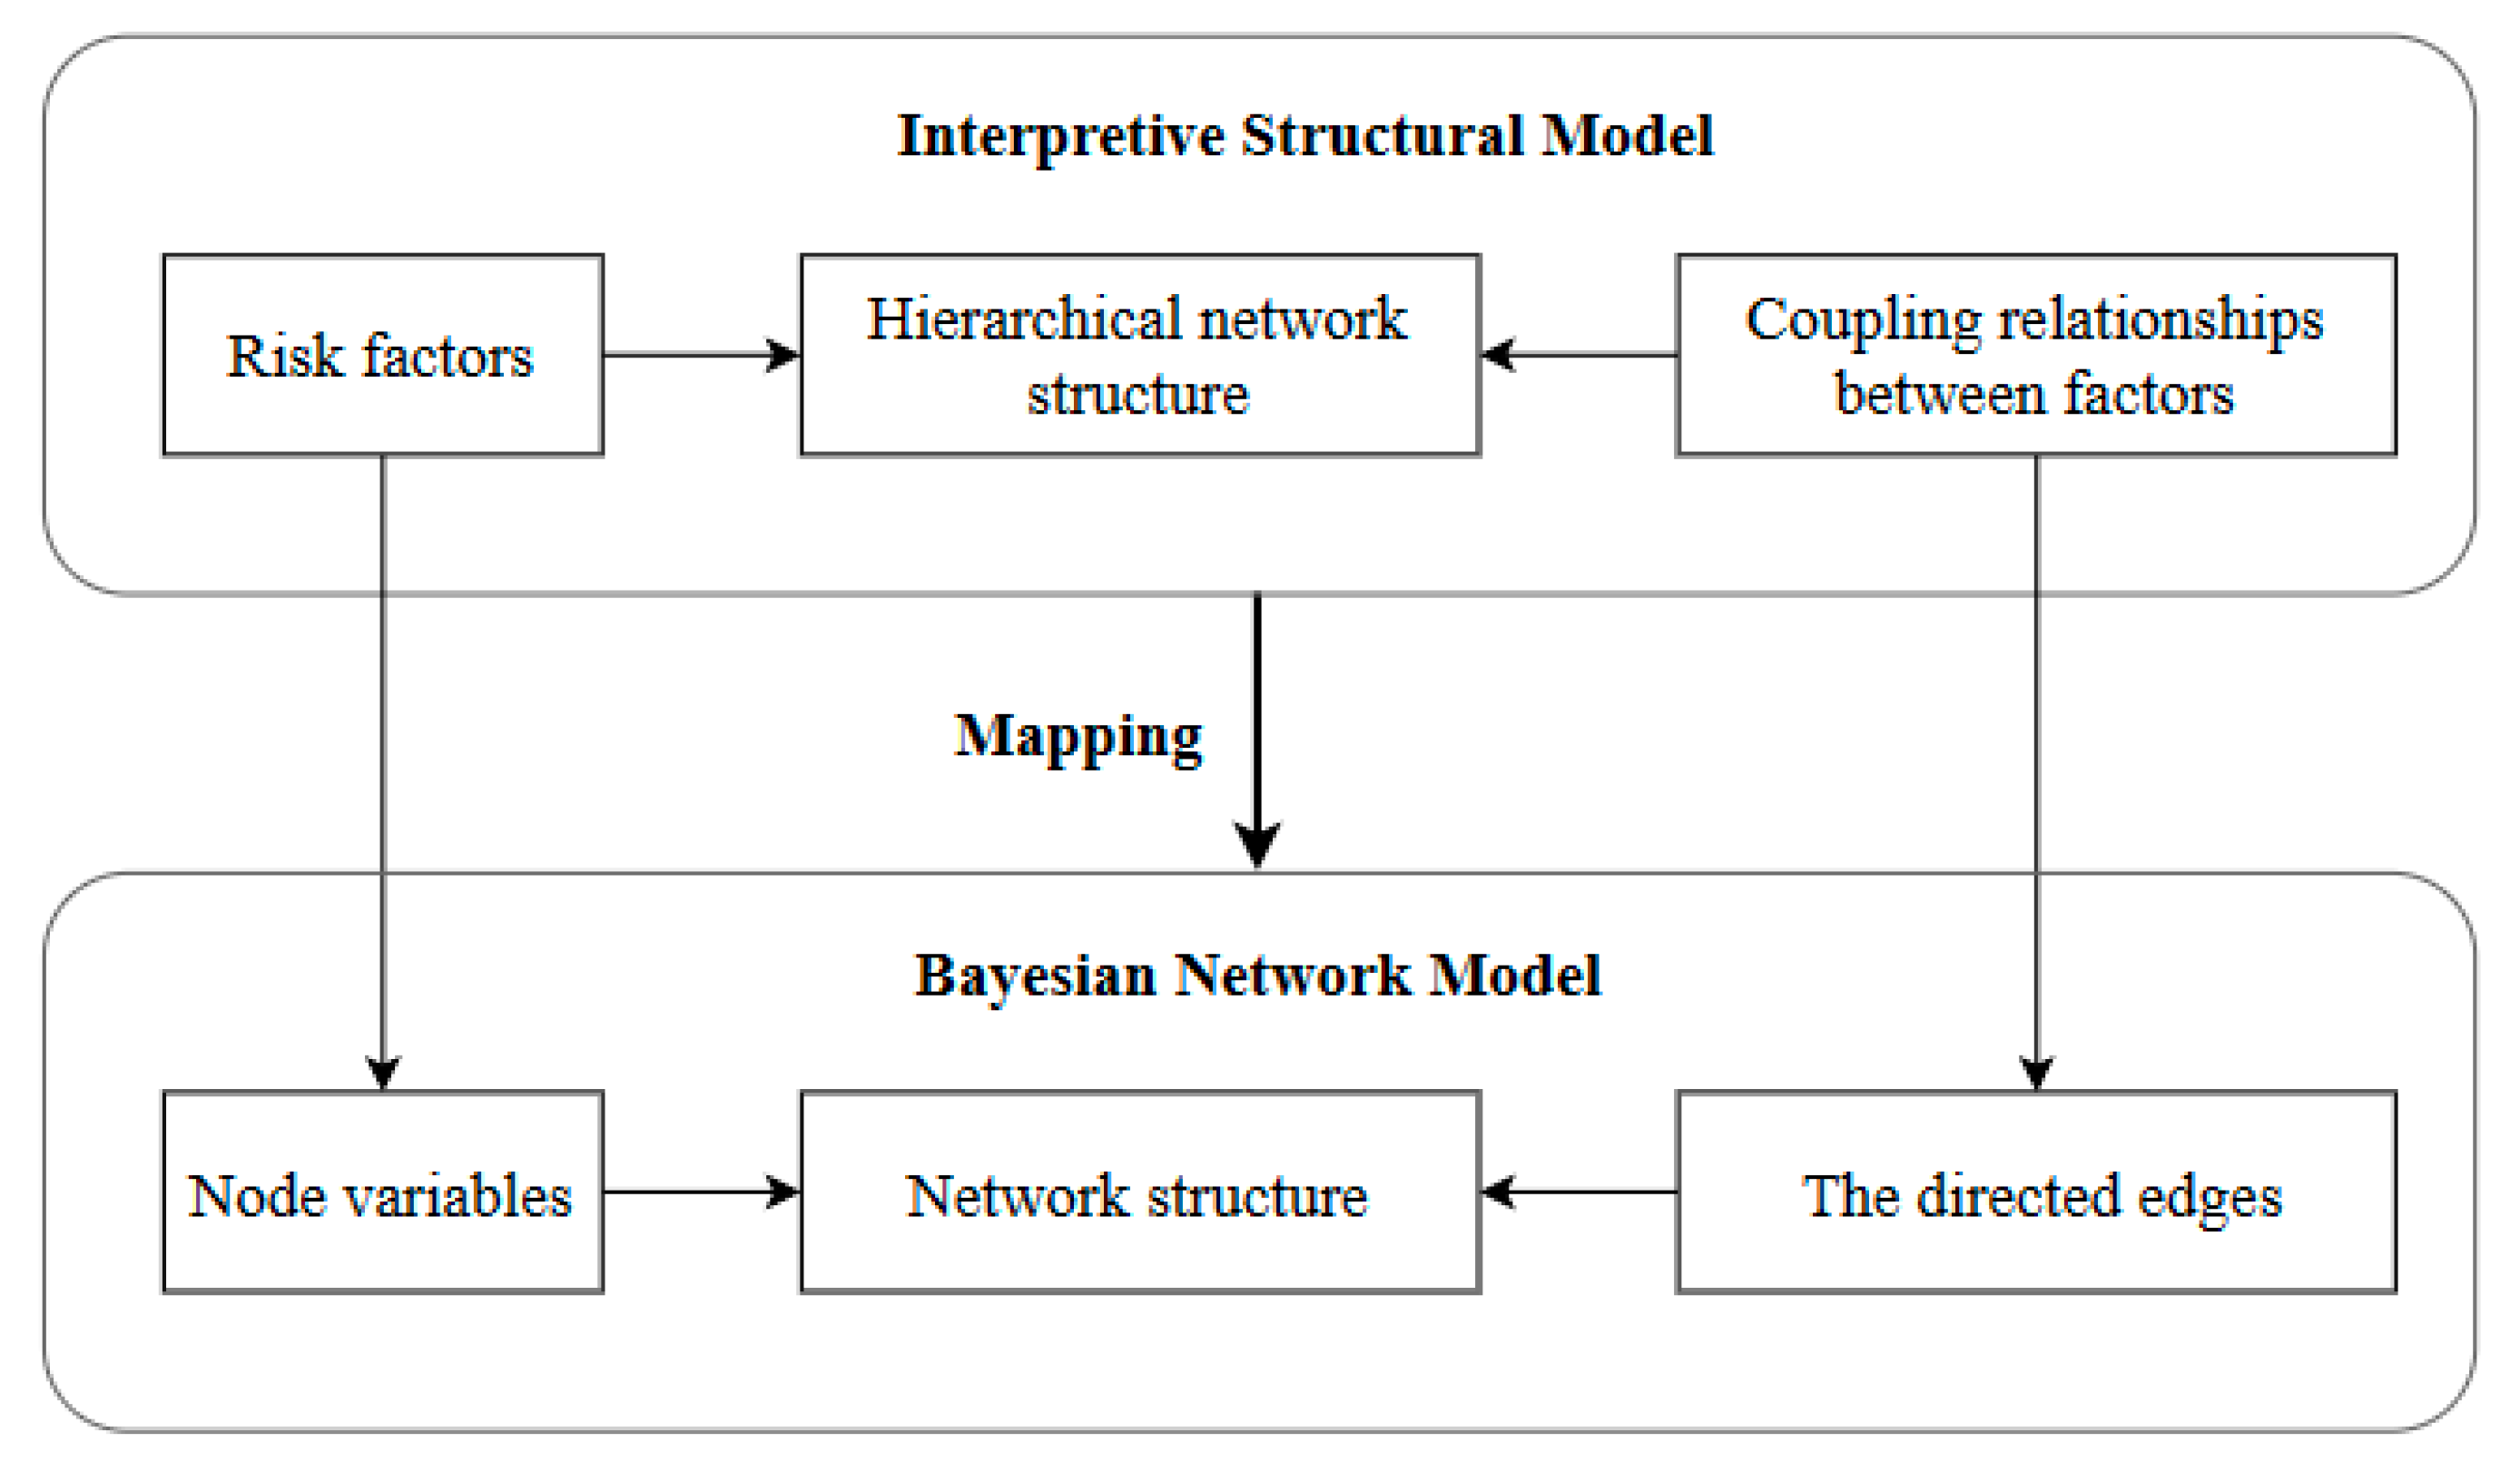
3.3. The DEMATEL-ISM Method
- Step 1: Generate and normalize the direct influence matrix
- Step 2: Determine the comprehensive influence matrix
- Step 3: Calculate the index value of all factors
- 1.
- Influencing degree and influenced degree
- 2.
- Centrality and causality
- Step 4: Determine the overall influence matrix.
- Step 5: Calculate the reachability matrix.
- Step 6: Classify different levels based on the reachability matrix.
- Step 7: Draw the directed graph.
3.4. Noisy-Or Gate Bayesian Network Model
3.4.1. Bayesian Network Model
- (1)
- Construct the network structure S and express the relationship between each information element by determining the directed graph. It consists of a point variable set and a directed edge set . Among them, the directed edge L represents the dependence or causality between variables and . The final network structure S is expressed as S = (V, L).
- (2)
- Determine the probability distribution of the node, including the prior probability of the parent node and the conditional probability table (CPT) of other child nodes. The degree of interaction between variables is expressed through the probability distribution among them. The conditional probability table distribution of node variables is expressed as Equation (11).
3.4.2. Noisy-Or Gate Model and Leaky Noisy-Or Gate Model
- All variables have only two states, occurrence (Y) and non-occurrence (N);
- The corresponding parent nodes of any node are independent of each other.
- When any parent node is Y, and all other parent nodes are N, it is enough to make node V in Y state. At this time, the node connection probability is . Then other items of conditional probability table (CPT) of node V determined by , expressed as Equation (12).
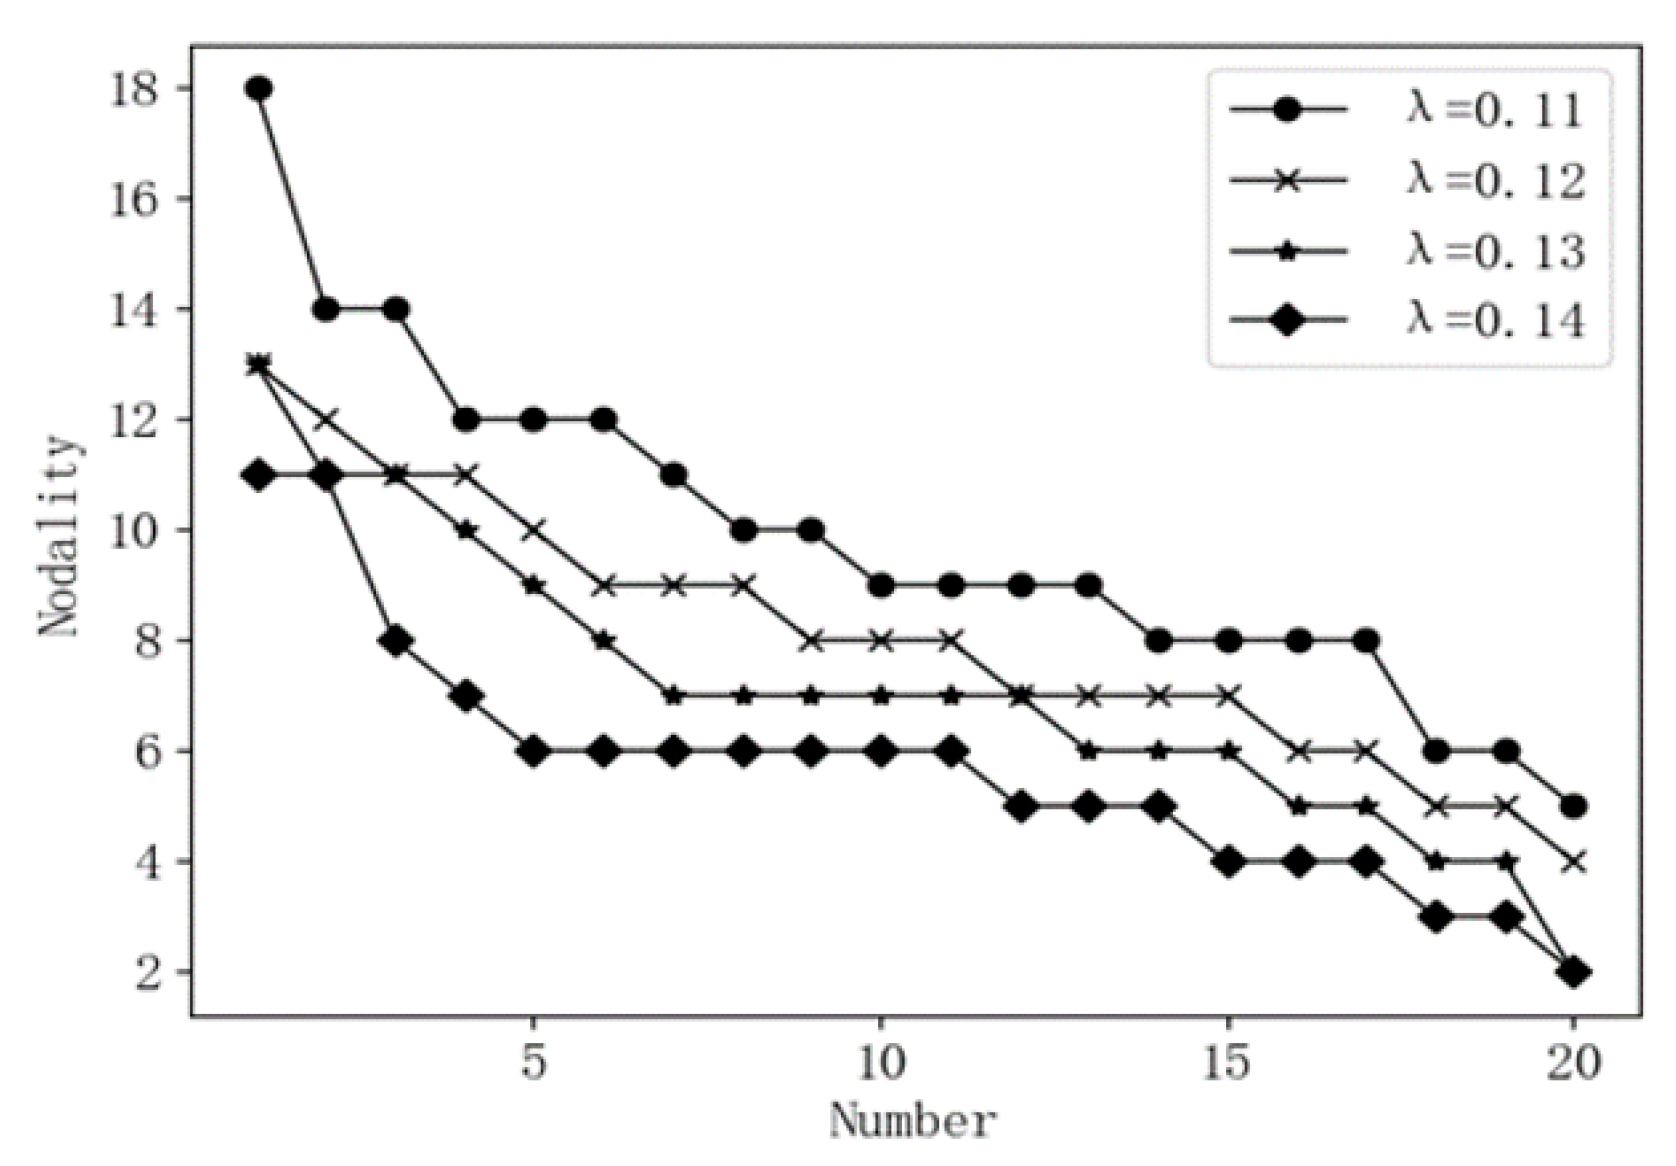
3.4.3. Conduct the BN Model Based on the Leaky Noisy-Or Gate Model
4. Results
4.1. Coupling Analysis of System Failure Risk Factors
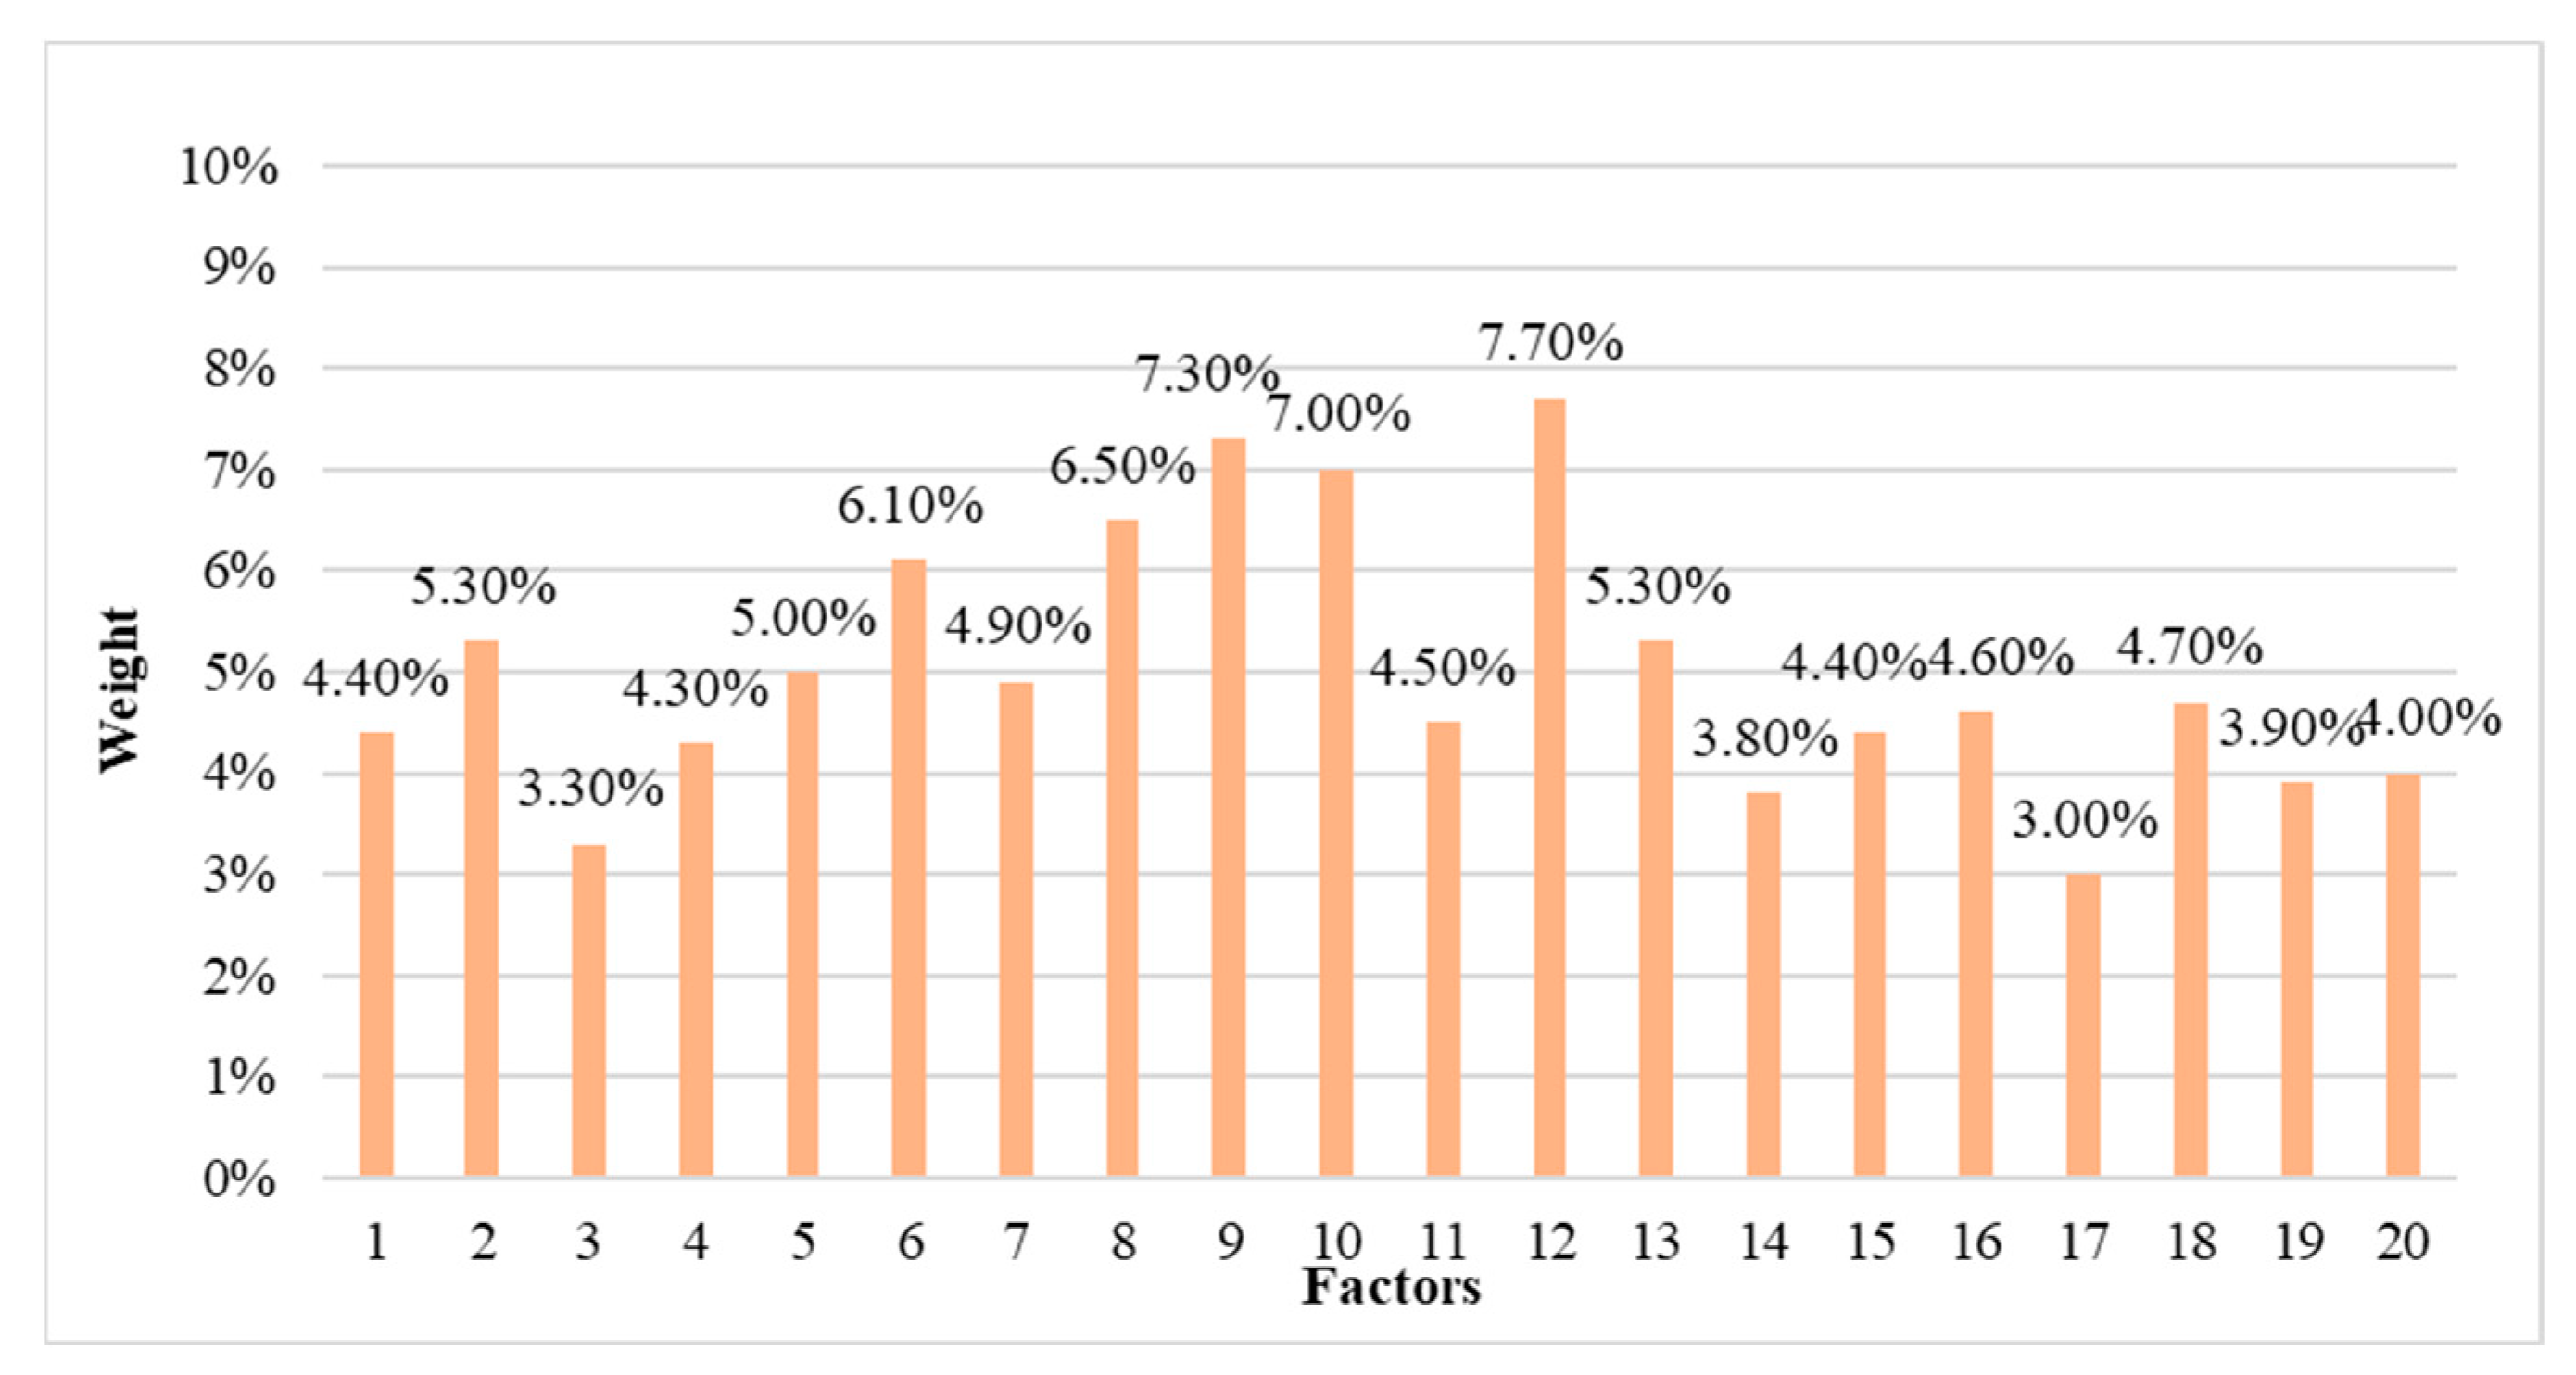
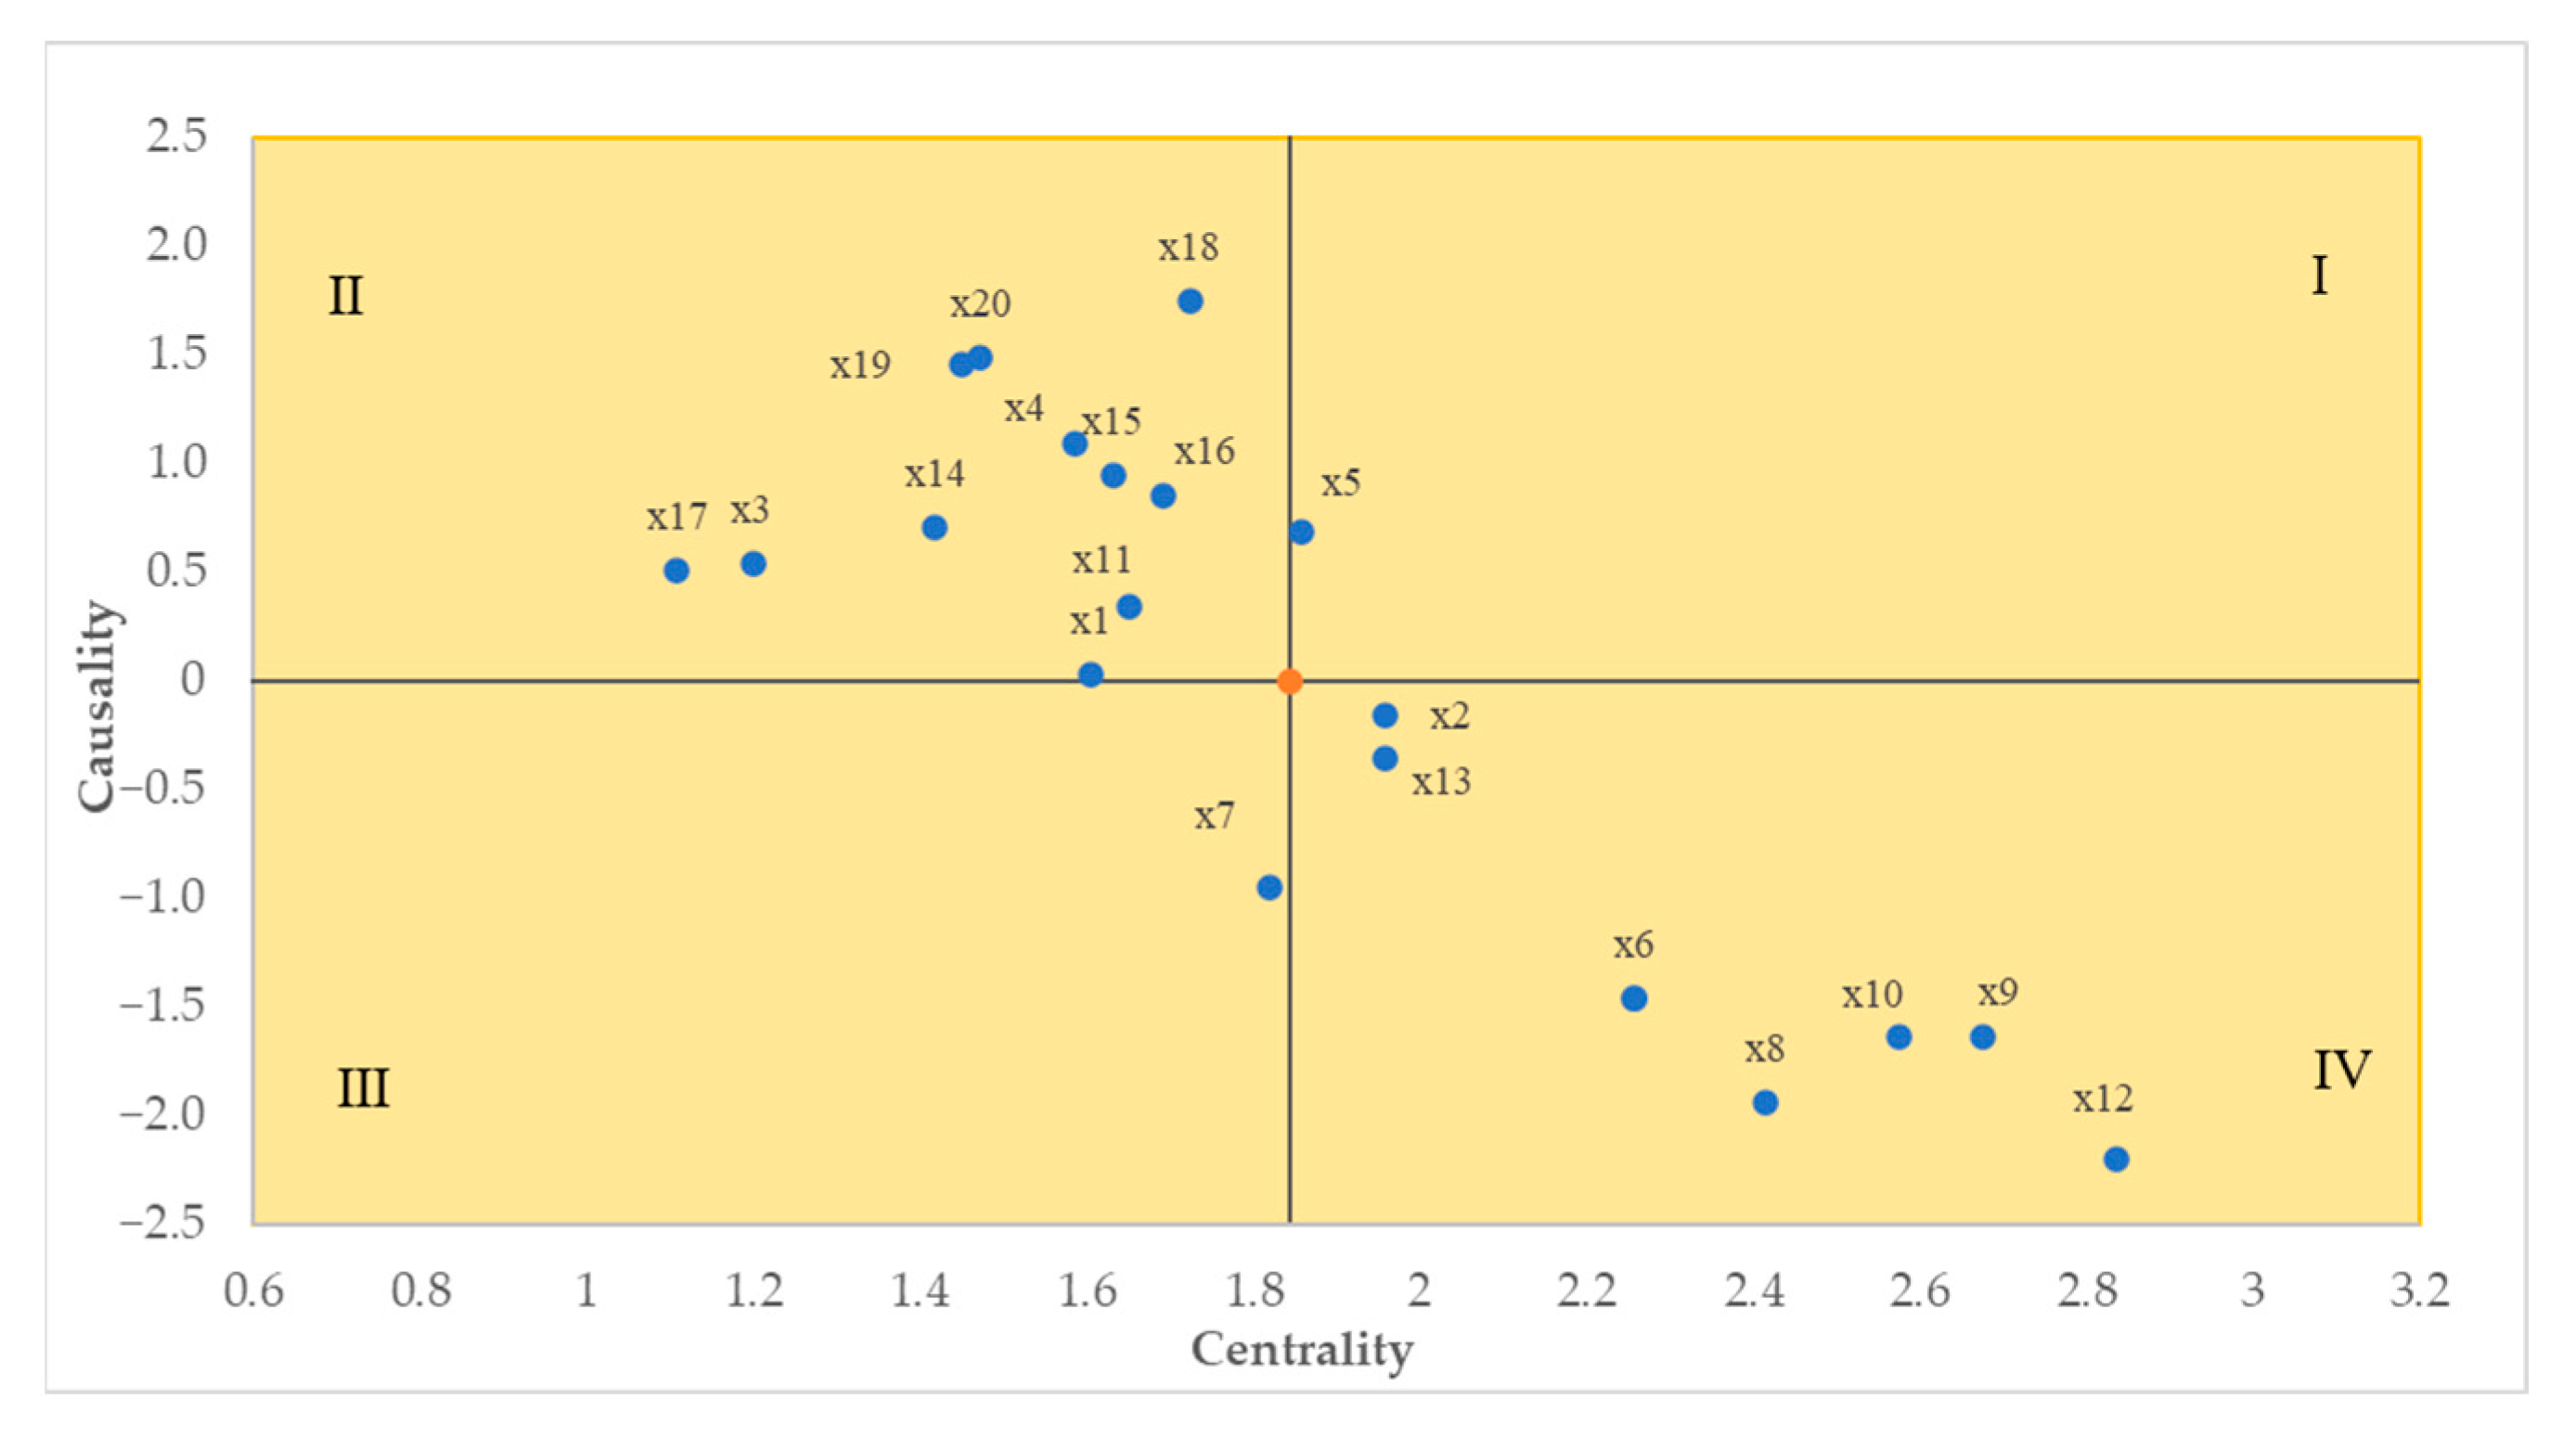
4.1.1. DEMATEL Model
4.1.2. ISM Model
4.2. BN Modeling
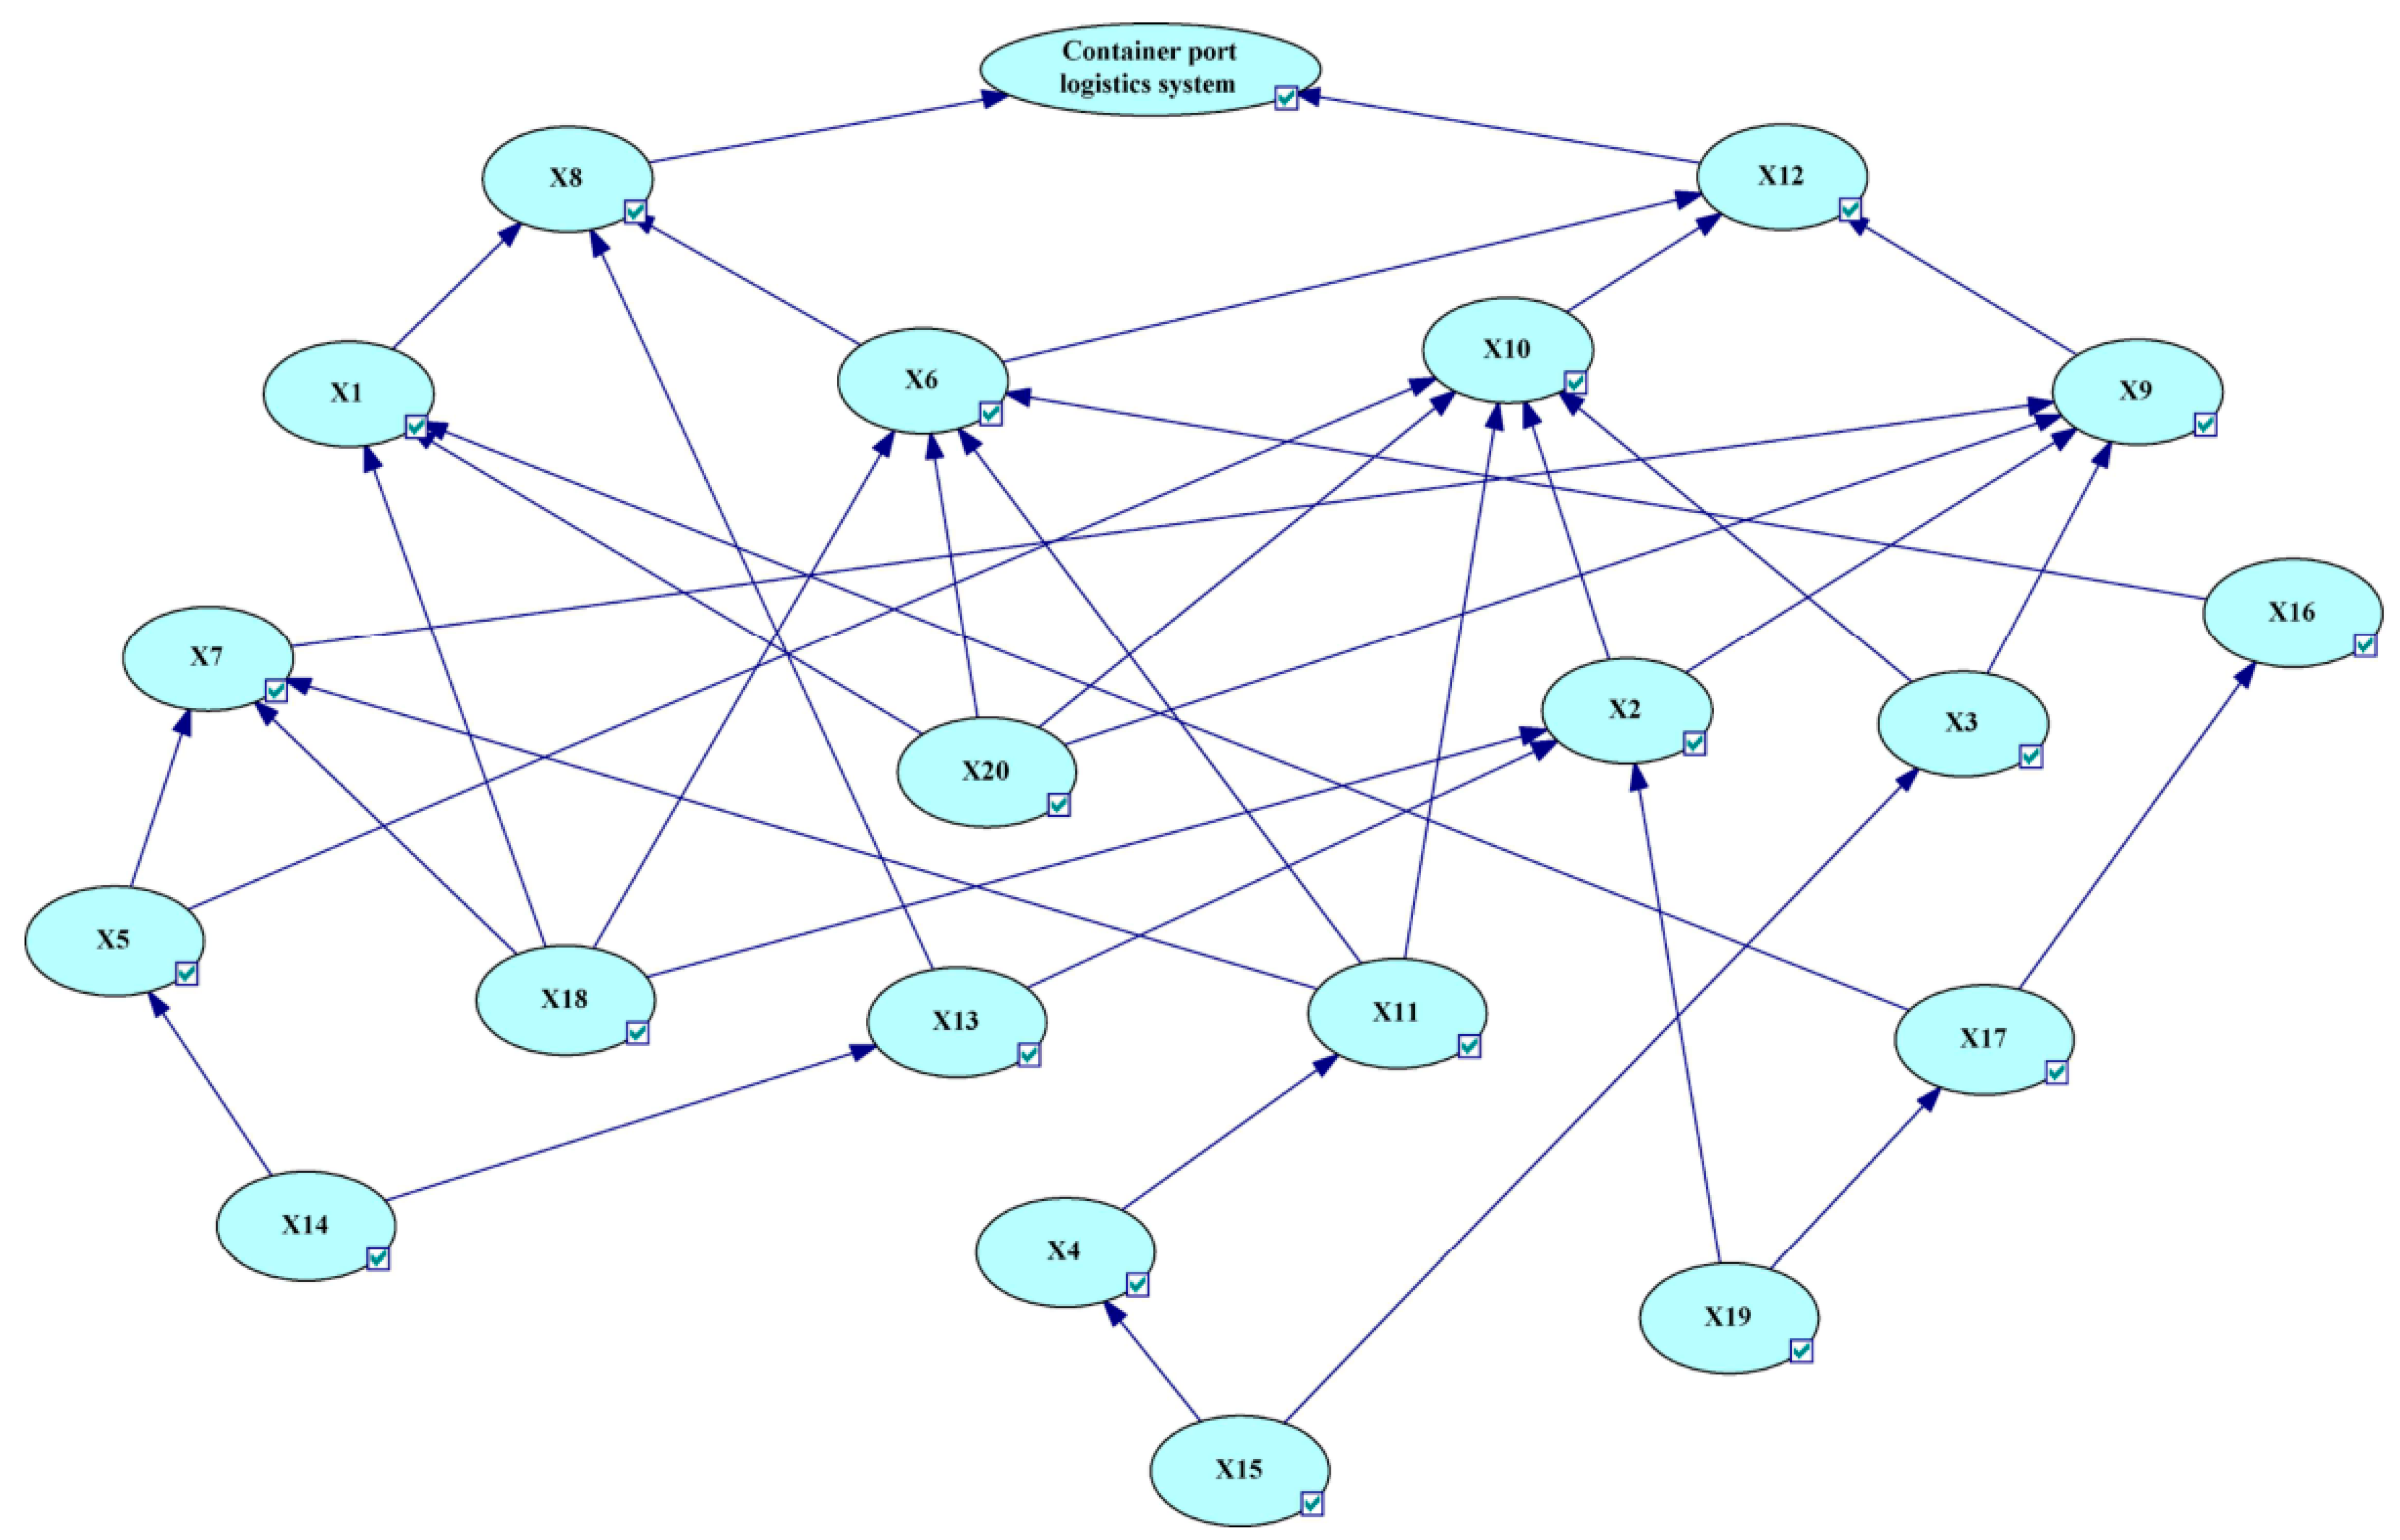
4.2.1. Establish the Network Structure and Network Parameter in the BN
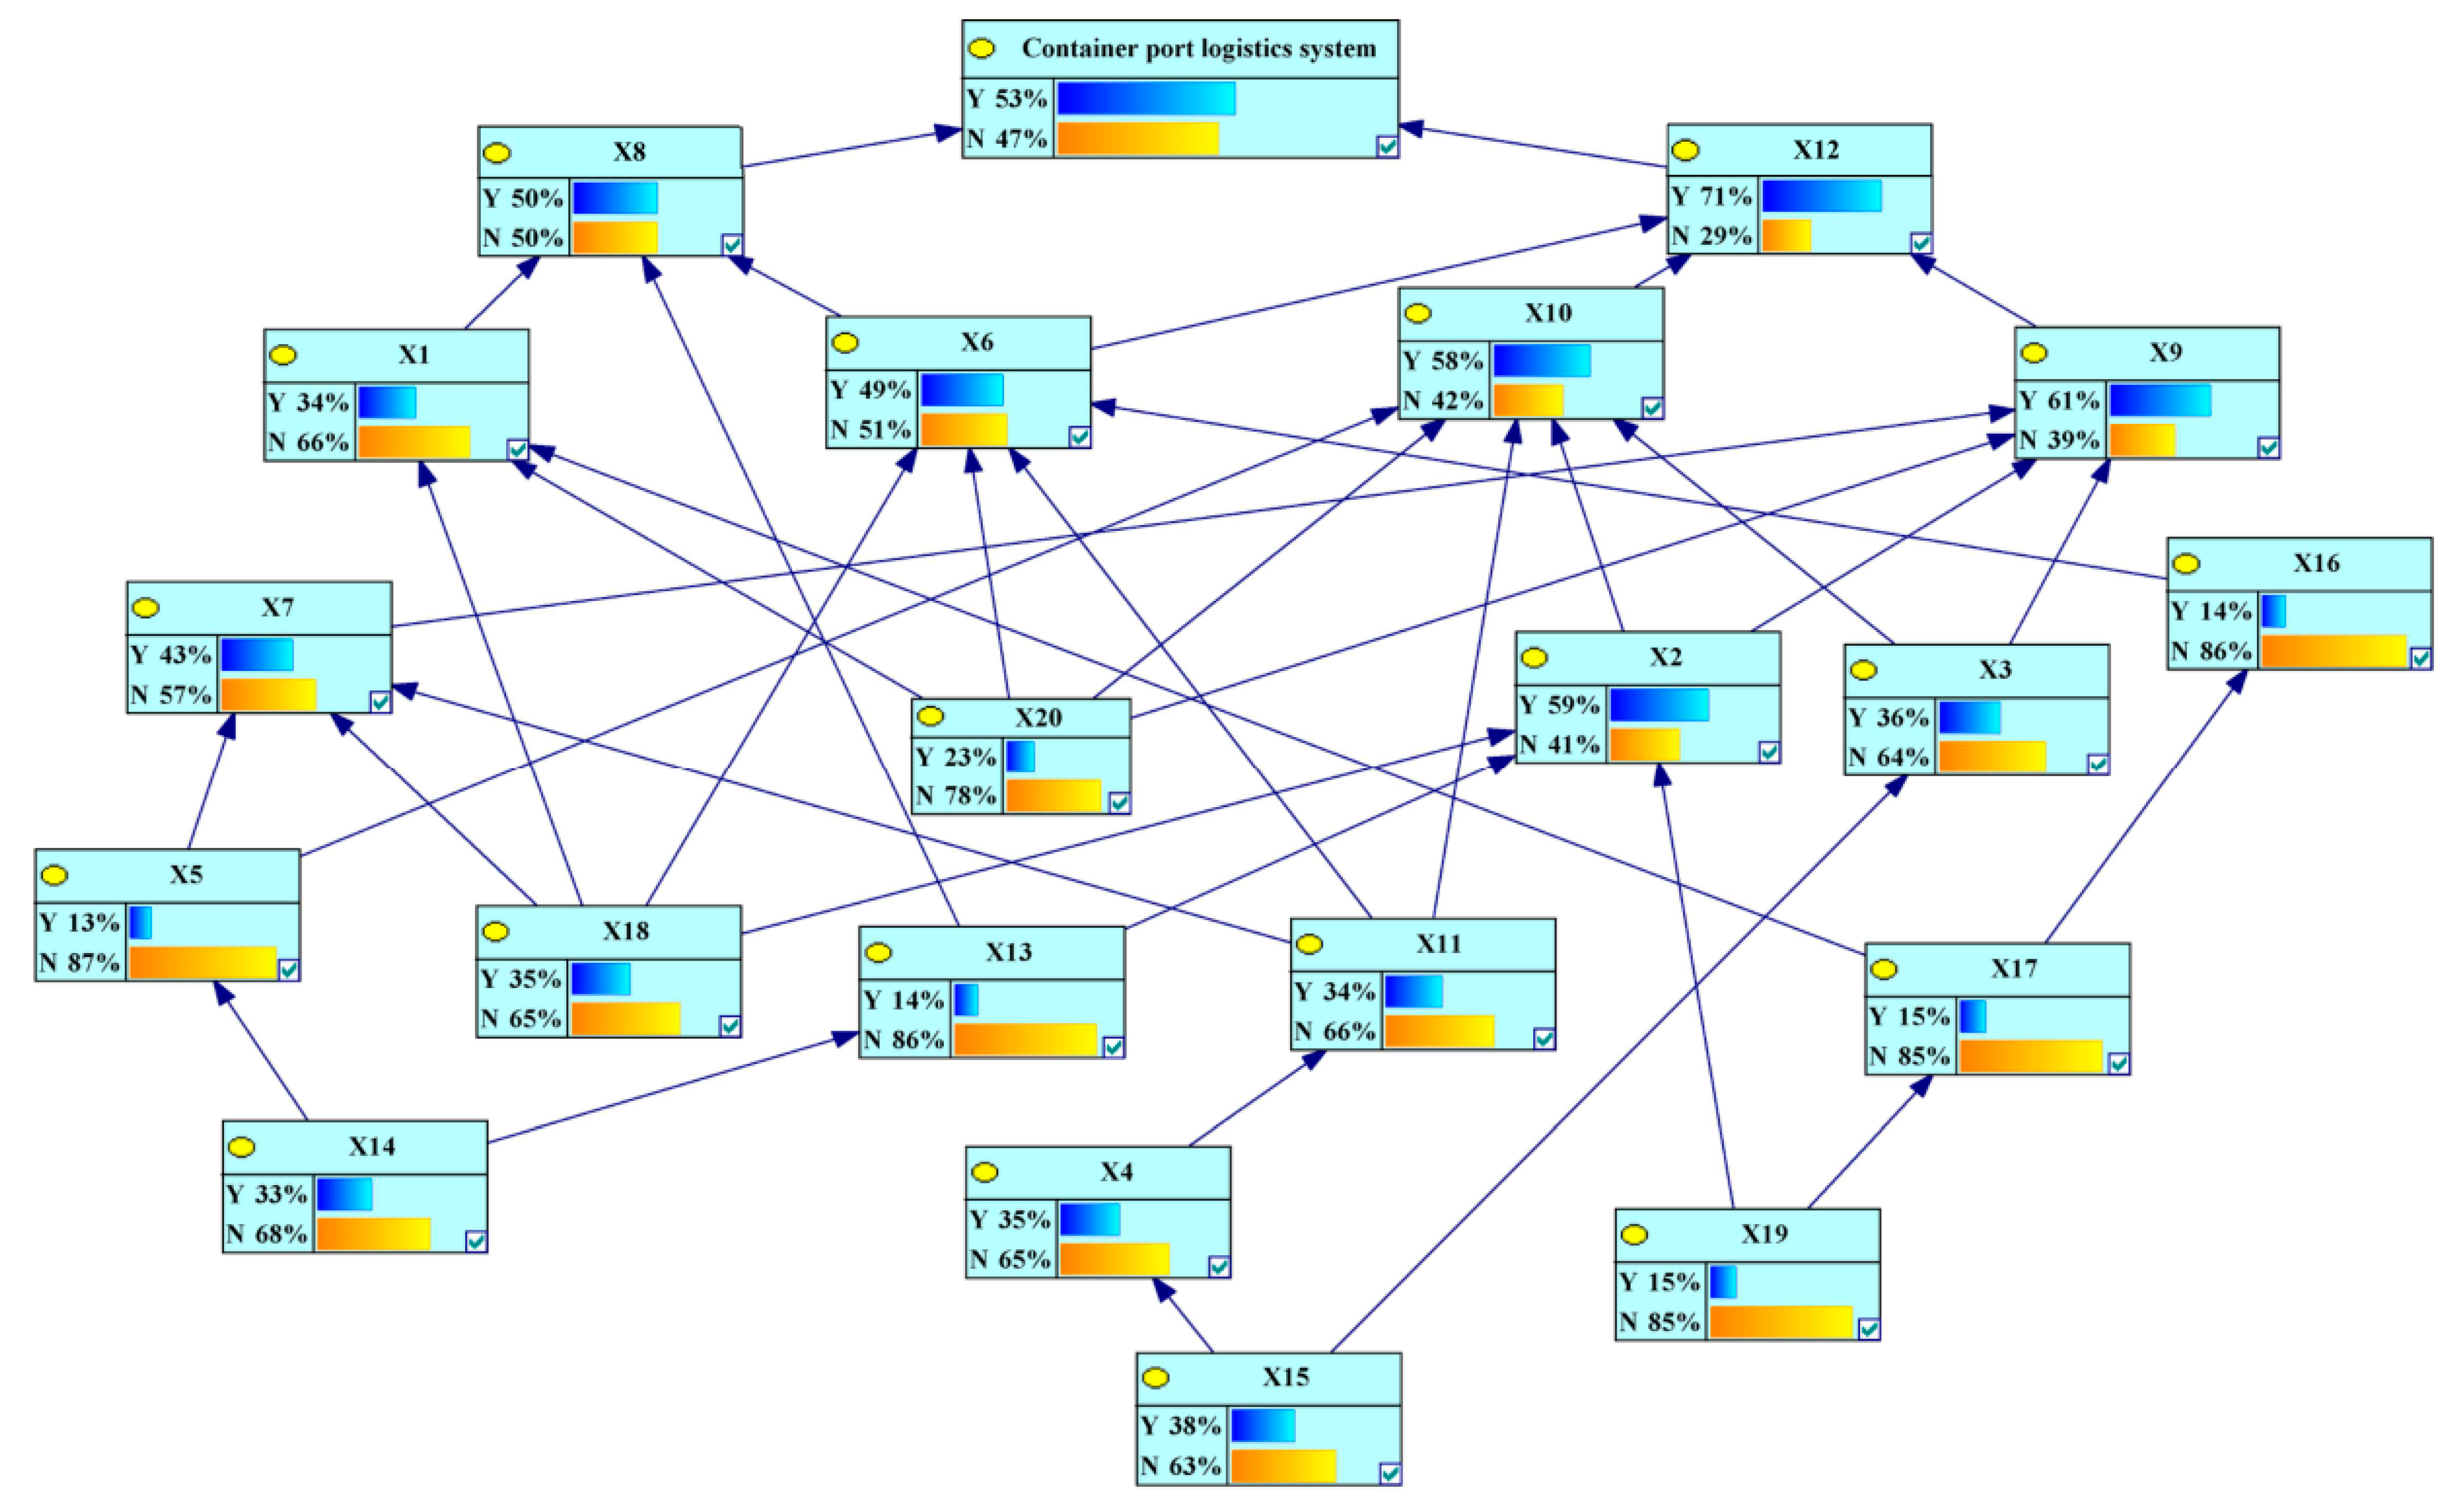
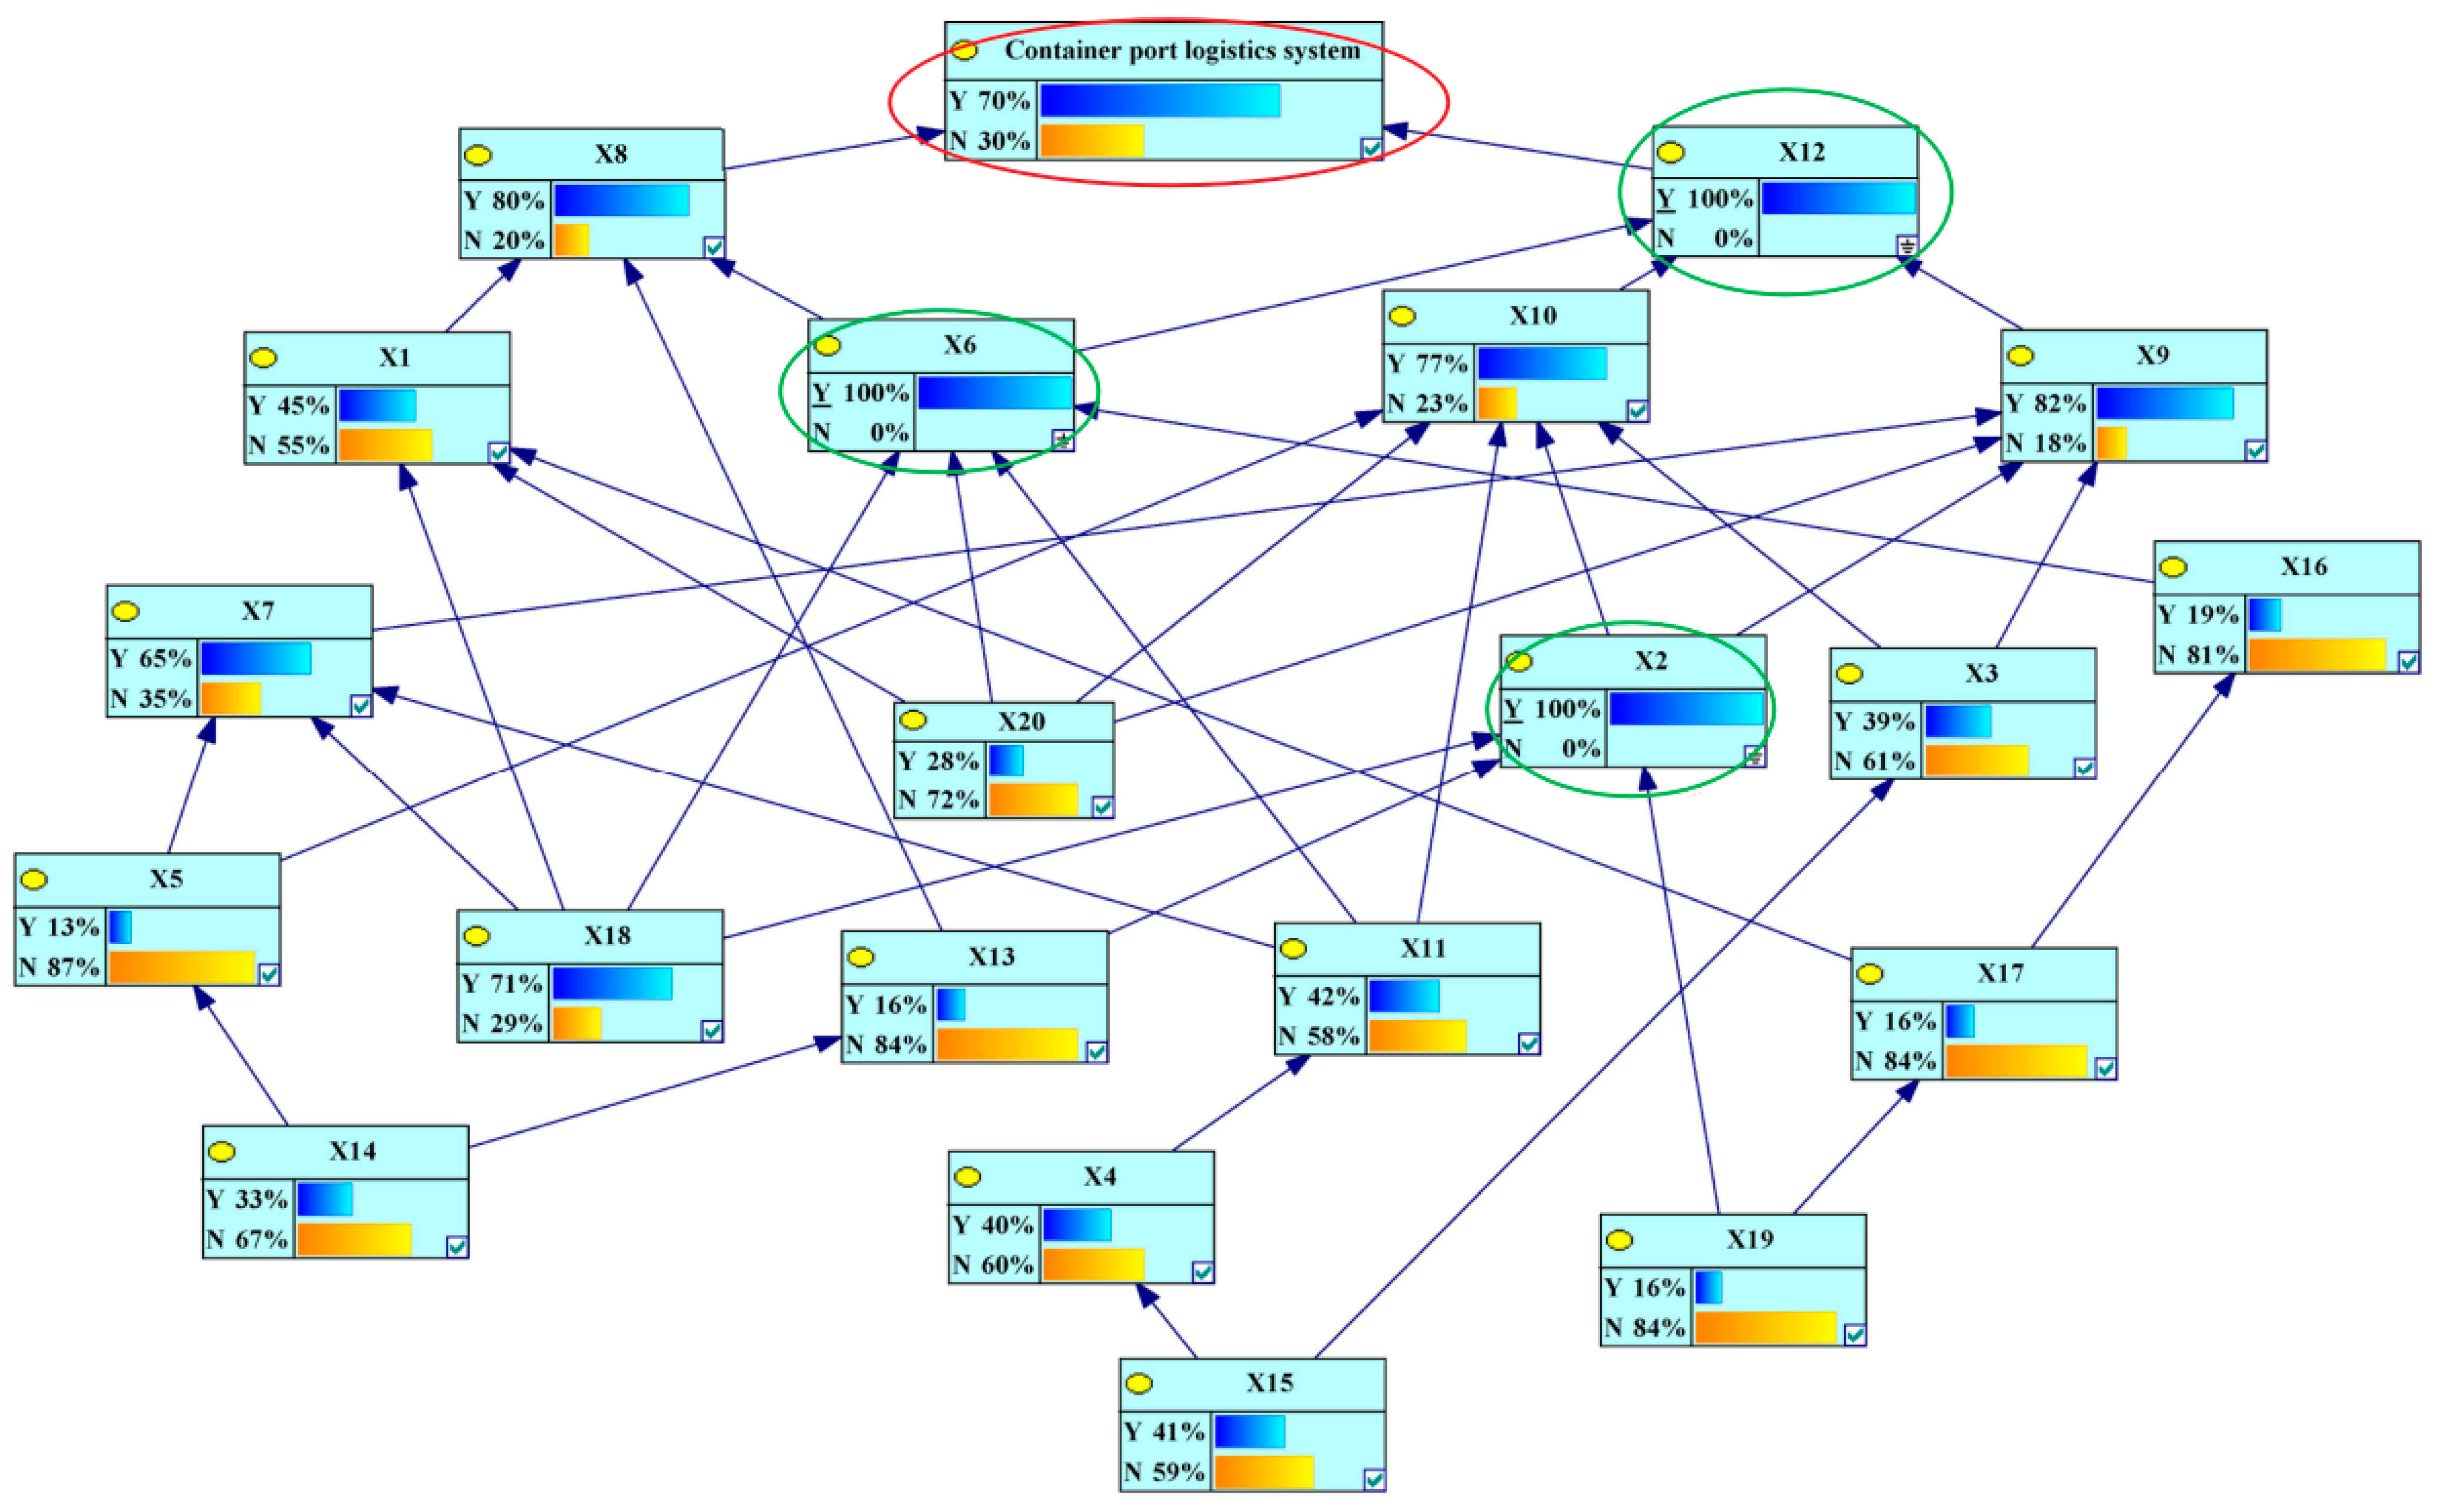
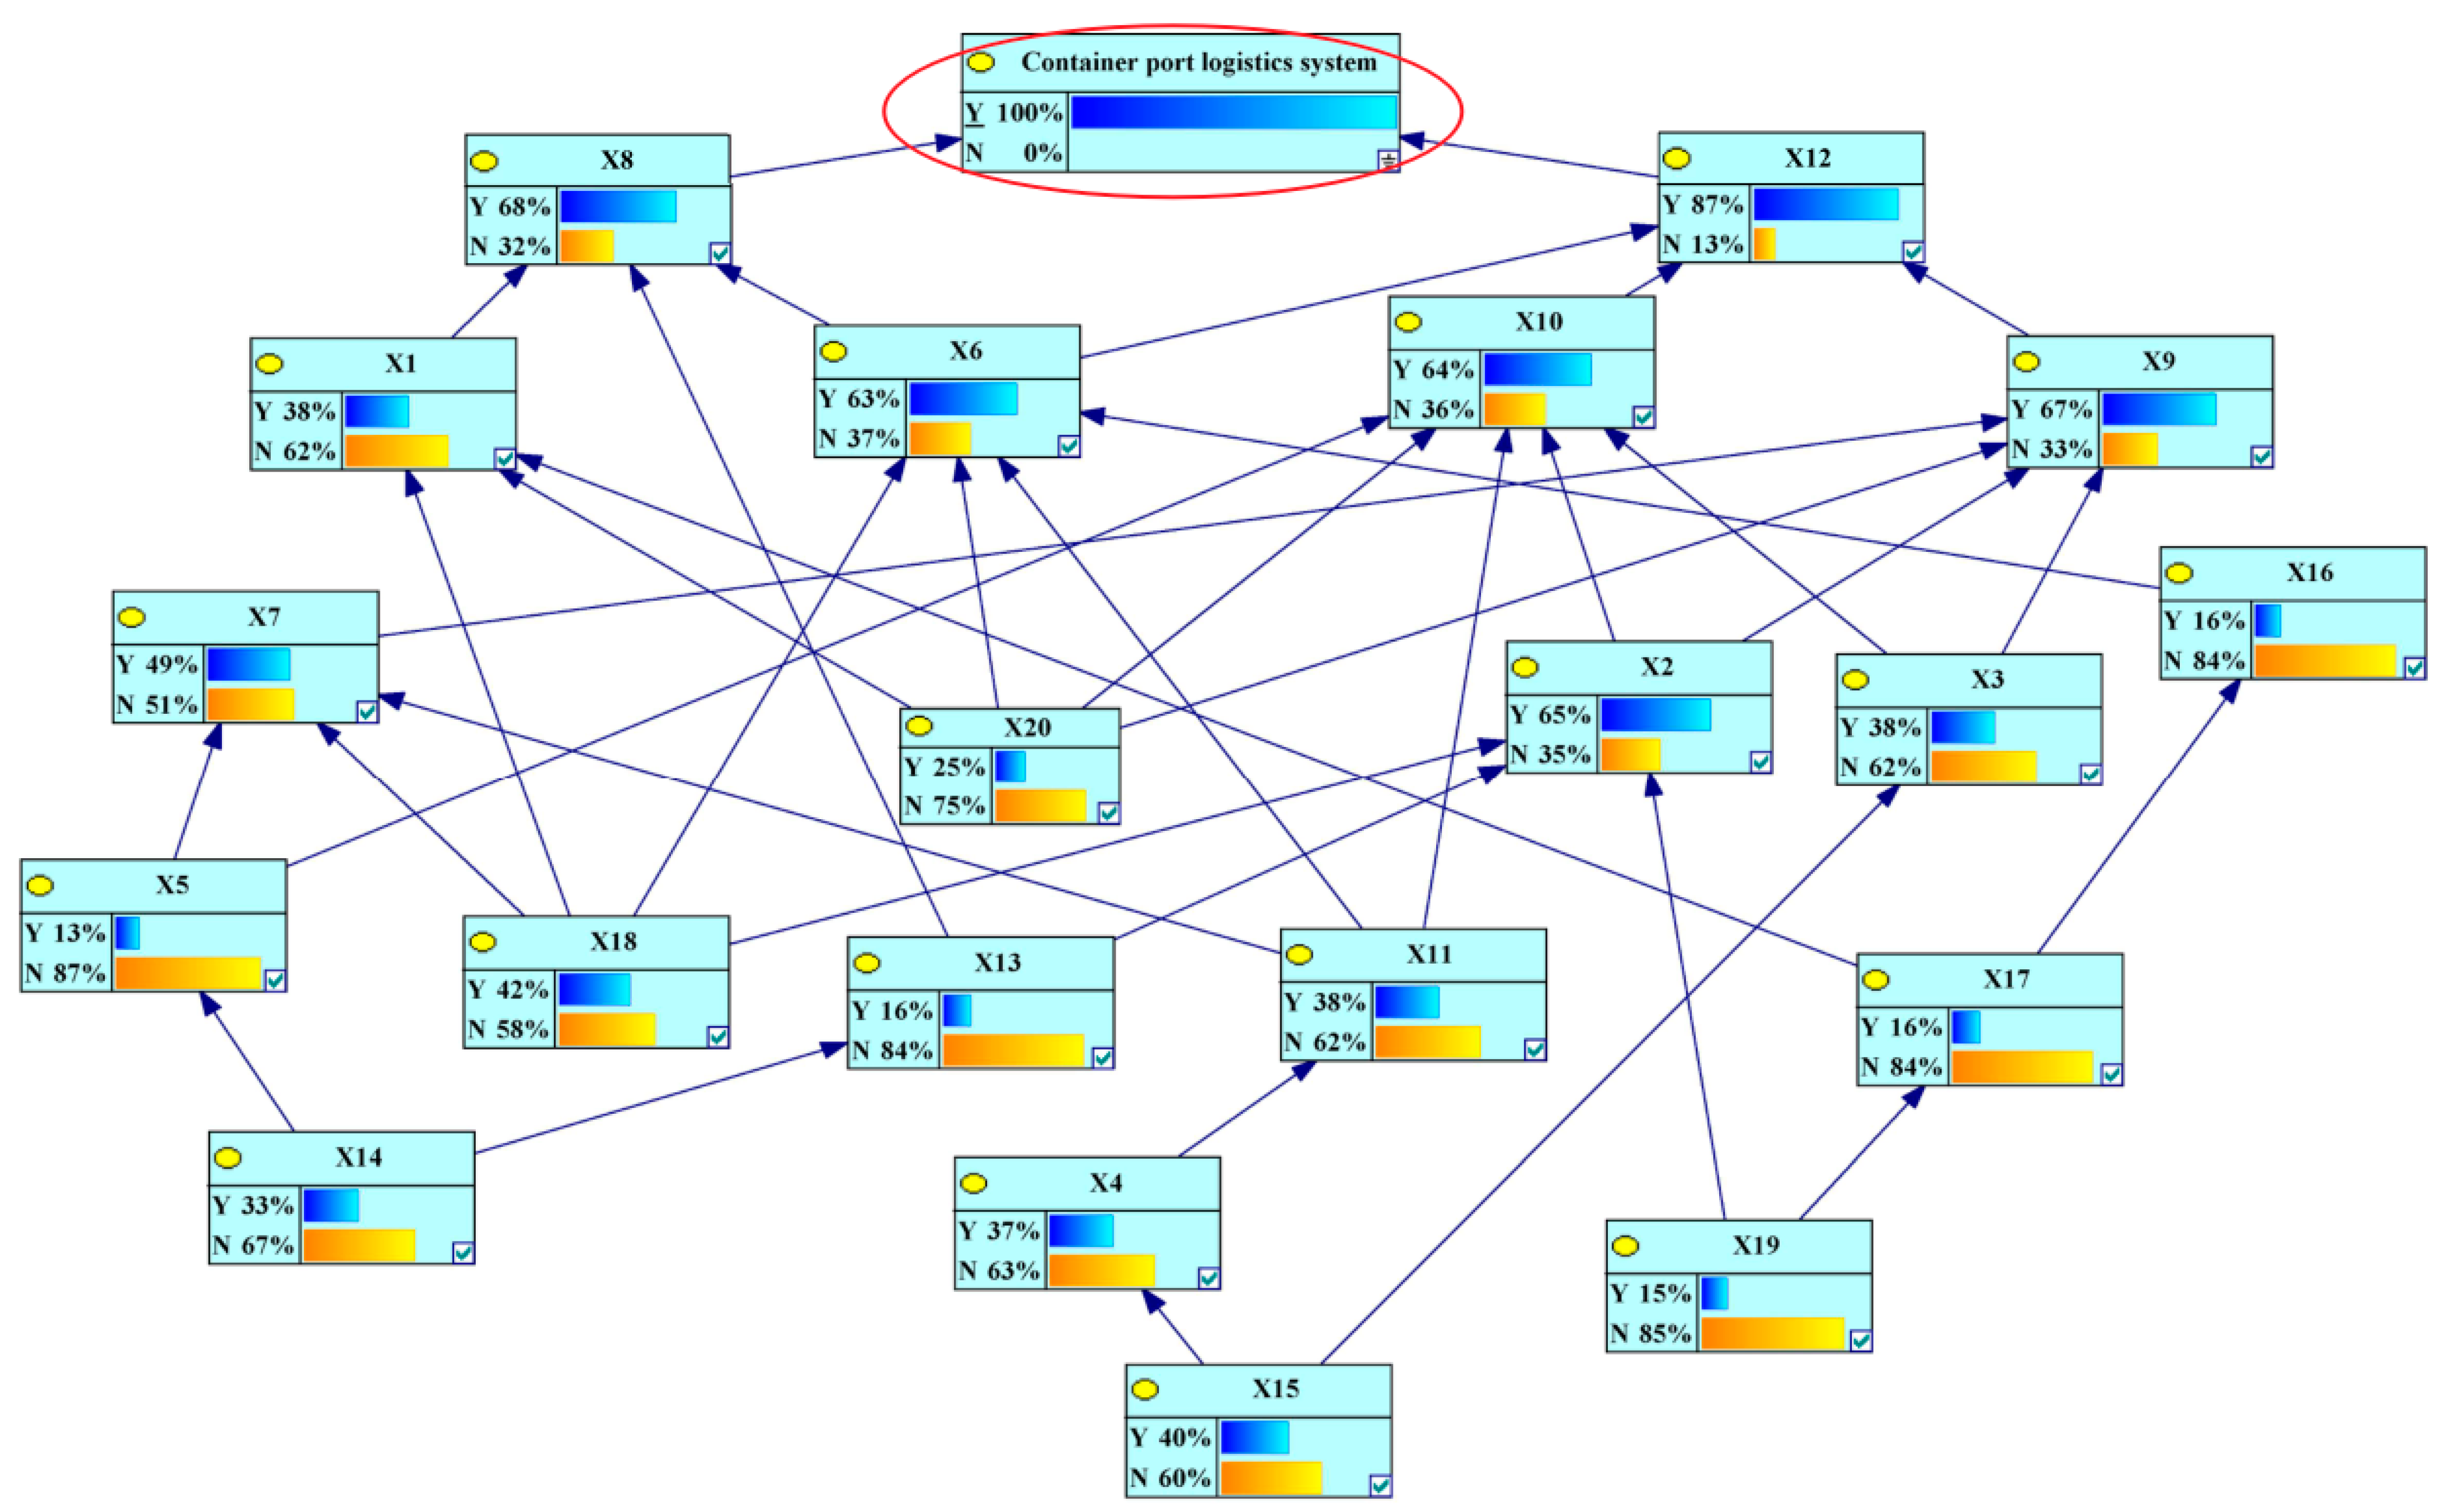
4.2.2. Causal Reasoning Analysis
- Positive causal reasoning
- 2.
- Reverse Diagnostic Reasoning
5. Discussion
- (1)
- For the key cause factors, port managers should cut off their influence transmission among other factors to control the risk propagation and evolution; for the key result factors, it is necessary to not only control the influence consequences of the cause factors but also pay attention to preventing the risk emergence from increasing due to the mutual coupling among risk factors.
- (2)
- From the perspective of factor hierarchy and transmission, we should concentrate more on their subtle influence when managing the bottom risk factors; fundamentally eliminate the hidden problems and cut off the transmission path from the bottom risk factors to other high-level factors in a timely manner; and focus on the interaction between multiple factors and focus on time efficiency.
6. Conclusions
- 1.
- Conclusions and implications
- 2.
- Limitations
Author Contributions
Funding
Institutional Review Board Statement
Informed Consent Statement
Data Availability Statement
Conflicts of Interest
References
- Wan, C.; Yan, X.; Zhang, D.; Qu, Z.; Yang, Z. An advanced fuzzy Bayesian-based FMEA approach for assessing maritime supply chain risks. Transp. Res. Part E Logist. Transp. Rev. 2019, 125, 222–240. [Google Scholar] [CrossRef]
- Zhou, Y.; Li, X.; Yuen, K.F. Holistic risk assessment of container shipping service based on Bayesian Network Modelling. Reliab. Eng. Syst. Saf. 2022, 220, 108305. [Google Scholar] [CrossRef]
- Nguyen, S. A risk assessment model with systematical uncertainty treatment for container shipping operations. Marit. Policy Manag. 2020, 47, 778–796. [Google Scholar] [CrossRef]
- Sarkar, B.D.; Shankar, R. Understanding the barriers of port logistics for effective operation in the Industry 4.0 era: Data-driven decision making. Int. J. Inf. Manag. Data Insights 2021, 1, 100031. [Google Scholar] [CrossRef]
- Gurning, S.; Cahoon, S. Analysis of multi-mitigation scenarios on maritime disruptions. Marit. Policy Manag. 2011, 38, 251–268. [Google Scholar] [CrossRef]
- Wendler-Bosco, V.; Nicholson, C. Port disruption impact on the maritime supply chain: A literature review. Sustain. Resilient Infrastruct. 2019, 5, 378–394. [Google Scholar] [CrossRef]
- Pallis, P.L. Port risk management in container terminals. Transp. Res. Procedia 2017, 25, 4411–4421. [Google Scholar] [CrossRef]
- Loh, H.S.; Zhou, Q.; Thai, V.V.; Wong, Y.D.; Yuen, K.F. Fuzzy comprehensive evaluation of port-centric supply chain disruption threats. Ocean. Coast. Manag. 2017, 148, 53–62. [Google Scholar] [CrossRef]
- Mokhtari, K.; Ren, J.; Roberts, C.; Wang, J. Application of a generic bow-tie based risk analysis framework on risk management of sea ports and offshore terminals. J. Hazard. Mater. 2011, 192, 465–475. [Google Scholar] [CrossRef]
- John, A.; Paraskevadakis, D.; Bury, A.; Yang, Z.; Riahi, R.; Wang, J. An integrated fuzzy risk assessment for seaport operations. Saf. Sci. 2014, 68, 180–194. [Google Scholar] [CrossRef]
- Mokhtari, K.; Ren, J.; Roberts, C.; Wang, J. Decision support framework for risk management on sea ports and terminals using fuzzy set theory and evidential reasoning approach. Expert Syst. Appl. 2012, 39, 5087–5103. [Google Scholar] [CrossRef]
- Alyami, H.; Lee, P.T.-W.; Yang, Z.; Riahi, R.; Bonsall, S.; Wang, J. An advanced risk analysis approach for container port safety evaluation. Marit. Policy Manag. 2014, 41, 634–650. [Google Scholar] [CrossRef]
- Alyami, H.; Yang, Z.; Riahi, R.; Bonsall, S.; Wang, J. Advanced uncertainty modelling for container port risk analysis. Accid. Anal. Prev. 2019, 123, 411–421. [Google Scholar] [CrossRef]
- Du, Y.-W.; Zhou, W. New improved DEMATEL method based on both subjective experience and objective data. Eng. Appl. Artif. Intell. 2019, 83, 57–71. [Google Scholar] [CrossRef]
- Qin, M.; Wang, X.; Du, Y. Factors affecting marine ranching risk in China and their hierarchical relationships based on DEMATEL, ISM, and BN. Aquaculture 2022, 549, 737802. [Google Scholar] [CrossRef]
- Onisko, A.; Druzdzel, M.J.; Wasyluk, H. Learning Bayesian network parameters from small data sets: Application of Noisy-OR gates. Int. J. Approx. Reason. 2001, 27, 165–182. [Google Scholar] [CrossRef]
- Budiyanto, M.A.; Fernanda, H. Risk assessment of work accident in container terminals using the fault tree analysis method. J. Mar. Sci. Eng. 2020, 8, 466. [Google Scholar] [CrossRef]
- Chang, C.-H.; Xu, J.; Song, D.-P. Risk analysis for container shipping: From a logistics perspective. Int. J. Logist. Manag. 2015, 26, 147–171. [Google Scholar] [CrossRef]
- Ding, J.F.; Tseng, W.J. Fuzzy risk assessment on safety operations for exclusive container terminals at Kaohsiung port in Taiwan. Proc. Inst. Mech. Eng. Part M J. Eng. Marit Environ. 2013, 227, 208–220. [Google Scholar] [CrossRef]
- Khan, R.U.; Yin, J.; Mustafa, F.S.; Anning, N. Risk assessment for berthing of hazardous cargo vessels using Bayesian networks. Ocean. Coast. Manag. 2021, 210, 105673. [Google Scholar] [CrossRef]
- Guo, Y.L.; Jin, Y.X.; Hu, S.P.; Yang, Z.L.; Xi, Y.T.; Han, B. Risk evolution analysis of ship pilotage operation by an integrated model of FRAM and DBN. Reliab. Eng. Syst. Saf. 2023, 229, 108850. [Google Scholar] [CrossRef]
- Yang, Z.; Wan, C.; Yang, Z.; Qing, Y. Using Bayesian network-based TOPSIS to aid dynamic port state control detention risk control decision. Reliab. Eng. Syst. Saf. 2021, 213, 107784. [Google Scholar] [CrossRef]
- Hanninen, M. Bayesian networks for maritime traffic accident prevention: Benefits and challenges. Accid. Anal. Prev. 2014, 73, 305–312. [Google Scholar] [CrossRef] [PubMed]
- Garvey, M.D.; Carnovale, S.; Yeniyurt, S. An analytical framework for supply network risk propagation: A Bayesian network approach. Eur. J. Oper. Res. 2015, 243, 618–627. [Google Scholar] [CrossRef]
- Fan, S.; Zhang, J.; Blanco-Davis, E.; Yang, Z.; Yan, X. Maritime accident prevention strategy formulation from a human factor perspective using Bayesian Networks and TOPSIS. Ocean. Eng. 2020, 210, 107544. [Google Scholar] [CrossRef]
- Chen, P.R.; Zhang, Z.P.; Huang, Y.J.; Dai, L.; Hu, H. Risk assessment of marine accidents with Fuzzy Bayesian Networks and causal analysis. Ocean. Coast. Manag. 2022, 228, 106323. [Google Scholar] [CrossRef]
- Loh, H.S.; Thai, V.V.; Wong, Y.D.; Yuen, K.F.; Zhou, Q. Portfolio of port-centric supply chain disruption threats. Int. J. Logist. Manag. 2017, 28, 1368–1386. [Google Scholar] [CrossRef]
- Zhang, X.X.; Chen, W.J.; Xi, Y.T.; Hu, S.P.; Tang, L.J. Dynamics simulation of the risk coupling effect between maritime pilotage human factors under the HFACS framework. J. Mar. Sci. Eng. 2020, 8, 144. [Google Scholar] [CrossRef]
- John, A.; Yang, Z.; Riahi, R.; Wang, J. A risk assessment approach to improve the resilience of a seaport system using Bayesian networks. Ocean. Eng. 2016, 111, 136–147. [Google Scholar] [CrossRef]
- Dhahri, M.; Elmsalmi, M.; Aljuaid, A.M.; Hachicha, W. Seaport terminals risks prioritization using a structural modeling-based approach: A real case study. J. Mar. Sci. Eng. 2022, 10, 217. [Google Scholar] [CrossRef]
- Gui, D.; Wang, H.; Yu, M. Risk assessment of port congestion risk during the COVID-19 pandemic. J. Mar. Sci. Eng. 2022, 10, 150. [Google Scholar] [CrossRef]
- Hu, Q.; Wiegmans, B.; Corman, F.; Gabriel, L. Integration of inter-terminal transport and hinterland rail transport. Flex. Serv. Manuf. J. 2019, 31, 807–831. [Google Scholar] [CrossRef]
- Notteboom, T.; Lam, J.S.L. Dealing with uncertainty and volatility in shipping and ports. Marit. Policy Manag. 2014, 41, 611–614. [Google Scholar] [CrossRef]
- Verschuur, J.; Koks, E.E.; Hall, J.W. Port disruptions due to natural disasters: Insights into port and logistics resilience. Transp. Res. Part D Transp. Environ. 2020, 85, 102393. [Google Scholar] [CrossRef]
- Lam, J.S.L.; Su, S.L. Disruption risks and mitigation strategies: An analysis of Asian ports. Marit. Policy Manag. 2015, 42, 415–435. [Google Scholar] [CrossRef]
- Kwesi-Buor, J.; Menachof, D.A.; Talas, R. Scenario analysis and disaster preparedness for port and maritime logistics risk management. Accid. Anal. Prev. 2019, 123, 433–447. [Google Scholar] [CrossRef]
- Balakrishnan, S.; Lim, T.; Zhang, Z. A methodology for evaluating the economic risks of hurricane-related disruptions to port operations. Transp. Res. Part A Policy Pract. 2022, 162, 58–79. [Google Scholar] [CrossRef]
- Notteboom, T.; Pallis, T.; Rodrigue, J.-P. Disruptions and resilience in global container shipping and ports: The COVID-19 pandemic versus the 2008–2009 financial crisis. Marit. Econ. Amp. Logist. 2021, 23, 179–210. [Google Scholar] [CrossRef]
- Hossain, N.U.I.; Nur, F.; Hosseini, S.; Jaradat, R.; Marufuzzaman, M.; Puryear, S.M. A Bayesian network based approach for modeling and assessing resilience: A case study of a full service deep water port. Reliab. Eng. Syst. Saf. 2019, 189, 378–396. [Google Scholar] [CrossRef]
- Hosseini, S.; Ivanov, D. Bayesian networks for supply chain risk, resilience and ripple effect analysis: A literature review. Expert Syst. Appl. 2020, 161, 113649. [Google Scholar] [CrossRef]
- Qazi, A.; Dickson, A.; Quigley, J.; Gaudenzi, B. Supply chain risk network management: A Bayesian belief network and expected utility based approach for managing supply chain risks. Int. J. Prod. Econ. 2018, 196, 24–42. [Google Scholar] [CrossRef]
- Jiang, M.; Lu, J.; Qu, Z.; Yang, Z. Port vulnerability assessment from a supply Chain perspective. Ocean. Coast. Manag. 2021, 213, 105851. [Google Scholar] [CrossRef]
- Hsieh, C.-H. Disaster risk assessment of ports based on the perspective of vulnerability. Nat. Hazards 2014, 74, 851–864. [Google Scholar] [CrossRef]
- Wu, W.-W.; Lee, Y.-T. Developing global managers’ competencies using the fuzzy DEMATEL method. Expert Syst. Appl. 2007, 32, 499–507. [Google Scholar] [CrossRef]
- Si, S.-L.; You, X.-Y.; Liu, H.-C.; Zhang, P. DEMATEL Technique: A Systematic Review of the State-of-the-Art Literature on Methodologies and Applications. Math. Probl. Eng. 2018, 2018, 3696457. [Google Scholar] [CrossRef]
- Yazdi, M.; Khan, F.; Abbassi, R.; Rusli, R. Improved DEMATEL methodology for effective safety management decision-making. Saf. Sci. 2020, 127, 104705. [Google Scholar] [CrossRef]
- Jiao, J.; Wei, M.W.; Yuan, Y.; Zhao, T. Risk Quantification and Analysis of Coupled Factors Based on the DEMATEL Model and a Bayesian Network. Appl. Sci. 2020, 10, 317. [Google Scholar] [CrossRef]
- Jiang, X.D.; Fan, H.M.; Zhang, Y.; Yuan, Z. Using interpretive structural modeling and fuzzy analytic network process to identify and allocate risks in Arctic shipping strategic alliance. Polar Sci. 2018, 17, 83–93. [Google Scholar] [CrossRef]
- Huang, W.; Zhang, Y.; Kou, X.; Yin, D.; Mi, R.; Li, L. Railway dangerous goods transportation system risk analysis: An Interpretive Structural Modeling and Bayesian Network combining approach. Reliab. Eng. Syst. Saf. 2020, 204, 107220. [Google Scholar] [CrossRef]
- Hossain, N.U.I.; El Amrani, S.; Jaradat, R.; Marufuzzaman, M.; Buchanan, R.; Rinaudo, C.; Hamilton, M. Modeling and assessing interdependenciesS between critical infrastructures using Bayesian network: A case study of inland waterway port and surrounding supply chain network. Reliab. Eng. Syst. Saf. 2020, 198, 106898. [Google Scholar] [CrossRef]
- Ojha, R.; Ghadge, A.; Tiwari, M.K.; Bititci, U.S. Bayesian network modelling for supply chain risk propagation. Int. J. Prod. Res. 2018, 56, 5795–5819. [Google Scholar] [CrossRef]
- Yu, J.X.; Wu, S.B.; Yu, Y.; Chen, H.; Fan, H.; Liu, J.; Ge, S. Process system failure evaluation method based on a Noisy-or Gate intuitionistic fuzzy Bayesian network in an uncertain environment. Process Saf. Environ. Prot. 2021, 150, 281–297. [Google Scholar]
- Gou, X.; Lam, J.S.L. Risk analysis of marine cargoes and major port disruptions. Marit. Econ. Logist. 2019, 21, 497–523. [Google Scholar] [CrossRef]


| Category | Description | Code | Risk Factors | Remark | References |
|---|---|---|---|---|---|
| Human risks (H) | Port activities are labor-intensive, this paper considers human activities that may lead to abnormal system operation as human risks. | H1 | labor shortages | shortage of in-port workers (dock or warehouse workers), shortage of truck drivers; port labor strikes | [4,9,13,17,27,30,36] |
| H2 | operating errors | improper operation due to misunderstanding of instructions, negligence of personnel, poor communication, poor condition of workers, etc. | |||
| H3 | lack of security awareness | lack of relevant security awareness among port workers and unsafe behavior during work resulting in operational accidents | |||
| H4 | insufficient professional knowledge and skills | insufficient maintenance ability of machinery, the port operation is not skilled. | |||
| H5 | poor supervision | lack of complete supervision and inspection of port operations | |||
| Facility and equipment risks (F) | Facilities and equipment are important basic guarantees for port logistics operation systems. Facility and equipment risks can be explained as factors that cause the failure of operations, such as loading and unloading, transit, and warehousing. | F1 | lack of port equipment | inadequate handling equipment and transit equipment, such as cranes, forklifts, trailers, and trucks | [4,7,8,10,12,17,27,29] |
| F2 | over-aging and defects of equipment | over-aged and defective port operation machinery and equipment | |||
| F3 | lack of warehouse/yard space | port warehouse or a yard full of cargo with no applicable inventory space | |||
| F4 | equipment breakdown | machinery failure, including cranes; in-vehicle equipment failure, such as trucks; the power supply equipment failure | |||
| F5 | port information technology (IT) system failure | failure of the port logistics information network system (navigation, communication, and dispatching system) | |||
| Technical risks (T) | Technologies that may cause container operation failures or affect operational efficiency are defined as technical risks. | T1 | lack of maintenance technology | insufficient technical capacity for the maintenance of port infrastructure and machinery equipment, and IT system. | [7,9,10,29] |
| T2 | mismatch between technological innovation and system capabilities | immaturity of the technology required for technological innovation in the port, the lack of corresponding facilities and equipment Inadequate | |||
| Organization and management risks (O) | Management organization refers to the activities that maintain the safety and order of port operations | O1 | poor organization of port production scheduling | improper organization and command of port handling, pilotage, and other production scheduling may cause production delay, congestion, and other problems | [4,10,29,30] |
| O2 | Imperfect management organization rules and regulations | sound rules and regulations are the guarantees of port operation; loopholes may lead to the disorganization of ports | |||
| O3 | lack of professional training or safety education | staff should master the necessary professional skills and safety knowledge to reduce accident injuries | |||
| External risks (E) | External risks refer to the risks arising from changes in the port operating environment, mainly including political and economic environment, natural disasters, and emergencies. | E1 | port management policy | port security inspection policy, customs clearance rules, yard management policy, etc. | [2,4,7,9,10,27,29,34,36,37,43] |
| E2 | economic and trade risks | trade policies, customs rules, global economic states, market freight rates, and labor costs of various countries | |||
| E3 | natural disaster/harsh climate | earthquake, tsunami, hurricane, and so on, heavy rain, storms, and other abrupt climate change | |||
| E4 | public health event | COVID-19 | |||
| E5 | security threats | trafficking, smuggling, breaking in/theft, terrorist attacks, cyber attack, etc. |
| Score | Impact Level | Description |
|---|---|---|
| 0 | No influence | Factor ihas no influence on factor j |
| 1 | Low influence | The occurrence of factor i has a low influence on factor j |
| 2 | Medium influence | The occurrence of factor i has a 50% probability of affecting factor j |
| 3 | High influence | The occurrence of factor i has a high influence on factor j |
| 4 | Very high influence | The occurrence of factor i will have the greatest influence on factor j |
| Factors | Influencing Degree D | Influenced Degree C | Centrality M | Causality R | Weight | Rank | Factor Attribute |
|---|---|---|---|---|---|---|---|
| X1 | 0.813 | 0.793 | 1.606 | 0.02 | 0.044 | 13 | Cause |
| X2 | 0.897 | 1.061 | 1.958 | −0.164 | 0.053 | 6 | Result |
| X3 | 0.866 | 0.335 | 1.2 | 0.531 | 0.033 | 19 | Cause |
| X4 | 1.336 | 0.25 | 1.586 | 1.087 | 0.043 | 15 | Cause |
| X5 | 1.244 | 0.614 | 1.857 | 0.63 | 0.05 | 8 | Cause |
| X6 | 0.401 | 1.856 | 2.258 | −1.455 | 0.061 | 5 | Result |
| X7 | 0.439 | 1.382 | 1.82 | −0.943 | 0.049 | 9 | Result |
| X8 | 0.243 | 2.173 | 2.415 | −1.93 | 0.065 | 4 | Result |
| X9 | 0.499 | 2.177 | 2.676 | −1.678 | 0.073 | 2 | Result |
| X10 | 0.463 | 2.112 | 2.575 | −1.648 | 0.07 | 3 | Result |
| X11 | 1.048 | 0.602 | 1.65 | 0.446 | 0.045 | 12 | Cause |
| X12 | 0.327 | 2.508 | 2.835 | −2.181 | 0.077 | 1 | Result |
| X13 | 0.801 | 1.158 | 1.959 | −0.357 | 0.053 | 6 | Result |
| X14 | 1.055 | 0.363 | 1.418 | 0.691 | 0.038 | 18 | Cause |
| X15 | 1.296 | 0.334 | 1.631 | 0.962 | 0.044 | 13 | Cause |
| X16 | 1.266 | 0.425 | 1.692 | 0.841 | 0.046 | 11 | Cause |
| X17 | 0.806 | 0.303 | 1.109 | 0.503 | 0.03 | 20 | Cause |
| X18 | 1.724 | 0 | 1.724 | 1.724 | 0.047 | 10 | Cause |
| X19 | 1.449 | 0 | 1.449 | 1.449 | 0.039 | 17 | Cause |
| X20 | 1.472 | 0 | 1.472 | 1.472 | 0.04 | 16 | Cause |
| Level Li | Factors Xi |
|---|---|
| L1 | X8, X12 |
| L2 | X1, X6, X9, X10 |
| L3 | X2, X3, X7, X16, X20 |
| L4 | X5, X11, X13, X17, X18 |
| L5 | X4, X14, X19 |
| L6 | X15 |
| X5 | X11 | X18 | X7 | |
|---|---|---|---|---|
| Y | N | |||
| Y | Y | Y | 0.88713 | 0.11287 |
| N | 0.6074 | 0.3926 | ||
| N | Y | 0.82442 | 0.17558 | |
| N | 0.38929 | 0.61071 | ||
| N | Y | Y | 0.83366 | 0.16634 |
| N | 0.42143 | 0.57857 | ||
| N | Y | 0.74125 | 0.25875 | |
| N | 0.1 | 0.9 | ||
Disclaimer/Publisher’s Note: The statements, opinions and data contained in all publications are solely those of the individual author(s) and contributor(s) and not of MDPI and/or the editor(s). MDPI and/or the editor(s) disclaim responsibility for any injury to people or property resulting from any ideas, methods, instructions or products referred to in the content. |
© 2023 by the authors. Licensee MDPI, Basel, Switzerland. This article is an open access article distributed under the terms and conditions of the Creative Commons Attribution (CC BY) license (https://creativecommons.org/licenses/by/4.0/).
Share and Cite
Wang, M.; Wang, H. Exploring the Failure Mechanism of Container Port Logistics System Based on Multi-Factor Coupling. J. Mar. Sci. Eng. 2023, 11, 1067. https://doi.org/10.3390/jmse11051067
Wang M, Wang H. Exploring the Failure Mechanism of Container Port Logistics System Based on Multi-Factor Coupling. Journal of Marine Science and Engineering. 2023; 11(5):1067. https://doi.org/10.3390/jmse11051067
Chicago/Turabian StyleWang, Mengmeng, and Haiyan Wang. 2023. "Exploring the Failure Mechanism of Container Port Logistics System Based on Multi-Factor Coupling" Journal of Marine Science and Engineering 11, no. 5: 1067. https://doi.org/10.3390/jmse11051067