Article

Rule-Based Control Studies of LNG–Battery Hybrid Tugboat

by
Sharul Baggio Roslan
1,
Zhi Yung Tay
1,*,
Dimitrios Konovessis
2,
Joo Hock Ang
3 and
Nirmal Vineeth Menon
3
1
Singapore Institute of Technology, 10 Dover Drive, Singapore 138683, Singapore
2
Department of Naval Architecture, Ocean and Marine Engineering, University of Strathclyde, 100 Montrose St, Glasgow G4 0LZ, UK
3
Seatrium Limited, 80 Tuas South Boulevard, Singapore 637051, Singapore
*
Author to whom correspondence should be addressed.
J. Mar. Sci. Eng. 2023, 11(7), 1307; https://doi.org/10.3390/jmse11071307
Submission received: 1 June 2023 / Revised: 17 June 2023 / Accepted: 24 June 2023 / Published: 27 June 2023
(This article belongs to the Special Issue Advances in Innovative Solutions for Ship Energy Efficiency)

Abstract

:
The use of hybrid energy systems in ships has increased in recent years due to environmental concerns and rising fuel prices. This paper focuses on the development and study of a hybrid energy system using liquefied natural gas (LNG) and batteries for a tugboat. The hybrid system model is created in MATLAB/Simulink® and uses fuel data obtained from an operational diesel-powered tugboat. The LNG–hybrid system is then subjected to testing in four distinct configurations: fixed speed, variable speed, and with and without a battery. The different configurations are compared by computing the daily fuel cost, CO2 emissions, energy efficiency operation indicator ( E E O I ) and carbon intensity indicator ( C I I ) ratings in three distinct operation cases. The analysis reveals that the use of an LNG–battery hybrid tugboat results in an average reduction of 67.2% in CO2 emissions and an average decrease of 64.0% in daily fuel cost compared to a diesel system. An energy management system using rule-based (RB) control is incorporated to compare the daily cost and CO2 emissions for one of the case studies. The rule-based control that requires the battery to be used and the LNG engine to be switched off at the lowest allowable minimum power based on the specific gas consumption produces the most cost-effective control strategy out of all the different control strategies tested. The result demonstrates that an additional reduction of CO2 and daily fuel cost for LNG–battery hybrid tugboats by 23.8% and 22.3%, respectively, could be achieved with the implementation of the cost-effective strategy as compared to not having a control strategy.

1. Introduction

The main focus of environmental concerns in the modern world is on lowering carbon emissions to lessen the effects of global warming. Since 2016, the marine industry has been subject to regulations on reducing carbon emissions. The main objective of MARPOL Annex VI, which was created by the International Maritime Organization (IMO), was to reduce yearly GHG emissions by at least half by the year 2050 [1], with the target of reducing carbon emissions by at least 40% by 2030, with a 70% reduction by 2050. Stricter emission limits have been established, such as a 0.1% m/m marine sulphur content limit in emission-controlled areas (ECA) from 2015 and a 0.5% m/m limit starting in January 2020 [2]. This requirement resulted in vessel owners seeking various means to reduce CO2 emissions [3], such as using scrubbers/exhaust gas cleaning systems, carbon capture and storage, or alternative fuel sources, e.g., hydrogen, ammonia or LNG [4]. Other means of reducing CO2 emissions by altering vessel design or operational measures have been experimented with, by reducing vessel speed [5] or using air lubrication to reduce hull friction [6].
Since July 2011, following the 62nd meeting of the Marine Environment Protection Committee (MEPC), two CO2 emission limitation indicators have been introduced—the energy efficiency design index (EEDI) for new ships and the ship energy efficiency management plan (SEEMP) for all ships [7]. Later in 2020, MEPC introduced the efficient existing ship index (EEXI) and annual carbon intensity indicator ( C I I ), to be implemented in 2023 [8]. Similar to the EEDI, which takes into consideration the vessel design parameters, the EEXI also measures the CO2 emissions per transport work. However, the EEXI applies to existing ships as opposed to the EEDI, which only applies to new ships. The attained EEXI values are to be below the required EEXI to ensure that the ship fulfils the minimum energy efficiency standards [9].
The SEEMP includes both the CII and the energy efficiency operational index ( E E O I ). The CII ratings and the annual operational reports are required for vessels of more than 5000 GT. A notable study that incorporates CII ratings was conducted by Gianni et al. [10], who analysed the various power configurations of a cruise ship that did not adhere to the CII requirements. The study discovered that only marine gas oil (MGO), when compared to shore connection, solid oxide fuel cells and LNG, does not meet the 2024 CII regulations and that only LNG power can get a CII “A” grade up to 2026. Another CII ratings-based study [11] examined the CO2 emissions reduction by using ammonia fuel engines and concluded that a total of 12,660 tonnes of CO2 emissions could be reduced with an “A” CII rating. However, building a new ship is more cost-effective due to the high initial cost of USD 5 million for retrofitting. The lack of research incorporating CII ratings is partly the motivation for including CII ratings in this paper.
With the stricter requirements, technological advancement and commercial adoption of electrical or hybrid propulsion have seen an increase in popularity to achieve zero-emission operation and improve vessel efficiency. For military and cruise ships, electrical propulsion vessels have existed since the 1990s, and over the years, they have experienced many improvements [12]. A milestone was achieved when the world’s first electric-powered car ferry, the Ampere, was built in 2015 [13]. The electrical propulsion system provides higher efficiency, lower carbon emission or zero emission in low loading conditions [14], and overall reduces operational costs. Because LNG shrinks by a factor of 1/600 during liquification, making it easier to transport and more accessible than other alternative fuels, hybrid propulsion using natural gas-powered engines or batteries has also recently seen an increase in popularity [15]. Additionally, LNG is a cost-effective fuel that reduces CO2 emission by 26% and is sulphur-free, albeit methane slip may reduce the environmental benefits [16]. Lebedevas et al. [17] completed some noteworthy past research on employing LNG dual-fuel engines for tugboats, achieving reductions of 10%, 91% and 65% in CO2, SO2 and NOX emissions, respectively. Compared to utilizing diesel, using a hybrid diesel-LNG propulsion system saves 33% on fuel costs. Another study on LNG dual-fuel engines was conducted by Zhang et al. [18], where an average savings of 22% was obtained for the engines operating at different loads at a fixed speed when compared to a full diesel engine operation, but this savings percentage decreases as the load increases. A thesis by Vadset [19] on LNG–battery hybrid systems compared LNG–battery systems with variable speeds to full-LNG systems and found that variable-speed LNG systems with batteries can save 20% in fuel cost when compared to fixed-speed fully LNG systems. To the knowledge of the authors, there are not many studies that research the LNG–battery hybrid system, specifically on tugboats, thereby motivating the study of this subject in this paper.
The increase in hybrid propulsion systems allows power sources to be alternated for better energy optimisation and utilisation. Energy management systems (EMS) manage the power distribution between sources while providing the required power, i.e., the battery power and shore power, to determine the power charge in a generator such as fuel cells [20]. Some examples of EMS include methods such as rule-based (RB) control, nonlinear programming (NLP), genetic algorithm (GA) and equivalent consumption minimization strategy (ECMS). The distribution of power depends on the optimal power allocation due to different profiles, efficiency and cost aspects. Relevant past studies of using EMS on hybrid propulsion systems have been conducted by Breijs and Amam [21] using an RB control strategy for diesel–electric hybrid ferry, where a reduction of 11% in fuel consumption was achieved during sea trials. A control strategy using NLP was carried out on a diesel–electric hybrid tugboat to optimize the size of the battery and economic dispatch of the power system controllable unit [22]. The study found that the total operating cost was reduced by 13.5% by using the nonlinear programming control strategy. Research for a diesel–electric hybrid ferry by Banaei [23] used GA to optimise vessel operation cost, where a reduction of 3.5% in total operation cost was obtained. A study using ECMS by Kalikatzarakis [24] on a diesel–electric hybrid tugboat managed to reduce fuel consumption by 10%. Different EMS resulted in varying reductions in the respective studies listed, depending on the design requirements and the vessel types. The authors noticed that no significant studies have been performed on control strategies for LNG–battery hybrid systems and were thereby motivated to incorporate EMS into this paper.
This paper looks to assess the environmental and economic impacts of using an LNG–battery hybrid propulsion system for a 65-tonne tugboat as compared to using diesel or LNG as the sole propulsion system. With the use of data gathered from an equivalent diesel-powered tugboat, the data are used to profile the loading operations of the modelled tugboat. The hybrid LNG–battery tugboat system is created in MATLAB/Simulink® with the full system breakdown described in Section 2. Three different cases will be replicated on the model: Case 1: Manually logged operation data, Case 2: Designed operational profile, and Case 3: Past operational data from sensors. The system will be tested in four different configurations, i.e., diesel only, LNG with fixed speed at 1200 rpm, LNG with variable speed and LNG with variable speed with battery. The daily fuel operation cost, CO2 emissions emitted and E E O I are calculated for the aforementioned respective cases and configurations and compared against one another. As the CII ratings are not required for vessels below 5000 GT, this paper will neglect the weight requirements and categorise the tugboat as a cruise passenger ship for comparison purposes. An RB control strategy is then applied for Case 2, where several control strategies are applied to compare against the results without an EMS. Further development of the system modelling could be conducted with the advancement of digital twins that incorporates machine learning [25,26,27,28,29,30] and big data analytics [31,32].
The following sections will be arranged as follows: Section 2 presents an overview of the tugboat, the methodologies used to obtain the vessel loading profiles, and the description of the hybrid LNG–battery power system modelled on Simulink without an EMS and with the EMS added to the model; Section 3 compares the operation cost, emissions and E E O I of the different cases and fuel types; Section 4 compares the difference in results without and with an RB control; and lastly, Section 5 concludes with a summary of the work and recommendations for future research.

2. System Overview

Figure 1 shows the hybrid power system diagram using an LNG and battery. The tugboat consists of two LNG generator sets (Gensets) that serve as the primary energy source, with each having a maximum output of 1492 kW, a maximum speed of 1600 rpm and a nominal voltage of 545 V. Two lithium-ion batteries with an output of 452 kWh each serve as energy storage. The vessel loads include the two azimuth thrusters with ducted propellers, service and hotel load, heating, ventilation and air-conditioning (HVAC), lighting and pumps. A 1000 V modern direct current (DC) distribution system is used in the present system because it reduces the power conversion losses, making it simpler to integrate the energy storage technologies, and improves fuel efficiency while the system is running at part load [33]. The alternate current (AC) power from the Gensets is converted to DC power through a rectifier while the battery connects directly to the DC distribution. As such a system requires less equipment, it can improve round-trip efficiency. The hybrid power system is modelled in MATLAB/Simulink® to simulate the dynamic response of the system.

2.1. Loading Profile

In this study, the operation of a 65-tonne tugboat consisting of two Gensets and batteries is considered. The main operational modes can be categorised as (i) Idle or standby, (ii) Transit, and (iii) Tugging. The tugboat’s operational time-domain load profile was created based on the design loading parameters, manually recorded operation data and historical data from flowmeter sensors installed on a diesel tugboat with identical operations. Even though the length of a single operation can vary, an average of 120 min is typically needed for each tugging operation. To shorten the simulation time, the operational duration in the model will be downscaled to 120 s. In Section 3, the breakdown of each case’s operation mode and load profile is covered.

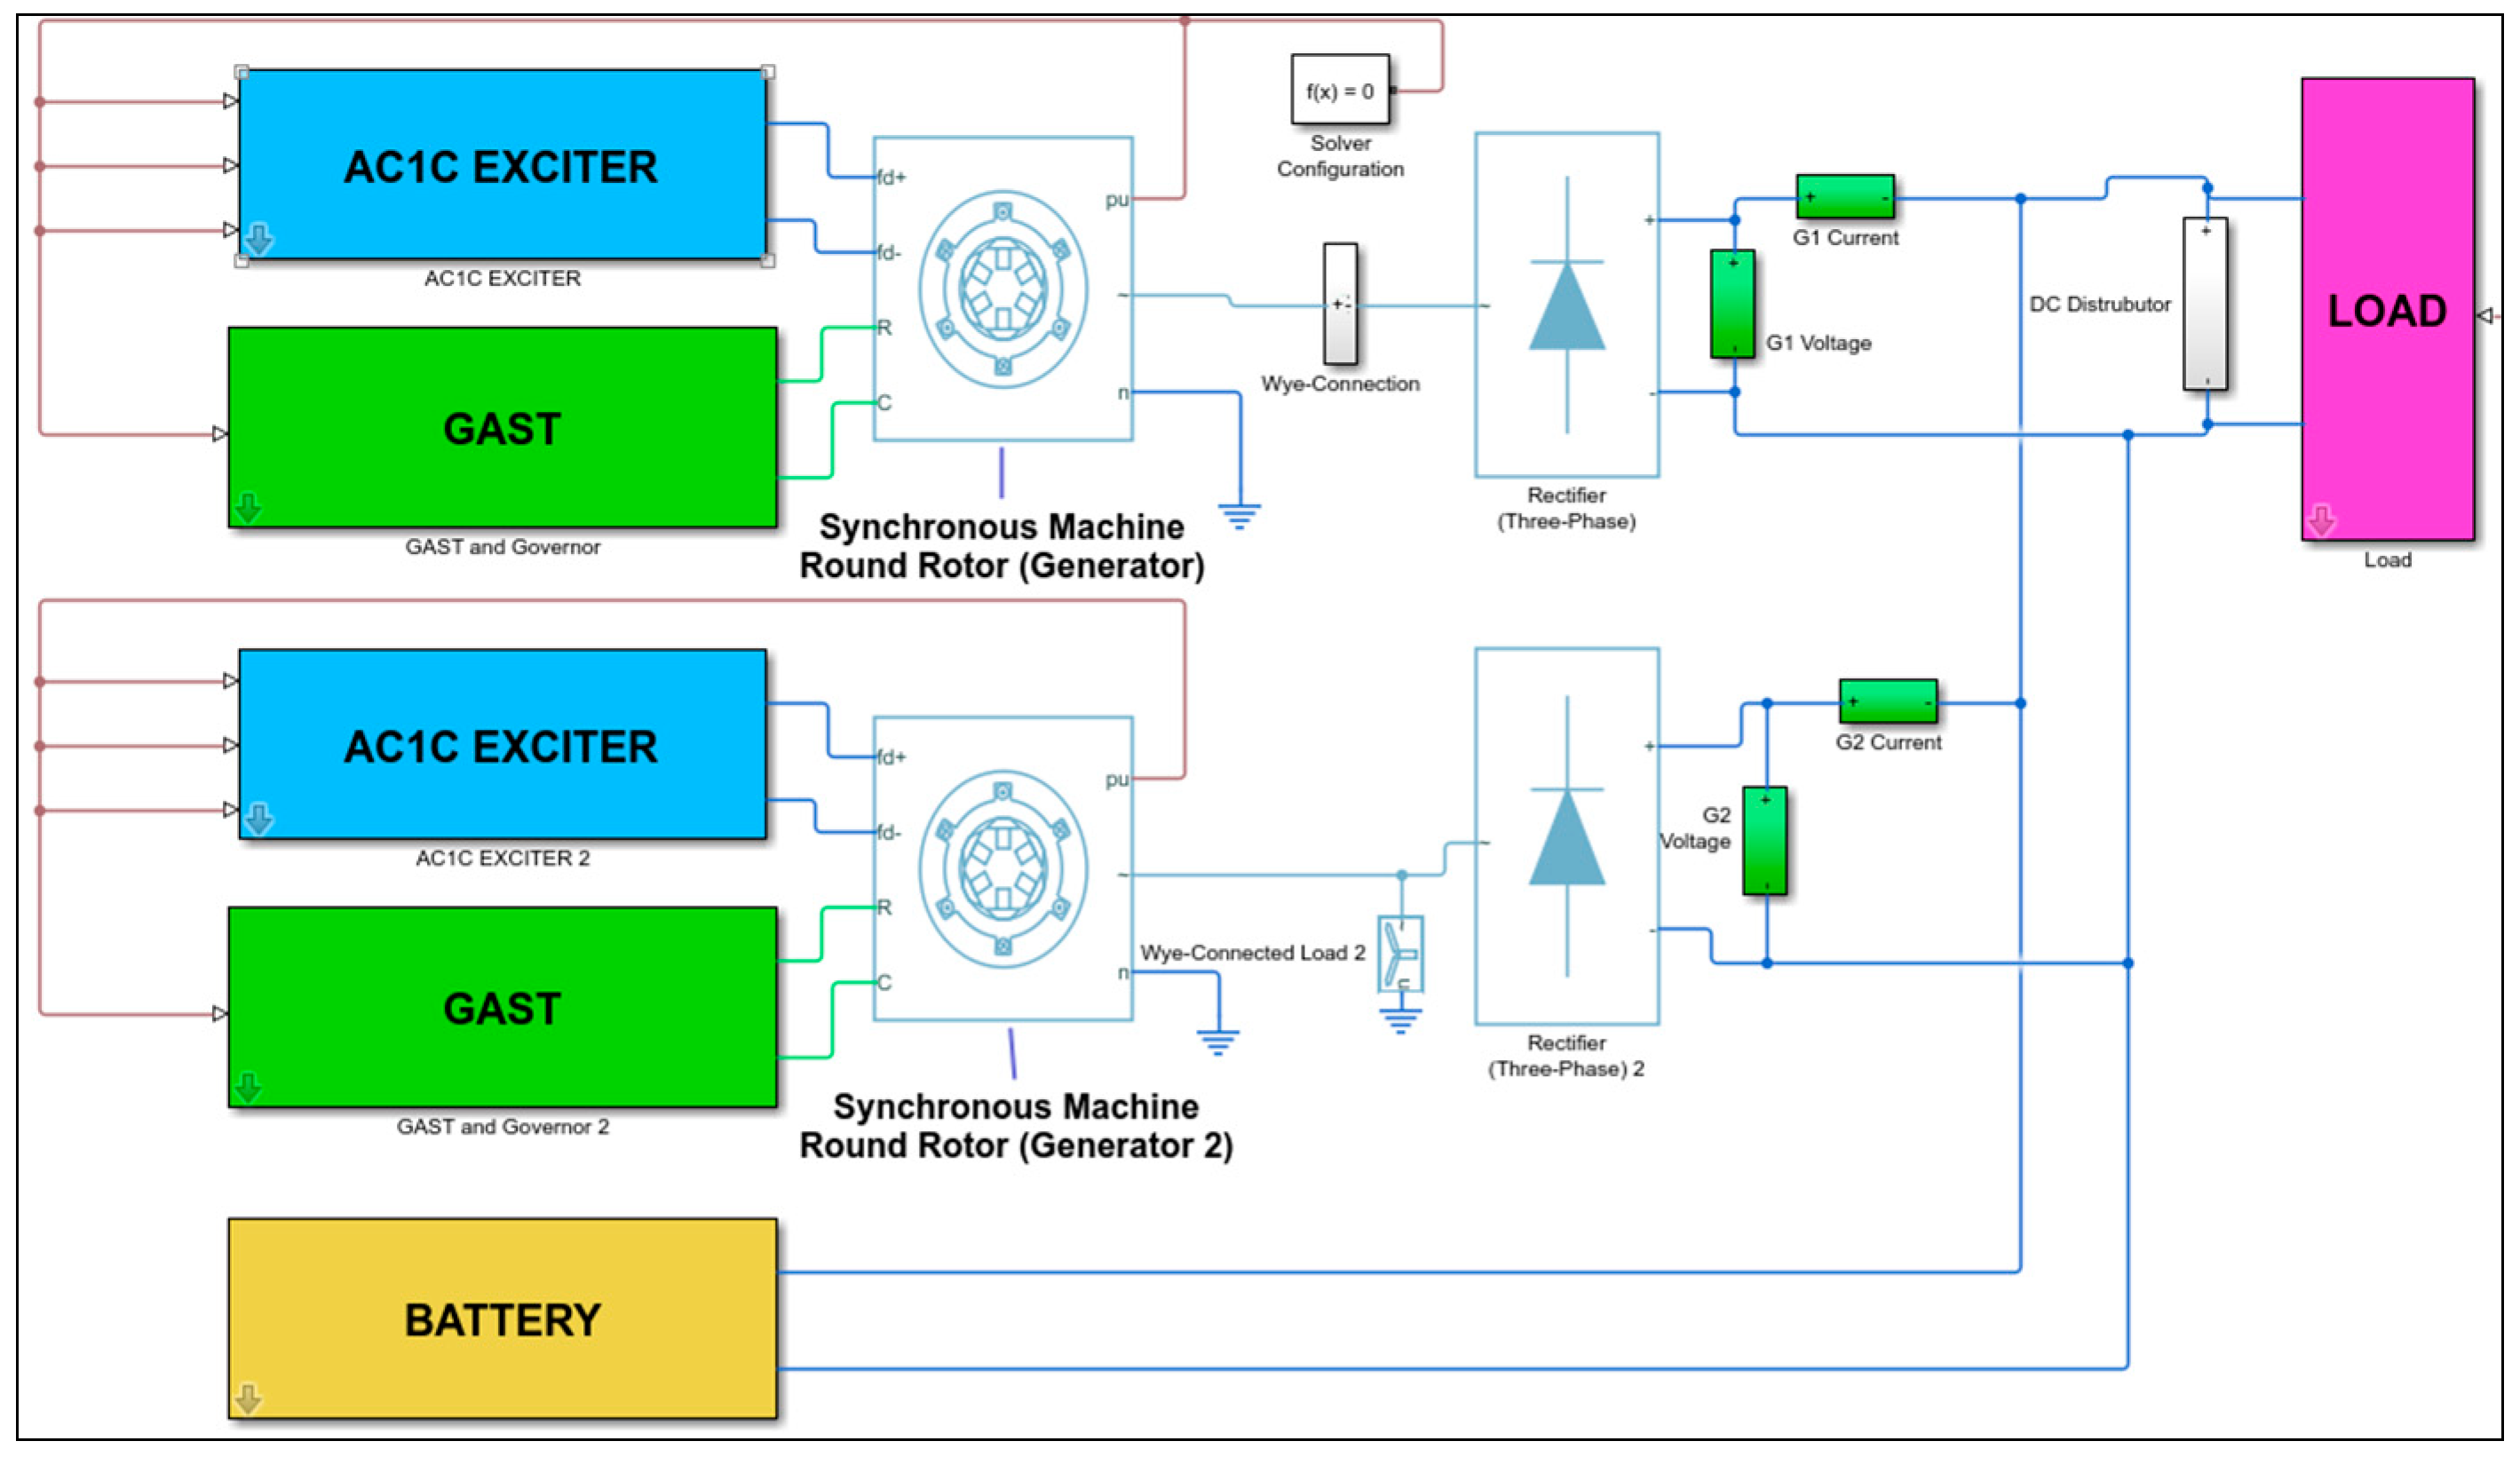
2.2. Modelling of Hybrid LNG–Battery Power System

The Simulink model for the hybrid engine comprises three main parts, i.e., the Genset, the Gas Turbine (GAST) and the Battery, as shown in Figure 2. Power from the battery and the Gensets is then distributed by a DC distributor. The Genset, GAST and battery systems utilized in the system modelling are covered in detail in the sections that follow.

2.2.1. Genset System

The Genset is the main energy source for hybrid-powered electrical ships. The Genset used in the system modelling in Figure 2 is the “Synchronous machine round rotor” block available in the Simulink/Simscape library [34]. The round-rotor synchronous generator is selected because it is usually driven by steam turbines and used for high-speed applications [35]. The parameters of the generator are given in Table 1.
For the Genset system, the AC voltage is converted to DC through the three-phase rectifier. A three-phase rectifier is selected because of its structural and control simplicity, high energy efficiency and performance of the input factors [19]. The regulation of the power system is conducted by using an AC excitation system—the AC1C excitation model [36] found in the Simulink library. The AC1C consists of an alternator main exciter with a non-controllable rectifier. The synchronous generator’s demand for direct current is produced by the AC excitation system. When the synchronous generator’s terminal voltage fluctuates, the regulator in the AC1C system feeds the exciter regulation voltage to control the output by adjusting the field voltage and field current to maintain a steady state [37].

2.2.2. GAST System

The excitation system from the synchronous generators regulates voltage controls and power distribution between the engines. The speed governor and turbine settings regulate the engine’s fuel flow and speed. Two alternative variables, namely fixed speed and variable speed, are tested using the models. The LNG engine, a commonly used dynamic gas turbine model adopted by Mahat et al. [38], is selected due to its simplicity. The parameters used for the GAST model are based on values used by Vadset [19] and Mahat et al. [38], as shown in Table 2. The speed governor is used in the GAST model to control the load sharing between the Gensets using the speed droop method—a method whereby the governor reference speed increases as the load decreases to acquire stable operations.
The speed governor is an isochronous controller with speed regulated towards the reference speed, w r e f , through a proportional-integral (PI) controller, as shown in the block diagram of the speed governor in Figure 3. The w r e f is set to 1.0 for the fixed-speed simulation. In this analysis, a variable speed configuration is taken into account since, unlike fixed speed, it can produce the required active load with the least amount of energy consumption, resulting in lower fuel costs. For variable speed, energy consumption is computed using a look-up table of the LNG engine’s load limit curve, as seen in Figure 4. The input is the active power calculated from the generator, and the output is the optimal engine RPM speed to minimise energy consumption.
The specific energy consumption (SEC) of the engine is calculated from the different load outputs generated from the Gensets. Both the fixed and variable speeds are calculated based on values from the LNG engine consumption curves shown in Figure 4, where the orange line represents the fixed RPM at 1200. To find the SEC of the fixed-speed engine, the specific gas consumption (SGC) at the active load is required. This requires the input of the active Genset load and generating a look-up table based on values from the orange line shown in Figure 4. As for the variable speed SEC, the SGC value is taken at the optimum engine speed and gas consumption at the active load. The results from the two cases are calculated and further discussed in Section 3.

2.2.3. Battery System

A lithium-ion battery connected directly to the DC distribution system is employed as the energy storage system in this power system because it requires less equipment and boosts round-trip efficiency. The direct connection limits the controllability of the battery as compared to a bi-directional converter which can control the voltage and current of the battery [14]. The system battery model, which is connected directly to the DC distributor, was taken from the Simulink/Simscape library and used for the simulation. For the setup without an EMS, it is programmed to operate at 45% of the battery’s maximum capacity at 400 kW throughout the simulations to ensure the battery has sufficient charge to operate 1.5 times the required duration as a safety allowance. Future studies of a similar model may consider implementing bi-directional DC-DC converters due to their electrical isolation capabilities and high reliability in renewable energy sources [39]. The peak shaving control could also be implemented into the system to provide a smooth operation and to allow a constant power distribution between the Gensets and battery instead of supplying the peaks of the variable load, which is not energy efficient [19].

2.2.4. Energy Management System

With the different types of energy sources on board and fluctuating operational requirements, an energy management system (EMS) is required to determine the optimal power distribution between the engine and energy storage systems. A basic RB control strategy is included to control and maintain the stability of the power generation sources, as well as distribute the load as required. Typically, RB methods are ideal with prior knowledge and past data of the system [40], where the past data are used as a benchmark for the RB control. This could improve the power management of a hybrid system by allocating the different power sources efficiently to reduce operational costs and improve system longevity.
In this paper, data acquired from manually logged operational data and data collected from sensors are discussed in Section 4. The load-dependent RB control will be implemented in the system and discussed in Section 4.5. An example of an RB strategy using determined load rules to optimise fuel consumption can be found in [41] for an offshore supply vessel. Two different load-dependent RB controls are implemented in Section 4.5. The first rule is based on a load on/off switch to regulate the power switch to fully battery-operated when the required load is consuming more than 200 g/kWh LNG per engine, based on Figure 4. The second rule is based on the flexibility of load sharing within the hybrid propulsion system, where different percentages of LNG and battery power in increments of 10% were investigated. A simple overview of the energy management framework is shown in Figure 5 below.

3. Mathematical Overview

3.1. Diesel Fuel Consumption

The calculation for diesel consumption is based on the method proposed by Dung et al. [42], with some variations to accommodate the different systems. The mean specific fuel oil consumption ( S F O C   ¯ ) could be obtained from the specific fuel oil consumption ( S F O C ) for each Genset given in the diesel engine fuel consumption graph as follows,
S F O C ¯ = 1 2 t 0 t S F O C G e n   1 t + S F O C G e n   2 t   d t
where t is the total duration and the subscript in (1) denotes the S F O C for the respective Genset.
The S F O C ¯ is then used to calculate the mean diesel consumption using the average generator power ( P A v g ). The mean diesel consumption C ¯ d i e s e l calculation is shown in Equation (2).
C ¯ d i e s e l   kg / h = S F O C ¯   g / kWh × P A v g kW × 1000  
Note that the brackets in the equations represent the units for the variables, and all the cost is in USD.
The daily operation cost C o s t d a i l y given in (3) is then calculated by taking the assumed diesel price P d i e s e l . As of writing, the average price of marine diesel oil is set to be USD 1.023/ kg [43].
C o s t d a i l y   USD = C ¯ d i e s e l   kg / h × 24   h  

3.2. LNG Consumption

For the LNG calculations, a similar concept to the diesel fuel counterpart is implemented. The mean LNG consumption C ¯ L N G is directly calculated from the summation of the S G C at the active load obtained from the engine limit curve in Figure 4.
C ¯ L N G   Kg h = P A v g kW × 1 1000 2 t × 0 t S G C G e n   1 t + S G C G e n   2 t   d t g kWh
The daily operation cost of the LNG is given in (5). The price of LNG P L N G , as of writing, is set to be USD 0.40/kg [44].
C o s t d a i l y U S D = C ¯ L N G   kg / h × P L N G   USD / kg × 24   h

3.3. Battery Consumption

The battery consumption for the example will be calculated based on the difference in the battery state of charge (SOC). Using the Coulomb counting method [19] given in (6),
S O C t = S O C t 1 + 0 t P   kW E b a t   kWh d t  
where S O C t is the battery S O C at time t in %, S O C   t 1 the battery’s initial S O C in %, t the time in hour, P the charge/discharge power and E b a t is the battery capacity.
Charging the battery with 1800 kW for 130 s makes it possible to add USD 1.95, as claimed by Vadset [19], with a rate of USD 0.03/kWh. A separate study from Kersey [45] used the price of electricity of USD 0.035/kWh. This paper, however, will utilise the average value of USD 0.033/kWh. The cost to charge the battery fully after every trip will be based on the formula in Equation (7),
B a t t e r y   C h a r g i n g Cost   USD = SOC SOC t × E b a t   kWh × Charging   Cost   USD / kWh
where S O C S O C t is the percentage of battery to be fully charged, E b a t is the battery capacity, and Charging   Cost will be USD 0.033/kWh at 1800 kW. To obtain the daily operation cost with battery charging for configurations with a battery, the B a t t e r y   C h a r g i n g Cost is multiplied by 12 trips and added with C o s t d a i l y in (5), assuming each trip takes 120 min and not factoring in charging duration. Charging duration will progressively improve as the technology matures, evidenced by successful cases in the automobile industry where the chargers are capable of charging one vehicle at 1 MW or three vehicles simultaneously at 360 kW [46].

3.4. CO2 Emissions

The CO2 emissions E m i s s i o n C O 2 calculation is based on MEPC.245 (66) [47]. The total CO2 emissions can be calculated using the following formula based on the total fuel oil consumption C f u e l .
E m i s s i o n C O 2   ton = C f u e l   ton × C F
where C F represents the CO2 emission coefficient based on the type of fuel oil consumed. The coefficients are based on MEPC.245 (66) [47]. The diesel used in this paper is diesel oil and has a C F value of 3.206, whereas the LNG has a C F value of 2.75.

3.5. EEOI and CII

Lastly, the E E O I or C I I attained will be calculated from (9), whereas the required annual operational CII is obtained from (10).
E E O I   or   C I I   a t t a i n e d   g tonne nm = E m i s s i o n C O 2 D W T   or   G T   tonne × D i s t a n c e   S a i l e d   nm  
Required   Annual   Operational   C I I = 1 Z   100 × C I I R
where Z refers to the reduction factor, starting from 5% in 2023 and afterwards increasing by 2% each year. The C I I reference value C I I R is based on the respective ship type and capacity from the table found in MEPC.353 (78) [48]. The distance sailed in this study is the average distance travelled by the diesel-powered tugboat of 10.4 nm.
The calculated values will have a C I I rating based on Table 3. The rating is based on the ratio of E E O I or C I I attained (9) to the required C I I (10), where a higher ratio indicates a worse rating, and vice versa. Any values lower than column B in Table 3 are rated as A [10]. As tugboats are not categorised under the list of vessel types in MEPC.354 (78) [48], this study adopts the cruise passenger ship values for E E O I calculations and C I I ratings.

4. Results and Discussions

In this section, three distinct scenarios are presented: Case 1: Manually logged operational data, Case 2: Designed operational profile, and Case 3: Past operational data collected from sensors. Additionally, four different power source configurations are examined: Diesel, LNG with fixed speed at 1200 rpm (LNG (F)), LNG with variable speed (LNG (V)), and LNG with variable speed and hybrid power (LNG V + B). The objective of the simulations is to ensure that the system model produces a similar loading operation. The simulations are based on the system mentioned in Section 2.2, and the loading profile represents a single tugboat operation showcasing the variable load.
This is then followed by the calculation of the daily fuel operation cost, CO2 emissions, E E O I and C I I ratings for each case. The section concludes with a comparison between a performance without a control strategy in the best power source configuration to one with control strategies applied. The calculations for LNG-related issues are integrated into the Simulink model, and the computations for diesel-related issues are performed using Microsoft Excel.

4.1. Case 1: Manually Logged Operational Data

Case 1 studies the load distribution using data that were manually logged throughout the operations. A diesel power tugboat with a similar operation loading profile as the hybrid LNG–electric vessel was used to record the vessel speed, operational types, and load with respect to the duration. A total of 11 trips’ worth of data was gathered. Figure 6 shows an example of logged data.
The recorded revolution per minute (RPM) of the engine is used to obtain the load output by using the diesel engine fuel consumption graph. Such a curve is similar to the LNG load limit curve given in Figure 4. The average values and durations are then computed out of the 11 trips of logged data for the respective operations and presented in Table 4.
The load profile presented in Figure 7a is generated by the mean power obtained from all the trips logged during the operation. The simulated load profiles are shown in Figure 7b,c, for load profiles without and with batteries, respectively. The calculation results of the case with the different power sources and configurations are shown in Table 5. The reduction in daily cost and CO2 emission decreases dramatically when switching to hybrid power systems, i.e., an 82.2% and 89.2% reduction in daily cost and CO2 emission, respectively. The average power simulated in the Simulink for Case 1 is 445 kW. Among the fuel types taken into consideration, using LNG (F) has the highest daily costs and emissions. Given that the engine speed is fixed, the SGC between 200 kW and 500 kW swings between 230 and 260 g/kWh, whereas for LNG(V), the SGC between 200 to 500 kW is 195 g/kWh. This can be attributed to the high LNG consumption required during low-load situations.
The daily cost, CO2 emissions and E E O I calculated from (8) and (9) are presented in Table 5. The daily cost and CO2 emissions of LNG (V + B) are 82.2% and 89.2%, respectively, lower than the diesel configurations.

4.2. Case 2: Designed Operational Profile

Based on the designed operational profile of the vessel provided by the industry collaborator, Case 2 analyses the typical load distribution. Table 6 provides a summary of the operational type, duration and average load data. The data provided by the industry collaborator are in terms of loading percentage and duration for different operation types, i.e., idle, 6-knot transit, 10-knot transit, 12-knot transit and tugging. Case 2 incorporated data from Case 1 to obtain the actual load in kW; e.g., the loading 420 kW for the Idle condition is obtained by multiplying the given percentage with the idle load recorded in Case 1.
In all the simulations with a battery, the distribution of power between the LNG engine and the battery is such that the battery is fixed to a maximum of 400 kW while the Genset provides the remaining load. The simulated loading profiles of the model without and with a battery generated in Simulink are given in Figure 8b and Figure 8c, respectively. The loading profiles without and with the battery of the variable profiles are closely simulated to the design load profile in Figure 8a. The noise produced by the load generated in Simulink and the difference in the rate of power changes as the load increases and drops are the only noteworthy differences. However, this can be improved by integrating a PID controller with the proper control settings into the system.
The calculation results from the corresponding power sources and configurations are shown in Table 7. The daily cost in Table 7 represents the daily fuel operation cost as calculated from (3) and (5) for the respective fuel types. Similar to Case 1, the reduction in daily cost and CO2 emission decreases when switching to hybrid power systems, i.e., a 60.5% and 62.7% reduction in daily cost and CO2 emission, respectively. A reduction in the CO2 emissions by LNG (V) of 22.2% when compared to LNG (F) is expected as the variable engine speed has been set to the optimised SGC at the given required load.
The average power for Case 2 is 630 kW. Compared to Case 1 with an average power of 445 kW, the value for Case 2 is significantly larger. This could be due to errors that may occur during the manual data-capturing process. Since the data was logged at intervals of one minute, recording the power over such a long duration could cause important engine surges and peaks to be missed, resulting in lower average power. The calibration may have been incorrect since the data were logged from an analogue tachometer, and the results logged did not take the allowance factor of the sensors into account.

4.3. Case 3: Past Operational Data from Sensors

Case 3 utilises data collected by mass flowmeters from a diesel-powered tugboat operating with a similar architecture as the hybrid vessel to precisely approximate the load distribution. The operational profile of the tugboat is shown in Figure 9a. As data were recorded continuously by the sensors, a variety of loads were observed in Case 3. Similarly, the loading profiles without and with battery are presented in Figure 9b and Figure 9c, respectively. Similar to Figure 8c, some noise is observed from the generator power. The noise ripples are observed to occur when the generator is required to produce 500–900 kW, possibly due to voltage harmonics caused by current harmonics, which increase at higher currents [50]. A harmonic filter could be added to reduce or mitigate the harmonics to a tolerable level. As compared to Case 2, the maximum load in this simulation is higher; hence, higher fuel consumption is expected. The average power, in this case, is 702 kW, 10% more than Case 2. Table 8 shows the results of the case with the different power sources and configurations. A comparison between the average power of Cases 2 and 3 shows that the load prediction from the method in Case 2 can predict the load with relatively good accuracy, i.e., 10% less accurate than the more accurate method in Case 3. As Case 3 requires the installation of mass flowmeters, which is costly, Case 2 presents a cost-effective means to predict the engine load by only using the design load profile and manually logged data.
The cost and CO2 comparison in Table 8 shows that the LNG and battery hybrid systems have the least daily cost and CO2 emissions as compared to the diesel power system, with a reduction of 55.2% and 56.9%, respectively. With the higher average power, a higher daily cost and E E O I are observed. However, it should be remembered that higher average power leads to lower fuel consumption. This is because the engine operates at a lower SGC when operating at higher load requirements, which lowers the cost. This is reflected in the difference between the daily cost of diesel and LNG(F) for Cases 1 and 3, presented in Table 5 and Table 8, respectively. Table 8 shows that Case 3, with an average power of 702 kW, has a difference of 9.2% in daily cost reduction for LNG (F) when compared to diesel, whereas Table 7 shows that Case 2, with an average power of 630 kW, has a difference of 8.1%. A bigger significant difference can be observed if the amount of time at a higher load is extended.

4.4. Comparisons between Cases 1, 2 and 3

Table 9 and Table 10 compare and report the average daily fuel operation costs and CO2 emissions of the cases, respectively. Out of the cases discussed, the diesel power system results in the highest cost, partially because of the higher diesel costs of USD 1.023/kg compared to the LNG costs of USD 0.40/kg at the time of writing this paper. When LNG-powered systems are compared, LNG (V + B) has the lowest fuel cost. The average power of the operation and the amount of fuel used directly affect the daily cost. The cost per day increases as the fuel usage and average power increase. It should be noted that the engine’s SGC is the same for any loads below 400 kW, as illustrated in Figure 4; hence, the fuel consumption is not optimised. Therefore, it is economically advantageous to operate entirely with batteries rather than employing the hybrid propulsion system in situations when the average power is less than 400 kW.
The comparison of the CII ratings of the respective cases and propulsions is given in Table 11. The table shows that moving forward, the preferable power system will be using a variable speed LNG engine with battery, as it can obtain a grade ‘A’ CII rating for the following years to come. Using the diesel and LNG (F) configuration is not recommended because of an “E” CII rating and the high daily cost required to maintain. Both LNG (V) and LNG (V + B) are recommended due to the high CII ratings and low daily cost; however, more improvements can be made to enhance the configurations, such as adding a dedicated EMS, as shown in the next section.

4.5. Rule-Based (RB) Control Strategy

The RB control strategies explored in this paper are based on the findings from the previous section; therefore, the rules selected are based on prior knowledge of the load demands. Additionally, different configurations of load sharing are investigated between LNG and battery, where different percentages of the respective power source are compared to seek the optimum RB strategy to achieve the lowest cost and emissions. With findings from Section 4.4, it is noted that the operation with load power below 400 kW is more beneficial to operate fully with a battery system. However, 600 kW is used as the minimum load required to switch on the Genset because a 300 kW load on each genset will consume 200 g/kWh LNG, which is the optimum value when compared to using 260 g/kWh at any load lesser than 200 kW load (see Figure 4). The first RB control, an on/off switch strategy of the LNG engine, is created based on this limit to see how much improvement in energy efficiency could be achieved. The switch, when turned on, will allow the LNG engine to be used, whereas the switch is turned off when a load power of less than 600 kW is required. The loading profile of Case 2 with the on/off switch RB control being implemented is shown in Figure 10a. A comparison between the results with and without a control strategy for Case 2 is shown in Table 12. When compared to Figure 8c, distinct inactivity of the Genset is observed when the load required is less than 600 kW after 55 s onwards. However, sharp spikes and fluctuating power is observed when alternating between the energy sources is required, likely due to the difference in the power changes when the load increases and decreases.
The second RB is created based on the flexible load sharing between the hybrid propulsion system, where different percentages of LNG and battery power are investigated to find the optimum RB strategy with the lowest cost and CO2 emission. This section experimented with different load distributions in increments of 10% for the different percentages of load sharing, and the results and findings are shown in Table 13. Figure 10b shows an example of the different percentages of load-sharing control being implemented in Case 2, where the system is using 80% LNG and 20% battery power. Noise from the load can be reduced to a tolerable level with a harmonic filter, as mentioned in Section 4.3.
When compared to results from Table 7, Table 8, Table 9, Table 10 and Table 11 to Table 12, a significant reduction between not having an RB and having a control strategy is observed. When compared to LNG (V + B) without RB control strategy, results with the on/off RB strategy displayed a further reduction in daily cost and CO2 emissions (or E E O I ) of up to 22.3% and 23.8%, respectively. Although the difference in reduction in daily cost and emissions for LNG (V + B) with 80% LNG power and 20% battery power is not better than the results of LNG (V + B), it still showed a reduction of 30.9% in daily cost and 26.9% in CO2 emissions when compared to using diesel.
Other configurations of the load sharing with different percentages are shown in Table 13, where a range of reduction percentages can be observed; the results are then compared with respect to the effect of the battery state of charge (SOC) based on Equation (6). The S O C using the control strategy for a duration of 120 min is included in Table 12 and Table 13. The inclusion of the battery S O C changes the consideration for the optimum control strategy for different types of operations. Based on the highest amount of reduction in daily cost and CO2 emissions, the RB control strategy of switching off LNG at less than a 600 kW load is the most cost-effective. However, with a high battery S O C consumption of 48% after a 120-min operation, it does not have any allowance in case of emergency, despite allowing the vessel to complete two back-to-back trips without charging. Therefore, this strategy is suitable only with battery swapping or when given the time to fully charge the batteries onboard after every operation.
Table 12 shows that LNG (V + B) without control provides better results when compared to the second RB control in terms of percentage reduction in daily cost and CO2 emissions; the battery S O C consumed is not sustainable, and hence, it is not recommended to operate the tugboat at LNG (V + B) without control. Additionally, without a bi-directional converter, the battery is unable to recharge when the vessel is offshore or control the charging/discharging process. Therefore, the most cost-effective operation without charging onboard or battery swapping is by configuring the load distribution to 80% LNG and 20% battery. Based on the analysis performed with only 18% of the battery S O C used up in a single 120-min operation (see Table 13), a fully charged battery in this configuration will allow completing a maximum of five 120-min operations or a singular operation of up to 10 h.

5. Conclusions

The hybrid LNG–battery power system was presented with several operational cases compared to investigate the reduction in fuel consumption and CO2 emissions. The use of the LNG power system is capable of producing close to zero NOX and SOX emissions, as well as a possible near-zero emission when the battery is used. The hybrid LNG–battery power system was compared to conventional power systems such as diesel and LNG with fixed speed and variable speed. The hybrid LNG–battery power system showcased its capabilities with the lowest average daily fuel operation cost at 64.0% and an average reduction of CO2 emissions of 67.2% when compared to the diesel propulsion system. With regards to the system design sustainability, the hybrid LNG–battery power system with a variable speed engine and battery power, LNG (V + B), is the only configuration to fulfil a CII rating of an ‘A’ up to 2027. The comparison among the three cases also showed that the methodology using manually logged data and the designed operational profile in Case 2 presents a cost-effective method to predict the load distribution with relatively good accuracy when compared to the more accurate but costly method using mass flowmeters in Case 3. Case 2 was then used to explore the different RB control strategies to further optimise the reduction in daily fuel operation and CO2 emissions.
As a rule of thumb, it is more economically beneficial to operate fully on a battery propulsion system when the load required is below a certain threshold. The first rule was thus created using the load on/off switch to regulate the power switch to fully battery-operated when the required load is less than 600 kW. The second rule was created based on the analysis of the flexible load sharing within the hybrid propulsion system, where different percentages of LNG and battery power in increments of 10% were investigated. The results concluded with the RB control of the load on/off switch, which reduces daily cost by 82.8% and CO2 emissions by 86.5%. The second rule has a reduction average of 53.9% for daily cost and 54.9% for CO2 emissions when compared to diesel propulsion for Case 2.
Different rules consume a battery’s S O C differently, hence affecting the number of trips allowed with each rule. The ideal rule for a cost-effective performance being the first rule, with access to a battery swap or allowable time to fully charge the batteries after every trip. The second rule, which uses a combination of 80% LNG and 20% battery power, is the best choice for reducing costs and emissions while also supporting a high number of trips. This configuration can complete up to 10 h of operation on a single charge, making it ideal for long-range journeys.
The hybrid power system modelling could be improved by incorporating a bi-directional converter to allow more control of the voltage and current of the battery and, more importantly, to allow the battery to be charged offshore by the Gensets. Future studies could include factors such as hydrodynamic properties to study the impact on the vessel load requirements and optimisation using live data from sensors installed on vessels.

Author Contributions

Conceptualization, S.B.R.; methodology, S.B.R. and Z.Y.T.; validation, S.B.R., J.H.A. and N.V.M.; writing—original draft preparation, S.B.R.; data collection, S.B.R., J.H.A. and N.V.M.; writing—review and editing, Z.Y.T.; visualization, S.B.R.; supervision, Z.Y.T. and D.K.; project administration, Z.Y.T.; funding acquisition, Z.Y.T. and D.K. All authors have read and agreed to the published version of the manuscript.

Funding

This research was funded by MOE, Grant Number R-MOE-A403-E002.

Institutional Review Board Statement

Not applicable.

Informed Consent Statement

Not applicable.

Data Availability Statement

The data presented in this study are available on request from the corresponding author. The data are not publicly available due to the private and confidential documents involved.

Conflicts of Interest

The authors declare no conflict of interest. The funders had no role in the design of the study; in the collection, analyses, or interpretation of data; in the writing of the manuscript; or in the decision to publish the results.

References

  1. International Maritime Organization, Prevention of Air Pollution from Ships. Available online: https://www.imo.org/en/OurWork/Environment/Pages/Air-Pollution.aspx (accessed on 25 October 2022).
  2. International Maritime Organisation, The 2020 Global Sulphur Limit: FAQ. Available online: http://www.imo.org/en/MediaCentre/HotTopics/GHG/Documents/FAQ_2020_English.pdf (accessed on 13 December 2022).
  3. Tadros, M.; Ventura, M.; Soares, C.G. Review of Current Regulations, Available Technologies, and Future Trends in the Green Shipping Industry. Ocean Eng. 2023, 280, 114670. [Google Scholar] [CrossRef]
  4. Mallouppas, G.; Yfantis, E.A. Decarbonization in Shipping Industry: A Review of Research, Technology Development, and Innovation Proposals. J. Mar. Sci. Eng. 2021, 9, 415. [Google Scholar] [CrossRef]
  5. Maloni, M.; Paul, J.A.; Gligor, D.M. Slow Steaming Impacts on Ocean Carriers and Shippers. Marit. Econ. Logist. 2013, 15, 151–171. [Google Scholar] [CrossRef] [Green Version]
  6. Fotopoulos, A.G.; Margaris, D.P. Computational Analysis of Air Lubrication System for Commercial Shipping and Impacts on Fuel Consumption. Computation 2020, 8, 38. [Google Scholar] [CrossRef]
  7. The Marine Environment Protection Committee. Resolution MEPC.203(62); The Marine Environment Protection Committee: London, UK, 2011. [Google Scholar]
  8. The Marine Environment Protection Committee. Resolution MEPC.328(76)—Amendments to the Annex of the Protocol of 1997 to Amend the International Convention for the Prevention of Pollution from Ships 1973, as Modified by the Protocol of 1978 Relating Thereto 2021 Revised MARPOL Annex VI; The Marine Environment Protection Committee: London, UK, 2021. [Google Scholar]
  9. ClassNK, Outlines of EEXI Regulation EEDI Section of Marine GHG Certification Department. Available online: https://www.classnk.or.jp/hp/pdf/activities/statutory/eexi/eexi_rev3e.pdf (accessed on 13 December 2022).
  10. Gianni, M.; Pietra, A.; Coraddu, A.; Taccani, R. Impact of SOFC Power Generation Plant on Carbon Intensity Index (CII) Calculation for Cruise Ships. J. Mar. Sci. Eng. 2022, 10, 1478. [Google Scholar] [CrossRef]
  11. Ejder, E.; Arslanoğlu, Y. Evaluation of Ammonia Fueled Engine for a Bulk Carrier in Marine Decarbonization Pathways. J. Clean. Prod. 2022, 379, 134688. [Google Scholar] [CrossRef]
  12. Moreno, V.M. Future Trends in Electric Propulsion Systems for Commercial Vessels. J. Marit. Res. 2007, 4, 81–100. [Google Scholar]
  13. Ship Technology, Ampere Electric-Powered Ferry. Available online: https://www.ship-technology.com/projects/norled-zerocat-electric-powered-ferry/ (accessed on 25 November 2022).
  14. Chua, L.W.Y.; Tjahjowidodo, T.; Seet, G.G.L.; Chan, R. Implementation of Optimization-Based Power Management for All-Electric Hybrid Vessels. IEEE Access 2018, 6, 74339–74354. [Google Scholar] [CrossRef]
  15. Roslan, S.B.; Konovessis, D.; Tay, Z.Y. Sustainable Hybrid Marine Power Systems for Power Management Optimisation: A Review. Energies 2022, 15, 9622. [Google Scholar] [CrossRef]
  16. Karaçay, Ö.E.; Özsoysal, O.A. Techno-Economic Investigation of Alternative Propulsion Systems for Tugboats. Energy Convers. Manag. X 2021, 12, 100140. [Google Scholar] [CrossRef]
  17. Lebedevas, S.; Norkevičius, L.; Zhou, P. Investigation of Effect on Environmental Performance of Using LNG as Fuel for Engines in Seaport Tugboats. J. Mar. Sci. Eng. 2021, 9, 123. [Google Scholar] [CrossRef]
  18. Zhang, B.; Jiang, Y.; Chen, Y. Research on Calibration, Economy and PM Emissions of a Marine LNG–Diesel Dual-Fuel Engine. J. Mar. Sci. Eng. 2022, 10, 239. [Google Scholar] [CrossRef]
  19. Vadset, M.S. Modeling and Operation of Hybrid Ferry with Gas Engine, Synchronous Machine and Battery. Master’s Thesis, Norwegian University of Science and Technology, Trondheim, Norway, 2018. [Google Scholar]
  20. Wu, X.; Song, Y.; Wang, Y. Estimation Model for Loads of Ship Power System Based on Fuzzy SOFM Network. Shipbuild. China 2003, 44, 65–70. [Google Scholar]
  21. Breijs, A.; Amam, E.E. Energy Management–Adapt Your Engine to Every Mission. In Proceedings of the 13th International Naval Engineering Conference, Hong Kong, China, 13–14 October 2016; pp. 1–8. [Google Scholar]
  22. Anvari-Moghaddam, A.; Dragicevic, T.; Meng, L.; Sun, B.; Guerrero, J.M. Optimal Planning and Operation Management of a Ship Electrical Power System with Energy Storage System. In Proceedings of the IECON 2016—42nd Annual Conference of the IEEE Industrial Electronics Society, Florence, Italy, 23–26 October 2016; pp. 2095–2099. [Google Scholar] [CrossRef] [Green Version]
  23. Banaei, M.; Ghanami, F.; Rafiei, M.; Boudjadar, J.; Khooban, M.-H. Energy Management of Hybrid Diesel/Battery Ships in Multidisciplinary Emission Policy Areas. Energies 2020, 13, 4179. [Google Scholar] [CrossRef]
  24. Kalikatzarakis, M.; Geertsma, R.D.; Boonen, E.J.; Visser, K.; Negenborn, R.R. Ship Energy Management for Hybrid Propulsion and Power Supply with Shore Charging. Control Eng. Pract. 2018, 76, 133–154. [Google Scholar] [CrossRef]
  25. Tay, Z.Y.; Hadi, J.; Chow, F.; Loh, D.J.; Konovessis, D. Big Data Analytics and Machine Learning of Harbour Craft Vessels to Achieve Fuel Efficiency: A Review. J. Mar. Sci. Eng. 2021, 9, 1351. [Google Scholar] [CrossRef]
  26. Tay, Z.Y.; Hadi, J.; Konovessis, D.; Loh, D.J.; Tan, D.K.H.; Chen, X. Efficient Harbour Craft Monitoring System: Time-Series Data Analytics and Machine Learning Tools to Achieve Fuel Efficiency by Operational Scoring System. In Proceedings of the ASME 2021 40th International Conference on Ocean, Offshore and Arctic Engineering OMAE 2021, Virtual Online, 21–30 June 2021. [Google Scholar]
  27. Fam, M.L.; Tay, Z.Y.; Konovessis, D. An Artificial Neural Network for Fuel Efficiency Analysis for Cargo Vessel Operation. Ocean Eng. 2022, 264, 112437. [Google Scholar] [CrossRef]
  28. Hadi, J.; Konovessis, D.; Tay, Z.Y. Achieving Fuel Efficiency of Harbour Craft Vessel via Combined Time-Series and Classification Machine Learning Model with Operational Data. Marit. Transp. Res. 2022, 3, 100073. [Google Scholar] [CrossRef]
  29. Abebe, M.; Shin, Y.; Noh, Y.; Lee, S.; Lee, I. Machine Learning Approaches for Ship Speed Prediction towards Energy Efficient Shipping. Appl. Sci. 2020, 10, 2325. [Google Scholar] [CrossRef] [Green Version]
  30. Cheliotis, M.; Lazakis, I.; Theotokatos, G. Machine Learning and Data-Driven Fault Detection for Ship Systems Operations. Ocean Eng. 2020, 216, 107968. [Google Scholar] [CrossRef]
  31. Hadi, J.; Konovessis, D.; Tay, Z.Y. Filtering Harbor Craft Vessels’ Fuel Data Using Statistical, Decomposition, and Predictive Methodologies. Marit. Transp. Res. 2022, 3, 100063. [Google Scholar] [CrossRef]
  32. Mirović, M.; Miličević, M.; Obradović, I. Big Data in the Maritime Industry. NAŠE MORE Znan. Časopis More Pomor. 2018, 65, 56–62. [Google Scholar] [CrossRef]
  33. Zahedi, B.; Norum, L.E.; Ludvigsen, K.B. Optimized Efficiency of All-Electric Ships by Dc Hybrid Power Systems. J. Power Sources 2014, 255, 341–354. [Google Scholar] [CrossRef]
  34. MathWorks, Synchronous Machine Round Rotor. Available online: https://www.mathworks.com/help/sps/ref/synchronousmachineroundrotor.html?searchHighlight=synchronous_generator_round&s_tid=srchtitle_synchronous_generator_round_1 (accessed on 6 January 2023).
  35. Saini, M.K. Difference between Cylindrical Rotor and Salient Pole Rotor Synchronous Generator. Available online: https://www.tutorialspoint.com/difference-between-cylindrical-rotor-and-salient-pole-rotor-synchronous-generator# (accessed on 6 January 2023).
  36. IEEE Std 421.5-2016; (Revision of IEEE Std 421.5-2005): IEEE Recommended Practice for Excitation System Models for Power System Stability Studies. IEEE: New York, NY, USA, 2016; Volume 2016, pp. 1–207.
  37. Lai, J. Parameter Estimation of Excitation Systems. Master’s Thesis, Graduate Faculty of North Carolina State University, Raleigh, NC, USA, 2007. [Google Scholar]
  38. Mahat, P.; Chen, Z.; Bak-Jensen, B. Gas Turbine Control for Islanding Operation of Distribution Systems. In Proceedings of the 2009 IEEE Power & Energy Society General Meeting, Calgary, AB, Canada, 26–30 July 2009; IEEE: New York, NY, USA, 2009; pp. 1–7. [Google Scholar]
  39. Dung, N.A.; Hieu, P.P.; Hsieh, Y.; Lin, J.; Liu, Y.; Chiu, H. A Novel Low-loss Control Strategy for Bidirectional DC–DC Converter. Int. J. Circuit Theory Appl. 2017, 45, 1801–1813. [Google Scholar] [CrossRef]
  40. Chua, L.W.Y. A Strategy for Power Management of Electric Hybrid Marine Power Systems. Ph.D. Thesis, Nanyang Technological University, Singapore, 2019. [Google Scholar]
  41. Nebb, O.C.; Zahedi, B.; Lindtjorn, J.O.; Norum, L. Increased Fuel Efficiency in Ship LVDC Power Distribution Systems. In Proceedings of the 2012 IEEE Vehicle Power and Propulsion Conference, Seoul, Republic of Korea, 9–12 October 2012; pp. 564–568. [Google Scholar] [CrossRef]
  42. Hansen, J.F. Modelling and Control of Marine Power Systems. Ph.D. Thesis, Norwegian University of Science and Technology, Trondheim, Norway, 2000. [Google Scholar]
  43. Ship&Bunker, Singapore Bunker Prices—Ship & Bunker. Available online: https://shipandbunker.com/prices/apac/sea/sg-sin-singapore#MGO (accessed on 3 January 2023).
  44. IndexMundi, Natural Gas vs Diesel—Price Rate of Change Comparison. Available online: https://www.indexmundi.com/commodities/?commodity=natural-gas&currency=sgd&commodity=diesel (accessed on 20 December 2022).
  45. Kersey, J.; Popovich, N.D.; Phadke, A.A. Rapid Battery Cost Declines Accelerate the Prospects of All-Electric Interregional Container Shipping. Nat. Energy 2022, 7, 664–674. [Google Scholar] [CrossRef]
  46. Heliox, The Future Is Megawatt Charging. Available online: https://www.heliox-energy.com/blog/the-future-is-megawatt-charging (accessed on 16 June 2023).
  47. The Marine Environment Protection Committee. Resolution MEPC.245(66)-2014 Guidelines on the Method of Calculation of the Attained Energy Efficiency Design Index (EEDI) for New Ships; The Marine Environment Protection Committee: London, UK, 2014. [Google Scholar]
  48. The Marine Environment Protection Committee. Resolution MEPC.353 (78)—2022 Guidelines on the Reference Lines for Use with Operational Carbon Intensity Indicators (CII Reference Lines Guidelines, G2); The Marine Environment Protection Committee: London, UK, 2022. [Google Scholar]
  49. The Marine Environment Protection Committee. Resolution MEPC.354(78)—2022 Guidelines on the Operational Carbon Intensity Rating of Ships (CII Rating Guidelines, G4); The Marine Environment Protection Committee: London, UK, 2022. [Google Scholar]
  50. L&T Electrical & Automation, Understanding Current & Voltage Harmonics. Available online: https://www.lntebg.in/about-us/blog/understanding-current-voltage-harmonics/ (accessed on 5 January 2023).
Figure 1. Diagram of LNG–battery hybrid vessel power system.
Jmse 11 01307 g001
Figure 2. Model of Hybrid LNG–battery power system in Simulink.
Jmse 11 01307 g002
Figure 3. Fixed speed configuration in Simulink [19].
Jmse 11 01307 g003
Figure 4. LNG engine load limit curve.
Jmse 11 01307 g004
Figure 5. Simplified energy management framework [15].
Jmse 11 01307 g005
Figure 6. Operational load profile of a tugboat.
Jmse 11 01307 g006
Figure 7. Case 1 (a) load profile, (b) load profile simulated without battery, and (c) load profile simulated with battery.
Jmse 11 01307 g007
Figure 8. Case 2 (a) load profile, (b) load profile simulated without battery, and (c) load profile simulated with battery.
Jmse 11 01307 g008
Figure 9. Case 3 (a) load profile, (b) load profile simulated without battery, and (c) load profile simulated with battery.
Jmse 11 01307 g009
Figure 10. RB control strategies on case 2: (a) on/off strategy; (b) varied load sharing configurations control.
Jmse 11 01307 g010
Table 1. Synchronous generator parameters.
DescriptionValueUnit
Rated electrical frequency50Hz
Rated apparent power1865kVA
Rated voltage545V
Number of poles3-
Table 2. GAST model parameters.
DescriptionValueUnit
Speed governor proportional gain,  K i 25pu
Speed governor time constant,  T i 25s
Feedback gain,  K F B 0pu
Controller time constant,  T 1 0.05s
Load limiter time constant,  T 2 0.1s
Temperate limiter time constant,  T 3 5.0s
Temperate limit gain,  K T 5s
Ambient temperature load limit,  A r 1.0pu
Controller maximum output,  V m a x 1.0pu
Controller minimum output,  V m i n 0pu
Table 3. CII rating for the different types of ships [49].
Ship TypeShip SizeBCDE
Bulk Carrier 0.860.941.061.18
Gas CarrierDWT ≥ 65,0000.810.911.121.44
DWT < 65,0000.850.951.061.25
Tanker 0.820.931.081.28
Container Ship 0.830.941.071.19
General Cargo Ship 0.830.941.061.19
Refrigerated Cargo Carrier 0.780.911.071.20
Combination Carrier 0.870.961.061.14
LNG CarrierDWT ≥ 100,0000.890.981.061.13
DWT < 100,0000.780.921.101.37
Ro-ro Cargo Ship (VC) 0.860.941.061.16
Ro-ro Cargo Ship 0.760.891.081.27
Ro-ro Passenger Ship 0.760.921.141.30
Cruise Passenger Ship 0.870.951.061.16
Table 4. Manually obtained load profile for Case 1.
OperationRPM (per Engine)Load (kW)Amount of Time (%)
Transiting39445050.97
Tugging38642214.17
Idle (Waiting)38742412.14
Idle (Tugging)39244322.72
Table 5. Case 1 configuration comparisons.
Fuel TypeDaily Cost
(USD)
CO2 Emission
(Tonne)
E E O I
(CO2 g/tn-nm)
% Reduction *
in Daily Costin CO2 Emission and EEOI
Diesel24457.6678.6--
LNG (F)25088.5387.6−2.6−11.4
LNG (V)18216.2063.625.519.1
LNG (V + B)4340.838.5382.289.2
* with respect to diesel.
Table 6. Designed load profile for Case 1.
OperationLoad (kW)Amount of Time (%)
Idle42010
6-knot Transit58825
10-knot Transit98010
12-knot Transit117620
Tugging44035
Table 7. Case 2 configuration comparisons.
Fuel TypeDaily Cost
(USD)
CO2 Emission
(Tonne)
E E O I
(CO2 g/tn-nm)
% Reduction *
in Daily Costin CO2 Emission and EEOI
Diesel352211.03113.2--
LNG (F)323611.011138.10.2
LNG (V)25158.5687.828.622.4
LNG (V + B)13914.1142.360.562.7
* with respect to diesel.
Table 8. Case 3 configuration comparisons.
Fuel TypeDaily Cost (USD)CO2 Emission (Tonne) E E O I
(CO2 g/tn-nm)
% Reduction *
in Daily Costin CO2 Emission and EEOI
Diesel366911.49117.9--
LNG (F)333111.33116.39.21.4
LNG (V)28079.5598.023.516.9
LNG (V + B)16454.9550.855.256.9
* with respect to diesel.
Table 9. Average cost comparison of cases.
DieselLNG (F)LNG (V)LNG (V + B)
Daily Cost (USD)3212302523811157
Difference-5.8%25.9%64.0%
Table 10. Average CO2 emissions from cases.
DieselLNG (F)LNG (V)LNG (V + B)
CO2 (tonne)10.0610.298.103.30
Difference-−2.3%19.5%67.2%
Table 11. CII ratings of respective cases and configurations.
C I I   Rating Fuel TypeYear
20232024202520262027
Case 1DieselEEEEE
LNG (F)EEEEE
LNG (V)DEEEE
LNG (V + B)AAAAA
Case 2DieselEEEEE
LNG (F)EEEEE
LNG (V)EEEEE
LNG (V + B)AAAAA
Case 3DieselCCDDD
LNG (F)DEEEE
LNG (V)AABBB
LNG (V + B)AAAAA
Table 12. Case 2 comparisons of results with control strategy.
Fuel TypeDaily Cost (USD)CO2 Emission (Tonne) E E O I
(CO2 g/tn-nm)
% Reduction * Battery   S O C   Consumed   ( % )
in Daily Cost in   CO 2   Emissions   or   E E O I
Diesel352211.03113.2---
LNG (V + B) w/o Control13914.1142.360.562.752
LNG (V + B) Control 80/2024348.0682.730.926.918
LNG (V + B) Control On/Off6071.4815.282.886.548
* with respect to diesel.
Table 13. Case 2 comparison with control strategy at different percentages of load sharing for 120-min operation.
Fuel TypeDaily Cost (USD)CO2
Emission (Tonne)
E E O I
(CO2 g/tn-nm)
% Reduction * Battery   S O C   Consumed   ( % )
in Daily Costin CO 2   Emissions   and   E E O I
Diesel352211.03113.2---
10% LNG/90% Battery5530.9710.084.391.274
20% LNG/80% Battery6541.4014.481.487.368
30% LNG/70% Battery10402.8229.070.574.459
40% LNG/60% Battery15364.5746.956.458.554
50% LNG/50% Battery16545.0151.453.054.650
60% LNG/40% Battery19306.0762.345.245.041
70% LNG/30% Battery20506.5867.641.840.332
80% LNG/20% Battery24348.0682.730.926.918
90% LNG/10% Battery27639.3095.421.615.79
* with respect to diesel.
Disclaimer/Publisher’s Note: The statements, opinions and data contained in all publications are solely those of the individual author(s) and contributor(s) and not of MDPI and/or the editor(s). MDPI and/or the editor(s) disclaim responsibility for any injury to people or property resulting from any ideas, methods, instructions or products referred to in the content.

