1. Introduction
Coastal flooding exacerbated by climate change-driven sea level rise in the 21st century (21C) is recognized as a major existential threat that will affect the livelihoods of more than 1 billion people globally [
1,
2]. This includes between a quarter to more than half of all people living in the Pacific Islands [
3]. Indeed, projected losses in real gross domestic product (real GDP) for major cities around the world are estimated to be significant within the next 100 years [
4], potentially costing the global economy USD trillions in losses by the year 2100 under a business-as-usual climate change scenario [
5,
6,
7].
While much focus within the last decade has been on understanding the dynamics and impacts of coastal flooding due to tidal, relative sea level rise (RSLR), storm surges, and extreme wave processes (e.g., Refs. [
8,
9,
10,
11]), concerns about the effects of sea level rise on exacerbating tsunami inundation impacts have increased. For example, Li et al. (2018) [
12] demonstrated that sea level rise will increase both the frequency and intensity of tsunami-induced flooding by a factor of 1.5 to 4.7 in the city of Macau located along the South China Sea. Similarly, Nagai et al. (2019) [
13] used maximum credible tsunami simulations in Tokyo Bay for different sea level rise scenarios to show that tsunami-induced flood risk in the cities of Yokohama and Kawasaki gradually increases throughout the 21C, with the risk to life in these cities significantly affected once sea levels reach +1.0 m higher than at present.
More recently, Dura et al. (2021) [
14] conducted an earthquake and tsunami modelling analysis that combined local probabilistic RSLR projections to show the increased potential for more frequent, relatively low magnitude earthquakes (M
w 8.0) originating at the Alaska-Aleutian subduction zone, to produce distant-source tsunamis that exceed historically observed maximum nearshore tsunami heights at Los Angeles and Long Beach Ports in California. These observations are consistent with nearshore tsunami height changes due to SLR presented by Koyano et al. (2022) [
15] for the east coast of Japan, who also suggested that the effects of SLR on expected tsunami heights at coast are non-linear and vary according to location.
In the Pacific Islands region, far-field or distant sourced tsunamis which take up to several hours from initiation to coastal impact are typically considered lower risk events compared with locally sourced tsunamis (e.g., Refs. [
16,
17]). However, there is a dearth of detailed hazard risk modelling studies which demonstrate the effects that SLR will have on exacerbating tsunami inundation risk to far-field events in Pacific Island environments. Furthermore, there is a scarcity of evidence on the temporal and critical SLR height thresholds where life and livelihoods are threatened due to SLR-exacerbated far-field tsunami inundation. In the light of evidence delineating the effects of SLR on increasing tsunami inundation risk in coastal continental settings (e.g., Refs. [
12,
13,
14,
15]), there is a need to investigate these processes in the Pacific Small Island Developing States (SIDSs), a region that is highly vulnerable to the impacts of multiple geo-climatic hazards.
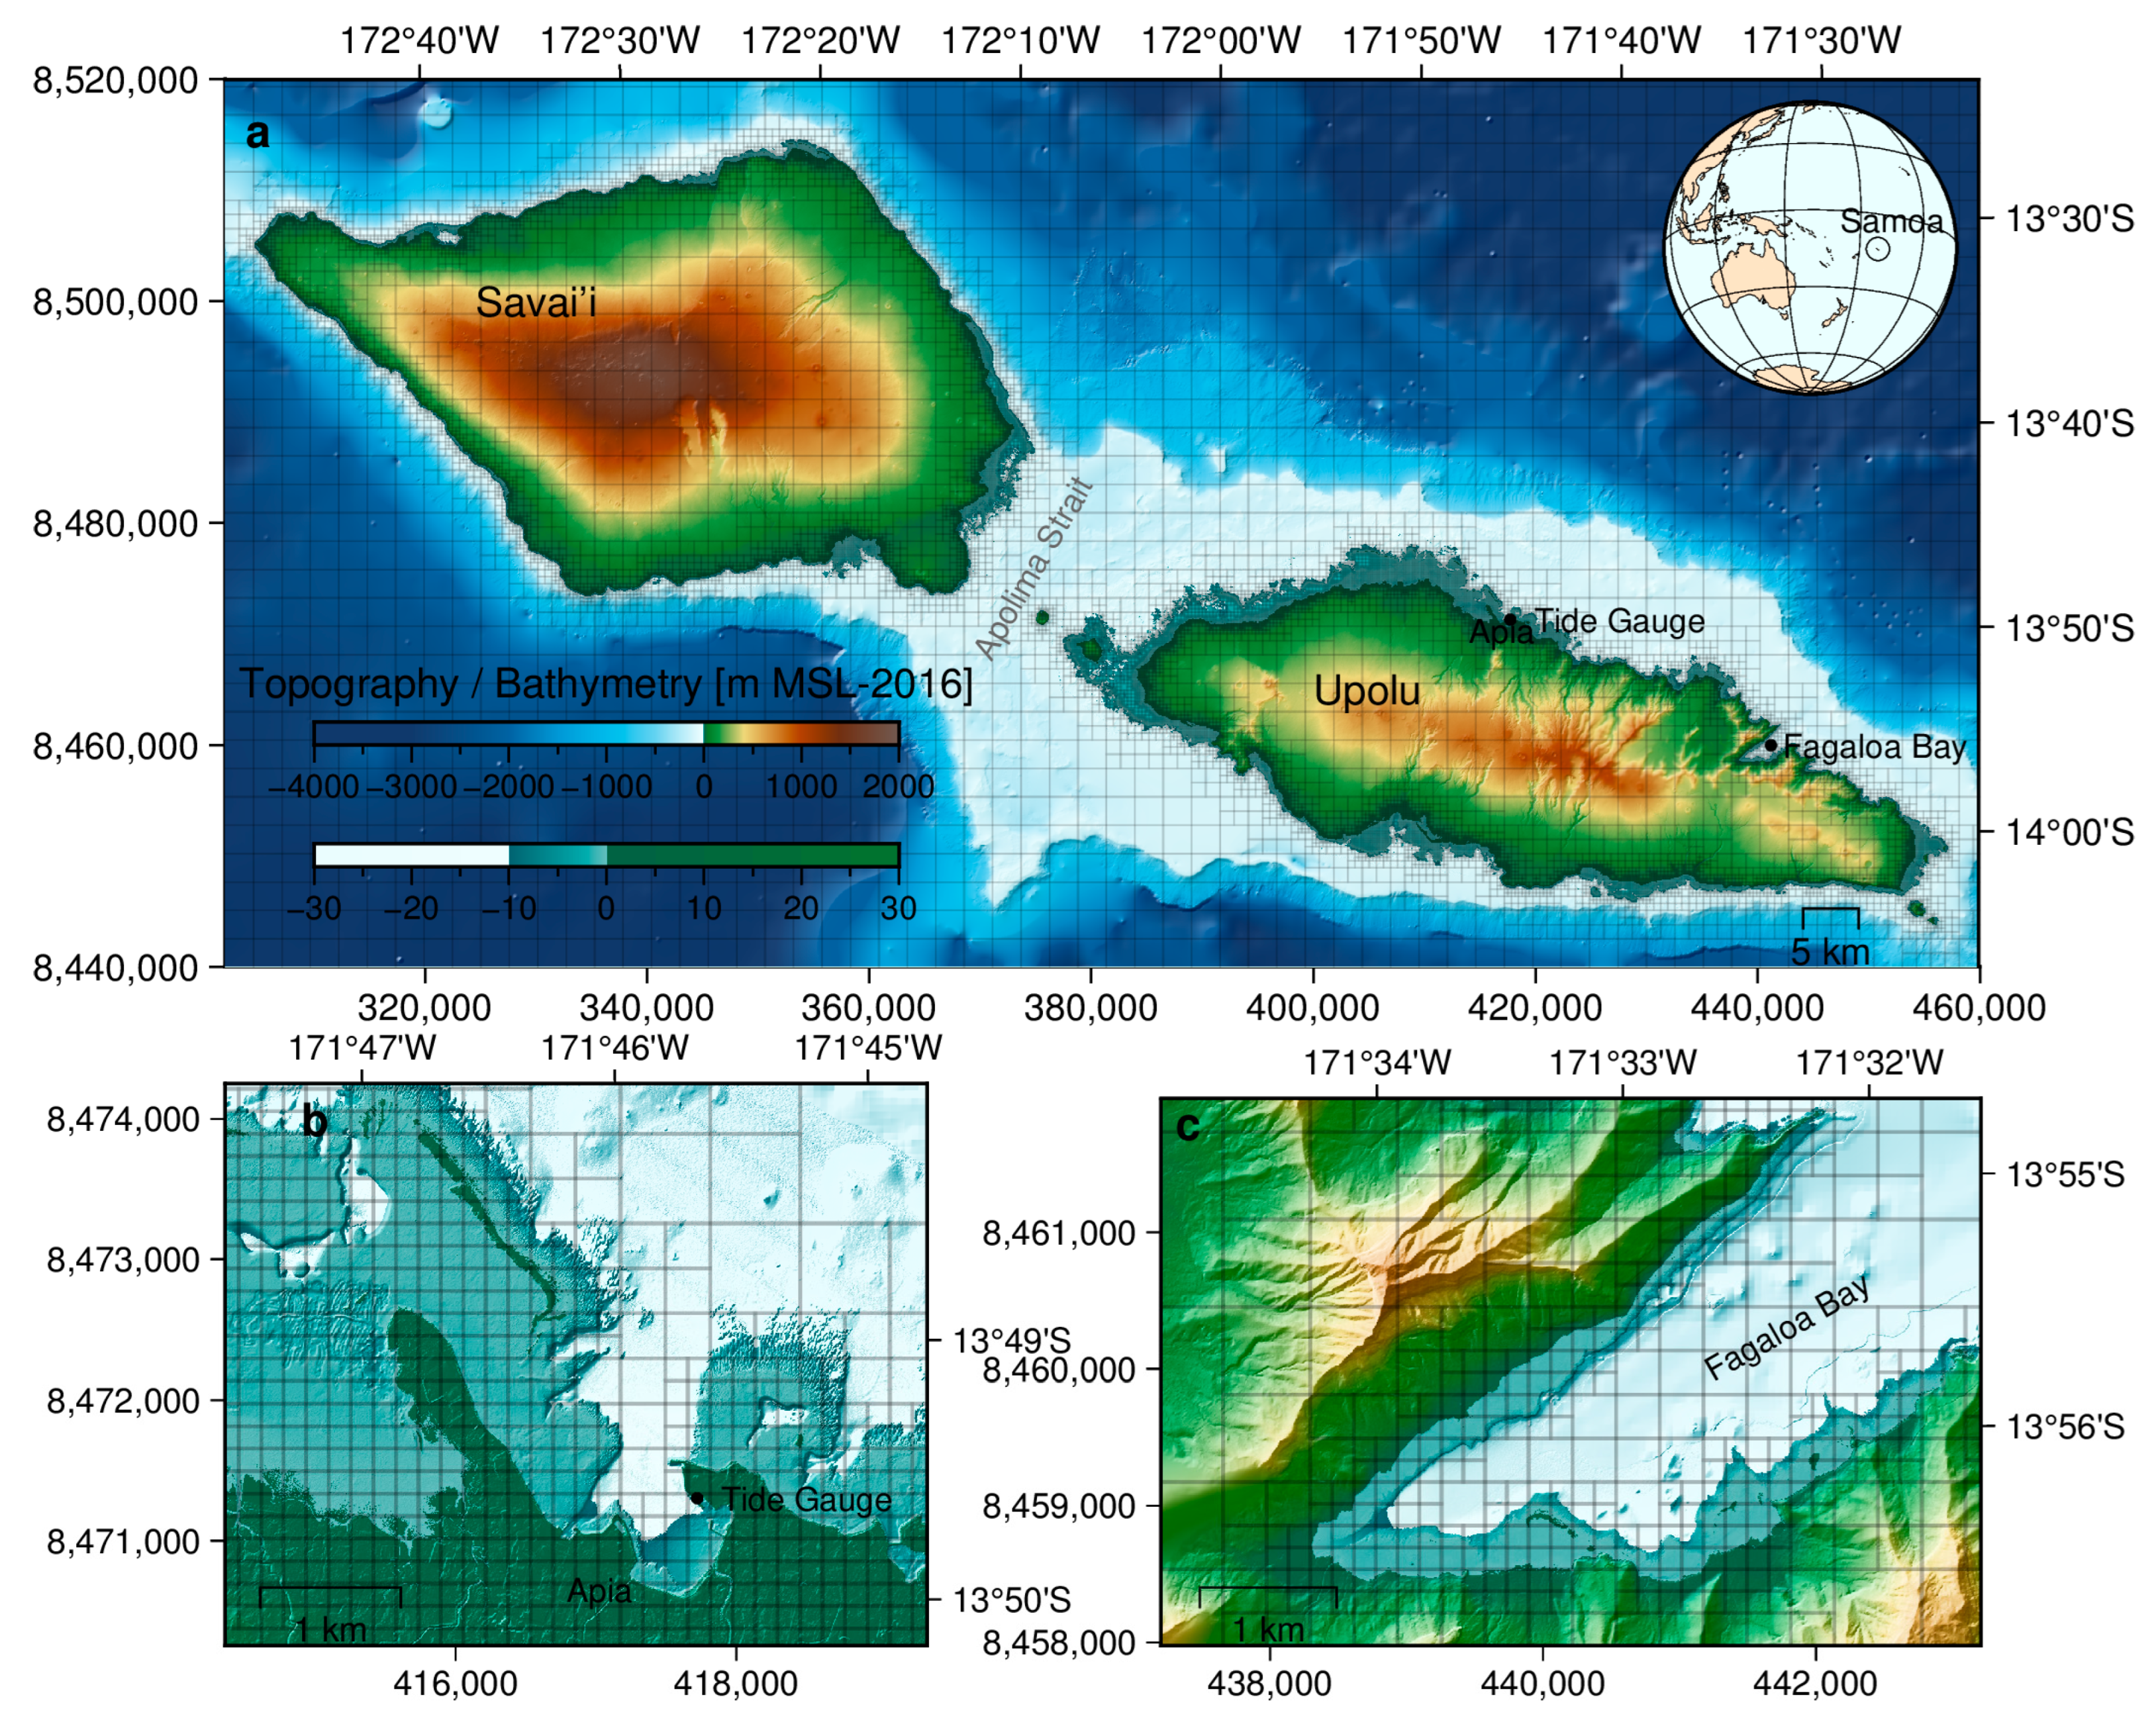
In this paper, we investigate the impact that incremental RSLR has on far-field tsunami inundation and exposure risk in Samoa (
Figure 1), a Pacific SIDS where RSLR is further exacerbated by rapid post-2009 Samoan earthquake subsidence [
18]. Using the 2011 Tōhoku-oki tsunami as a proxy for a far-field tsunami type that can impact the city of Apia in north Upolu Island, we model the event from its source through to propagation across the Pacific Ocean and inundation in Samoa under incremental SLR scenarios (up to 2 m). Results of the inundation modelling are used along with digital representations of buildings to quantify their exposure and damage to permanent tidal flooding caused by incremental SLR, as well as to identify sea-level thresholds where exposure risk to far-field tsunami inundation becomes critical. The implications of our findings on tsunami risk planning in analogous Pacific Island contexts are discussed.
2. Contextual Background
The northern coasts of the Samoan Islands are typically considered at lower threat from tsunami inundation compared with southern coasts which are exposed to the well-known local tsunamigenic northern Tonga subduction zone [
19]. The apparent absence of local tsunamigenic earthquake sources north of the island chain, and limited detailed investigations on potential volcanic or landslide tsunamigenic sources off the northern flanks of the island shelf [
20], lead to a general impression that tsunami threats to the capital city of Apia are relatively low. Indeed, historical records of tsunami impacts in Apia suggest that the threats are lower [
19], with the recent 2022 Hunga Tonga-Hunga Ha’apai volcanic eruption generating a tsunami that resulted in a 0.514 m wave height at the Apia tide gauge [
21]. However, no damage or reports of injuries/losses due to strong currents were observed. Outside of Apia, local volcanic-related tsunami threats which can impact areas in northwest Upolu (e.g., the 1907 Mt Matavanu phreatomagmatic-generated tsunamis) [
22], and far-field tsunamis that can impact Fagaloa Bay in northeast Upolu (e.g., 1960 Chile tsunami) [
17], have been recorded, although no loss of life from any of these events were observed.
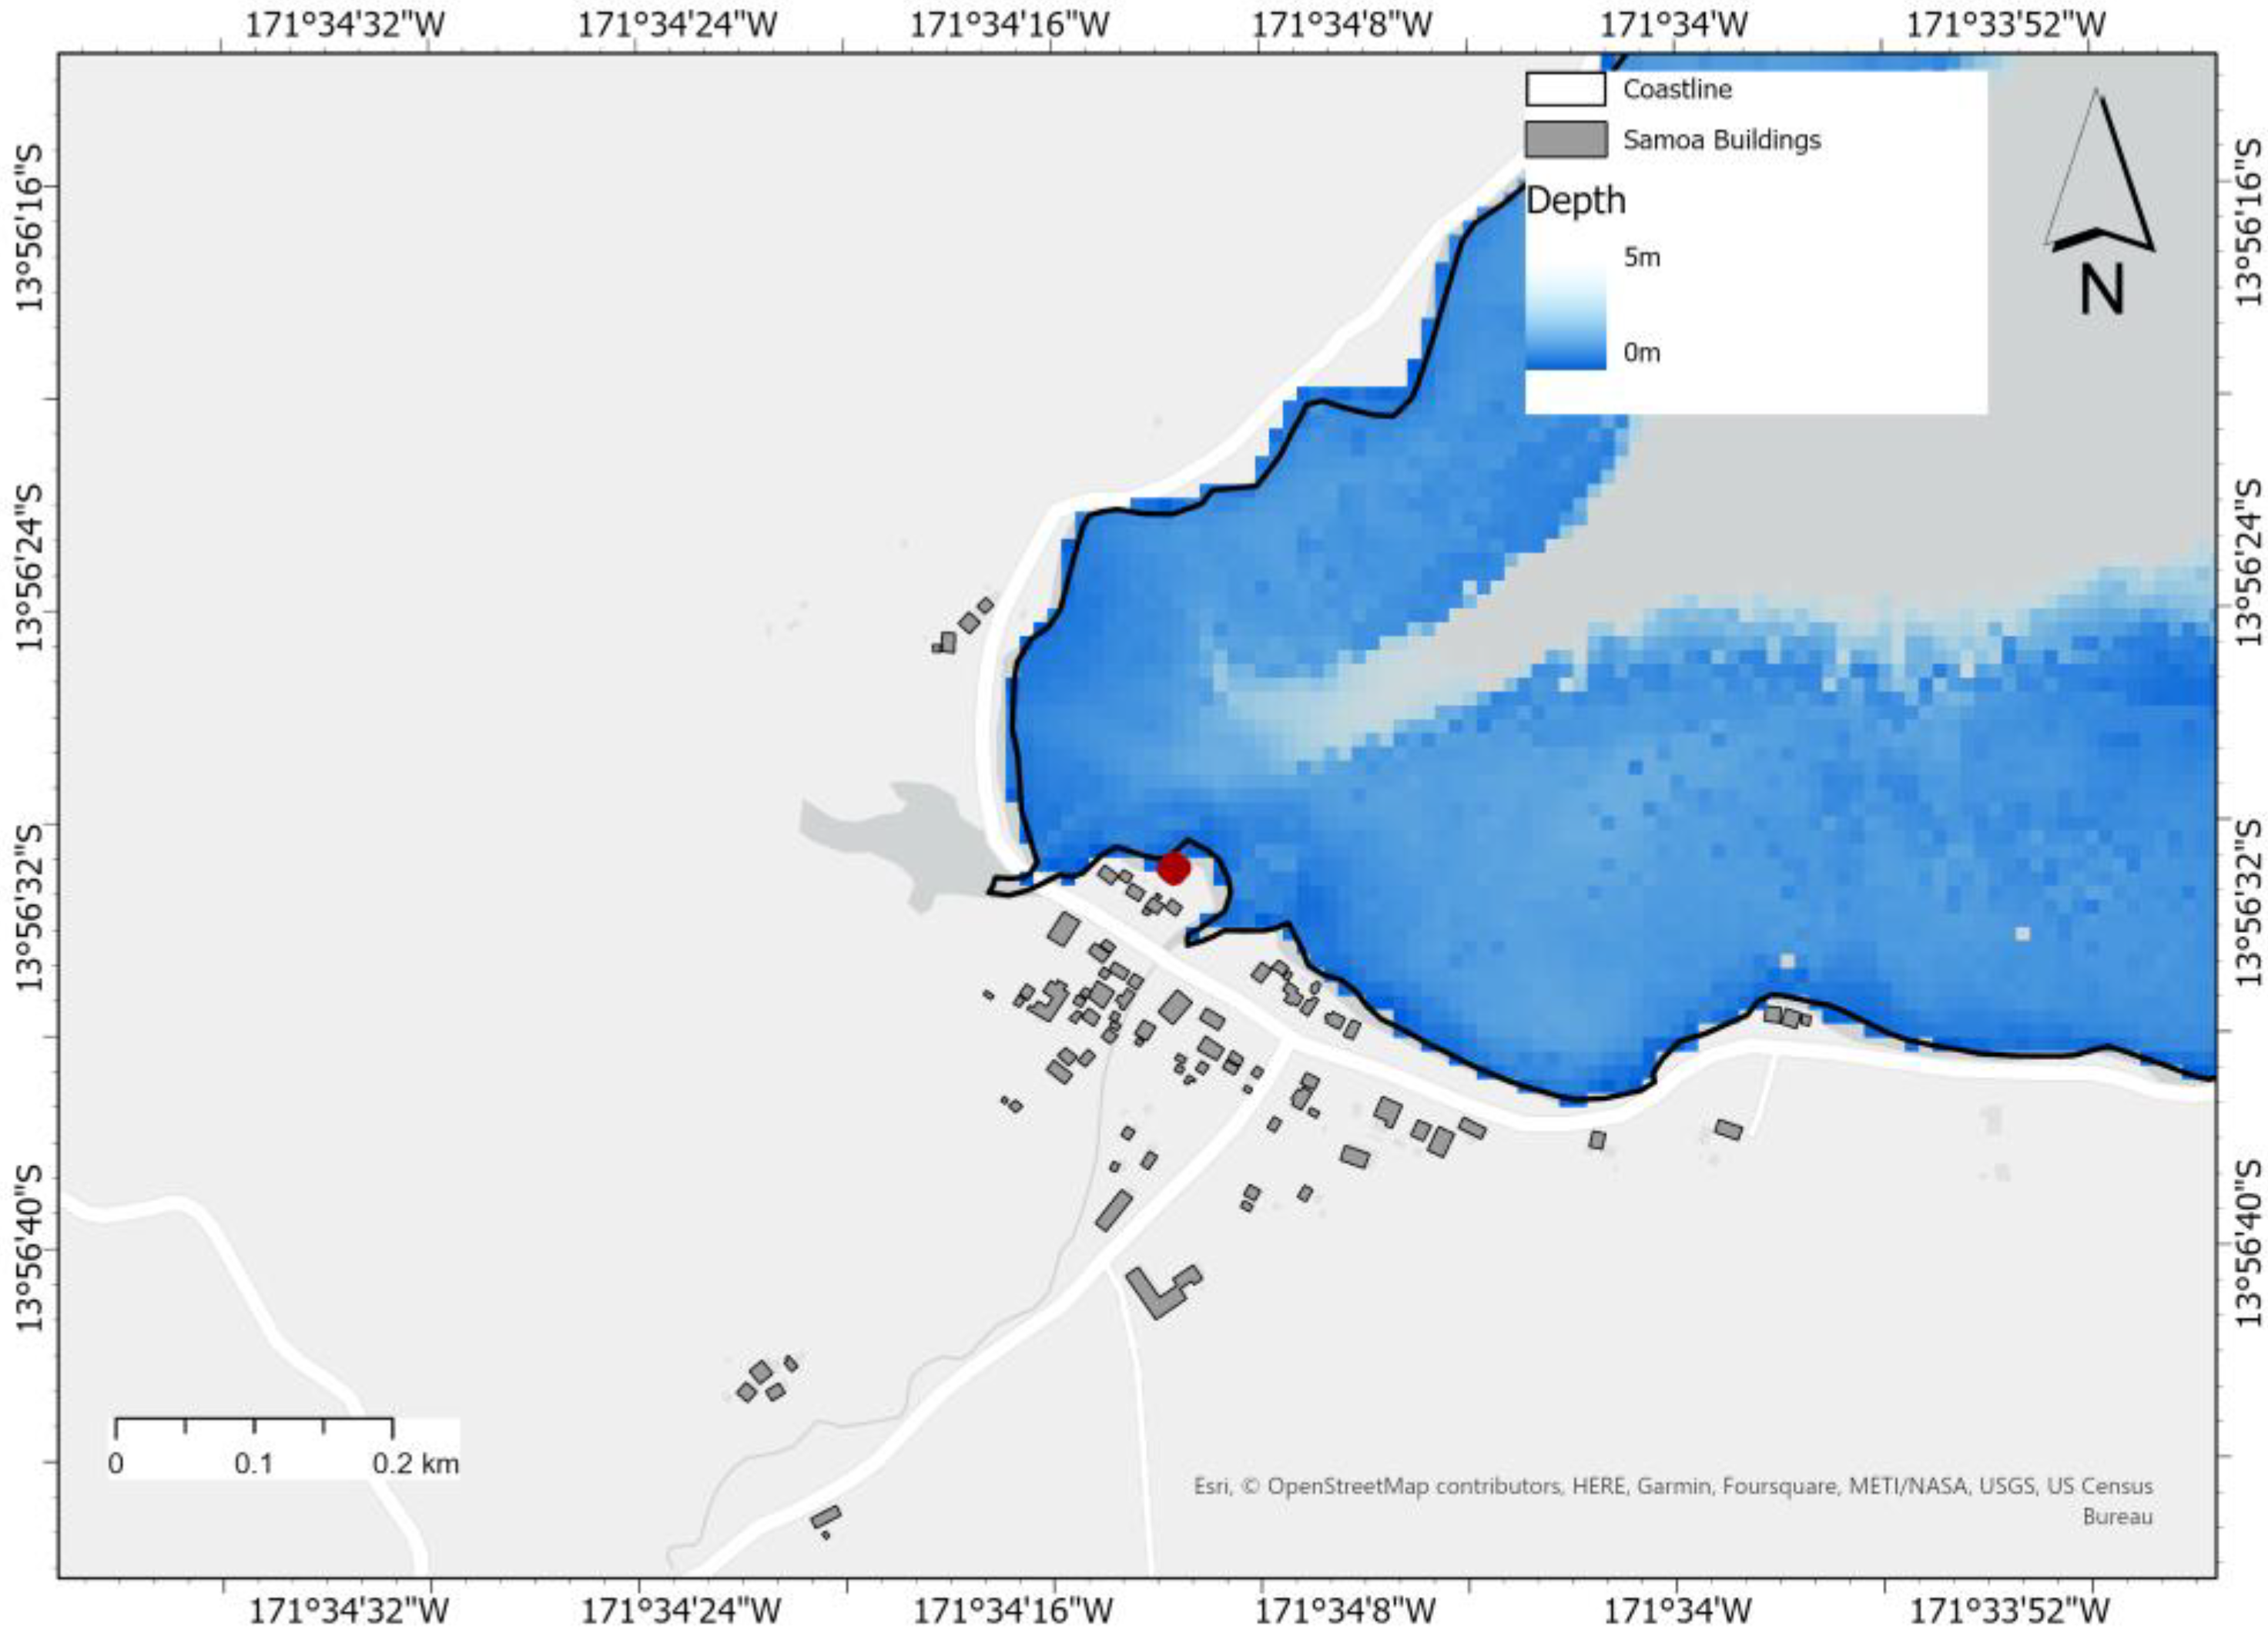
A single building at the head of Fagaloa Bay is the only location in Samoa known to have experienced inundation following the 2011 Tōhoku-oki tsunami, whereby a tsunami wave of 0.7 m above normal water level was observed approx. 14 h after the event (
Figure 1). Long period waves associated with both local and distant sourced tsunamis are known to excite resonance frequencies in the characteristic V-shaped Fagaloa embayment which can amplify wave flux effects (e.g., Ref. [
23]). Resonance modes and periods in Samoa are predominantly controlled by fringing reefs [
24] and excite when constructive interference occurs between the tsunami oscillation periods and the natural periods of bathymetric features. This phenomenon can result in more severe onshore inundation impacts than might be expected (e.g., Refs. [
23,
24]. In far-field tsunamis, the largest wave amplitude tends to occur following the first peak due to this resonance. For these types of events both the regional and local bathymetry play a significant role in resonance amplification [
25]. Hence, the 2011 Tōhoku-oki tsunami inundation in this embayment is unsurprising, with the observed wave providing a reference to corroborate our tsunami model and its application in the incremental SLR inundation analysis.
3. Materials and Methods
To investigate the impact of a Tōhoku-oki-type far-field tsunami inundation on the exposure of buildings in Samoa under incremental sea level rise, we (1) modelled the tsunami from the earthquake source to inundation in the Samoan Islands, as described in
Section 3.1 and
Section 3.2, and (2) we modelled the built-environment exposure to tsunami inundation impacts on buildings, as described in
Section 3.3.
3.1. Tsunami Source and Propagation Modelling
Tsunami modelling from source to propagation and inundation was undertaken using the shock-capturing hydrodynamics model BG-Flood (block-adaptive on graphics processing unit flood model) [
24,
26] (
Figure 1). Finite faulting characteristics for the 2011 Tōhoku-oki earthquake source developed by Yamazaki et al. (2018) [
27], were used to configure the tsunami generation in BG-Flood. The initial deformation of the water surface was calculated using the deformation model of Okada (1985) [
28] for each of the 60 segments of the finite fault solution in [
27]. The deformation of each of the 60 separate fault segments was applied at the rupture time suggested in [
28] (up to 2 min after the initial rupture). Transpacific propagation of the wave to Samoa was simulated on a uniform spherical grid with a resolution of 0.05 degrees (~5 km).
BG-Flood applies graphics processing units (GPUs) configured with an adaptive mesh refinement (AMR)-type grid to simulate shallow water hydrodynamics used to model propagation across the Pacific Ocean to inundation in Samoa. The Saint-Venant shallow water equation (SWE) solver in Basilisk [
29] provided the model governing equations, with a Block Uniform Quadtree mesh used to enable efficient simulation on the GPUs [
30]. The model uses an explicit solver where the timestep is automatically calculated based on a courant (CFL) number of 0.5. The SWE engine validation and solver are described in detail by Popinet (2012) [
31]. The ability of BG-Flood to efficiently simulate many scenarios efficiently [
26] meant that it was well suited for modelling the range of 2011 Tōhoku-oki-type tsunami inundation under benchmark and incremental SLR. BG-Flood was validated using tide gauge and Deep-ocean Assessment and Reporting of Tsunamis (DART) buoy data to show that it satisfactorily reproduced two historical events. The 11 March 2011 magnitude 9.1 Tōhoku-oki tsunami showed moderate to strong correlation with DART buoys (DART-51425 and DART-51426), and the 29 September 2009 magnitude 8.1 Samoa tsunami event showed strong correlation with the Apia tide gauge [
32].
The digital elevation models (DEM) used in these simulations were derived from: (1) the Generic Bathymetric Chart of the Oceans (GEBCO) at ~900 m resolution covering the ocean expanse between the earthquake source and Samoa; (2) a multi-beam bathymetry survey over the Samoan shelf slopes at a resolution of ~60 m [
33], which was used in the adaptive refinement of the propagating wave in the nearshore; (3) light detection and ranging (LiDAR) topography and nearshore bathymetry (down to 30 m depth) at a resolution of 5 m [
34], for simulation of inundation on land at spatially variable grid resolutions (e.g., 10 m on land and close to the shore and 160 m in the deep ocean).
3.2. Tsunami Inundation Modelling
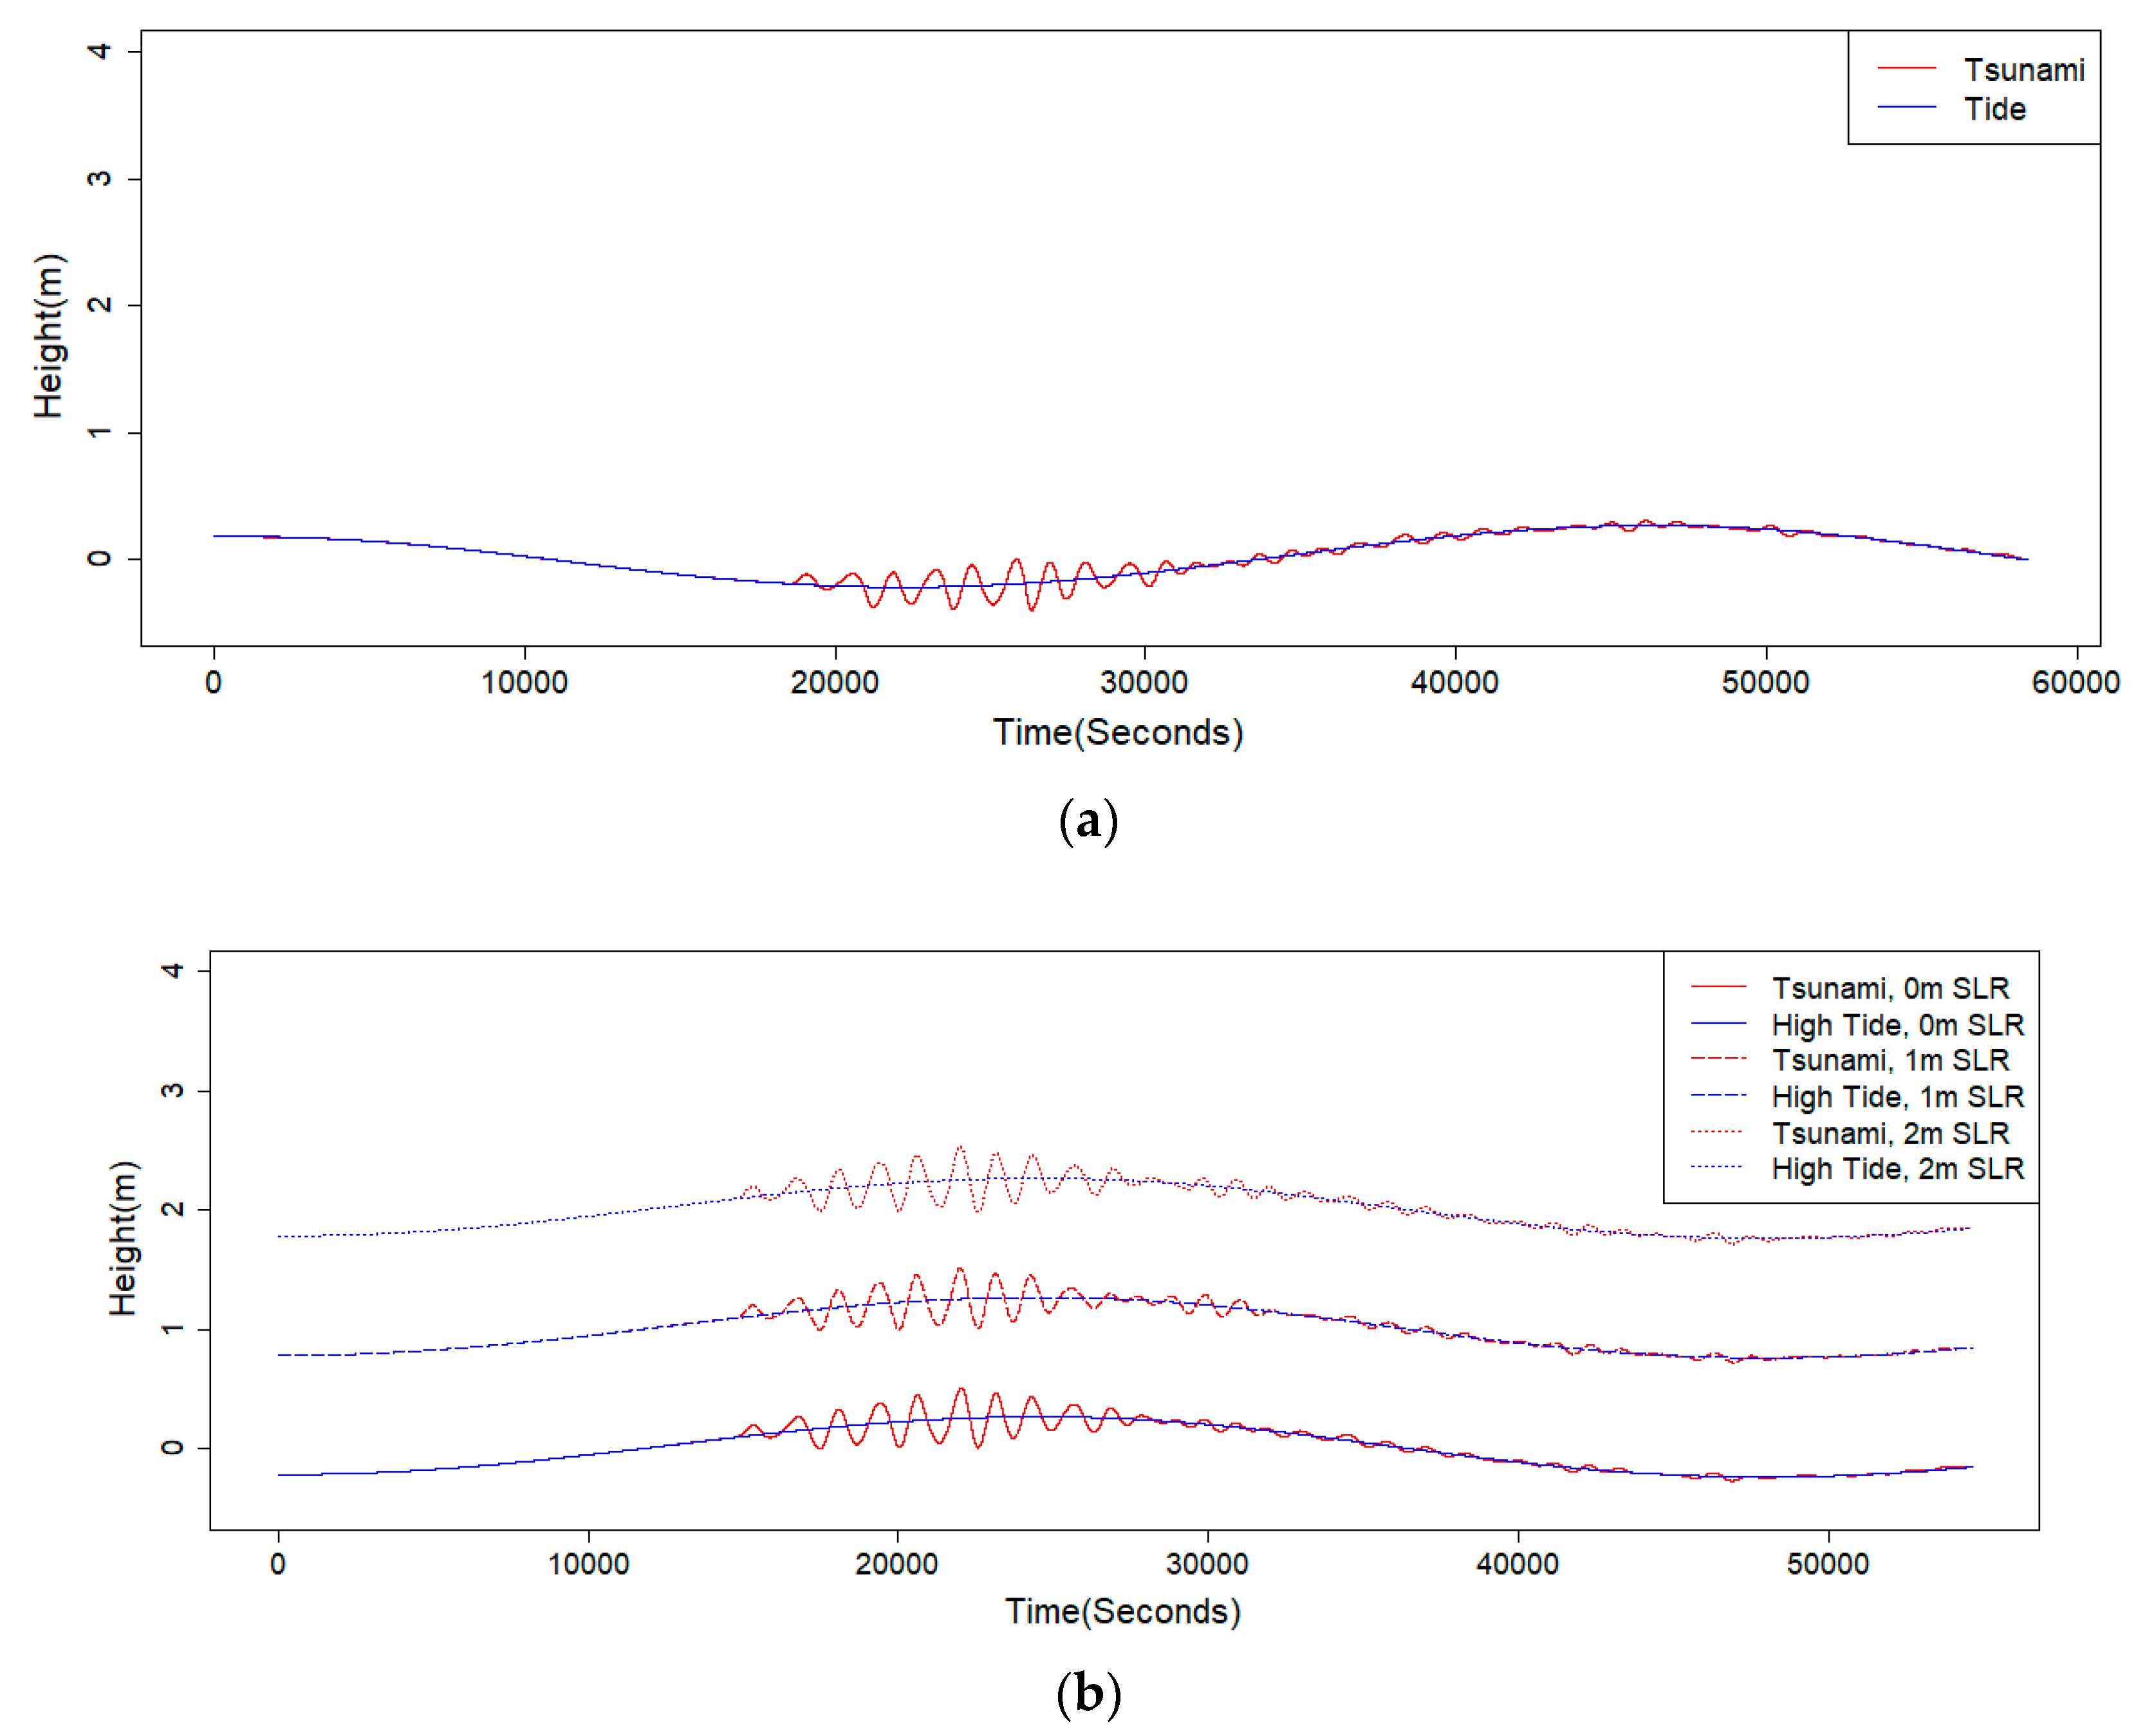
Tsunami inundation modelling was undertaken in 0.2 m sea level rise increments, ranging from 0 m SLR up to 2 m SLR. This was to account for a range of possible SLRs from present to beyond 2150 including, pessimistic carbon emission pathways leading to severe ice sheet loss. These simulations were all modelled using BG-Flood with the tsunami inundating at high tide, to simulate a worse-case scenario, despite the Tōhoku tsunami reaching Samoa at low to medium tide. Additionally, the actual observed tsunami was modelled for use in validation.
The tide on 11 March 2011 was also modelled in BG-Flood under the different sea level rise increments. These results were then used in the exposure analysis to determine the assets that would already be exposed to sea level rise even without the far-field tsunami. There are no sea level records from the Apia Tide Gauge between 2 March 2011 at 0800 and 24 March 2011 at 0300 due to instrument faults, meaning that the relevant tide for the tsunami had to be predicted. This was carried out by first calculating the tidal constituent from the hourly tide gauge data from 1994 to 2021 using the UTide Matlab package. The constituents were then used to predict the tide level for 11 March 2011 using the tide prediction function of UTide.
The tsunami wave generated from the source and propagation modelling was added to the predicted tide from the 11 March 2011 and the SLR increment to use as the boundary forcing for the north boundary of the tsunami simulations. The tide and SLR increment only was used as the boundary forcing for the other three sides of the tsunami simulation domain, and all domain sides for the tide simulations.
A simplified roughness map forcing was used in all simulations. The map was generated by applying a low roughness (0.0001 m) for elevations lower than −20 m (i.e., 20 m below datum), and a value of 0.01 m was used for areas with elevations above the −20 m threshold. The roughness map was used to represent the high roughness from the fringing reefs, mangroves, and coastal vegetation in contrast to the relatively smooth seafloor of the continental shelf and deep ocean. Outputs of this model were in the network common data form (netCDF) file format, with the highest inundation extent extracted for use in the subsequent exposure and damage analysis.
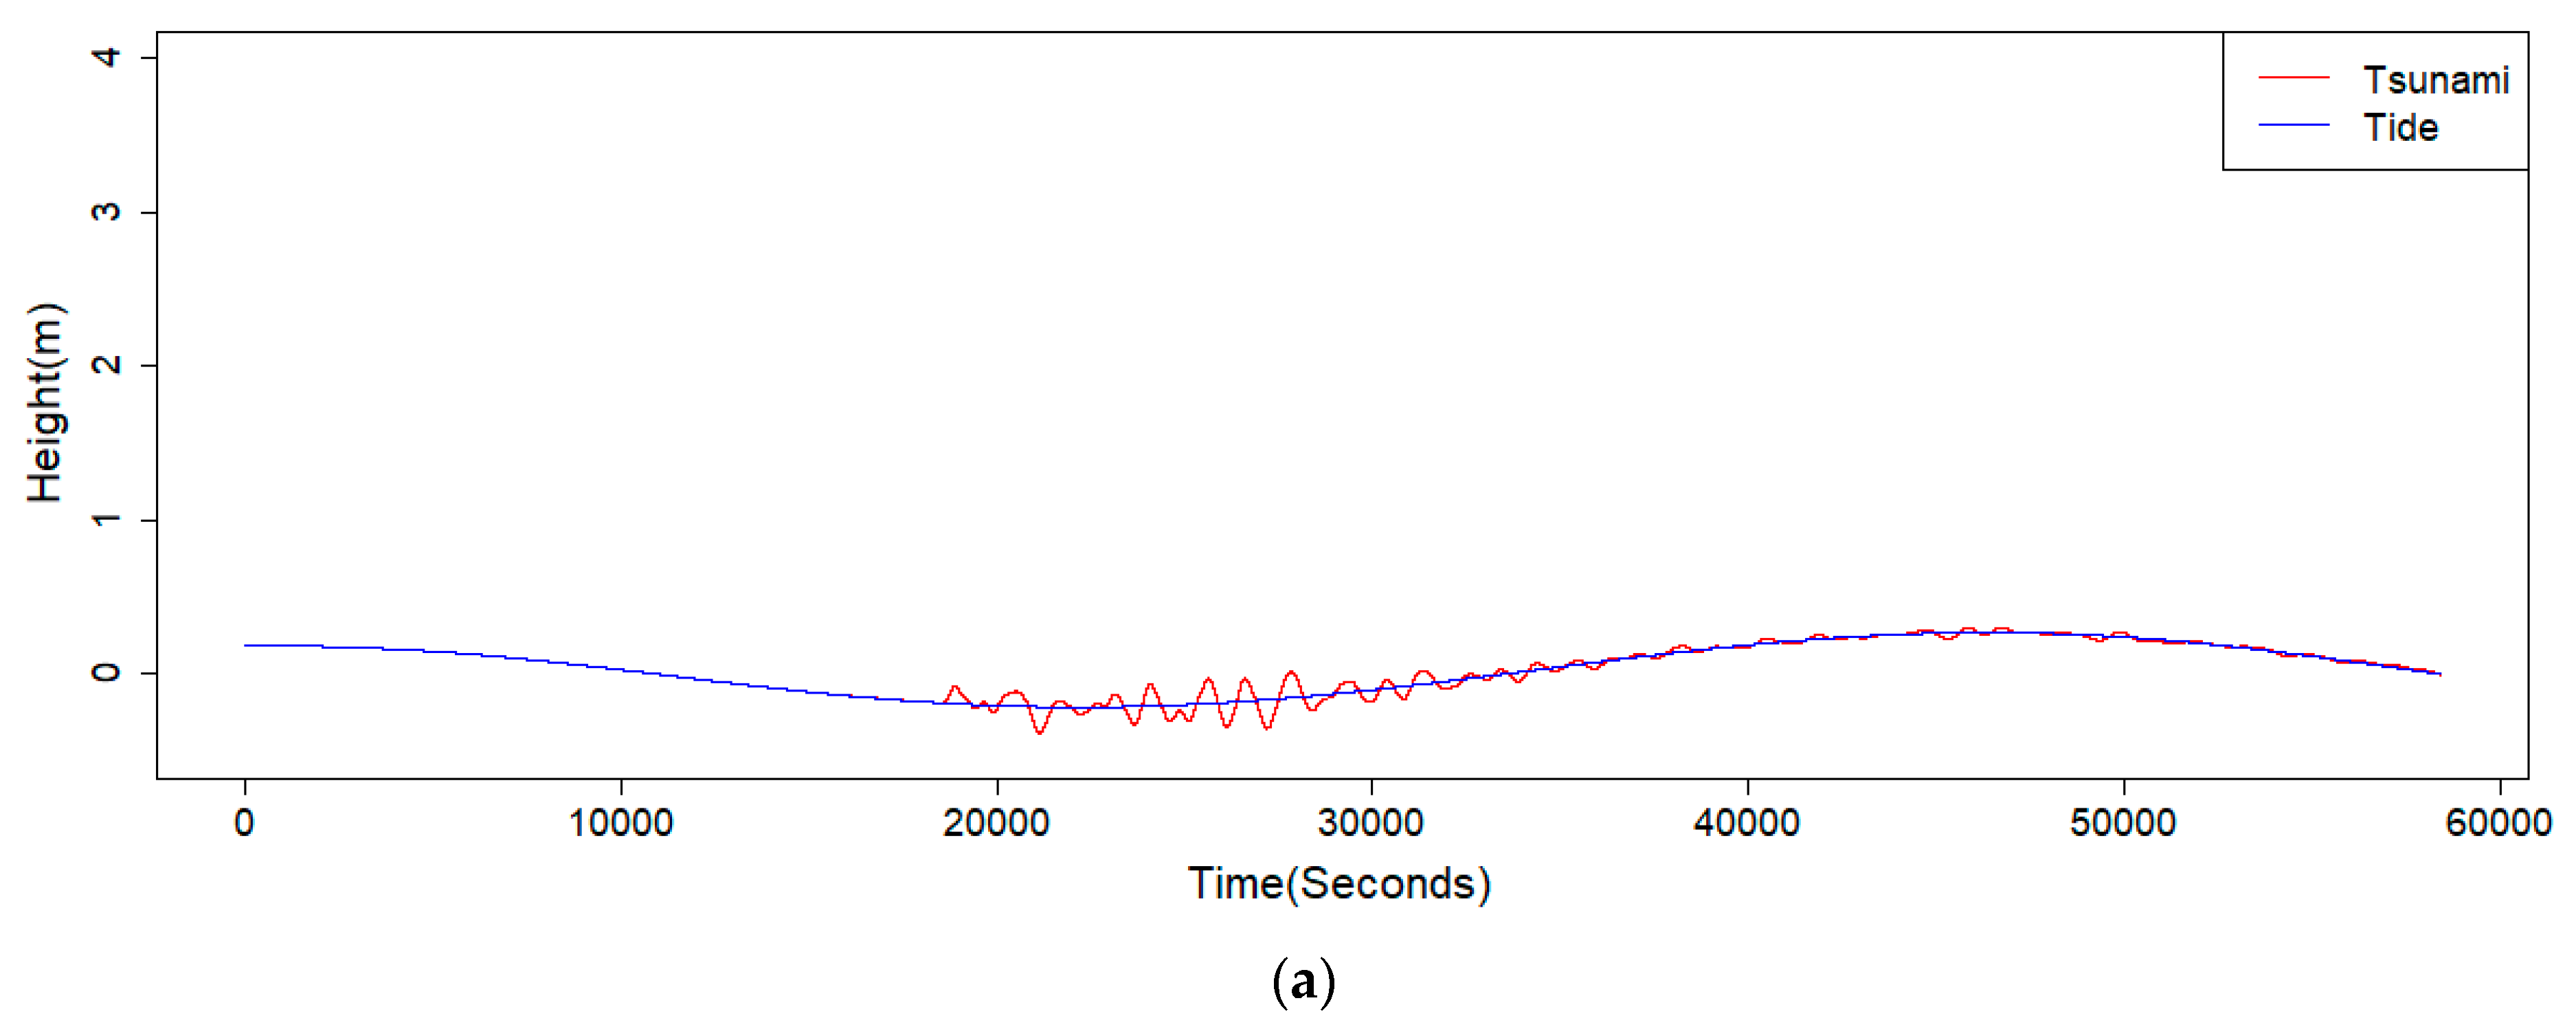
Validation of the model was limited due to the lack of Apia Tide Gauge data. Eyewitnesses from the 2011 tsunami event in Samoa observed the inundation of only one building in Fagaloa Bay. As seen in
Figure 2, the tide alone did not result in the inundation of this building, yet when coupled with the tsunami, this building becomes inundated as expected, which helps to validate our model.
3.3. Tsunami Damage Analysis
Cumulative tsunami damages in response to RSLR were analysed using the multi-hazard impact model framework supported by the RiskScape software [
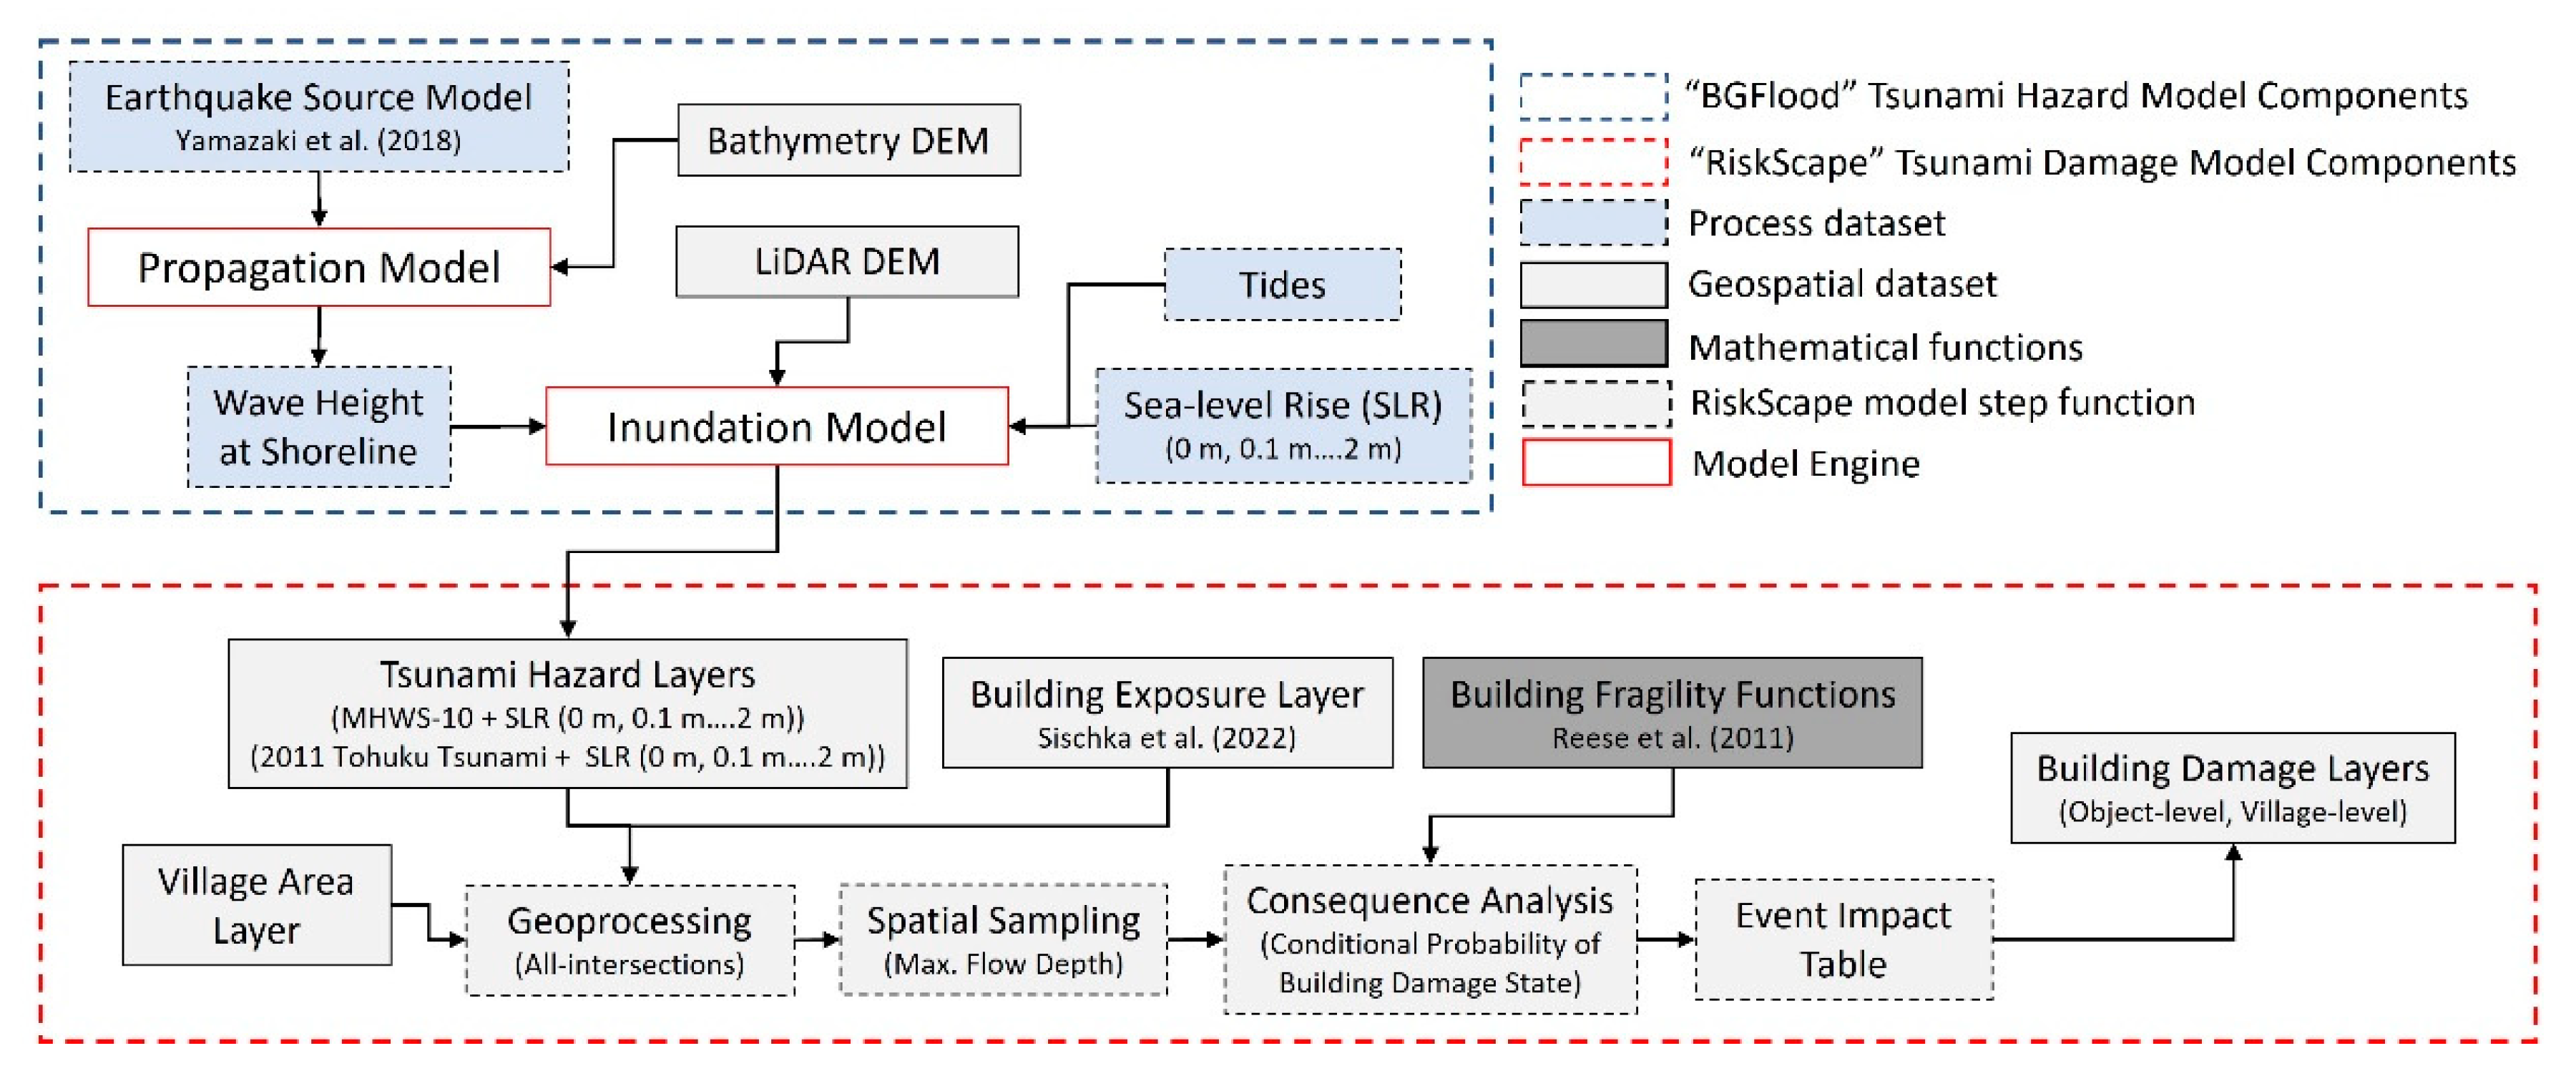
35]. RiskScape implements modeller-defined risk quantification workflows as model pipelines. Model pipeline steps and functions enable the analysis of hazard, exposure, and vulnerability data across different spatio-temporal domains using geoprocessing and spatial sampling operations. Pipelines configured to analyse direct physical damage to buildings in this study are presented in
Figure 3, with building structures selected for damage analysis due to their socio-economic importance in tsunami preparedness, response, and recovery activities.
In addition to the tsunami hazard scenarios presented in
Section 3.2, exposure and vulnerability information provide model inputs to quantify the direct physical damage to buildings. Buildings located within the maximum modelled tsunami run-up extent were acquired from Sischka et al. (2022) [
36]. Building outlines were represented as polygons with construction frame attribute characteristics.
To model the damages to buildings exposed to tsunami inundation, we used fragility curves which relate a tsunami hazard intensity measure (e.g., flow depth) to the conditional probability of built structures reaching or exceeding a given damage state [
37]. In this study, direct physical damage is assessed using empirical fragility curves that represent surveyed Samoan buildings damaged in the 2009 South Pacific Tsunami [
38]. The curves denote a lognormal cumulative density function (CDF) that estimates conditional probabilities of buildings reaching specific damage states (DS) in response to maximum tsunami flow depth (m) (
Table 1), for ‘timber’, ‘masonry’, and ‘reinforced concrete’ construction frame typologies. These construction frame typologies represent over 90% of buildings potentially exposed to tsunami hazards in Samoa [
39], thereby providing sufficient representation of direct physical damage for buildings in the study area. Where
µ (mean) and
σ (standard deviation) damage state coefficients are unavailable for timber and reinforced concrete typologies (
Table 1), or where construction frame attributes were absent and could not be attributed to buildings, masonry fragility curves were applied to calculate the conditional DS probabilities.
Figure 3.
RiskScape framework showing the modelling workflow, data inputs, and outputs [
27,
36,
38].
Figure 3.
RiskScape framework showing the modelling workflow, data inputs, and outputs [
27,
36,
38].
A model pipeline was developed to quantify the direct tsunami exposure and physical damage to buildings in RiskScape (
Figure 3). Individual tsunami hazard and RSLR scenarios consisted of two digital maps representing (1) tsunami flow depth, and (2) permanent tide without tsunami inundation. Buildings exposed to tide inundation depths >0.05 m were identified as permanently inundated and removed from the physical damage analysis. A maximum flow depth for built structures episodically exposed to tsunami hazards was then determined from spatial sampling of grids intersecting the buildings’ outline polygons. Maximum flow depth was applied in object-specific building curves to calculate the conditional probability of each DS, which were then weighted to estimate the damage probability (0–1) for each building object.
4. Results
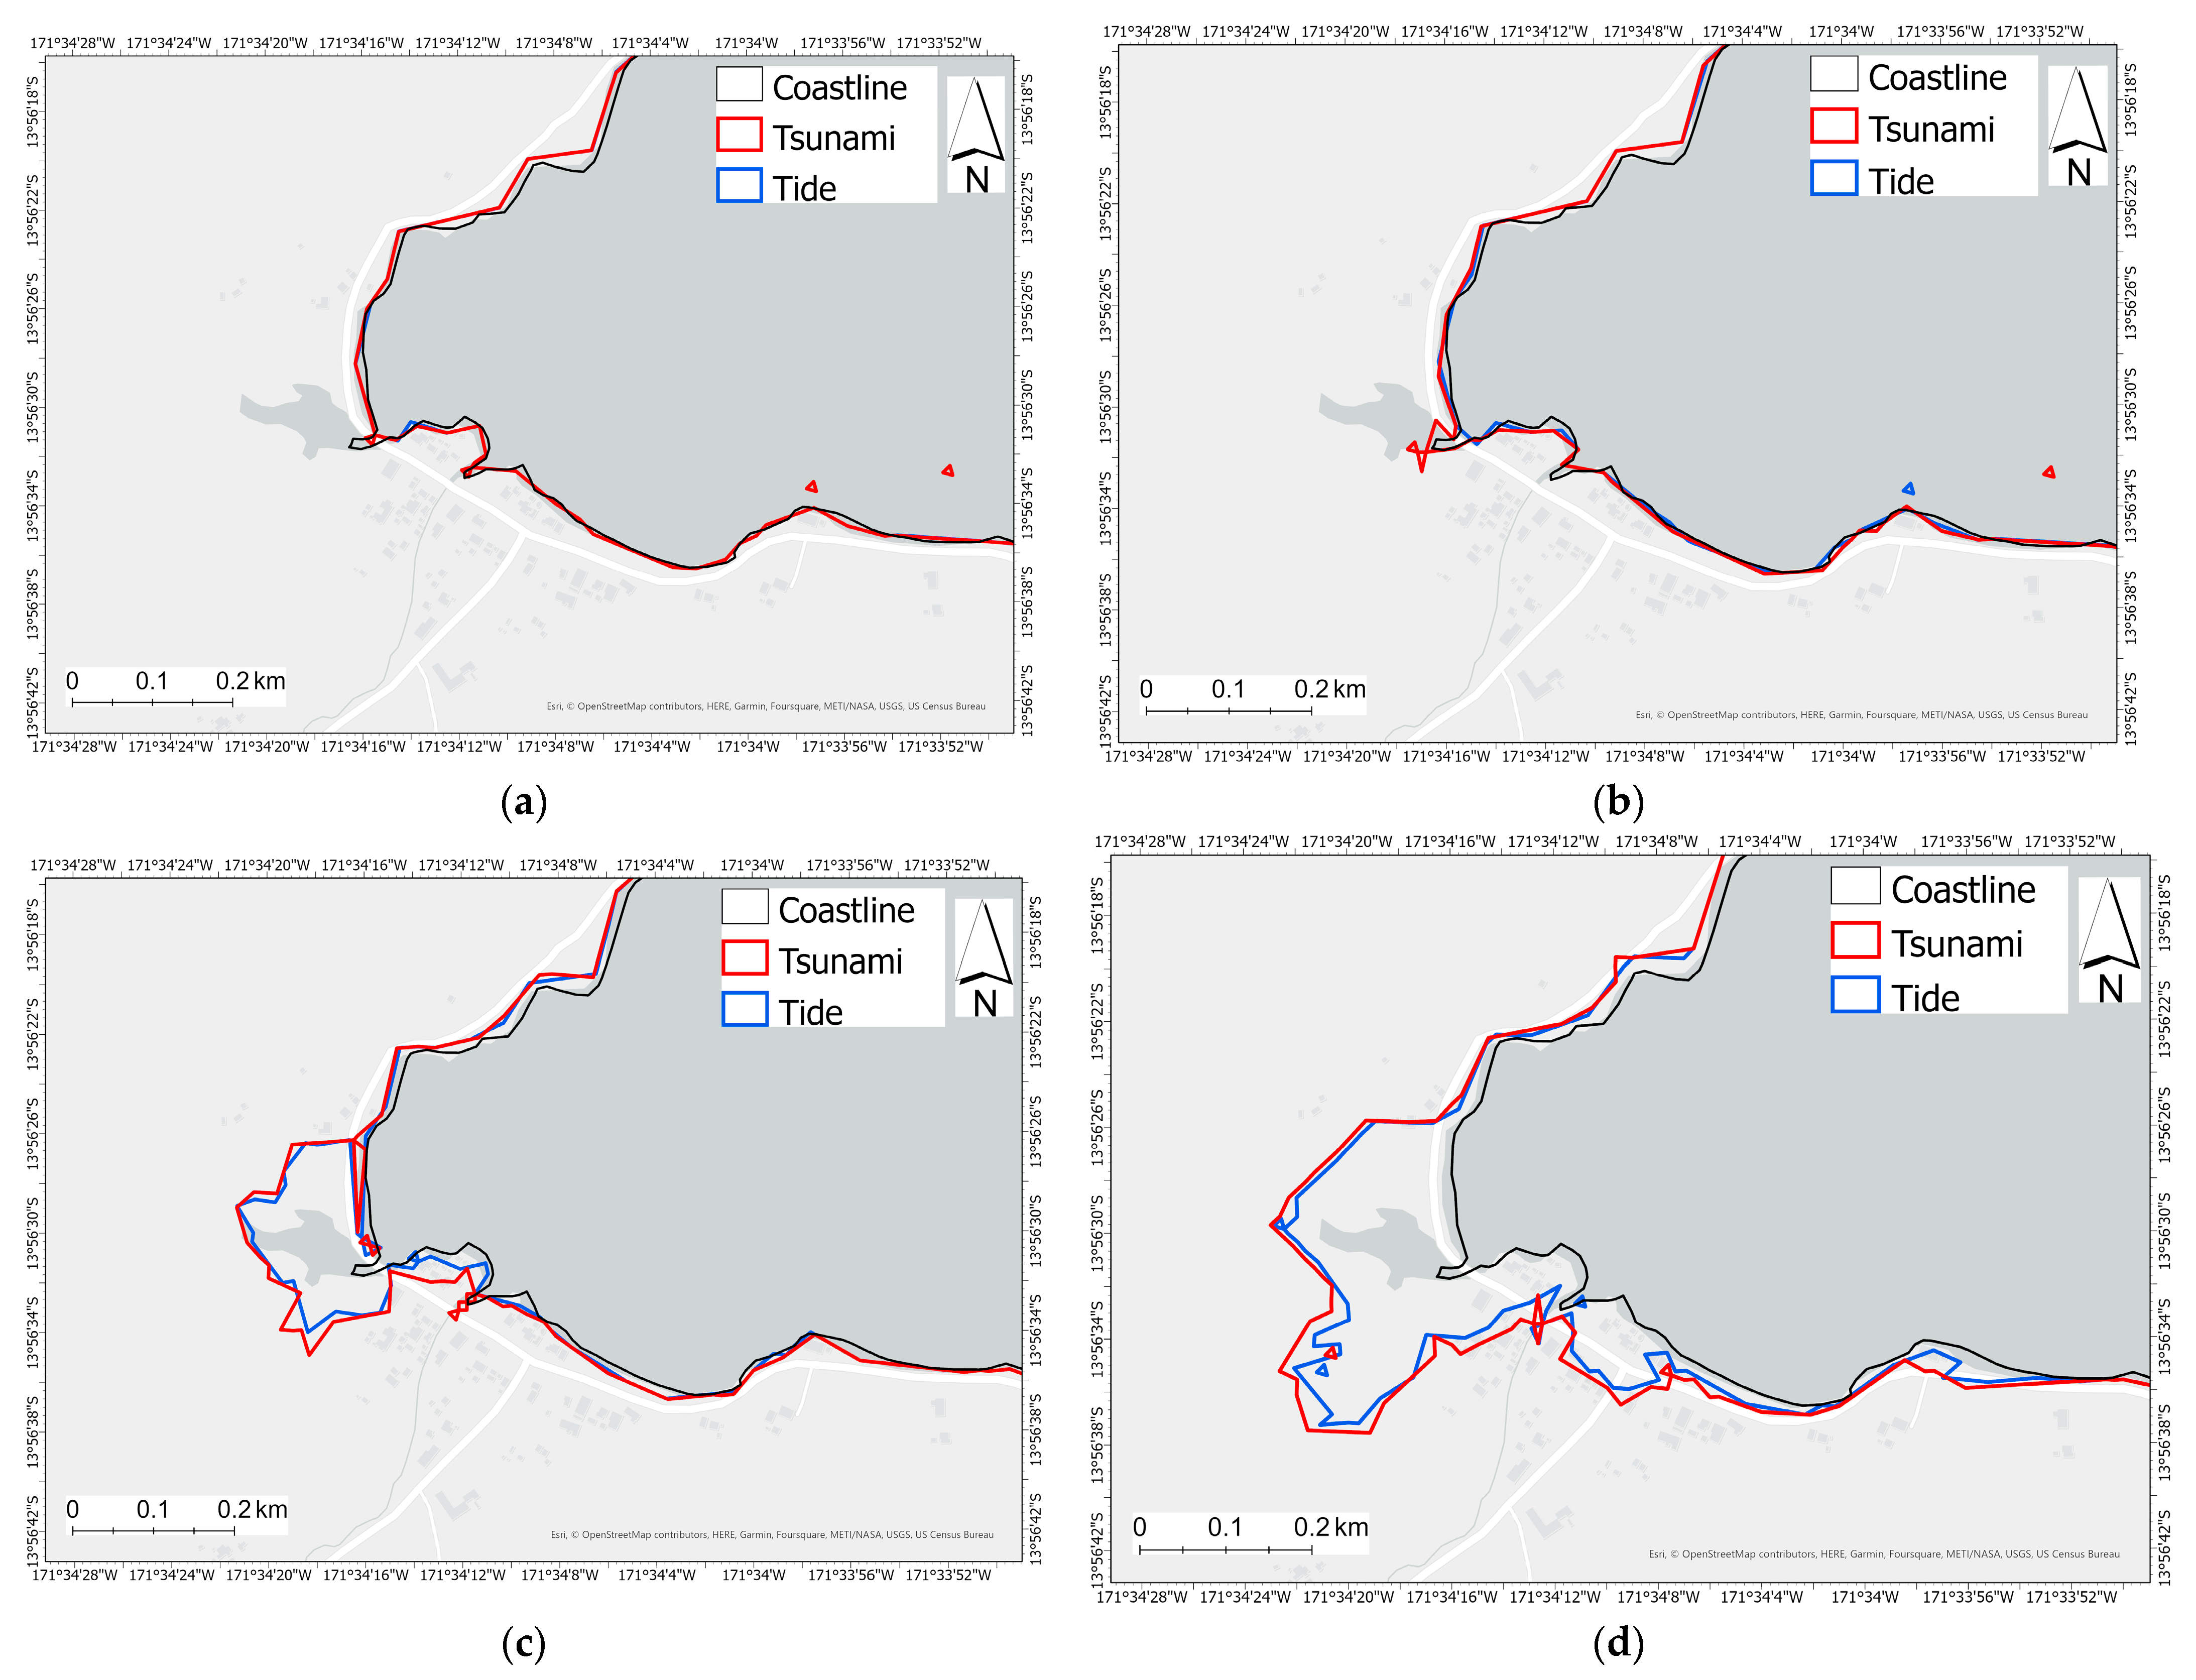
Modelling results of the 2011 Tōhoku-oki-type tsunami in Samoa corroborate eye-witness observations that the impacts of inundation were minimal and predominantly confined to Fagaloa Bay in northeast Upolu. The tsunami arrival coincided with low tide and resulted in the inundation of one building located on the coastline in Fagaloa Bay (
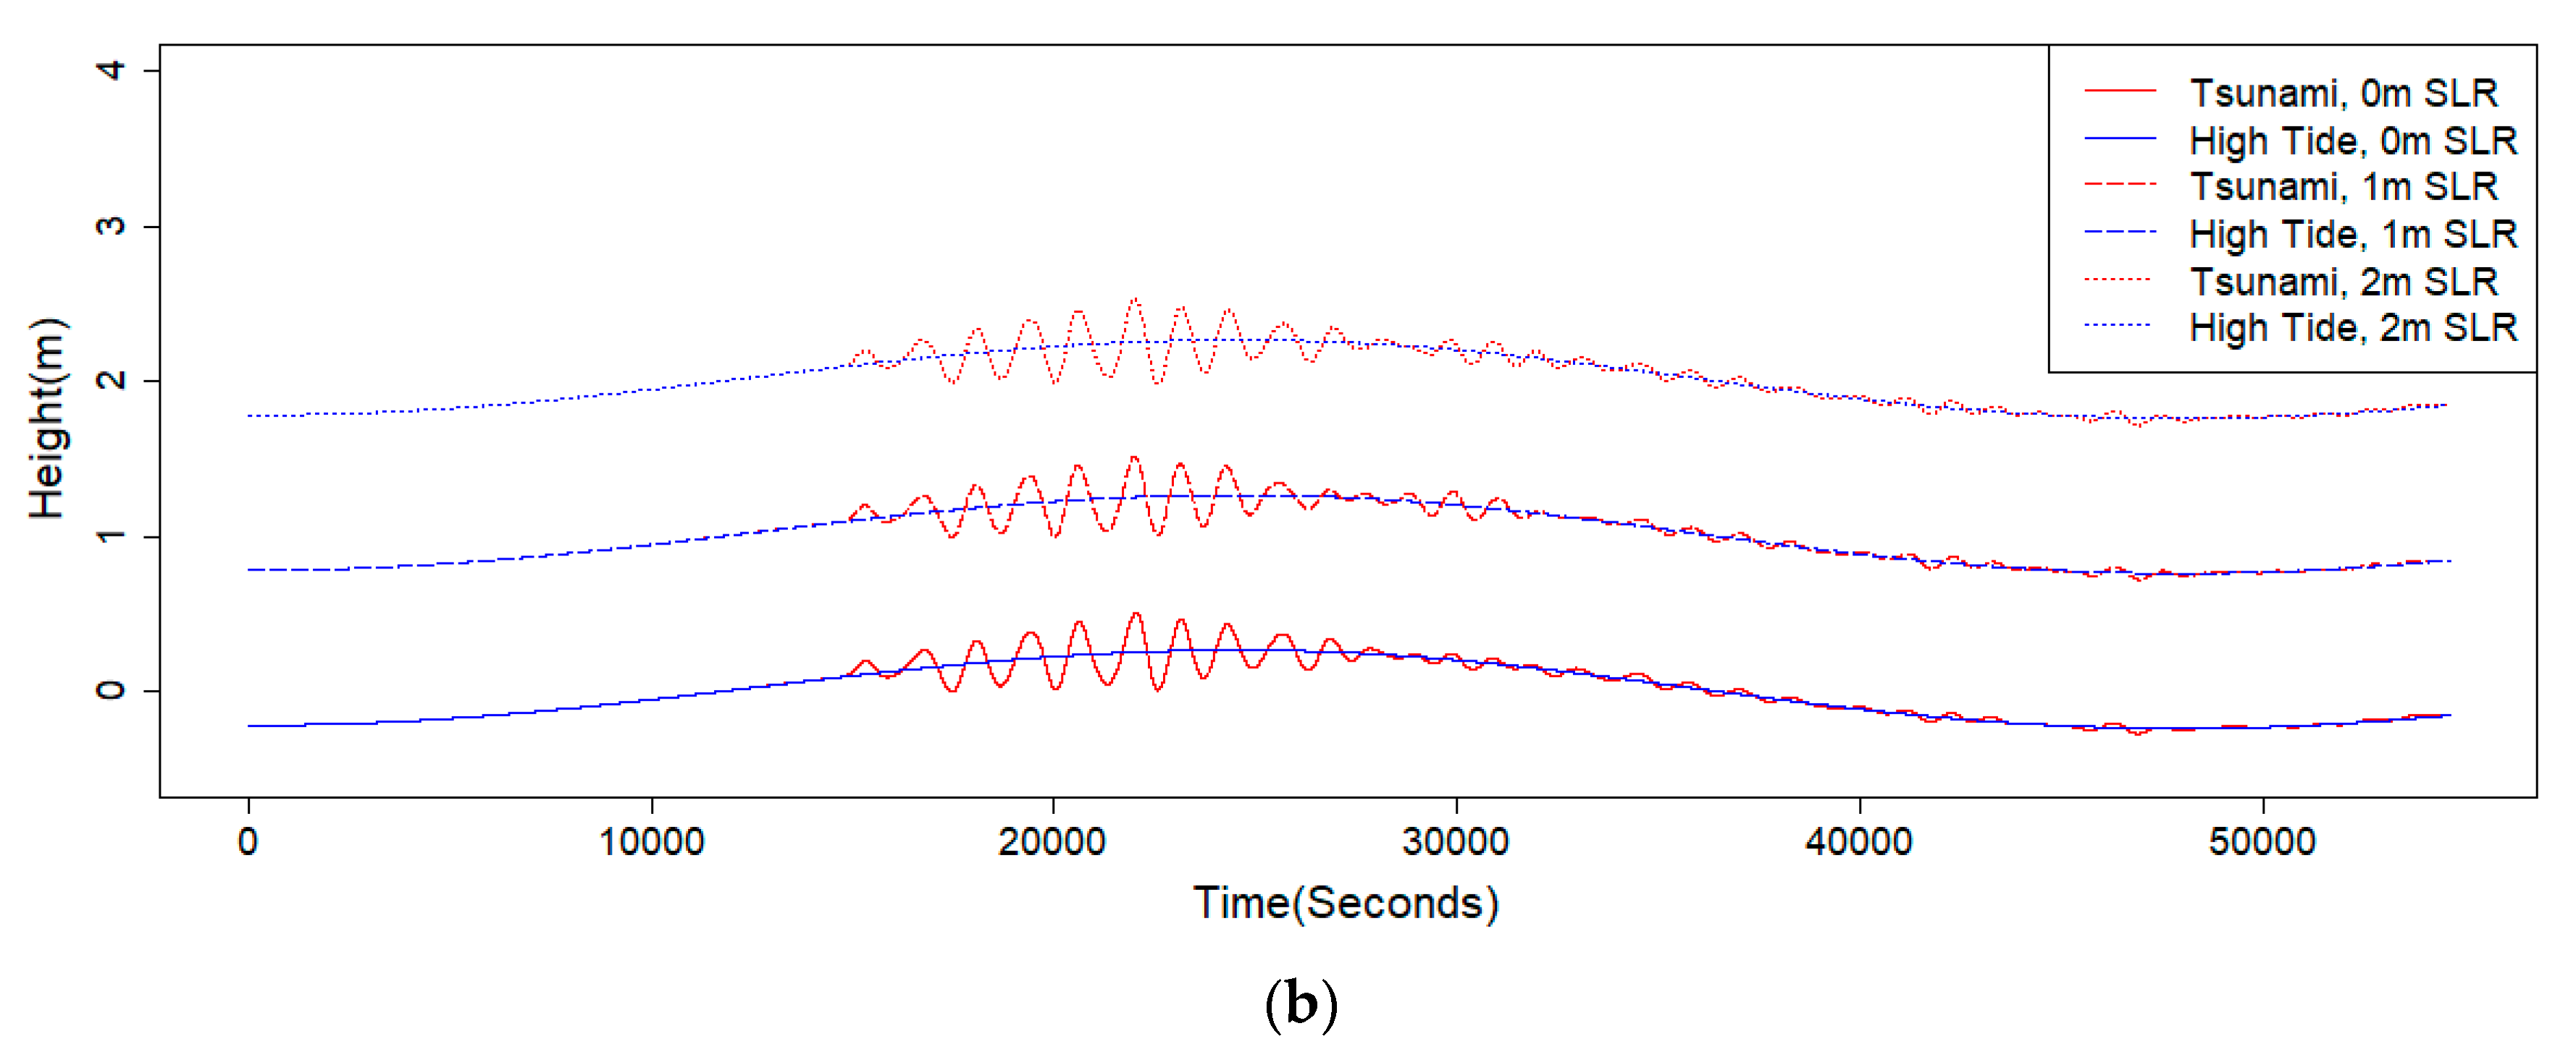
Figure 2). Under increasing SLR, the impacts of a similar magnitude event are more severe. For example,
Figure 4 and
Figure 5 show increases in wave amplification for a Tōhoku-oki-type tsunami at the coast in Apia and Fagaloa Bay with increasing sea levels, with the extent of tsunami flooding and expected damage in these locations becoming more widespread and severe. This wave amplification is due to tsunami resonance in Fagaloa Bay and at the Apia tide gauge, caused by boundary reflection and the bathymetry of these two locations [
40].
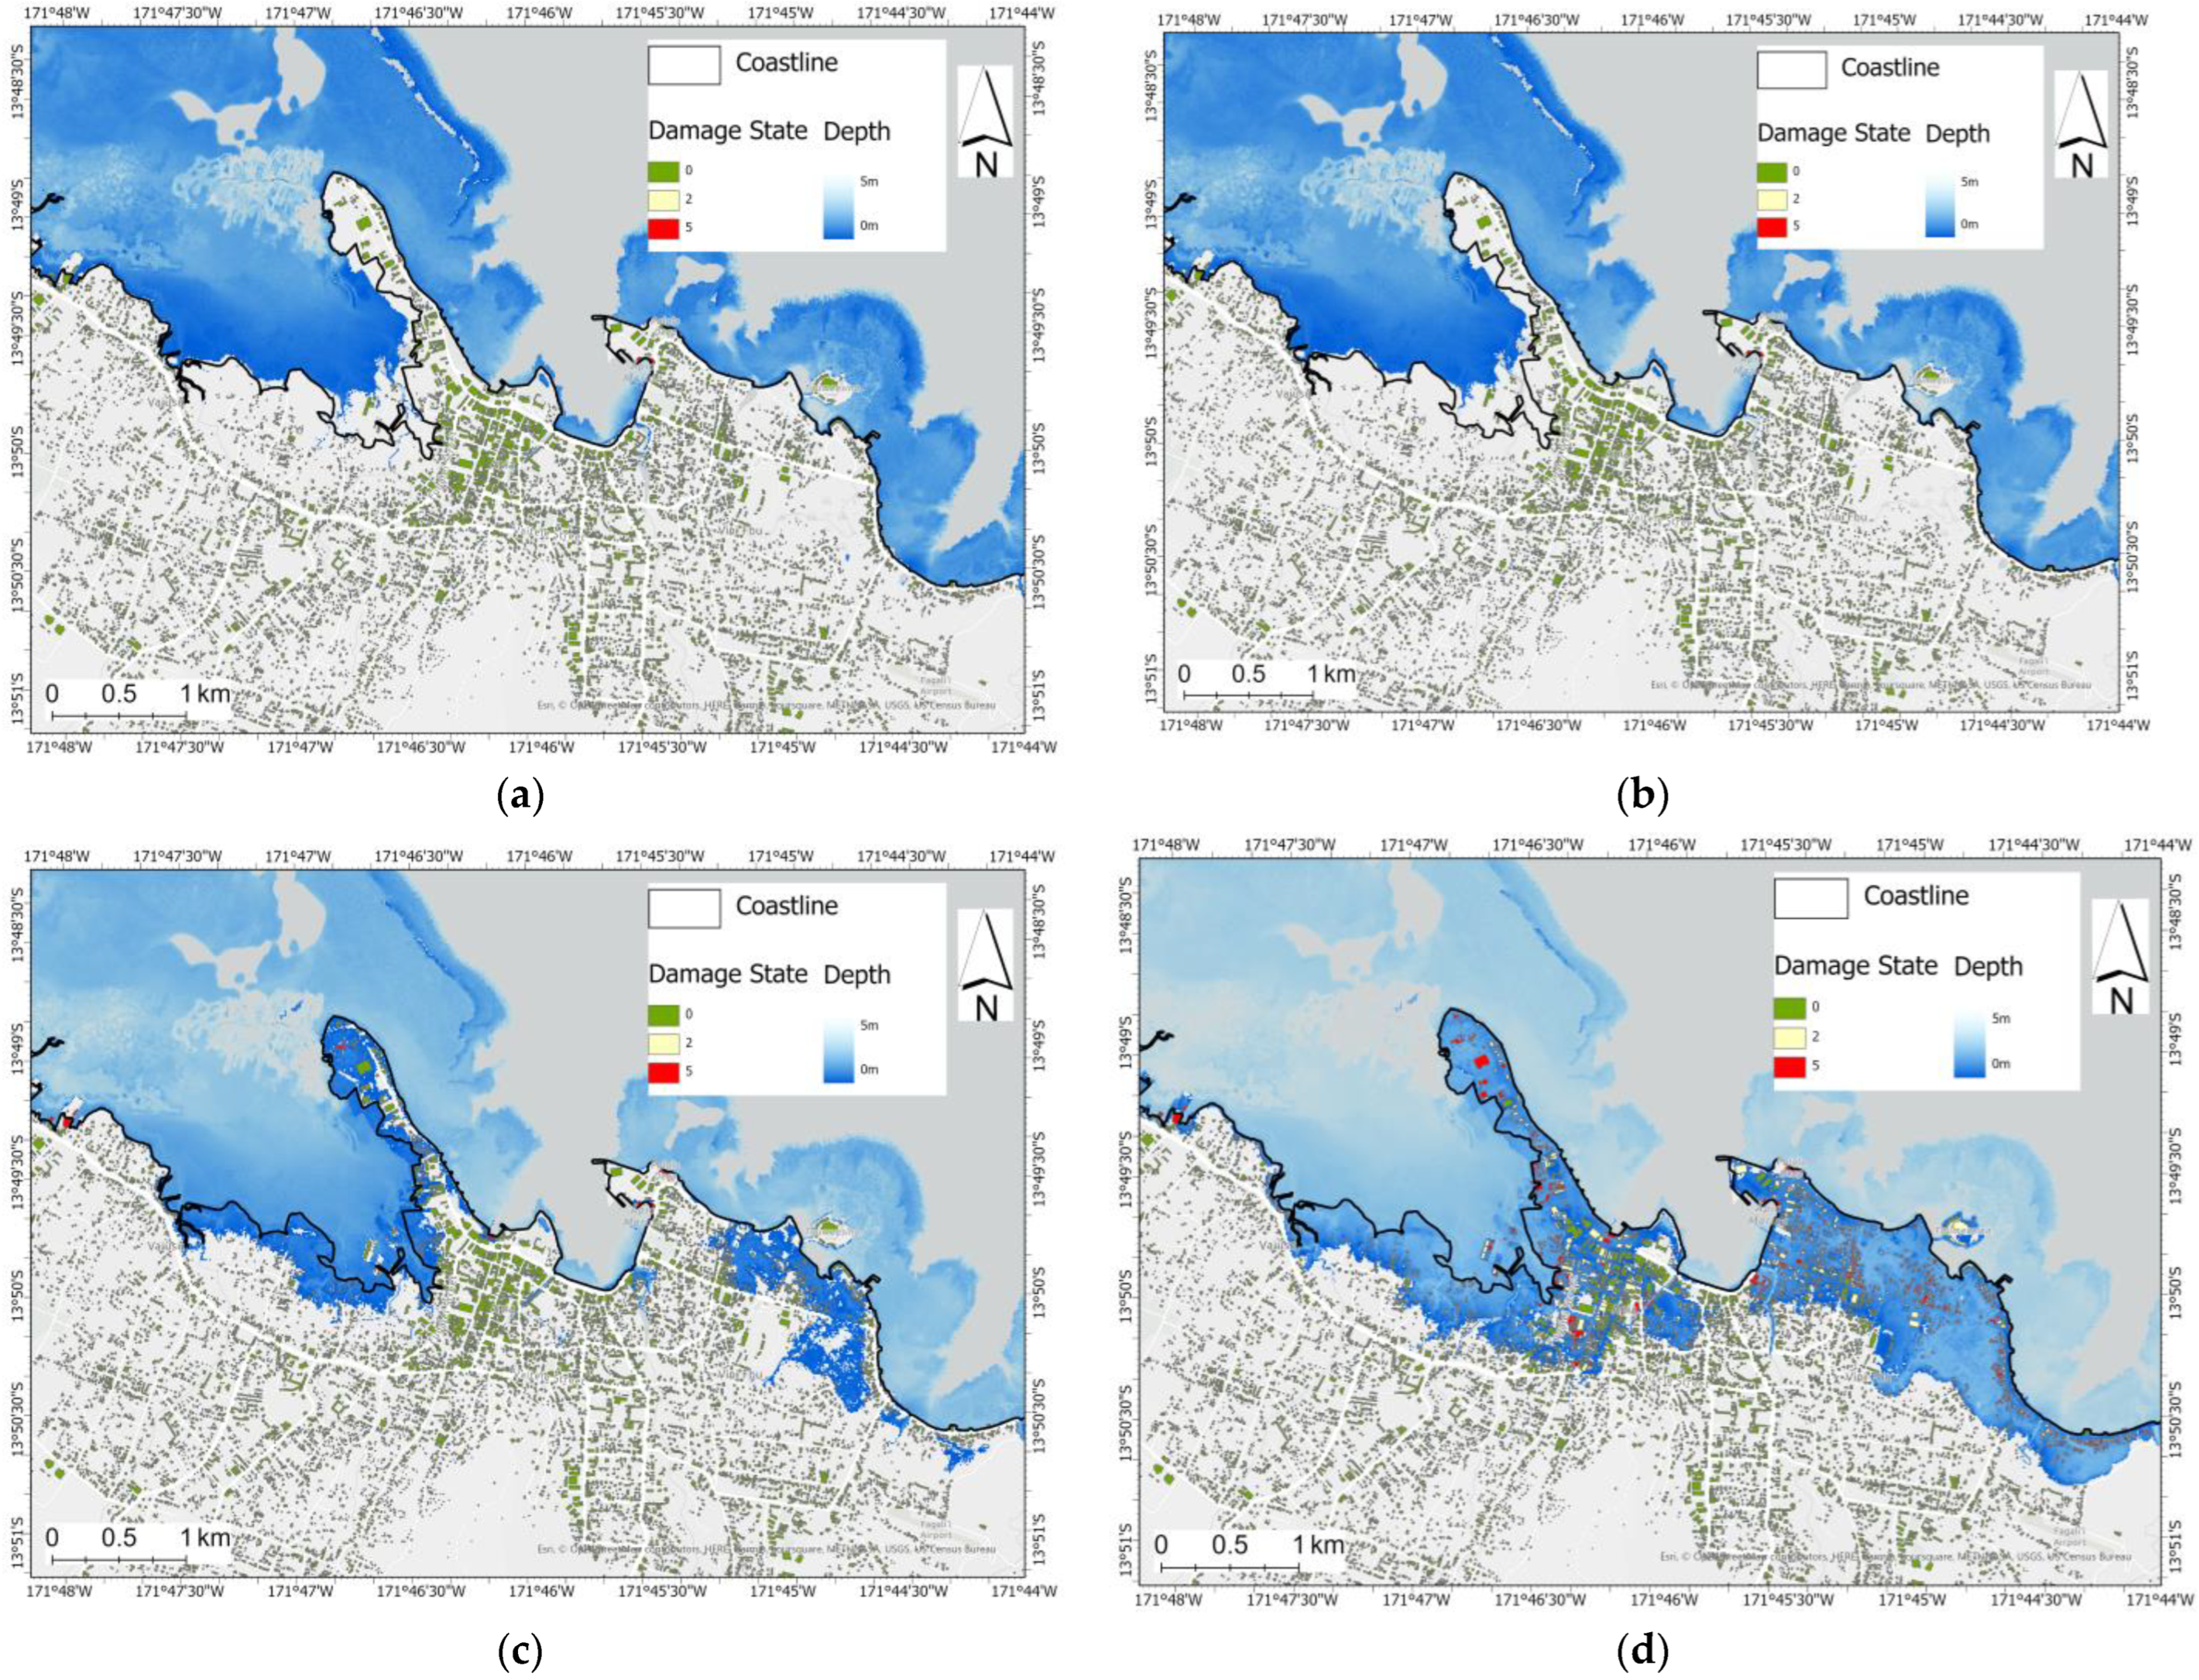
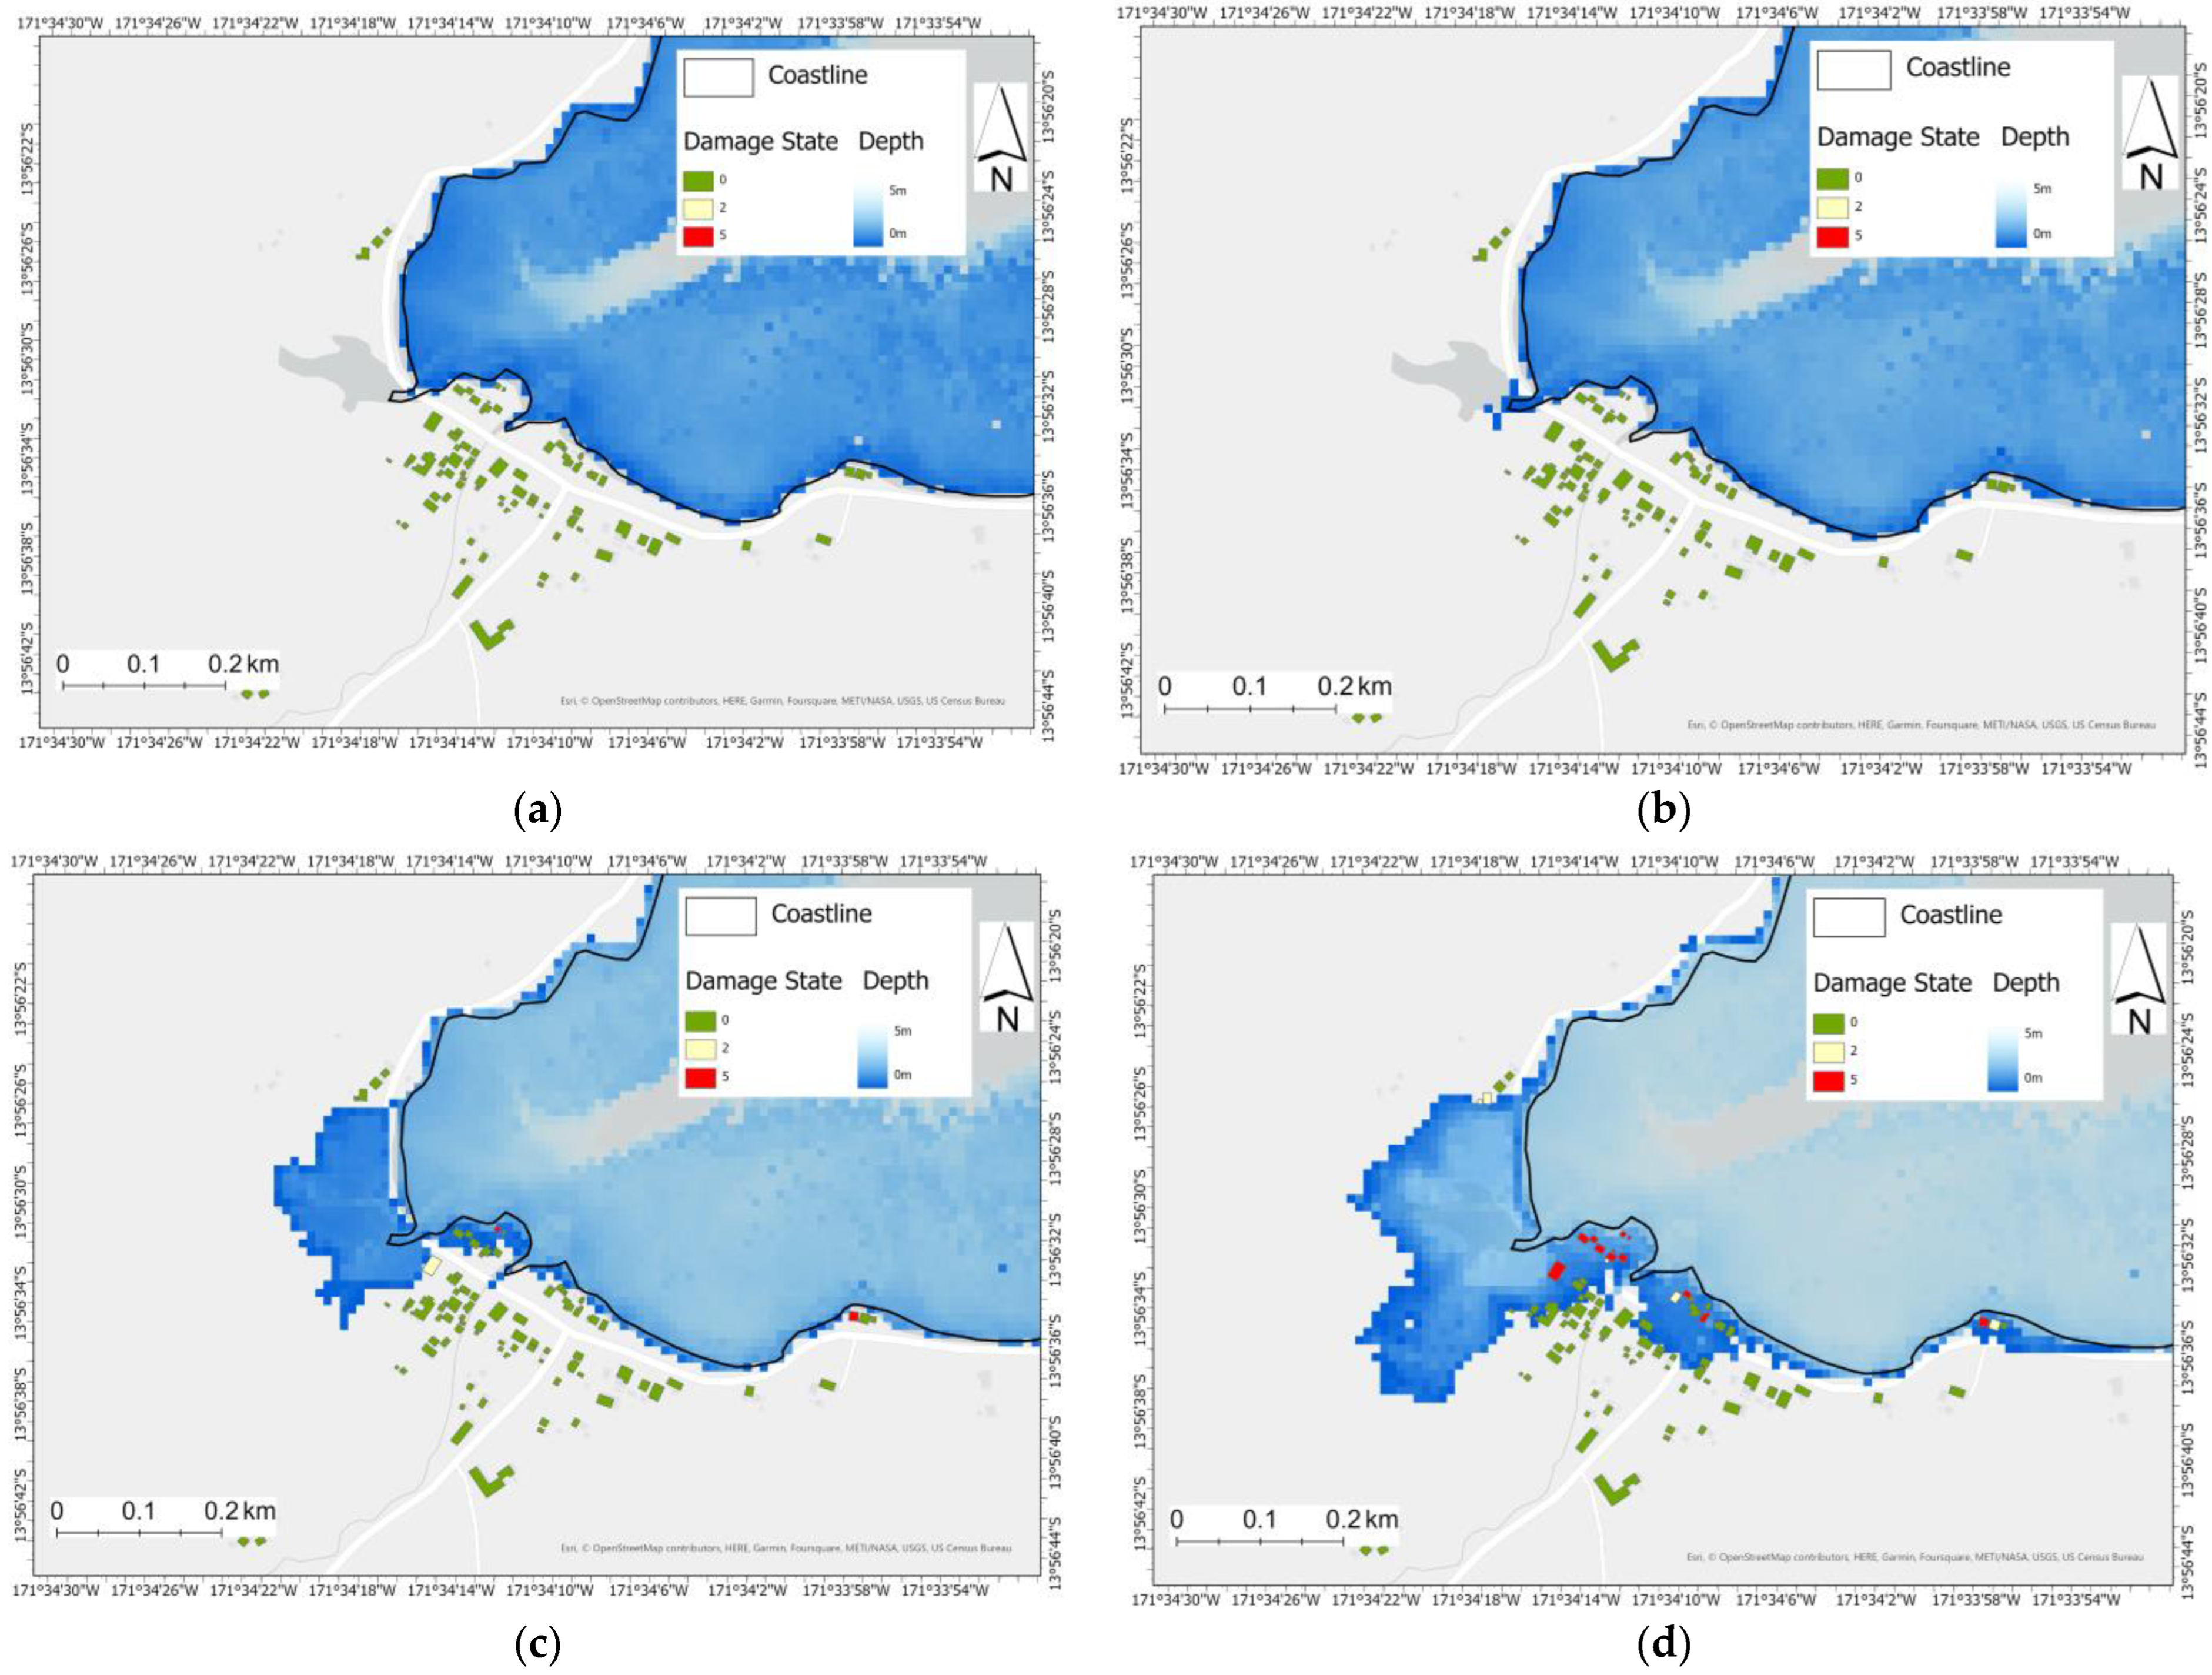
Additionally, more buildings become exposed to inundation as well as experience greater severity of tsunami damage impacts with increasing sea level rise, as evident in the higher probable damage states (
Figure 6 and
Figure 7). This is explained by the greater tsunami inundation extents and increases in flood depths above ground level at any given location within the inundation exposure zone under corresponding incremental SLR. This results in more buildings experiencing over a 50% probability of reaching or exceeding DS5, meaning they are likely to be completely destroyed or washed away. For example, the scenario in which the tsunami arrives at high tide with 2 m of SLR destroys 1142 buildings across the entire country compared with 250 buildings for the scenario with 1 m of SLR.
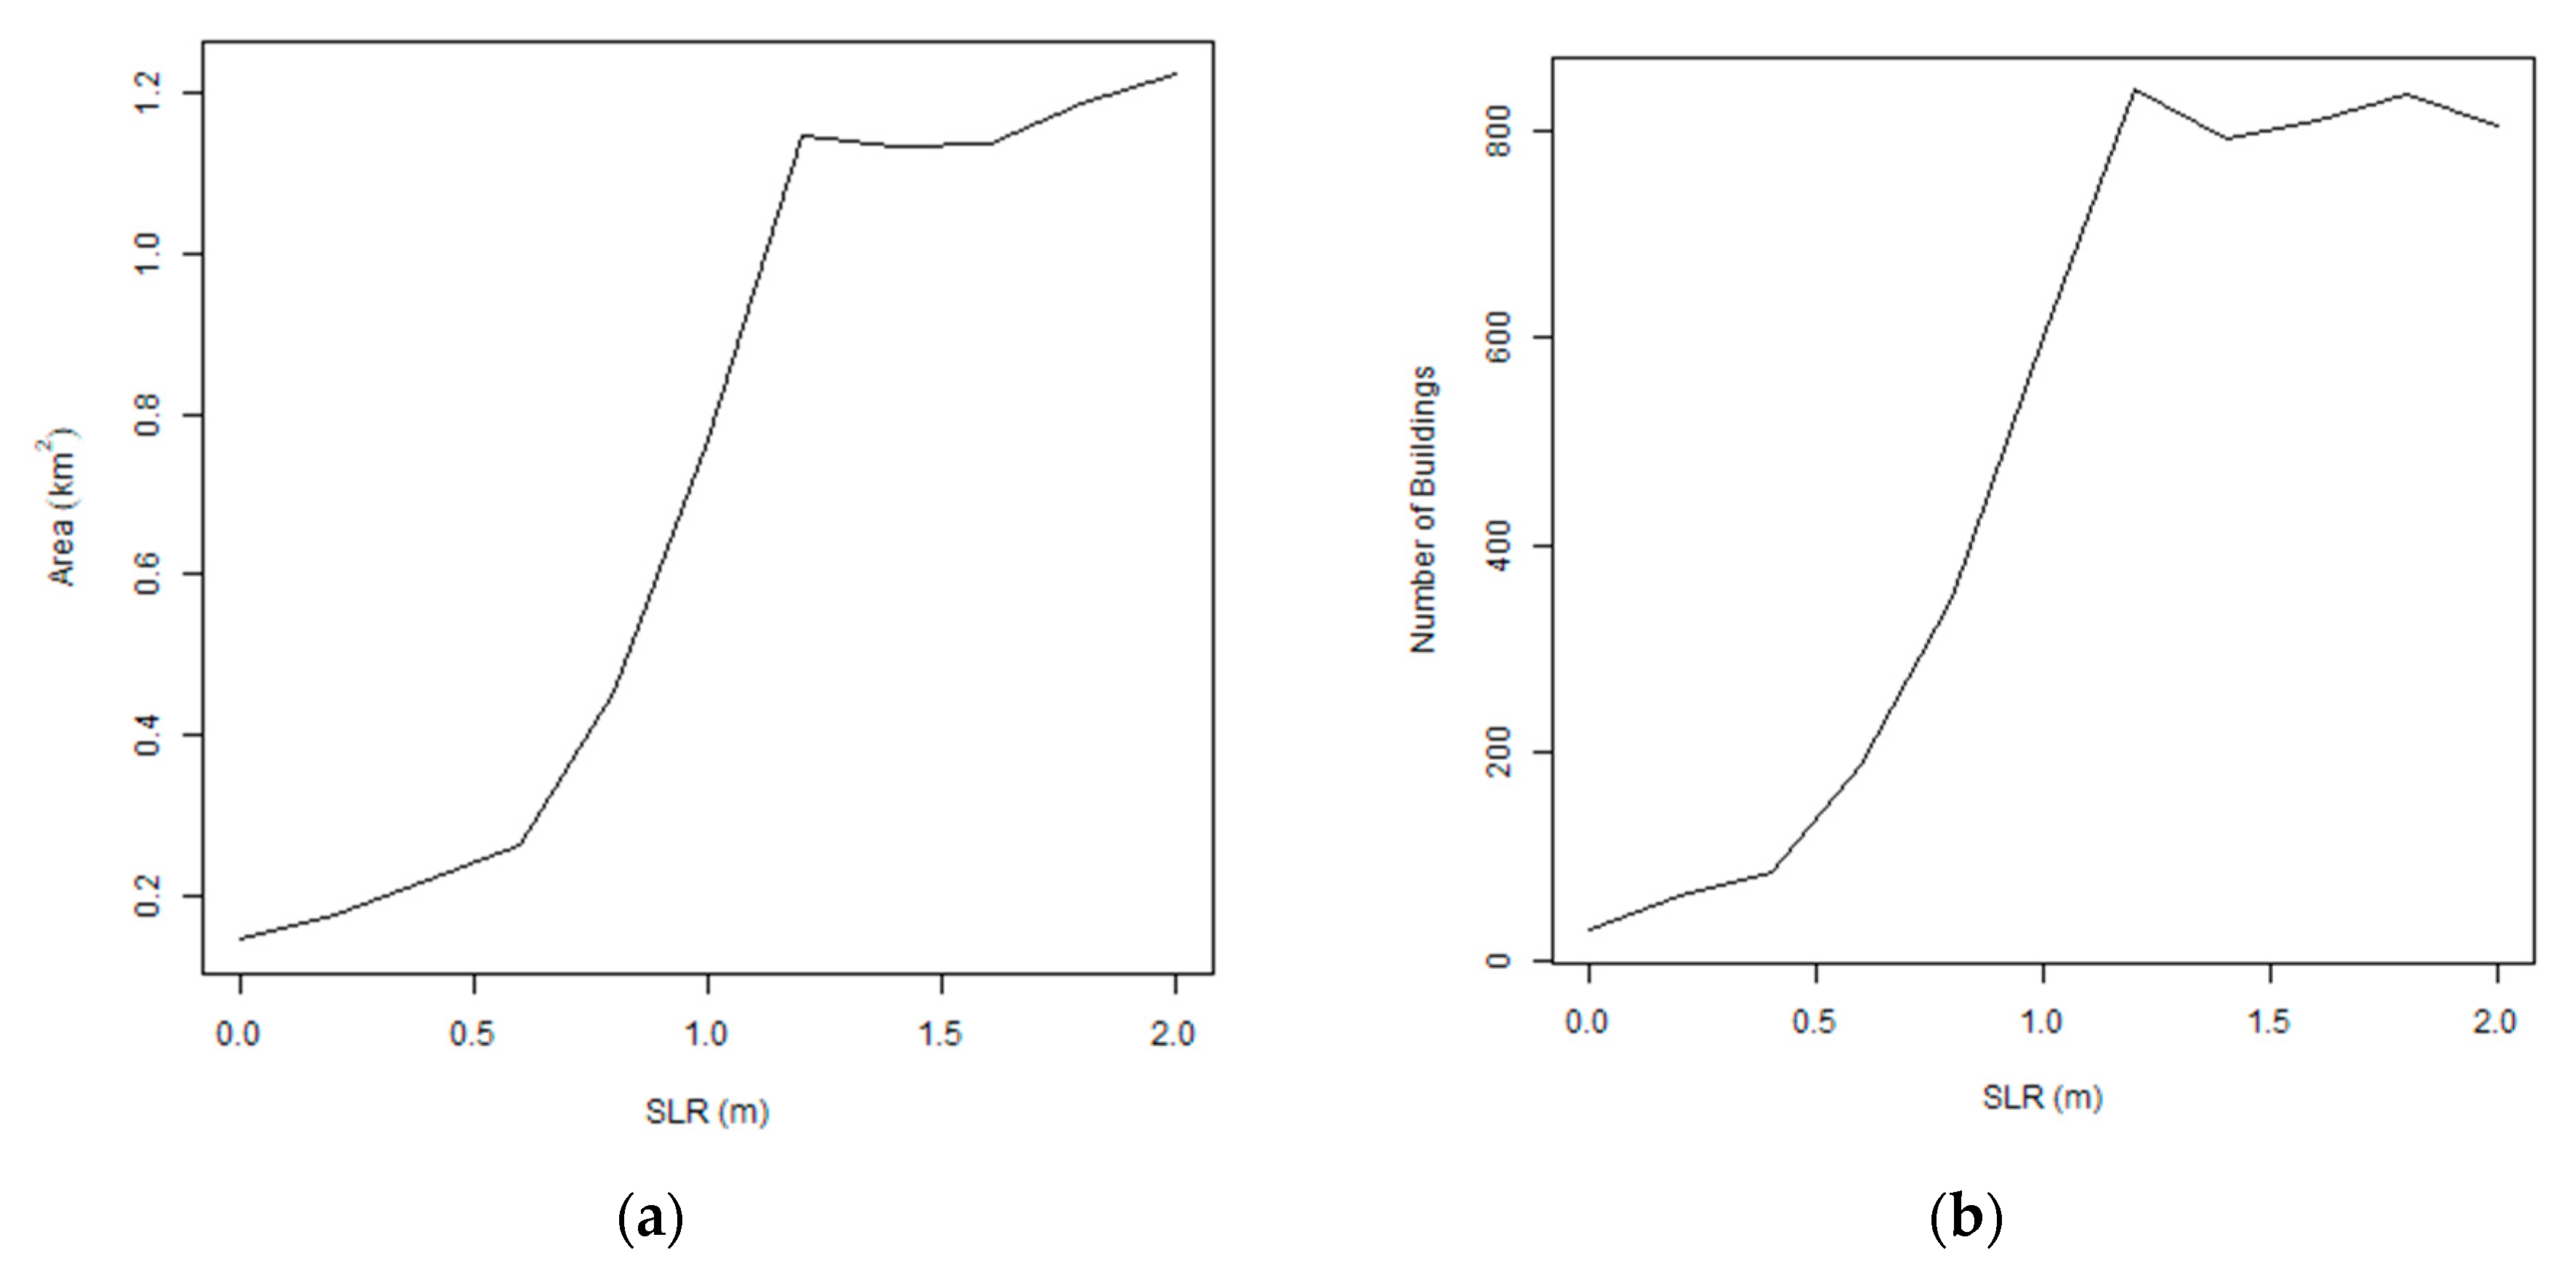
Importantly, many of the buildings inundated by this characteristic tsunami type under a 1 m SLR scenario are within the high tide inundation zone. This implies that buildings in these locations will be subjected to permanent flooding, whereby habitability will likely be compromised when the sea level reaches 1 m above its current level in future (e.g.,
Figure 8). The difference between the tsunami and permanent tide inundation extent increases dramatically after 0.6 m RSLR from 0.26 km
2 to 1.14 km
2 by 1.2 m RLSR (
Figure 9a). A similar trend is observed for tsunami-exposed buildings with the permanent tide inundation removed. That is, 189 buildings are exposed with 0.6 m RSLR, but 838 are exposed with 1.2 m RSLR (
Figure 9b). After 1.2 m RSLR, the combined tsunami and permanent tide inundation extent and number of exposed buildings becomes more even.
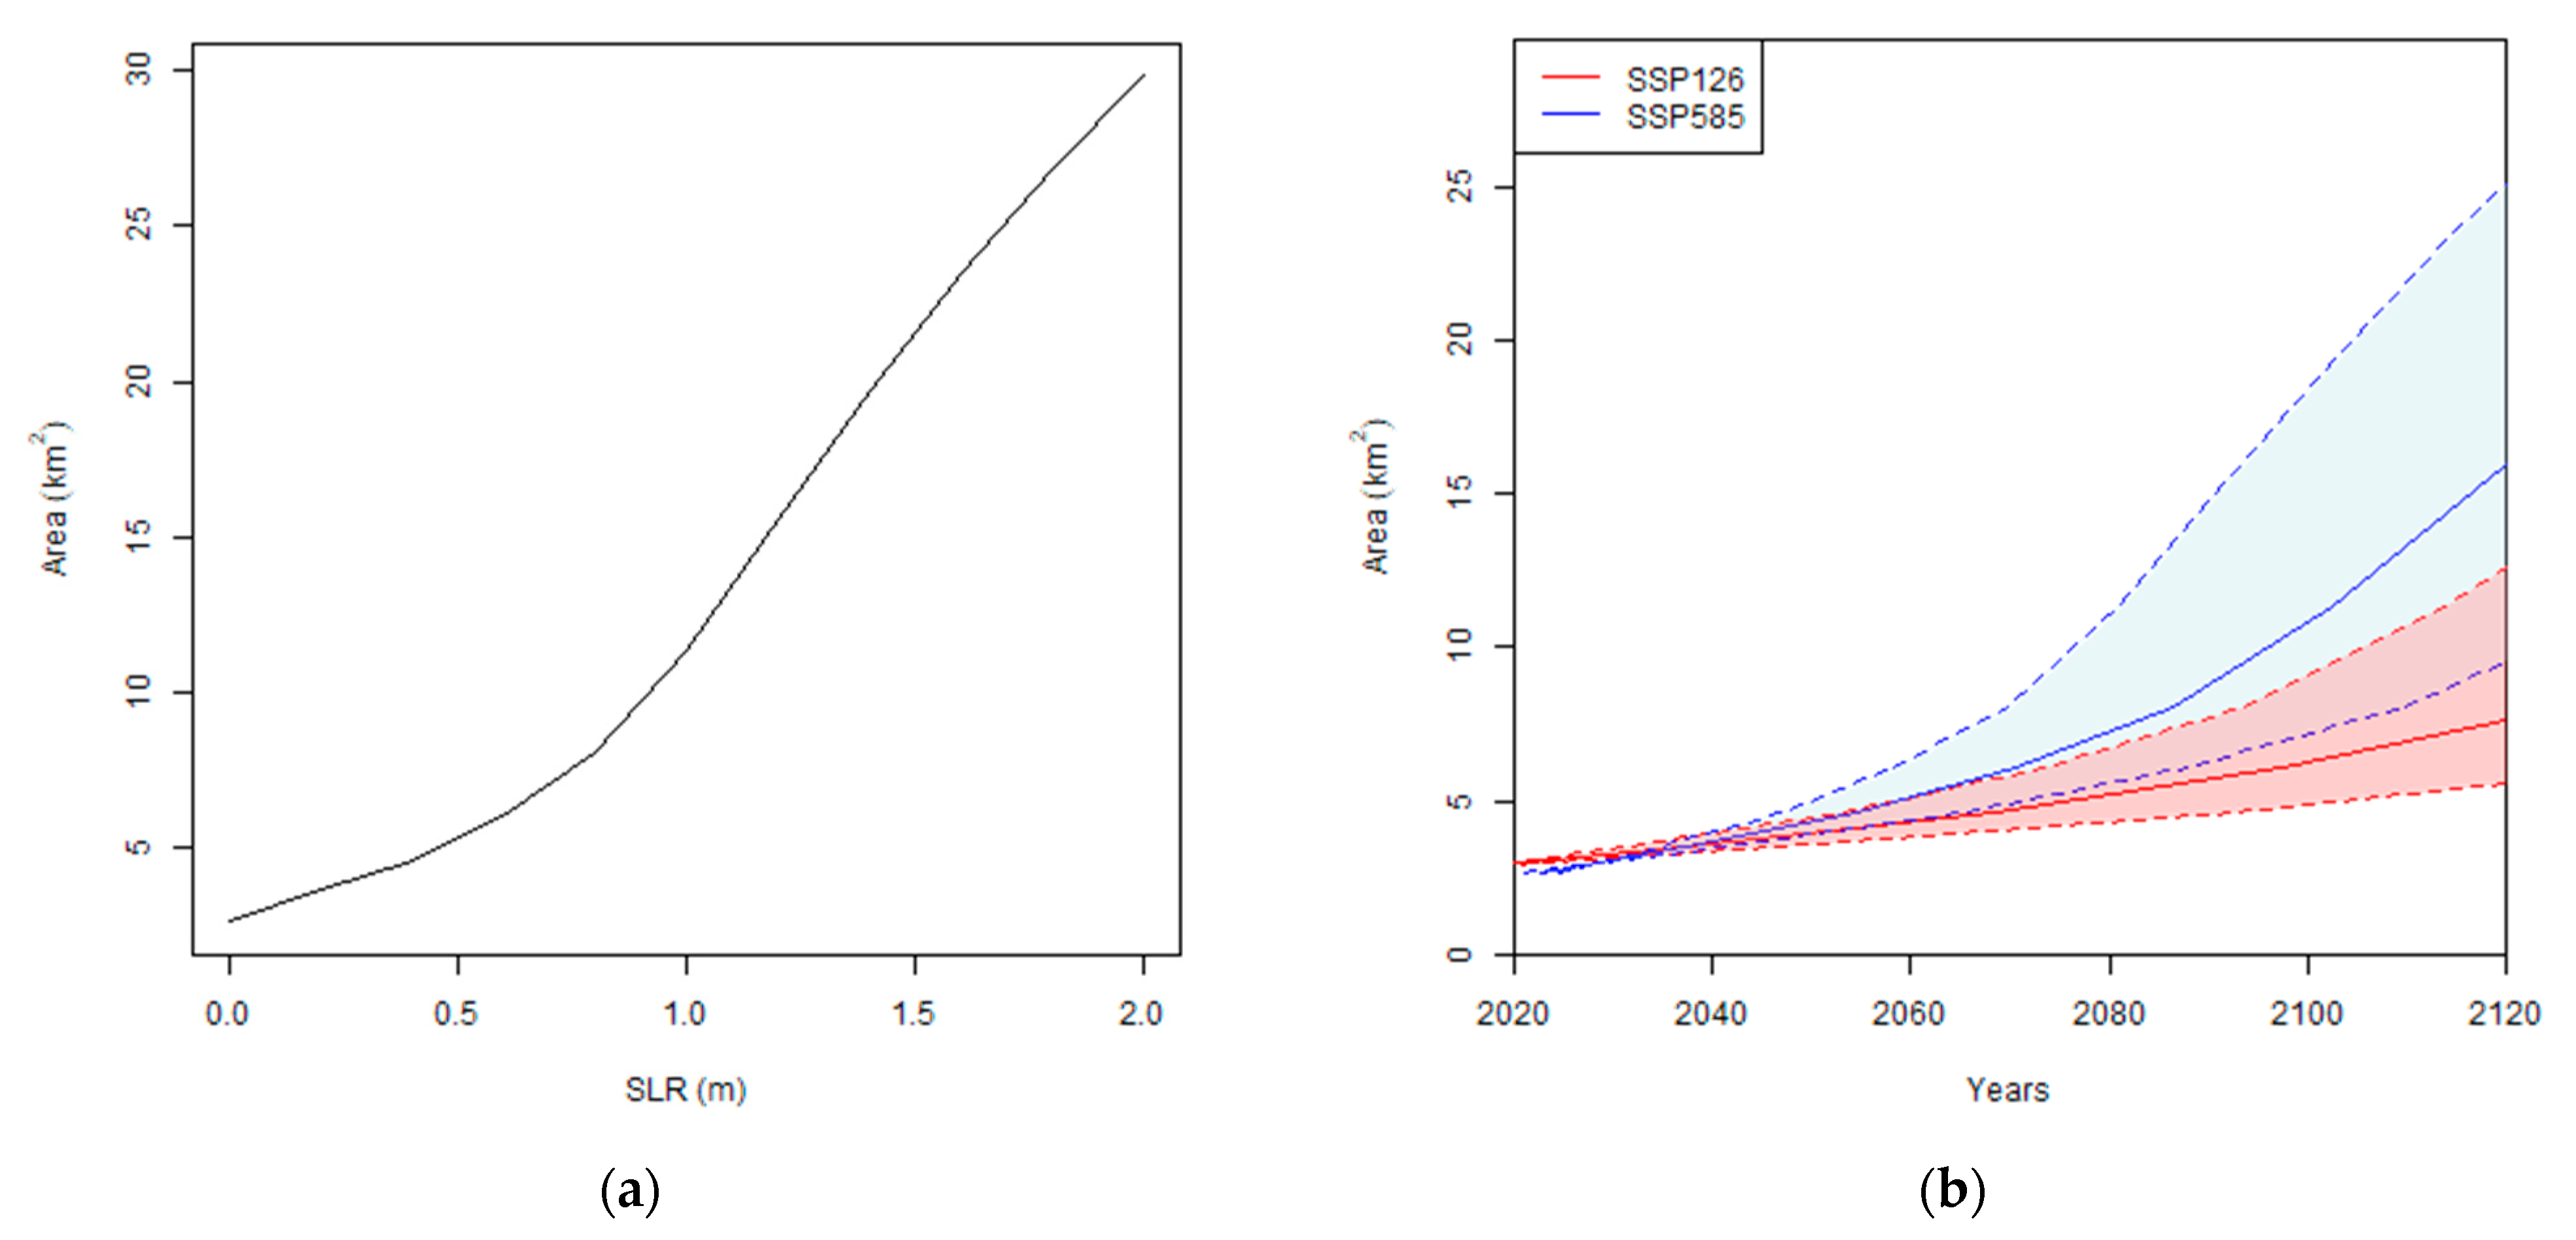
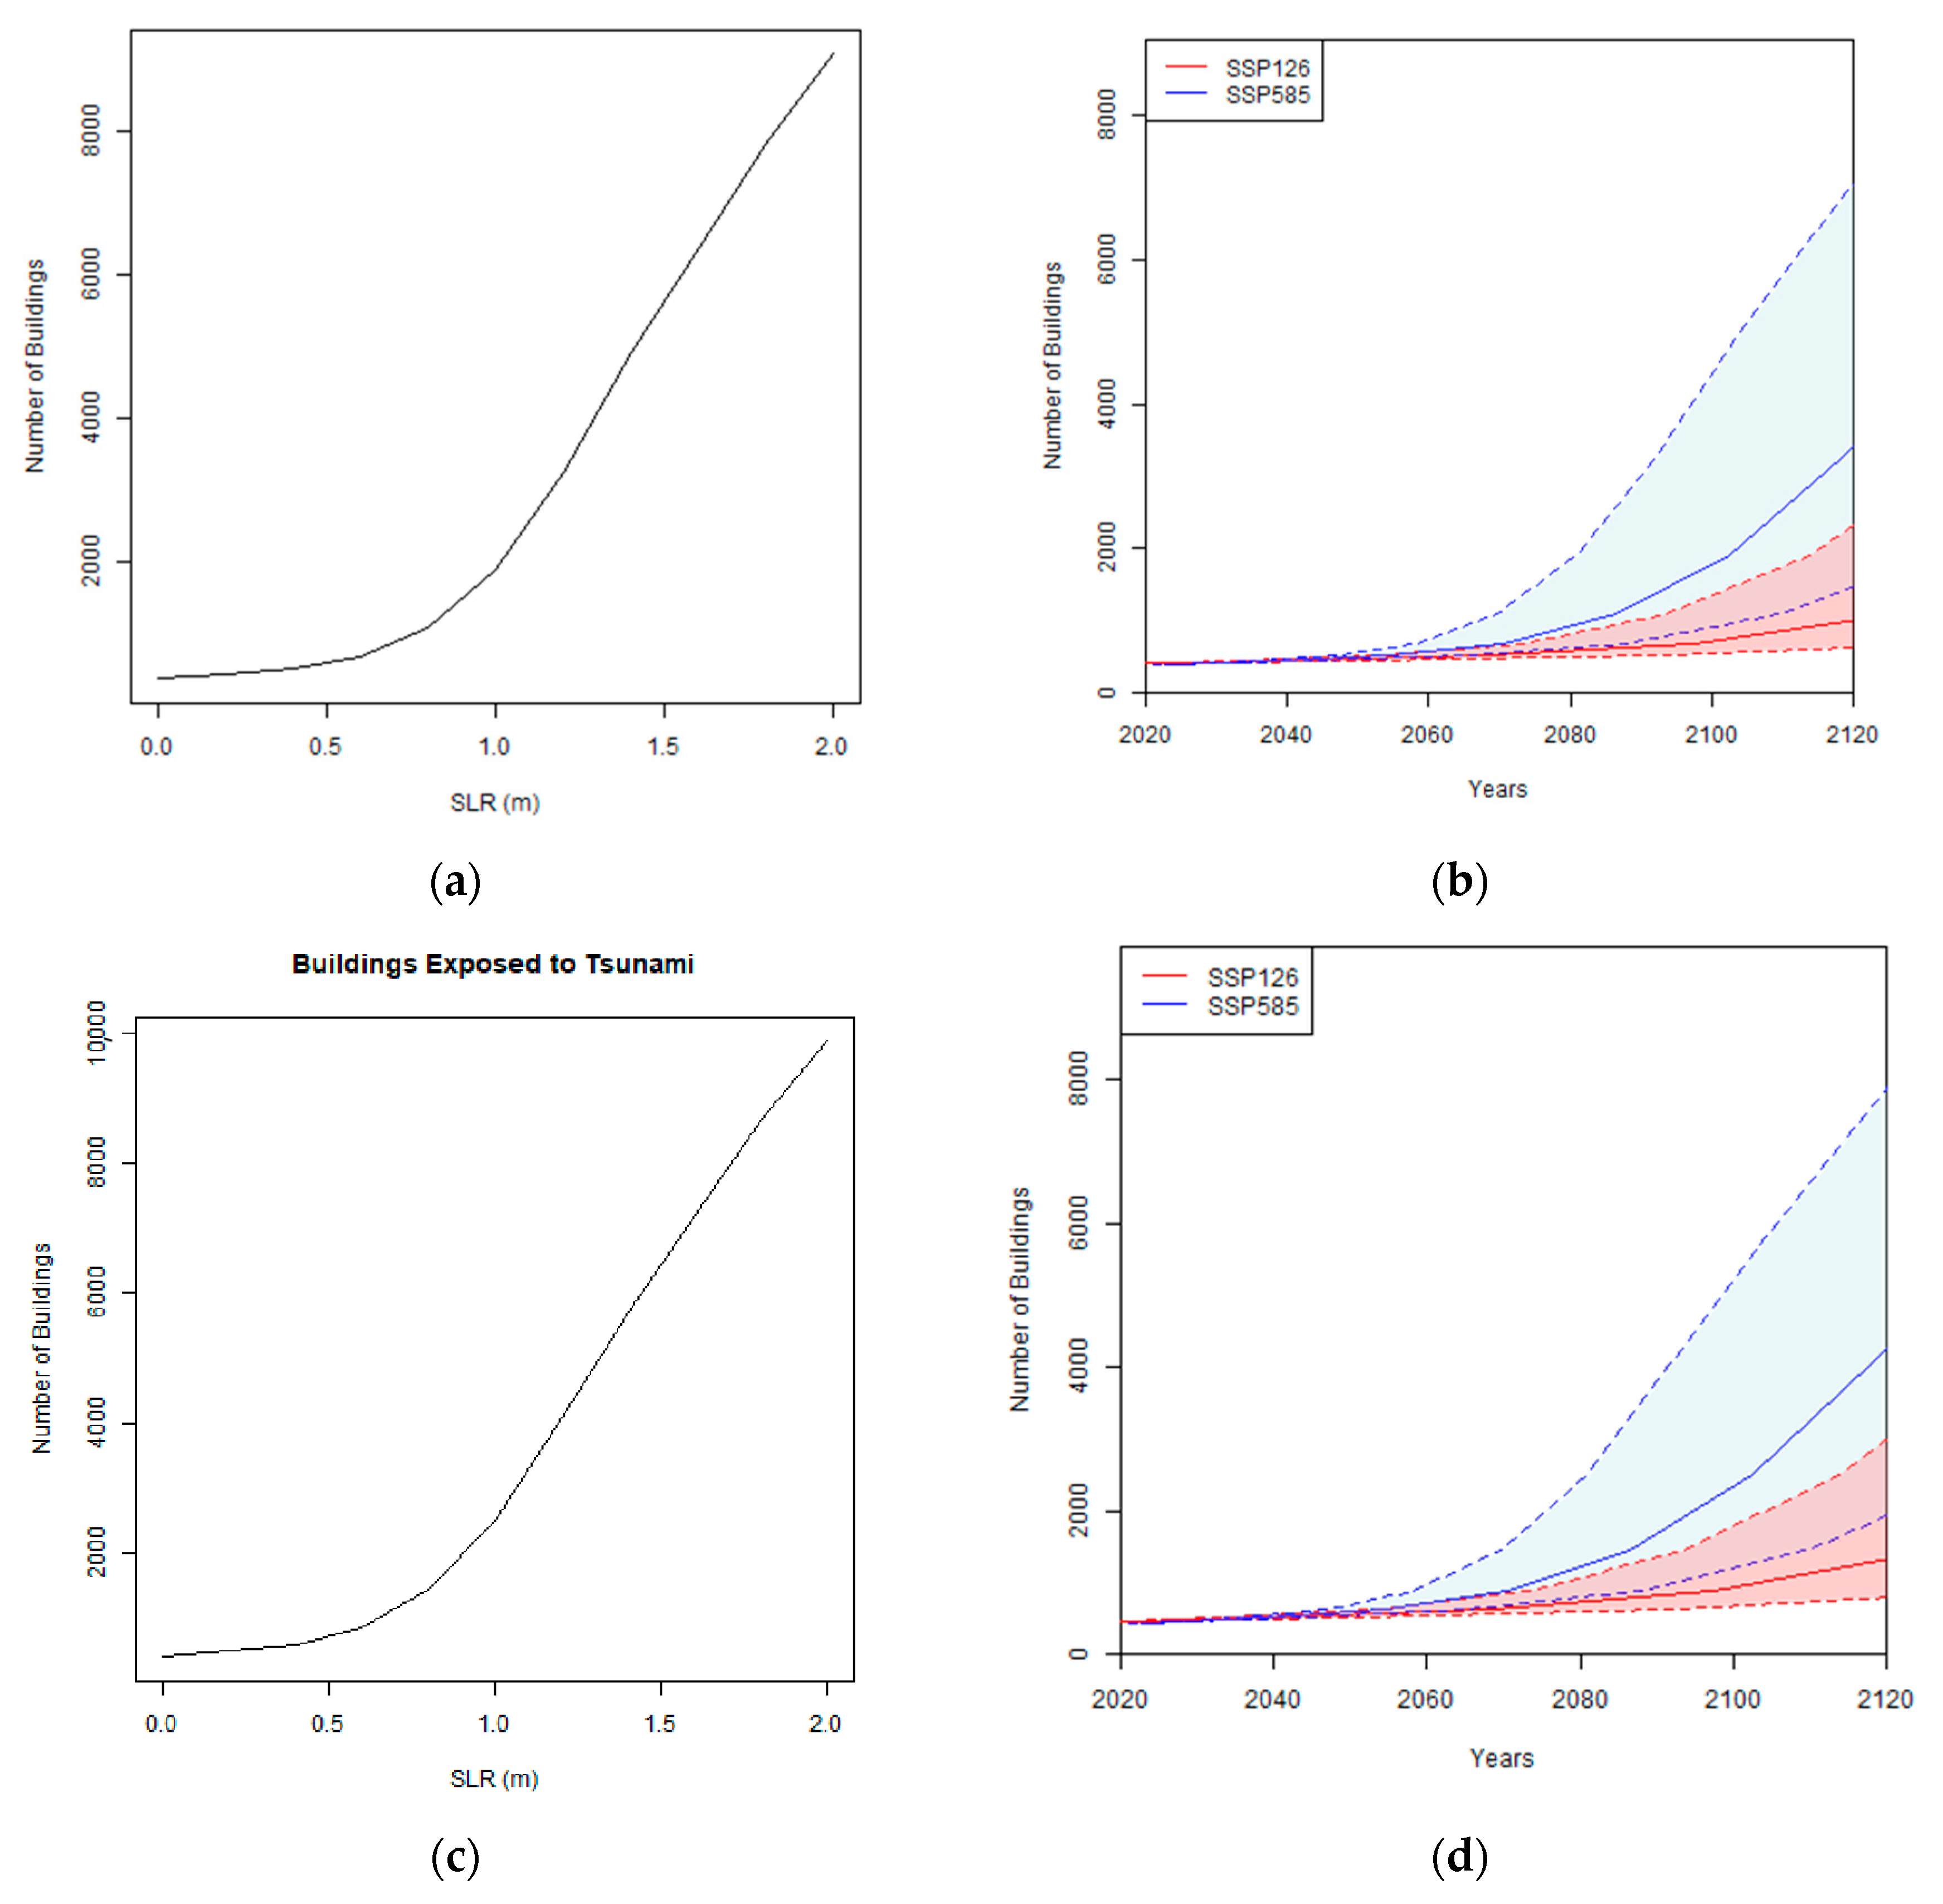
As demonstrated by
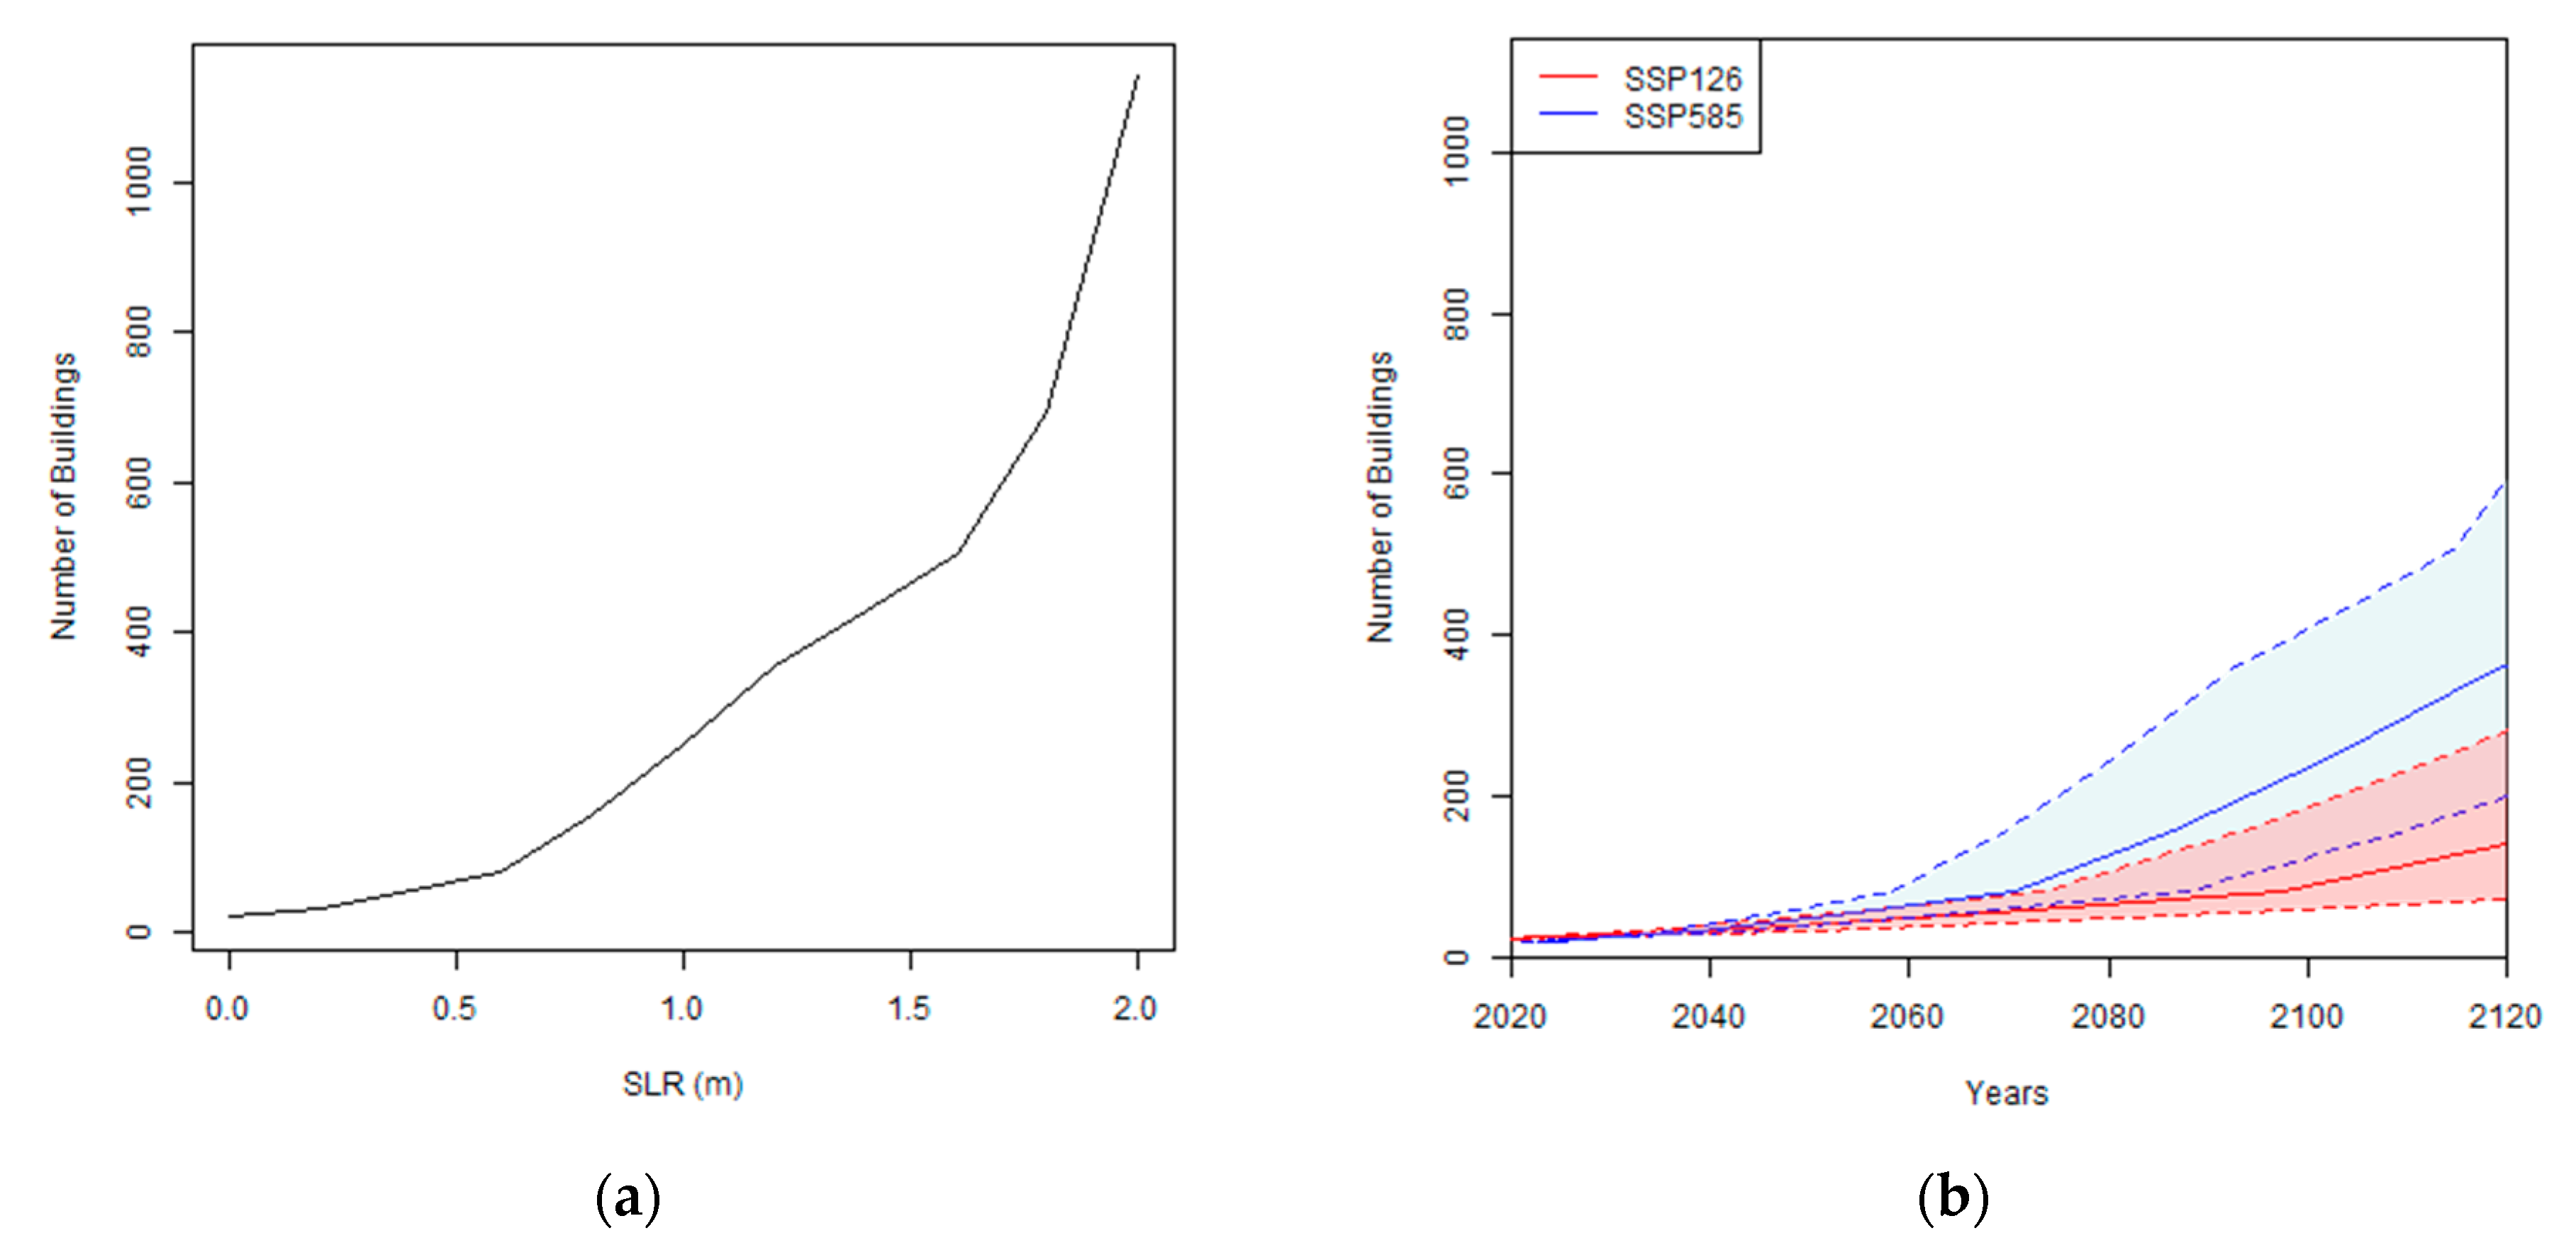
Figure 10, as the RSLR increases, so does the area that is exposed to the total inundation extent. From this these results clearly indicate that the number of buildings exposed is proportional to the inundation extent, i.e., increasing as RSLR increases (
Figure 11). The maximum number of buildings exposed to tide is 9056, which occurs with 2 m SLR, compared to 9860 exposed to the tsunami, a difference of 804. Based on the Intergovernmental Panel on Climate Change (IPCC) shared socioeconomic pathway (SSP) climate change scenarios, where SSP1-2.6 represents low greenhouse gas emission scenarios, and SSP5-8.5 represents continuing high emissions of greenhouse gases [
41], by the year 2100 the likely number of buildings exposed to the tide only could be as low as 529 (SSP1-2.6, quantile 17), or as high as 4916 (SSP5-8.5, quantile 83). Likewise, buildings exposed to the tsunami wave could be between 615 (SSP1-2.6, quantile 17) and 5707 (SSP5-8.5, quantile 83). With SSP1-2.6 (quantile 17), an extra 86 buildings are exposed to the tsunami; however, for SSP5-8.5 (quantile 83), an additional 791 buildings are exposed.
The number of buildings with an over 50% probability of reaching/exceeding DS5, which are likely to be fully destroyed or washed away, also increases significantly as RSLR increases (
Figure 12). By 2100, it is likely that the tsunami and tide combined could result in approx. 55 buildings (SSP1-2.6, quantile 17) to 430 buildings (SSP5-8.5, quantile 83) reaching/exceeding DS5.
5. Discussion
The 2011 Tōhoku-oki event represents one of the most destructive tsunamis to have occurred in the 21st century in terms of losses and damage, with far-field effects experienced in Fagaloa Bay, Samoa, approximately 7500 km southeast of the source. Whilst the impacts of tsunami inundation from this event in Samoa were minimal, the results of our study suggest that a similar far-field-type event occurring under a future SLR of 1 m and 2 m could impact up to 2082 and 9440 more buildings, respectively, compared with present-day exposure levels. When removing the buildings already exposed to permanent tide inundation, if a similar event were to occur with 1 m and 2 m of SLR, it is likely to expose 570 and 774 more buildings, respectively. These increases in exposure are explained by the greater tsunami inundation extents and corresponding flow depths above ground level under the incremental SLR scenarios assessed.
Based on sea level rise projections for Samoa under a high emission, low mitigation, shared socioeconomic pathway scenario (SSP5-8.5) with medium confidence at the 17th–83rd quantile, 0.5 m SLR is likely to be reached/exceeded in Samoa between the decades 2050–2080, 1 m SLR will likely be reached/exceeded by 2080–2130, and 2 m SLR will likely be reached/exceeded as early as 2130–2140 in a worst-case scenario [
41]. Furthermore, post-2009 South Pacific earthquake subsidence in Samoa is occurring at a particularly fast rate of 8–16 mm/year [
18], which exacerbates SLR and implies that a SLR of 1 m could be reached/exceeded earlier than current projections for these islands.
Interestingly, our results indicate that one of the greatest risks to buildings was the SLR itself rather than the characteristic far-field tsunami-type that we had assessed. While the modelled inundation extents combining permanent tide and tsunami consistently showed the tsunami extent being greater than the tide, the increase in sea level is what drives the extension of inundation further inland and subsequent increase in building exposure and damage. After approximately 0.6 m SLR, the tsunami and permanent tide extents start to diverge more significantly, with this divergence highest after 1 m (
Figure 11). This indicates that an approx. 1 m SLR threshold is where far-field tsunamis, such as the 2011 Tōhoku-oki-type event, may become more problematic. These observations are consistent with similar findings by Nagai et al. (2020) [
13], who showed that tsunami risk to life in the cities of Yokohama and Kawasaki in Japan become significantly affected once sea levels reach +1.0 m higher than at present.
While our results show compelling evidence for the effects of SLR on exacerbating far-field tsunami inundation risk throughout the 21st century in Samoa, one of the main problems with the modelling approach taken was the absence of Apia tide gauge data for validation of the event at the time of its occurrence in 2011. This was due to the Apia tide gauge being temporarily non-operational when the 2011 event occurred. Nevertheless, eyewitness accounts of inundation collected by the Samoa Disaster Management Office in Fagaloa Bay after the event provided a means to corroborate, in part, the modelled runup in this study. The consistent modelled-to-observed results of the 2011 event in Fagaloa Bay, along with modelling corroborations in [
32], aid in substantiating its usage as a characteristic-type far-field event in our incremental SLR scenario modelling.
Overall, our results indicate that far-field tsunami inundation in Samoa similar to a 2011 Tōhoku-oki-type event will be exacerbated throughout the 21st century with rising sea levels, posing significant coastal resilience challenges once sea levels reach/exceed +1.0 m. In contrast to high volcanic islands of the Pacific, such as Samoa, our findings have major implications for tsunami inundation risk in low-lying atolls which typically have summits of less than 5–10 m above sea level. These observations lead us to suggest that incorporating the effects of SLR in tsunami hazard risk modelling assessments in Pacific Island environments should be considered for use in longer-term coastal resilience and adaptation planning.
Notwithstanding the focus of this study, the findings imply that SLR will compound the impacts of near-field tsunamis which presently expose large quantities of assets (e.g., [
36,
42,
43]) and can cause destructive damages and losses (e.g., [
36,
38]). Similar inferences could be made for high-frequency, low-magnitude, coastal inundation hazards, such as king tides and cyclone-related storm surges (e.g., [
44]), whereby RSLR may compound present day exposure and impact levels across the Pacific.
6. Conclusions
This study set out to assess the effects that rising sea level may have on far-field tsunami inundation exposure and impacts to buildings in a Pacific Island context. Using a characteristic 2011 Tōhoku-oki-type far-field tsunami scenario in Samoa, we show that incremental SLR over the 21st century results in greater tsunami inundation extents and corresponding flood depths above ground level. In turn, this exposes more buildings to more severe damage with each progressive rise in SLR, with tsunami impacts becoming significant once SLR reaches/exceeds +1.0 m. Based on a high-emissions, low-mitigation SSP5-8.5 SLR scenario for Samoa, it is likely that this threshold will be reached by the decades 2080–2130. This timing could be sooner depending on whether the current rates of rapid land subsidence in Samoa continue, relative to any potential increases in the current rate of SLR in the coming decades for this region under low mitigation scenarios. Overall, our findings have planning implications for similar environmental settings in the Pacific and point towards a need to incorporate the effects of SLR in future tsunami inundation risk assessments.

 ,
, 


