Article

Estimating Stock Status and Biological Reference Points of the Sardine Fishery Using the Surplus Production Model from the Bay of Bengal, Bangladesh

by
Rokeya Sultana
1,2,
Qun Liu
1,*,
Md. Abdullah Al-Mamun
1,3,
Partho Protim Barman
4,
Md. Mostafa Shamsuzzaman
4 and
Suman Barua
1,3
1
College of Fisheries, Ocean University of China, Qingdao 266003, China
2
Directorate of Secondary and Higher Education, Ministry of Education, Dhaka 1000, Bangladesh
3
Department of Fisheries, Ministry of Fisheries & Livestock, Dhaka 1000, Bangladesh
4
Department of Coastal and Marine Fisheries, Sylhet Agricultural University, Sylhet 3100, Bangladesh
*
Author to whom correspondence should be addressed.
J. Mar. Sci. Eng. 2023, 11(5), 944; https://doi.org/10.3390/jmse11050944
Submission received: 10 April 2023 / Revised: 24 April 2023 / Accepted: 26 April 2023 / Published: 28 April 2023
(This article belongs to the Section Marine Biology)

Abstract

:
This research examined the biological reference points (BRPs) and stock status of the sardine fishery in the Bay of Bengal (BoB), Bangladesh, to determine the sustainability of this resource. The Monte Carlo method (CMSY), the Bayesian state-space Schaefer surplus production model (BSM), and the ASPIC (a Stock Production Model Incorporating Covariates) software suite, were used to analyze catch–effort data obtained from the Yearbook of Fisheries Statistics of Bangladesh. All models derived maximum sustainable yields (MSY) ranging from 37,900 to 41,280 t, which is quite near to the catch from the latest year (38,051 t in 2020), indicating the fully exploited status of sardines. The estimated B < BMSY and F > FMSY values from the BSM and Schaefer models indicate a poor biomass and an unsafe fishing status. For Schaefer and BSM, the calculated F/FMSY values were 1.07 and 1.06, and the B/BMSY values were 0.92 and 0.75, which also indicate the overexploited status of the sardine fishery in the BoB, Bangladesh. This information will aid in developing management strategies and conservation policies for the sustainability and rebuilding of this commercially important resource in the BoB on the Bangladesh coast.

1. Introduction

One-third of the world’s assessed fisheries are overfished [1] and nearly half of harvesting fish stocks in Asia have been overexploited or have collapsed [2]. Fisheries management aims to find the best balance between ecological conservation, economic yield, and social considerations for marine living resources. For this goal, it is important to assess a stock’s current condition and potential for exploitation with the help of biological and economic reference points [3]. Most commercially harvested fish stocks worldwide lack an accurate stock assessment due to a shortage of data for assessing the stock status and fishing mortality [4,5]. However, fish stock assessment is a difficult task for fisheries because of the enough data that is currently available and, according to the scarce available data, it is possible that only 12% of the world’s fisheries are currently managed [6,7,8].
Herring, anchovies, and sardines (HAS) are a group of forage species. HAS are expected to produce 15.2 million tons of fish annually, or 18.6% of the world’s total marine fisheries productivity [1,8]. Sardines are pelagic and comprise one of the major clupeid groups of commercial fishery targets in terms of biomass harvested from Bangladesh’s coastal water. Fifteen species of Sardine are found in the Indo-Pacific region; however, sixty-one sardine species have been reported globally [8,9,10]. In addition, seven different sardine species have been reported in the Bay of Bengal, Bangladesh coast, where five species are under the genus Sardinella and two are from Dussumieria [11,12]. These fishery groups make up an average of 5.12% of Bangladesh’s overall marine production, with 97% coming from commercial fishing and only 3% from artisanal fishing [13].
Data-limited fisheries, often known as fisheries with only catch and/or length frequency (LFQ) data, call for a certain set of models [14]. In the BoB, Bangladesh coastal waters, where only catch–effort data are available, sardine resources fall under the category of data-limited fisheries. Data-limited techniques have recently been created in response to the current issue, e.g., CMSY [15]. The current study analyzed 10-year-long catch and effort (CE) data from the commercial sardine fishery of the BoB, Bangladesh using two non-equilibrium SPMs. The SPMs, also known as biomass dynamics models, are frequently used to evaluate the MSY, which is one of the most commonly utilized biological reference points (BRPs), as a target for fisheries management [16,17]. Additionally, there are other modern methods, such as the Monte Carlo approach (CMSY) [15], for calculating MSY and BPRs in fisheries with limited data. The CMSY is more effective at evaluating BRPs than other methods and is especially useful for developing countries with little or no data on effort [15,17]. Attempts were made to determine the MSY and associated BRPs using catch statistics and supplemental data, using the CMSY approach and ASPIC software package [15,16].
From Bangladesh’s standpoint, there are few, poor, or perhaps no commercial fisheries statistics for many species. Thus, the creation of a Marine Protected Area (MPA), mesh size limitations, and the closure of spawning grounds, were the main focuses of Bangladesh’s marine fisheries management [17]. MPAs are a popular concept and may be an ultimate solution to the conservation and sustainable utilization of fishery resources. As in other parts of the world, Bangladesh should also seriously consider and implement this management option. Since Bangladesh has a small data collection of sardines, the stock status and total allowable catch (TAC) cannot be realized. No studies have yet been performed on the stock status and MSY of this fisheries resource using the latest commercial catch data in the Bay of Bengal (BoB) Bangladesh water.
The objective of this study was to estimate the BRPs and assess the stock status of sardine fishery, using CMSY and ASPIC approaches, for the sustainable management and conservation of this fishery resource in the coastal water of Bangladesh.

2. Materials and Methods
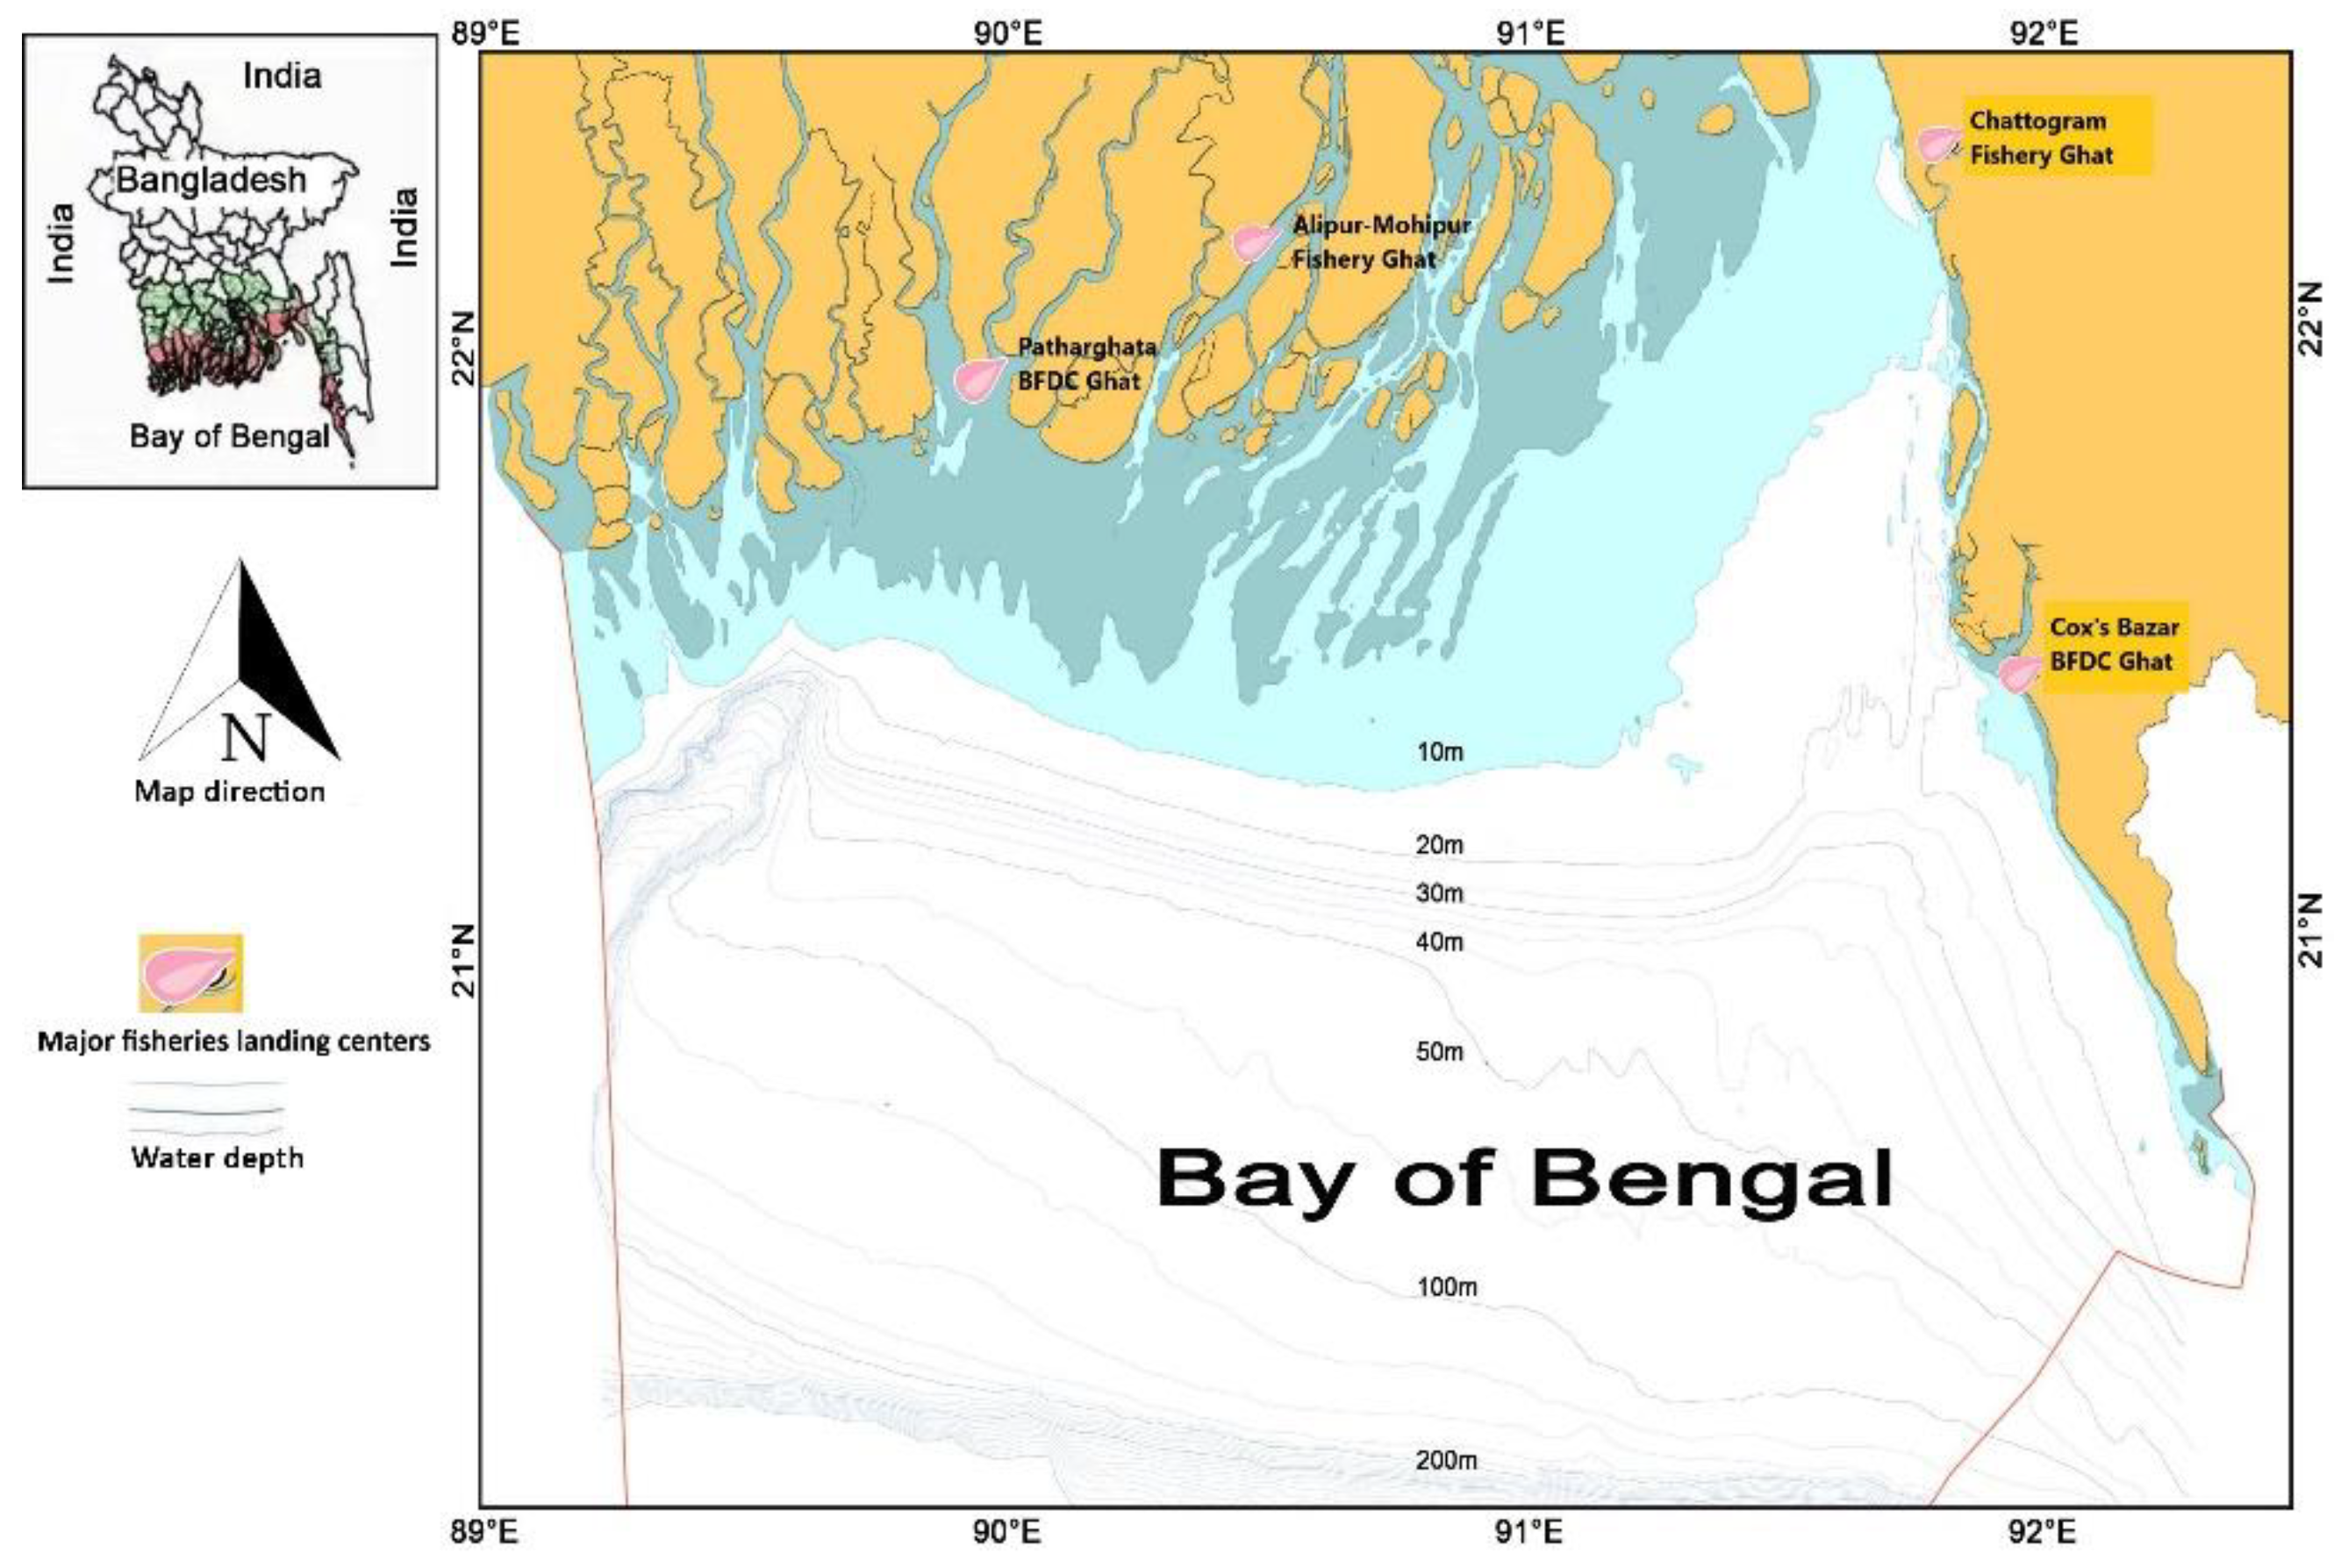
2.1. Data Sources

The Bay of Bengal (BoB) is roughly located between latitudes 5° and 22° N and longitudes 80° and 90° E, and is bordered by Sri Lanka, India, Bangladesh, Myanmar and the northern part of the Malay Peninsula. The coastal area of Bangladesh is located in the northern part of the BoB (Figure 1). The commercial fisheries sector of Bangladesh is broadly categorized as an artisanal and industrial fishery. The artisanal mechanized fishing boats have marine diesel engines with 20–75 horsepower (HP), while industrial trawlers are normally 20–40 m long and have marine diesel engines with 350–1450 horsepower (HP).
The sardine fishery was studied using ten years’ (2011–2020) worth of time series catch–effort (CE) data in the BoB (Figure 2). The CE data of the commercial fisheries were collected from the Yearbook of Fisheries Statistics of Bangladesh, published by the Department of Fisheries, Ministry of Fisheries and Livestock, Government of the People’s Republic of Bangladesh. Sardines were mostly caught with trawl nets, gill nets, and Set Bag Nets (SBNs) in the industrial and artisanal sectors of the BoB. Typically, the fish trawl nets’ minimum code end mesh size was 60 mm. However, for the SBNs it was 45 mm, while for the gill nets (small mesh drift net) it was 100 mm [13]. The catch statistics were considered in tons (t), and the CPUE (catch per unit of effort) was figured in tons per gear per year (t/g/yr).
The CE data were analyzed using the R codes (CMSY_2019_9f.R), and were downloaded from https://oceanrep.geomar.de/33076/ (accessed on 10 June 2022) [18]. The Markov chain Monte Carlo method was employed during CMSY analysis on probability distributions using the JAGS program [19]. In addition, two non-equilibrium SPMs (Surplus Production Models) were also run using the ASPIC software to evaluate the BRPs [16].

2.2. CMSY and BSM Model

The CMSY and BSM methods were applied to estimate the important biological reference points (BRPs) of MSY, B/BMSY, and F/FMSY, using time series data on catch, CPUE, and resilience. While, for the productivity estimation, the catch and abundance information is required by the traditional surplus production models (such as the Fox and Schaefer model) [20,21], the CMSY can forecast biomass using data on catch and productivity [15]. The BSM that makes use of catch and CPUE data was also incorporated [22,23].
In the present study, the fish population dynamics are described below:
B t + 1 = B t + r 1 - B t k B t - C t
In the year (t + 1) the exploited biomass was  B t + 1 , the existing biomass and catch in year t was respectively  B t  and  C t . k is carrying capacity, and r is intrinsic population growth rate. When biomass fell below 1/4 k and stock sizes were severely depleted, the following equation was used:
B t + 1 = B t + 4 B t k r 1 - B t k B t - C t | B t k < 0.25
The resilience value for sardines was “high”. Therefore, the prior range for r of 0.6–1.5 (Table 1) was used for sardines as the input prior [24]. Three assumptions were used to determine the prior range of k: firstly, the size of the unexploited stock (k) is greater than the time series’ largest catch. Secondly, the productivity of the stock determines the maximum sustainable catch stated as a fraction of the available biomass (Fmsy). Thirdly, the maximum catch will make up a higher percentage of k in considerably depleted stocks as opposed to moderately depleted ones. The probabilistic biomass ranges (Table 2) automatically estimate the relative biomass at the beginning and end of the time series data based on the anticipated level of depletion.
The carrying capacity ranges were calculated using the species’ maximum catch and resilience in Equations (3) and (4):
k l o w = max ( C a t c h ) r h i g h ; k h i g h = 4 max ( C a t c h ) r l o w
k l o w = 2 max ( C a t c h ) r h i g h ; k h i g h = 12 max ( C a t c h ) r l o w
where the lower and upper bounds of k are denoted by  k l o w  and  k h i g h . At the end of the given time series dataset, Equation (3) accounts for the stocks with low prior biomass, whereas Equation (4) is used for the stocks with high prior biomass. In addition, the data were smoothed using a three-year moving average to lessen the impact of severe captures [15].
The equation below connects the CPUE (abundance index) to the stock biomass (B) through the catchability coefficient (q):
C P U E t = q B t
When r and k are calculated, MSY = rk/4, FMSY = 0.5r, and BMSY = 0.5k are the estimated parameters for CMSY and BSM [21,25]. Table 3 shows the input values (Relative biomass, r, k and q ranges) for CMSY.

2.3. Surplus Production Models (SPMs) and ASPIC

Two non-equilibrium SPMs were run using the ASPIC computer package to evaluate the BRPs [16]. The logistic population growth model is represented by following Equation (6) [21], and the Gompertz growth model is represented by Equation (7) [20]:
d B d t = r B ( k - B )
d B d t = r B l n k - l n B
In the calculation above, the description of the parameters are the same as the previous equations. Equation (6) as a continuous function is different from Equation (1) which is a discrete function.
An initial proportion (IP) value is a necessary input for the ASPIC. The ratio between the initial capture and the maximum catch from the data set was used to determine the IP value, which ranged from 0 to 1. While IP = one denotes the heavily exploited status of the stock in the first year of the data series, IP= zero denotes the time when the data series started with the virgin status of the stock. Since the catch in the first year was 40% of the maximum catch, this investigation, therefore, determined that IP was 0.4. Both Schaefer and Fox SPMs were executed in ASPIC. Bootstrap trials were used to calculate the confidence intervals. Since the ASPIC cannot calculate the value of r, it was manually calculated using the formula r = 2 × FMSY.

3. Results

3.1. Stock Status and BRPs for Sardine Fishery Derived from CMSY and BSM

The derived MSY of sardine fishery from the CMSY and BSM were 37,900 (29,500–51,100) t and 38,200 (33,400–43,700) t, respectively (Table 4). The values of MSY from both methods were very close to the catch from the latest year (38,051 t/year in 2020). The fishing mortality F (0.587) was higher than FMSY (0.553), and last year’s biomass (52,000 t) was lower than the BMSY (69,100 t), indicating that this fishery in the BoB is overfished (Figure 3). In addition, the results of exploitation (F/FMSY = 1.06 > 1.0) and B/BMSY = 0.75 (<1.0) further support the overfished (Table 5) status of sardine stock in the study area (Figure 4).

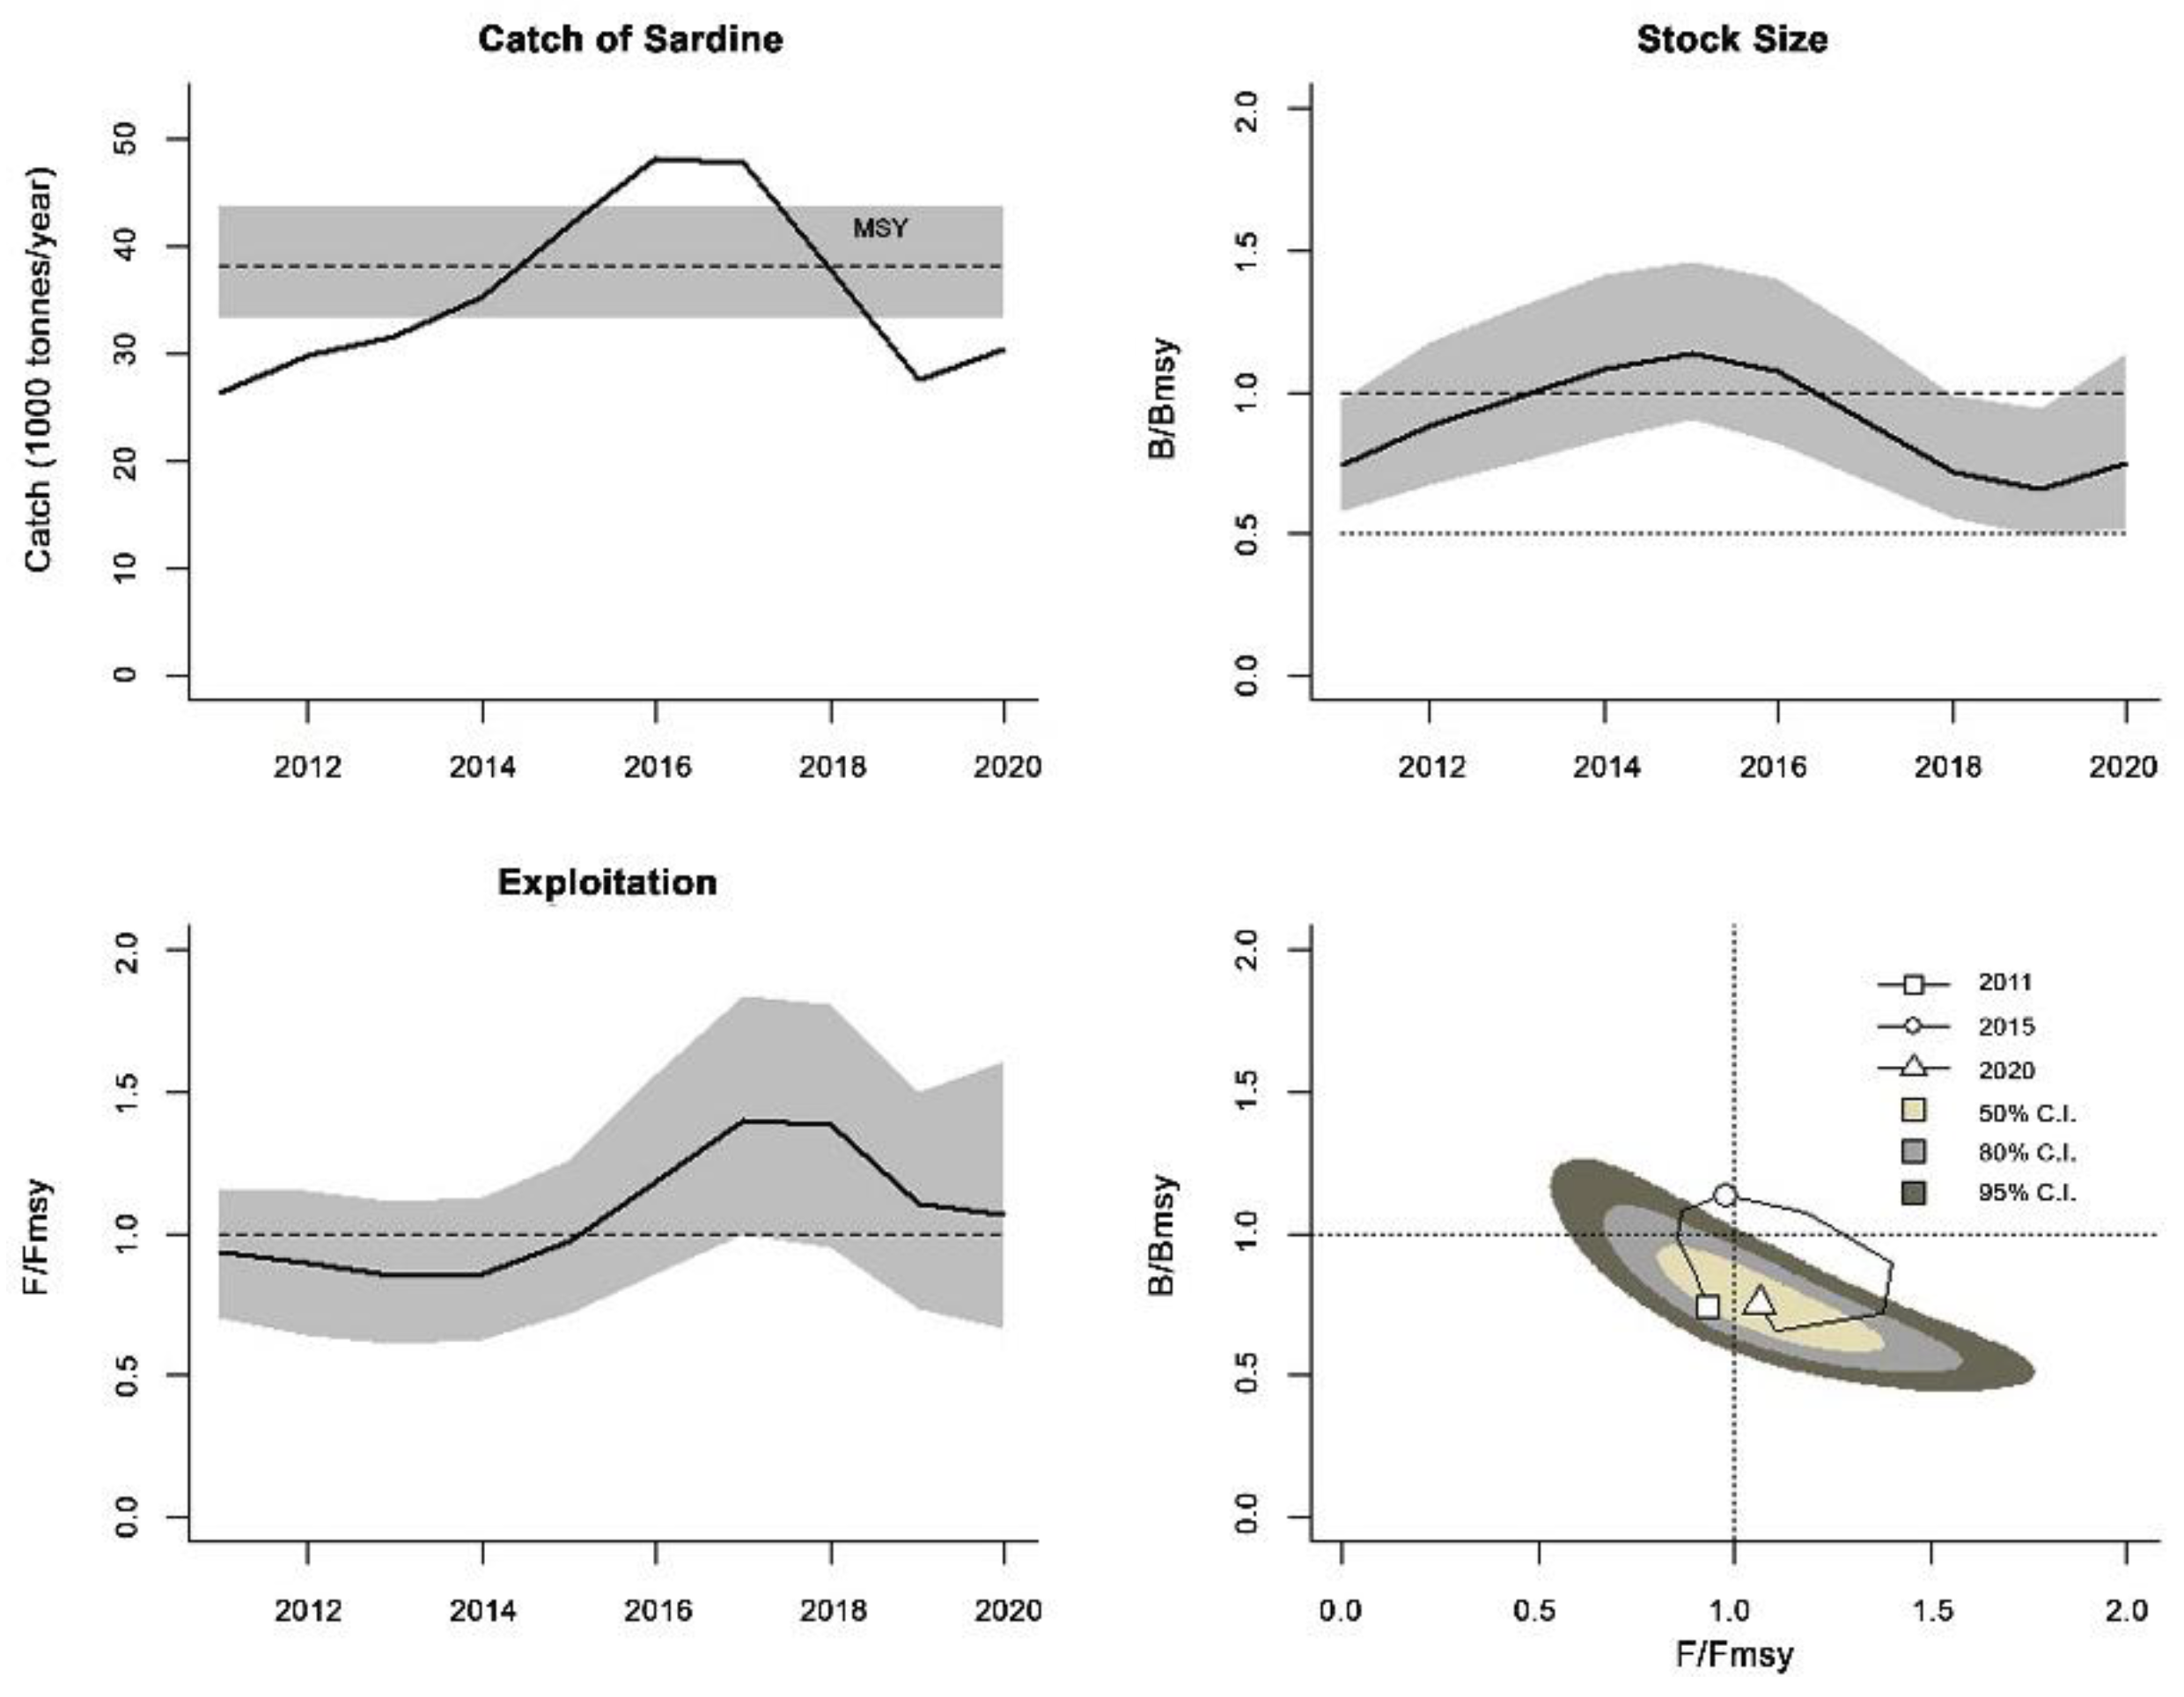
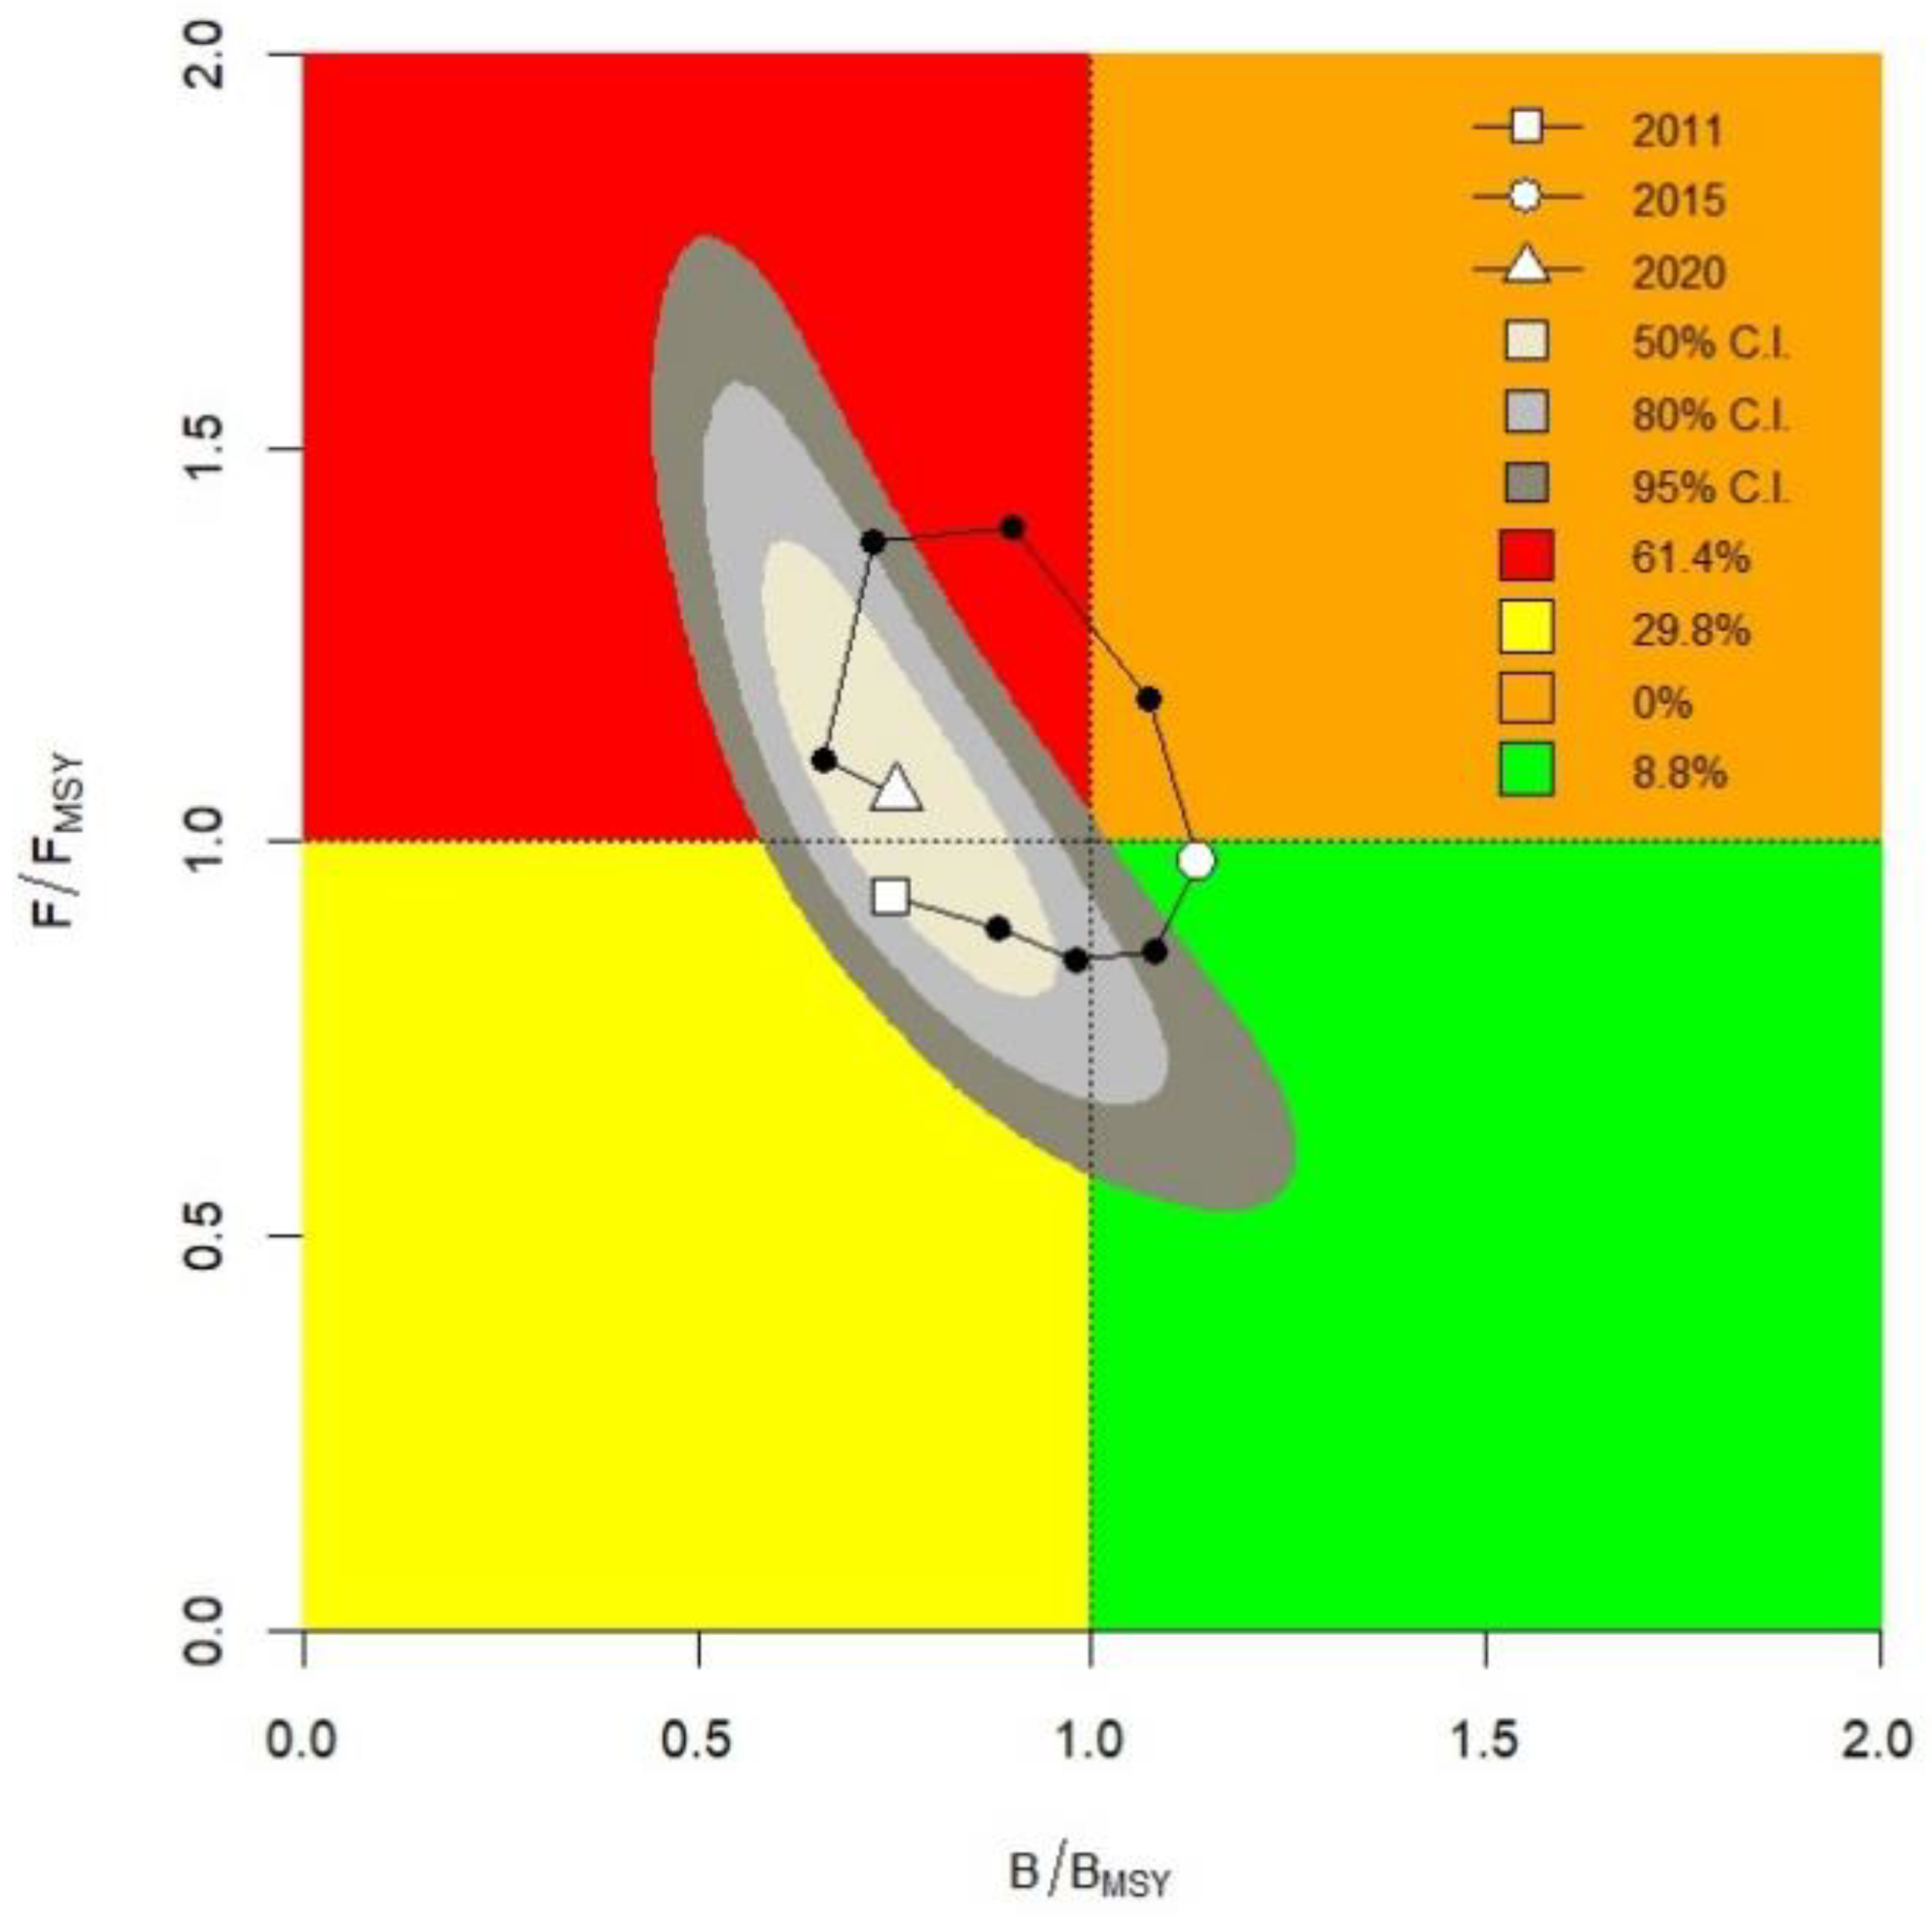
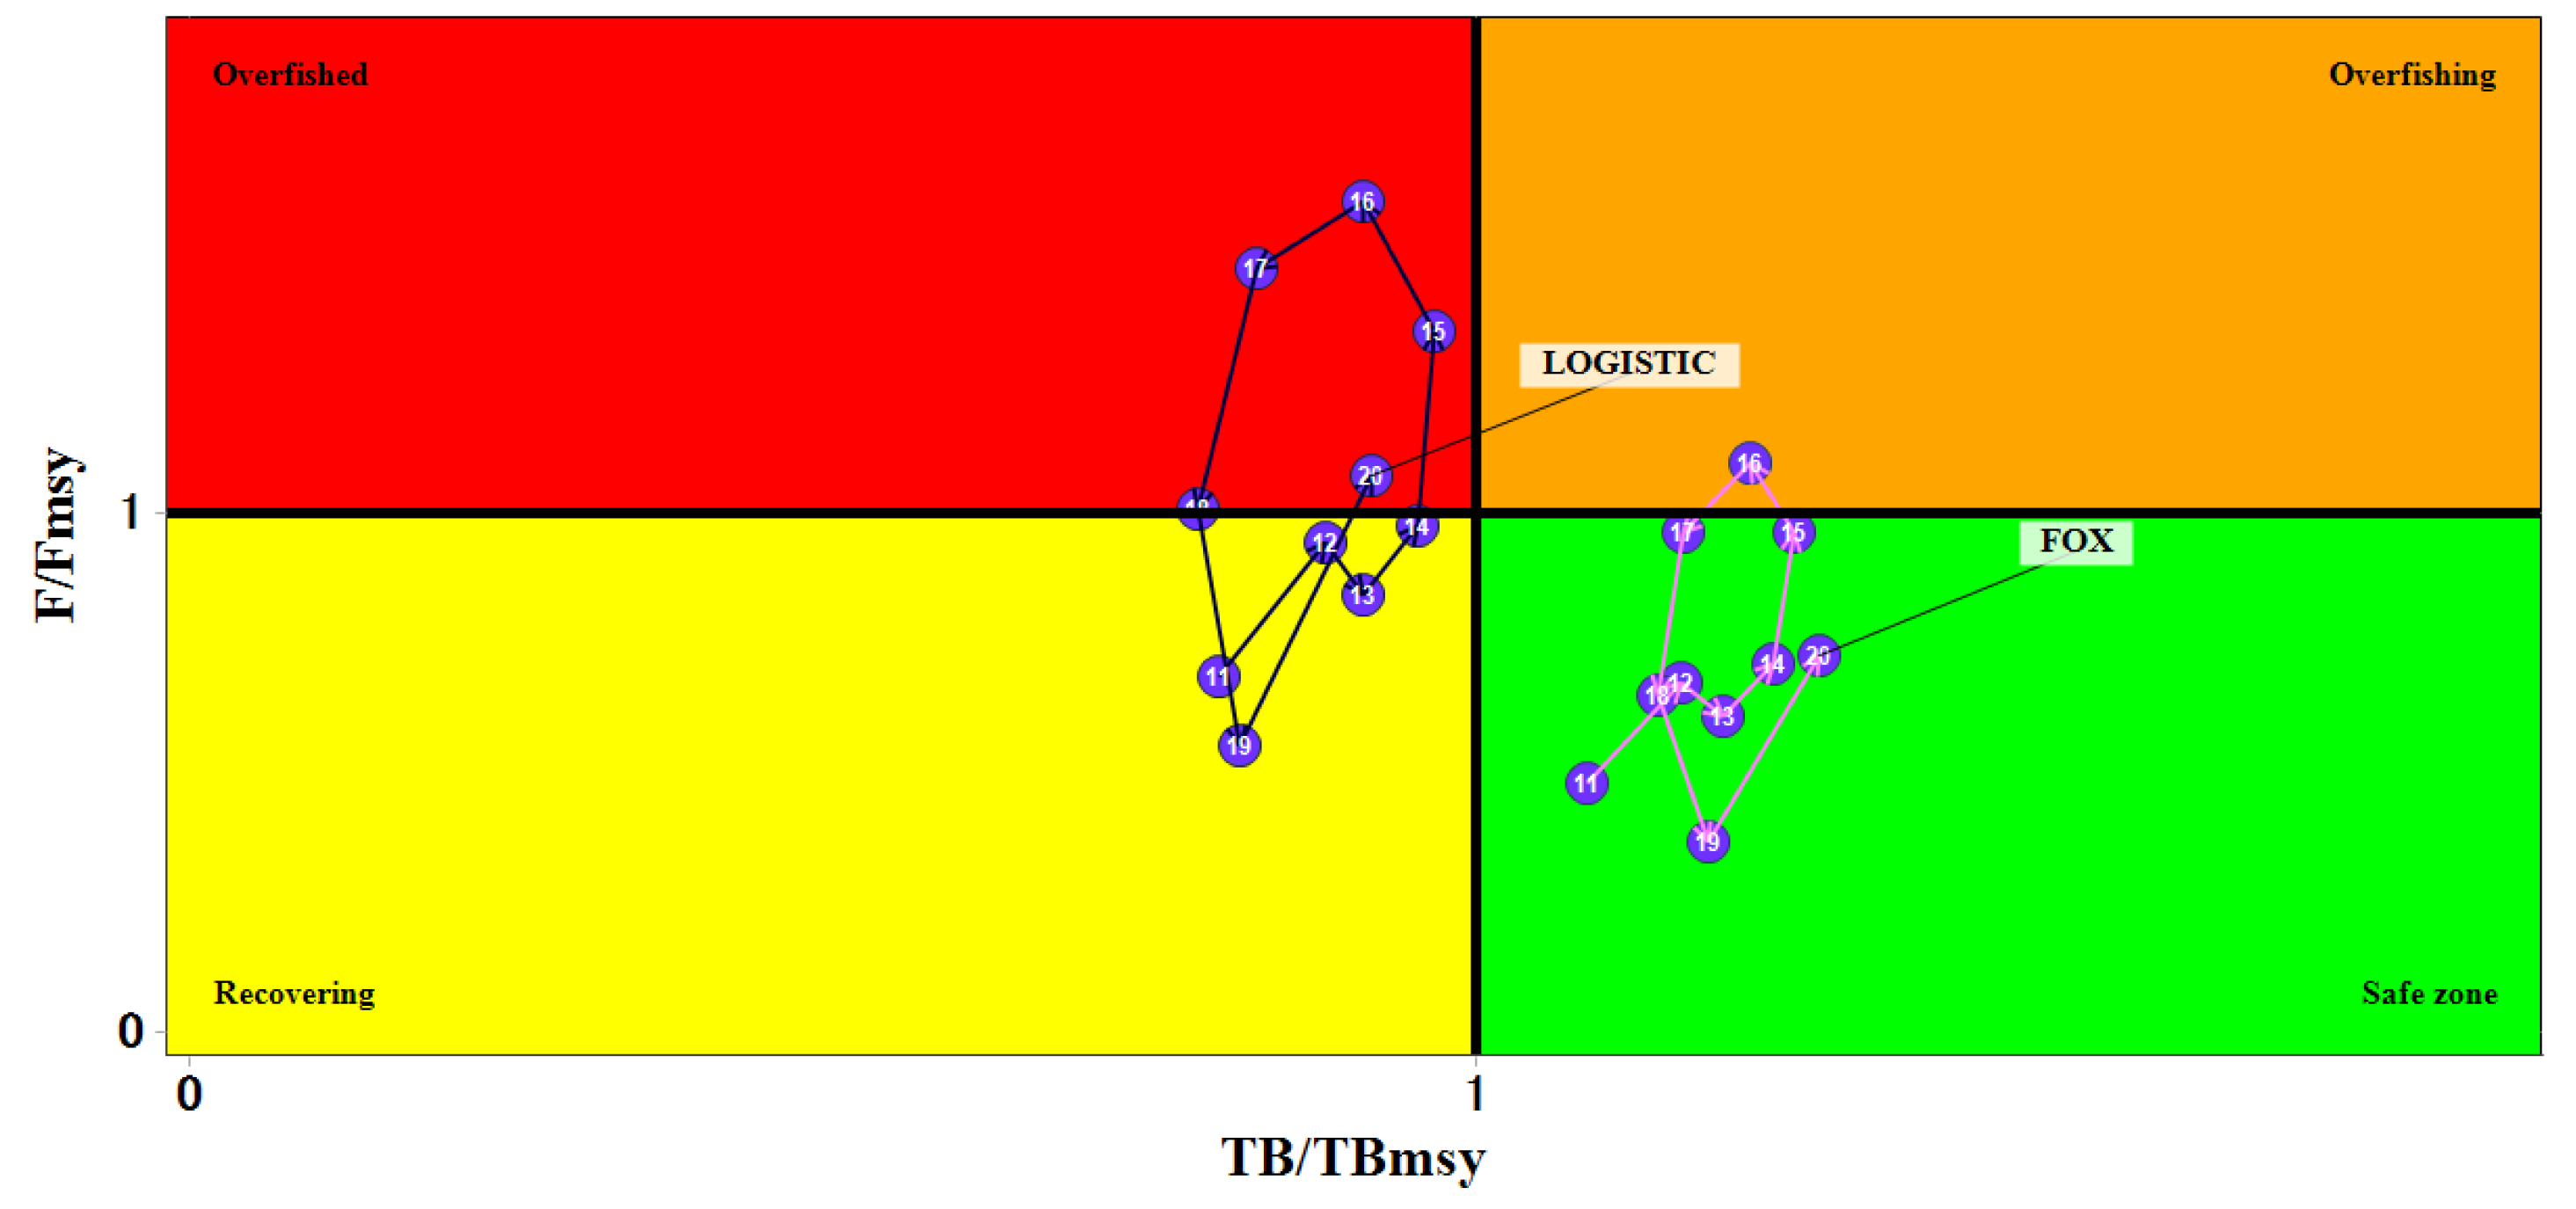
3.2. Stock Status and BRPs for Sardine Fishery Resource Derived from ASPIC

The population parameters estimated by the ASPIC are presented in Table 6. The estimated value of B/BMSY = 0.92 (<1) and F/FMSY = 1.07 (>1), obtained from the logistic model, indicating the overfished condition of the sardine fishery in the study area. However, the estimated values from the Fox model were B/BMSY = 1.27 (>1) and F/FMSY = 0.73 (<1). The Fox model’s estimated k, MSY, B, BMSY, and B/BMSY values were greater than those from the logistic model, demonstrating the Fox model’s conservatism. The logistic and Fox models derived using the ASPIC software demonstrated the inconsistent pattern of B/BMSY and F/FMSY (Figure 5). Furthermore, for the logistic and Fox models, the estimated values of k were 376,900 t and 686,700 t, and r = 0.41 and 0.33 year−1, respectively. The logistic model’s estimated values of FMSY and BMSY were, respectively, 0.205 and 188,500 t, while they were 0.163 and 252,600 t for the Fox model. The derived MSY values of sardines from logistic and Fox models were 38,650 t and 41,280 (Table 6) which is close to the last year’s catch (38,051 t/year in 2020).

4. Discussion

Scientific fish stock assessment is important for the rational exploitation of fisheries’ resources. Most conventional stock assessment models need much data, which restricts their application to species with limited data [26]. For the assessment of fish stocks, MSY is a popular BRP [27], and B/BMSY is utilized as a framework to ascertain the status of fisheries [8,17]. Besides the ASPIC software, the recent approaches of CMSY and BSM, which primarily rely on time series of catches and supplementary qualitative data to estimate biomass and related data on the stocks under consideration, are already well-established for assessing data-poor stocks [15,16,28]. In this contribution, the commercial sardine fisheries resource in the coastal water of Bangladesh was assessed using the data-limited stock assessment methodologies, CMSY and ASPIC.

4.1. Estimated Population Parameters of Sardine Fishery

The catchability coefficient (q), commonly known as the fishing gear efficiency, is the proportion of fishing mortality to fishing effort. When catch and effort statistics are important inputs for assessing fish stocks, the q value is crucial [15]. The BSM-derived q value (4.21 × 10⁻⁶) was higher than that of the other models. An important indicator for understanding a fishery is the intrinsic growth rate (r) [29,30]. It is stated that population size can increase by 10% over time when r is 0.1 [31]. ASPIC estimated r values of 0.41 and 0.33/year for logistic and Fox models, and 1.11/year for CMSY and BSM models. Due to of the high correlation between r and k parameters, ASPIC estimated high k values of 676900t and 686700t while CMSY and BSM estimated low k value of 138000t. Luckily, MSY = rk/4 is of the most interest to us which is close for both of the approaches.

4.2. MSY, Exploitation and Stock Status of Sardine Fishery

Finding a reliable method for estimating the maximum sustainable yield (MSY) and essential BRPs for fishery management is crucial, especially when data are scarce [32]. The MSY as the target reference point (TRP) and related BRPs were taken into consideration to assume the stock status [17,32]. The lower observed catch and higher MSY value indicated the underexploited state. On the other hand, a fish stock’s overexploitation state was indicated by a greater observed catch and lower MSY [31]. The MSY value of sardine stock produced from all the models ranged from 37,900 to 41,280 t (Table 4 and Table 6). This was close to the catch from the latest year (38,051 t), indicating sardines’ fully exploited status in the BoB, Bangladesh waters. When the observed catch is extremely close to or equal to the MSY value, the stock is said to be fully exploited and no further growth in capture is anticipated [4]. To protect the sustainability of fisheries, the MSY value is advised as the TAC (total allowable catch) [33,34].
In addition, the estimated values of B/BMSY (<1.0) from the BSM and logistic models were 0.75 and 0.92, respectively (Table 5 and Table 6), indicating the overfished status of sardine fishery. However, the estimated value from the Fox model was 1.27 (>1.0). The calculated values of F/FMSY (>1.0) from BSM and logistic models comply with the overfished status. Furthermore, all models’ (except the Fox model) produced fishing mortality (F) was higher than the FMSY, and last year’s biomass was lower than the BMSY, also supporting the overfished status of sardine fishery in the coastal water of Bangladesh. Since BSM/CMSY/logistic models and Fox model assume different population growth functions, and we do not have independent information to know which one is correct, caution is required in making decisions.
In the current study area, there is little published information on BRPs to compare the various parameters of these fishery resources (Table 7). Reference [35] reported the slightly overfished and severely depleted status of the sardinella sp. in the BoB, which is consistent with the current study’s findings. A similar finding was reported by [8] using the LBB (length-based Bayesian biomass) method. However, [8,35] found the not overfished condition of the rainbow sardine (Dussumieria sp.) in the northeastern Bay of Bengal. The sardinellas are the main target of intense sardine fishery. Very little is performed to exploit rainbow sardines; they are probably only caught accidentally. Several bycatch species in this fishery are of great concern, in addition to the sardinellas’ declining numbers [35]. This also strongly complies with the overfished status of sardines stock in the coastal water of Bangladesh estimated by the present study. In addition, the overexploitation status for the oil sardine was reported in the northern Bay of Bengal, India [36]. Similar findings were reported by [37] for Sardinella gibbosa, and Sardinella fimbriata in the north west Bay of Bengal, India, which also comply with the present study’s findings.
In addition, the continuous increase in the fishing effort (Figure 2) from 2011 to 2016 has increased sardine production more than two times. As a result, the stock has reached an overexploitation level. To control the overexploitation, fishing efforts were maintained at almost the same level from 2017 to 2020 (Figure 2). The result of this was that, after a certain decline (due to the impact of previous overfishing), the production seems to be starting to regain, which strongly comply with the present study findings. Therefore, for the sustainable management and protection of this resource, the existing effort should be controlled.

4.3. Suitability of the Data Limited Methods for the Sustainable Fisheries Management

The fishery reference points of the sardine fishery from the BoB were evaluated in this study using ASPIC (a Stock Production Model Incorporating Covariates software suite), CMSY, and BSM methods. SPMs are thought to occasionally provide BRPs that are better than age-based models and can be used wherever [16]. Additionally, BRPs from multispecies data can be appropriately assessed using the ASPIC software with SPMs. To run the ASPIC program, an IP value must be carefully selected for fitting these models [16]. On the other hand, for the CMSY and BSM approaches, r and k were the essential prior information that could be acquired from the resilience data obtained from the FishBase [38]. When employed for less-captured fisheries or for very low resilience, the MSY, computed by CMSY and BSM, exhibits certain inefficiencies; medium to high resilience fisheries are the best fits [15]. The high resilience value for sardine suggests that the CMSY approach is the most useful for evaluating BRPs and stock status. In addition, the effectiveness of the CMSY approach was individually tested by the FAO [4], which found the better performance of this method at estimating fisheries stock status over short time series of data. Therefore, the CMSY method may be recommended as a possible substitute to estimate the stock status of the sardine population and other fisheries with the limited data in the BoB.
The fishery reference points derived from the CMSY, BSM, and logistic models showed that sardines are being overfished in the study area, which looks more reasonable with the present real scenarios of this resource in the BoB. However, the Fox-model-derived findings are partially consistent with those results. Hence, considering the outcomes of the present study, further studies focusing on sardine fishery, and analyzing the data by means of other models, are strongly recommended.

5. Conclusions

The current study assessed the biological reference points (BRPs) and stock status of the exploited sardine fishery resource on the BoB. CMSY-, BSM-, and logistic- (ASPIC) model-derived fishery reference points showed that sardines are being overfished in the study area. Even though fish are a renewable resource, overfishing reduces fish biomass and results in the ruin of the fishery. To ensure the sustainability of an overfished fishery, it is essential to undertake continuous monitoring of the stock assessment. Hence, the current study strongly suggests the adoption of management strategies, and the development of specific policies, in order to reduce the existing fishing pressure and keep the catch at the MSY level. In addition, a detailed study on the biology and life history of sardine fishery, along with the protection and conservation of the nursery and breeding grounds, is recommended. These results will aid in developing this fishery resource in the BoB, Bangladesh coastal water, and in formulating management strategies and conservation policies to ensure the sustainability of this commercially important resource.

Author Contributions

R.S.: conceptualization, methodology, data collection, analysis and interpretation, drafting, reviewing, and editing of the manuscript, Q.L.: conceptualization, study design, data analysis, data interpretation, editing, and reviewing, M.A.A.-M., P.P.B., M.M.S. and S.B.: visualization, data analysis, data interpretation, editing, and reviewing. All authors have read and agreed to the published version of the manuscript.

Funding

The work is supported by the basic research fund of Ocean University of China (201562030).

Institutional Review Board Statement

Not applicable.

Informed Consent Statement

Not applicable.

Data Availability Statement

The data are available on request from the corresponding author based on reasonable grounds.

Acknowledgments

The first author would like to express gratitude to the Chinese Scholarship Council (CSC) for their financial support during her doctoral studies and this research work. The authors are grateful to the College of Fisheries, Ocean University of China; Department of Fisheries (DoF), Dhaka, Bangladesh and Directorate of Secondary & Higher Secondary Education (DSHE), Dhaka, Bangladesh, for their pleasant support in the successful completion of this research. The authors are also grateful to Sayedur Rahman Chowdhury, Professor, Institute of Marine Sciences, University of Chittagong, Bangladesh, for his cordial support in the coastal map designing.

Conflicts of Interest

The authors declare no conflict of interest.

References

  1. FAO. The State of the World Fisheries and Aquaculture; Food and Agriculture Organisation: Rome, Italy, 2018. [Google Scholar]
  2. Lam, V.W.; Pauly, D. Status of fisheries in 13 Asian large marine ecosystems. Deep Sea Res. II 2019, 163, 57–64. [Google Scholar] [CrossRef]
  3. Albertsen, C.M.; Trijoulet, V. Model-based estimates of reference points in an age-based state-space stock assessment model. Fish. Res. 2020, 230, 105618. [Google Scholar] [CrossRef]
  4. Rosenberg, A.A.; Fogarty, M.J.; Cooper, A.B.; Dickey-Collas, M.; Fulton, E.A.; Gutiérrez, N.L.; Hyde, K.J.W.; Kleisner, K.M.; Kristiansen, T.; Longo, C.; et al. Developing New Approaches to Global Stock Status and Fishery Production Potential of the Seas; Tech. Rep. Circular No. 1086; FAO: Rome, Italy, 2014; Available online: http://www.fao.org/docrep/019/i3491e/i3491e.pdf (accessed on 20 June 2022).
  5. Jardim, E.; Azevedo, M.; Brites, N.M. Harvest control rules for data limited stocks using length-based reference points and survey biomass indices. Fish. Res. 2015, 171, 12–19. [Google Scholar] [CrossRef]
  6. Kindong, R.; Gao, C.; Pandong, N.; Ma, Q.; Tian, S.; Wu, F.; Sarr, O. Stockstatus assessments of five small pelagic species in the Atlantic and Pacific Oceansusing the length-based bayesian estimation (LBB) method. Front. Mar. Sci. 2020, 7, 592082. [Google Scholar] [CrossRef]
  7. Hou, G.; Zhang, H.; Wang, J.; Chen, Y.; Lin, J. Stock Assessment of 19 Perciformes in the Beibu Gulf, China, Using a Length-Based Bayesian Biomass Method. Front. Mar. Sci. 2021, 8, 731837. [Google Scholar] [CrossRef]
  8. Barman, P.P.; Liu, Q.; Al-Mamun, M.A.; Schneider, P.; Mozumder, M.M.H. Stock Assessment of Exploited Sardine Populations from Northeastern Bay of Bengal Water, Bangladesh Using the Length-Based Bayesian Biomass (LBB) Method. J. Mar. Sci. Eng. 2021, 9, 1137. [Google Scholar] [CrossRef]
  9. Jit, R.B.; Singha, N.K.; Ali, S.M.H.; Rhaman, G. Abundance of sardine fish species in Bangladesh. Basic Res. J. Agric. Sci. Rev. 2013, 2, 111–115. [Google Scholar]
  10. Roy, B.J.; Singha, N.K.; Ali, S.M.H.; Rahman, G. Month wise catch per unit effort of sardine species Sardinella fimbriata and Dussumieria acuta in Artisanal and Industrial fishing sector. Glob. Adv. Res. J. Agric. Sci. 2013, 2, 173–179. [Google Scholar]
  11. Hossain, M.S.; Chowdhury, S.R.; Sharifuzzaman, S.M.; Islam, M.M.; Hasan, J.; Haque, M.A.; Ali, M.Z.; Hoq, M.E.; Mahmud, Y. Cataloguing Marine Fisheries Resources of Bangladesh; Institute of Marine Sciences, University of Chittagong and Bangladesh Fisheries Research Institute (BFRI): Mymensingh, Bangladesh, 2020. [Google Scholar]
  12. Uddin, M.S.; Chowdhury, S.R.; Rahman, M.M.; Singha, N.K.; Mamun, M.A.A.; Rashed, M.R.; Hasan, M.E.; Tazim, M.F.; Mamun, A. (Eds.) Album: Marine and Coastal Fishes of Bangladesh; Department of Fisheries: Dhaka, Bangladesh, 2021; p. 312. [Google Scholar]
  13. DoF (Department of Fisheries). Yearbook of Fisheries Statistics of Bangladesh, 2019–2020; Department of Fisheries, Ministry of Fisheries and Livestock, Government of Bangladesh: Dhaka, Bangladesh, 2020; Volume 37, 141p. Available online: http://fisheries.portal.gov.bd/sites/default/files/files/fisheries.tal.gov.bd/page/4cfbb3cc_c0c4_4f25_be21_b91f84bdc45c/2020-10-20-11-57-8df0b0e26d7d0134ea2c92ac6129702b.pdf (accessed on 20 June 2022).
  14. ICES. ICES Implementation of Advice for Data-Limited Stocks in 2012 in Its 2012 Advice; ICES CM2012/ACOM68; ICES: Copenhagen, Denmark, 2012; p. 42. [Google Scholar] [CrossRef]
  15. Froese, R.; Demirel, N.; Coro, G.; Kleisner, K.M.; Winker, H. Estimating fisheries reference points from catch and resilience. Fish Fish. 2017, 18, 506–526. [Google Scholar] [CrossRef]
  16. Prager, M.H. User’s Guide for ASPIC Suite, Version 7: A Stock–Production Model Incorporating Covariates and Auxiliary Programs; Prager Consulting: Portland, OR, USA, 2016. [Google Scholar]
  17. Barman, P.P.; Shamsuzzaman, M.; Schneider, P.; Mozumder, M.M.H.; Liu, Q. Fisheries Reference Point and Stock Status of Croaker Fishery (Sciaenidae) Exploited from the Bay of Bengal, Bangladesh. J. Mar. Sci. Eng. 2022, 10, 63. [Google Scholar] [CrossRef]
  18. Froese, R.; Demirel, N.; Gianpaolo, C.; Winker, H. A Simple User Guide for CMSY+ and BSM (CMSY_2019_9f.R). December 2019. Available online: https://oceanrep.geomar.de/id/eprint/33076/ (accessed on 10 June 2022).
  19. Plummer, M. JAGS: A program for analysis of Bayesian graphical models using Gibbs sampling. In Proceedings of the 3rd International Workshop on Distributed Statistical Computing, Vienna, Austria, 20–22 March 2003; Volume 124, pp. 1–10. [Google Scholar]
  20. Fox, W.W. An Exponential Surplus-Yield Model for Optimizing Exploited Fish Populations. Trans. Am. Fish. Soc. 1970, 99, 80–88. [Google Scholar] [CrossRef]
  21. Schaefer, M.B. Some aspects of the dynamics of populations important to the management of the commercial marine fisheries. Bull. Math. Biol. 1991, 53, 253–279. [Google Scholar] [CrossRef]
  22. Meyer, R.; Millar, R.B. BUGS in Bayesian stock assessments. Can. J. Fish. Aquat. Sci. 1999, 56, 1078–1087. [Google Scholar] [CrossRef]
  23. Millar, R.B.; Meyer, R. Non-linear state space modelling of fisheries biomass dynamics by using Metropolis-Hastings within-Gibbs sampling. J. R. Stat. Soc. 1999, 49, 327–342. [Google Scholar] [CrossRef]
  24. Froese, R.; Pauly, D. Fishbase. Available online: https://fishbase.mnhn.fr/search.php (accessed on 25 May 2022).
  25. Haddon, M. Modelling and Quantitative Methods in Fisheries, 2nd ed.; Chapman and Hall/CRC: New York, NY, USA; London, UK, 2011; ISBN 9781119130536. [Google Scholar] [CrossRef]
  26. Carruthers, T.R.; Punt, A.E.; Walters, C.J.; Mac Call, A.; McAllister, M.K.; Dick, E.J.; Cope, J. Evaluating methods for setting catch limits in data-limited fisheries. Fish. Res. 2014, 153, 48–68. [Google Scholar] [CrossRef]
  27. Costello, C.; Ovando, D. Status, Institutions, and Prospects for Global Capture Fisheries. Annu. Rev. Environ. Resour. 2019, 44, 177–200. [Google Scholar] [CrossRef]
  28. Froese, R.; Winker, H.; Coro, G.; Demirel, N.; Tsikliras, A.C.; Dimarchopoulou, D.; Scarcella, G.; Quaas, M.; Matz-Lück, N. Status and rebuilding of European fisheries. Mar. Policy 2018, 93, 159–170. [Google Scholar] [CrossRef]
  29. Anderson, C.N.K.; Hsieh, C.H.; Sandin, S.A.; Hewitt, R.; Hollowed, A.; Beddington, J.; May, R.M.; Sugihara, G. Why fishing magnifies fluctuations in fish abundance. Nature 2008, 452, 835–839. [Google Scholar] [CrossRef]
  30. Cheung, W.W.L.; Lam, V.W.Y.; Sarmiento, J.L.; Kearney, K.; Watson, R.; Zeller, D.; Pauly, D. Large-scale redistribution of maximum fisheries catch potential in the global ocean under climate change. Glob. Chang. Biol. 2010, 16, 24–35. [Google Scholar] [CrossRef]
  31. Hoggarth, D.; Abeyasekera, S.; Arthur, R.; Beddington, J.R.; Burn, R.W.; Halls, A.S.; Kirkwood, G.P.; McAllister, M.; Medley, P.; Mees, C.C.; et al. Stock Assessment for Fishery Management; FAO Fisheries Technical Paper; FAO: Rome, Italy, 2006; Volume 487, ISBN 9251055033. [Google Scholar]
  32. Ji, Y.; Liu, Q.; Liao, B.; Zhang, Q.; Han, Y. Estimating biological reference points for Largehead hairtail (Trichiurus lepturus) fishery in the Yellow Sea and Bohai Sea. Acta Oceanol. Sin. 2019, 38, 20–26. [Google Scholar] [CrossRef]
  33. Bouch, P.; Minto, C.; Reid, D.G. Comparative performance of data-poor CMSY and data-moderate SPiCT stock assessment methods when applied to data-rich, real-world stocks. ICES J. Mar. Sci. 2021, 78, 264–276. [Google Scholar] [CrossRef]
  34. Zhai, L.; Liang, C.; Pauly, D. Assessments of 16 Exploited Fish Stocks in Chinese Waters Using the CMSY and BSM Methods. Front. Mar. Sci. 2020, 7, 1002. [Google Scholar] [CrossRef]
  35. Fanning, P.; Chowdhury, S.R.; Uddin, M.S.; Al-Mamun, M.A. Marine Fisheries Survey Reports and Stock Assessment 2019 Based on R/V Meen Sandhani Surveys from 2016 to 2019; Published by Bangladesh Marine Fisheries Capacity Building Project; Department of Fisheries, Ministry of Fisheries and Livestock, Matshya Bhaban: Dhaka, Bangladesh, 2019. Available online: http://mfsmu.fisheries.gov.bd/site/download/03cb42dc-8a4f-4dd3-a08943e5f5bcf61b (accessed on 20 May 2022).
  36. Ghosh, S.; Muktha, M.; Rao, M.H.; Behera, P.R. Assessment of stock status of the exploited fishery resources in northern Bay of Bengal using landed catch data. Indian J. Fish. 2015, 62, 23–30. [Google Scholar]
  37. Ghosh, S.; Hanumantha Rao, M.V.; Sumithrudu, S.; Rohit, P.; Maheswarudu, G. Reproductive biology and population characteristics of Sardinella gibbosa and Sardinella fimbriata from north west Bay of Bengal. Indian J. Mar. Sci. 2013, 42, 758–769. [Google Scholar]
  38. Martell, S.; Froese, R. A simple method for estimating MSY from catch and resilience. Fish Fish. 2013, 14, 504–514. [Google Scholar] [CrossRef]
Figure 1. The coastal map of the BoB, Bangladesh.
Jmse 11 00944 g001
Figure 2. Diagrammatic representation of the catch and effort data (2011–2020) of the sardine fishery from the BoB, Bangladesh.
Jmse 11 00944 g002
Figure 3. Schematic plots based on BSM analysis for the sardine fishery in the BoB, Bangladesh coast. The shaded areas are the 95% confidence intervals.
Jmse 11 00944 g003
Figure 4. Kobe plot showing the simultaneous movement of exploitation (F/FMSY) and relative biomass (B/BMSY) using BSM for sardine fishery in the BoB, Bangladesh coast.
Jmse 11 00944 g004
Figure 5. The Kobe plot for sardine fishery in the BoB, Bangladesh coast was obtained using the ASPIC software (logistic and Fox) for the ratios F/FMSY (fishing mortality to FMSY), and B/BMSY (biomass to BMSY).
Jmse 11 00944 g005
Table 1. Prior ranges for the parameter r used in Monte Carlo method (CMSY) study.
ResilienceVery LowLowMediumHigh
Prior r range0.015–0.10.05–0.50.2–0.80.6–1.5
Table 2. Prior B/K (relative biomass ranges) using Monte Carlo method (CMSY).
Very Strong DepletionStrong DepletionMedium DepletionLow DepletionNearly
Unexploited
0.01–0.20.01–0.40.2–0.60.4–0.80.75–1.0
Table 3. Relative biomass (B), r, k, q ranges as priors in the CMSY and BSM used in this analysis.
ResourcePrior Initial
Relative Biomass
Prior Intermediate
Relative Biomass
Prior Final
Relative Biomass
Prior Range for rPrior Range of qPrior Range for k
Sardine fishery0.2–0.60.5–0.9 (in year 2015)0.2–0.60.6–1.53.45 × 10−6
1.09 × 10⁻⁵
89.9–270
Table 4. The estimated k, r and MSY values and their 95% confidence intervals for the sardine fishery in the Bay of Bengal, Bangladesh coast.
Method Namek (t) r (/yr) MSY (t)
CMSY138,000 (97,100–196,000)1.11 (0.774–1.58)37,900 (29,500–51,100)
BSM138,000 (102,000–188,000)1.11 (0.806–1.52)38,200 (33,400–43,700)
Table 5. Estimated results for the management of sardine fishery based on Bayesian Schaefer model (BSM) analysis.
ResourceF (/yr) FMSY (/yr) B (t) BMSY (t) F/FMSYB/BMSYAssessment
Sardine fishery0.5870.55352,00069,1001.060.752overfished
Table 6. Estimated results derived from ASPIC for the sardine resources using catch and effort data and 0.4 IP value.
ModelsIPkqrMSYBBMSYFFMSYB/BMSYF/FMSY
Logistic0.400376,9001.67 × 10−60.4138,650173,590188,5000.220.2050.921.07
Fox0.400686,7009.13 × 10−70.3341,280321,560252,6000.120.1631.270.73
Table 7. Comparison of the present findings to the previous study in sardine fishery resource assessment in the Bay of Bengal.
Group or
Scientific Name
Study AreaAssessment ResultComparison with This StudyReferences
Sardinellas (Sardinella sp.)Bay of Bengal, BangladeshSlightly overfished,
Severely depleted
Consistent[35]
Rainbow sardines (Dussumieria sp.)Bay of Bengal, BangladeshNot over-fishedInconsistent[35]
Sardine (Sardinella sp.)Northeastern Bay of Bengal, Bangladeshover-fishedConsistent[8]
Sardine (Dussumieria sp.)Northeastern Bay of Bengal, BangladeshNot overexploitedInconsistent[8]
OilsardineNorthern Bay of Bengal, IndiaOverexploitedConsistent[36]
Sardinella gibbosa
Sardinella fimbriata
North West, Bay of Bengal, IndiaOverfishedConsistent[37]
Disclaimer/Publisher’s Note: The statements, opinions and data contained in all publications are solely those of the individual author(s) and contributor(s) and not of MDPI and/or the editor(s). MDPI and/or the editor(s) disclaim responsibility for any injury to people or property resulting from any ideas, methods, instructions or products referred to in the content.

