
Structural Design of the Substructure of a 10 MW Floating Offshore Wind Turbine System Using Dominant Load Parameters


Abstract
:1. Introduction
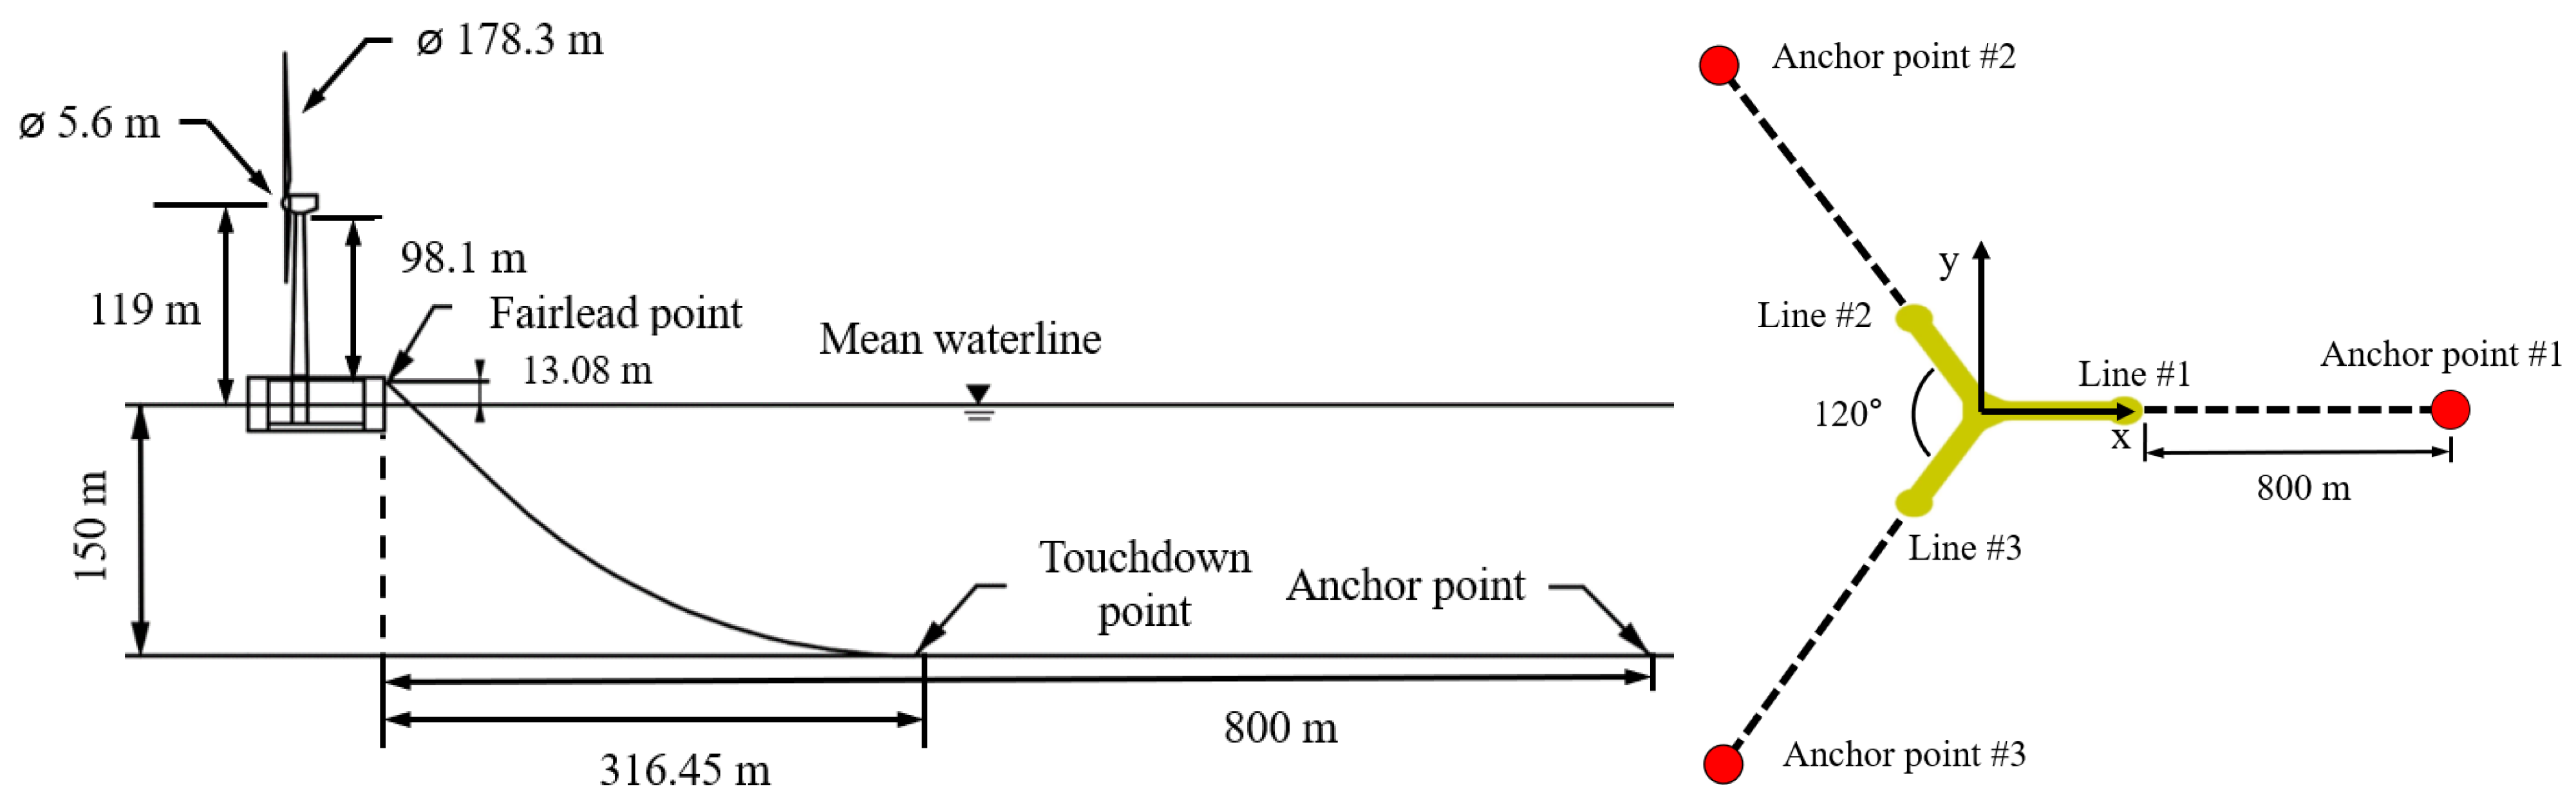
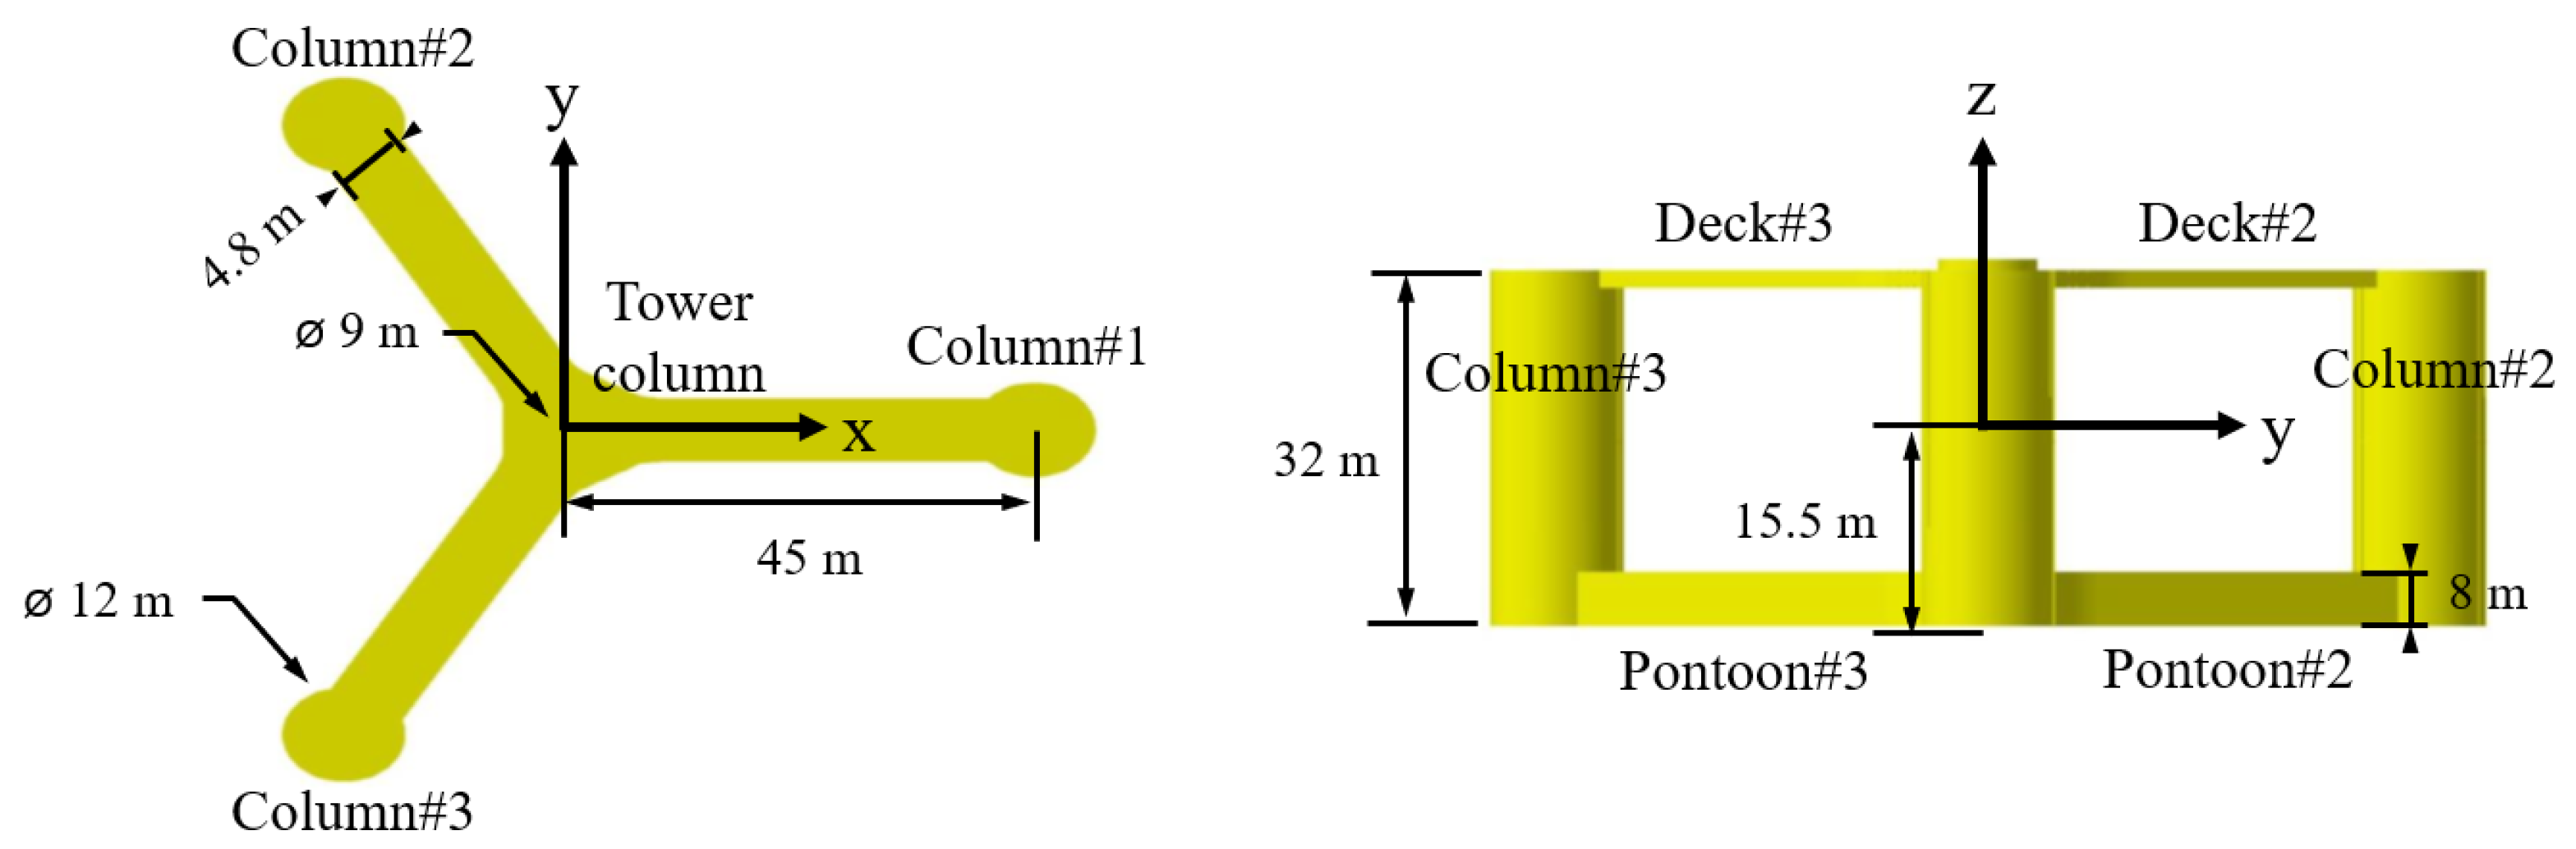
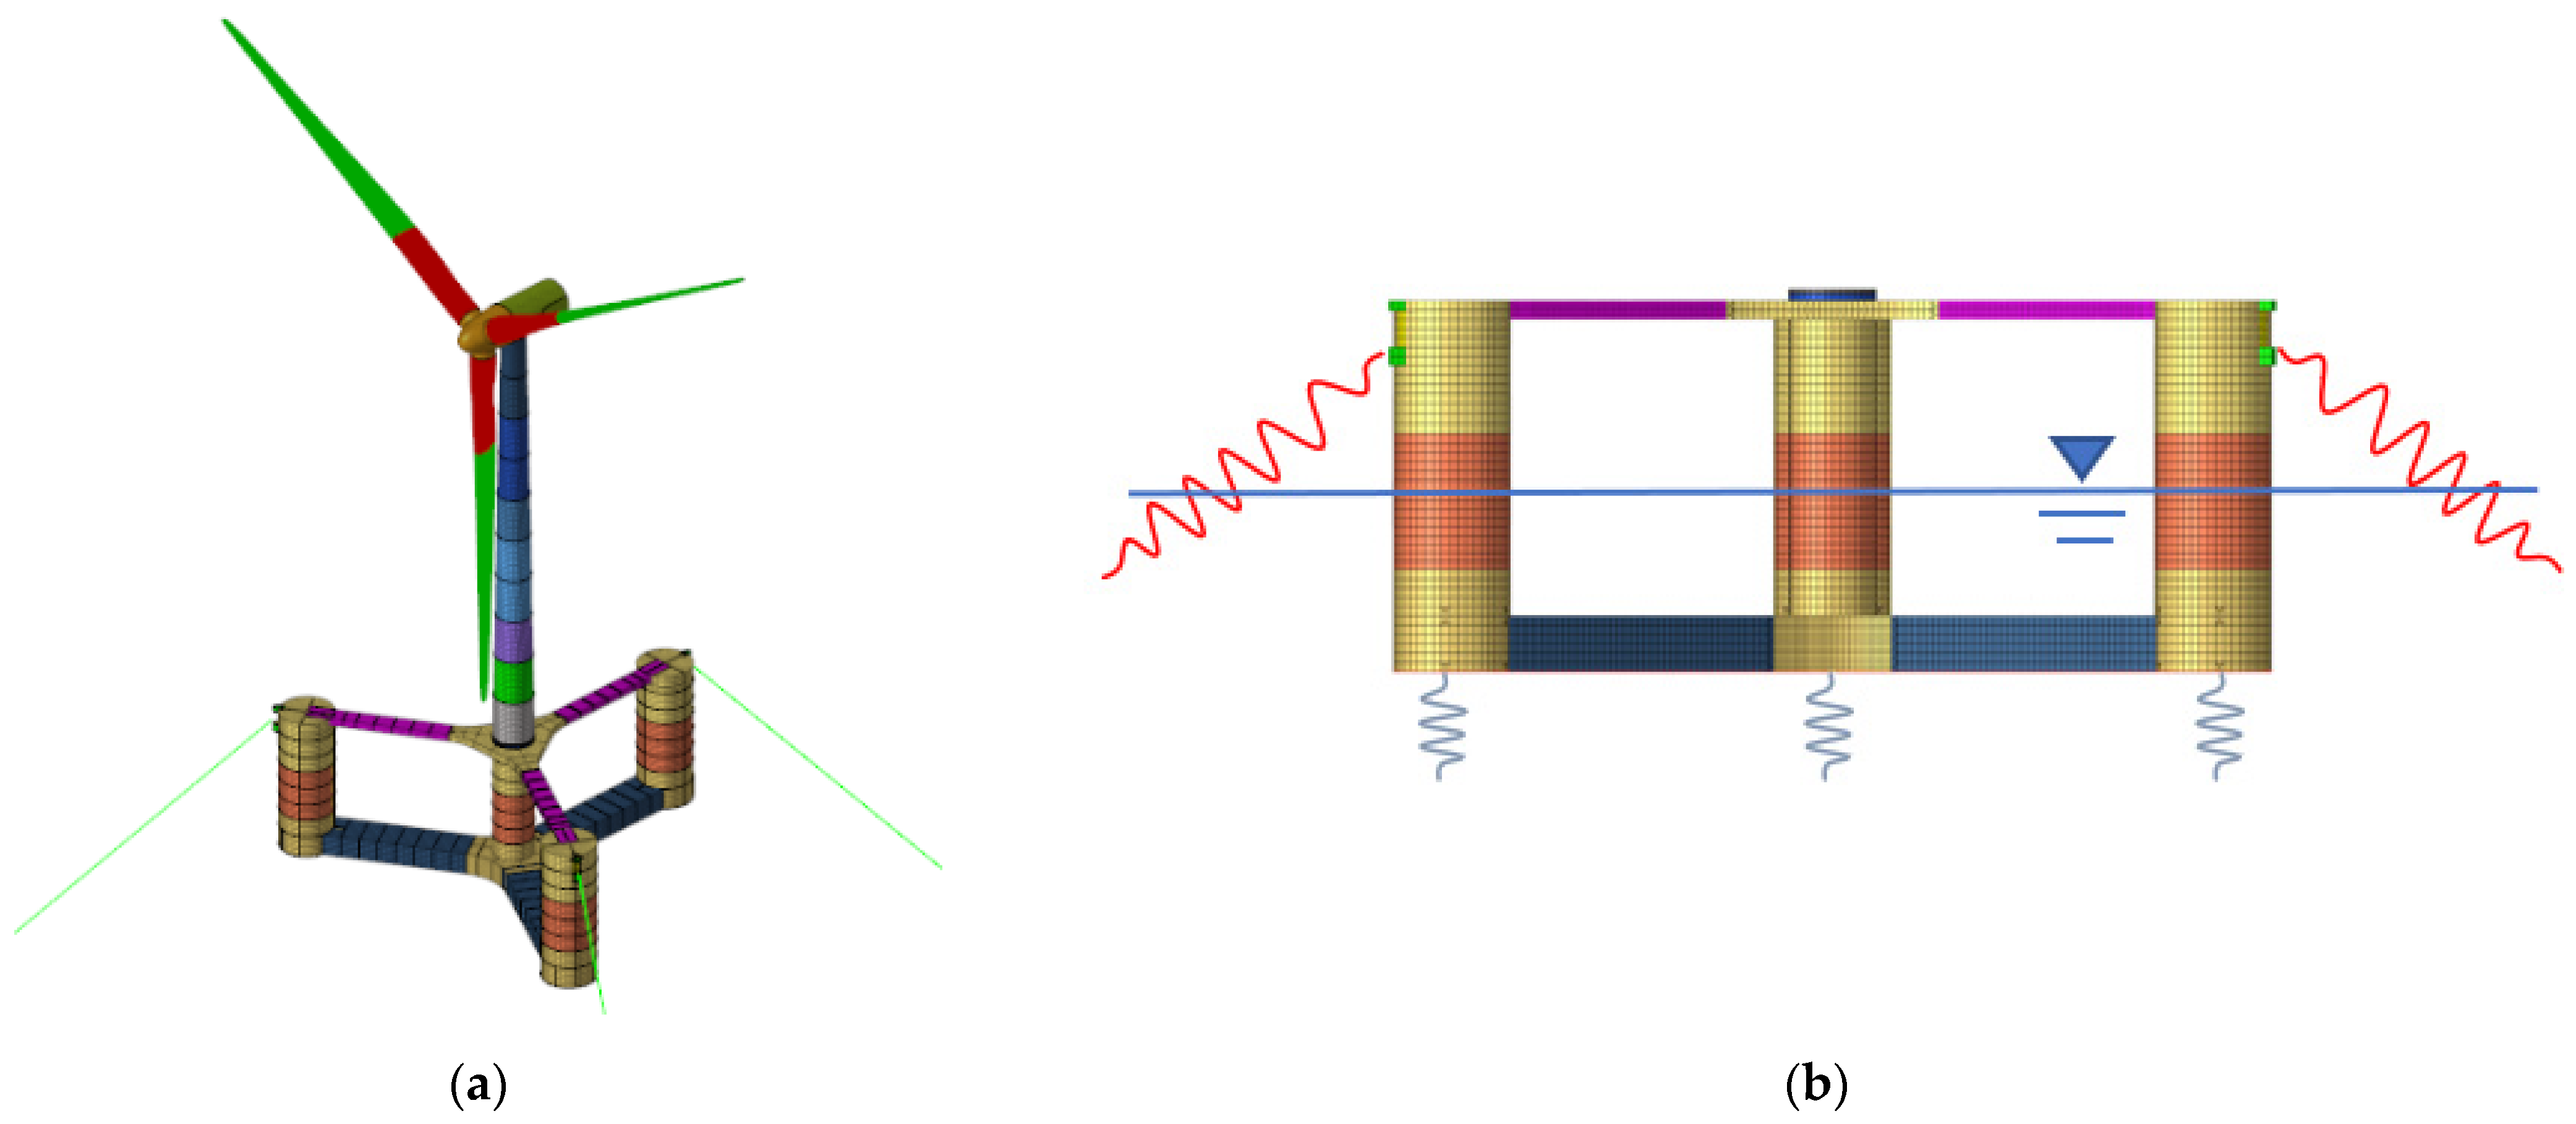
2. Details of the Target Structure
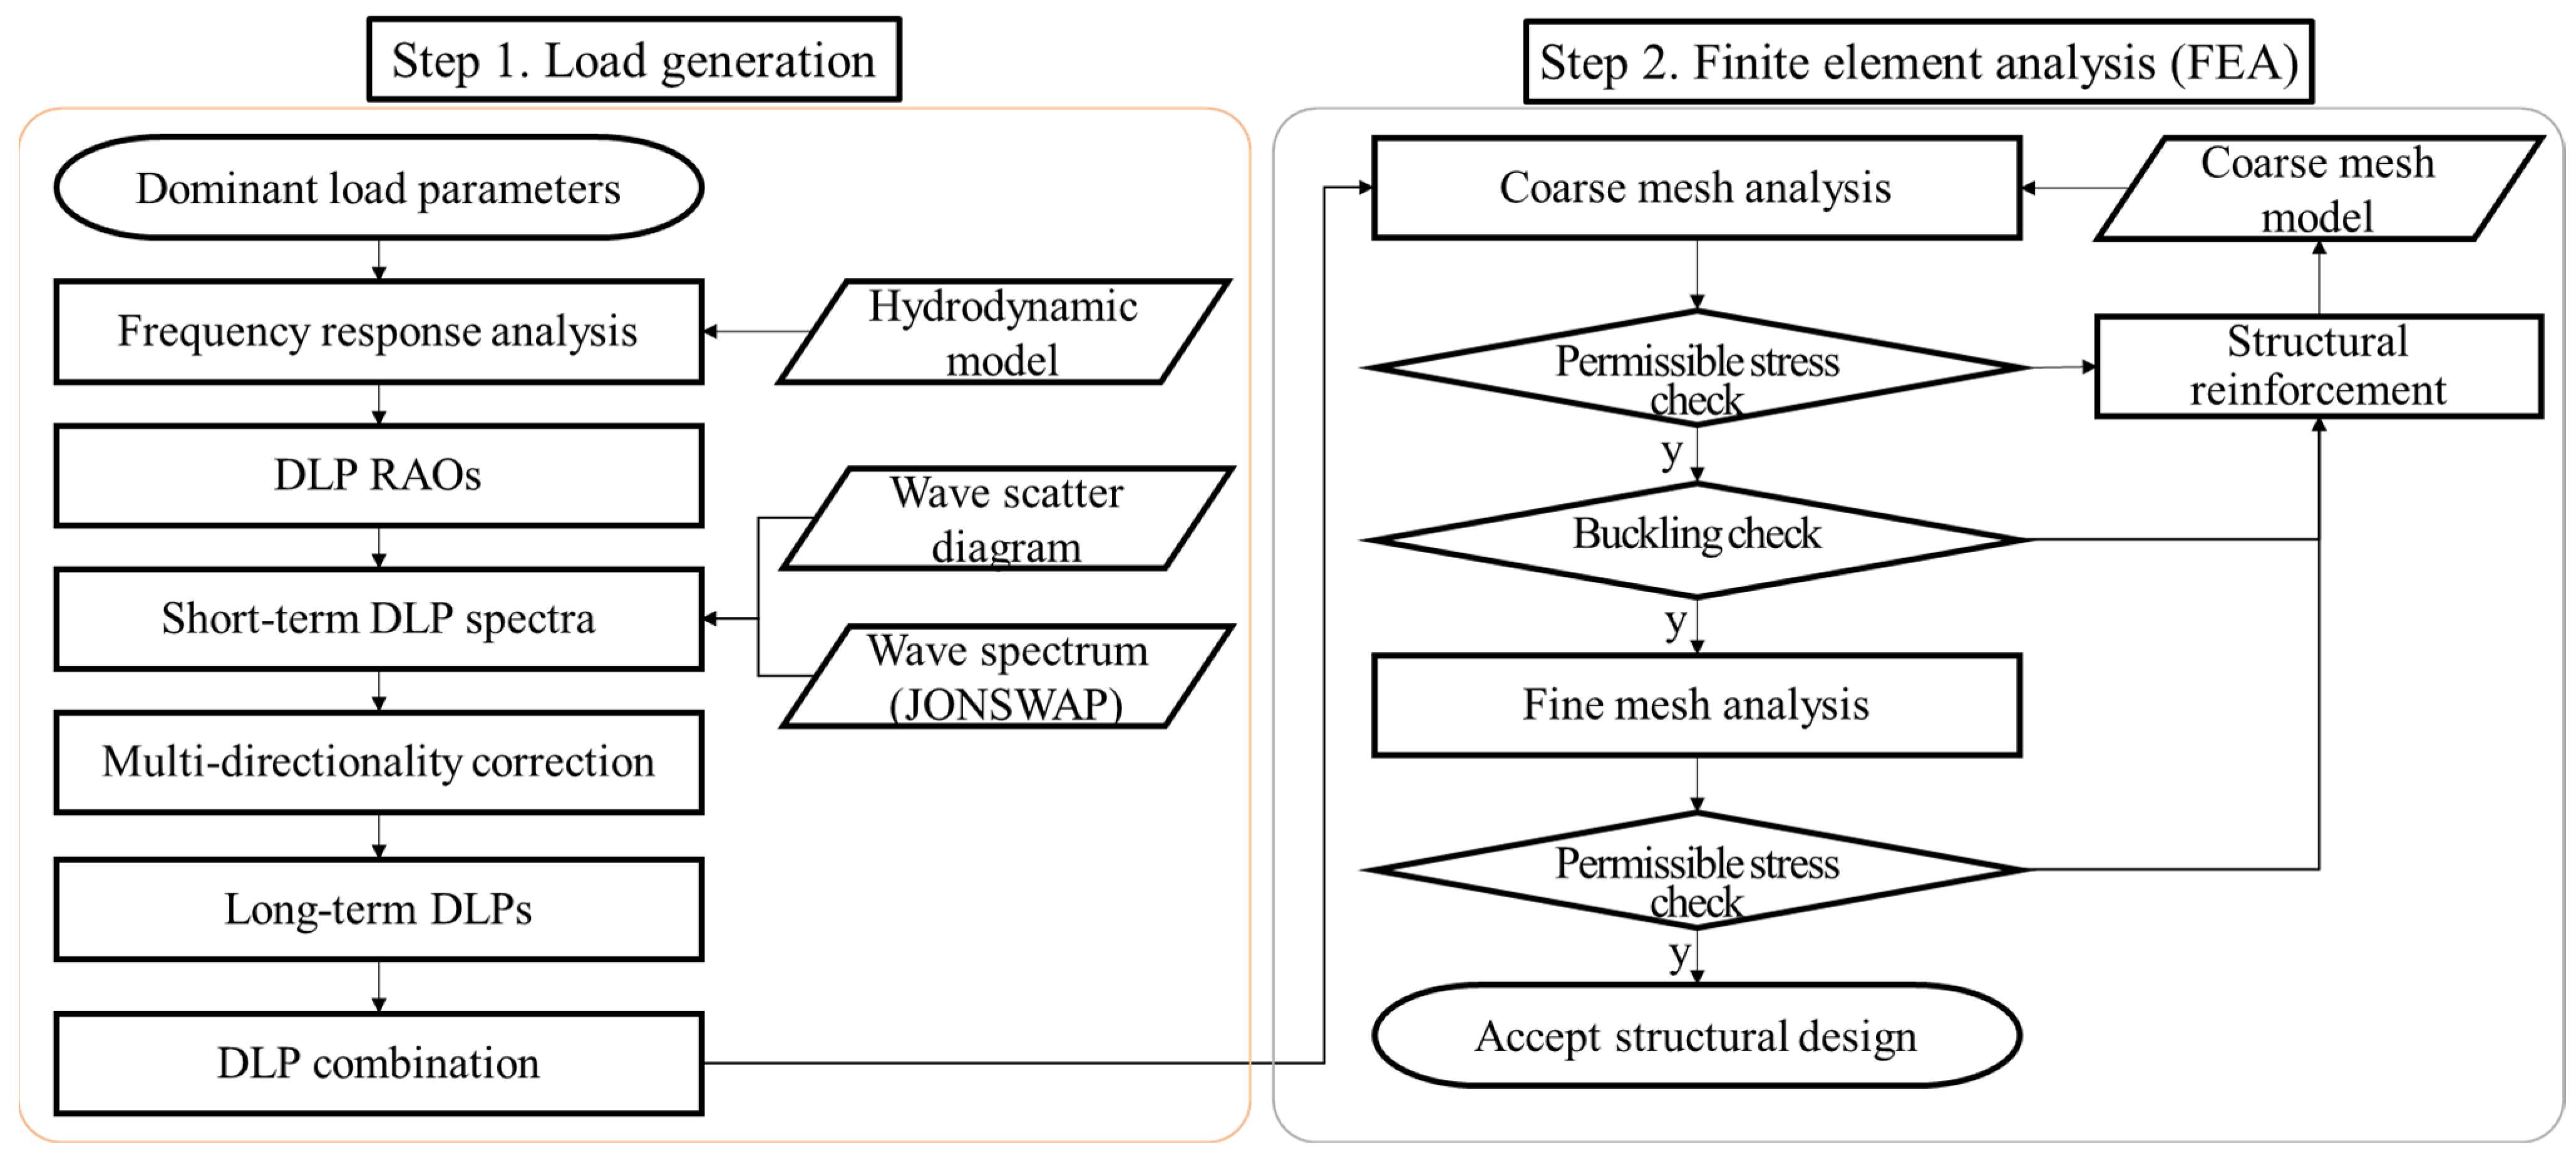
3. Technical Backgrounds for a DLP-Based Approach
3.1. Workflow of Direct Strength Analysis
3.2. Long-Term Load Assessment
4. Long-Term Loads
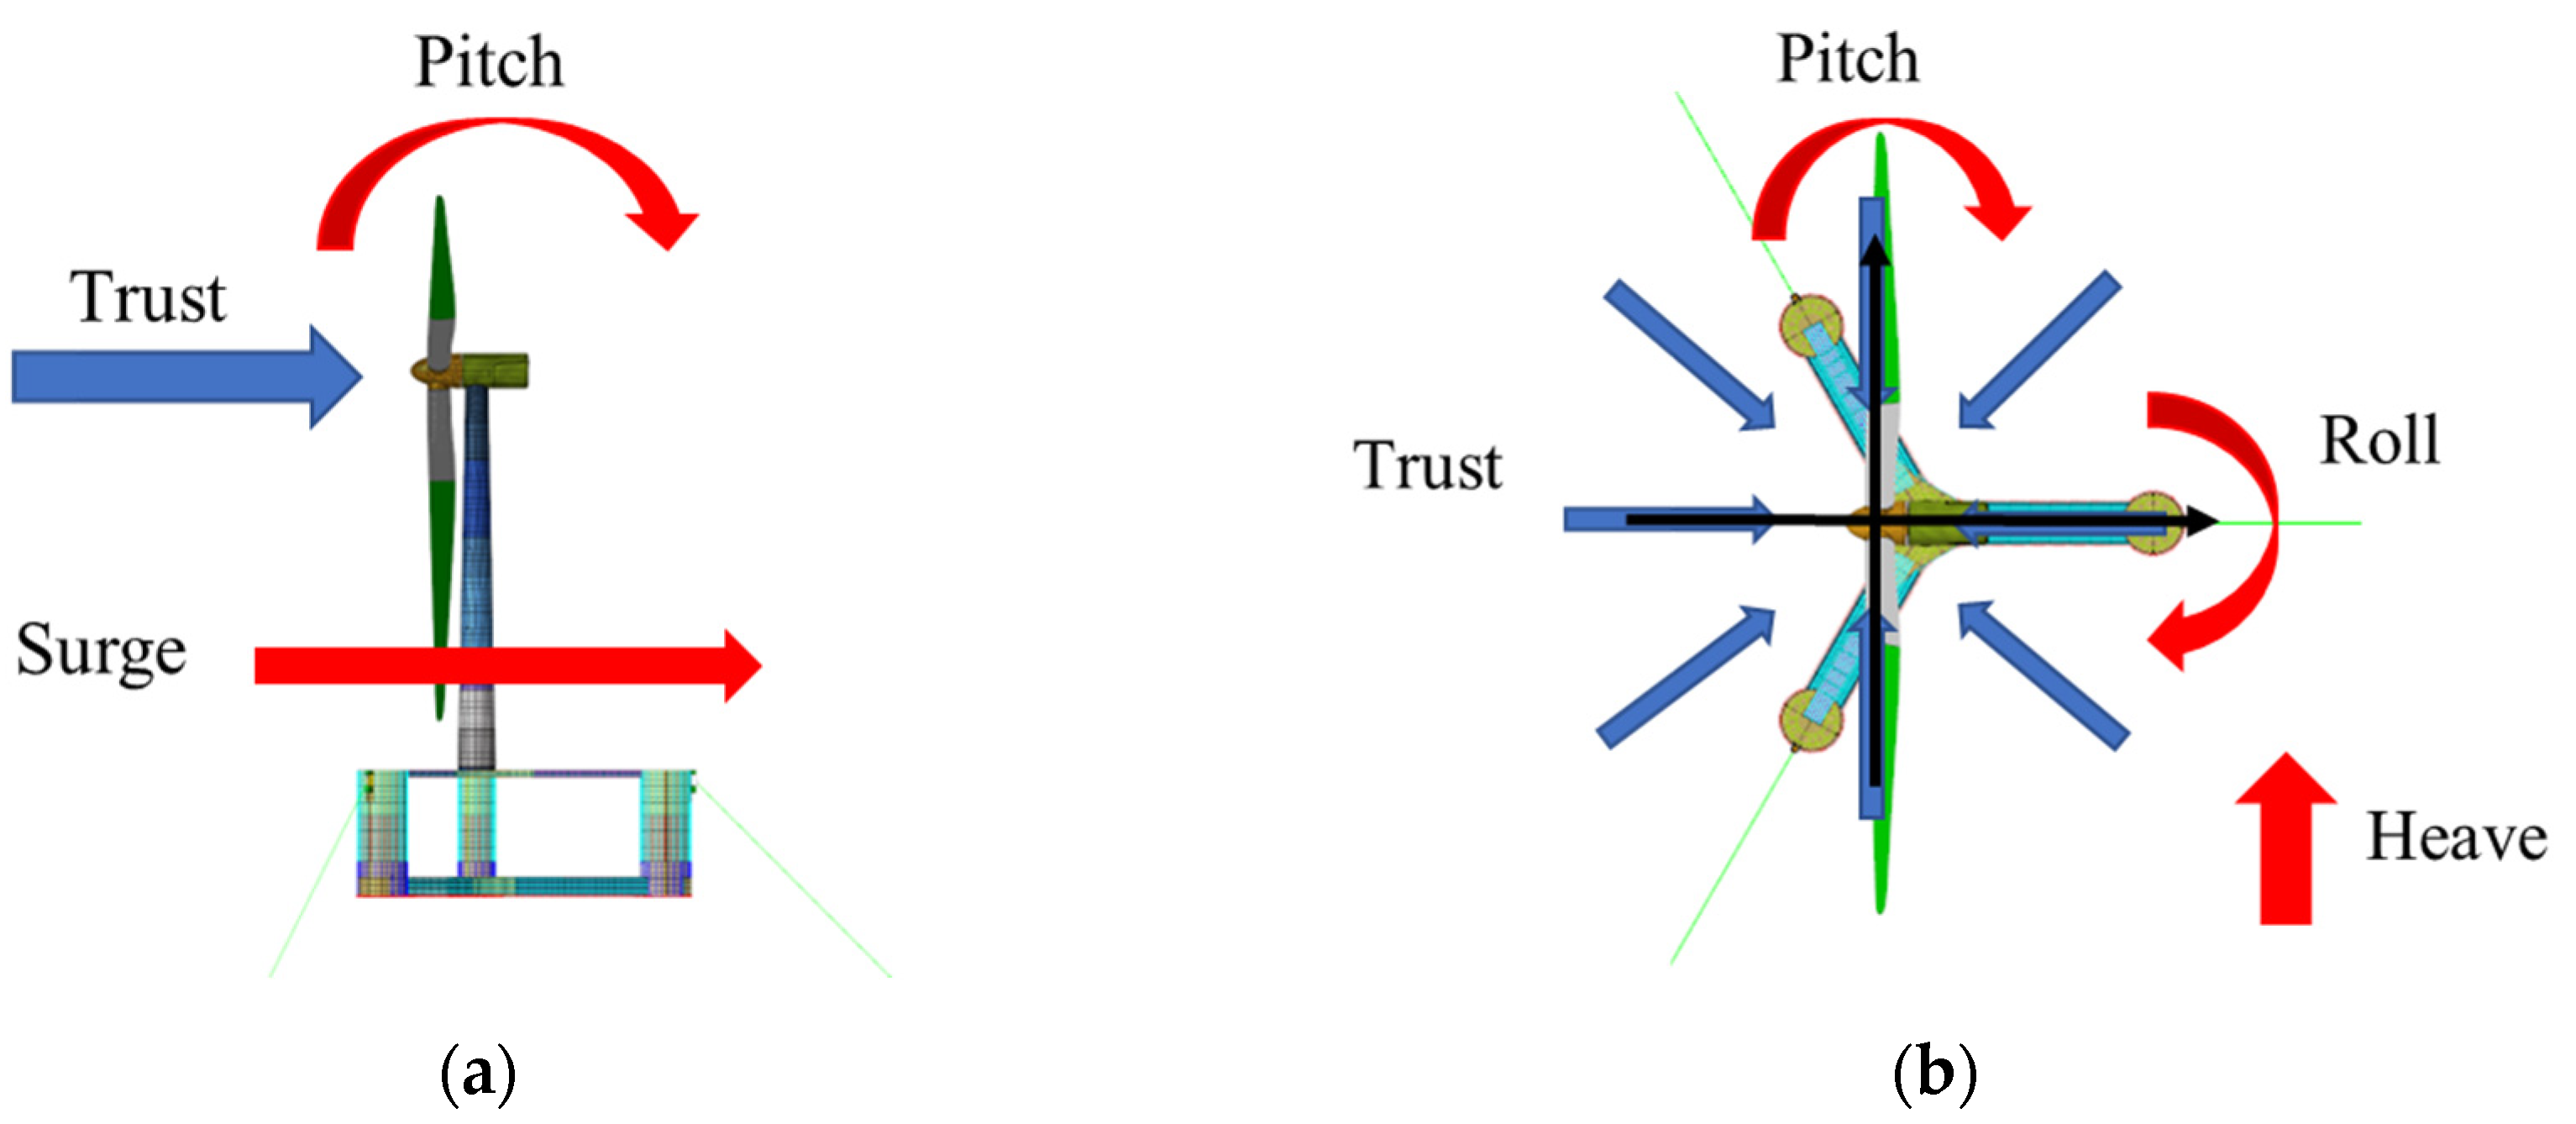
4.1. Nacelle Thrust
4.2. Acceleration
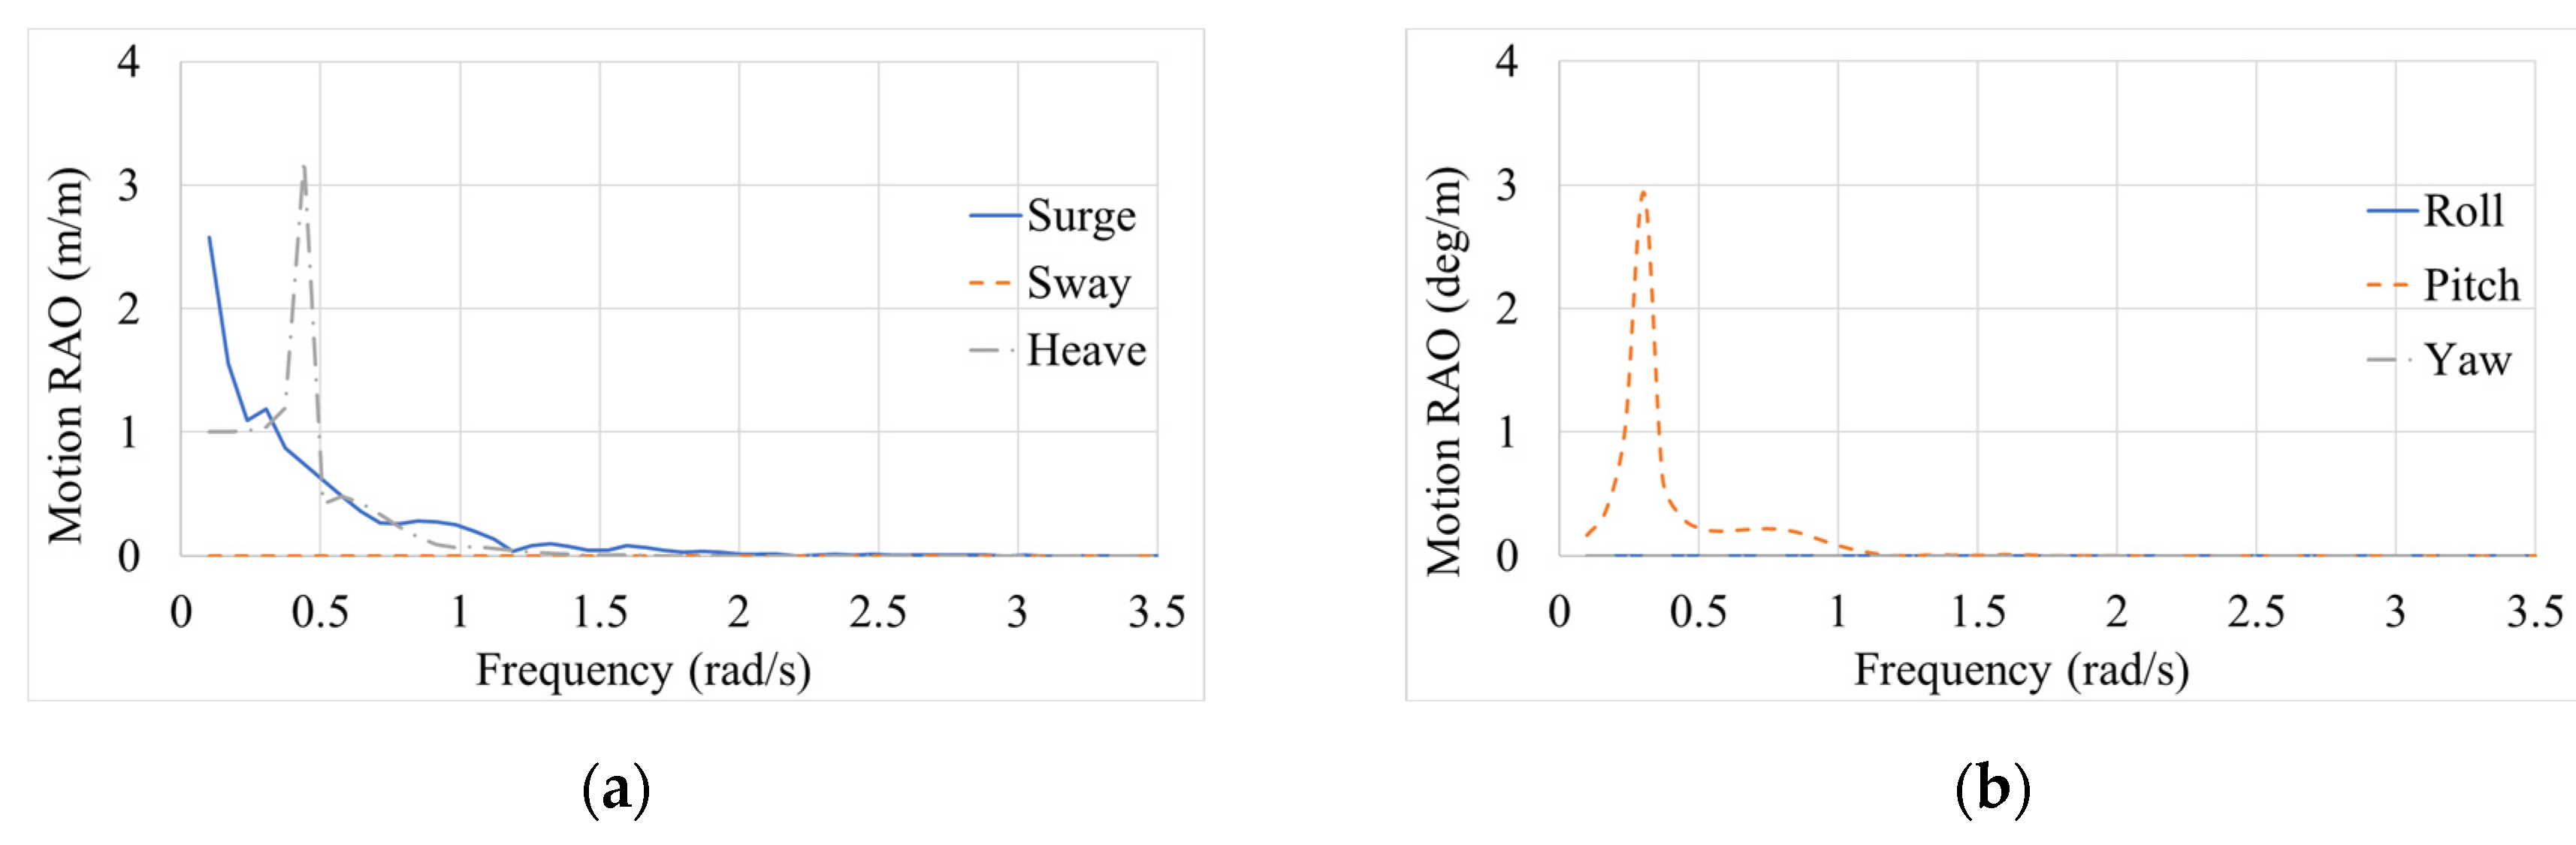
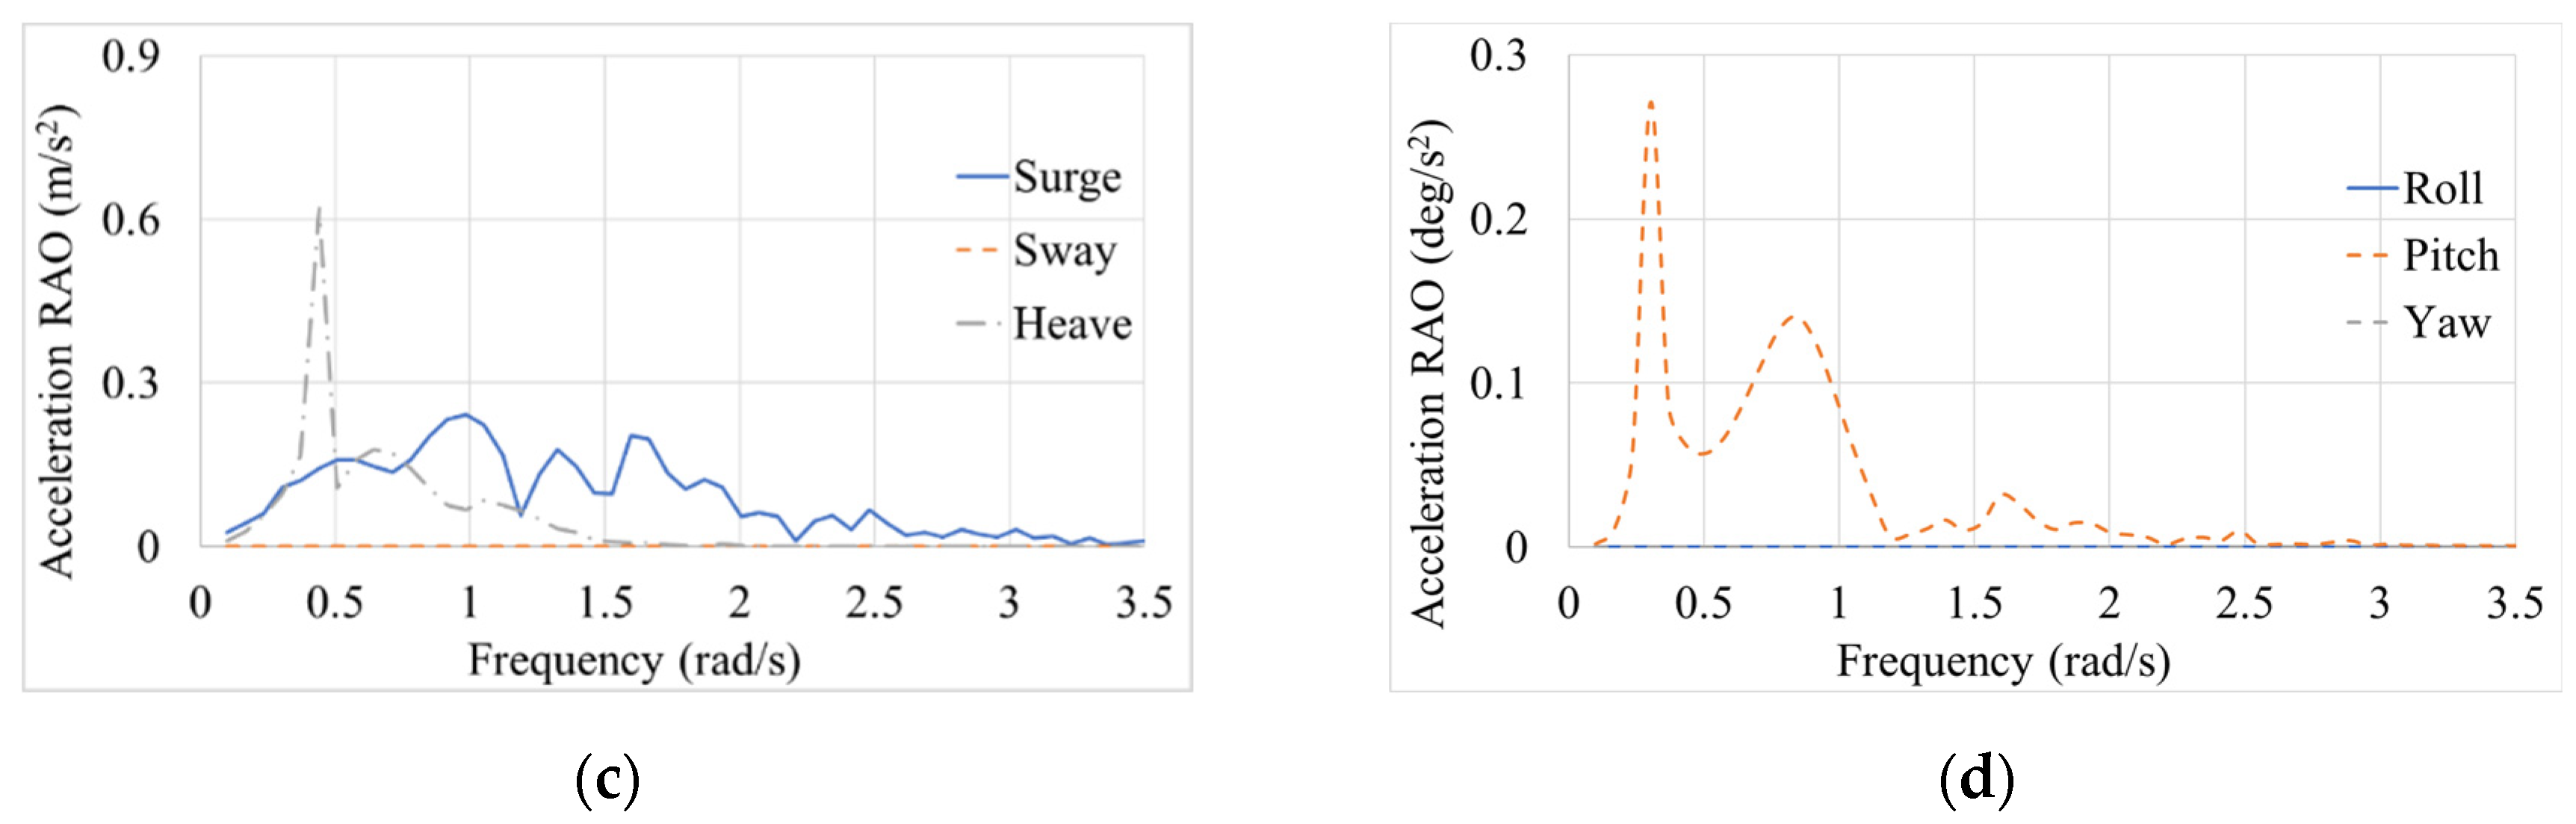
4.2.1. Acceleration RAO
4.2.2. Long-Term Prediction of Acceleration
4.3. DLP Combination
5. Finite Element Analysis
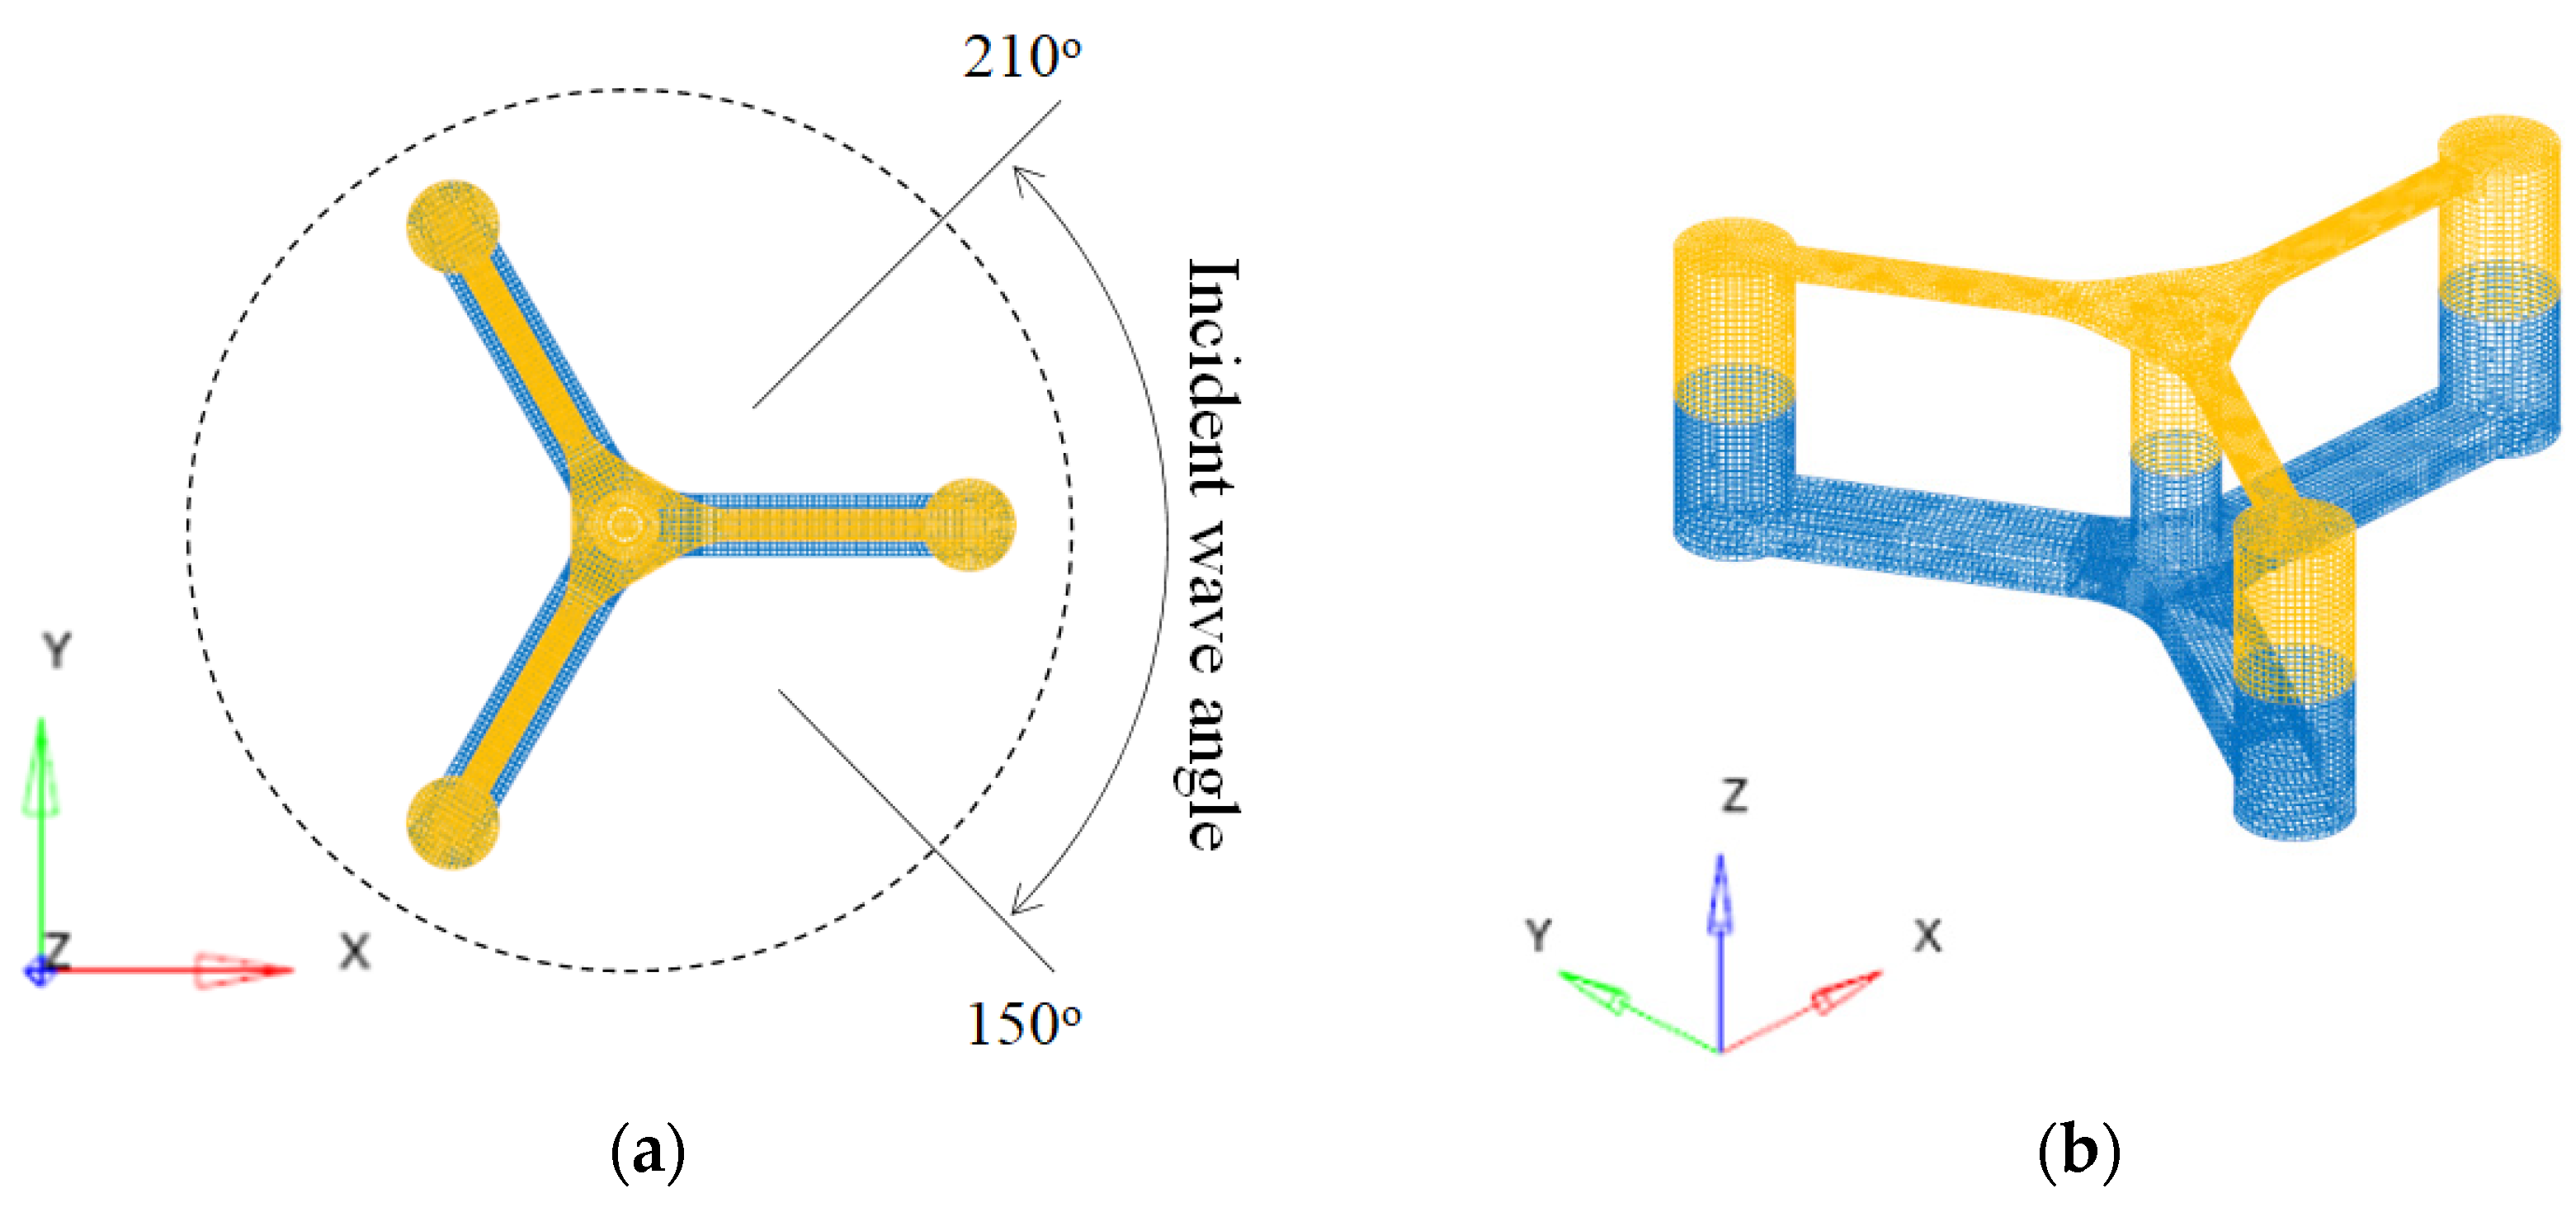
5.1. Finite Element Model
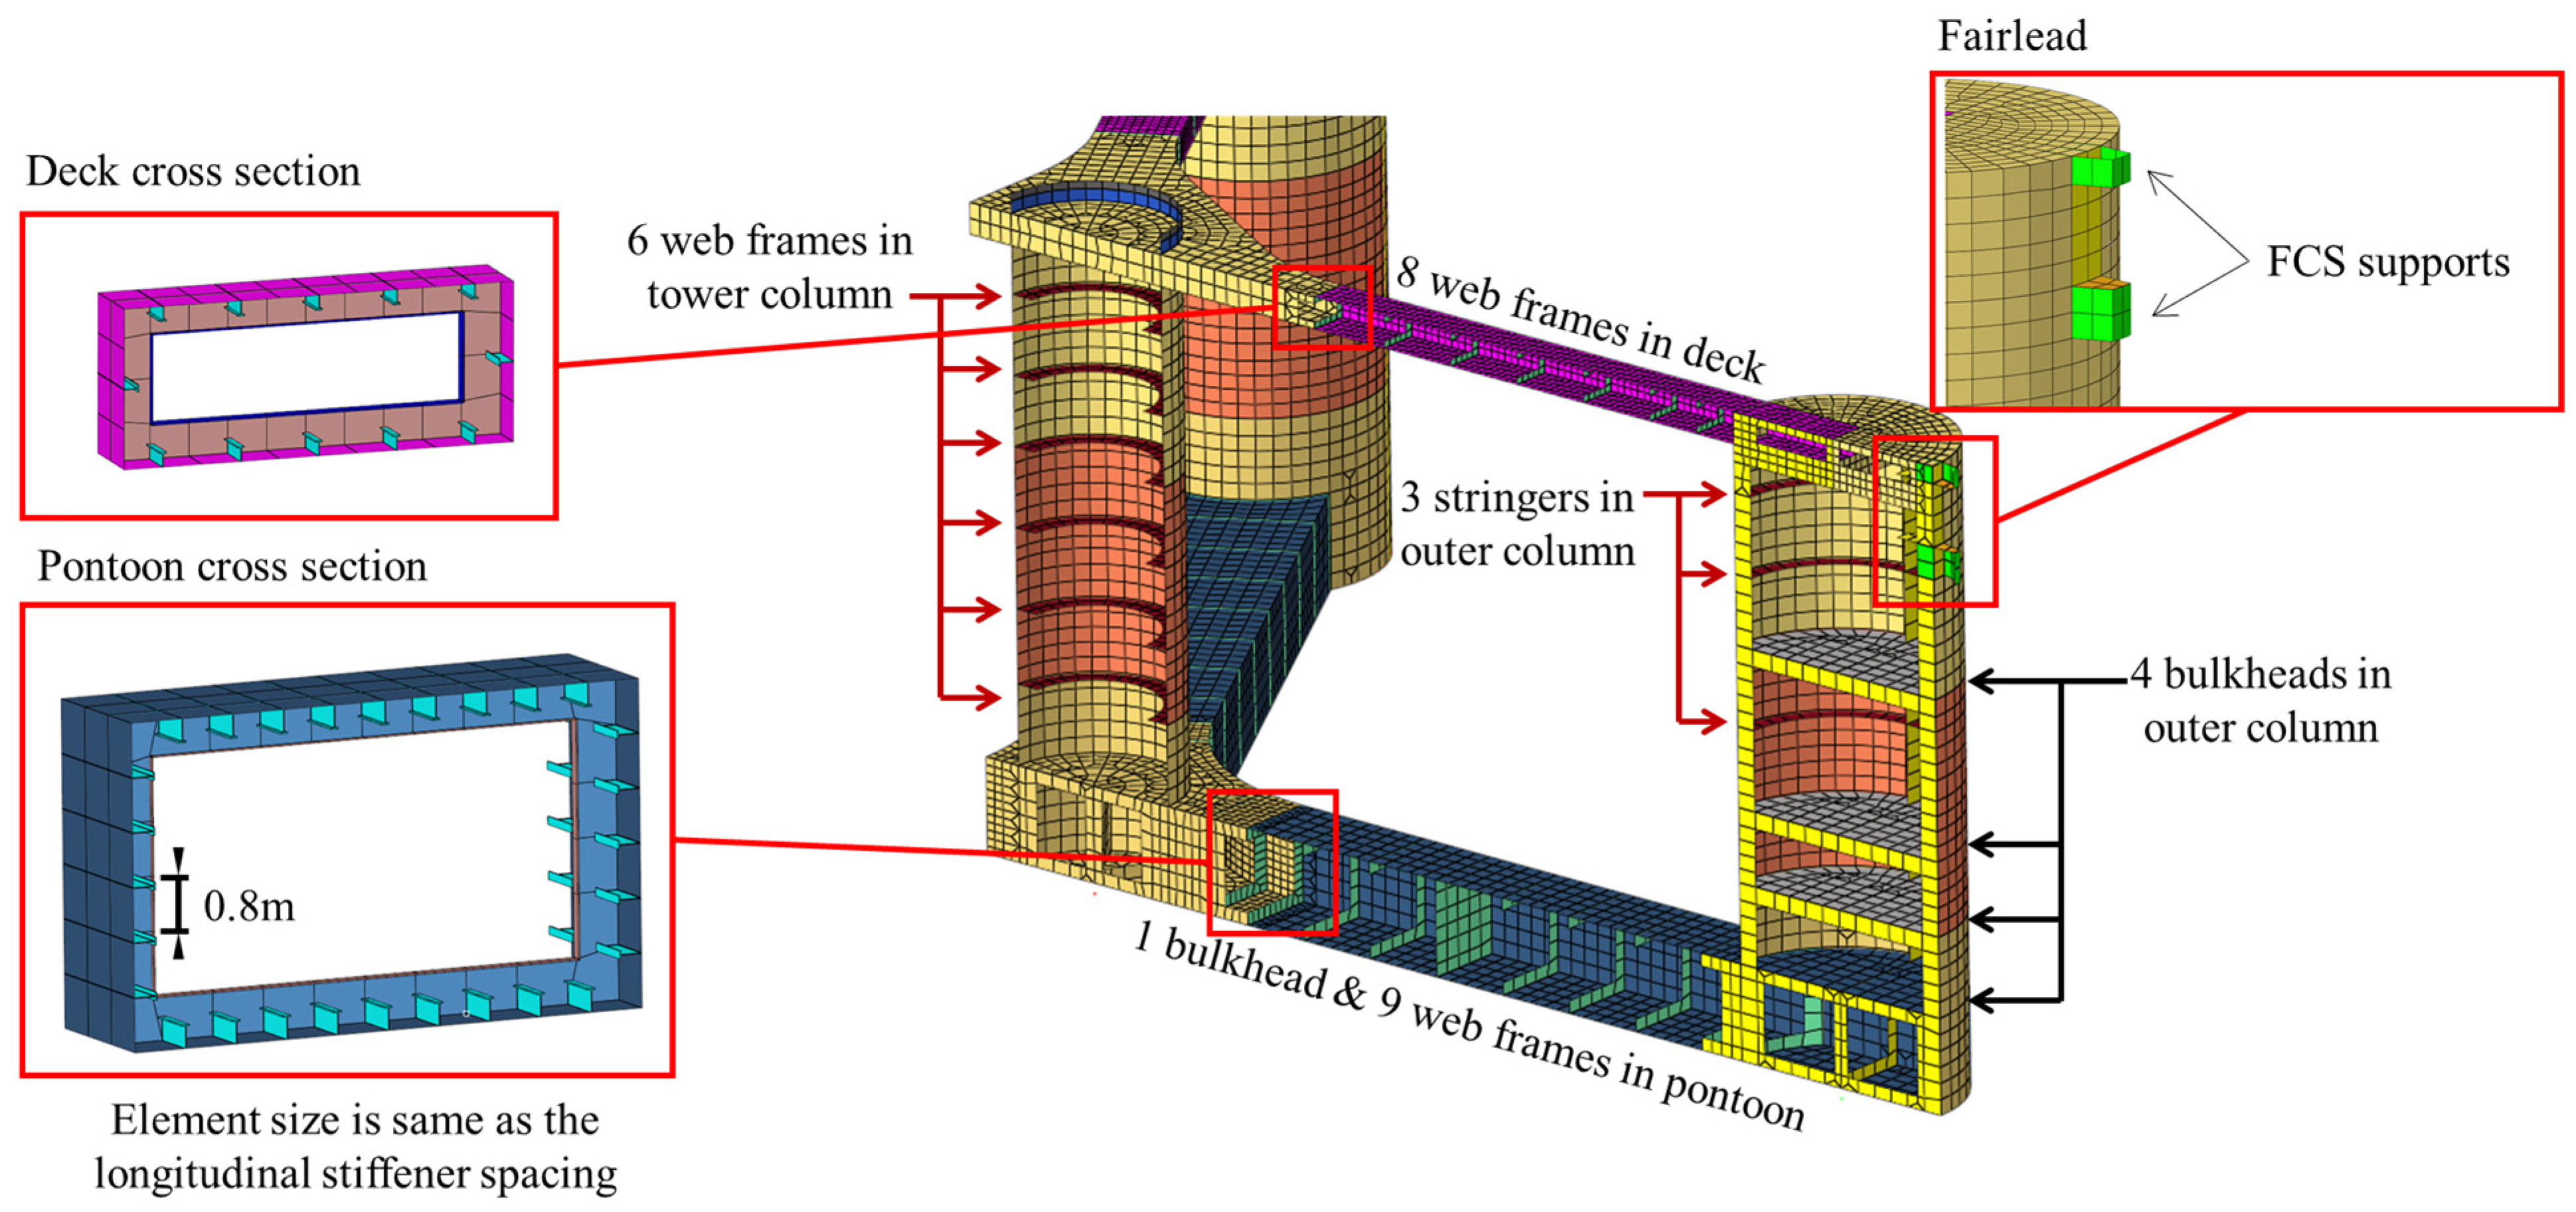
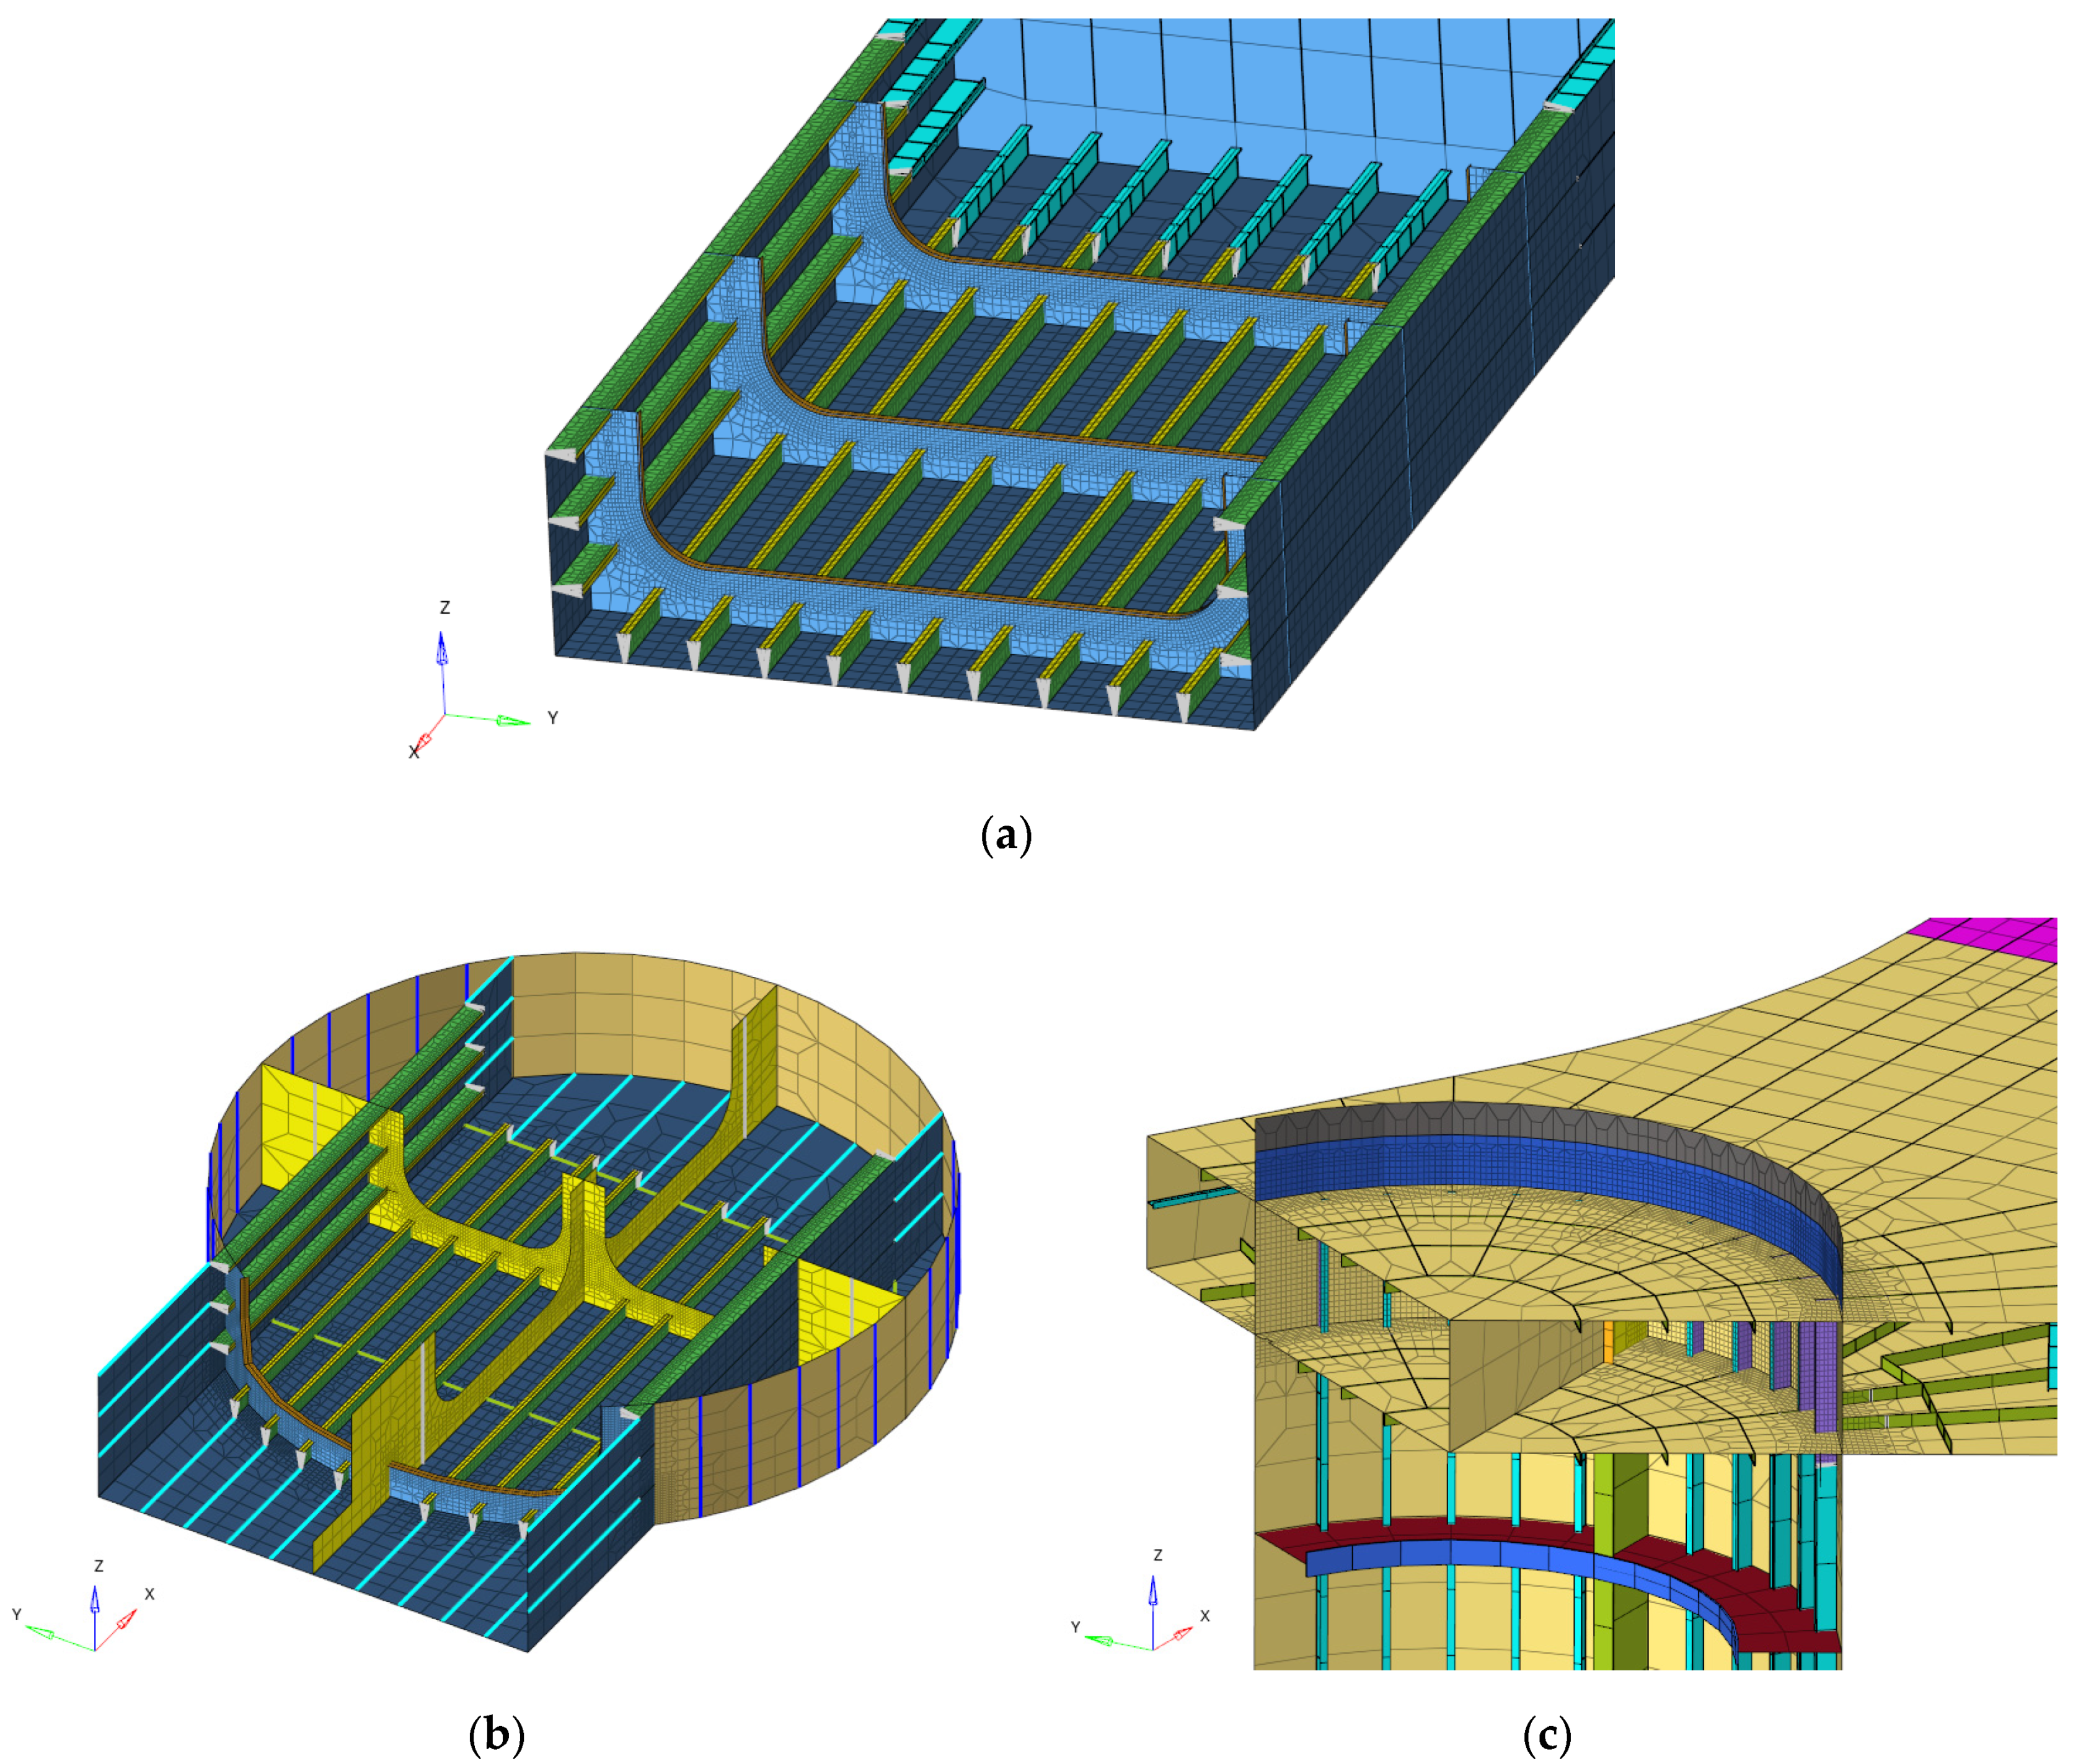
5.1.1. Geometric Modeling
5.1.2. Loading and Boundary Conditions
5.2. Permissible Stress
5.3. Coarse Mesh Analysis Results
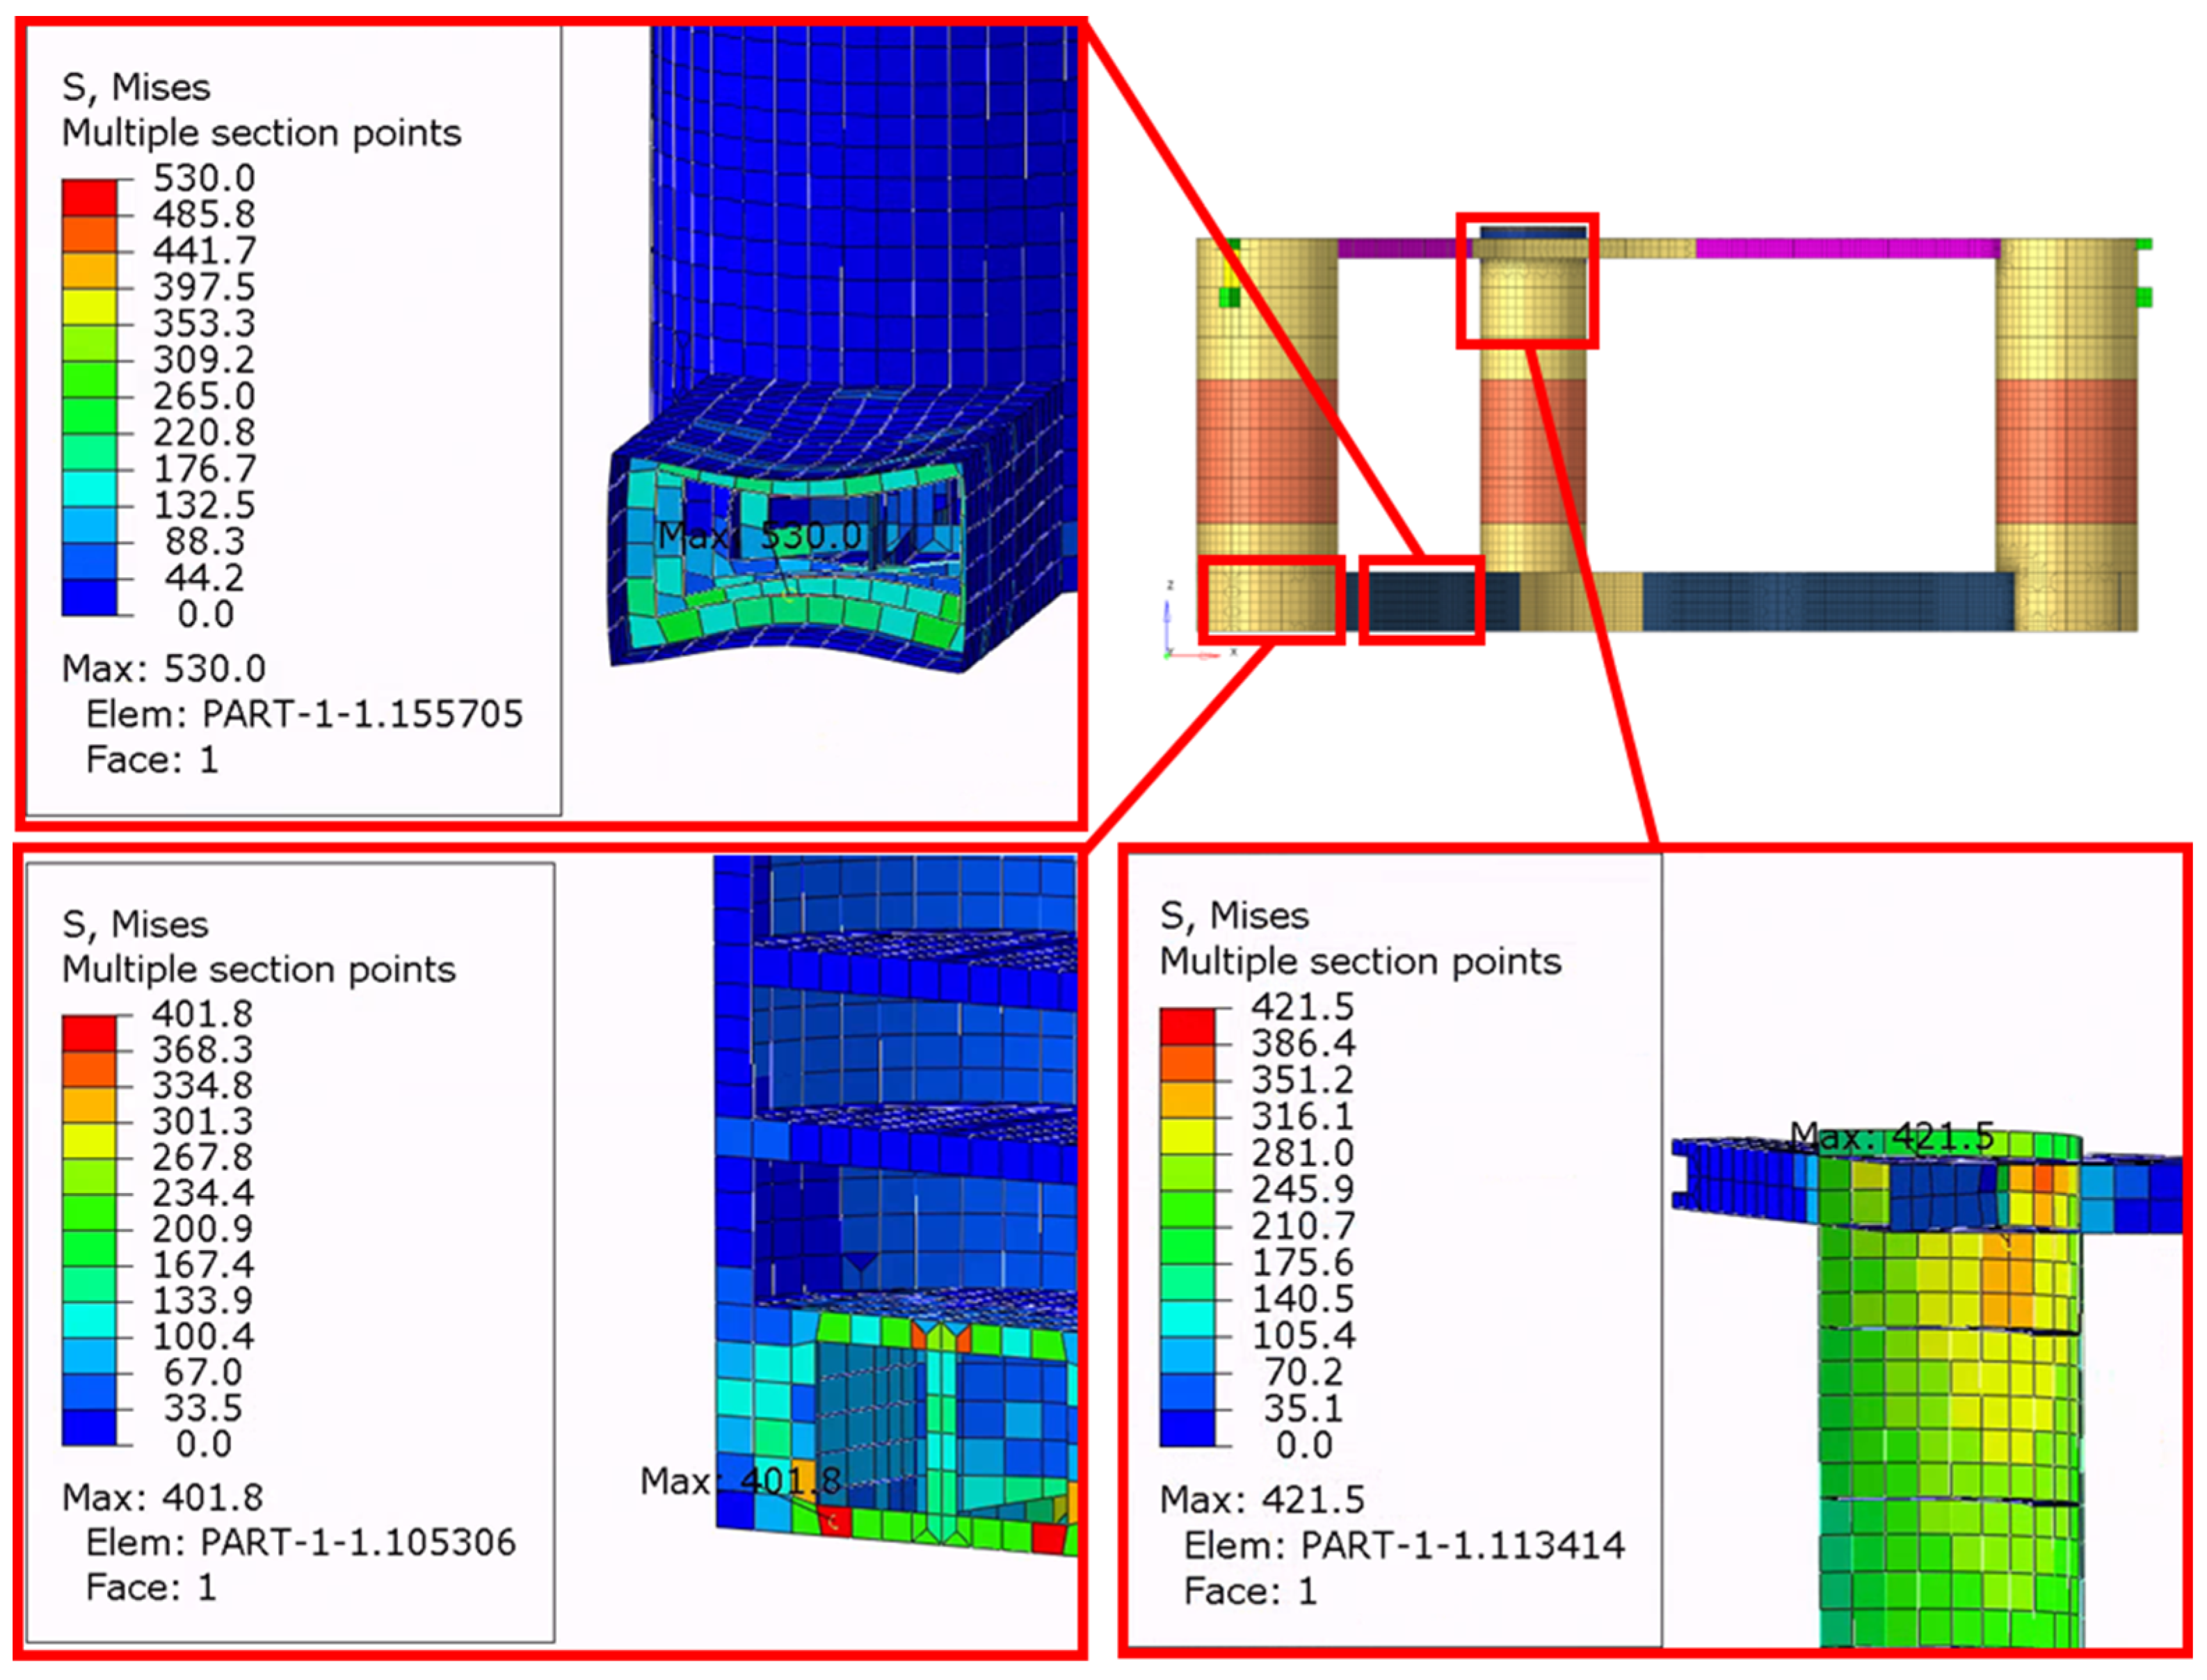
5.4. Fine Mesh Analysis Results
6. Conclusions
Author Contributions
Funding
Institutional Review Board Statement
Informed Consent Statement
Data Availability Statement
Conflicts of Interest
References
- DNV-ST-0119; Det Norske Veritas (DNV). Floating Wind Turbine Structures. DNV: Oslo, Norway, 2021.
- IEC 61400-1; International Electrotechnical Commission (IEC). Wind Energy Generation Systems—Part 1: Design Requirements. IEC: Geneva, Switzerland, 2019.
- FAST v7. Available online: https://www.nrel.gov/wind/nwtc/fastv7.html (accessed on 2 April 2023).
- OpenFAST Documentation. Available online: https://openfast.readthedocs.io/en/main/ (accessed on 2 April 2023).
- Yu, Y.; Shin, H. Response Analysis of MW-Class Floating Offshore Wind Power System using International Standard IEC61400-3-2. J. Ocean Eng. Technol. 2020, 34, 454–460. [Google Scholar] [CrossRef]
- Kim, J.; Heo, S.; Koo, W. Analysis of Dynamic Response Characteristics for 5 MW Jacket-type Fixed Offshore Wind Turbine. J. Ocean Eng. Technol. 2021, 35, 347–359. [Google Scholar] [CrossRef]
- Zhao, Z.; Wang, W.; Shi, W.; Qi, S.; Li, X. Effect of floating substructure flexibility of large-volume 10 MW offshore wind turbine semi-submersible platforms on dynamic response. Ocean Eng. 2022, 259, 111934. [Google Scholar] [CrossRef]
- Ha, K.; Kim, J.-B.; Yu, Y.; Seo, H.-S. Structural Modeling and Failure Assessment of Spar-Type Substructure for 5 MW Floating Offshore Wind Turbine under Extreme Conditions in the East Sea. Energies 2021, 14, 6571. [Google Scholar] [CrossRef]
- Devin, M.C.; Mendoza, N.R.; Platt, A.; Moore, K.; Jonkman, J.; Ennis, B.L. Enabling Floating Offshore VAWT Design by Coupling OWENS and OpenFAST. Energies 2023, 16, 2462. [Google Scholar] [CrossRef]
- Owens, B.C. Offshore Wind ENergy Simulation Toolkit (OWENS; 005472MLTPL00). Sandia National Lab. (SNL-NM), Albuquerque, NM, USA. 2013. Available online: https://www.osti.gov/biblio/1399218 (accessed on 2 April 2023).
- Li, J.; Bian, J.; Ma, Y.; Jiang, Y. Impact of typhoons on floating offshore wind turbines: A case study of typhoon mangkhut. J. Mar. Sci. Eng. 2021, 9, 543. [Google Scholar] [CrossRef]
- Ahn, H.; Ha, Y.-J.; Kim, K.-H. Load Evaluation for Tower Design of Large Floating Offshore Wind Turbine System According to Wave Conditions. Energies 2023, 16, 1862. [Google Scholar] [CrossRef]
- Wamit, Inc. The State of the Art in Wave Interaction Analysis. Available online: https://www.wamit.com/ (accessed on 2 April 2023).
- Roald, L.; Jonkman, J.; Robertson, A.; Chokani, N. The Effect of Second-order Hydrodynamics on Floating Offshore Wind Turbines. Energy Procedia. 2013, 35, 253–264. [Google Scholar] [CrossRef]
- Zhang, L.; Shi, W.; Karimirad, M.; Michailides, C.; Jiang, Z. Second-order hydrodynamic effects on the response of three semisubmersible floating offshore wind turbines. Ocean. Eng. 2020, 207, 107371. [Google Scholar] [CrossRef]
- Mei, X.; Xiong, M. Effects of second-order hydrodynamics on the dynamic responses and fatigue damage of a 15 mw floating offshore wind turbine. J. Mar. Sci. Eng. 2021, 9, 1232. [Google Scholar] [CrossRef]
- Yang, Y.; Bashir, M.; Wang, J.; Yu, J.; Li, C. Performance evaluation of an integrated floating energy system based on coupled analysis. Energy Convers. Manag. 2020, 223, 113308. [Google Scholar] [CrossRef]
- Ansys. Aqwa User Manual; Technology Drive: Harrisburg, PA, USA, 2020. [Google Scholar]
- Li, J.; Shi, W.; Zhang, L.; Michailides, C.; Li, X. Wind–Wave Coupling Effect on the Dynamic Response of a Combined Wind–Wave Energy Converter. J. Mar. Sci. Eng. 2021, 9, 1101. [Google Scholar] [CrossRef]
- Chen, M.; Xiao, P.; Zhou, H.; Li, C.B.; Zhang, X. Fully Coupled Analysis of an Integrated Floating Wind-Wave Power Generation Platform in Operational Sea-States. Front. Energy Res. 2022, 10, 819. [Google Scholar] [CrossRef]
- Kim, H.; Min, E.; Heo, S.; Koo, W. Motion Analysis of A Wind-Wave Energy TLP Platform Considering Second-order Wave Forces. J. Ocean. Eng. Technol. 2022, 36, 390–402. [Google Scholar] [CrossRef]
- Marine Operations and Mooring Analysis Software—Sima. Available online: https://www.dnv.com/services/marine-operations-and-mooring-analysis-software-sima-2324 (accessed on 13 April 2023).
- Chuang, Z.; Liu, S.; Lu, Y. Influence of second order wave excitation loads on coupled response of an offshore floating wind turbine. Int. J. Nav. Archit. Ocean Eng. 2020, 12, 367–375. [Google Scholar] [CrossRef]
- Zhou, Y.; Xiao, Q.; Peyrard, C.; Pan, G. Assessing focused wave applicability on a coupled aero-hydro-mooring FOWT system using CFD approach. Ocean. Eng. 2021, 240, 109987. [Google Scholar] [CrossRef]
- Rezaeiha, A.; Micallef, D. Wake interactions of two tandem floating offshore wind turbines: CFD analysis using actuator disc model. Renew. Energy 2021, 179, 859–876. [Google Scholar] [CrossRef]
- Dong, J.; Viré, A.; Li, Z. Analysis the vortex ring state and propeller state of floating offshore wind turbines and verification of their prediction criteria by comparing with a CFD model. Renew. Energy 2022, 184, 15–25. [Google Scholar] [CrossRef]
- Clément, C.; Bozonnet, P.; Vinay, G.; Pagnier, P.; Nadal, A.B.; Réveillon, J. Evaluation of Morison approach with CFD modelling on a surface-piercing cylinder towards the investigation of FOWT Hydrodynamics. Ocean. Eng. 2022, 251, 111042. [Google Scholar] [CrossRef]
- Wang, Y.; Chen, H.-C.; Koop, A.; Vaz, G. Hydrodynamic response of a FOWT semi-submersible under regular waves using CFD: Verification and validation. Ocean Eng. 2022, 258, 111742. [Google Scholar] [CrossRef]
- IEC-61400-3; International Electrotechnical Commission (IEC). Wind energy generation systems—Design requirements for offshore wind turbines. IEC: Geneva, Switzerland, 2009.
- IEC-61400-3-2; International Electrotechnical Commission (IEC). Wind energy generation system—Part 3-2: Design requirements for floating offshore wind turbines. IEC: Geneva, Switzerland, 2020.
- Lifes50+ project. Available online: https://lifes50plus.eu/ (accessed on 13 April 2023).
- Allen, C.; Viscelli, A.; Dagher, H.; Goupee, A.; Gaertner, E.; Abbas, N.; Hall, M.; Barter, G. Definition of the UMaine VolturnUS-S Reference Platform Developed for the IEA Wind 15-Megawatt Offshore Reference Wind Turbine; National Renewable Energy Lab. (NREL): Golden, CO, USA, 2020. [Google Scholar]
- Mahfouz, Y.; Salari, M.; Vigara, F.; Hernandez, S.; Molins, C.; Trubat, P.; Bredmose, H.; Pegalajar-Jurado, A. D1.3. Public Design and FAST Models of the Two 15MW Floater-Turbine Concepts. CoreWind Project. 2020. Available online: https://doi.org/10.5281/zenodo.4385727 (accessed on 13 April 2023).
- Balli, E.; Zheng, Y. Pseudo-coupled approach to fatigue assessment for semi-submersible type floating offshore wind turbines. Ocean Eng. 2020, 261, 112119. [Google Scholar] [CrossRef]
- Lamei, A.; Hayatdavoodi, M. On motion analysis and elastic response of floating offshore wind turbines. J. Ocean Eng. Technol. Mar. Energy. 2020, 6, 71–90. [Google Scholar] [CrossRef]
- Jang, B.S.; Kim, J.D.; Park, T.-Y.; Jeon, S.B. FEA based optimization of semi-submersible floater considering buckling and yield strength. Int. J. Nav. Archit. Ocean Eng. 2019, 11, 82–96. [Google Scholar] [CrossRef]
- Reyes-Casimiro, M.; Félix-González, I.; Perea, T. Optimization of a production semi-submersible hull configuration system based on the hydrodynamic response for a location in Mexican waters of the Gulf of Mexico. Mar. Struct. 2022, 83, 103176. [Google Scholar] [CrossRef]
- Bak, C.; Zahle, F.; Bitsche, R.; Kim, T.; Yde, A.; Henriksen, L.C.; Natarajan, A.; Hansen, M.H. Description of the DTU 10 MW Reference Wind Turbine; DTU Wind Energy Report-I-0092; DTU Wind Energy: Roskilde, Denmark, 2013. [Google Scholar]
- DNV-RU-SHIP Pt.3 Ch.4; Det Norske Veritas (DNV). Loads. DNV: Oslo, Norway, 2022.
- DNV-RP-C205; Det Norske Veritas (DNV). Environmental Conditions and Environmental Loads. DNV: Oslo, Norway, 2010.
- DNV-CG-0130; Det Norske Veritas (DNV). Wave Loads. DNV: Oslo, Norway, 2018.
- DNV-OS-C102; Det Norske Veritas (DNV). Structural Design of Offshore Ship-Shaped and Cylindrical Units. DNV: Oslo, Norway, 2021.
- DNV-RU-SHIP Pt.3 Ch.7; Det Norske Veritas (DNV). Finite Element Analysis. DNV: Oslo, Norway, 2021.
- Simulia. Abaqus User Manual; Abaqus: Vélizy-Villacoublay, France, 2020. [Google Scholar]
- IACS. Common Structural Rules for Bulk Carriers; International Association of Classification Societies: London, UK, 2023. [Google Scholar]


| Variables | Value | Case |
|---|---|---|
| Wind direction (degree) | −30, 0, +30 | 3 |
| Wave direction (degree) | −30, 0, +30 | 3 |
| Current direction (degree) | −30, 0, +30 | 3 |
| Yaw misalignment angle | −180 to 150 (30° interval) | 12 |
| Wind speed | 1 extreme wind speed | 1 |
| Sea state | Min 3 extreme sea states | 3 |
| Phases | 6 | |
| The number of subDLCs | aligned wind, wave, and current dir | 648 |
| misaligned wind, wave, and current dir | 5832 | |
| Entire analysis period (hour) | aligned wind, wave, and current dir | 1944 |
| misaligned wind, wave, and current dir | 17,496 | |
| Property | Unit | Value |
|---|---|---|
| Output power | MW | 10 |
| Rotor diameter | m | 178.3 |
| Tower length | m | 98.1 |
| Hub height above mean waterline | m | 119 |
| Blade mass | ton | 41.69 |
| Hub mass | ton | 105.52 |
| Nacelle mass | ton | 446.03 |
| Tower mass | ton | 654.70 |
| Total mass | ton | 1330 |
| Property | Unit | Value |
|---|---|---|
| Number of mooring lines | pcs | 3 |
| The angle between adjacent lines | deg | 120 |
| Chain diameter | mm | 147 |
| Chain grade | R5 | |
| Chain weight | ton | 474 |
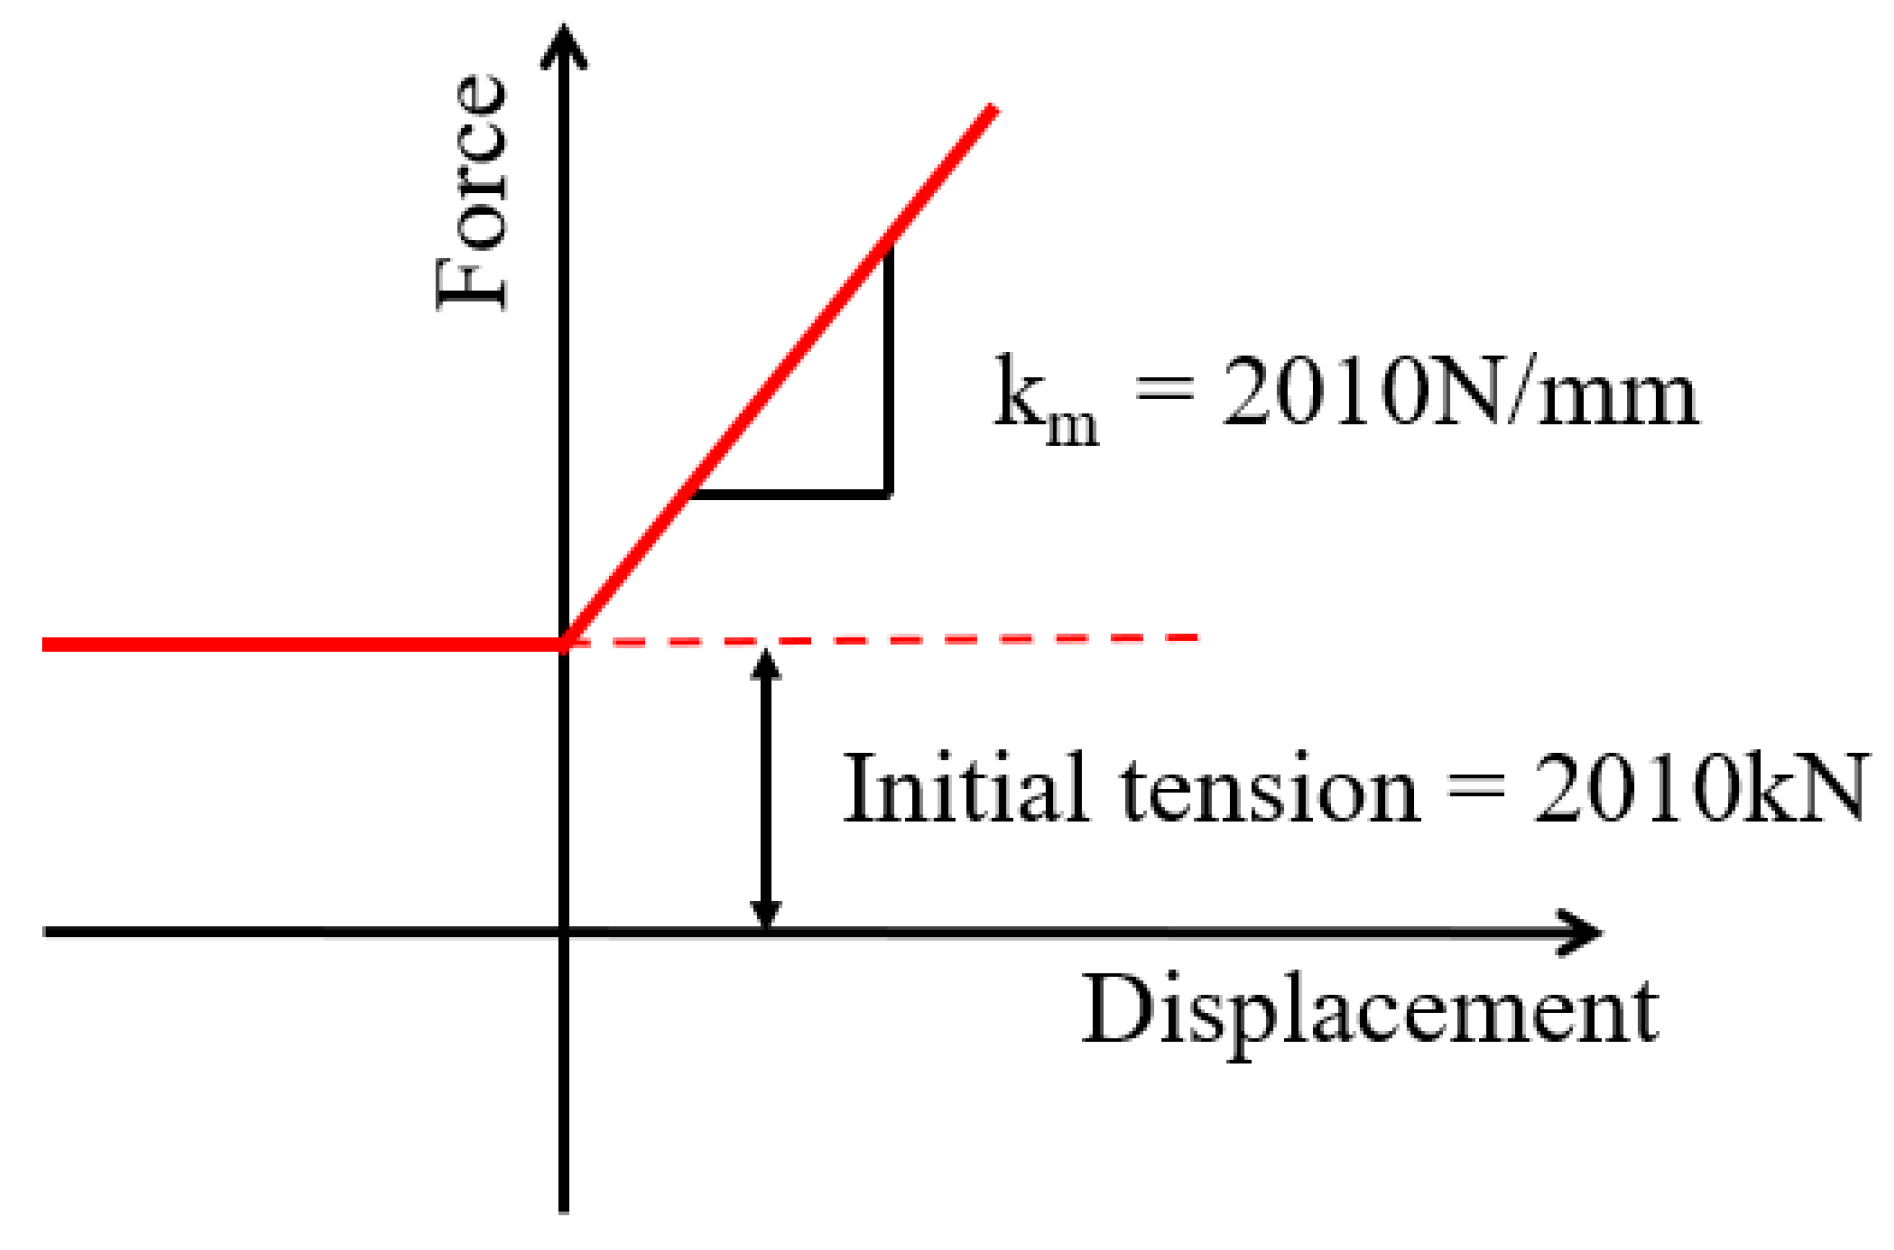
| Initial tension | N | 2.010 × 10⁶ |
| Minimum breaking load | N | 2.229 × 10⁷ |
| Water depth | m | 150 |
| Fairlead position height above mean waterline | m | 13.08 |
| Horizontal dist. from FCS to touchdown point | m | 316.45 |
| Horizontal dist. from FCS to anchor point | m | 800 |
| Unstretched mooring length | m | 850 |
| Property | Unit | Value |
|---|---|---|
| Column span | m | 45 |
| Tower column diameter | m | 9 |
| Tower column height | m | 33 |
| Outer column diameter | m | 12 |
| Outer column height | m | 32 |
| Pontoon width | m | 8 |
| Pontoon height | m | 4.8 |
| Deck width | m | 4 |
| Deck height | m | 1.6 |
| Hull steel weight | ton | 3400 |
| Ballast water weight | ton | 5185 |
| Outfitting weight | ton | 250 |
| Fairlead chain stopper weight | ton | 89 |
| Draft | m | 15.5 |
| Property | Unit | Target |
|---|---|---|
| Mass | ton | 10,254 |
| IXX wrt CoM | ton-mm2 | 1.954 × 10¹³ |
| IYY wrt CoM | ton-mm2 | 1.948 × 10¹³ |
| IZZ wrt CoM | ton-mm2 | 1.273 × 10¹³ |
| CoM from mean waterline | m | (−0.94, 0, 4.19) |
| Item | Value |
|---|---|
| Original mass (ton) | 10,727.96 |
| Element-based displacement (ton) | 10,717.20 |
| Error (%) | −0.10 |
| Tp (s) | Prob. (%) | ||||||||||||||||||||||
|---|---|---|---|---|---|---|---|---|---|---|---|---|---|---|---|---|---|---|---|---|---|---|---|
| 0.5 | 1.5 | 2.5 | 3.5 | 4.5 | 5.5 | 6.5 | 7.5 | 8.5 | 9.5 | 10.5 | 11.5 | 12.5 | 13.5 | 14.5 | 15.5 | 16.5 | 17.5 | 18.5 | 19.5 | Sum | |||
| Hs (m) | 0.5 | 0 | 7 | 1923 | 4811 | 5136 | 3357 | 1838 | 702 | 214 | 107 | 37 | 8 | 8 | 3 | 7 | 1 | 0 | 0 | 1 | 1 | 18161 | 22.76 |
| 1 | 0 | 0 | 261 | 3844 | 6040 | 6328 | 6408 | 3074 | 1139 | 469 | 171 | 33 | 14 | 20 | 6 | 4 | 5 | 4 | 2 | 0 | 27822 | 34.87 | |
| 1.5 | 0 | 0 | 0 | 232 | 1513 | 2830 | 4977 | 4271 | 1439 | 621 | 265 | 48 | 7 | 7 | 4 | 3 | 4 | 3 | 5 | 0 | 16229 | 20.34 | |
| 2 | 0 | 0 | 0 | 2 | 105 | 704 | 2014 | 3536 | 1812 | 565 | 218 | 37 | 15 | 3 | 2 | 1 | 0 | 1 | 0 | 0 | 9015 | 11.30 | |
| 2.5 | 0 | 0 | 0 | 0 | 3 | 69 | 474 | 1378 | 1589 | 725 | 315 | 63 | 26 | 2 | 2 | 0 | 1 | 0 | 0 | 0 | 4647 | 5.82 | |
| 3 | 0 | 0 | 0 | 0 | 0 | 5 | 112 | 418 | 732 | 586 | 245 | 109 | 43 | 0 | 1 | 0 | 1 | 0 | 0 | 0 | 2252 | 2.82 | |
| 3.5 | 0 | 0 | 0 | 0 | 0 | 0 | 22 | 113 | 229 | 271 | 161 | 67 | 40 | 8 | 1 | 0 | 0 | 0 | 0 | 0 | 912 | 1.14 | |
| 4 | 0 | 0 | 0 | 0 | 0 | 0 | 2 | 42 | 105 | 123 | 84 | 30 | 35 | 7 | 0 | 0 | 0 | 0 | 0 | 0 | 428 | 0.54 | |
| 4.5 | 0 | 0 | 0 | 0 | 0 | 0 | 0 | 7 | 47 | 59 | 33 | 12 | 25 | 1 | 0 | 0 | 0 | 0 | 0 | 0 | 184 | 0.23 | |
| 5 | 0 | 0 | 0 | 0 | 0 | 0 | 0 | 1 | 19 | 26 | 27 | 6 | 4 | 0 | 0 | 0 | 0 | 0 | 0 | 0 | 83 | 0.10 | |
| 5.5 | 0 | 0 | 0 | 0 | 0 | 0 | 0 | 0 | 4 | 6 | 8 | 7 | 1 | 1 | 0 | 0 | 0 | 0 | 0 | 0 | 27 | 0.03 | |
| 6 | 0 | 0 | 0 | 0 | 0 | 0 | 0 | 0 | 0 | 0 | 6 | 3 | 0 | 0 | 0 | 0 | 0 | 0 | 0 | 0 | 9 | 0.01 | |
| 6.5 | 0 | 0 | 0 | 0 | 0 | 0 | 0 | 0 | 0 | 0 | 0 | 6 | 3 | 0 | 0 | 0 | 0 | 0 | 0 | 0 | 9 | 0.01 | |
| 7 | 0 | 0 | 0 | 0 | 0 | 0 | 0 | 0 | 0 | 0 | 0 | 0 | 0 | 0 | 0 | 0 | 0 | 0 | 0 | 0 | 0 | 0.00 | |
| Sum | 0 | 7 | 2184 | 8889 | 12,797 | 13,293 | 15,847 | 13,542 | 7329 | 3558 | 1570 | 429 | 221 | 52 | 23 | 9 | 11 | 8 | 8 | 1 | 79,778 | 100.00 | |
| Prob. (%) | 0.00 | 0.01 | 2.74 | 11.14 | 16.04 | 16.66 | 19.86 | 16.97 | 9.19 | 4.46 | 1.97 | 0.54 | 0.28 | 0.07 | 0.03 | 0.01 | 0.01 | 0.01 | 0.01 | 0.00 | 100.00 | ||
(Year) | Surge (m/s2) | Sway (m/s2) | Heave (m/s2) | Roll (deg/s2) | Pitch (deg/s2) | Yaw (deg/s2) |
|---|---|---|---|---|---|---|
| 1 | 0.871 | 0.409 | 2.340 | 0.395 | 0.790 | 0.674 |
| 10 | 0.973 | 0.460 | 2.661 | 0.460 | 0.920 | 0.755 |
| 50 | 1.063 | 0.496 | 2.840 | 0.505 | 1.009 | 0.817 |
| 100 | 1.080 | 0.505 | 2.947 | 0.522 | 1.045 | 0.835 |
| Load Case | Acceleration | Thrust | |||||
|---|---|---|---|---|---|---|---|
| Surge (m/s2) | Sway (m/s2) | Heave (m/s2) | Roll (deg/s2) | Pitch (deg/s2) | Magnitude (kN) | Direction (Degree) | |
| X1 | +1.063 | n/a | n/a | n/a | +1.009 | 2080 | 0 |
| X2 | +1.063 | n/a | n/a | n/a | −1.009 | 2080 | 0 |
| X3 | −1.063 | n/a | n/a | n/a | +1.009 | 2080 | 0 |
| X4 | −1.063 | n/a | n/a | n/a | −1.009 | 2080 | 0 |
| X5 | +1.063 | n/a | n/a | n/a | +1.009 | 2080 | 180 |
| X6 | +1.063 | n/a | n/a | n/a | −1.009 | 2080 | 180 |
| X7 | −1.063 | n/a | n/a | n/a | +1.009 | 2080 | 180 |
| X8 | −1.063 | n/a | n/a | n/a | −1.009 | 2080 | 180 |
| Load Case | Acceleration | Thrust | |||||
|---|---|---|---|---|---|---|---|
| Surge (m/s2) | Sway (m/s2) | Heave (m/s2) | Roll (deg/s2) | Pitch (deg/s2) | Magnitude (kN) | Direction (Degree) | |
| Y1 | n/a | +0.496 | n/a | +0.505 | n/a | 2080 | 90 |
| Y2 | n/a | +0.496 | n/a | −0.505 | n/a | 2080 | 90 |
| Y3 | n/a | −0.496 | n/a | +0.505 | n/a | 2080 | 90 |
| Y4 | n/a | −0.496 | n/a | −0.505 | n/a | 2080 | 90 |
| Y5 | n/a | +0.496 | n/a | +0.505 | n/a | 2080 | 270 |
| Y6 | n/a | +0.496 | n/a | −0.505 | n/a | 2080 | 270 |
| Y7 | n/a | −0.496 | n/a | +0.505 | n/a | 2080 | 270 |
| Y8 | n/a | −0.496 | n/a | −0.505 | n/a | 2080 | 270 |
| Load Case | Acceleration | Thrust | |||||
|---|---|---|---|---|---|---|---|
| Surge (m/s2) | Sway (m/s2) | Heave (m/s2) | Roll (deg/s2) | Pitch (deg/s2) | Magnitude (kN) | Direction (degree) | |
| Z1-1 | n/a | n/a | +2.840 | +0.505 | +1.009 | 2080 | 0 |
| Z1-2 | n/a | n/a | +2.840 | +0.505 | +1.009 | 2080 | 45 |
| Z1-3 | n/a | n/a | +2.840 | +0.505 | +1.009 | 2080 | 90 |
| Z1-4 | n/a | n/a | +2.840 | +0.505 | +1.009 | 2080 | 135 |
| Z1-5 | n/a | n/a | +2.840 | +0.505 | +1.009 | 2080 | 180 |
| Z1-6 | n/a | n/a | +2.840 | +0.505 | +1.009 | 2080 | 225 |
| Z1-7 | n/a | n/a | +2.840 | +0.505 | +1.009 | 2080 | 270 |
| Z1-8 | n/a | n/a | +2.840 | +0.505 | +1.009 | 2080 | 315 |
| Z2-1~Z2-8 | n/a | n/a | +2.840 | +0.505 | −1.009 | 2080 | 8 directions |
| Z3-1~Z3-8 | n/a | n/a | +2.840 | −0.505 | +1.009 | 2080 | 8 directions |
| Z4-1~Z4-8 | n/a | n/a | +2.840 | −0.505 | −1.009 | 2080 | 8 directions |
| Z5-1~Z5-8 | n/a | n/a | −2.840 | +0.505 | +1.009 | 2080 | 8 directions |
| Z6-1~Z6-8 | n/a | n/a | −2.840 | +0.505 | −1.009 | 2080 | 8 directions |
| Z7-1~Z7-8 | n/a | n/a | −2.840 | −0.505 | +1.009 | 2080 | 8 directions |
| Z8-1~Z8-8 | n/a | n/a | −2.840 | −0.505 | −1.009 | 2080 | 8 directions |
| Item | Value |
|---|---|
| The number of shell elements | 30,610 |
| The number of beam elements | 19,092 |
| Model | Permissible Stress (MPa) |
|---|---|
| Coarse mesh | 355.0 |
| Fine mesh (adjacent to weld) | 532.5 |
| Location | Load Case | Maximum Stress (MPa) | Permissible Stress (MPa) | Result |
|---|---|---|---|---|
| Face plates of web frame in pontoon | Z1-5 | 441.8 | 532.5 | Pass |
| Web frame in outer column | X3 | 889.5 | 532.5 | Fail |
| Tower interface | X8 | 723.6 | 532.5 | Fail |
Disclaimer/Publisher’s Note: The statements, opinions and data contained in all publications are solely those of the individual author(s) and contributor(s) and not of MDPI and/or the editor(s). MDPI and/or the editor(s) disclaim responsibility for any injury to people or property resulting from any ideas, methods, instructions or products referred to in the content. |
© 2023 by the authors. Licensee MDPI, Basel, Switzerland. This article is an open access article distributed under the terms and conditions of the Creative Commons Attribution (CC BY) license (https://creativecommons.org/licenses/by/4.0/).
Share and Cite
Park, S.; Choung, J. Structural Design of the Substructure of a 10 MW Floating Offshore Wind Turbine System Using Dominant Load Parameters. J. Mar. Sci. Eng. 2023, 11, 1048. https://doi.org/10.3390/jmse11051048
Park S, Choung J. Structural Design of the Substructure of a 10 MW Floating Offshore Wind Turbine System Using Dominant Load Parameters. Journal of Marine Science and Engineering. 2023; 11(5):1048. https://doi.org/10.3390/jmse11051048
Chicago/Turabian StylePark, Sungjun, and Joonmo Choung. 2023. "Structural Design of the Substructure of a 10 MW Floating Offshore Wind Turbine System Using Dominant Load Parameters" Journal of Marine Science and Engineering 11, no. 5: 1048. https://doi.org/10.3390/jmse11051048