
Improved UNet-Based Shoreline Detection Method in Real Time for Unmanned Surface Vehicle

Abstract
:1. Introduction
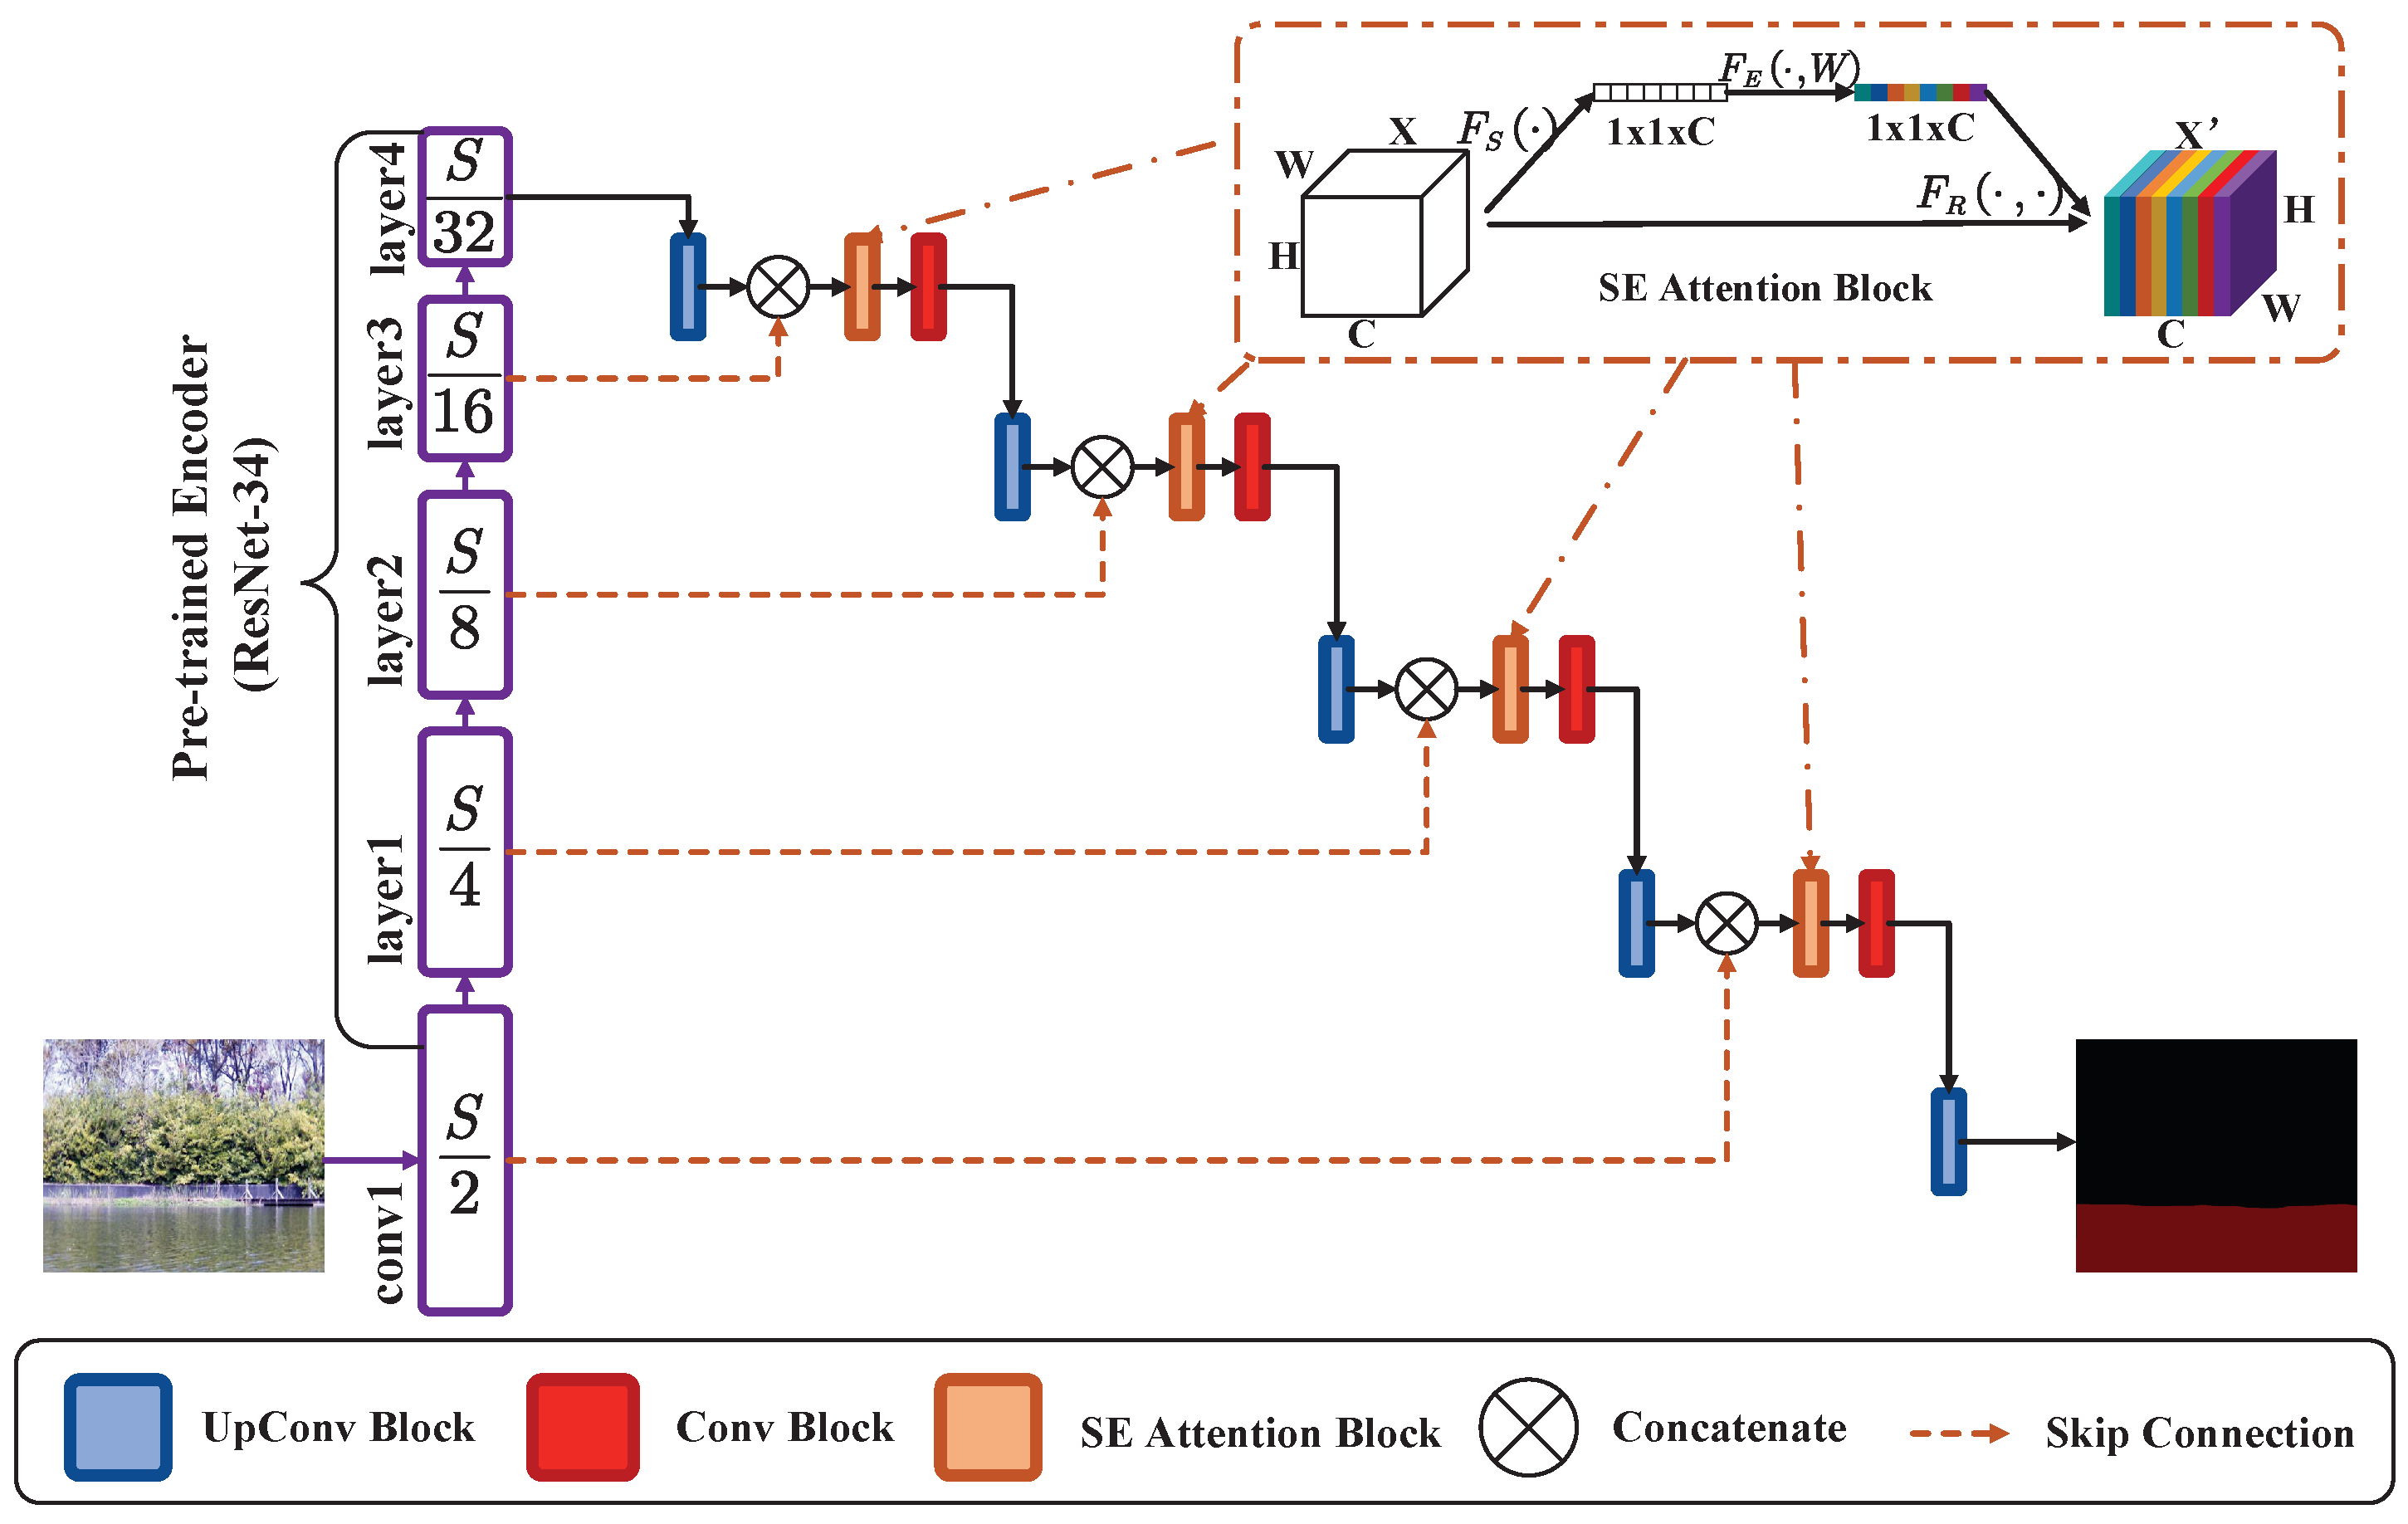
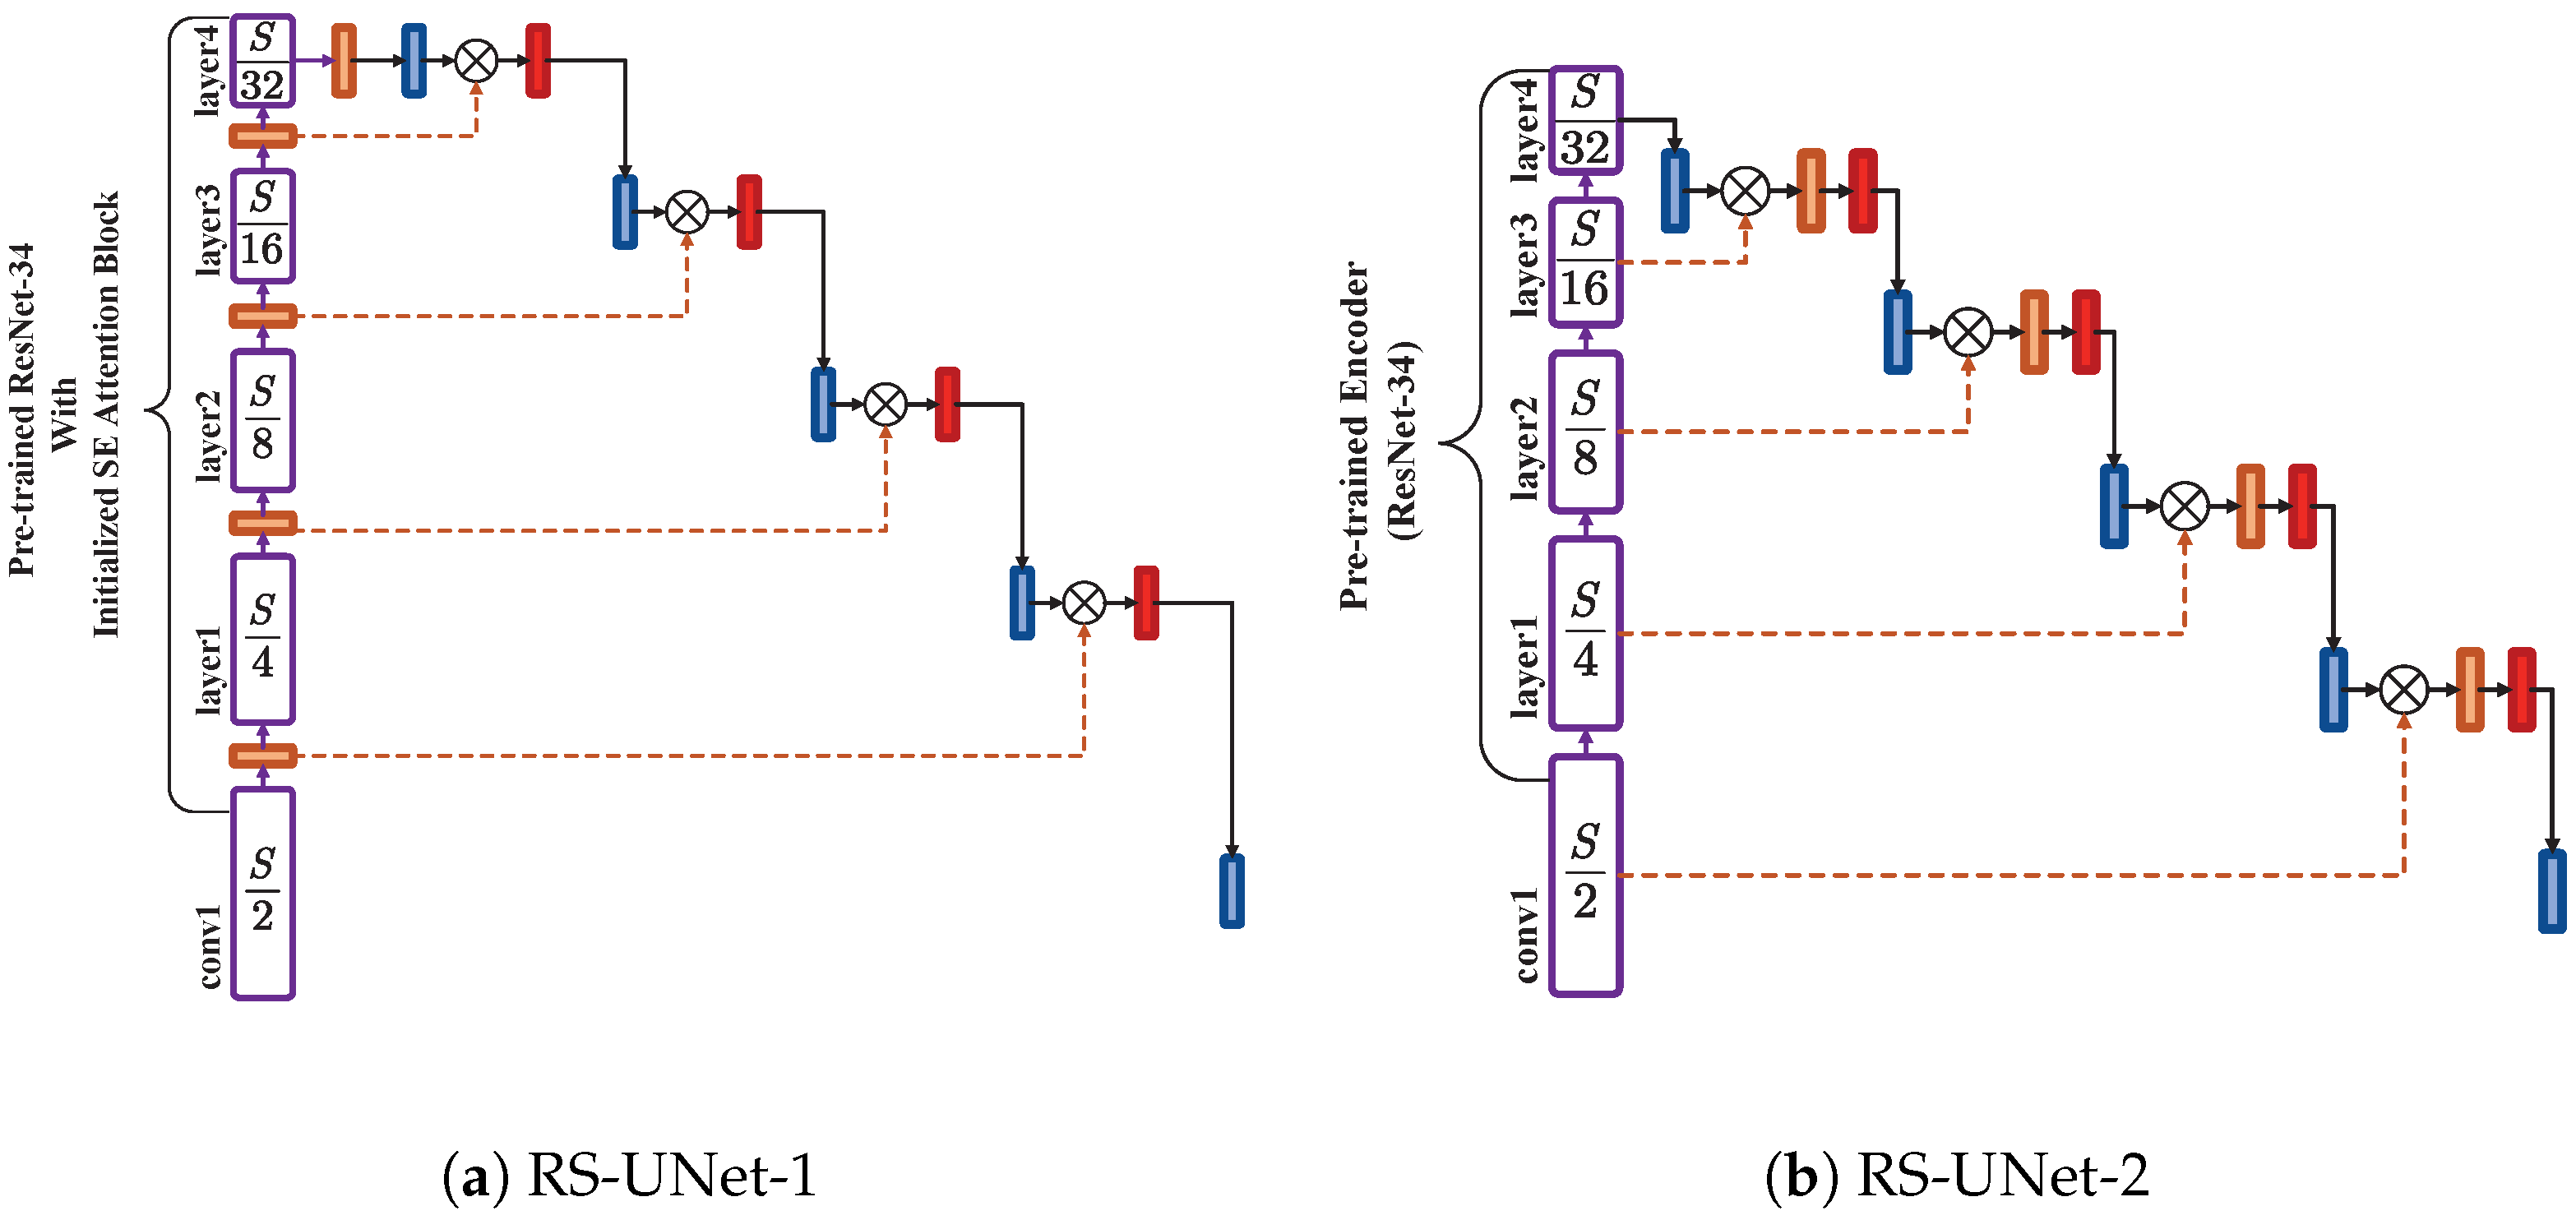
- An encoder is built based on ResNet-34 to enhance the feature extraction capability of the network in complicated environments, with the introduction of transfer learning using pretrained ResNet-34 weights to improve the training efficiency and solve the problem of insufficient training data;
- To reduce the amount of computation, a lightweight decoder is built, and an attention mechanism is added to the decoder to force the network to pay more attention to the data in the critical part throughout the segmentation process, increasing the computational speed and maintaining the segmentation quality;
- Construction of a shoreline detection method based on the proposed RS-UNet, which can accurately detect the shoreline in real time and be applied in various environments.
2. Related Work
2.1. Traditional Shoreline Detection Method
2.2. Deep-Learning-Based Shoreline Detection Method
3. Method
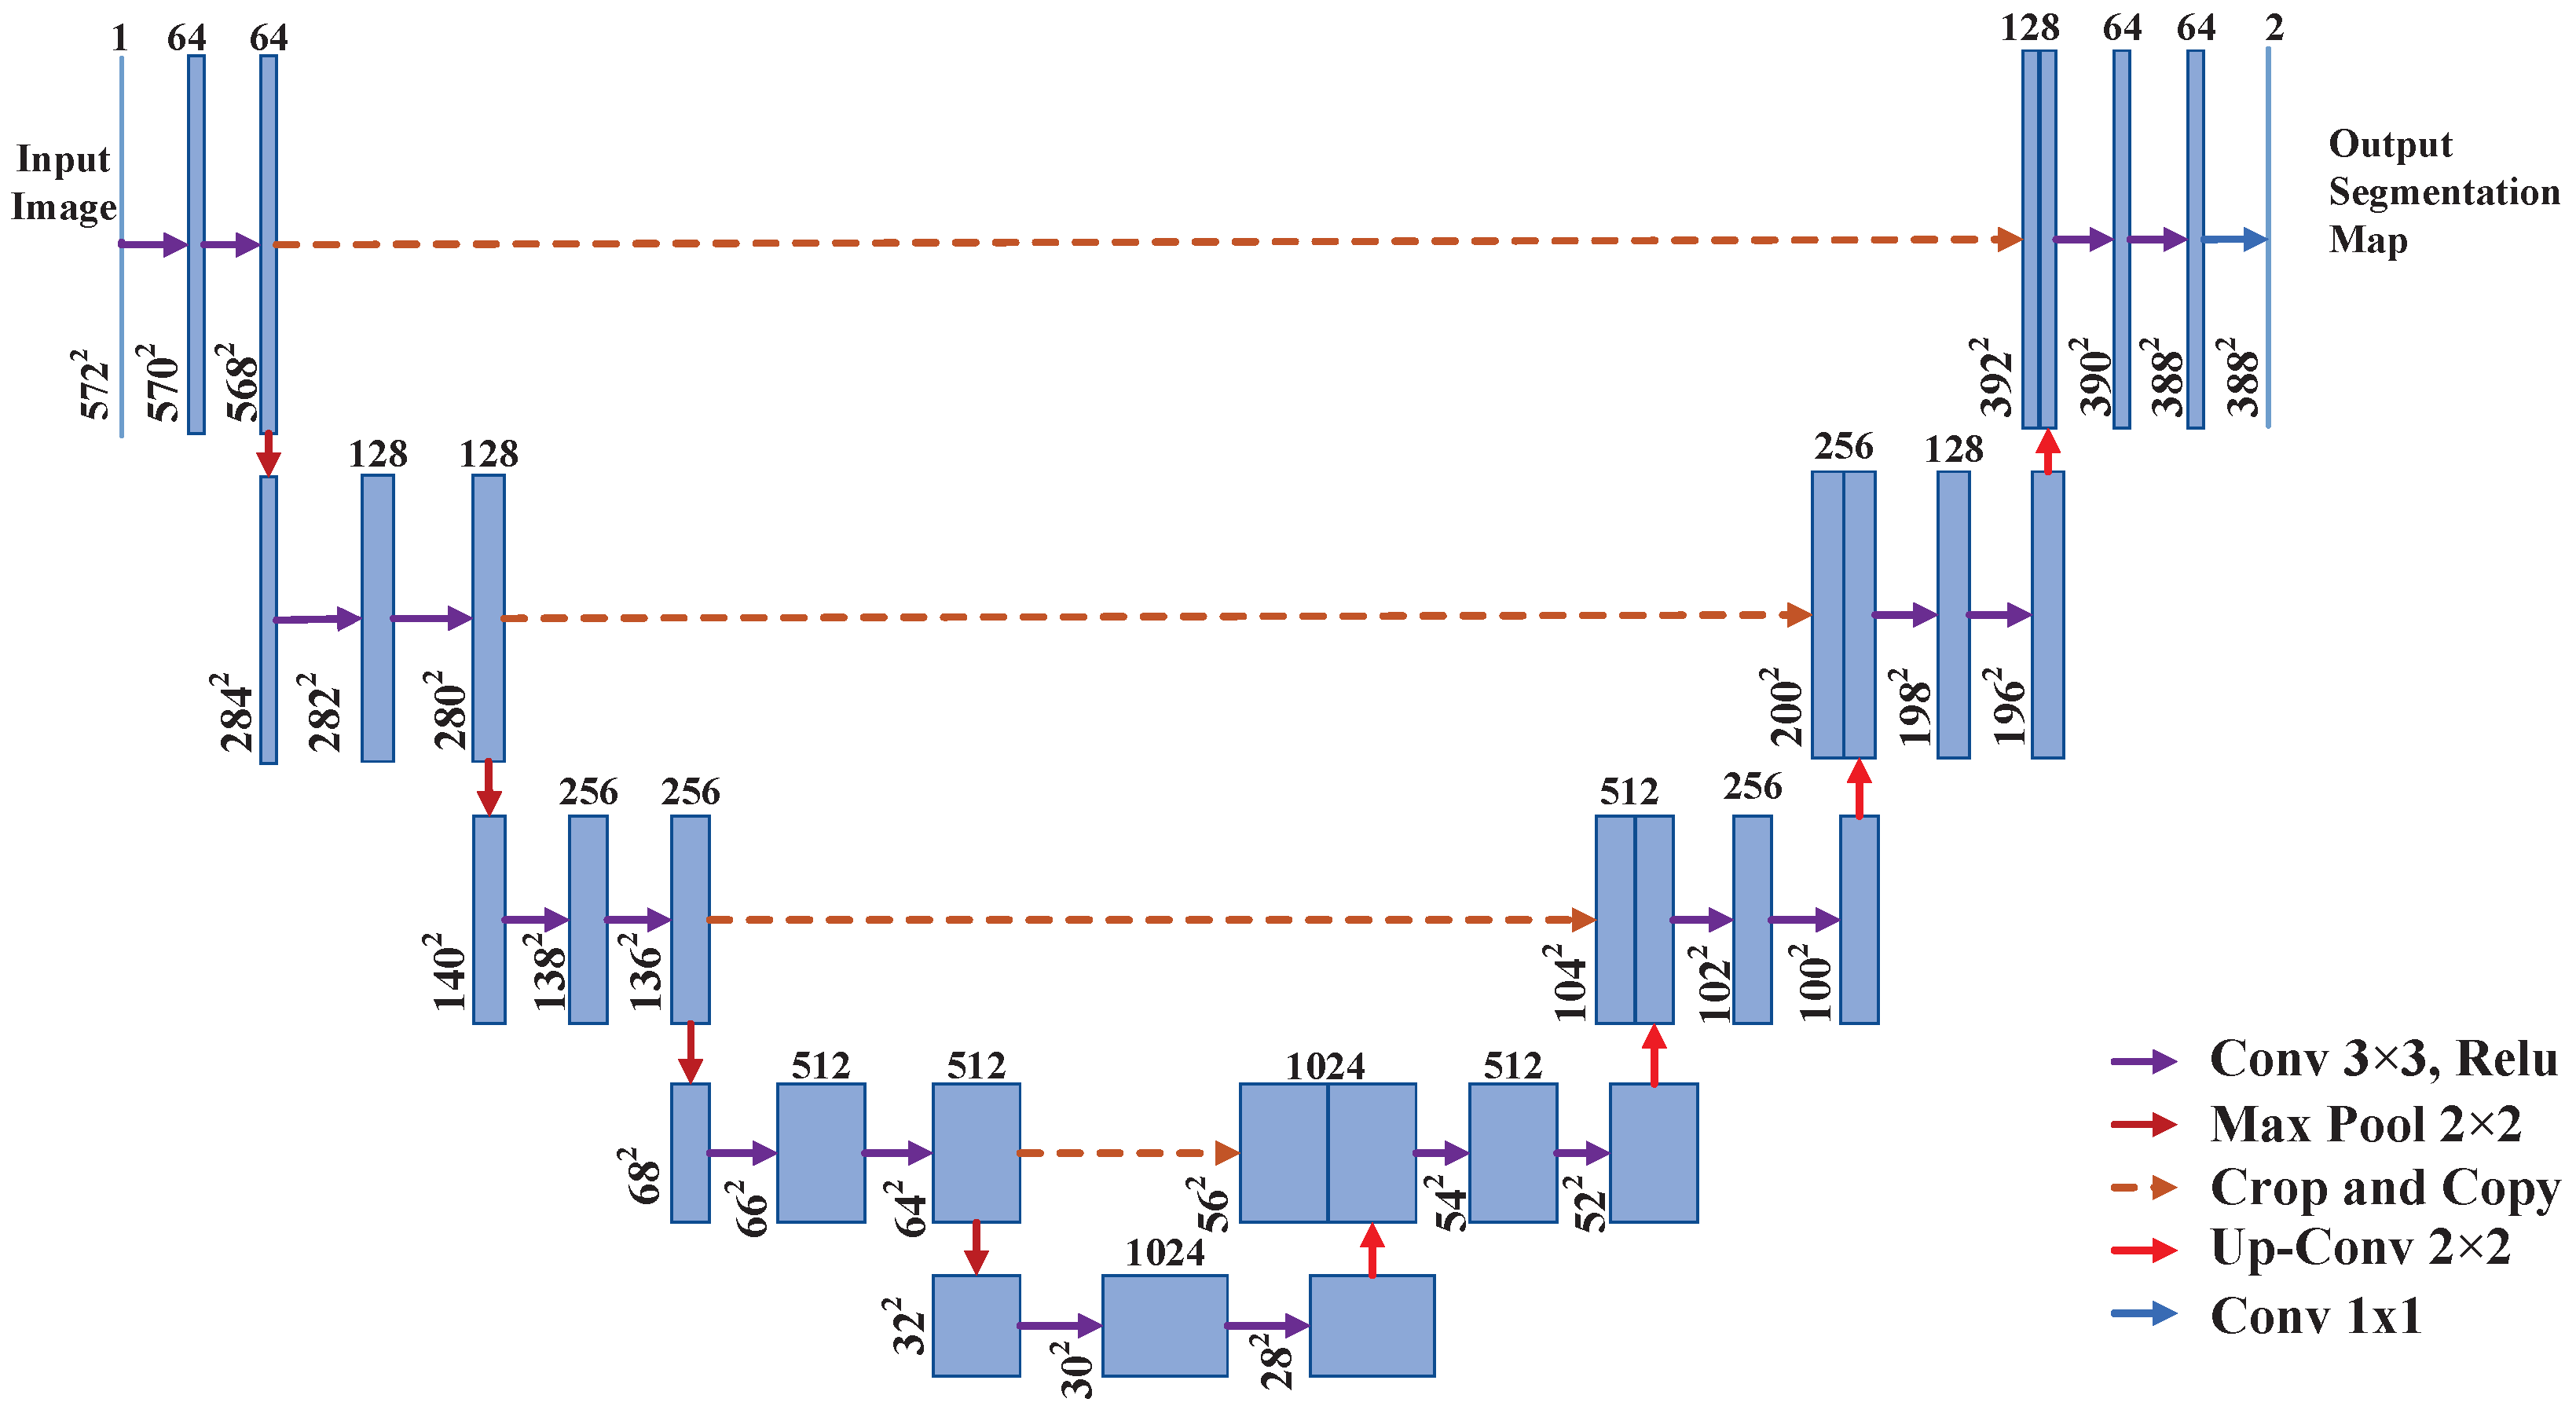
3.1. U-Net Network
3.2. RS-UNet Network
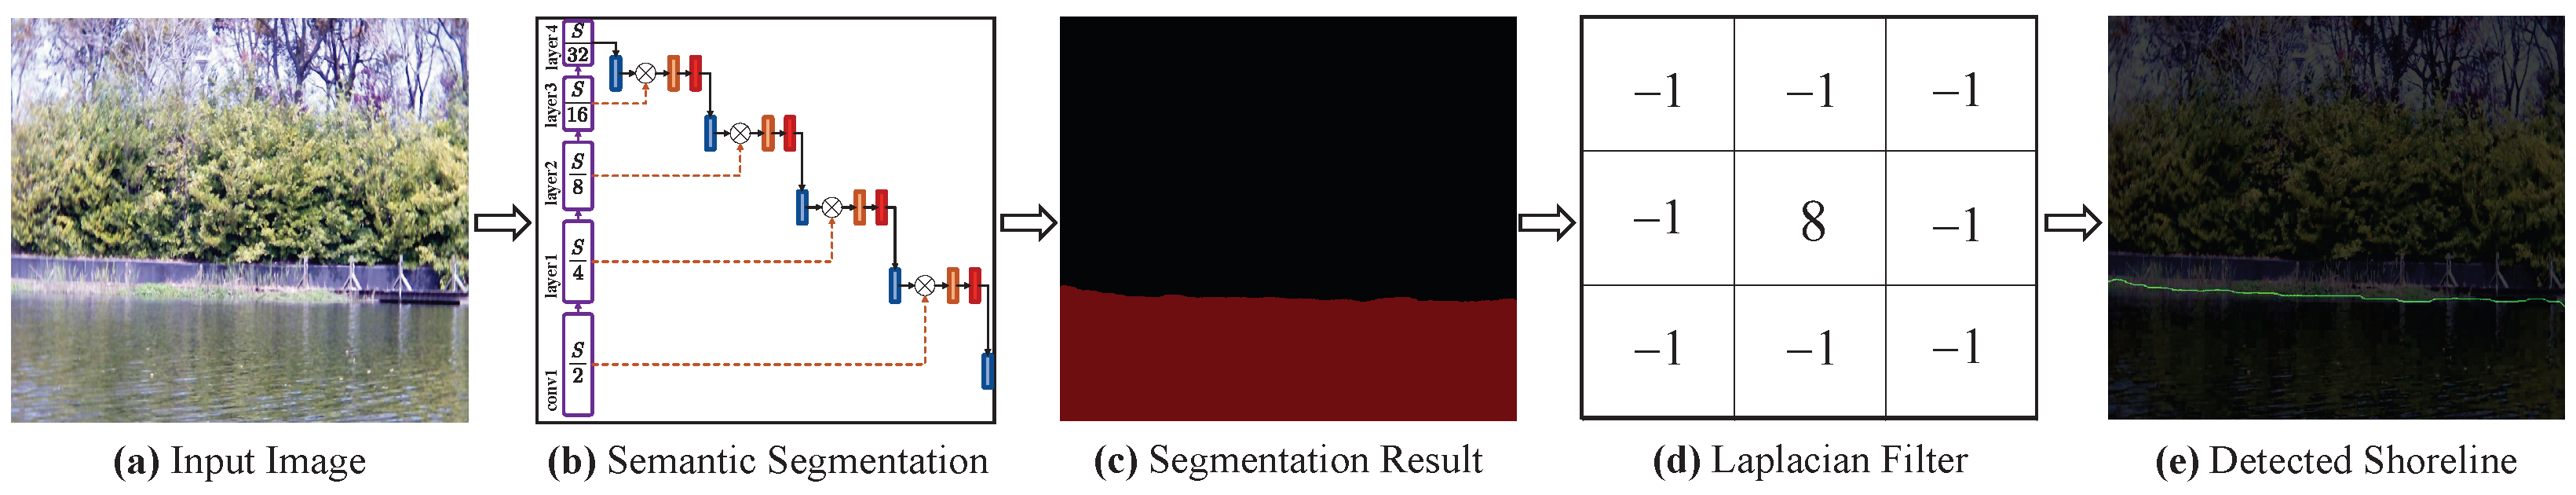
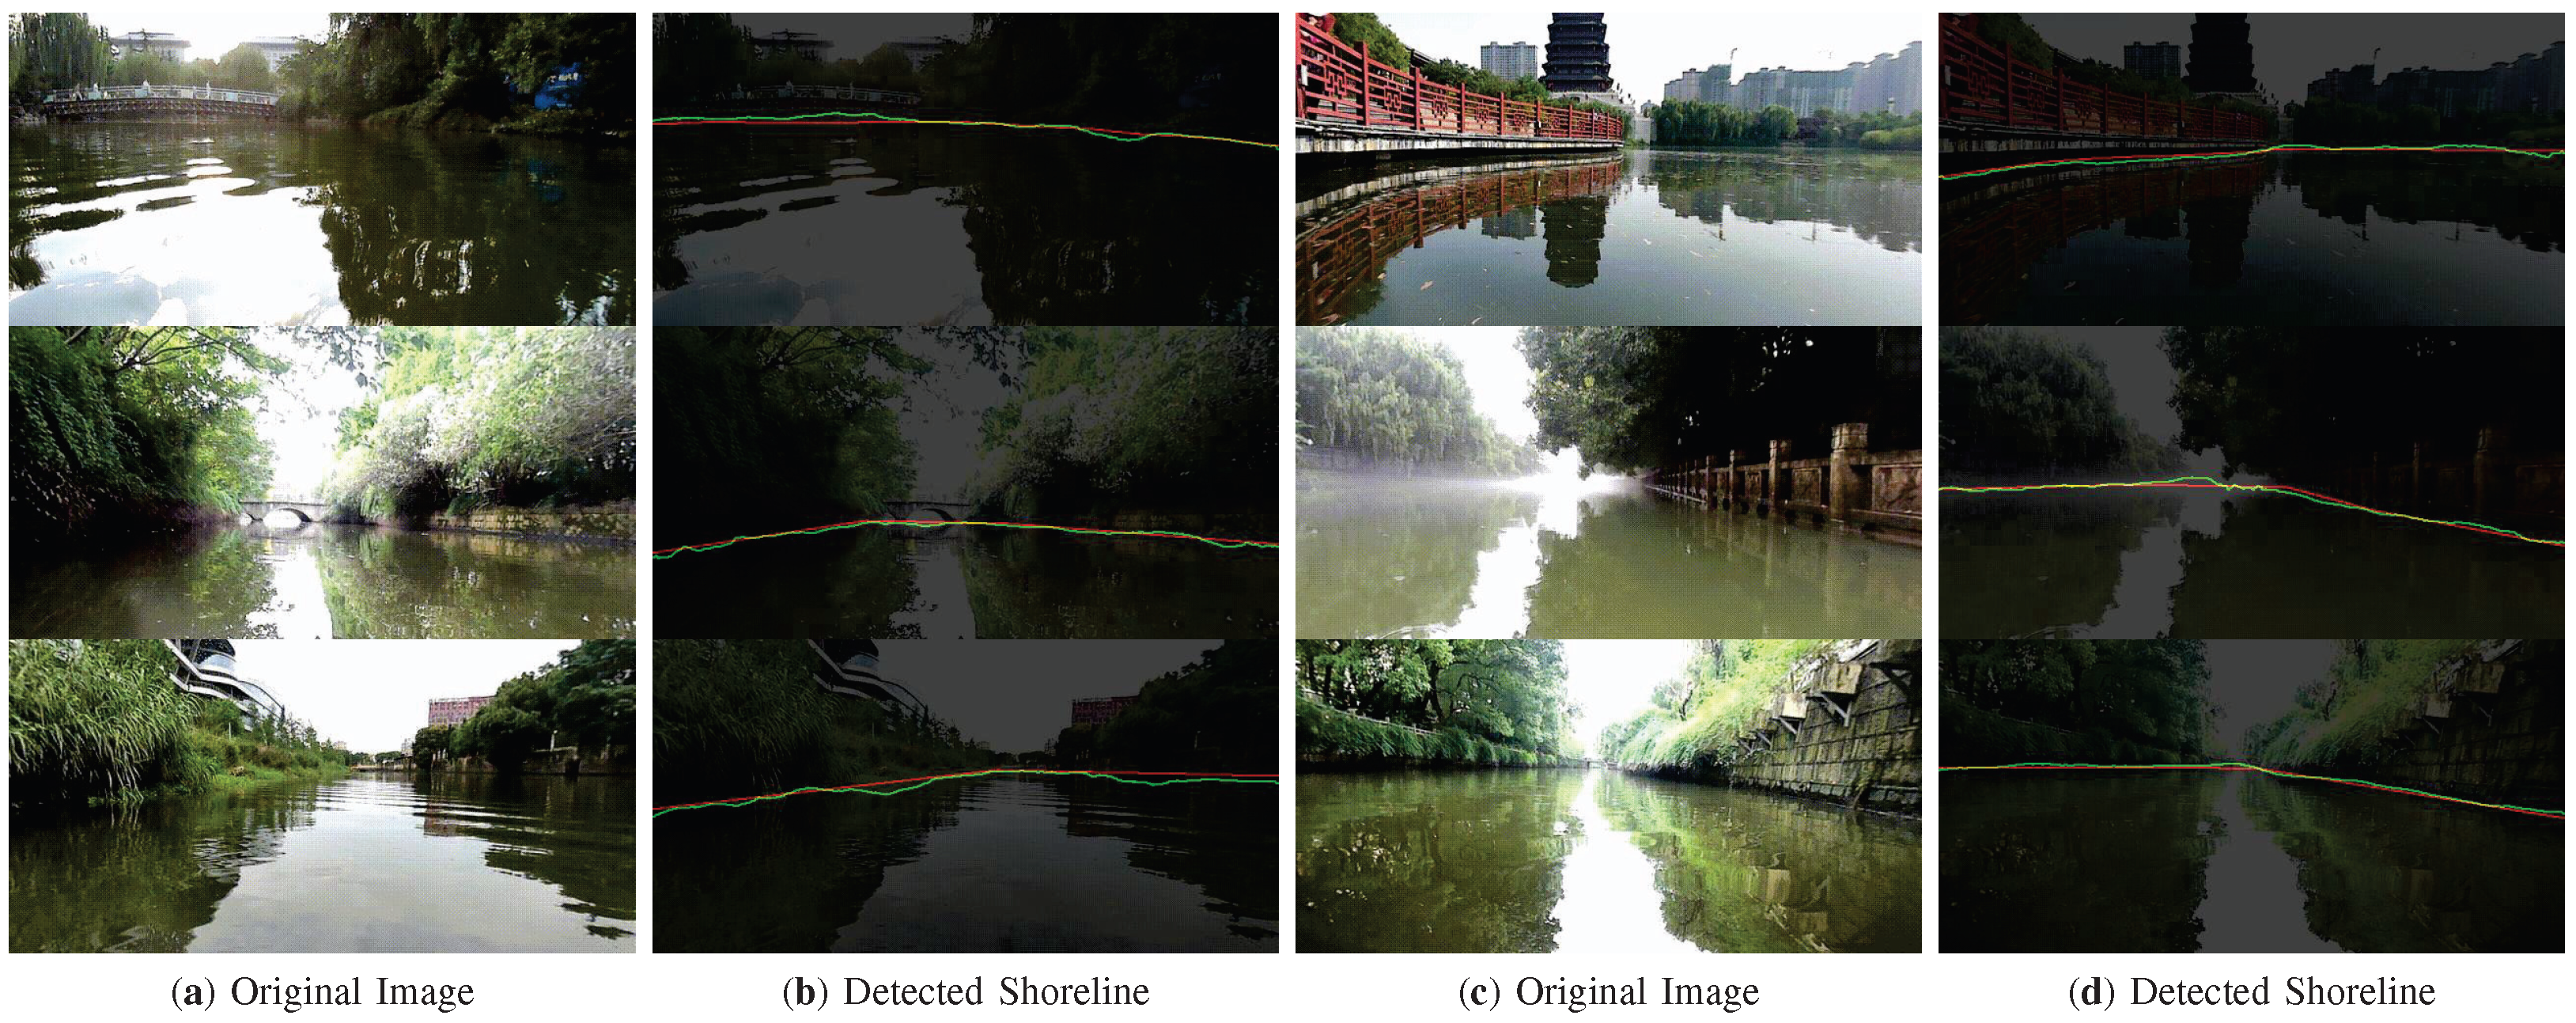
3.3. Shoreline Detection
4. Results and Discussion
4.1. Experimental Implementation
4.2. Ablation Studies
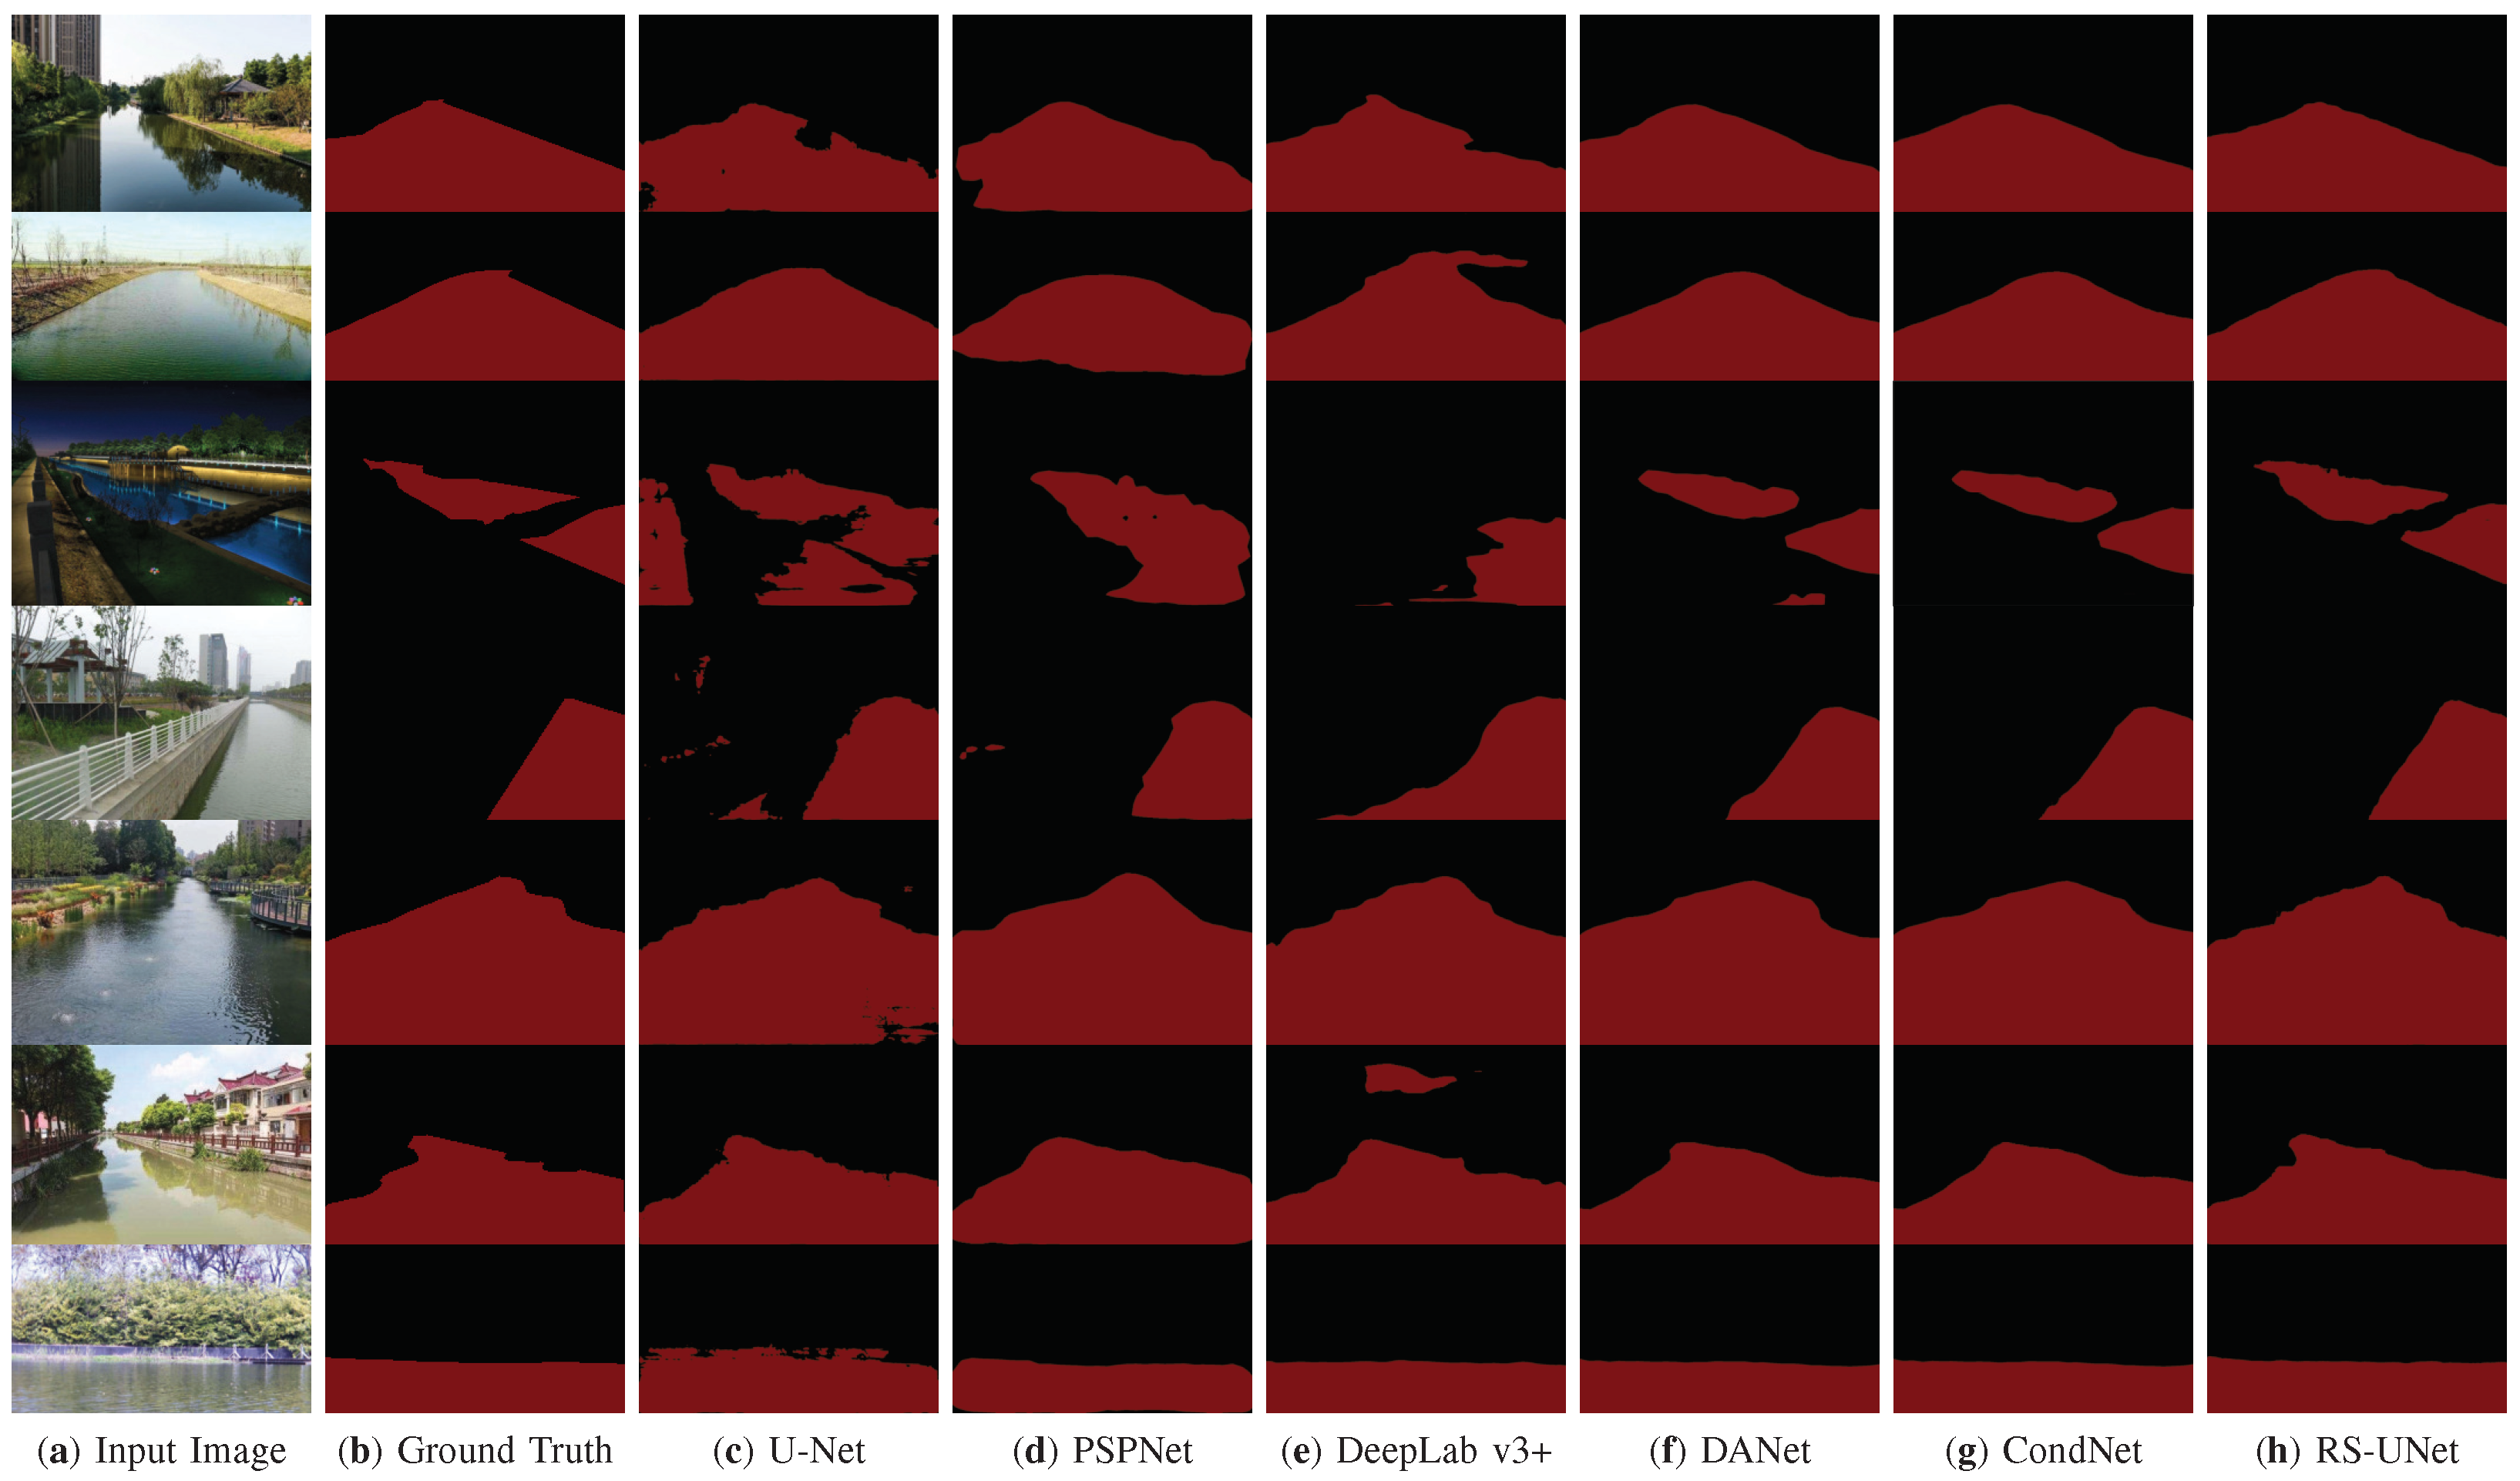
4.3. Experimental Results and Analysis of Water Surface Segmentation
4.4. Comparison with Other Shoreline Detection Methods
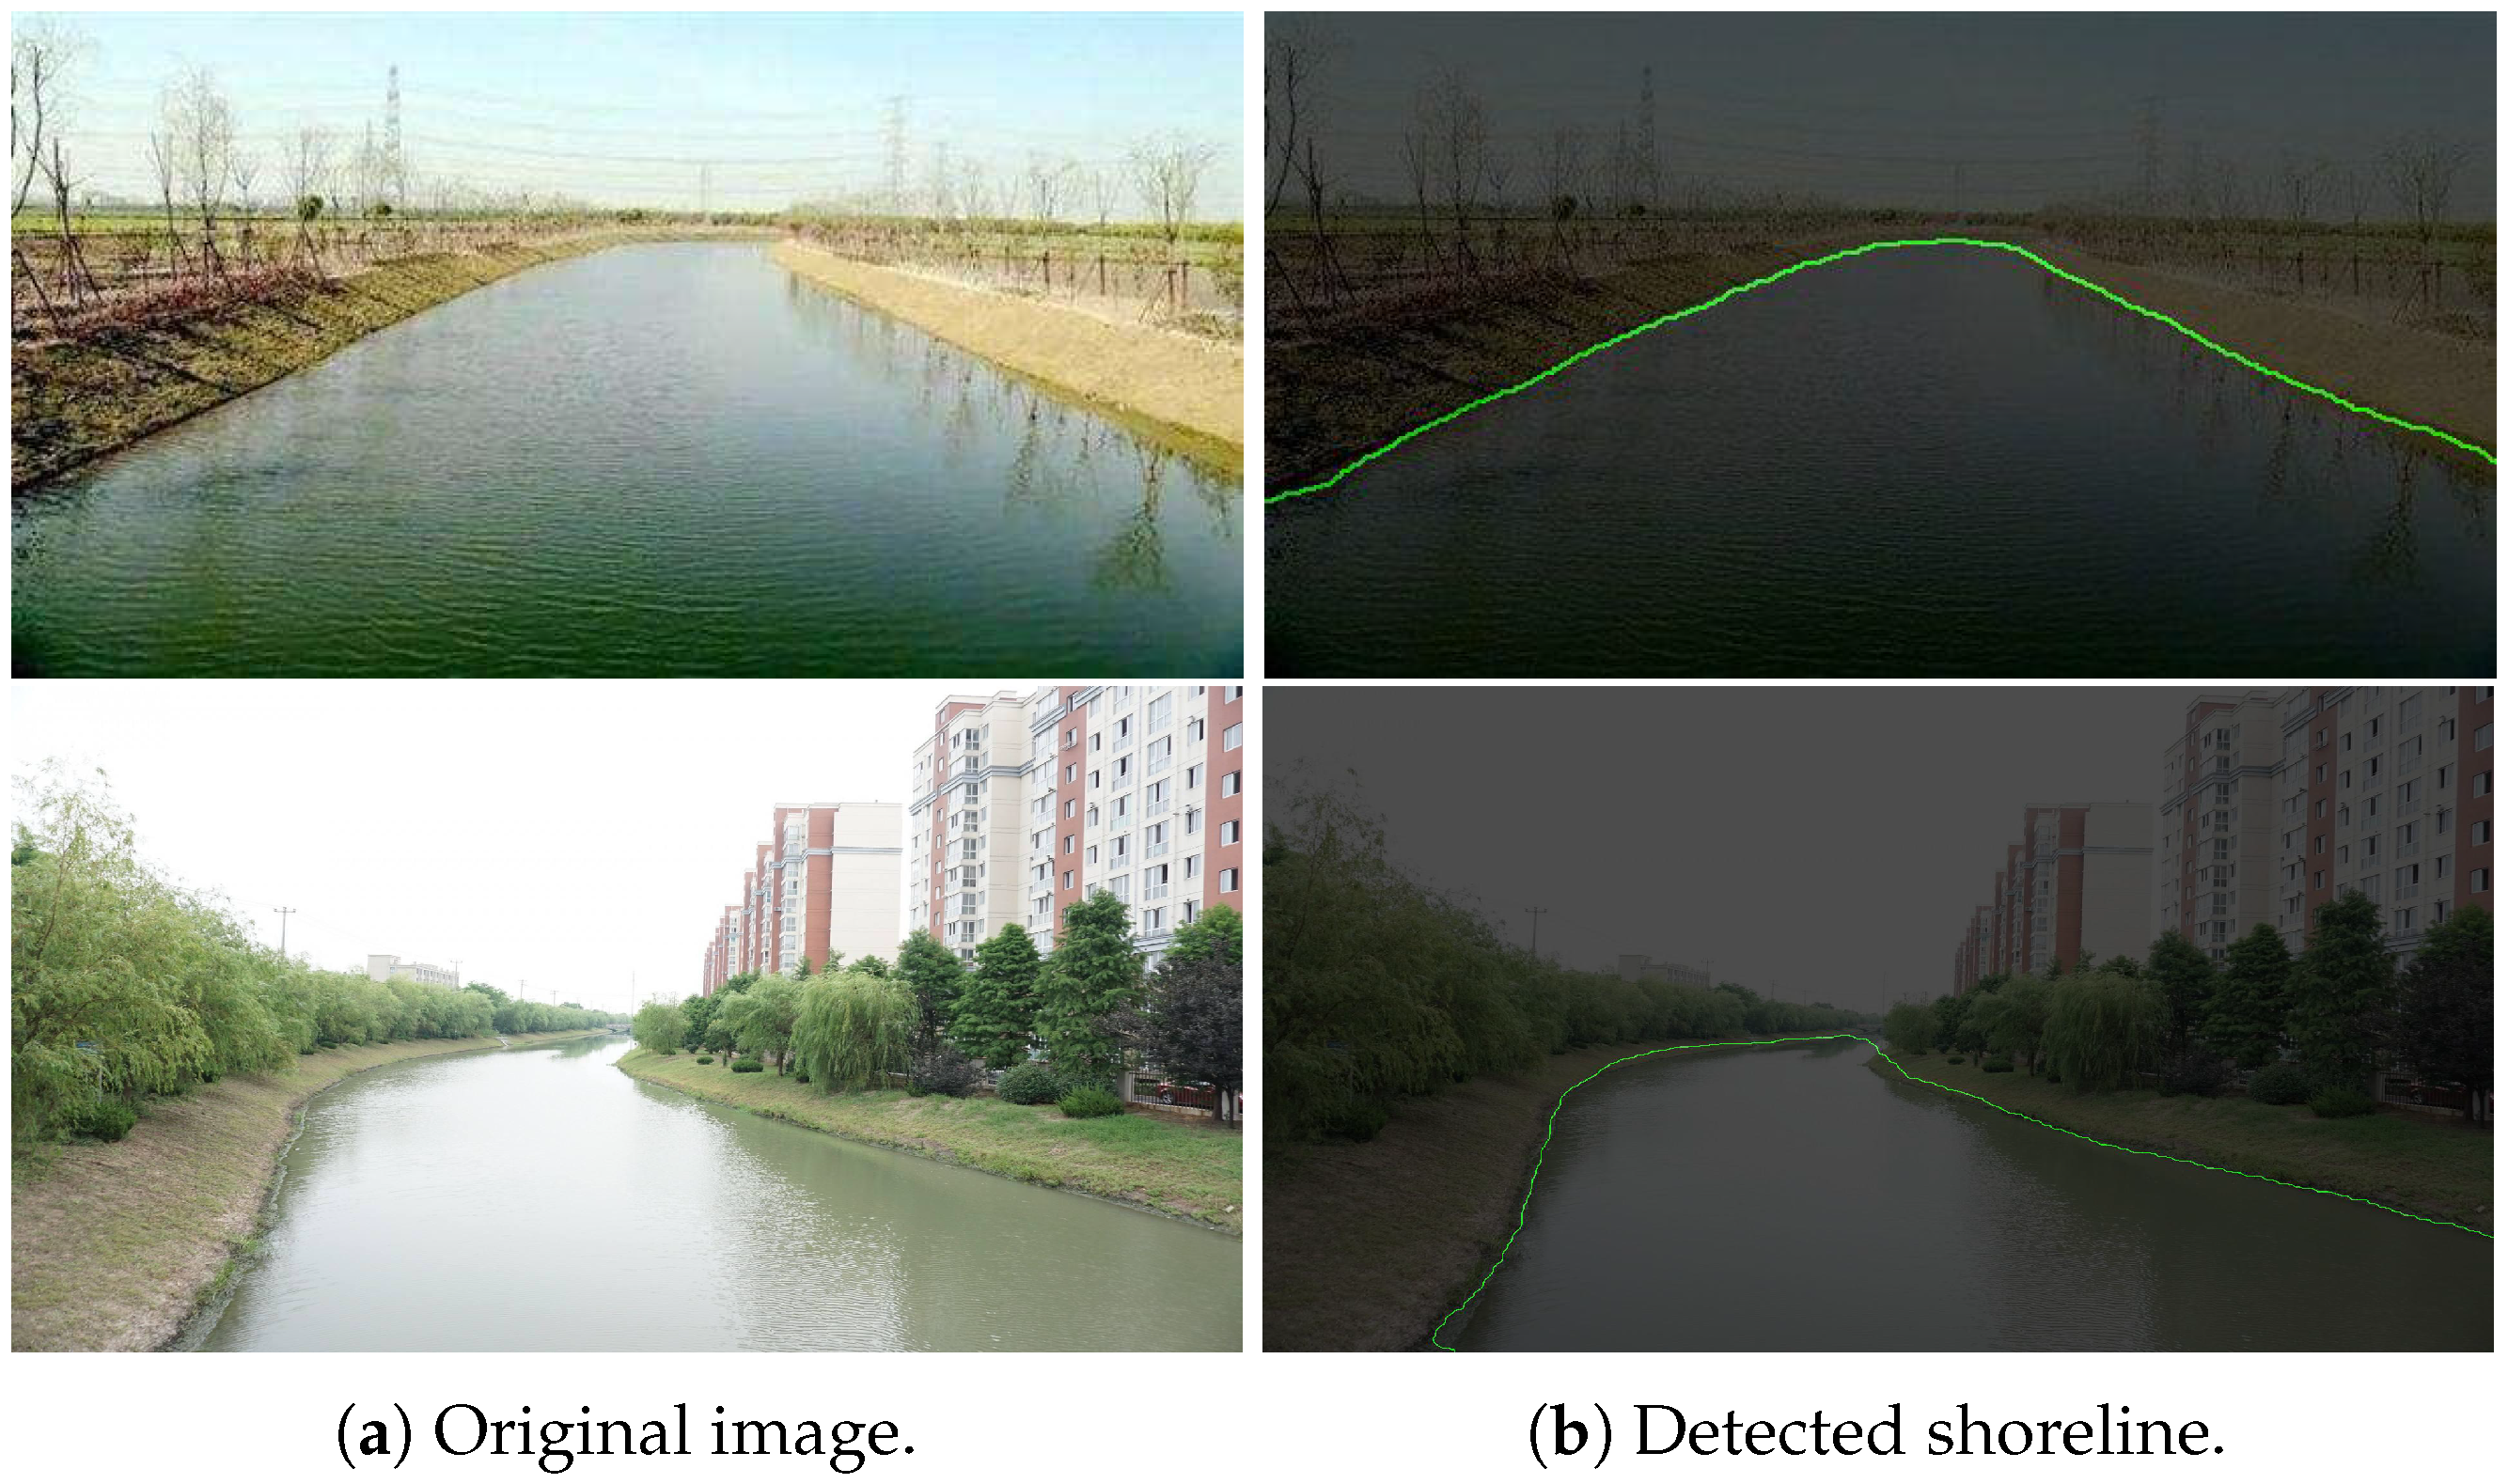
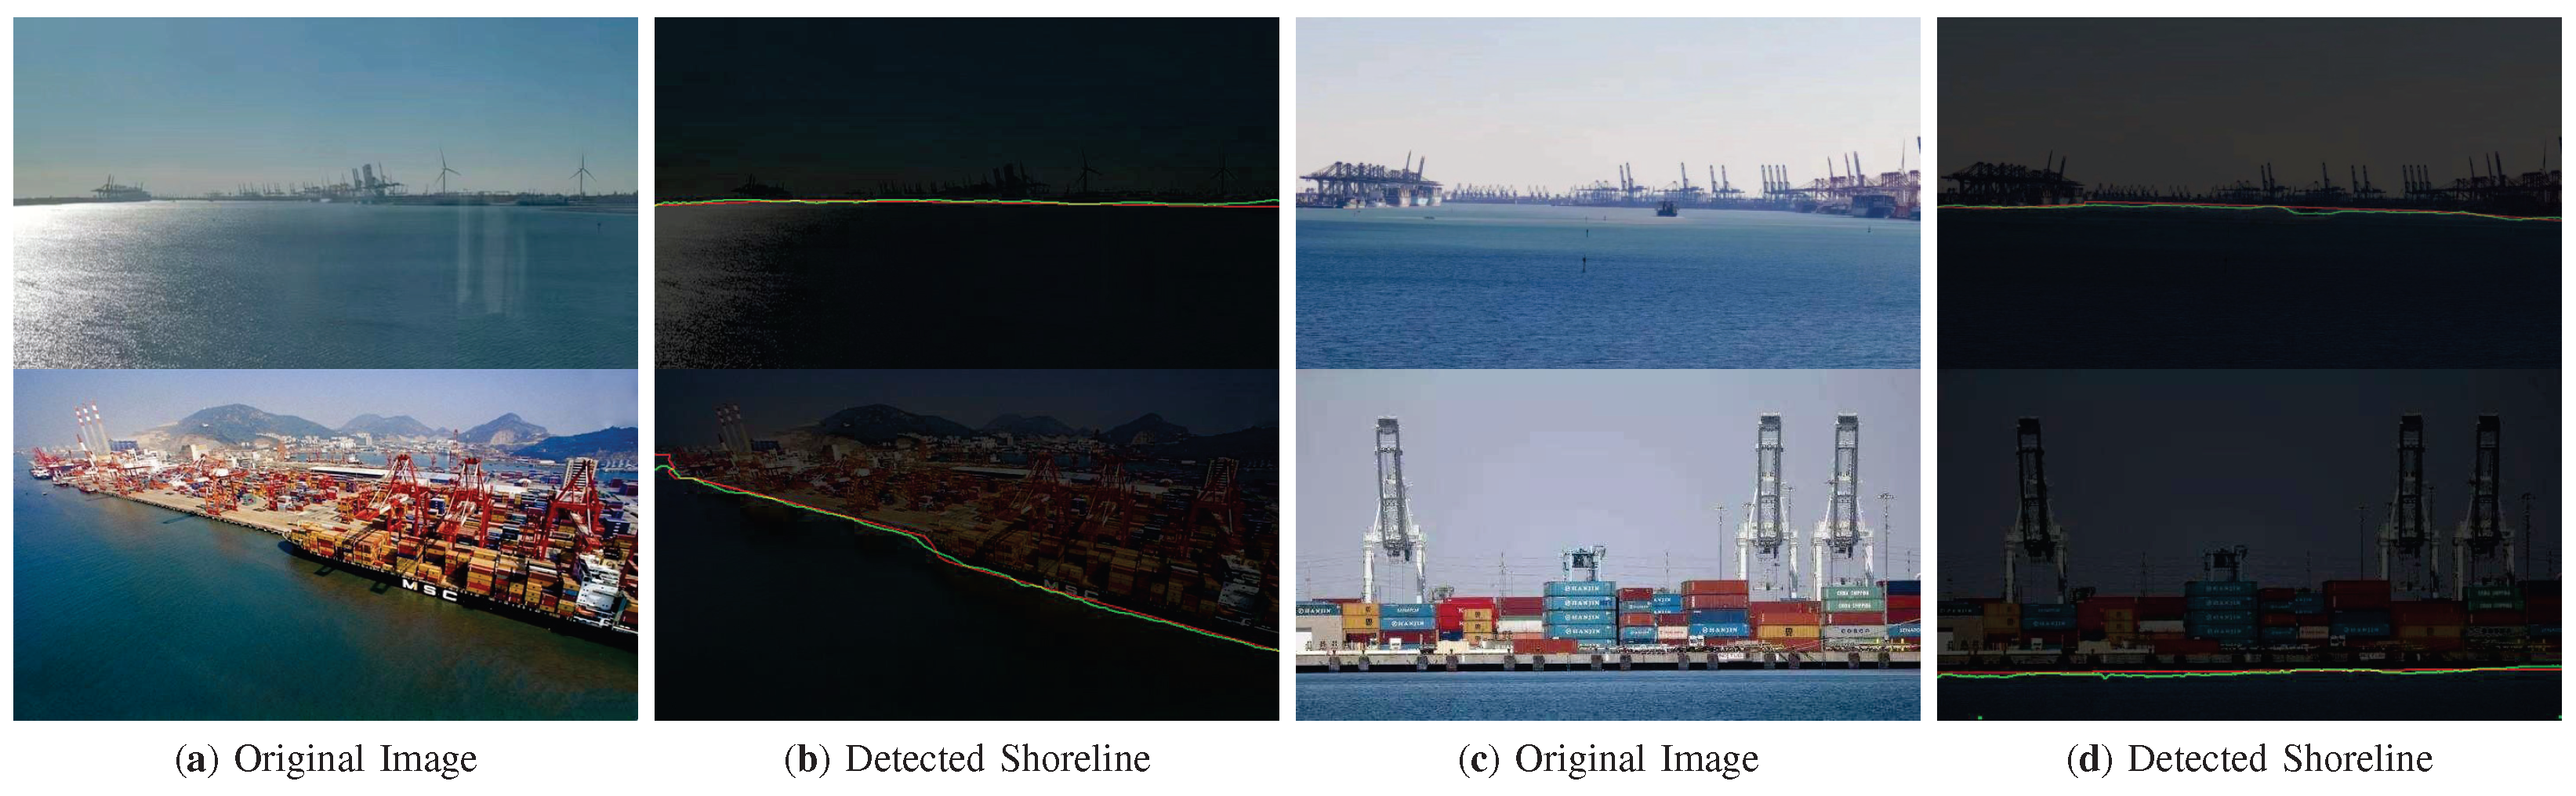
4.5. Experiment on Generalization Capability
5. Conclusions
Author Contributions
Funding
Institutional Review Board Statement
Informed Consent Statement
Data Availability Statement
Conflicts of Interest
Abbreviations
| Abbreviation | Full Name |
| MIoU | Mean intersection over union |
| FPS | Frames per second |
| USV | Unmanned surface vehicle |
| RANSAC | Random sample consensus |
| HSV | Hue saturation value |
| SE | Squeeze and excitation |
| RS-UNet | Residual squeeze-and-excitation U-Net |
| CRF | Conditional random fields |
| FCNs | Fully convolutional Networks |
References
- Yang, P.; Song, C.; Chen, L.; Cui, W. Image Based River Navigation System of Catamaran USV with Image Semantic Segmentation. In Proceedings of the 2022 WRC Symposium on Advanced Robotics and Automation (WRC SARA), Beijing, China, 20 August 2022; pp. 147–151. [Google Scholar]
- Sinisterra, A.J.; Dhanak, M.R.; Von Ellenrieder, K. Stereovision-based target tracking system for USV operations. Ocean Eng. 2017, 133, 197–214. [Google Scholar] [CrossRef]
- Ji, X.; Zhuang, J.Y.; Su, Y.M. Marine radar target detection for USV. In Proceedings of the Advanced Materials Research, Lille, France, 26–30 May 2014; Trans Tech Publications: Bach, Switzerland, 2014; Volume 1006, pp. 863–869. [Google Scholar]
- Wang, Z.; Zhang, Y. Estimation of ship berthing parameters based on Multi-LiDAR and MMW radar data fusion. Ocean Eng. 2022, 266, 113155. [Google Scholar] [CrossRef]
- Wei, Y.; Zhang, Y. Effective waterline detection of unmanned surface vehicles based on optical images. Sensors 2016, 16, 1590. [Google Scholar] [CrossRef] [PubMed] [Green Version]
- Kröhnert, M. Automatic waterline extraction from smartphone images. Int. Arch. Photogramm. Remote Sens. Spat. Inf. Sci. 2016, 41, 857. [Google Scholar] [CrossRef] [Green Version]
- Zhan, W.; Xiao, C.; Yuan, H.; Wen, Y. Effective waterline detection for unmanned surface vehicles in inland water. In Proceedings of the 2017 Seventh International Conference on Image Processing Theory, Tools and Applications (IPTA), Montreal, QC, Canada, 28 November–1 December 2017; pp. 1–6. [Google Scholar]
- Feng, T.; Xiong, J.; Xiao, J.; Liu, J.; He, Y. Real-time riverbank line detection for USV system. In Proceedings of the 2019 IEEE International Conference on Mechatronics and Automation (ICMA), Tianjin, China, 4–7 August 2019; pp. 2546–2551. [Google Scholar]
- Liu, R.W.; Yuan, W.; Chen, X.; Lu, Y. An enhanced CNN-enabled learning method for promoting ship detection in maritime surveillance system. Ocean Eng. 2021, 235, 109435. [Google Scholar] [CrossRef]
- Chen, P.; Li, Y.; Zhou, H.; Liu, B.; Liu, P. Detection of Small Ship Objects Using Anchor Boxes Cluster and Feature Pyramid Network Model for SAR Imagery. J. Mar. Sci. Eng. 2020, 8, 112. [Google Scholar] [CrossRef] [Green Version]
- Liang, M.; Liu, R.W.; Li, S.; Xiao, Z.; Liu, X.; Lu, F. An unsupervised learning method with convolutional auto-encoder for vessel trajectory similarity computation. Ocean Eng. 2021, 225, 108803. [Google Scholar] [CrossRef]
- Feng, H.; Cao, G.; Xu, H.; Ge, S.S. IS-STGCNN: An Improved Social spatial-temporal graph convolutional neural network for ship trajectory prediction. Ocean Eng. 2022, 266, 112960. [Google Scholar] [CrossRef]
- Chen, X.; Liu, S.; Liu, R.W.; Wu, H.; Han, B.; Zhao, J. Quantifying Arctic oil spilling event risk by integrating an analytic network process and a fuzzy comprehensive evaluation model. Ocean Coast. Manag. 2022, 228, 106326. [Google Scholar] [CrossRef]
- Xue, H.; Chen, X.; Zhang, R.; Wu, P.; Li, X.; Liu, Y. Deep Learning-Based Maritime Environment Segmentation for Unmanned Surface Vehicles Using Superpixel Algorithms. J. Mar. Sci. Eng. 2021, 9, 1329. [Google Scholar] [CrossRef]
- Steccanella, L.; Bloisi, D.; Blum, J.; Farinelli, A. Deep learning waterline detection for low-cost autonomous boats. In Proceedings of the International Conference on Intelligent Autonomous Systems, Singapore, 1–3 March 2018; Springer: Berlin/Heidelberg, Germany, 2018; pp. 613–625. [Google Scholar]
- Steccanella, L.; Bloisi, D.D.; Castellini, A.; Farinelli, A. Waterline and obstacle detection in images from low-cost autonomous boats for environmental monitoring. Robot. Auton. Syst. 2020, 124, 103346. [Google Scholar] [CrossRef]
- Yin, Y.; Guo, Y.; Deng, L.; Chai, B. Improved PSPNet-based water shoreline detection in complex inland river scenarios. Complex Intell. Syst. 2022, 9, 233–245. [Google Scholar] [CrossRef]
- Shen, J.; Tao, Q.; Xiao, Z. Shoreline detection algorithm based on the improved Deeplab v3+ network. J. Image Graph. 2019, 23, 2174–2182. [Google Scholar]
- Adam, M.A.M.; Ibrahim, A.I.; Abidin, Z.Z.; Zaki, H.F.M. Deep Learning-Based Water Segmentation for Autonomous Surface Vessel. In Proceedings of the IOP Conference Series: Earth and Environmental Science, Kuala Lumpur, Malaysia, 20–21 October 2020; IOP Publishing: Bristol, UK, 2020; Volume 540, p. 012055. [Google Scholar]
- Vandaele, R.; Dance, S.L.; Ojha, V. Automated water segmentation and river level detection on camera images using transfer learning. In Proceedings of the DAGM German Conference on Pattern Recognition, Tubingen, Germany, 28 September–1 October 2020; Springer: Berlin/Heidelberg, Germany, 2020; pp. 232–245. [Google Scholar]
- Zhan, W.; Xiao, C.; Wen, Y.; Zhou, C.; Yuan, H.; Xiu, S.; Zou, X.; Xie, C.; Li, Q. Adaptive semantic segmentation for unmanned surface vehicle navigation. Electronics 2020, 9, 213. [Google Scholar] [CrossRef] [Green Version]
- He, K.; Zhang, X.; Ren, S.; Sun, J. Deep residual learning for image recognition. In Proceedings of the IEEE Conference on Computer Vision and Pattern Recognition, Las Vegas, NV, USA, 27 June–1 July 2016; pp. 770–778. [Google Scholar]
- Hu, J.; Shen, L.; Sun, G. Squeeze-and-excitation networks. In Proceedings of the IEEE Conference on Computer Vision and Pattern Recognition, Salt Lake City, UT, USA, 18–22 June 2018; pp. 7132–7141. [Google Scholar]
- Kristan, M.; Sulić Kenk, V.; Kovačič, S.; Perš, J. Fast Image-Based Obstacle Detection From Unmanned Surface Vehicles. IEEE Trans. Cybern. 2016, 46, 641–654. [Google Scholar] [CrossRef] [PubMed] [Green Version]
- Peng, M.; WANG, J.; WEN, X.; Cong, X. Shoreline detection method by combining HSV spatial water image feature. J. Image Graph. 2018, 23, 526–533. [Google Scholar]
- Yao, L.; Kanoulas, D.; Ji, Z.; Liu, Y. ShorelineNet: An Efficient Deep Learning Approach for Shoreline Semantic Segmentation for Unmanned Surface Vehicles. In Proceedings of the 2021 IEEE/RSJ International Conference on Intelligent Robots and Systems (IROS), Prague, Czech Republic, 27 September–1 October 2021; pp. 5403–5409. [Google Scholar]
- Cheng, Y.; Jiang, M.; Zhu, J.; Liu, Y. Are we ready for unmanned surface vehicles in inland waterways? The usvinland multisensor dataset and benchmark. IEEE Robot. Autom. Lett. 2021, 6, 3964–3970. [Google Scholar] [CrossRef]
- Ronneberger, O.; Fischer, P.; Brox, T. U-net: Convolutional networks for biomedical image segmentation. In Proceedings of the International Conference on Medical Image Computing and Computer-Assisted Intervention, Munich, Germany, 5–9 October 2015; Springer: Berlin/Heidelberg, Germany, 2015; pp. 234–241. [Google Scholar]
- Long, J.; Shelhamer, E.; Darrell, T. Fully convolutional networks for semantic segmentation. In Proceedings of the IEEE Conference on Computer Vision and Pattern Recognition, Boston, MA, USA, 7–12 June 2015; pp. 3431–3440. [Google Scholar]
- Wang, X. Laplacian operator-based edge detectors. IEEE Trans. Pattern Anal. Mach. Intell. 2007, 29, 886–890. [Google Scholar] [CrossRef] [PubMed]
- Kingma, D.P.; Ba, J. Adam: A method for stochastic optimization. arXiv 2014, arXiv:1412.6980. [Google Scholar]
- Zhao, H.; Shi, J.; Qi, X.; Wang, X.; Jia, J. Pyramid scene parsing network. In Proceedings of the IEEE Conference on Computer Vision and Pattern Recognition, Honolulu, HI, USA, 21–26 July 2017; pp. 2881–2890. [Google Scholar]
- Chen, L.C.; Zhu, Y.; Papandreou, G.; Schroff, F.; Adam, H. Encoder-decoder with atrous separable convolution for semantic image segmentation. In Proceedings of the European Conference on Computer Vision (ECCV), Munich, Germany, 8–14 September 2018; pp. 801–818. [Google Scholar]
- Fu, J.; Liu, J.; Tian, H.; Li, Y.; Bao, Y.; Fang, Z.; Lu, H. Dual attention network for scene segmentation. In Proceedings of the IEEE/CVF Conference on Computer Vision and Pattern Recognition, Long Beach, CA, USA, 16–20 June 2019; pp. 3146–3154. [Google Scholar]
- Yu, C.; Shao, Y.; Gao, C.; Sang, N. CondNet: Conditional classifier for scene segmentation. IEEE Signal Process. Lett. 2021, 28, 758–762. [Google Scholar] [CrossRef]


| Encoder | ||||||
|---|---|---|---|---|---|---|
| Block | Filter Size | Stride | Channels | In | Out | Input |
| conv1 | 2 | 3/64 | S | Input image | ||
| MaxPooling | 2 | 64/64 | S/2 | S/4 | ||
| layer1 | 1 | 64/64 | S/4 | S/4 | ||
| layer2 | 2 | 64/128 | S/4 | S/8 | ||
| layer3 | 2 | 128/256 | S/8 | S/16 | ||
| layer4 | 2 | 256/512 | S/16 | S/32 | ||
| Decoder | ||||||
| Block | Filter Size | Up | Channels | In | Out | Input |
| de4upconv de4se de4conv | 2 1 1 | 512/256 512/512 512/256 | S/32 S/16 S/16 | S/16 S/16 S/16 | ||
| de3upconv de3se de3conv | 2 1 1 | 256/128 256/256 256/128 | S/16 S/8 S/8 | S/8 S/8 S/8 | ||
| de2upconv de2se de2conv | 2 1 1 | 128/64 128/128 128/64 | S/8 S/4 S/4 | S/4 S/4 S/4 | ||
| de1upconv de1se de1conv | 2 1 1 | 64/64 128/128 128/64 | S/4 S/2 S/2 | S/2 S/2 S/2 | ||
| upconv | 2 | 64/2 | S/2 | S | ||
| Loss Function | Dice | MIoU (%) | MPA (%) | PA (%) |
|---|---|---|---|---|
| Cross-entropy loss | 0.9748 | 96.65 | 98.27 | 98.37 |
| Joint loss | 0.9763 | 97.05 | 98.49 | 98.56 |
| Architecture | Dice | MIoU (%) | MPA (%) | PA (%) |
|---|---|---|---|---|
| RS-UNet-1 | 0.9735 | 96.66 | 98.26 | 98.37 |
| RS-UNet-2 | 0.9763 | 97.05 | 98.49 | 98.56 |
| Network | Params (M) | Dice Coefficient | MIoU (%) | MPA (%) | Pixel Accuracy (%) | FPS |
|---|---|---|---|---|---|---|
| U-Net [28] | 31.0 | 0.8791 | 80.16 | 88.24 | 89.60 | 9.5 |
| PSPNet [32] | 65.6 | 0.9052 | 88.83 | 93.82 | 94.36 | 20 |
| DeepLab v3+ [33] | 59.3 | 0.9449 | 92.22 | 95.90 | 94.36 | 35 |
| DANet [34] | 66.6 | 0.9705 | 95.61 | 97.70 | 97.93 | 34 |
| CondNet [35] | 44.1 | 0.9664 | 95.36 | 97.67 | 97.80 | 37 |
| RS-UNet(ours) | 23.7 | 0.9763 | 97.05 | 98.49 | 98.56 | 40 |
| Method | MIoU (%) | PA (%) | FPS |
|---|---|---|---|
| Yin et al. [17] | 96.87 | 98.49 | - |
| Ours | 97.21 | 98.60 | 32 |
| Dateset | Dice | MIoU (%) | MPA (%) | PA (%) |
|---|---|---|---|---|
| USVInland [27] | 0.9763 | 95.60 | 97.73 | 97.75 |
| Port | 0.9830 | 97.26 | 98.68 | 98.76 |
Disclaimer/Publisher’s Note: The statements, opinions and data contained in all publications are solely those of the individual author(s) and contributor(s) and not of MDPI and/or the editor(s). MDPI and/or the editor(s) disclaim responsibility for any injury to people or property resulting from any ideas, methods, instructions or products referred to in the content. |
© 2023 by the authors. Licensee MDPI, Basel, Switzerland. This article is an open access article distributed under the terms and conditions of the Creative Commons Attribution (CC BY) license (https://creativecommons.org/licenses/by/4.0/).
Share and Cite
Zhao, J.; Song, F.; Gong, G.; Wang, S. Improved UNet-Based Shoreline Detection Method in Real Time for Unmanned Surface Vehicle. J. Mar. Sci. Eng. 2023, 11, 1049. https://doi.org/10.3390/jmse11051049
Zhao J, Song F, Gong G, Wang S. Improved UNet-Based Shoreline Detection Method in Real Time for Unmanned Surface Vehicle. Journal of Marine Science and Engineering. 2023; 11(5):1049. https://doi.org/10.3390/jmse11051049
Chicago/Turabian StyleZhao, Jiansen, Fengchuan Song, Guobao Gong, and Shengzheng Wang. 2023. "Improved UNet-Based Shoreline Detection Method in Real Time for Unmanned Surface Vehicle" Journal of Marine Science and Engineering 11, no. 5: 1049. https://doi.org/10.3390/jmse11051049