
Effects of Water Velocity on Growth, Physiology and Intestinal Structure of Coral Trout (Plectropomus leopardus)
 and
and
Abstract
:1. Introduction
2. Materials and Methods
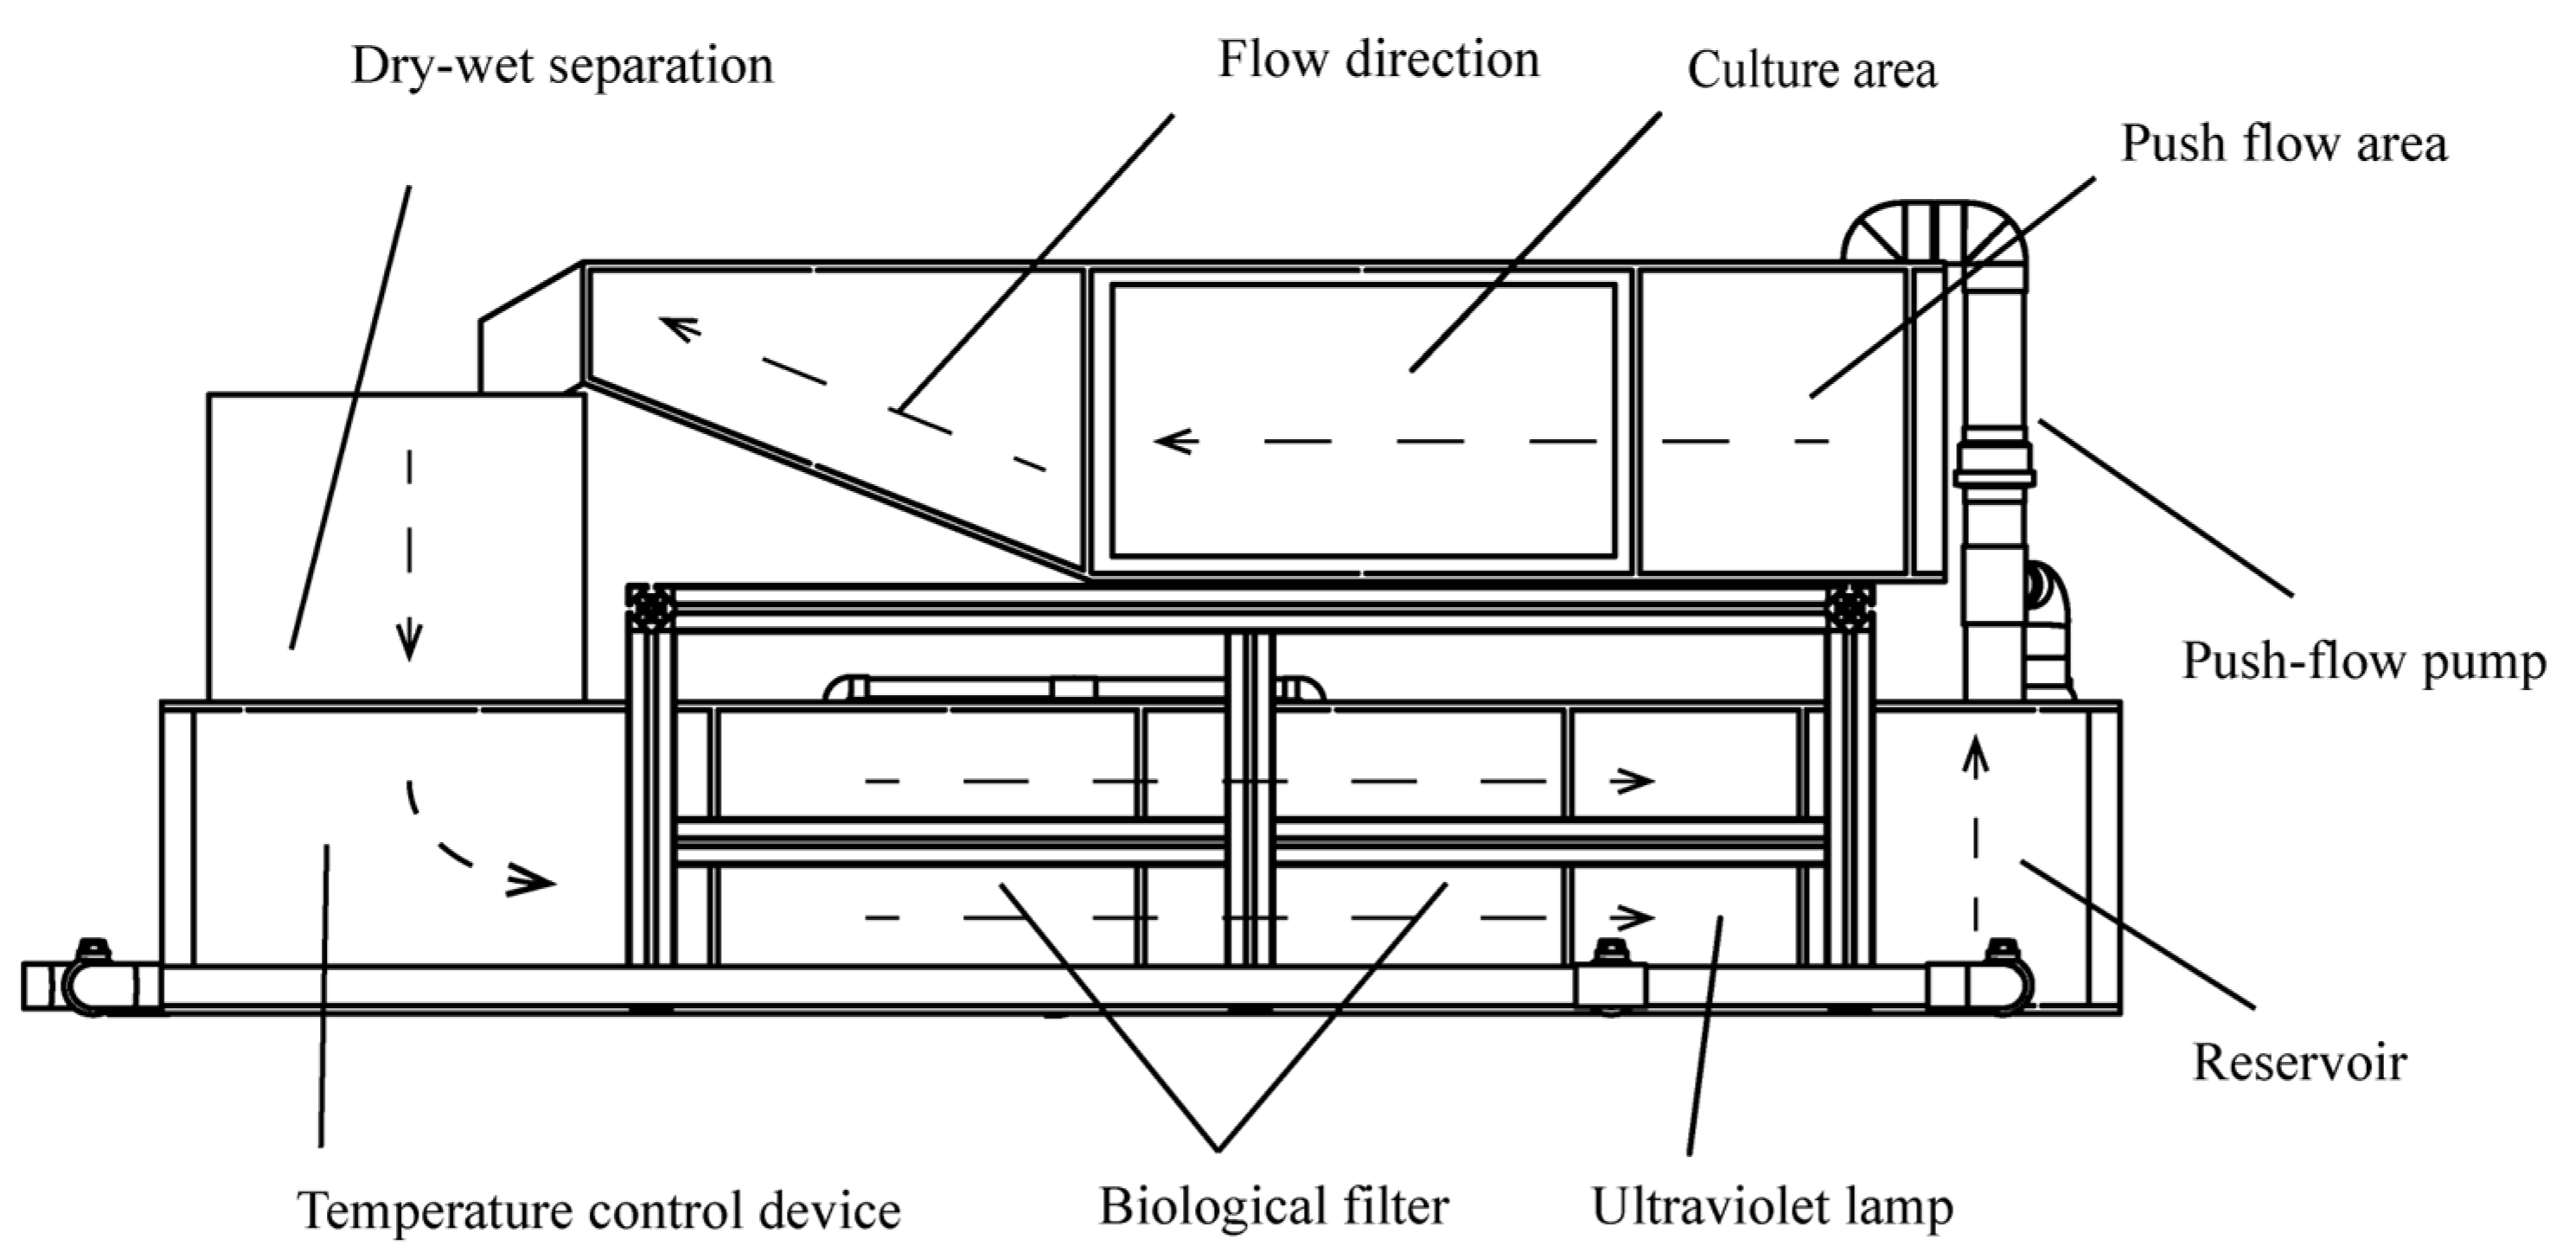
2.1. Experimental Fish and Design
2.2. Sample Collection and Processing
2.2.1. Sample Collection
2.2.2. Sample Handling
2.3. Index Measurement
2.3.1. Growth Performance Parameters’ Measurements
2.3.2. Blood Biochemical Parameters Measurements
2.3.3. Intestinal Digestive Enzyme Activity Measurements
2.3.4. Fixation and Observation of Intestinal Section
2.4. Statistical Analysis
3. Results
3.1. Growth Performance
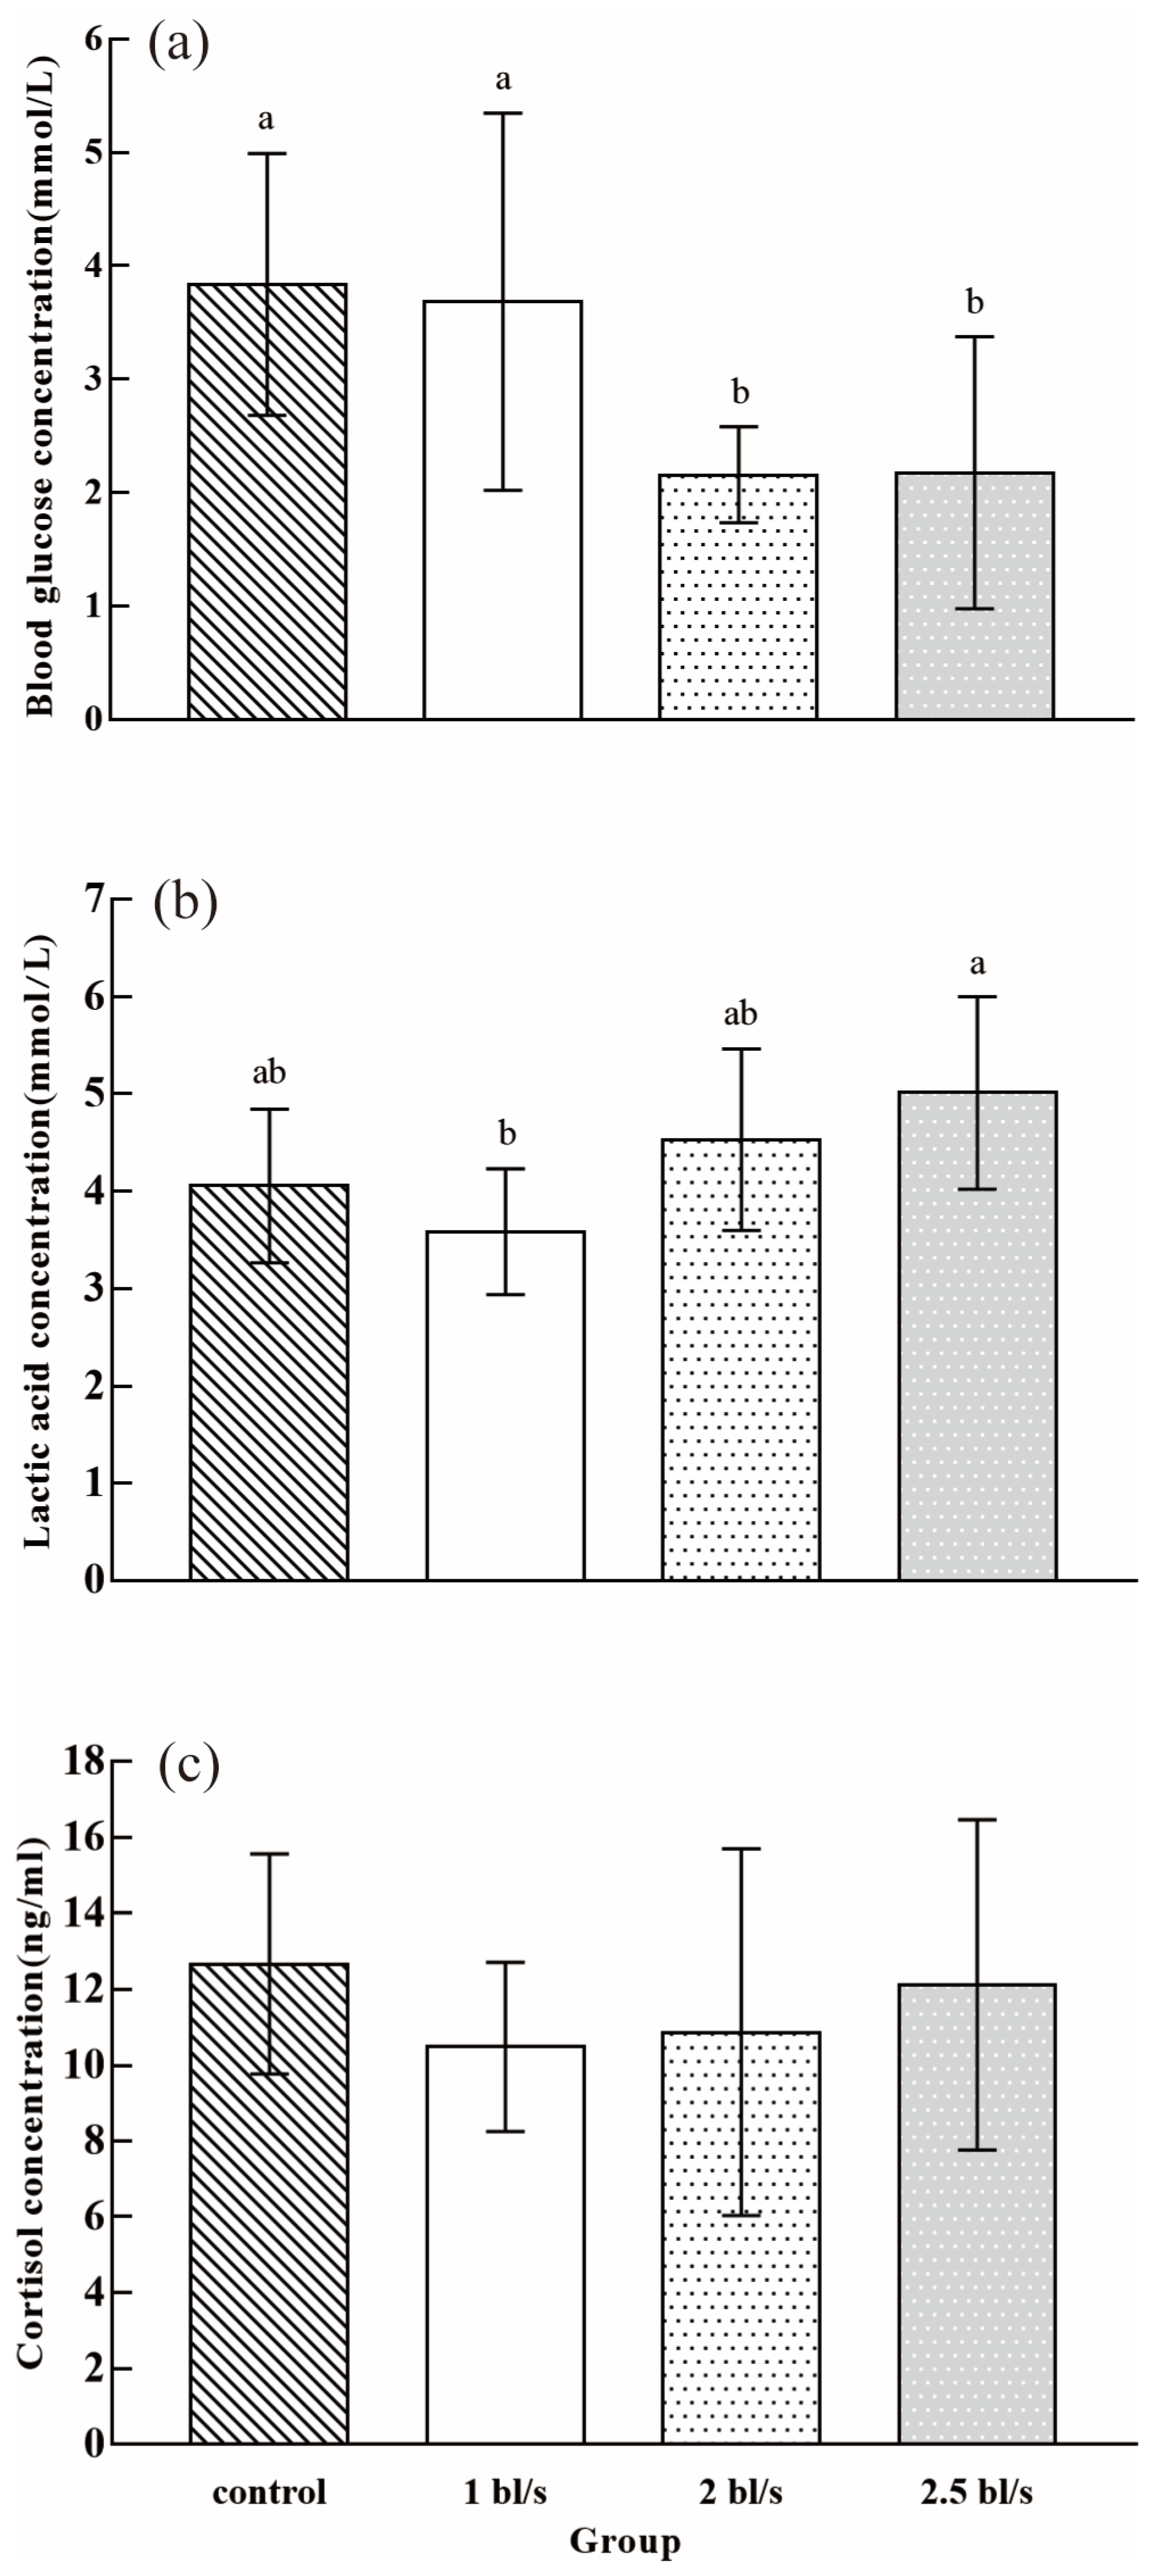
3.2. Blood Biochemistry
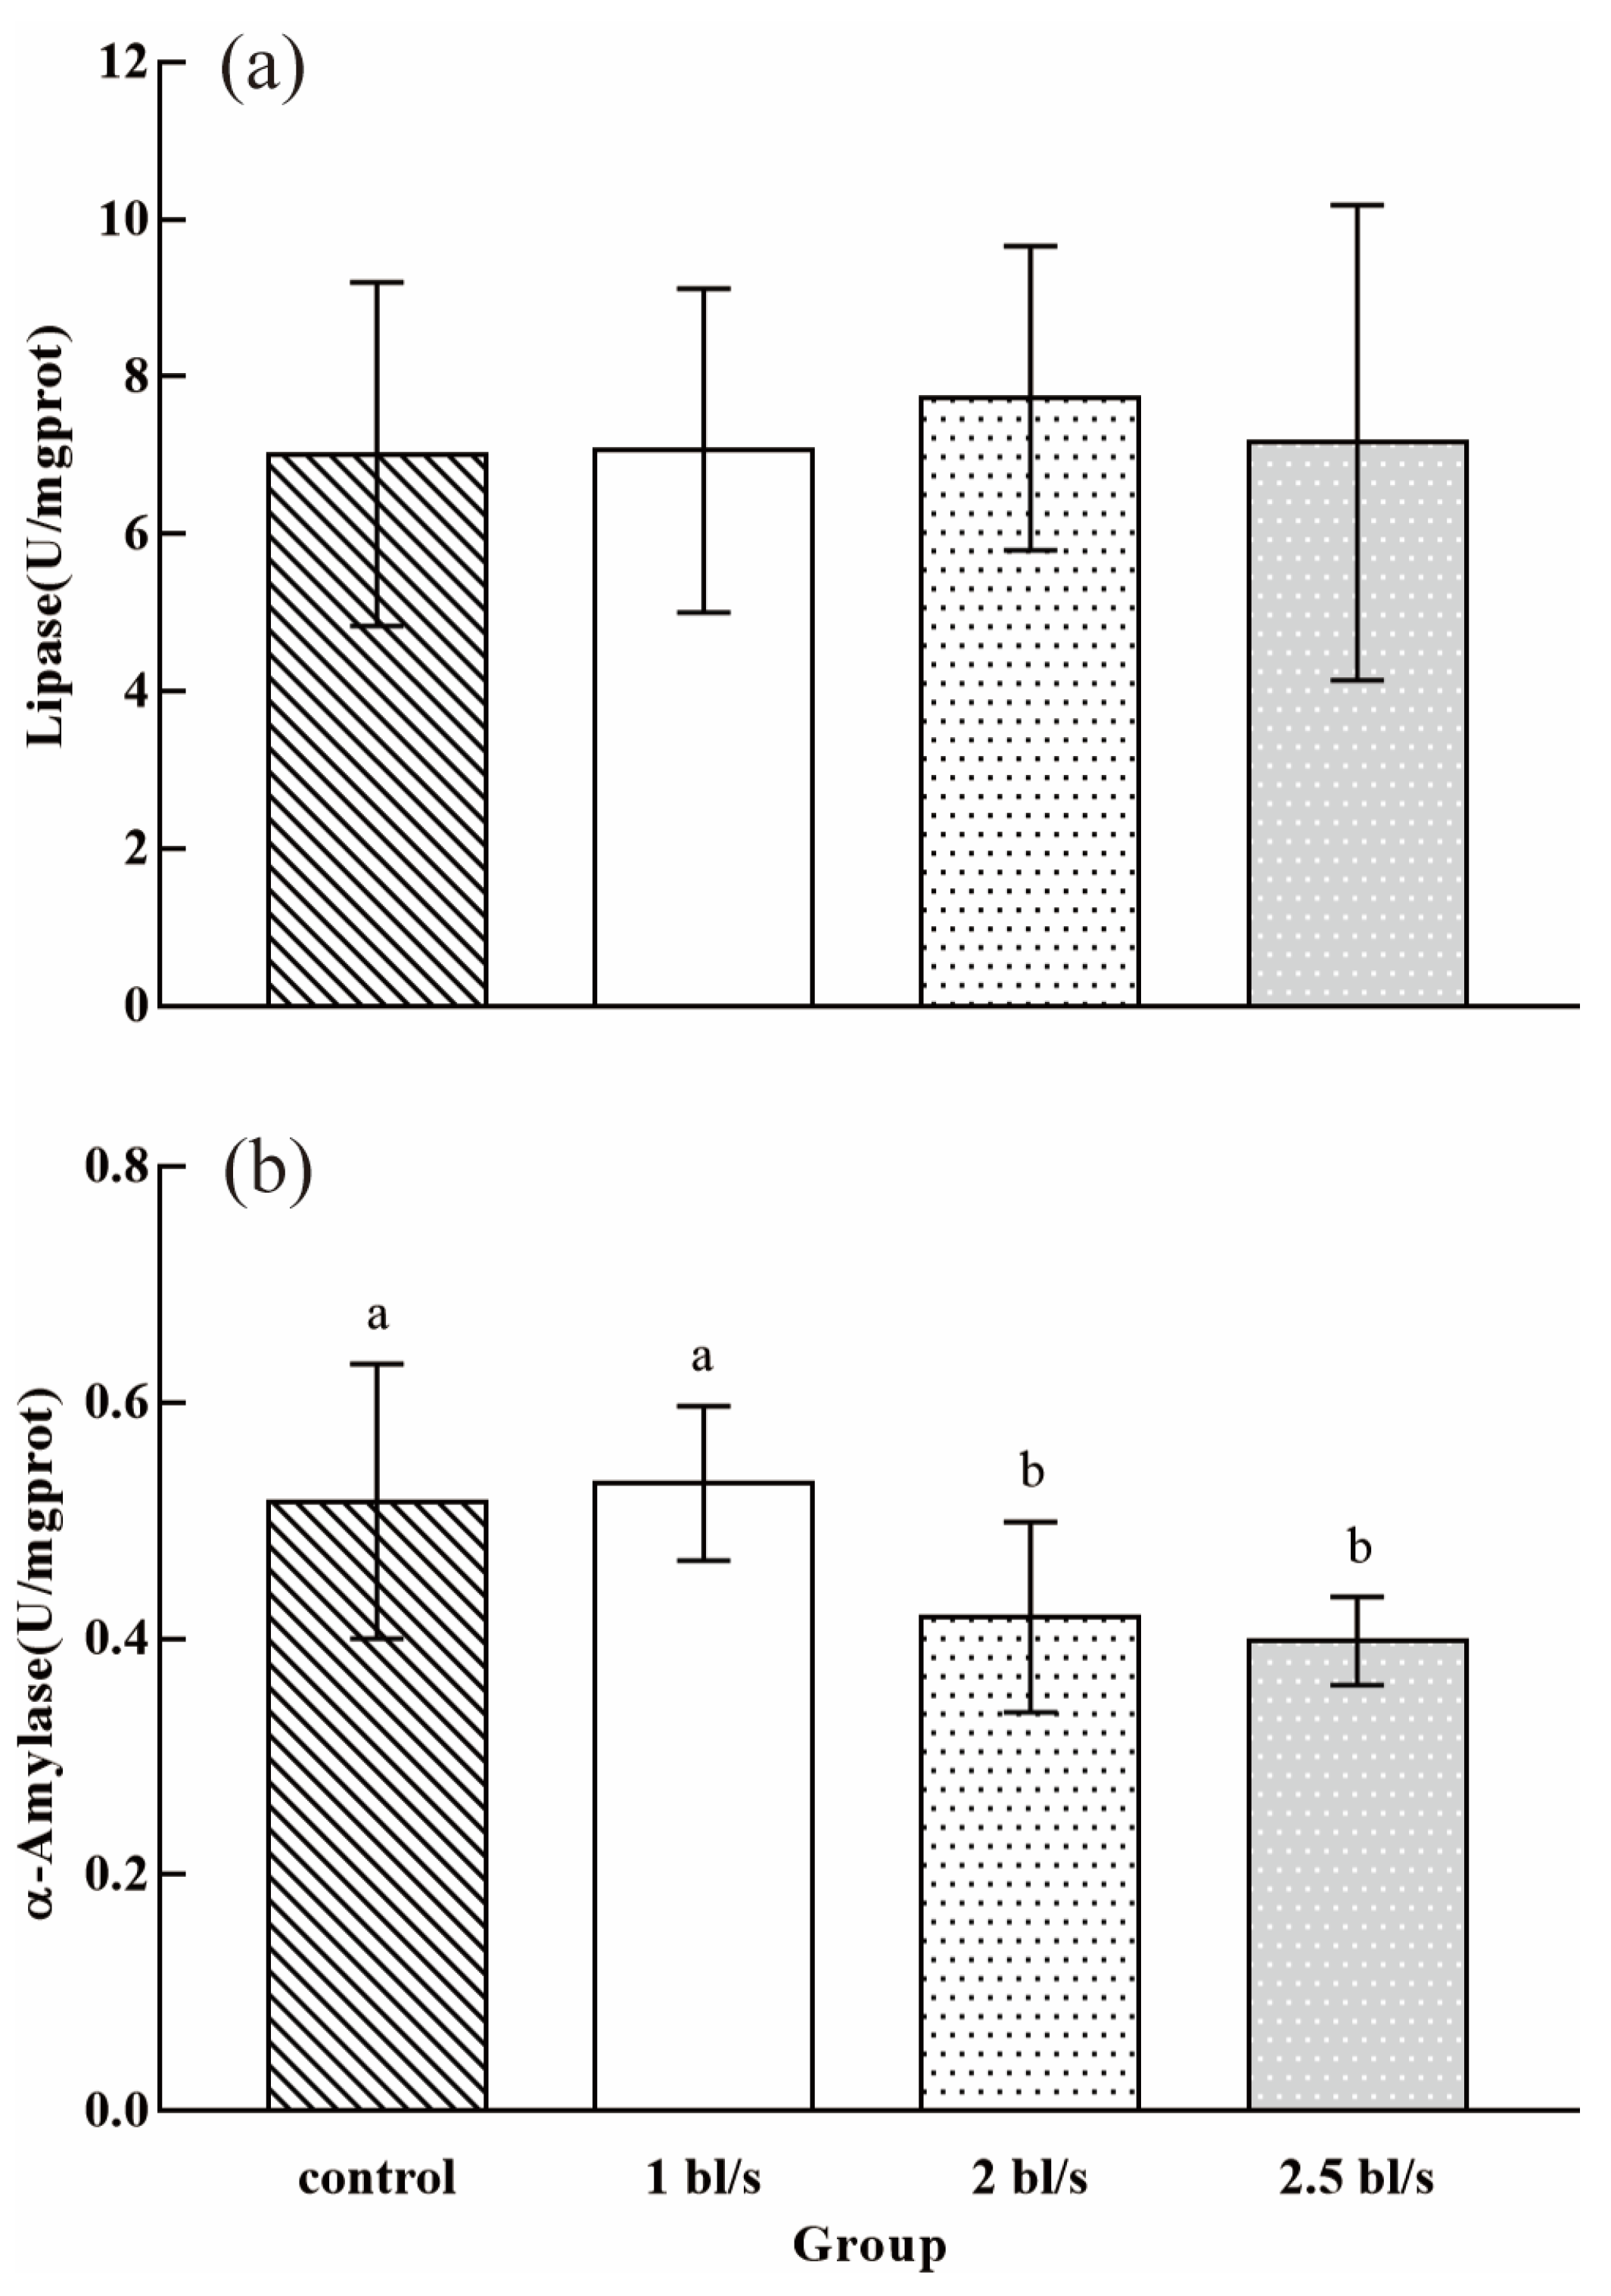
3.3. Intestinal Digestive Enzyme Activity
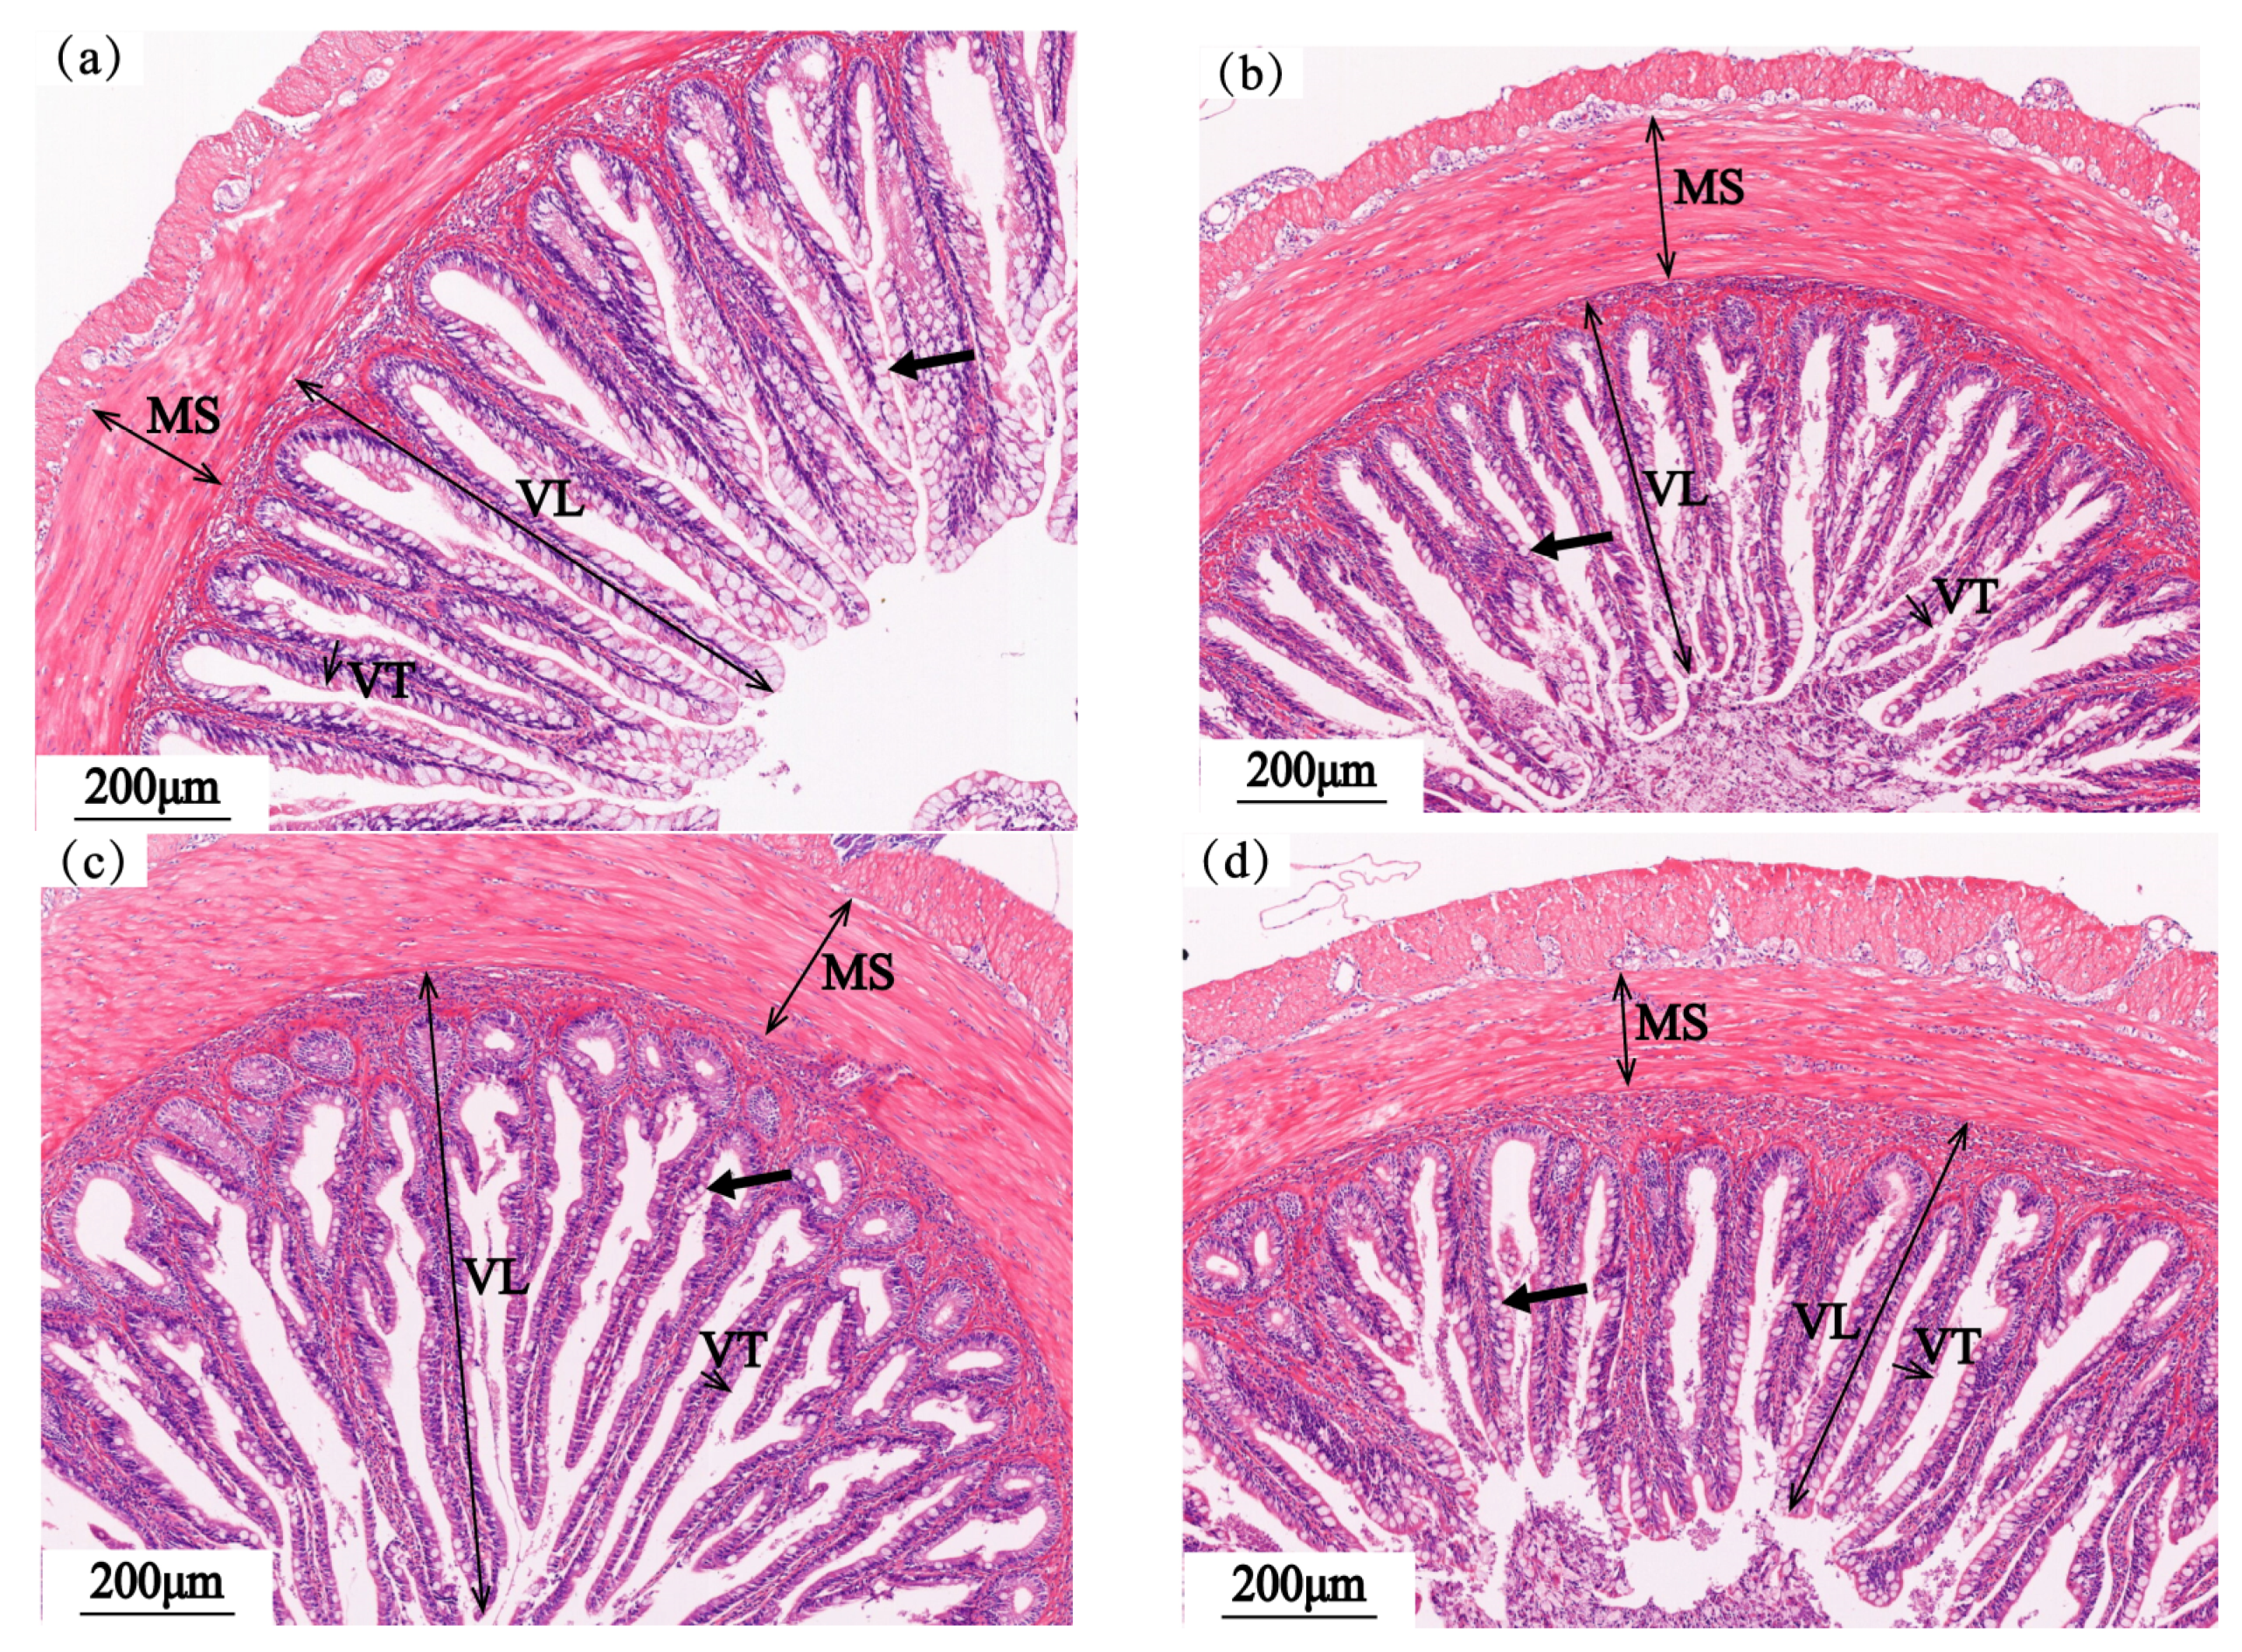
3.4. Intestinal Structure
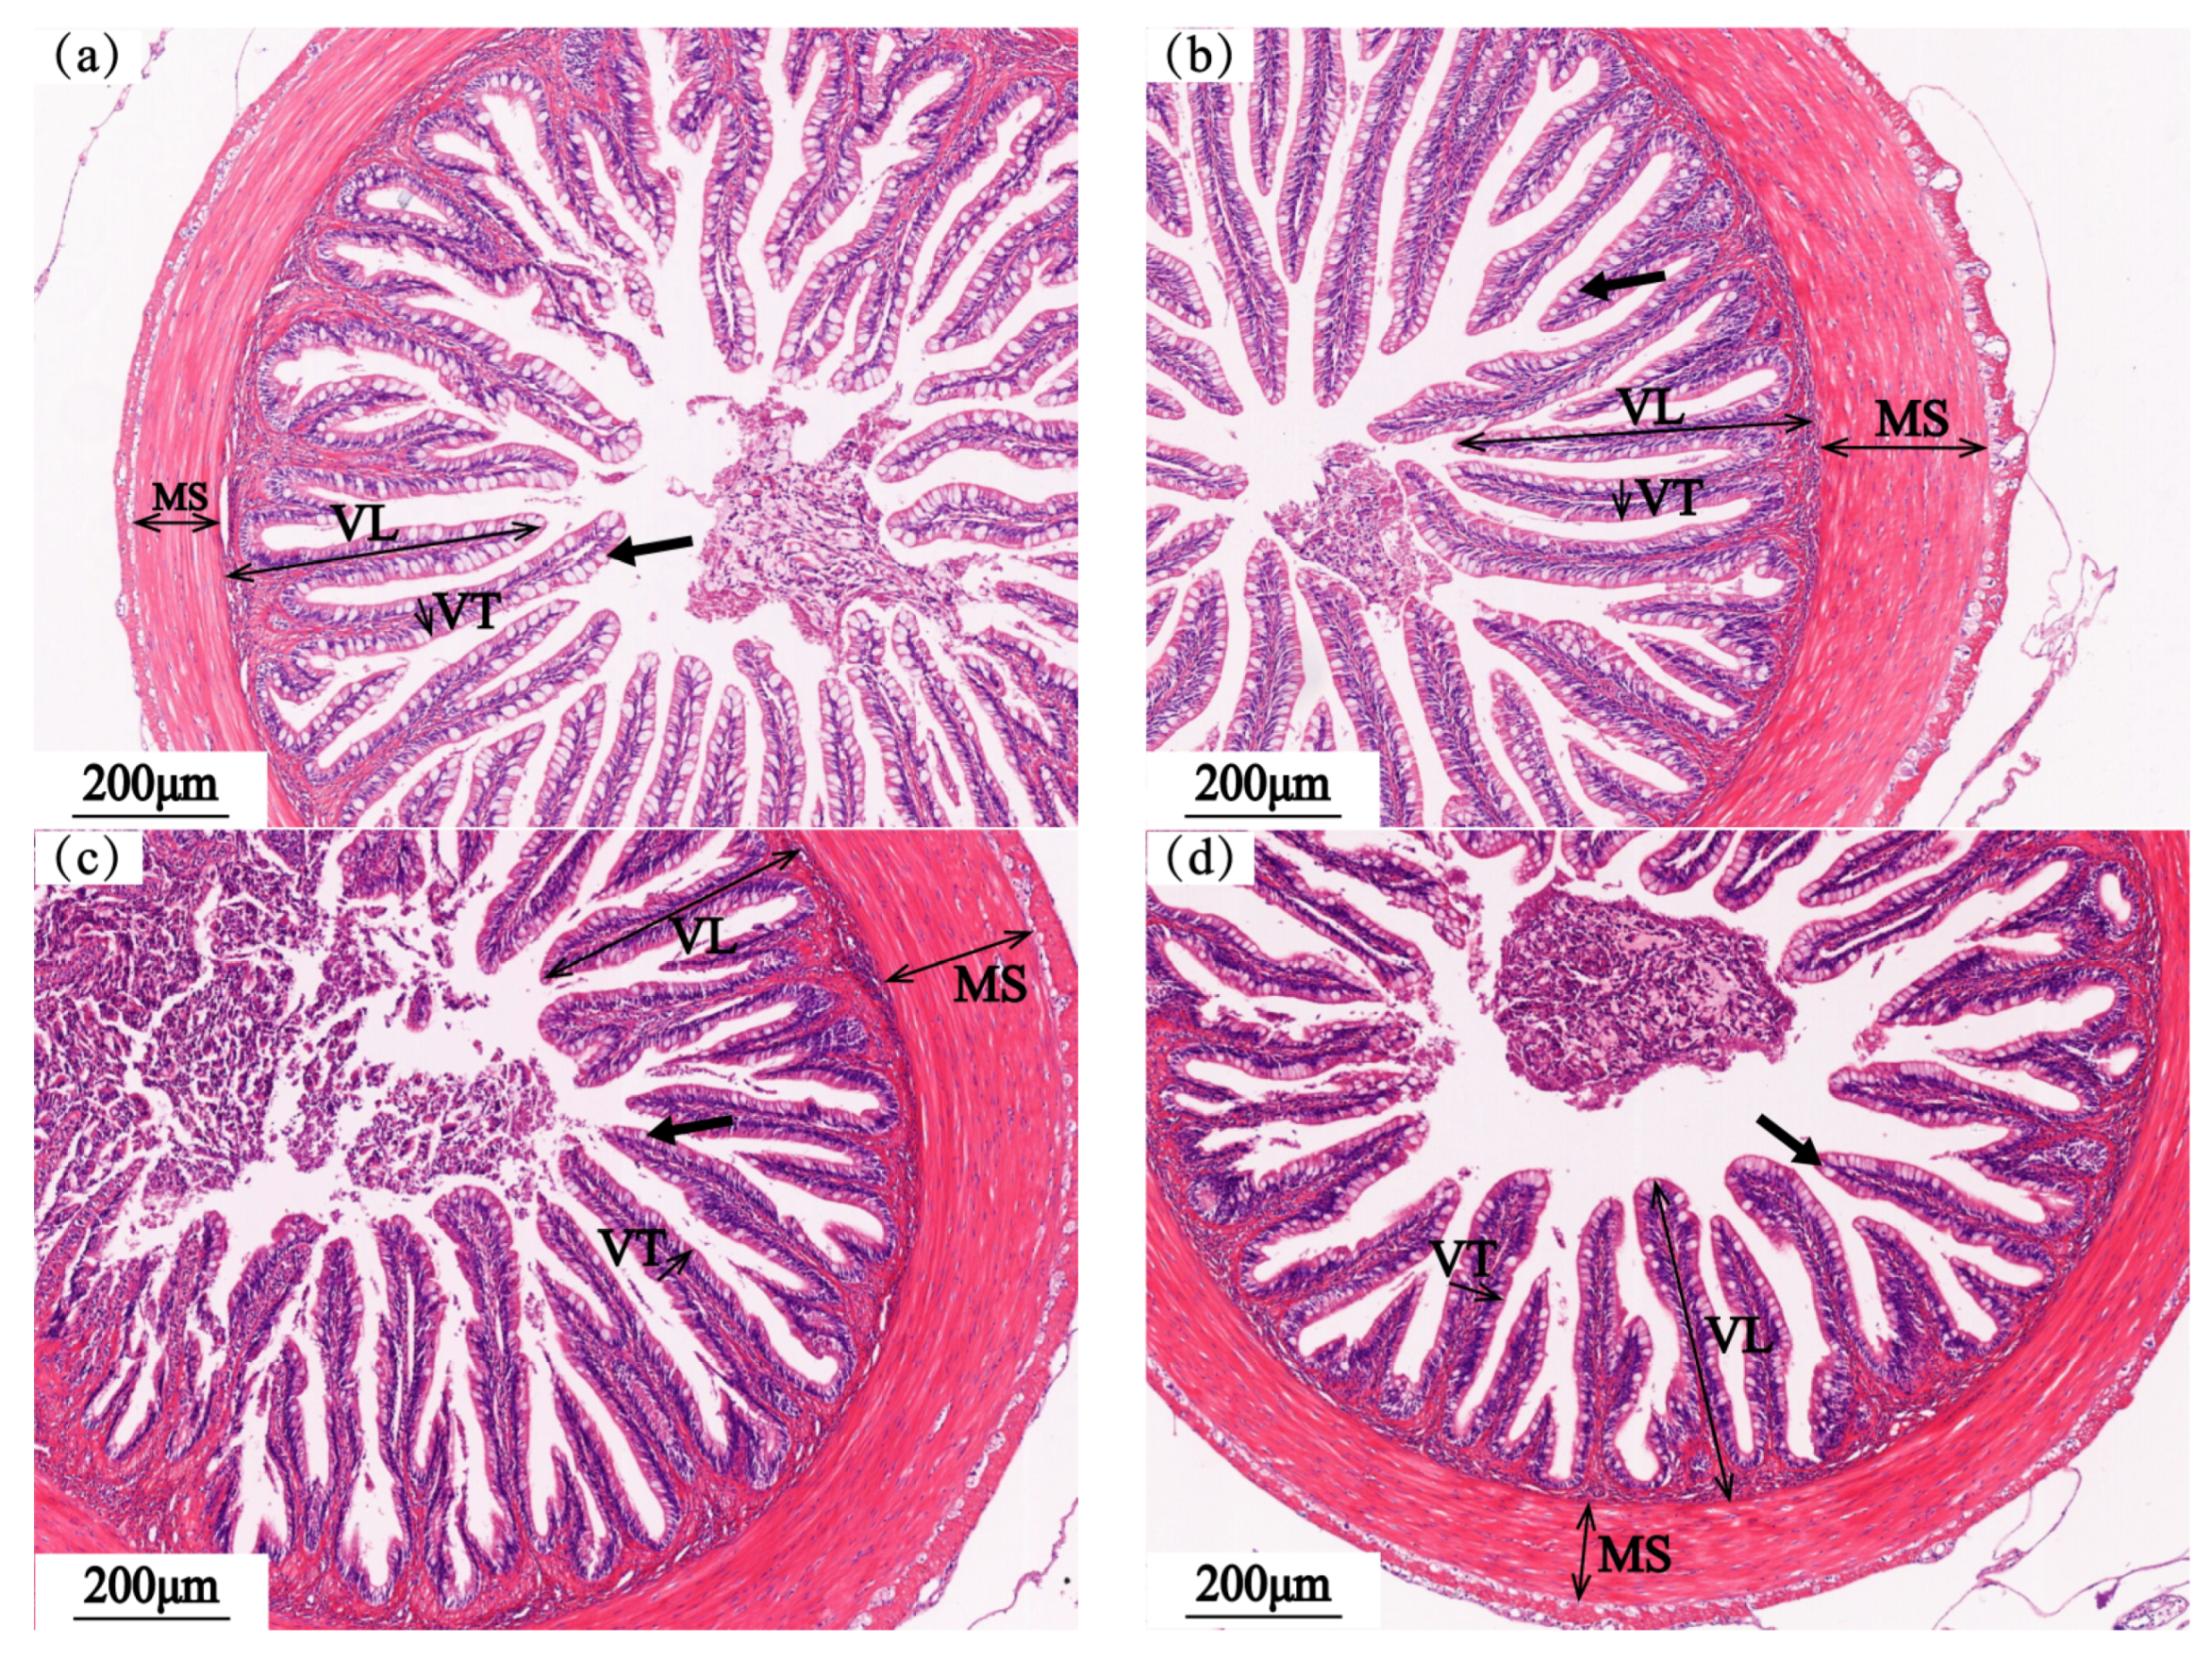
3.4.1. Foregut
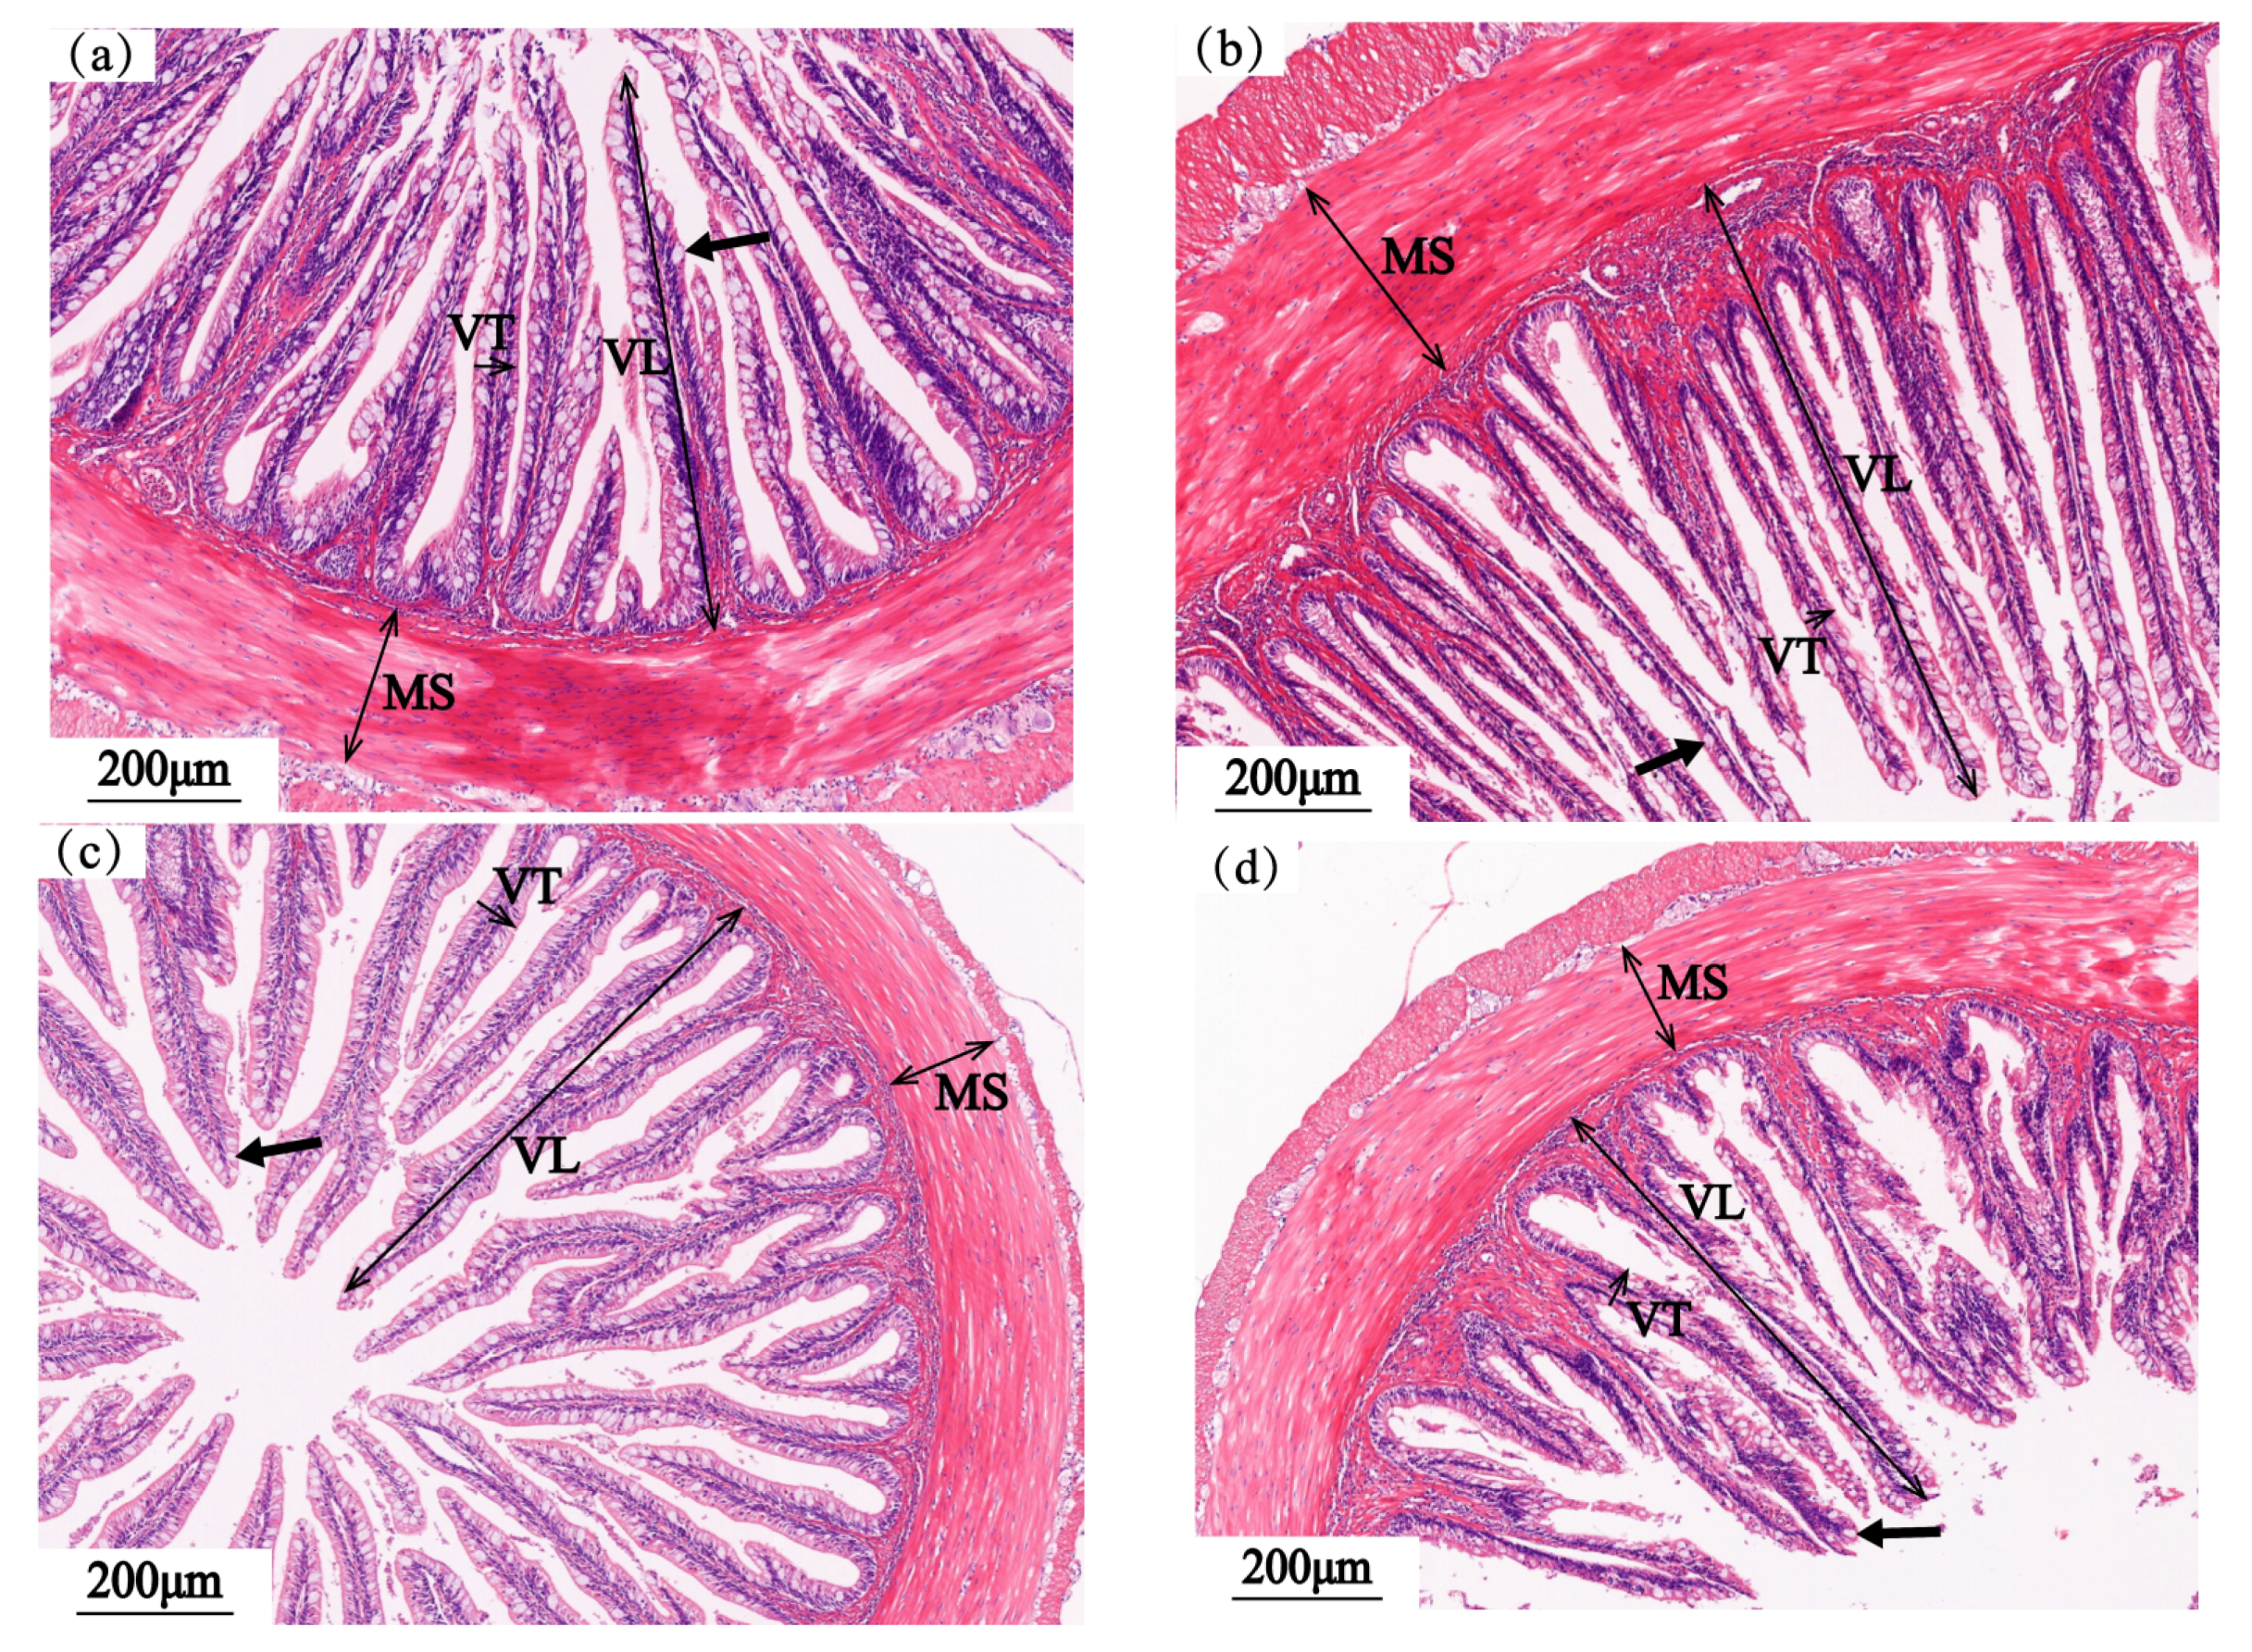
3.4.2. Midgut
3.4.3. Hindgut
4. Discussion
5. Conclusions
Author Contributions
Funding
Institutional Review Board Statement
Informed Consent Statement
Data Availability Statement
Acknowledgments
Conflicts of Interest
References
- Zhu, X.W.; Hao, R.J.; Zhang, J.P.; Tian, C.X.; Hong, Y.C.; Zhu, C.H.; Li, G.L. Improved growth performance, digestive ability, antioxidant capacity, immunity and Vibrio harveyi resistance in coral trout (Plectropomus leopardus) with dietary vitamin C. Aquac. Rep. 2022, 24, 101111. [Google Scholar] [CrossRef]
- Sun, Z.J.; Xia, S.D.; Feng, S.M.; Zhang, Z.K.; Rahman, M.M.; Rajkumar, M.; Jiang, S.G. Effects of water temperature on survival, growth, digestive enzyme activities, and body composition of the leopard coral grouper Plectropomus leopardus. Fish. Sci. 2015, 81, 107–112. [Google Scholar] [CrossRef]
- Lin, L. Effects of Environmental Factor on Growth and Blood Biochemical Indexes of Plectropomus leopardus. Master’s Thesis, Tianjin Agricultural University, Tianjin, China, 2016. [Google Scholar]
- Heinen, J.; Hankins, J.; Adler, P. Water quality and waste production in a recirculating trout-culture system with feeding of a higher-energy or a lower-energy diet. Aquac. Res. 1996, 27, 699–710. [Google Scholar] [CrossRef]
- Deng, C.; Chen, S.L.; Ye, H.Z.; Qi, X.Z.; Luo, J. Analysis of Pigment and Enzyme Levels of Plectropomus leopardus with Body Color Difference. Life Sci. Res. 2020, 24, 15–20. [Google Scholar]
- Davison, W. The effects of exercise training on teleost fish, a review of recent literature. Comp. Biochem. Physiol. Part A Physiol. 1997, 117, 67–75. [Google Scholar] [CrossRef]
- Timmerhaus, G.; Lazado, C.C.; Cabillon, N.A.R.; Reiten, B.K.M.; Johansen, L.-H. The optimum velocity for Atlantic salmon post-smolts in RAS is a compromise between muscle growth and fish welfare. Aquaculture 2021, 532, 736076. [Google Scholar] [CrossRef]
- Song, B.L.; Lin, X.T.; Xu, Z.N. Effects of upstream exercise training on feeding efficiency, growth and nutritional components of juvenile tinfoil barbs (Barbodes schwanenfeldi). J. Fish. China 2012, 36, 106–114. [Google Scholar] [CrossRef]
- Chen, Z.L.; Ye, Z.Y.; Ji, M.D.; Zhou, F.; Ding, X.Y.; Zhu, S.M.; Zhao, J. Effects of flow velocity on growth and physiology of juvenile largemouth bass (Micropterus salmoides) in recirculating aquaculture systems. Aquac. Res. 2021, 52, 3093–3100. [Google Scholar] [CrossRef]
- Li, X.Q. Study on Water Velocity and Polyculture in Recirculating Aquaculture System. Master’s Thesis, Qingdao University of Technology, Qingdao, China, 2018. [Google Scholar]
- Wei, X.L.; Yu, S.N.; Yang, Y.; Xiao, Y.Y.; Liu, Y.; Wei, F.S.; Tang, W.Q.; Li, C.H. Effects of exercise intensity on growth, blood innate immunity, hepatic antioxidant capacity, and HSPs70 mRNA expression of Epinephelus coioides. J. Fish. Sci. China 2017, 24, 1055–1064. [Google Scholar] [CrossRef]
- Li, X.; Ji, L.Q.; Wu, L.L.; Gao, X.L.; Li, X.Q.; Li, J.; Liu, Y. Effect of flow velocity on the growth, stress and immune responses of turbot (Scophthalmus maximus) in recirculating aquaculture systems. Fish Shellfish Immunol. 2019, 86, 1169–1176. [Google Scholar] [CrossRef]
- Grannell, A.; De Vito, G.; Murphy, J.C.; le Roux, C.W. The influence of skeletal muscle on appetite regulation. Expert Rev. Endocrinol. Metab. 2019, 14, 267–282. [Google Scholar] [CrossRef]
- Nadermann, N.; Volkoff, H. Effects of short-term exercise on food intake and the expression of appetite-regulating factors in goldfish. Peptides 2020, 123, 170182. [Google Scholar] [CrossRef]
- Liu, G.Y.; Wu, Y.J.; Qin, X.H.; Shi, X.T.; Wang, X.L. The effect of aerobic exercise training on growth performance, innate immune response and disease resistance in juvenile Schizothorax prenanti. Aquac. Int. 2018, 486, 18–25. [Google Scholar] [CrossRef]
- Yan, G.J.; Cao, Z.D.; Peng, J.L.; Fu, S.J. The Effects of Exercise Training on the Morphological Parameter of Juvenile Common Carp. J. Chongqing Norm. Univ. (Nat. Sci.) 2011, 28, 18–21. [Google Scholar]
- Liu, M.; Lin, Y.J.; Lian, Q.P.; Ni, M.; Gu, Z.M. Different water flow rates on the growth performance, antioxidant capacity, energy metabolism and tissue structure of micropterus salmoides under an in-pond recirculating aquaculture system. Acta Hydrobiol. Sin. 2023, 47, 25–36. [Google Scholar]
- Ma, C.X.; Zhao, J.L.; Zeng, M.D.; Song, Y.D.; Zhou, Y.H. Effects of feeding and live refeeding on glucose metabolism in Mandarinfish Siniperca chuatsi. Fish. Sci. 2021, 40, 818–825. [Google Scholar]
- Peng, S.M.; Shi, Z.H.; Li, J.; Yin, F.; Sun, P.; Wang, J.G. Effect of transportation stress on serum cortisol, glucose, tissue glycogen and lactate of juvenile silver pomfret (Pampus argenteus). J. Fish. China 2011, 35, 831–837. [Google Scholar] [CrossRef]
- Yu, S.N.; Wei, X.L.; Wei, F.S.; Xiao, Y.Y.; Li, C.H. Effects of different exercise intensity on growth and serum and liver antioxidant indices of sparus macrocephalus. Acta Hydrobiol. Sin. 2018, 42, 255–263. [Google Scholar]
- Wang, Y.R.; Li, E.C.; Chen, L.Q.; Wang, X.D.; Zhang, F.Y.; Gao, L.J.; Long, L.N. Effect of acute salinity stress on soluble protein, hemocyanin, haemolymph glucose and hepatopancreas glycogen of eriocheir sinensis. Acta Hydrobiol. Sin. 2012, 36, 1056–1062. [Google Scholar] [CrossRef]
- Song, B.L. Effects of Water Current on Swimming Activity, Growth and Ecophysiological Aspect of Young Barbodes Schwanenfeldi. Ph.D. Thesis, Jinan University, Guangzhou, China, 2008. [Google Scholar]
- Robles-Romo, A.; Zenteno-Savín, T.; Racotta, I.S. Bioenergetic status and oxidative stress during escape response until exhaustion in whiteleg shrimp Litopenaeus vannamei. J. Exp. Mar. Biol. Ecol. 2016, 478, 16–23. [Google Scholar] [CrossRef]
- Chai, R.Y.; Yin, H.; Huo, R.M.; Wang, H.Y.; Huang, L.; Wang, P. Sustained Swimming on the Endurance Time and Physiological Metabolism of Acanthopagrus Schlegeli and Sciaenops Ocellatus. 2022. Available online: http://ssswxb.ihb.ac.cn/article/doi/10.7541/2023.2022.0186 (accessed on 31 August 2022).
- Zhu, P.J. Effects of Different Water Velocities on Oxygen Consumption Rate, Morphological and Energy Metabolism of Grass Carp (Ctenopharyngodon idella). Master’s Thesis, Huazhong Agricultural University, Wuhan, China, 2022. [Google Scholar]
- Sun, G.X.; Li, M.; Wang, J.; Liu, Y. Effects of flow rate on growth performance and welfare of juvenile turbot (Scophthalmus maximus L.) in recirculating aquaculture systems. Aquac. Res. 2016, 47, 1341–1352. [Google Scholar] [CrossRef]
- Zahedi, S.; Mirvaghefi, A.; Rafati, M.; Mehrpoosh, M. Cadmium accumulation and biochemical parameters in juvenile Persian sturgeon, Acipenser persicus, upon sublethal cadmium exposure. Comp. Clin. Pathol. 2013, 22, 805–813. [Google Scholar] [CrossRef]
- Chen, Z.L. Effect of Flow Velocity on Largemouth Bass (Micropterus salmoides) Juveniles in Recirculating Aquaculture Systems. Master’s Thesis, Zhejiang University, Hangzhou, China, 2021. [Google Scholar]
- Li, P.; Chen, J.; Yu, D.H.; Li, Q.; Wang, G.Y.; Wei, H.J.; Sun, R.L.; Wang, S.R.; Sun, Y.H. Effects of transportation density and time on cortisol, lactate and glycogen of ancherythroculter nigrocauda. Acta Hydrobiol. Sin. 2020, 44, 415–422. [Google Scholar]
- Zhao, L.Q.; Song, B.L. Effects of flow velocity on the behavior and digestive enzymes of juvenile tilapia. Hebei Fish. 2017, 279, 21–23. [Google Scholar]
- Xu, Y.Q. Effects of Flow Rate on Growth, Nonspecific Immunity and Fatty Acid Composition in Juvenile Phoxinus Lagowskii Dybowskii. Master’s Thesis, Dalian Ocean University, Dalian, China, 2020. [Google Scholar]
- Wang, Y.B.; Zhang, J.; Li, X.M. Types and distribution of mucous cells in the digestive tract of Plectropomus leopardus. Mar. Fish. 2016, 38, 478–486. [Google Scholar]
- Uni, Z.; Noy, Y.; Sklan, D. Posthatch changes in morphology and function of the small intestines in heavy-and light-strain chicks. Poult. Sci. 1995, 74, 1622–1629. [Google Scholar] [CrossRef] [PubMed]


| Item | Control | 1 bl/s Water Flow Velocity | 2 bl/s Water Flow Velocity | 2.5 bl/s Water Flow Velocity |
|---|---|---|---|---|
| FC | 1.17 ± 0.14 b | 1.14 ± 0.12 b | 1.36 ± 0.21 ab | 1.48 ± 0.23 a |
| WGR (%) | 47.54 ± 5.63 a | 47.73 ± 5.55 a | 40.44 ± 5.63 ab | 37.92 ± 5.57 b |
| SGR (%) | 0.93 ± 0.09 a | 0.93 ± 0.09 a | 0.81 ± 0.10 ab | 0.76 ± 0.10 b |
| CF (%) | 2.53 ± 0.20 | 2.68 ± 0.05 | 2.63 ± 0.10 | 2.51 ± 0.08 |
| HIS (%) | 1.16 ± 0.16 | 1.22 ± 0.07 | 1.33 ± 0.18 | 1.24 ± 0.01 |
| VSI (%) | 5.06 ± 0.48 a | 4.70 ± 0.42 ab | 4.25 ± 0.13 b | 4.40 ± 0.41 ab |
| Item | Control | 1 bl/s Water Flow Velocity | 2 bl/s Water Flow Velocity | 2.5 bl/s Water Flow Velocity |
|---|---|---|---|---|
| VL (μm) | 749.83 ± 21.17 a | 565.72 ± 25.18 b | 832.54 ± 59.57 a | 764.4 ± 64.33 a |
| MS (μm) | 198.72 ± 7.92a b | 202.85 ± 38.01 ab | 227.49 ± 20.69 a | 190.8 ± 21.5 b |
| VT (μm) | 60.72 ± 7.28 b | 54.54 ± 7.65 b | 84.31 ± 12.74 a | 68.58 ± 7.12 b |
| Item | Control | 1 bl/s Water Flow Velocity | 2 bl/s Water Flow Velocity | 2.5 bl/s Water Flow Velocity |
|---|---|---|---|---|
| VL (μm) | 498.13 ± 31.35 ab | 523.97 ± 50.27 a | 433.67 ± 27.69 b | 443.2 ± 47.22 b |
| MS (μm) | 110.88 ± 12.76 c | 160.6 ± 16.83 b | 235.57 ± 28.63 a | 129.26 ± 6.27 c |
| VT (μm) | 54.51 ± 6.64 ab | 59.45 ± 7.71 a | 48.77 ± 5.88 b | 57.81 ± 3.43 ab |
| Item | Control | 1 bl/s Water Flow Velocity | 2 bl/s Water Flow Velocity | 2.5 bl/s Water Flow Velocity |
|---|---|---|---|---|
| VL (μm) | 628.24 ± 43.82 b | 838.13 ± 47.86 a | 627.75 ± 68.6 b | 684.7 ± 56.29 b |
| MS (μm) | 185.87 ± 13.17 b | 216.57 ± 25.83 a | 178.45 ± 22.08 b | 171.56 ± 7.89 b |
| VT (μm) | 67.8 ± 7.26 ab | 54.01 ± 8.76 b | 64.15 ± 9.47 ab | 69.99 ± 11.34 a |
Disclaimer/Publisher’s Note: The statements, opinions and data contained in all publications are solely those of the individual author(s) and contributor(s) and not of MDPI and/or the editor(s). MDPI and/or the editor(s) disclaim responsibility for any injury to people or property resulting from any ideas, methods, instructions or products referred to in the content. |
© 2023 by the authors. Licensee MDPI, Basel, Switzerland. This article is an open access article distributed under the terms and conditions of the Creative Commons Attribution (CC BY) license (https://creativecommons.org/licenses/by/4.0/).
Share and Cite
Qian, Z.; Xu, J.; Liu, A.; Shan, J.; Zhang, C.; Liu, H. Effects of Water Velocity on Growth, Physiology and Intestinal Structure of Coral Trout (Plectropomus leopardus). J. Mar. Sci. Eng. 2023, 11, 862. https://doi.org/10.3390/jmse11040862
Qian Z, Xu J, Liu A, Shan J, Zhang C, Liu H. Effects of Water Velocity on Growth, Physiology and Intestinal Structure of Coral Trout (Plectropomus leopardus). Journal of Marine Science and Engineering. 2023; 11(4):862. https://doi.org/10.3390/jmse11040862
Chicago/Turabian StyleQian, Zhenjia, Jincheng Xu, Andong Liu, Jianjun Shan, Chenglin Zhang, and Huang Liu. 2023. "Effects of Water Velocity on Growth, Physiology and Intestinal Structure of Coral Trout (Plectropomus leopardus)" Journal of Marine Science and Engineering 11, no. 4: 862. https://doi.org/10.3390/jmse11040862