
A Semi-Analytical Method for the Sealing Performance Prediction of Subsea Pipeline Compression Connector
 , , ,
, , ,
Abstract
:1. Introduction
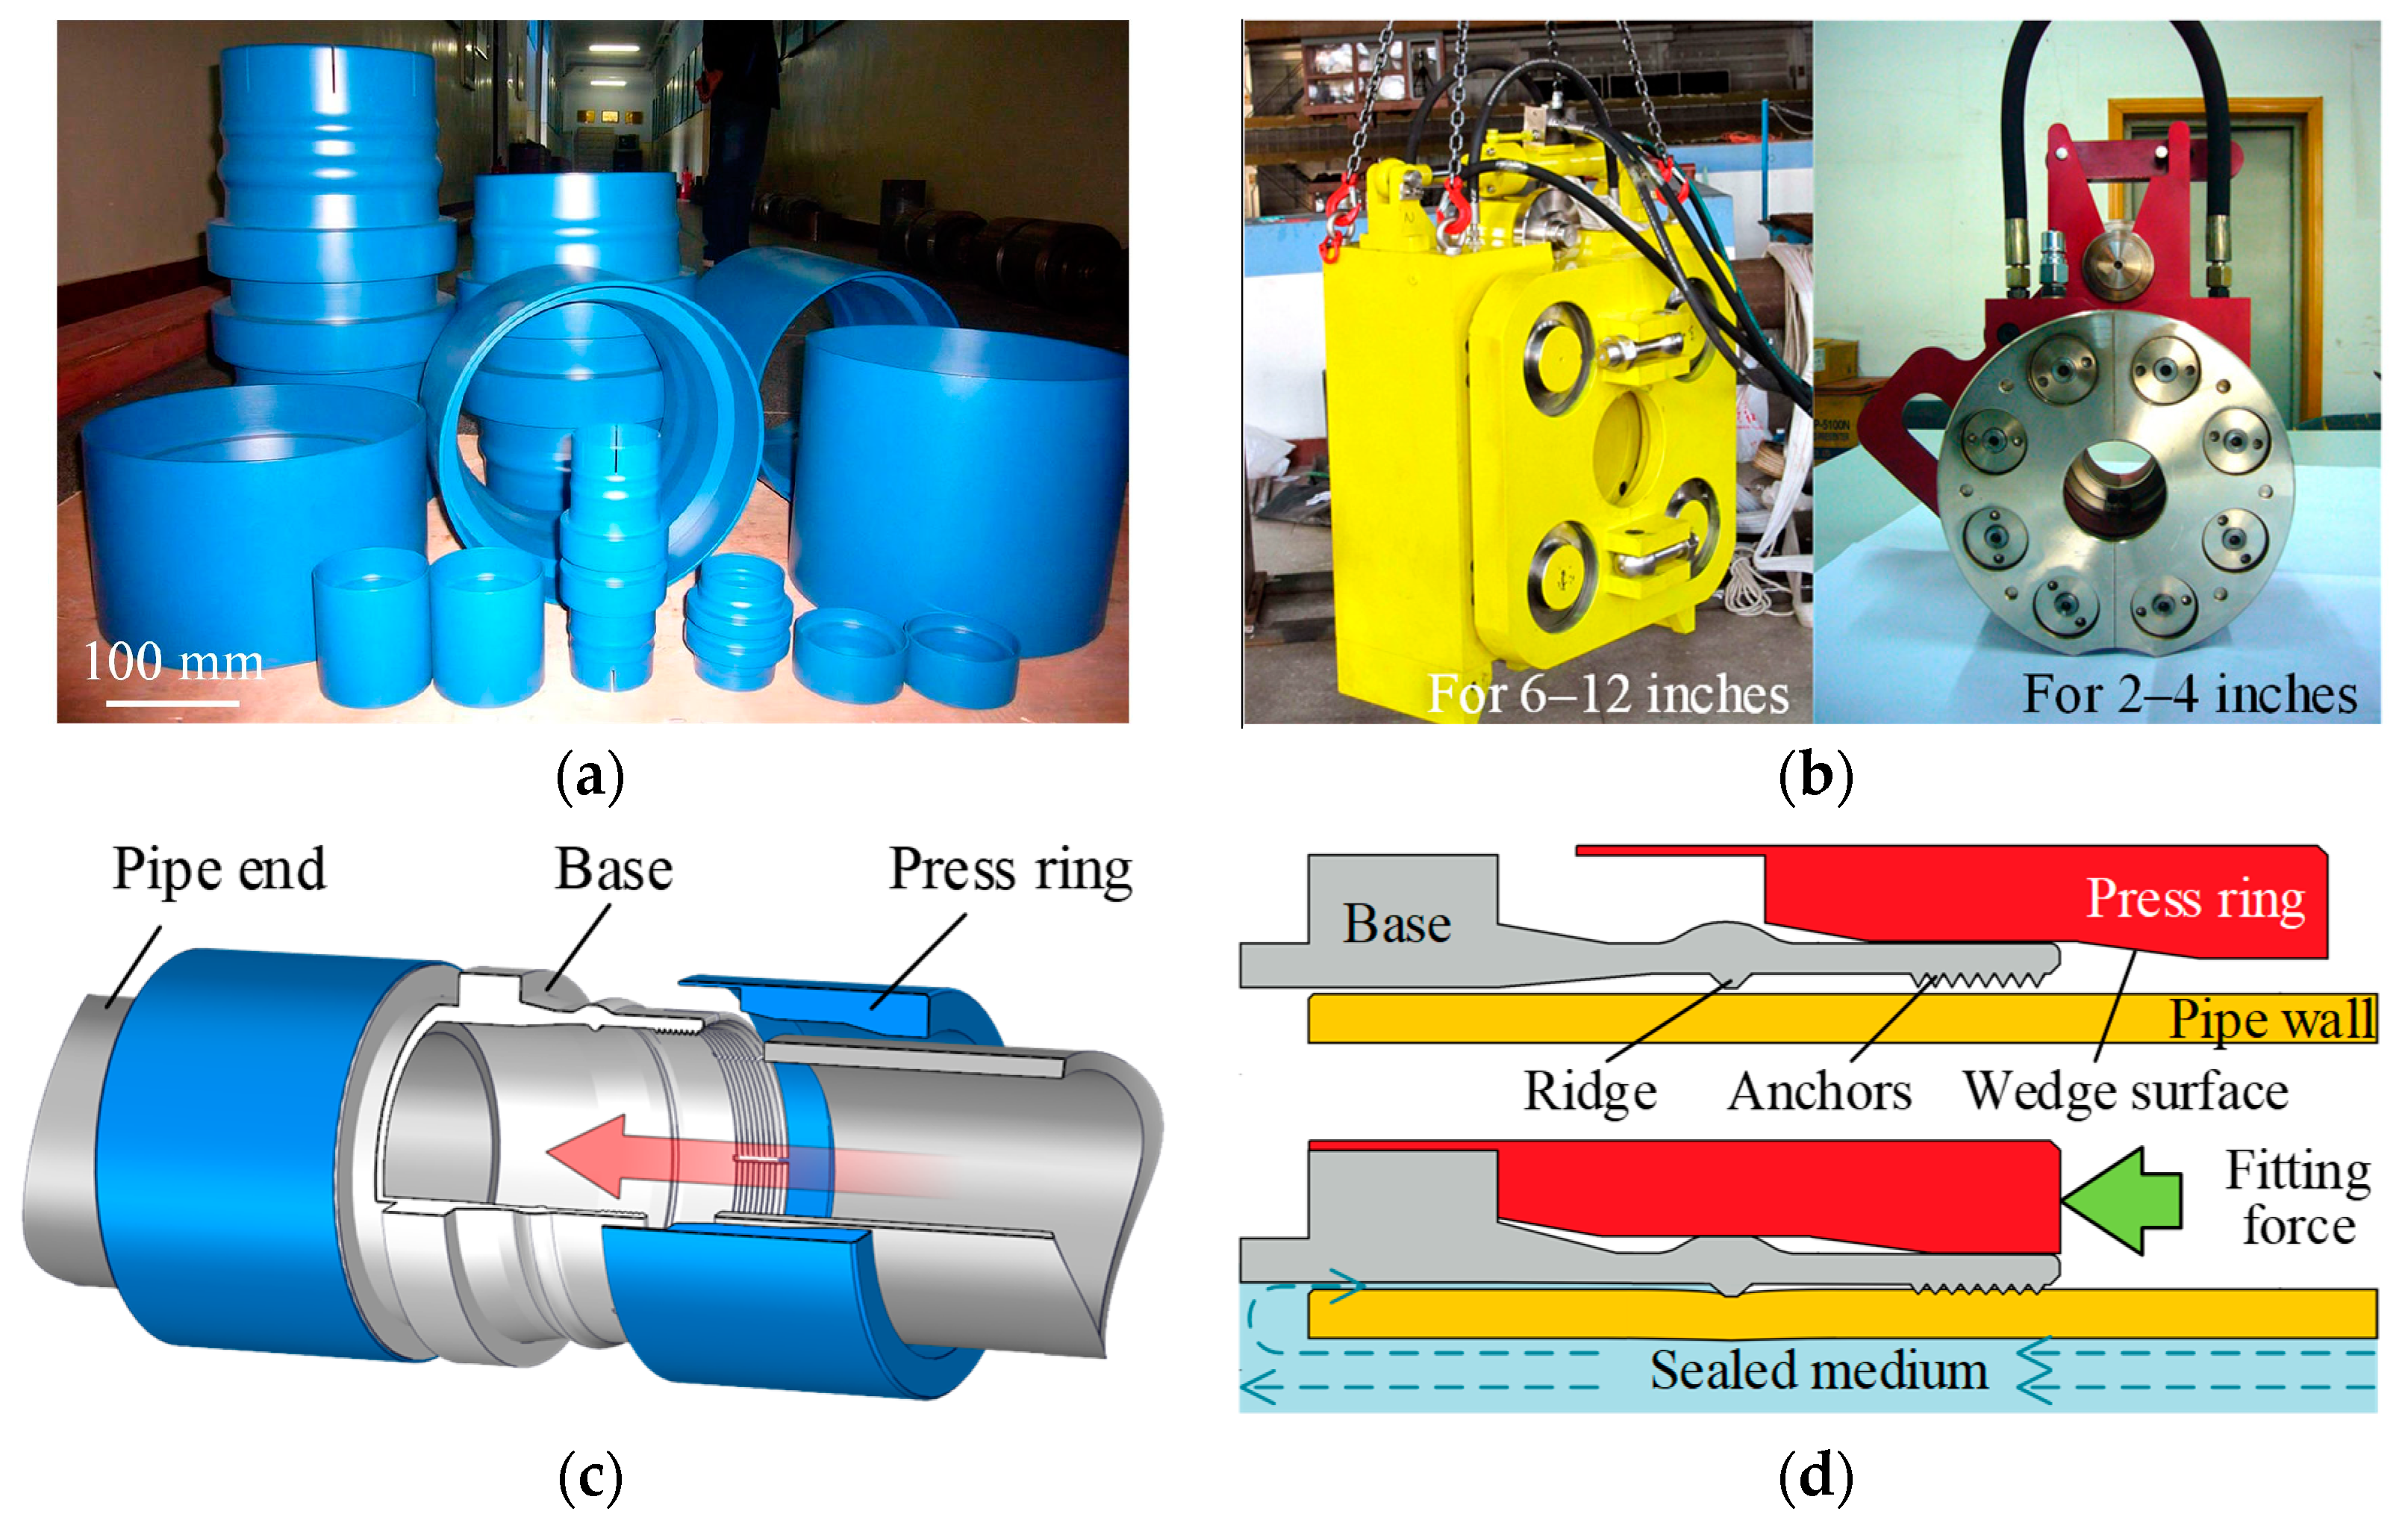
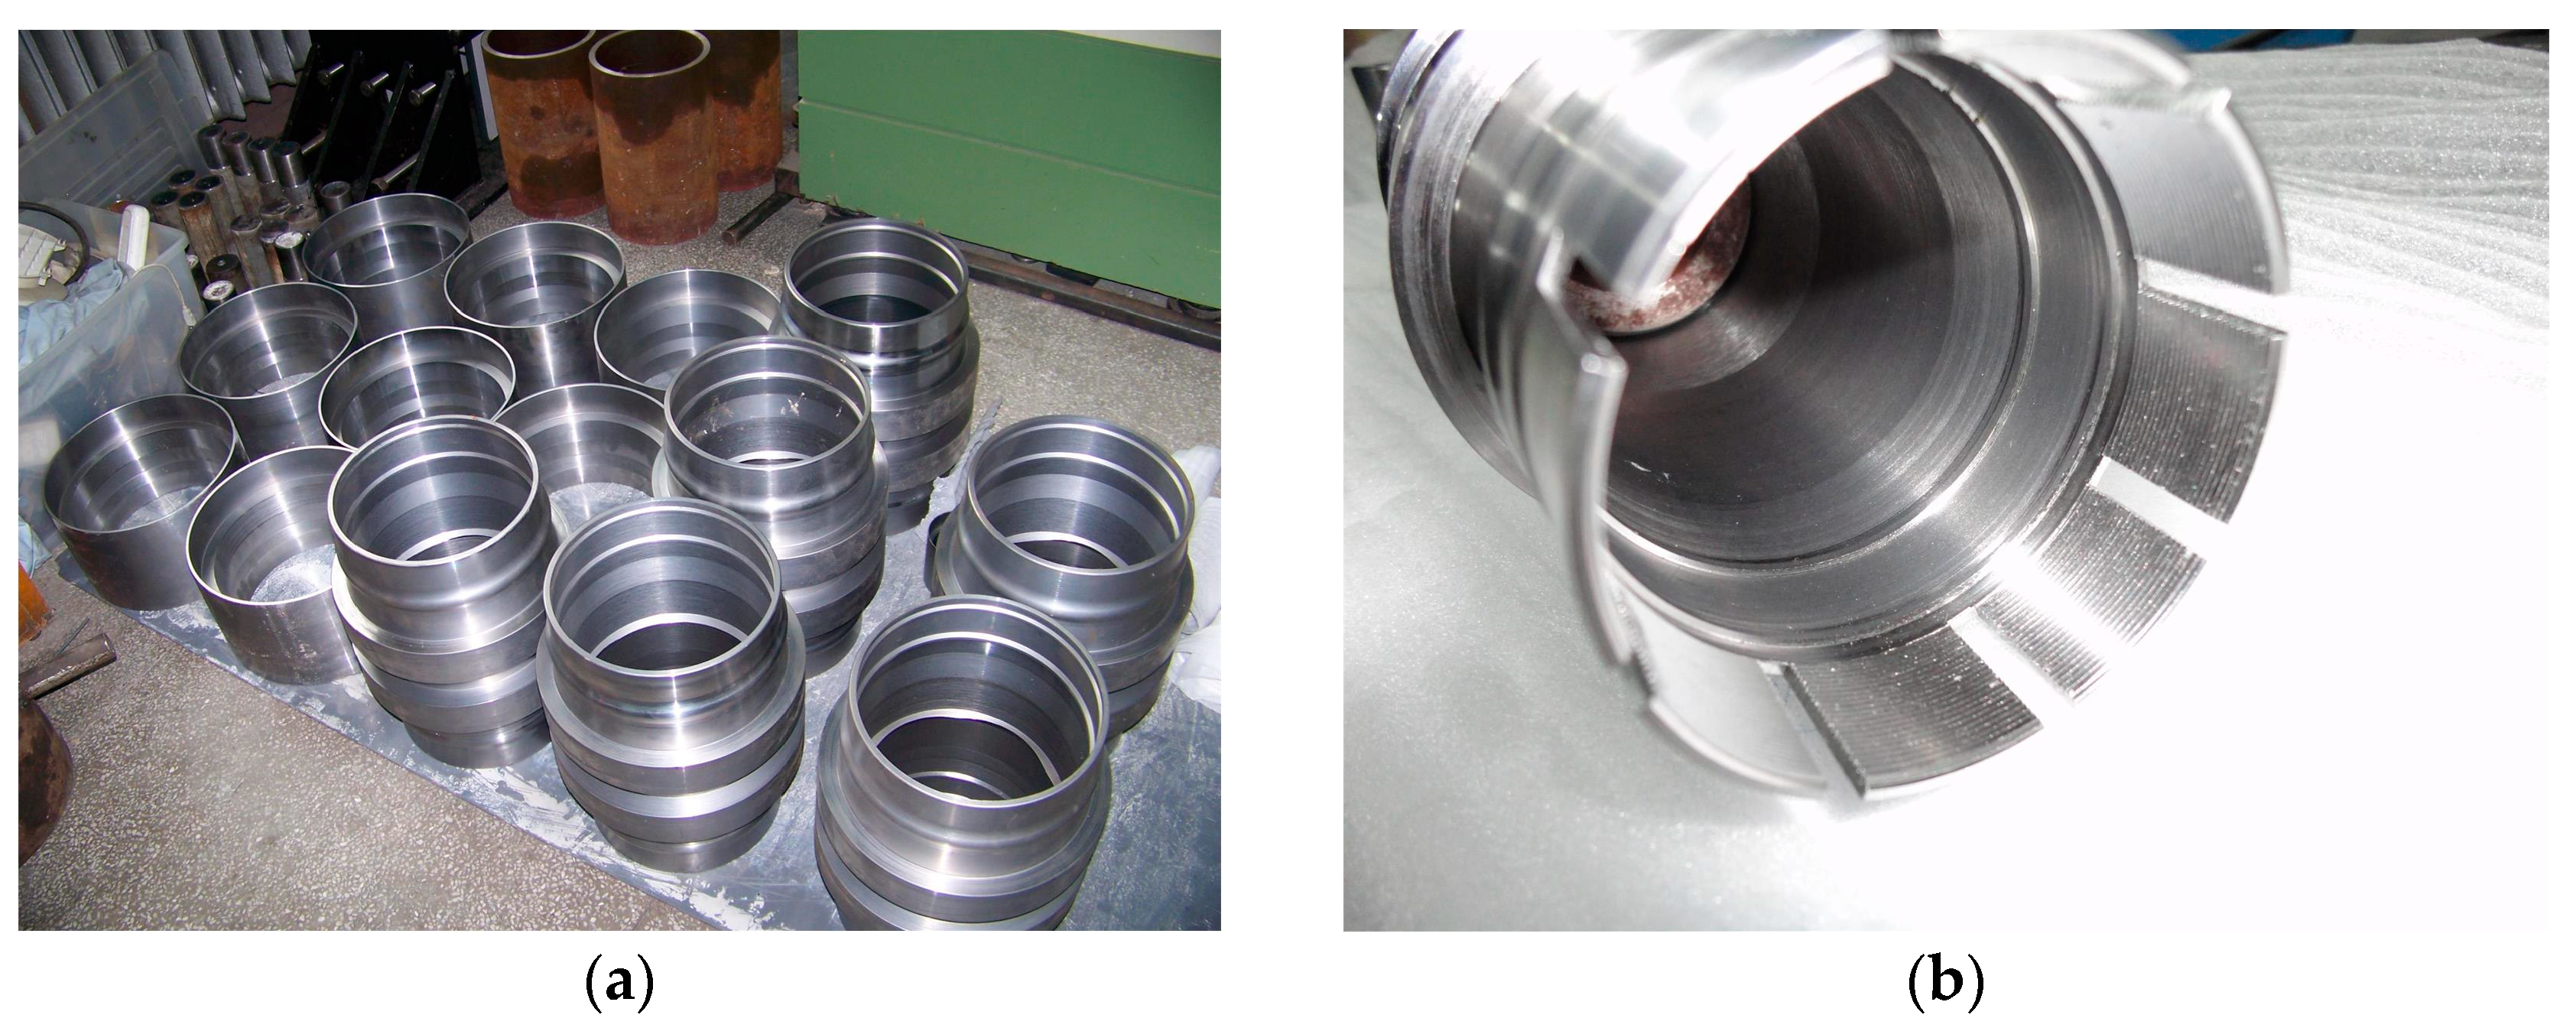
2. Connector Fitting Process
3. Analytical Model of the Fitting Process
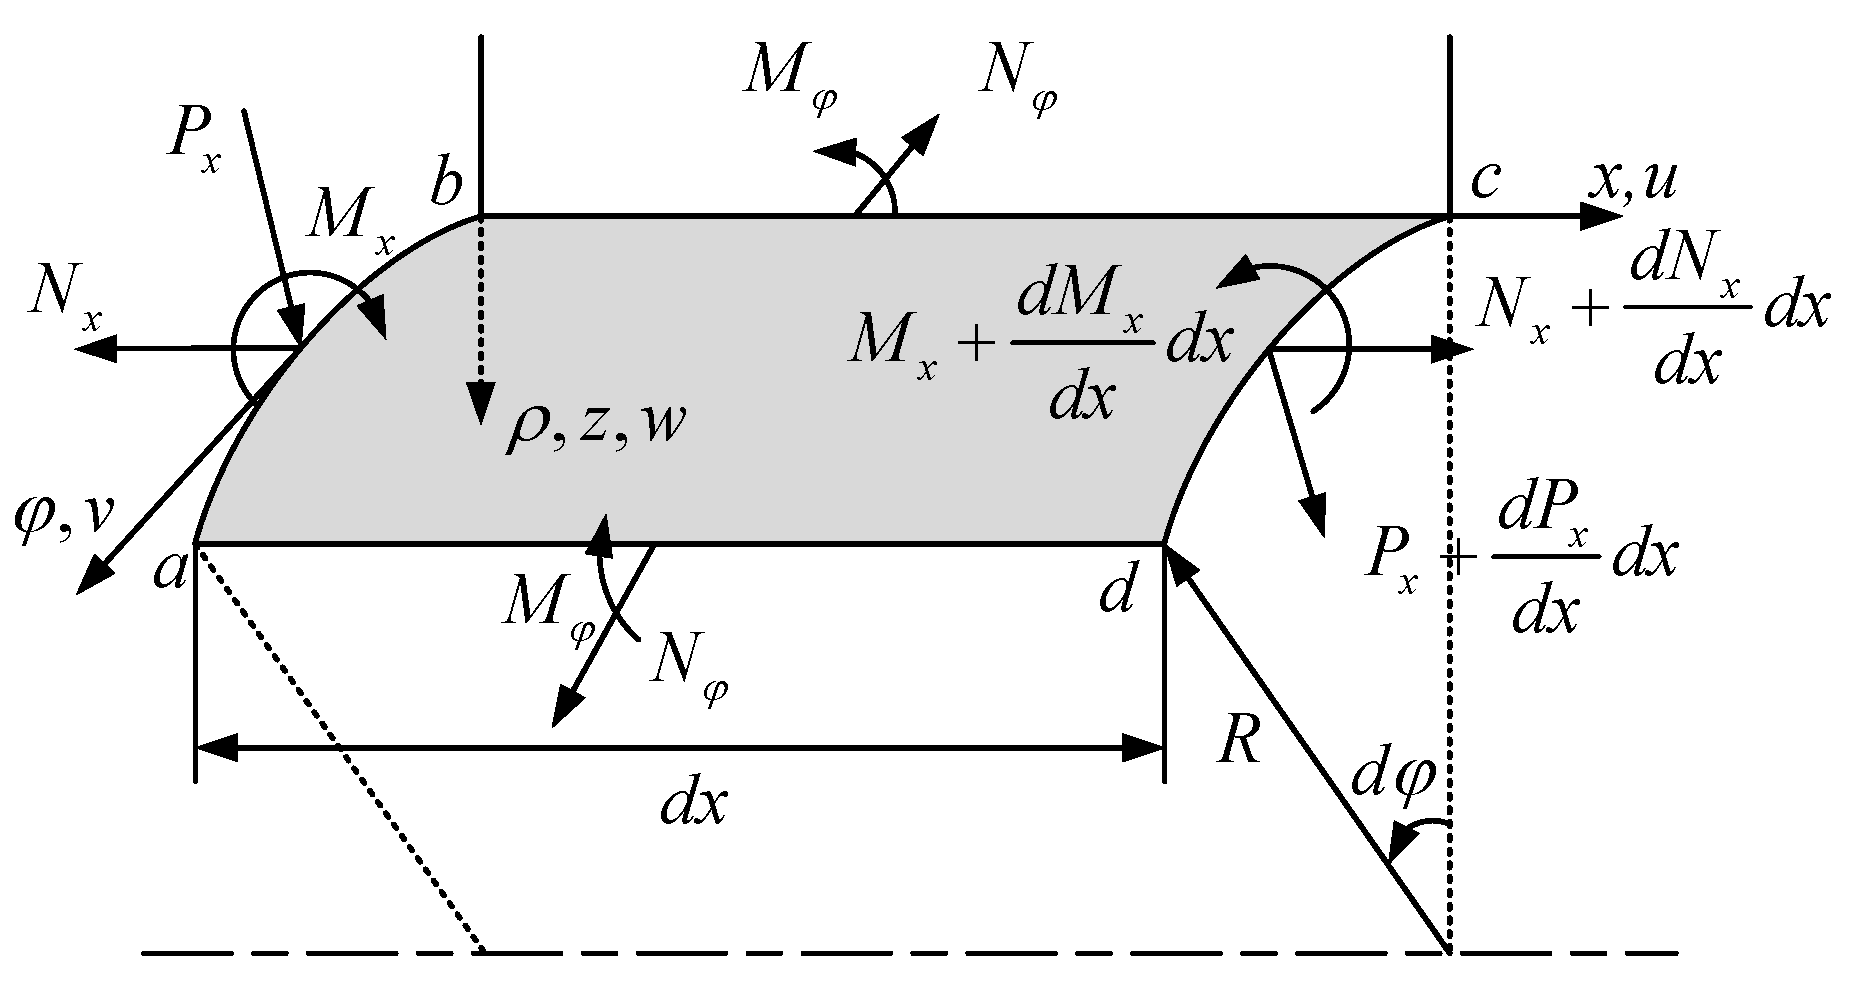
3.1. Formulation
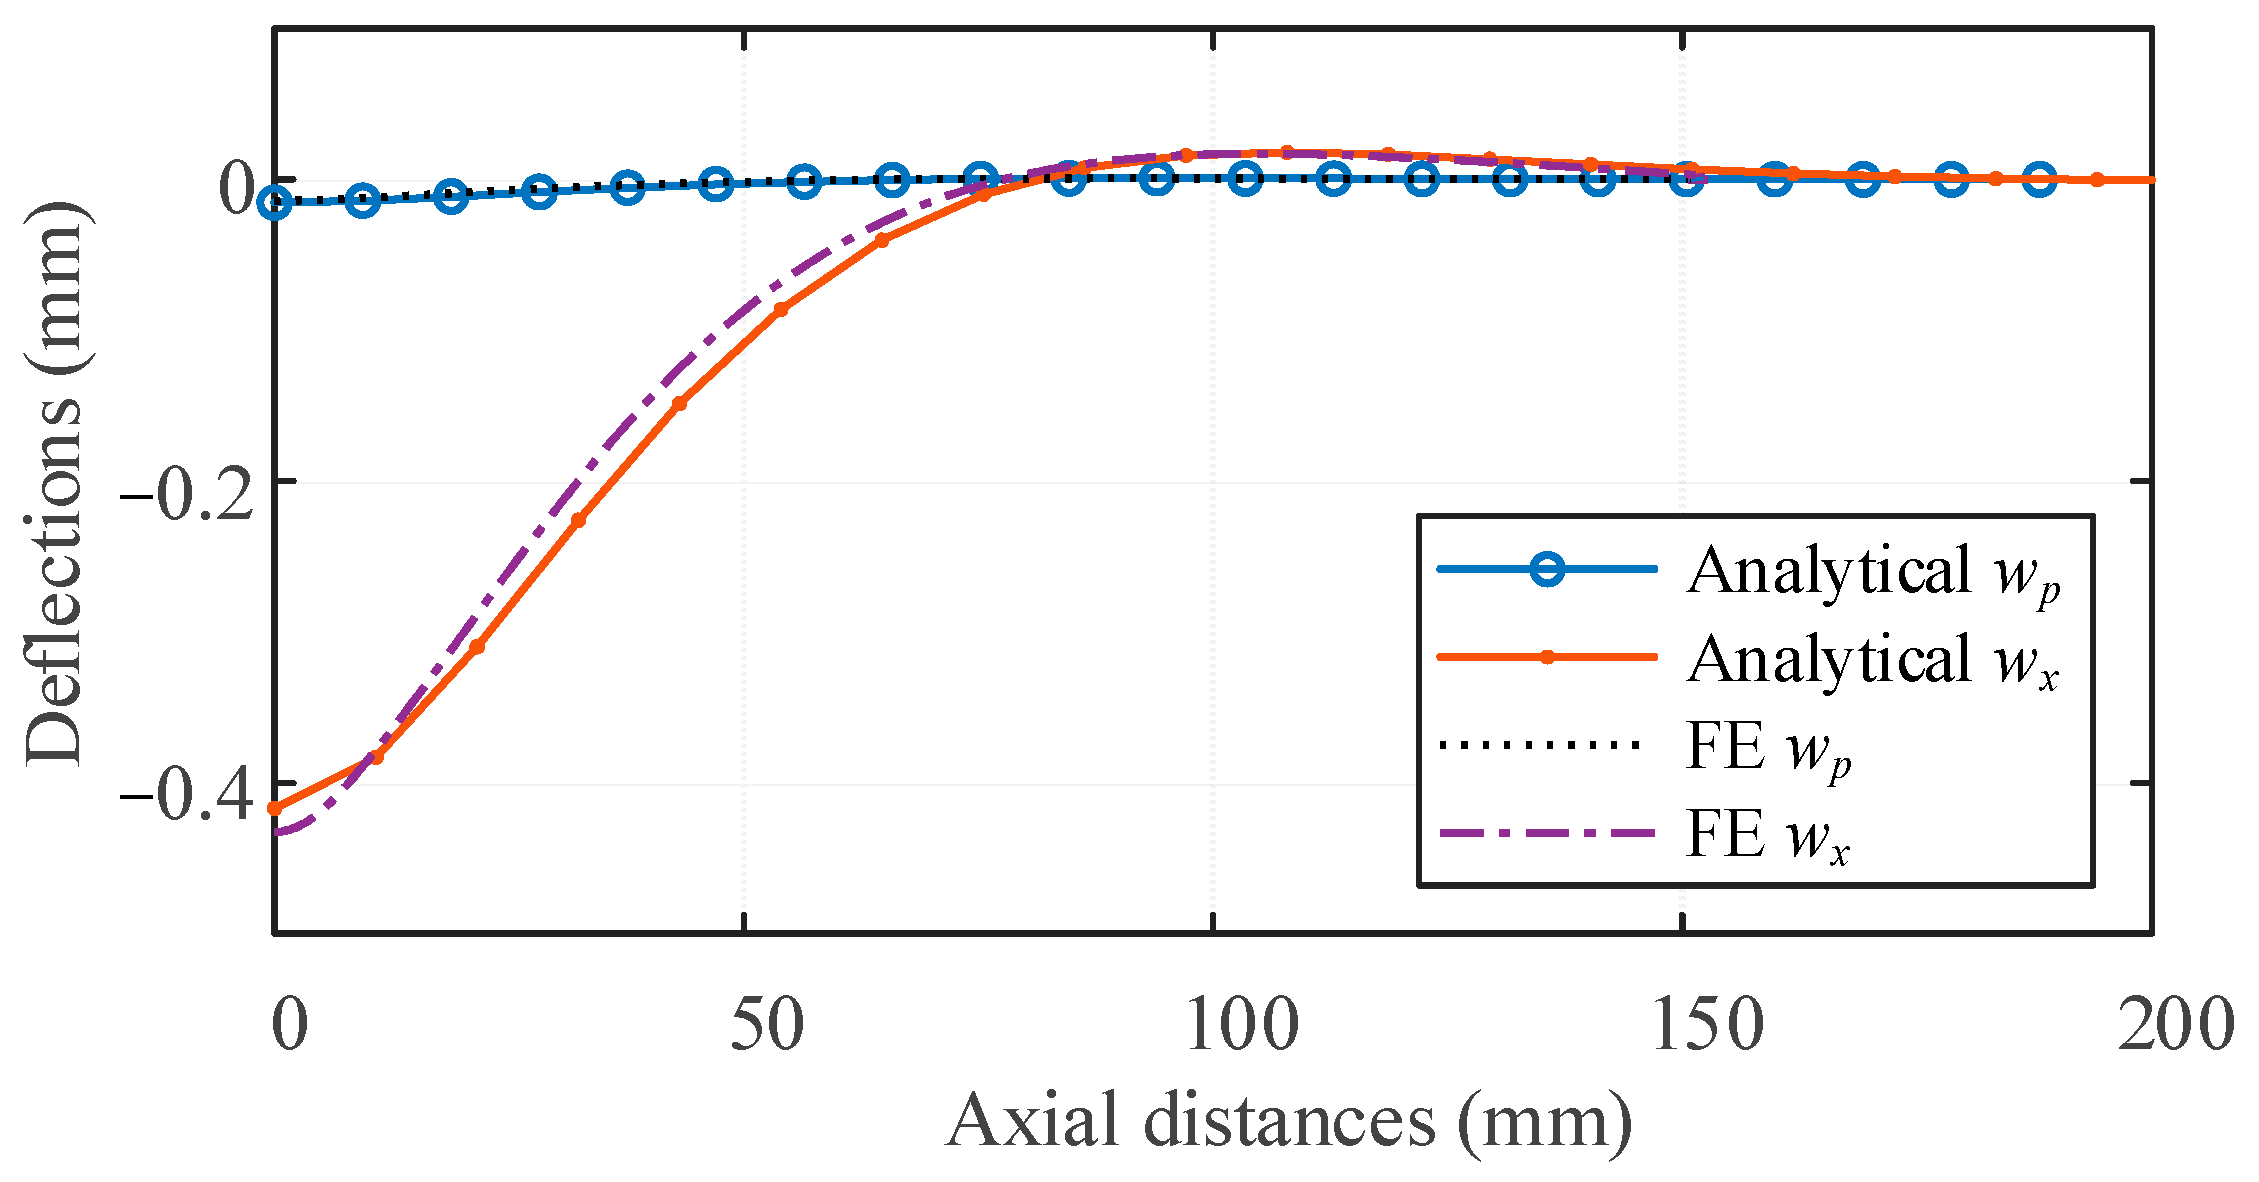
3.2. Numerical Modeling and Validation
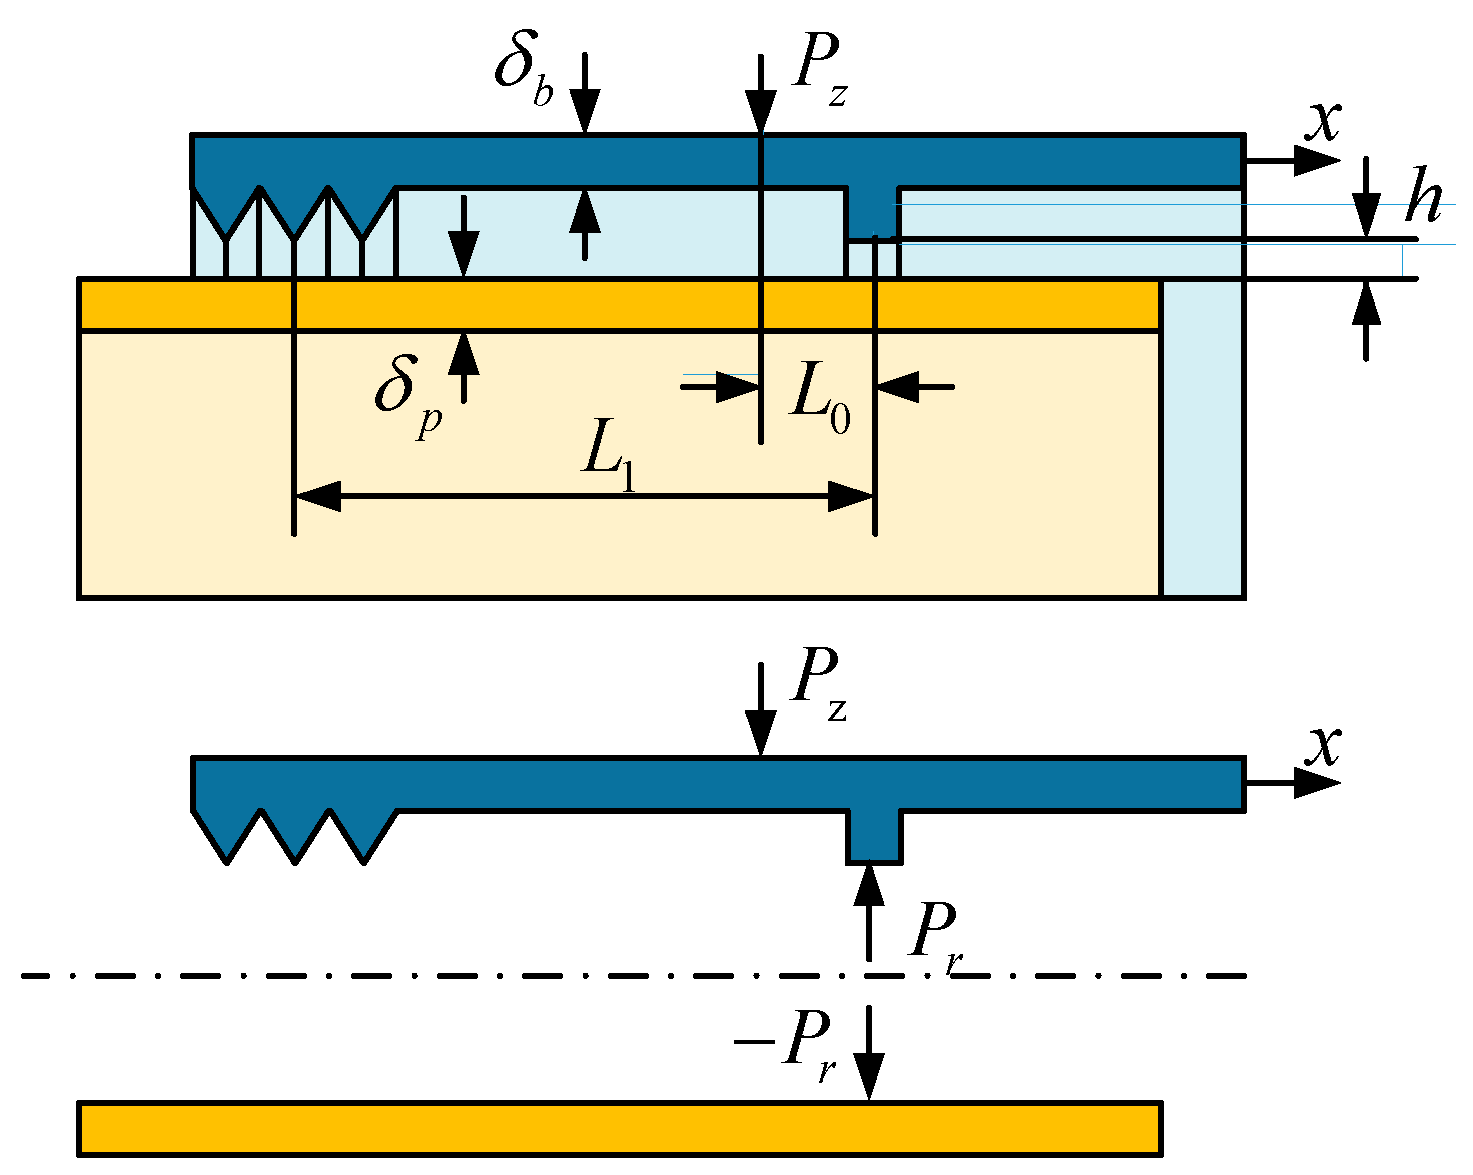
4. FE Model of the Sealing Surface
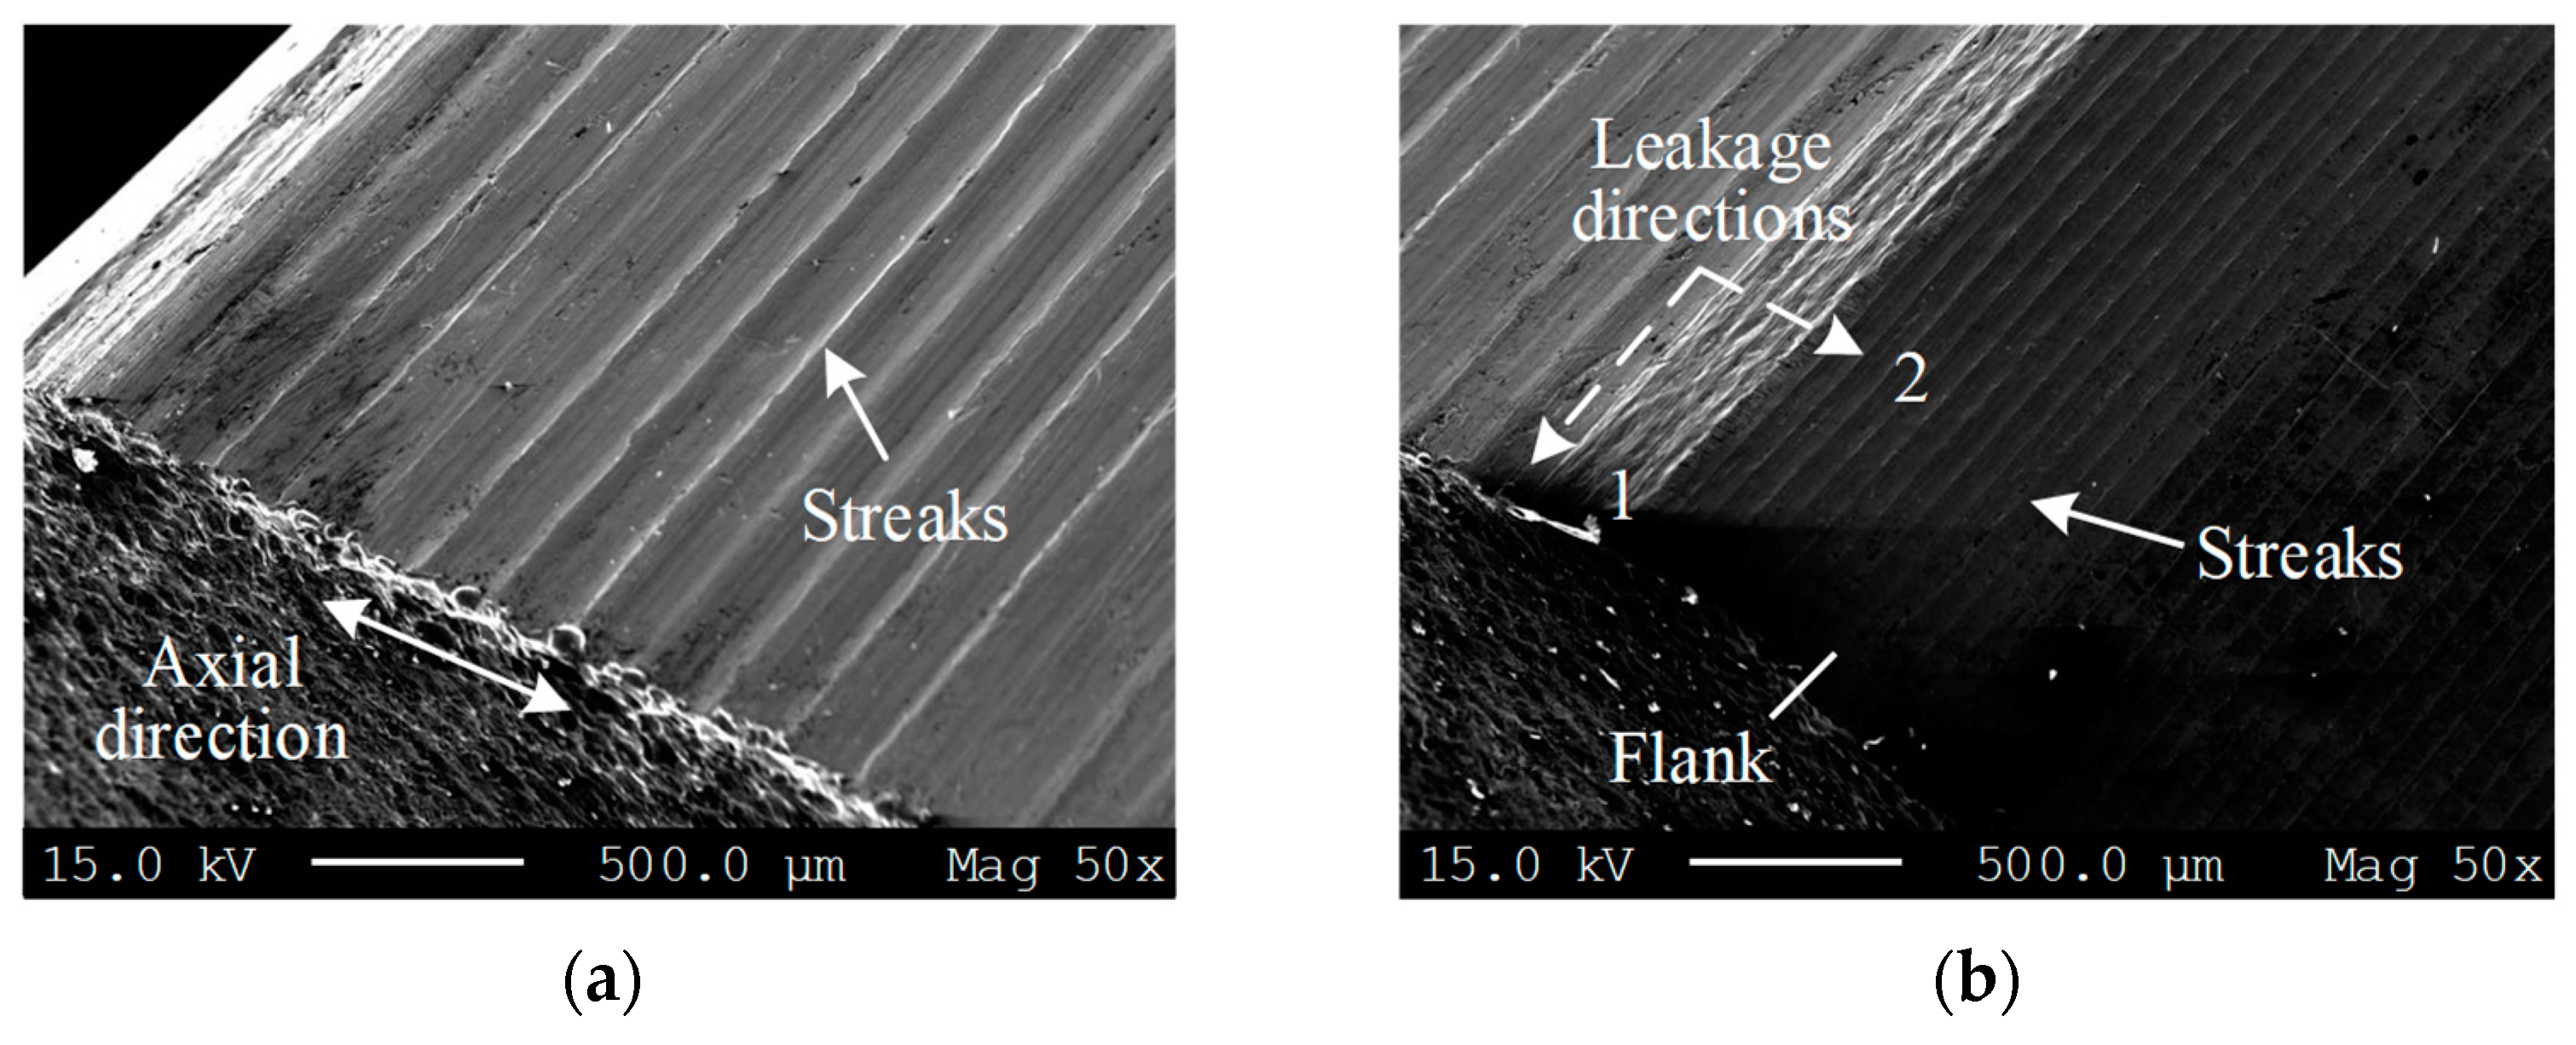
4.1. Characterization of the Sealing Surface
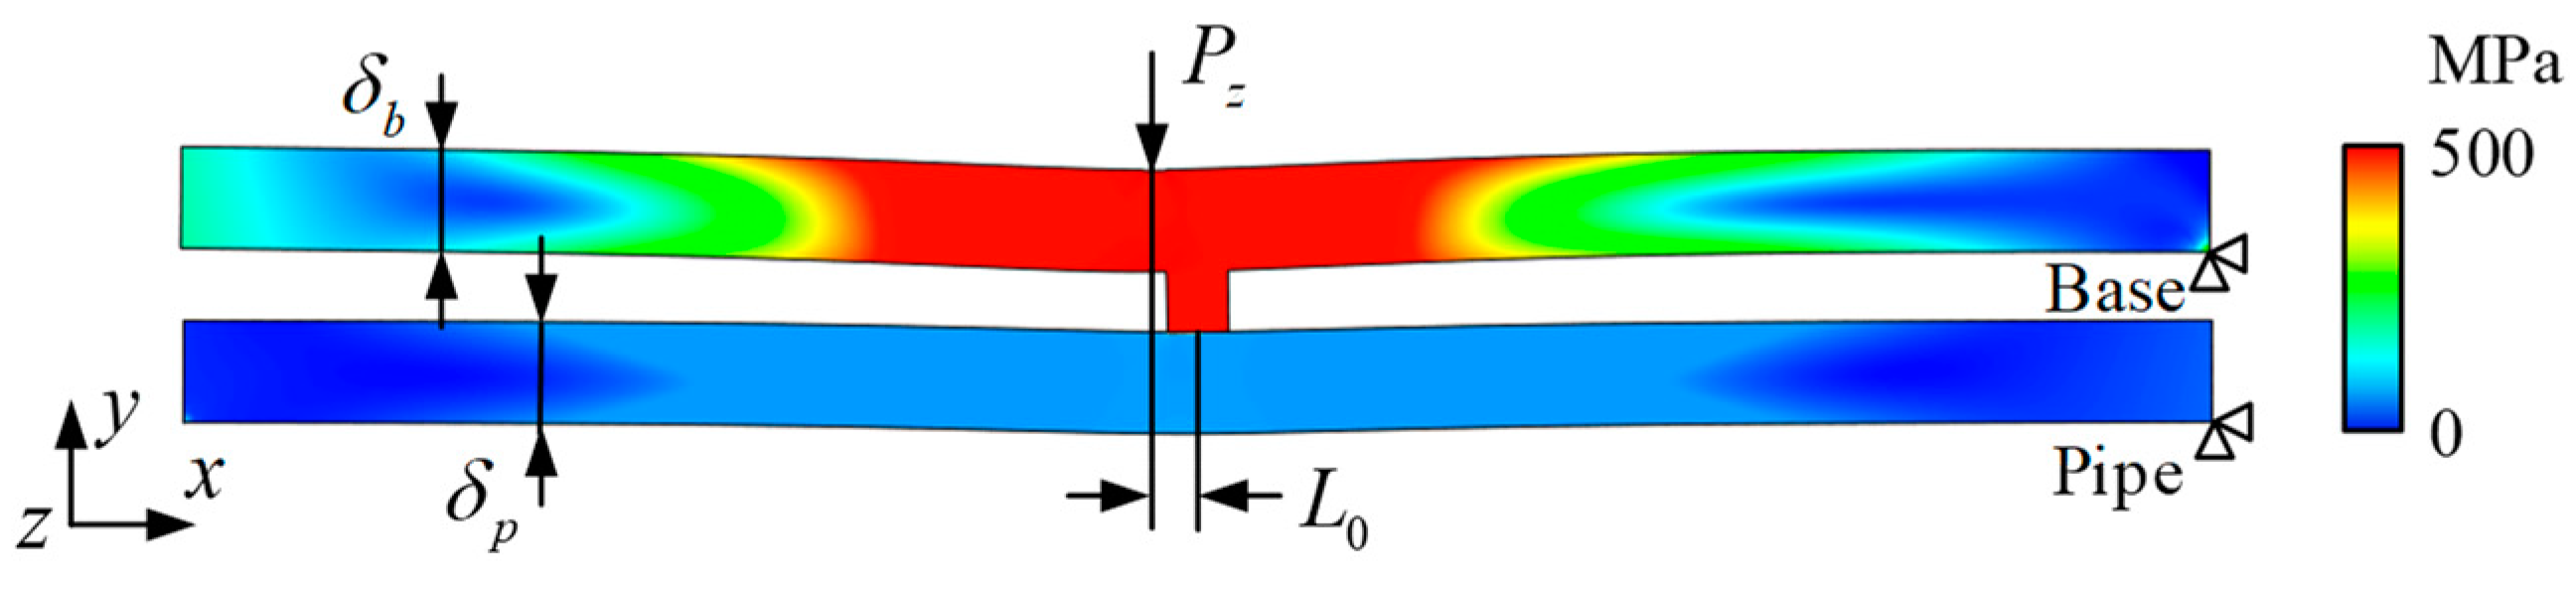
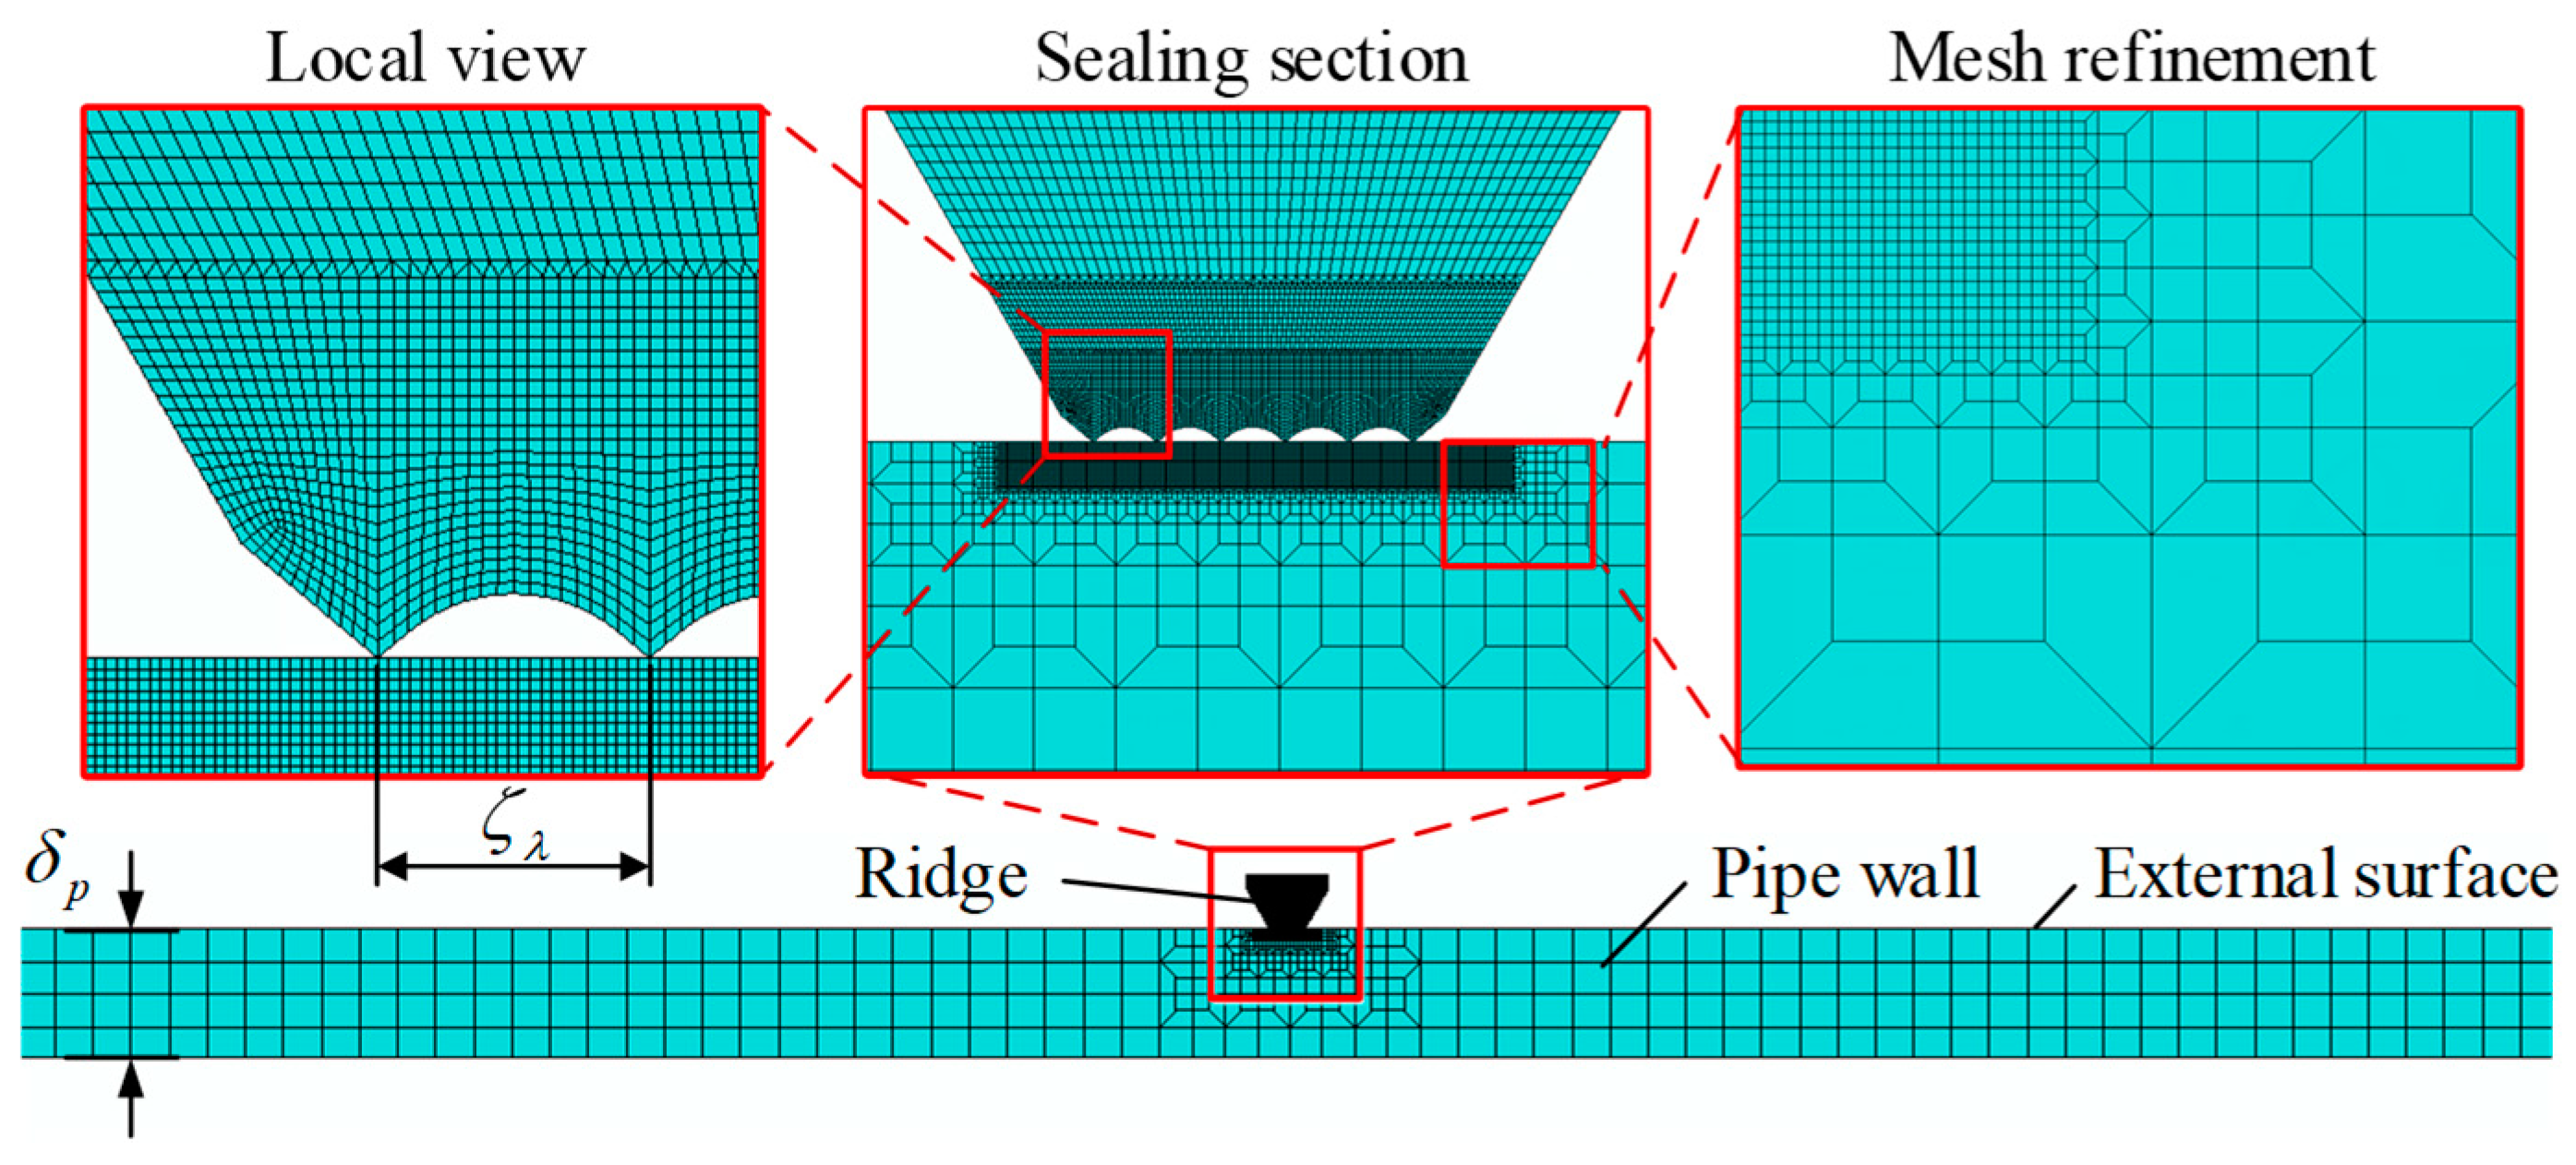
4.2. FE Model of the Sealing Surface
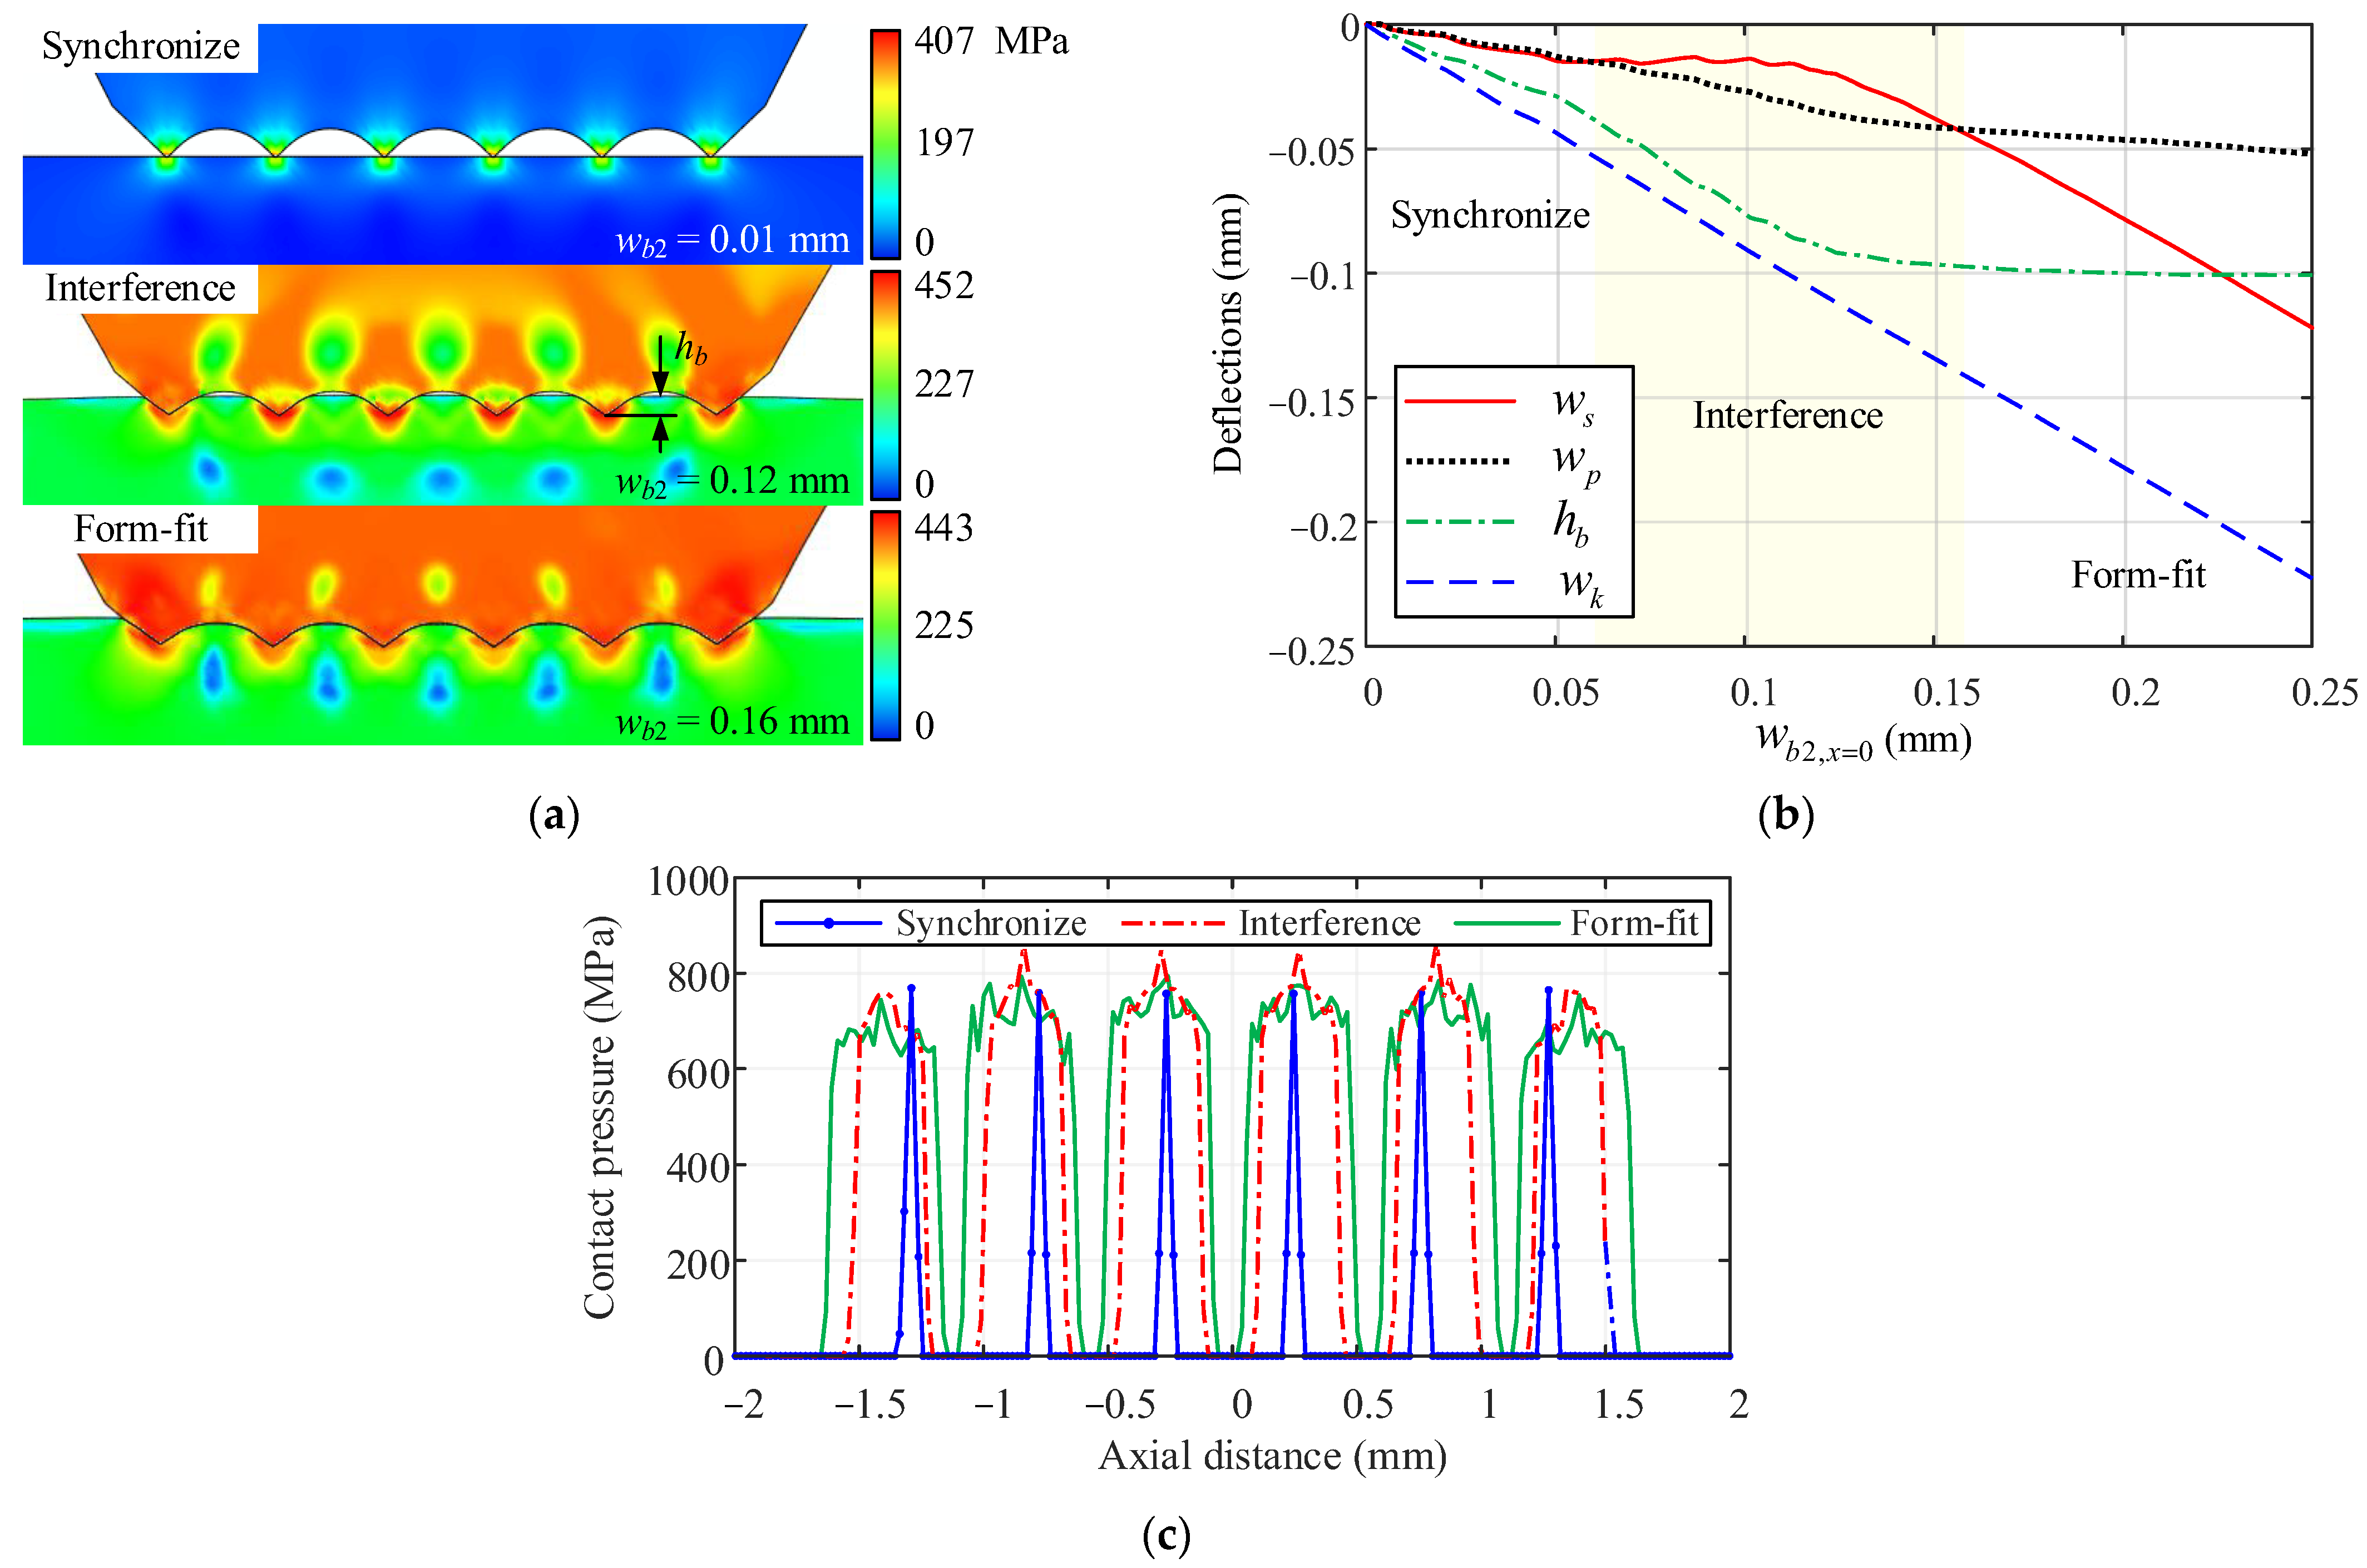
4.3. Change Laws of the Leakage Channel
- In the synchronize phase, the ridge and pipe deflect synchronously, the streaks are barely embedded in the pipe surface, and the stress concentration occurs at the contact points. Materials are not yielded;
- In the interference phase, streaks continue to be embedded in the pipe surface, the helical leakage channel is narrowed by the plastic deformations of the pipe, and the equispaced contact areas with high-contact pressure extend in the axial direction;
- In the form-fit phase, embedding is mainly performed with constant ; however, the plastic deformation of the seal area (the difference between and ) continually increases as increases, which makes the seal tighter. The untouched areas narrow considerably and will eventually disappear with the increase in .
5. Semi-Analytical Model of the Leakage
6. Results and Discussion
6.1. Parameter Analysis
- Compared to , pipe diameter shows almost exact influence trends on ; hence is positively correlated with both deflections;
- For all standard diameters in the ratio range of 0.25, within four-inch diameters ( 50 mm), changes of and can be considered independent of .
- The increment of is gradually related to , and, in this instance, when 0.2 mm, the gradient of approaches zero;
- There is a threshold of (when 0.2) at which the growth of is directly proportional to the growth of .
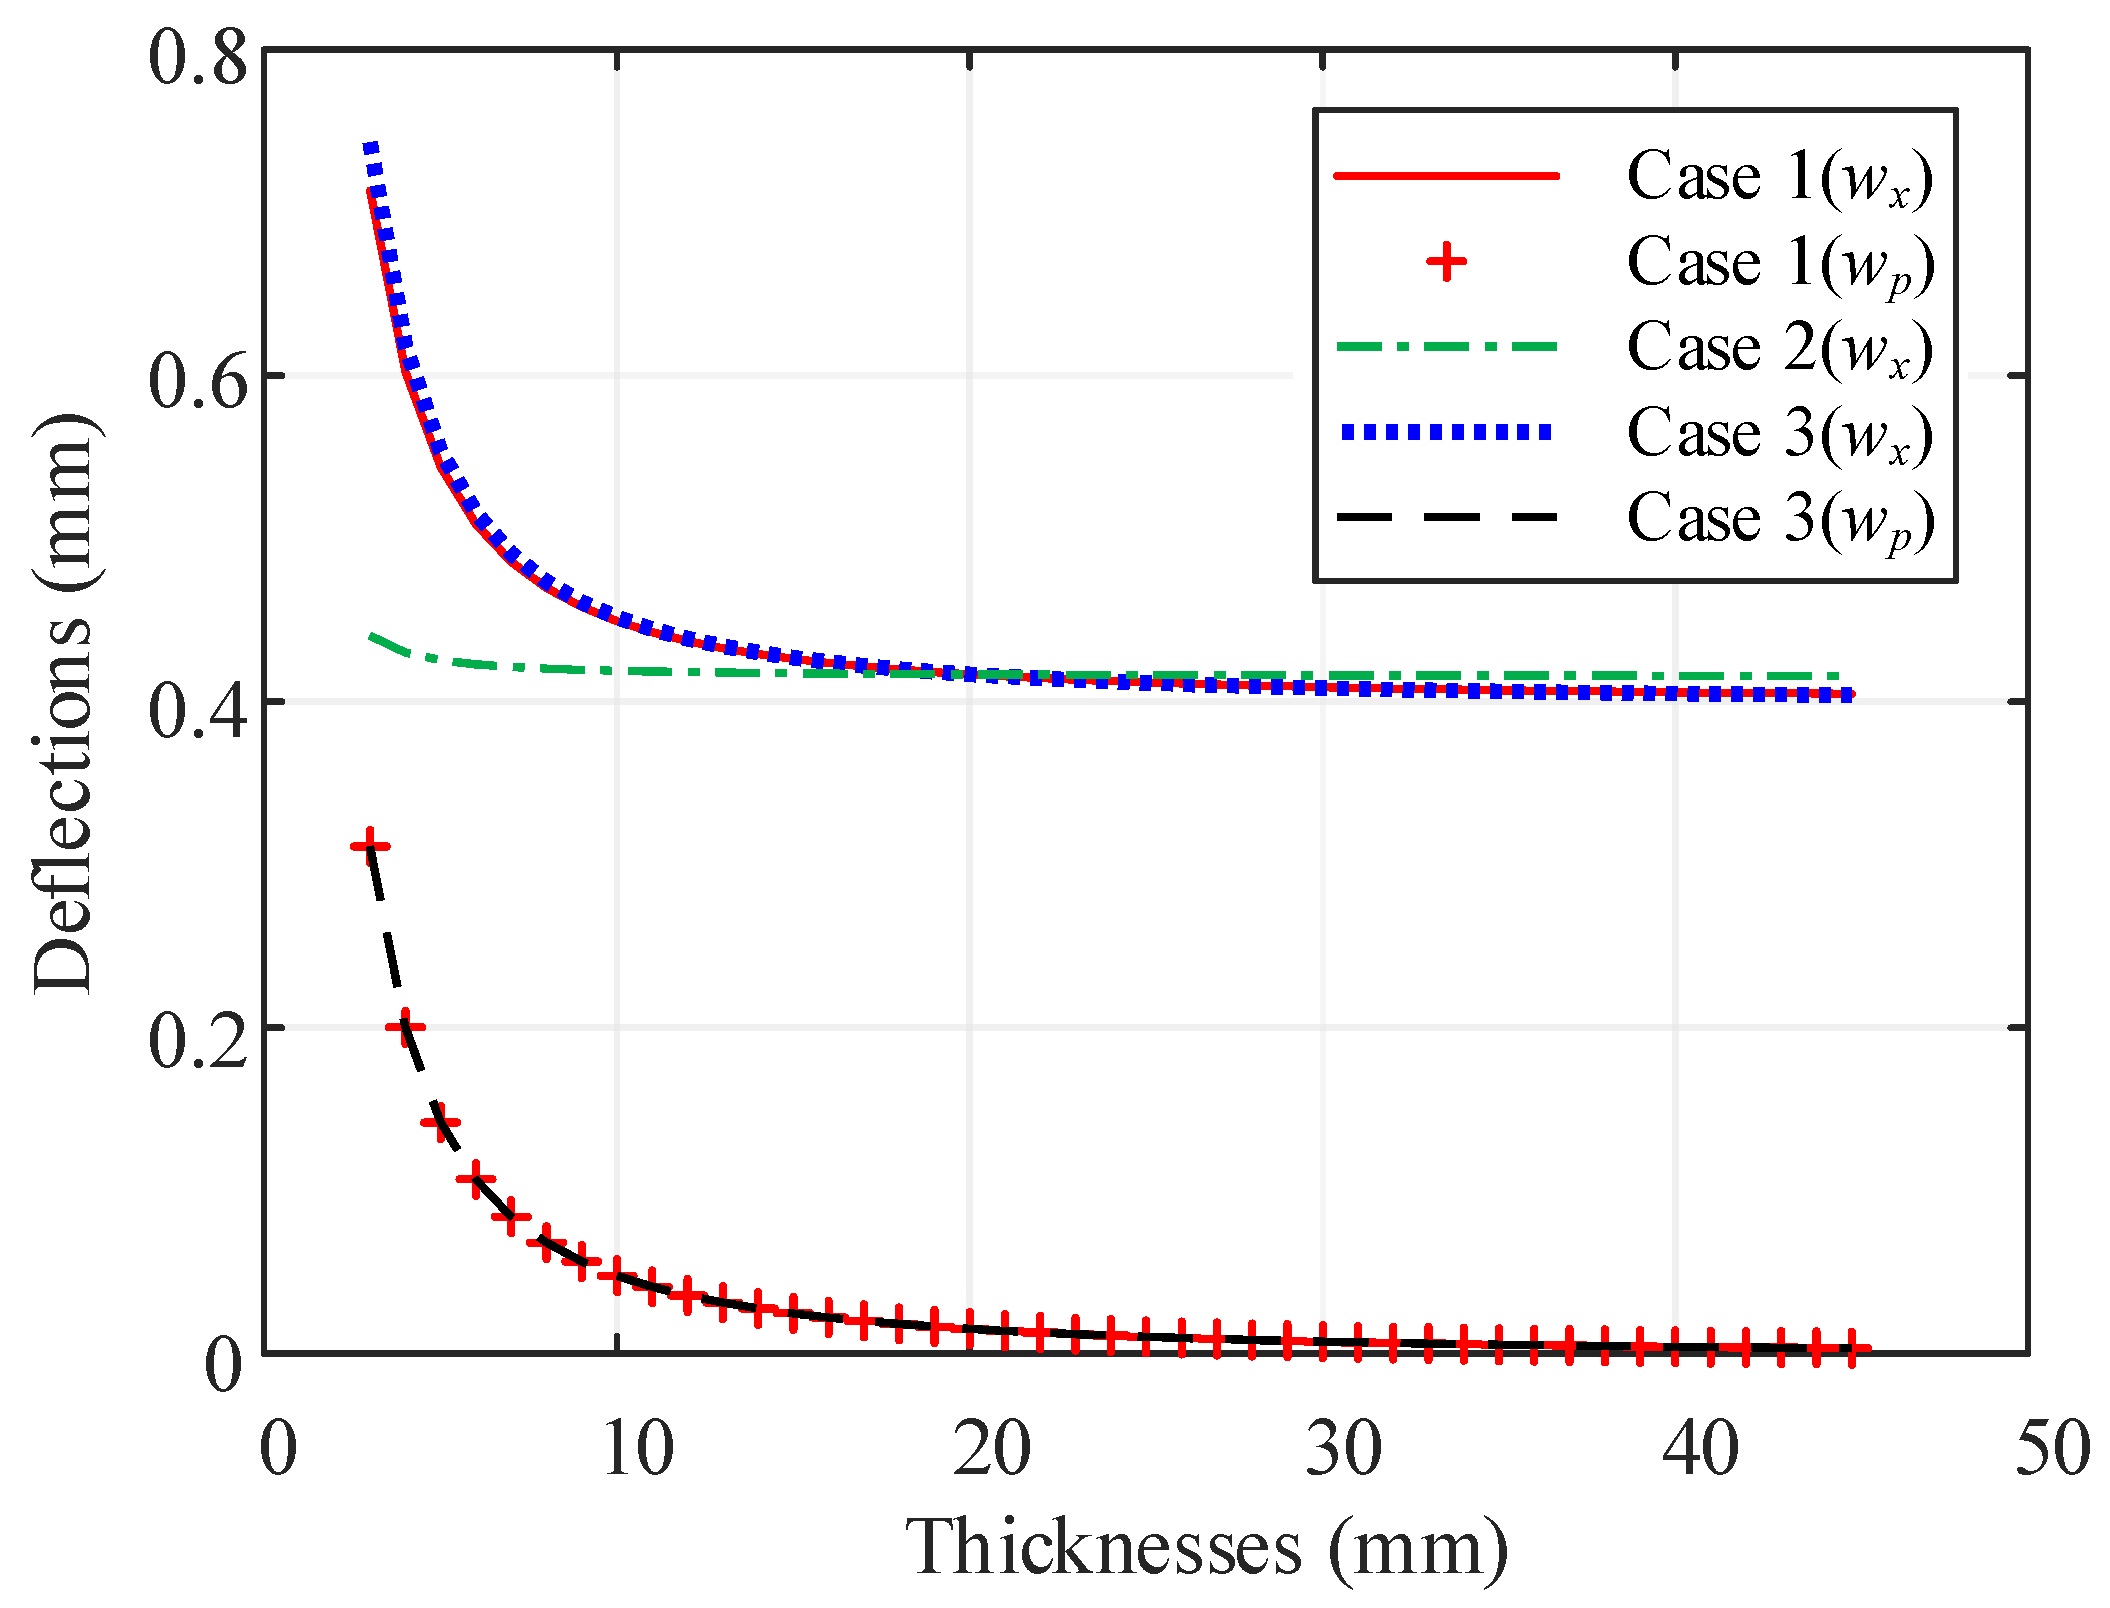
- As the increases, all deflections decrease with a decreased change rate;
- has a minimum influence on (the curve in Case @), and is irrelevant to , so the change in has a negligible impact on the interference. Therefore, consideration may be given to appropriately increasing or decreasing the thickness, , as needed.
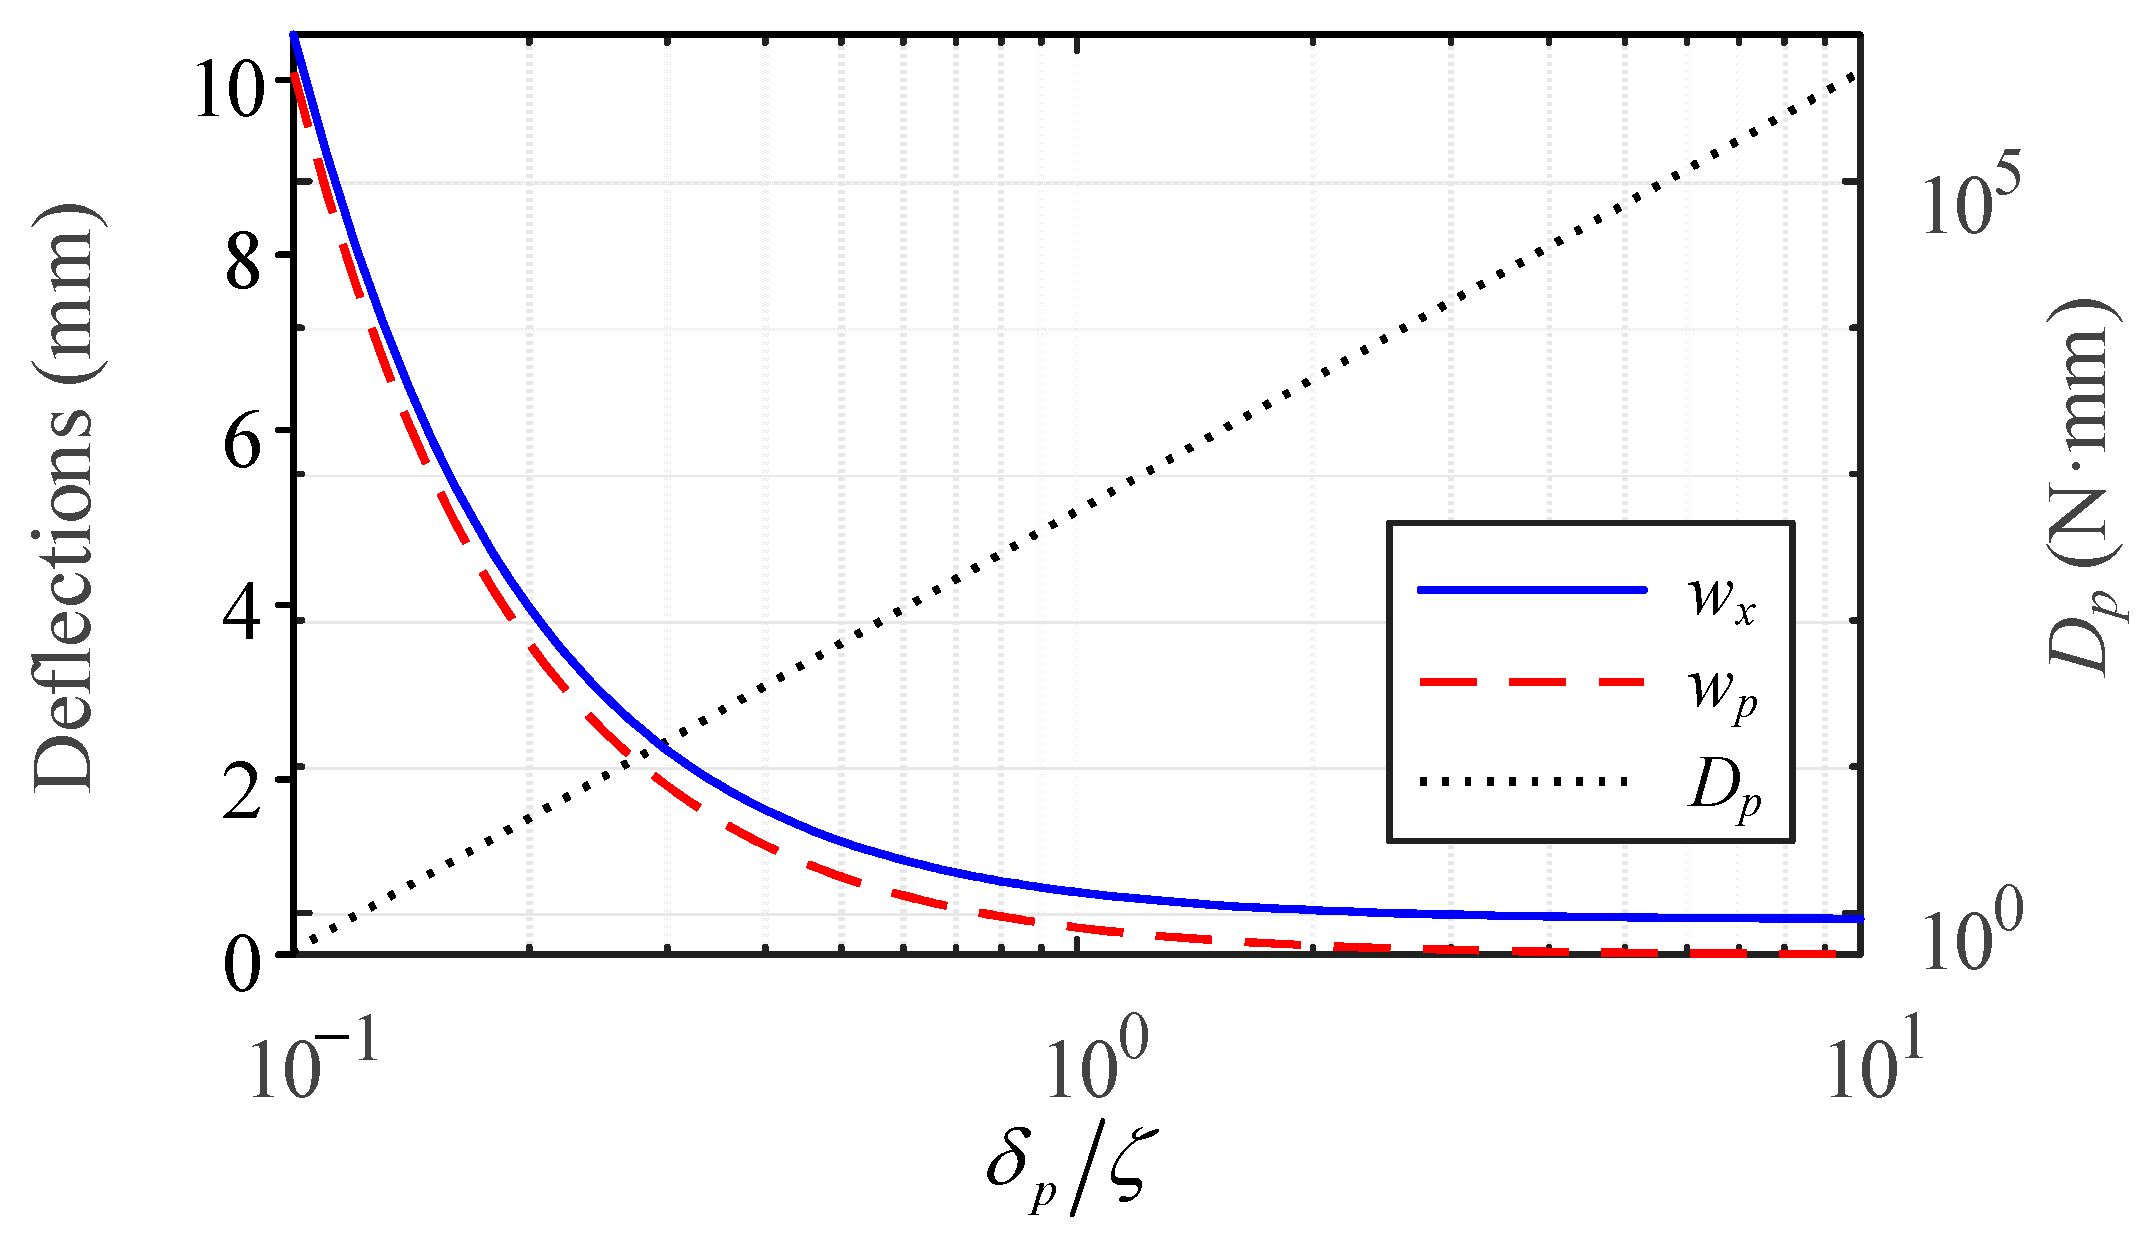
- For the flexural rigidity, a linear relationship exists between the ratio and in logarithmic coordinates;
- For deflections, they are influenced by a threshold of the ratio: when 1, deflections decrease as the ratio increases; when 1, the deflection change is practically unrelated to the ratio. This shows that when the thickness exceeds the sealing width, hardly affects deflection.
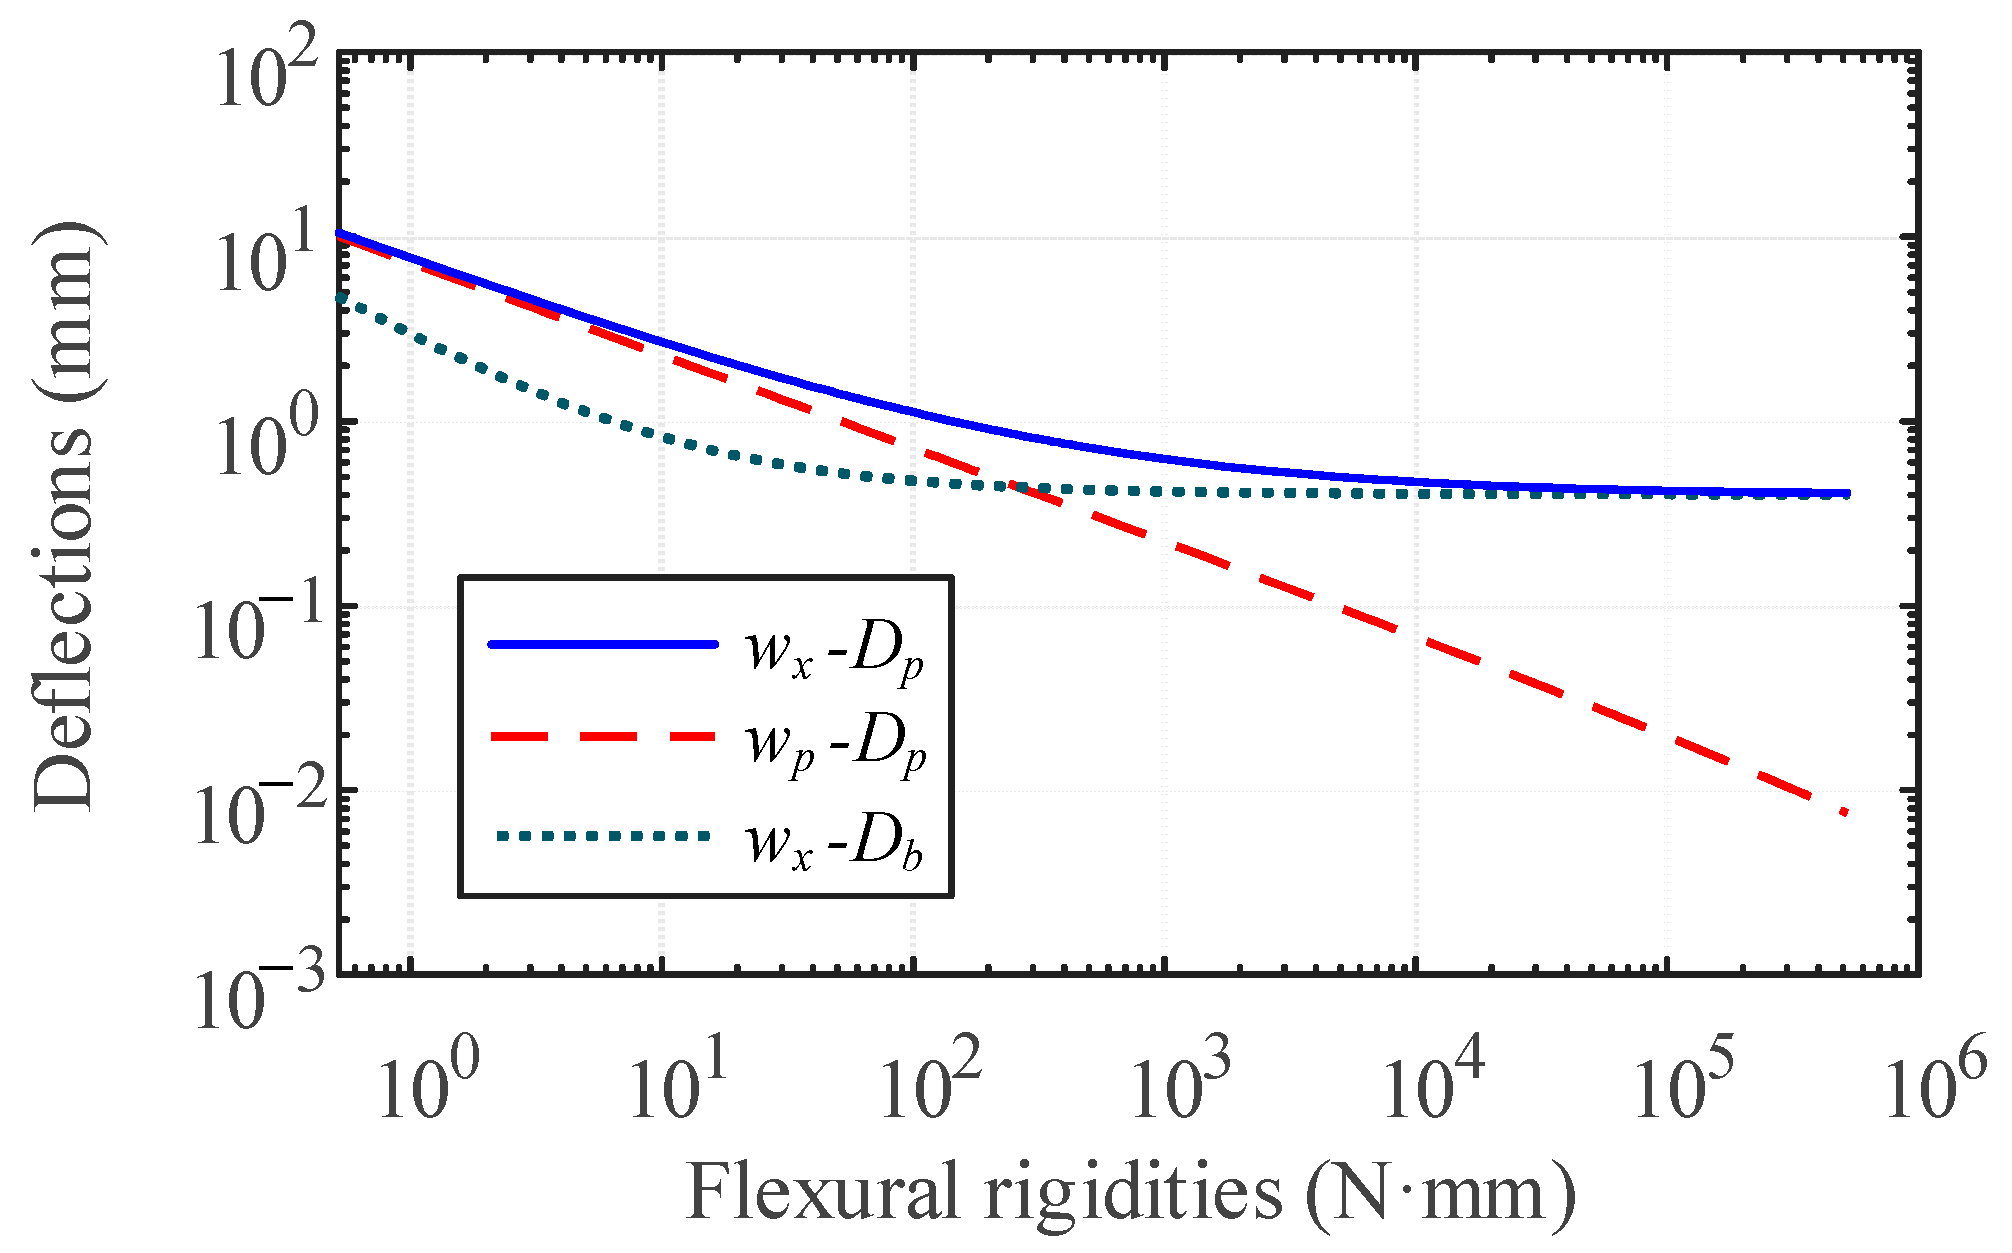
- exhibits an almost linear relationship with (the curve wp-Dp) in logarithmic coordinates but a decreasing effect on (wx-Dp);
- When 103, all effects on deflections are approximately linear, but when 103, the effect on and is significantly different;
- When 104, the only effect of the flexural rigidity is that of on ;
- The effect on of the flexural rigidity of (wx-Db) is comparable to that of the pipe (wx-Dp).
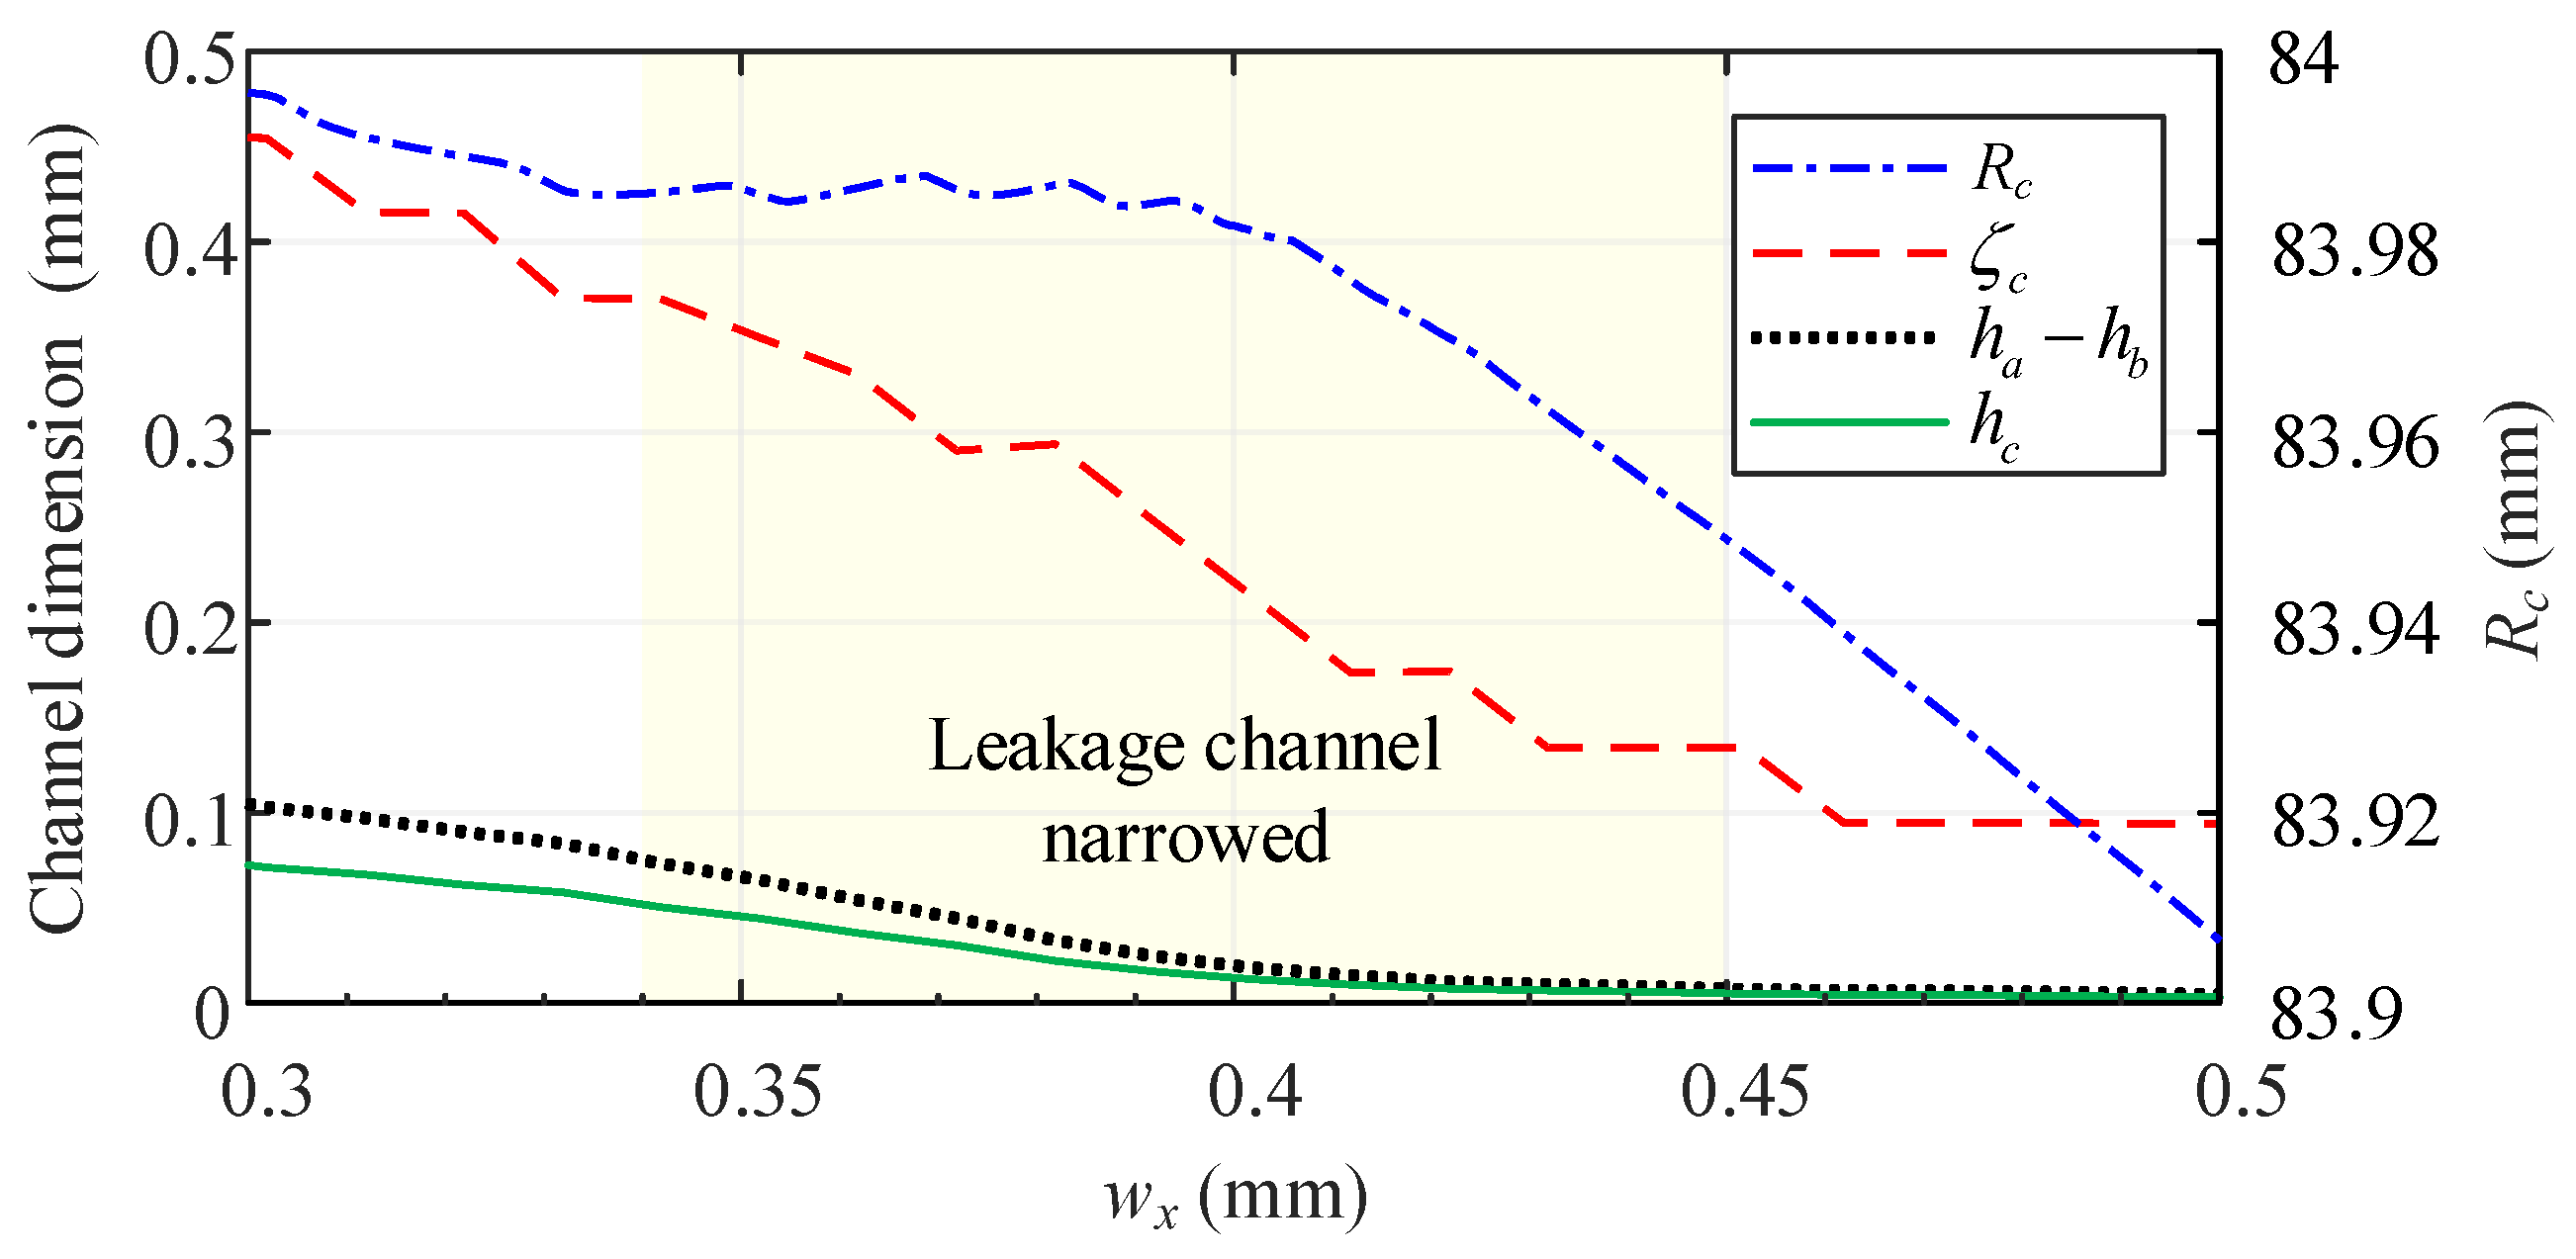
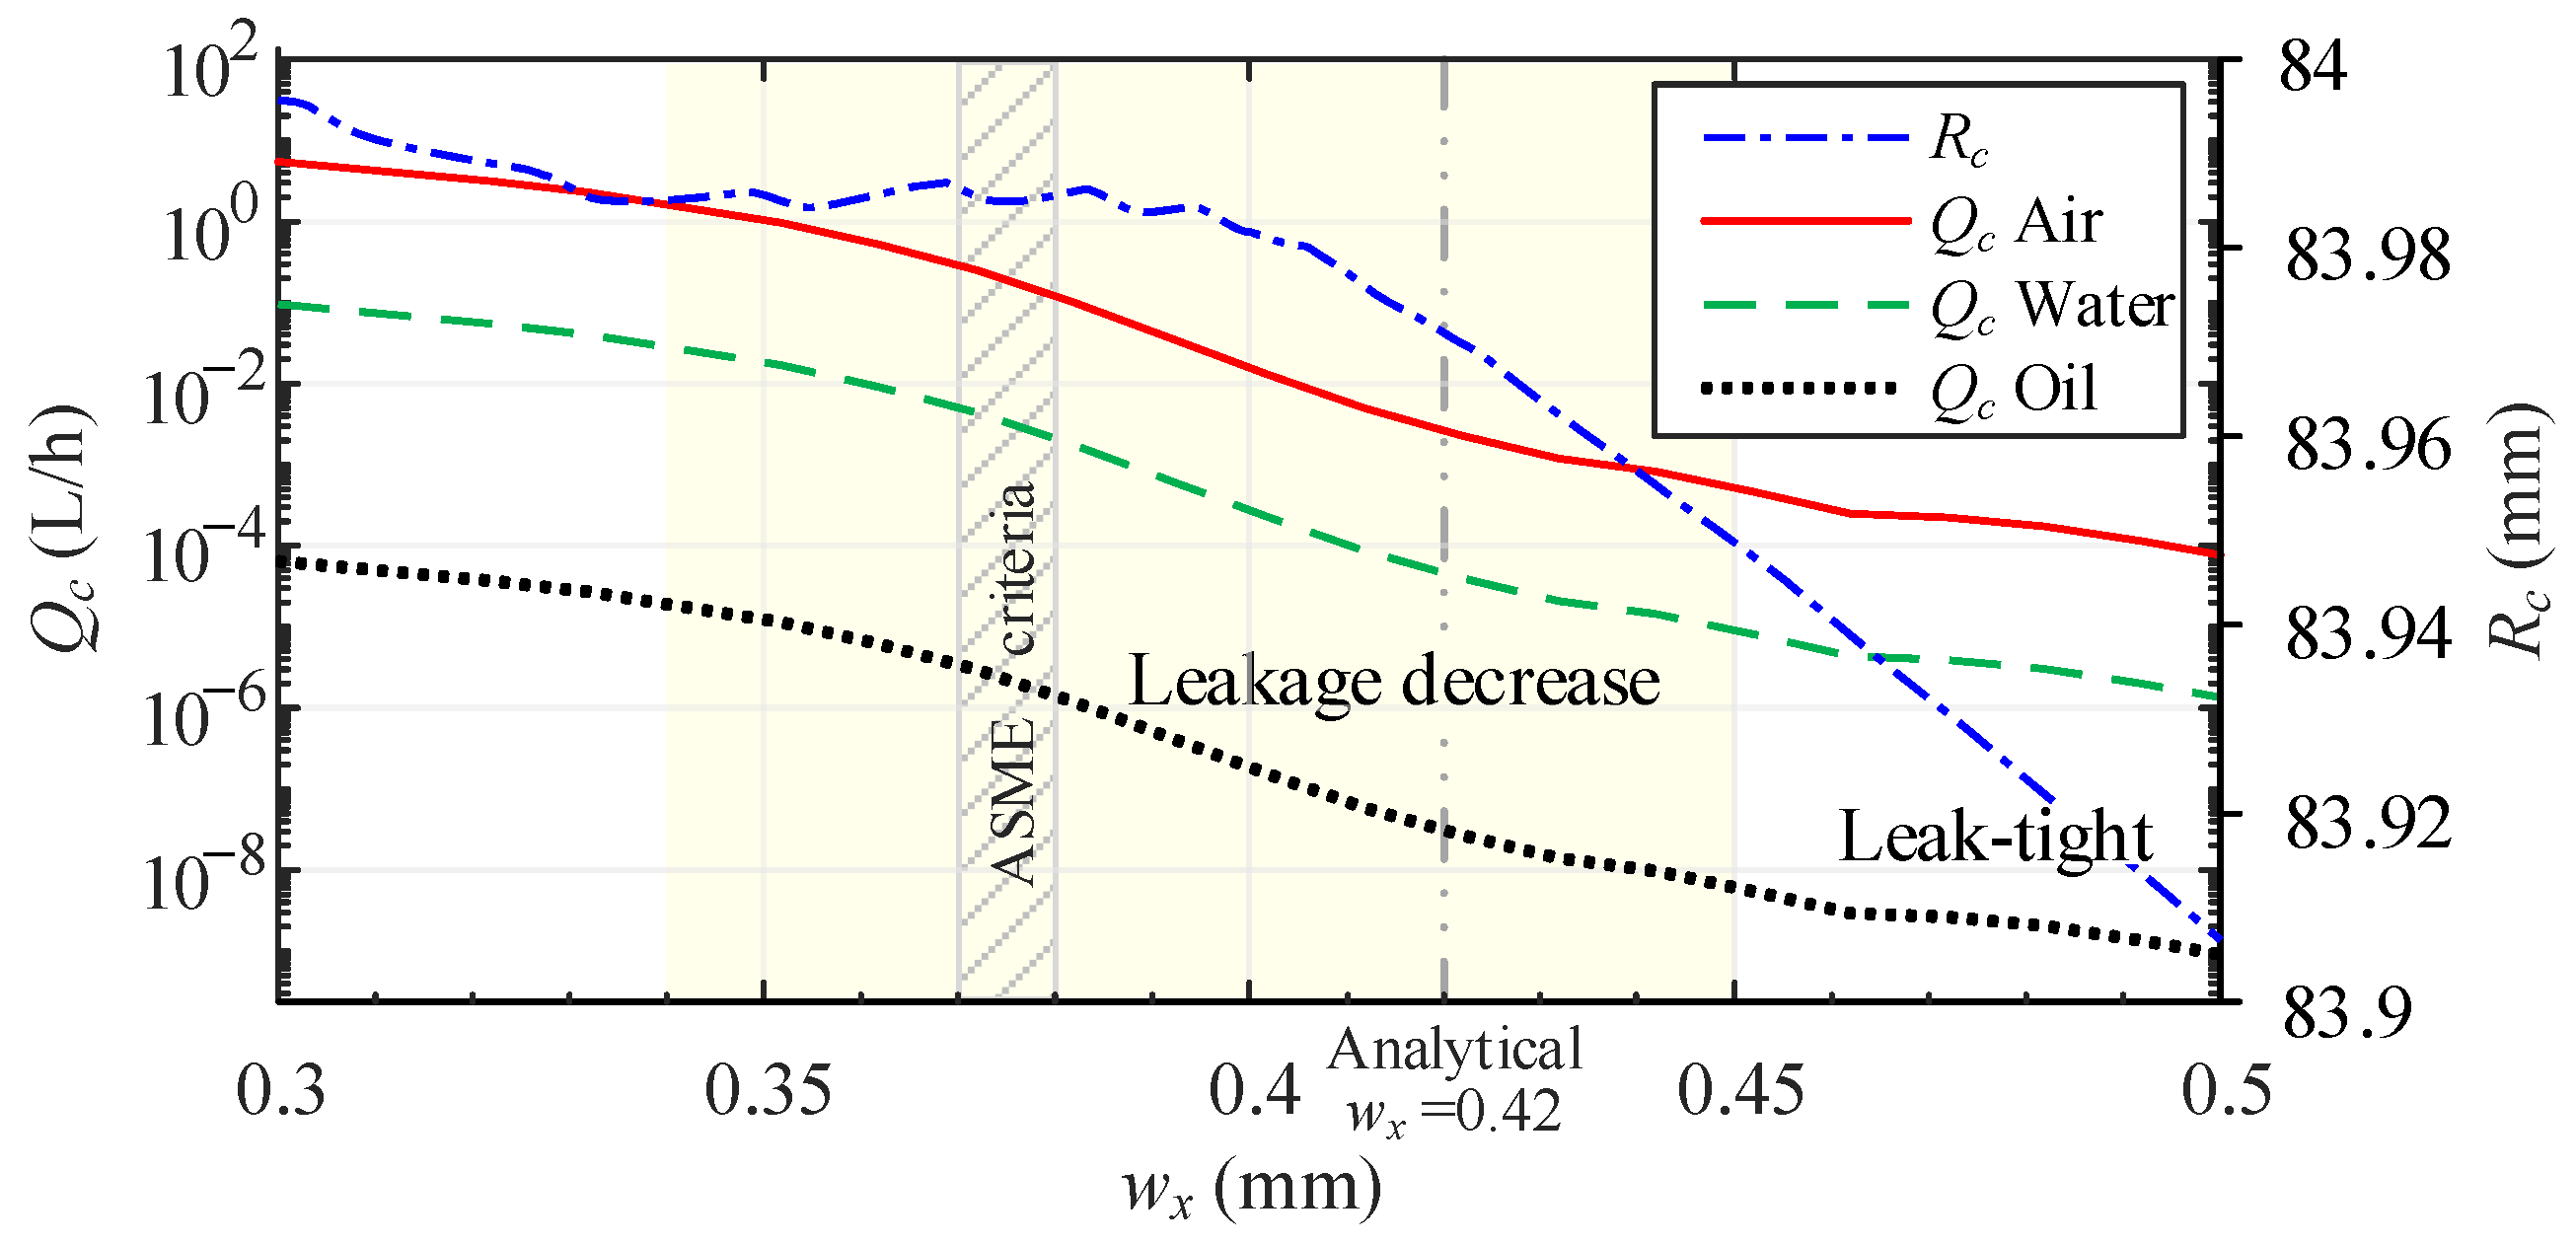
- There is a strong correlation between and : as increases, both and decrease;
- Coincidentally with the macroscopic results in Section 4.3, the true height of the channel and also have a notable reduction during the interference within the range (0.34, 0.45), while shows a clear descent stage;
- When 0.45 mm, and are virtually unchanged, indicating that the leakage ratio is stable.
- For air medium, according to the highest Class VI of ASME B16.104 [50], the connector can be considered leak-tight below, 0.24 L/h in the study case, while the corresponding minimum is in the range from 0.37 to 0.38 mm (0.25 to 0.10 L/h, shadowed area in the figure);
- Similar to the equivalent height curve, , in Figure 16, there is also an accelerated descent range of the leakage ratio and all leakage ratios are reduced to a minimum with 0.45 mm;
- The macroscopic minimum, , calculated from the proposed analytical model is 0.42 mm (the dash-double-dotted line in the figure), which is covered by the ASME criteria;
- The ASME criteria and the theoretical minimum, , are included within the leakage decrease range (from 0.37 to 0.45). Therefore, the results of the semi-analytical method are self-consistent, and the case connector is theoretically leak-tight to all typical mediums. The theoretical feasibility of the proposed semi-analytical method to predict the minimum preloaded deflection is verified.
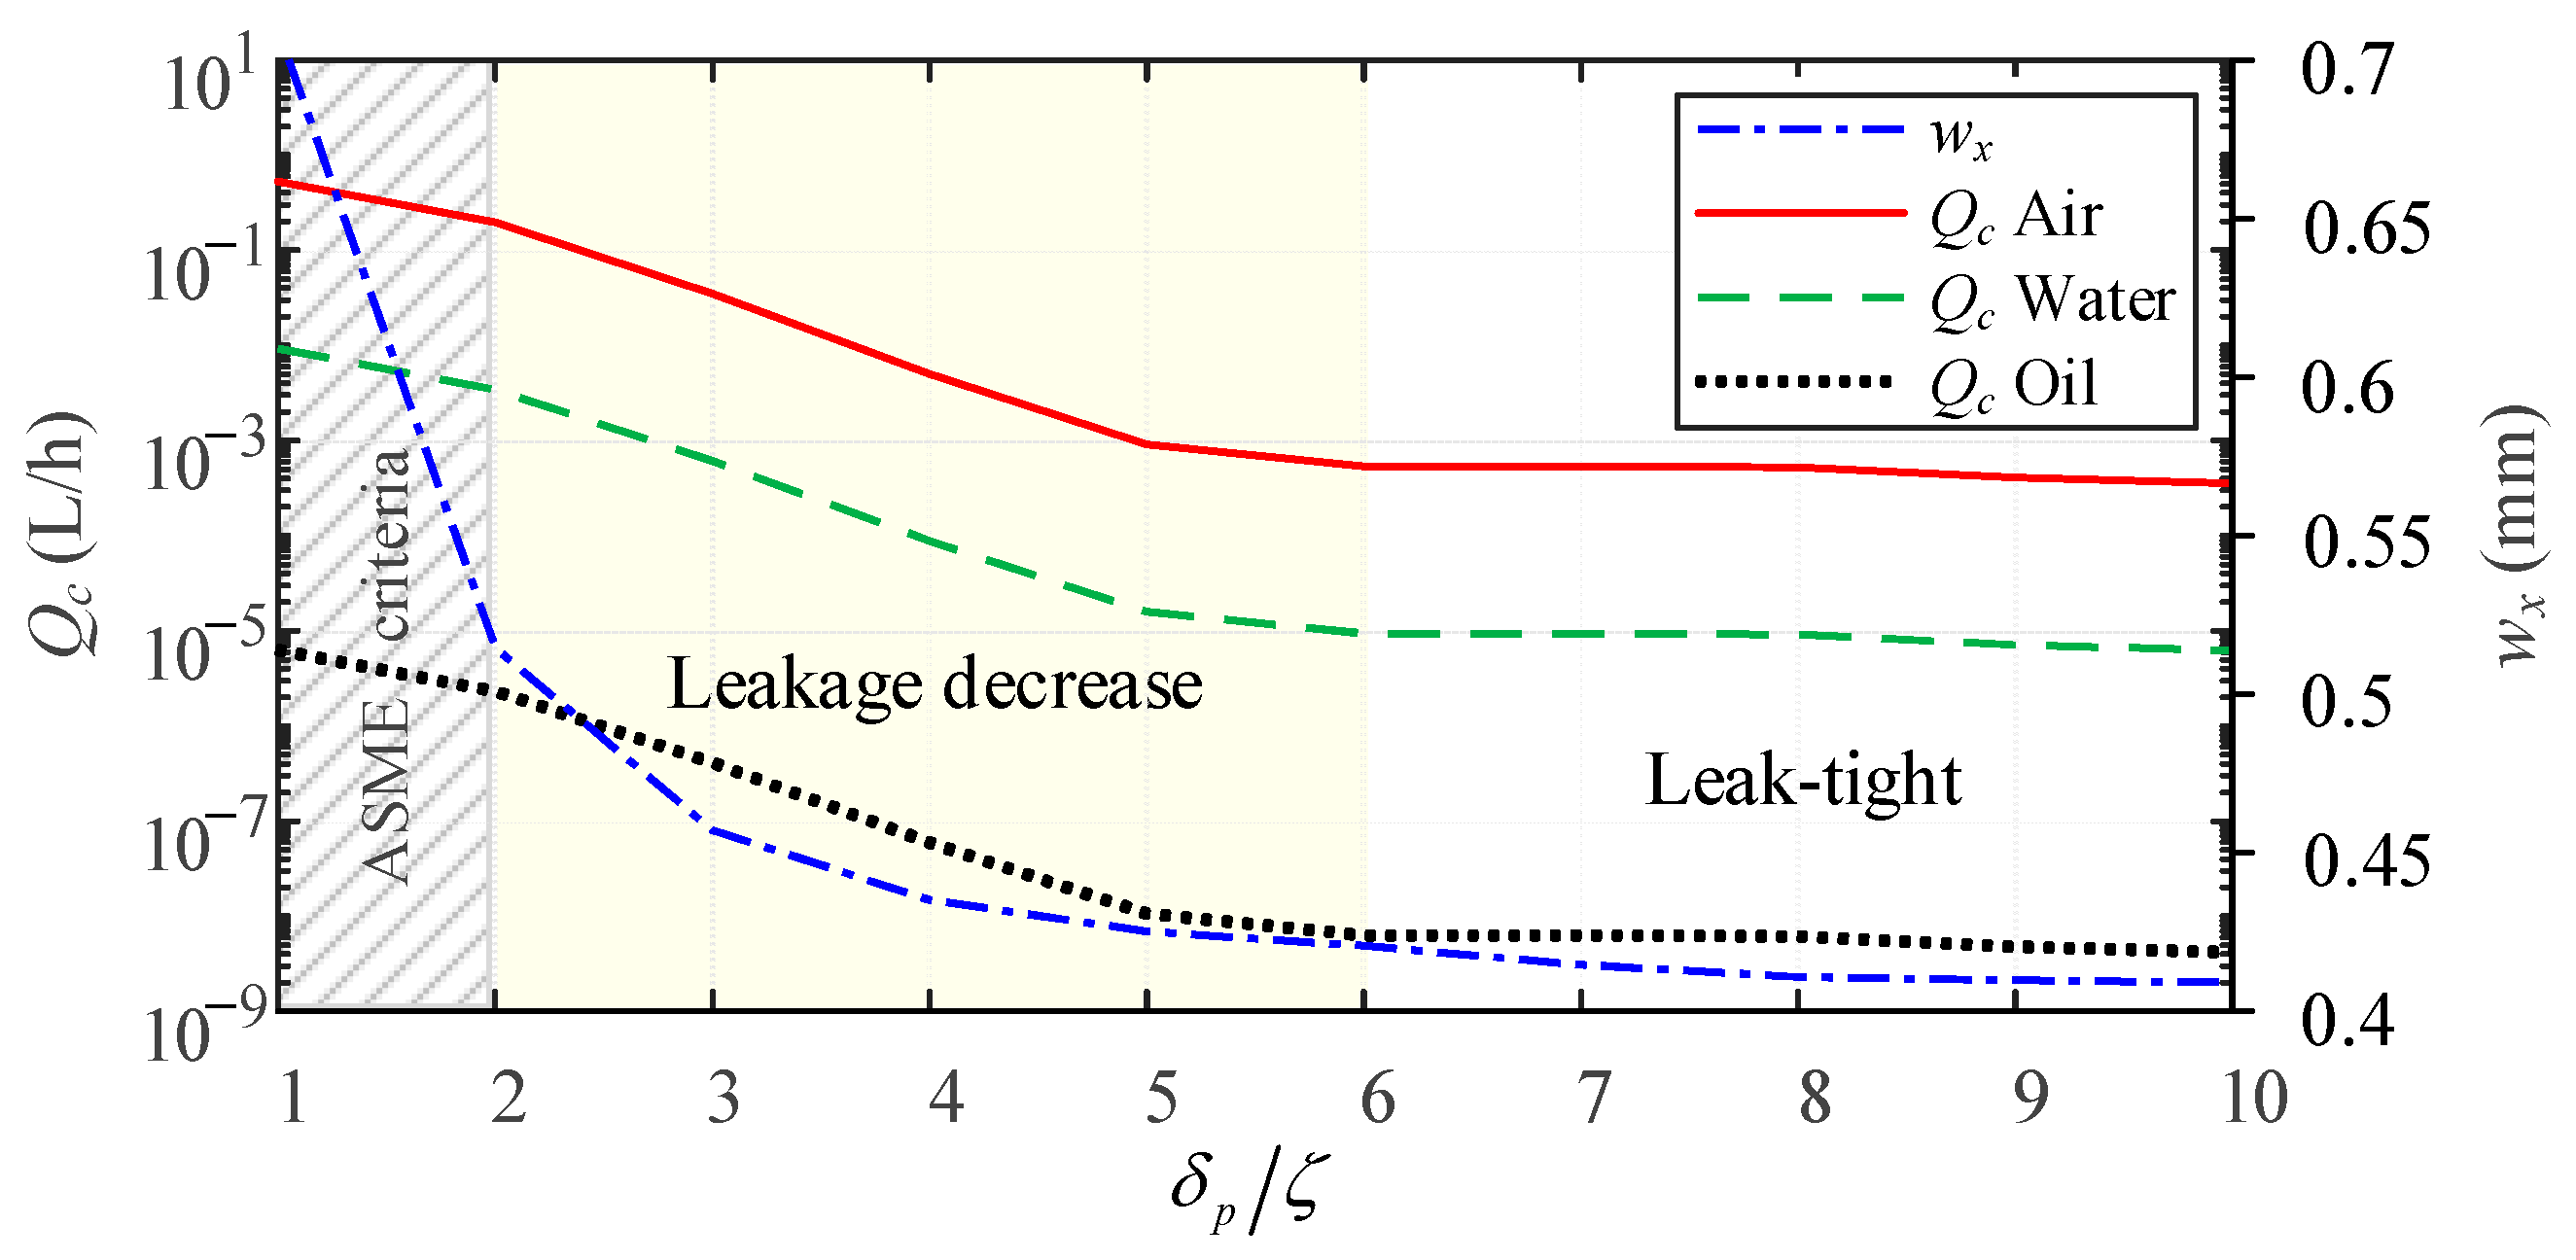
- When (1, 3], and begin descending with the increase in ;
- When (3, 5], the leakage is noticeably decreasing;
- When 5, the effects on , , and are moderated, the leakage is stable, and the sealing state needs to be further verified by prototype tests;
- When 3, the leakage may occur on the internally turned topography, the recommended design value is 5.
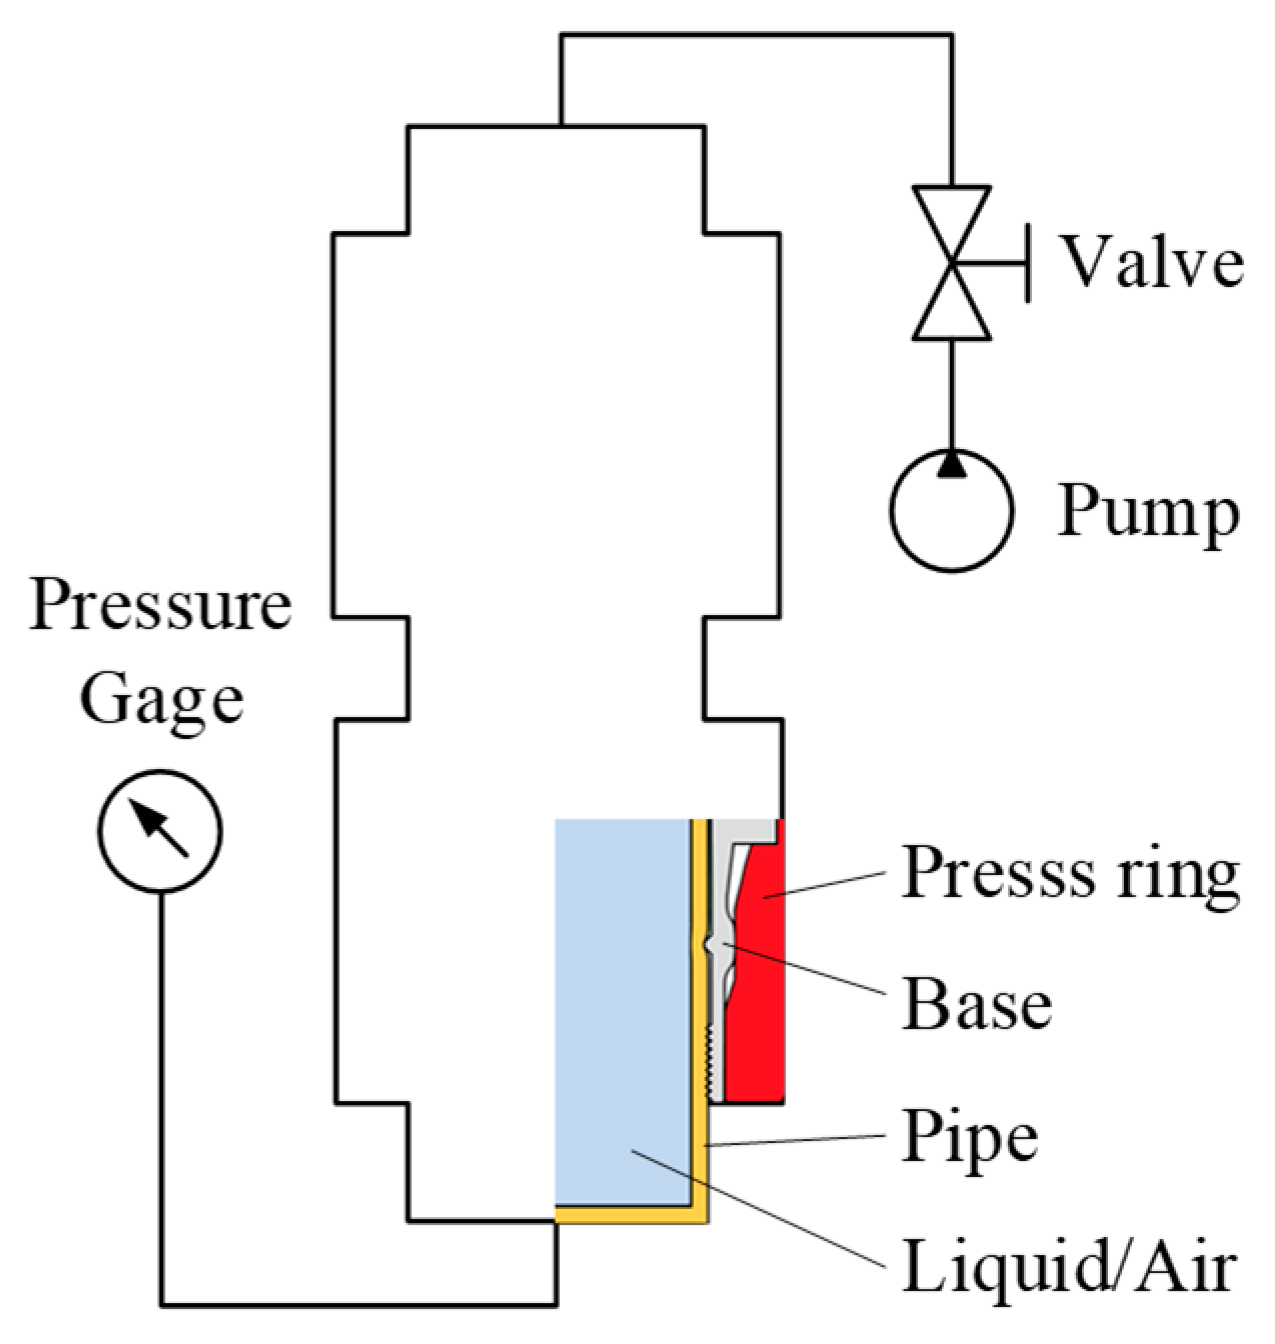
6.2. Experimental Test
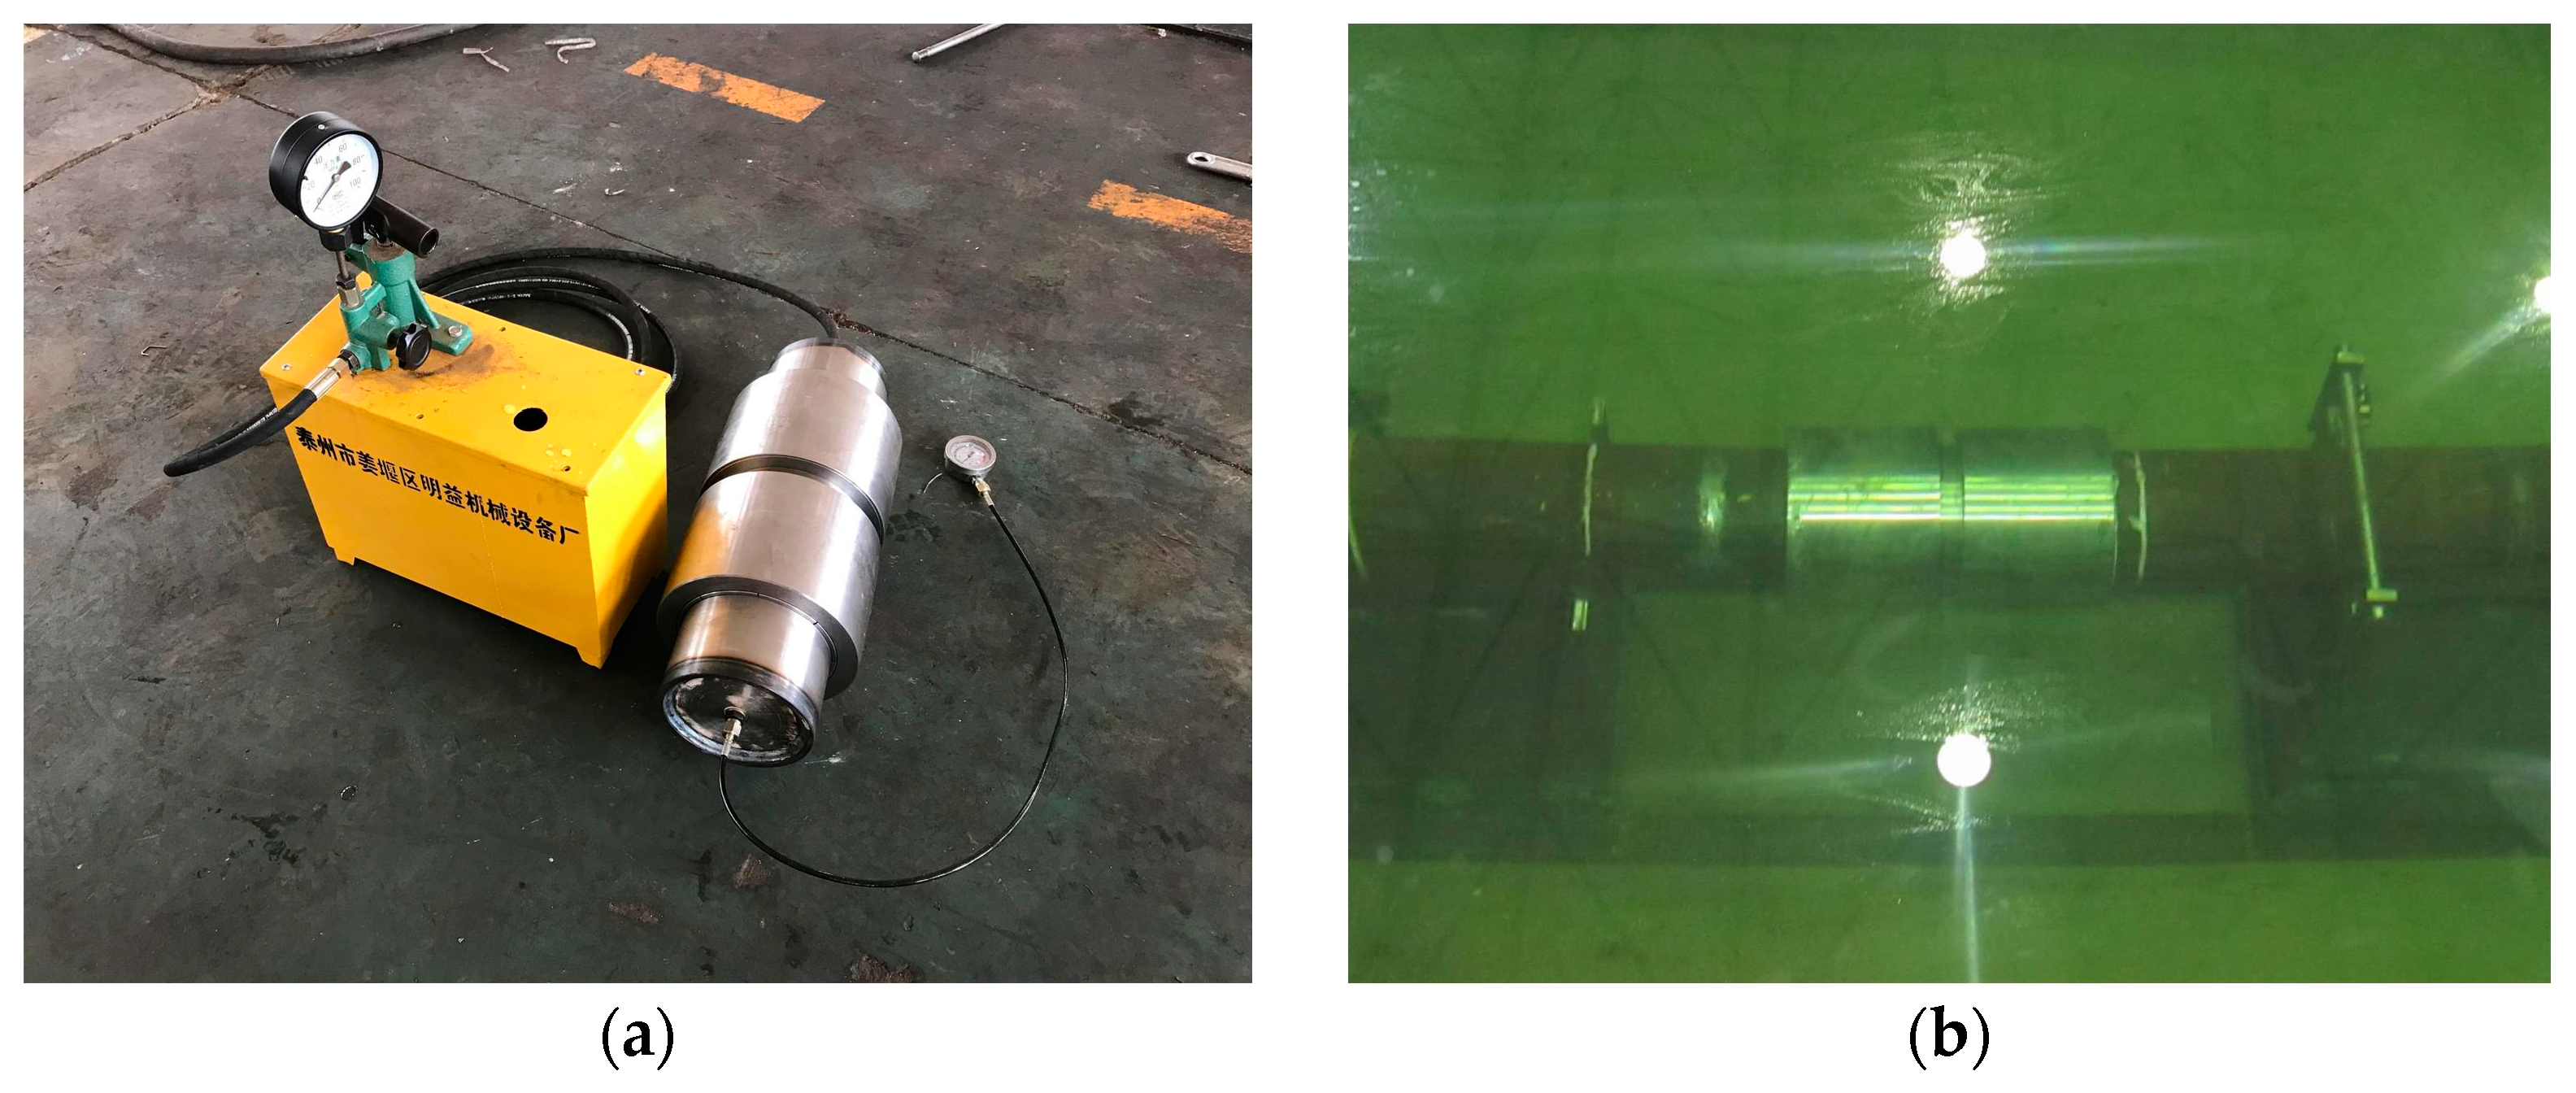
6.2.1. Working Pressure Test
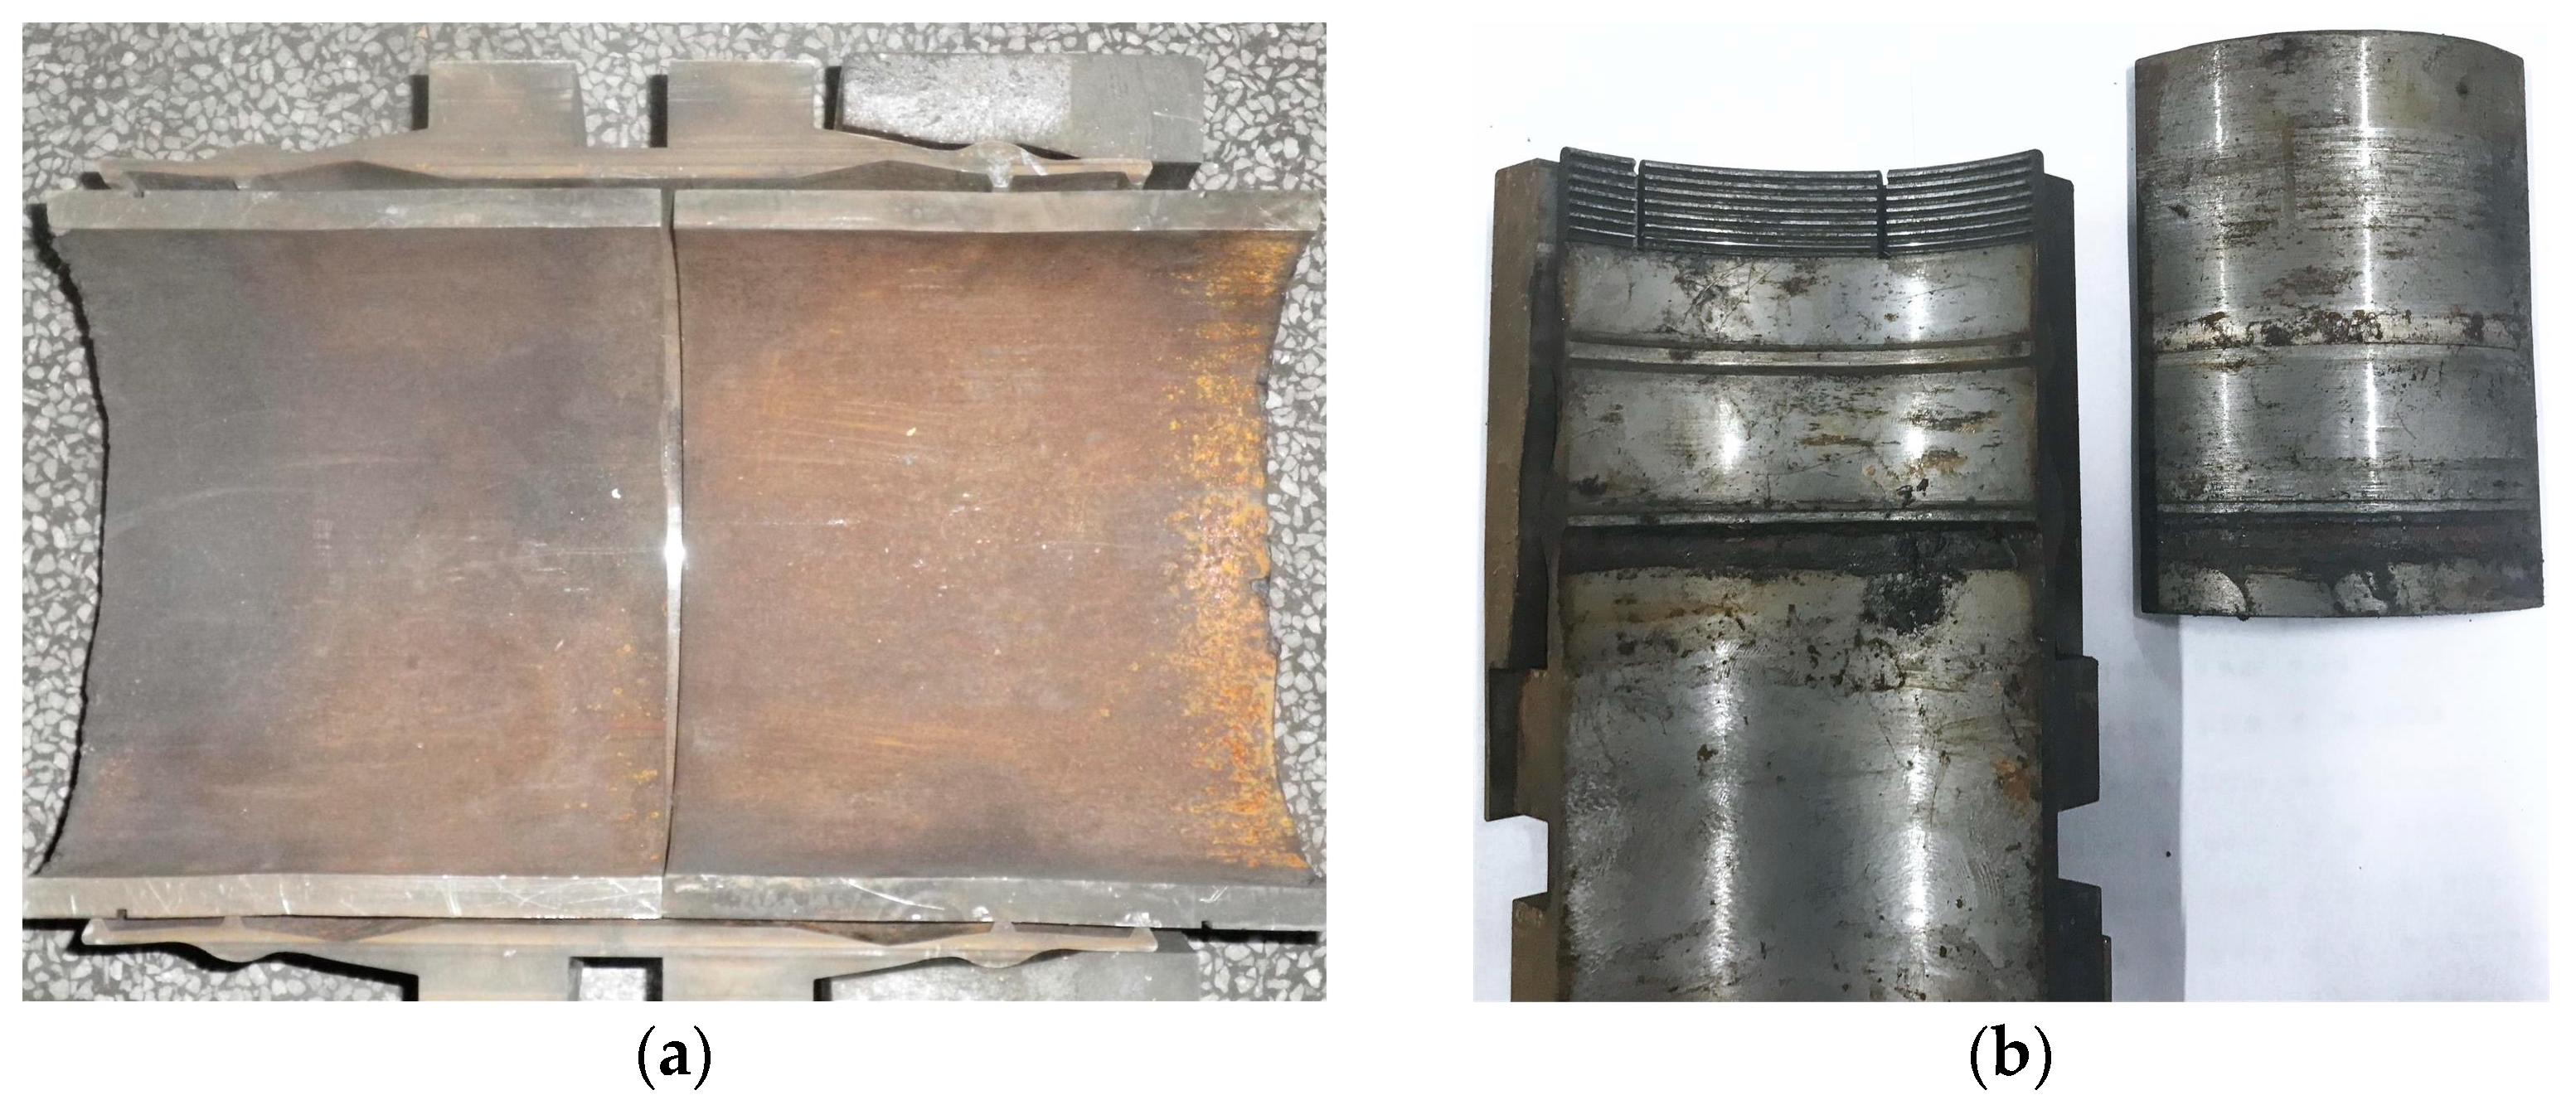
6.2.2. Burst Pressure Test
7. Conclusions
- A macroscopic 2D FE model is created to verify the analytical model. An agreement is found between the analytical and FE results with a mean error of less than 8.5%. The analytical model is proven to be good enough with the thickness–radius ratio being no more than 0.25 ( 0.25);
- The geometric parameter effects on the interference process are investigated. The influence and thresholds of the geometric parameters on sealing performance are presented, which provide the design guidance for the subsea pipeline compression connector;
- The radial sealing surface of the connector is observed by SEM. The surface is an anisotropic topography characterized by regular helical and continuous streaks with slight defects and irregularities. Potential leak paths in two orthogonal directions are identified as axial and circumferential;
- A mesoscopic 2D FE model is created based on the SEM result and the macroscopic FE model. The effects of the leakage channel in the sealing process are analyzed. Then, the analytical minimum deflections and those of FE are compared and shown to be consistent with each other. Since the macroscopic analytical minimum deflections of both the base and the pipe are included in the mesoscale results, it is theoretically verified that the semi-analytical method can identify and predict the leakage condition of the connector;
- The Abbott–Firestone curve of the sealing surface is introduced based on SEM observation and the FE model. A semi-analytical leakage model was obtained. Since the true height of the leakage channel shows a clear descent stage, the minimum preloaded deflection of the leak-tight range is identified. On the rough internally turned sealing surface, leakage may occur when the ratio of the pipe thickness to the sealing width is 3, and the recommended leak-tight design value is 5;
- The results with the proposed semi-analytical method correlate well with the working pressure test and the burst pressure test. The designed connectors can quickly create a reliable radial metal static seal with the rough turning topography and save more than 57% of design time compared to the common FE method, while reducing machining time and costs.
- The proposed semi-analytical method can be used to optimize the overall structural performance of compression connectors with a low computational cost. It allows the prediction and identification of the leakage condition of all standard pipe series with 0.25. The model also provides a good understanding of the radial sealing process. These results are helpful to highlight the different sealing performances with other type of seals and guide the further improvements.
Author Contributions
Funding
Institutional Review Board Statement
Informed Consent Statement
Data Availability Statement
Conflicts of Interest
Nomenclature
| Cross-sectional area of the hypothetical rectangle channel (mm2) | |
| Integral value of the total Abbott–Firestone curve (mm2) | |
| Flexural rigidity of cylindrical shell, base, and pipe, respectively (N·mm) | |
| Young’s modulus (MPa) | |
| Tangent modulus (MPa) | |
| Radial clearance between sealing surfaces (mm) | |
| Height of streaks (mm) | |
| Depth of embedded streaks (mm) | |
| Equivalent height of the hypothetical rectangular channel (mm) | |
| Axial distance between radial load and ridge (mm) | |
| Axial distance between anchors and ridge (mm) | |
| Length of the leakage channel (mm) | |
| Bending moments of axial section and a section perpendicular to the axis of a cylindrical shell, respectively (N·mm) | |
| Membrane forces of axial section and a section perpendicular to the axis of a cylindrical shell, respectively (N) | |
| Inlet the outlet pressures of the leakage channel (MPa) | |
| Components of radial load (N/mm) | |
| Reaction load (N/mm) | |
| Shearing force of intensity parallel to z axis of a section perpendicular to the axis of a cylindrical shell (N) | |
| Total equivalent radial load on the base (N/mm) | |
| Helical leakage ratio (L/h) | |
| Corner radius of the tool nose (mm) | |
| Radius of mid-surface of cylinder, base, and pipe, respectively (mm) | |
| Radius of leakage path (mm) | |
| Displacements of the mid-surface in the cylindrical coordinate (mm) | |
| Deflection components of (mm) | |
| Radial deflection of the base and pipe, respectively (mm) | |
| Deflection of the streak peaks (mm) | |
| Deflection component of (mm) | |
| Deflection of pipe surface at the seal (mm) | |
| Global rectangular coordinates of 2D axisymmetric FE model | |
| Thickness of cylinder, base, and pipe, respectively (mm) | |
| Strain components of cylindrical coordinates | |
| True strain | |
| Sealing width (mm) | |
| Width of the leakage channel (mm) | |
| Pitch of the streaks (feed rate) (mm) | |
| Kinematic viscosity (Pa·s) | |
| Friction coefficient | |
| Poisson’s ratio | |
| Hardening modulus (MPa) | |
| Yield strength of the base and pipe, respectively (MPa) | |
| True stress (MPa) | |
| (=R+z) | Cylindrical coordinates |
References
- Yun, F.; Liu, D.; Xu, X.; Jiao, K.; Hao, X.; Wang, L.; Yan, Z.; Jia, P.; Wang, X.; Liang, B. Thermal–Structural Coupling Analysis of Subsea Connector Sealing Contact. Appl. Sci. 2022, 12, 3194. [Google Scholar] [CrossRef]
- ASTM F1387; Standard Specification for Performance of Piping and Tubing Mechanically Attached Fittings. ASTM International: West Conshohocken, PA, USA, 2012.
- ISO 8434-1; Metallic Tube Connections For Fluid Power and General Use Part 1:24° Compression Fittings. International Organization for Standardization: Geneva, Switzerland, 2018.
- Okada, H.; Itoh, T.; Suga, T. The Influence of Surface Profiles on Leakage in Room Temperature Seal-Bonding. Sens. Actuators A Phys. 2008, 144, 124–129. [Google Scholar] [CrossRef]
- Lebeck, A.O. Hydrodynamic Lubrication in Wawy Contacting Face Seals-a Two Dimensional Iodei. J. Tribol. 1981, 103, 578–586. [Google Scholar] [CrossRef]
- Matsuzaki, Y.; Kazamaki, T. Effect of Surface Roughness on Compressive Stress of Static Seals. JSME Int. J. Ser. 3 1988, 31, 99–106. [Google Scholar] [CrossRef]
- Yanagisawa, T.; Sanada, M.; Koga, T.; Hirabayashi, H. The Influence of Designing Factors on the Sealing Performance of C-Seal. SAE Trans. 1991, 100, 651–657. [Google Scholar]
- Nakamura, T.; Funabashi, K. Effects of Directional Properties of Roughness and Tangential Force on Pressure Flow between Contacting Surfaces. Lubr. Sci. 1991, 4, 13–23. [Google Scholar] [CrossRef]
- Polycarpou, A.A.; Etsion, I. A Model for the Static Sealing Performance of Compliant Metallic Gas Seals Including Surface Roughness and Rarefaction Effects. Tribol. Trans. 2000, 43, 237–244. [Google Scholar] [CrossRef]
- Geoffroy, S.; Prat, M. On the Leak through a Spiral-Groove Metallic Static Ring Gasket. J. Fluids Eng. Trans. ASME 2004, 126, 48–54. [Google Scholar] [CrossRef]
- Liao, C.; Xu, X.; Fang, H.; Wang, H.; Man, M. A Leakage Model of Metallic Static Seals Based on Micromorphology Characteristics of Turning Flange Surface. Ind. Lubr. Tribol. 2015, 67, 572–581. [Google Scholar] [CrossRef]
- Beheshti, A.; Khonsari, M.M. Asperity Micro-Contact Models as Applied to the Deformation of Rough Line Contact. Tribol. Int. 2012, 52, 61–74. [Google Scholar] [CrossRef]
- Jackson, R.L.; Green, I. On the Modeling of Elastic Contact between Rough Surfaces. Tribol. Trans. 2011, 54, 300–314. [Google Scholar] [CrossRef]
- Marie, C.; Lasseux, D.; Zahouani, H.; Sainsot, P. An Integrated Approach to Characterize Liquid Leakage through Metal Contact Seal. Eur. J. Mech. Environ. Eng. 2003, 48, 81–86. [Google Scholar]
- Liao, Y.; Stephenson, D.A.; Ni, J. Multiple-Scale Wavelet Decomposition, 3D Surface Feature Exaction and Applications. J. Manuf. Sci. Eng. 2012, 134, 011005. [Google Scholar] [CrossRef]
- Deltombe, R.; Bigerelle, M.; Jourani, A. Analysis of the Effects of Different Machining Processes on Sealing Using Multiscale Topography. Surf. Topogr. Metrol. Prop. 2016, 4, 015003. [Google Scholar] [CrossRef]
- Bricaud, C.; Schulz, O.; Zierer, T.; Peltier, V.; Schwitzke, C.; Bauer, H.J. Experimental Investigations Into the Effect of Surface Roughness and Contact Force on Leakage Between Two Rigid Metallic Surfaces. J. Eng. Gas Turbines Power 2022, 144, 061006. [Google Scholar] [CrossRef]
- Weddeling, C.; Demir, O.K.; Haupt, P.; Tekkaya, A.E. Analytical Methodology for the Process Design of Electromagnetic Crimping. J. Mater. Process. Technol. 2015, 222, 163–180. [Google Scholar] [CrossRef]
- Weddeling, C.; Walter, V.; Haupt, P.; Tekkaya, A.E.; Schulze, V.; Weidenmann, K.A. Joining Zone Design for Electromagnetically Crimped Connections. J. Mater. Process. Technol. 2015, 225, 240–261. [Google Scholar] [CrossRef]
- Wei, Z.; Wang, L.; Guan, Y.; Yao, S.; Li, S. Static Metal Sealing Mechanism of a Subsea Pipeline Mechanical Connector. Adv. Mech. Eng. 2016, 8, 1–16. [Google Scholar] [CrossRef]
- Henriksen, J.; Hansen, M.R.; Thrane, F.C. Axial Load Capacity of Cold Formed Pipe Flange Connection. J. Press. Vessel Technol. 2017, 139, 051201. [Google Scholar] [CrossRef]
- Wang, L.Q.; Wei, Z.L.; Yao, S.M.; Guan, Y.; Li, S.K. Sealing Performance and Optimization of a Subsea Pipeline Mechanical Connector. Chin. J. Mech. Eng. Engl. 2018, 31. [Google Scholar] [CrossRef]
- Onyegiri, I.; Kashtalyan, M. Threaded Connectors for Sandwich Pipes—Part 1: Parametric & Comparative Studies. Int. J. Press. Vessel. Pip. 2018, 168, 117–124. [Google Scholar] [CrossRef]
- Quispe, J.L.P.; Pasqualino, I.P.; Estefen, S.F.; de Souza, M.I.L. Structural Behavior of Threaded Connections for Sandwich Pipes under Make-up Torque, External Pressure, and Axial Load. Int. J. Press. Vessel. Pip. 2020, 186, 104156. [Google Scholar] [CrossRef]
- Yan, Y.; Fan, Y. Influence of Fluid on Seal and Assembly of Pipeline Fittings Based on the Multiscale Finite Element Model. Complexity 2020, 2020, 4960734. [Google Scholar] [CrossRef]
- Agrawal, A.K.; Narayanan, R.G. Experimental and Numerical Studies on Joining Steel Tubes by End Forming. J. Constr. Steel Res. 2020, 167, 105792. [Google Scholar] [CrossRef]
- Liu, Z.; Zhang, L.; Wang, F.; Li, S.; Wang, P.; Cai, M.; Han, L.; Ma, Y.; Ma, Z.; Yan, B. Study on Optimization Design of Permanent Packer Slip Structure. J. Fail. Anal. Prev. 2020, 21, 50–60. [Google Scholar] [CrossRef]
- Wu, L.; Guo, X.; Chen, H.; Liu, J.; Su, Y. Calculation Method for the Axial Load-Bearing Capacity of Steel Pipe-to-Sleeve Grouted Connections. Constr. Build. Mater. 2022, 314, 125621. [Google Scholar] [CrossRef]
- Weddeling, C.; Gies, S.; Khalifa, N.B.; Tekkaya, A.E. Analytical Methodology for the Process and Joint Design of Form-Fit Joining by Die-Less Hydroforming. In Proceedings of the ASME 2014 International Manufacturing Science and Engineering Conference, MSEC 2014 Collocated with the JSME 2014 International Conference on Materials and Processing and the 42nd North American Manufacturing Research Conference, Web Portal ASME (American Society of Mechanical Engineers), Detroit, MI, USA, 9–13 June 2014; Volume 2. [Google Scholar]
- Ernens, D.; Pérez-Ràfols, F.; van Hoecke, D.; Roijmans, R.F.H.; van Riet, E.J.; Vande Voorde, J.B.E.; Almqvist, A.; de Rooij, M.B.; Roggeband, S.M.; van Haaften, W.M.; et al. On the Sealability of Metal-to-Metal Seals with Application to Premium Casing and Tubing Connections. SPE Drill. Complet. 2019, 34, 382–396. [Google Scholar] [CrossRef]
- Weber, F.; Gebhard, J.; Gitschel, R.; Goyal, S.; Kamaliev, M.; Wernicke, S.; Tekkaya, A.E. Joining by Forming–A Selective Review. J. Adv. Join. Process. 2021, 3, 100054. [Google Scholar] [CrossRef]
- Orynyak, I.; Bai, Y. Coupled Approximate Long and Short Solutions versus Exact Navier and Galerkin Ones for Cylindrical Shell under Radial Load. Thin-Walled Struct. 2022, 170, 108536. [Google Scholar] [CrossRef]
- Kumar, A.; Das, S.L.; Wahi, P.; Żur, K.K. On the Stability of Thin-Walled Circular Cylindrical Shells under Static and Periodic Radial Loading. J. Sound Vib. 2022, 527, 116872. [Google Scholar] [CrossRef]
- Abaqus, Version 6.14. Software for Technical Simulation. Dassault Systemes: Vélizy-Villacoublay, France, 2014.
- Rojíček, J.; Čermák, M.; Halama, R.; Paška, Z.; Vaško, M. Material Model Identification from Set of Experiments and Validation by DIC. Math. Comput. Simul. 2021, 189, 339–367. [Google Scholar] [CrossRef]
- ASME B36.10M; Welded and Seamless Wrought Steel Pipe. American Society of Mechanical Engineers: New York, NY, USA, 2018.
- ASME B36.19M; Stainless Steel Pipe. American Society of Mechanical Engineers: New York, NY, USA, 2018.
- Yang, Y.; Zhu, H.; He, D.; Du, C.; Xu, L.; He, Y.; Zheng, Y.; Ye, Z. Contact Mechanical Behaviors of Radial Metal Seal for the Interval Control Valve in Intelligent Well: Modeling and Theoretical Study. Energy Sci. Eng. 2020, 8, 1337–1352. [Google Scholar] [CrossRef]
- Liu, Y.; Du, H.; Ren, X.; Li, B.; Qian, J.; Yan, F. A Leakage Rate Model for Metal-to-Metal Seals Based on the Fractal Theory of Porous Medium. Aerospace 2022, 9, 779. [Google Scholar] [CrossRef]
- Manikandan, H.; Chandra Bera, T. Modelling of Dimensional and Geometric Error Prediction in Turning of Thin-Walled Components. Precis. Eng. 2021, 72, 382–396. [Google Scholar] [CrossRef]
- Abdalrahman, R.M.; Sure, S.A.H. The Influence of Cutting Edge Angles Included Angle and Nose Radius on Surface Finish of Aluminum Alloy 1050 in Turning. Zanco J. Pure Appl. Sci. 2020, 32, 31–38. [Google Scholar] [CrossRef]
- Shao, Y.; Yin, Y.; Du, S.; Xia, T.; Xi, L. Leakage Monitoring in Static Sealing Interface Based on Three Dimensional Surface Topography Indicator. J. Manuf. Sci. Eng. 2018, 140, 101003. [Google Scholar] [CrossRef]
- ISO 16610-41-2015; Geometrical Product Specifications (GPS)-Filtration-Part 41: Morphological Profile Filters: Disk and Horizontal Line-Segment Filters. International Organization for Standardization: Geneva, Switzerland, 2015.
- ISO 16610-85-2013; Geometrical Product Specifications (GPS)-Filtration-Part 85: Morphological Areal Filters: Segmentation. International Organization for Standardization: Geneva, Switzerland, 2015.
- Chen, J.J.; Shih, Y.S. Study of the Helical Effect on the Thread Connection by Three Dimensional Finite Element Analysis. Nucl. Eng. Des. 1999, 191, 109–116. [Google Scholar] [CrossRef]
- Toupin, R.A. Saint-Venant’s Principle. Arch. Ration. Mech. Anal. 1965, 18, 83–96. [Google Scholar] [CrossRef]
- Nitta, I.; Matsuzaki, Y. Experimental Study of the Performance of Static Seals Based on Measurements of Real Contact Area Using Thin Polycarbonate Films. J. Tribol. 2010, 132, 022202. [Google Scholar] [CrossRef]
- Georgescu, C.; Cristea, G.C.; Dima, C.; Deleanu, L. Evaluating Lubricating Capacity of Vegetal Oils Using Abbott-Firestone Curve. IOP Conf. Ser. Mater. Sci. Eng. 2017, 174, 012057. [Google Scholar] [CrossRef]
- Prat, M.; Plouraboué, F.; Letalleur, N. Averaged Reynolds Equation for Flows between Rough Surfaces in Sliding Motion. Transp. Porous Media 2002, 48, 291–313. [Google Scholar] [CrossRef]
- ASME B16.104; Control Valve Seat Leakage. American Society of Mechanical Engineers: New York, NY, USA, 1998.
- ISO 21329:2004; Petroleum And Natural Gas Industries-Pipeline Transportation Systems-Test Procedures for Mechanical Connectors. International Organization for Standardization: Geneva, Switzerland, 2004.


| Name | Unit | Symbol | Value | |
|---|---|---|---|---|
| Base | Pipe | |||
| Type | - | - | 6-inch | DN 150 |
| Radius | mm | 215 | 168 | |
| Thickness | mm | 20 | 20 | |
| Yield strength | Mpa | 600 | 235 | |
| Axial distance | mm | 0.2 | ||
| Radial clearance | mm | 0.4 | ||
| Young’s modulus | Mpa | 2.10 × 10⁵ | ||
| Tangent modulus | Mpa | 5 × 10² | ||
| Poisson coefficient | - | 0.3 | ||
| Friction coefficient | - | 0.2 | ||
| Type | Nominal Diameter (mm) | Nominal Thickness (mm) | Medium | Yield Strength (MPa) | |||
|---|---|---|---|---|---|---|---|
| DN | Inch | Water | Air | Pipe | Connector | ||
| 80 | 3 | 89 | 5 | 15 | 0.2 | 235 | 345 |
| 100 | 4 | 114 | 7 | 7 | 0.1 | ||
| 150 | 6 | 168 | 8 | 6 | 0.1 | ||
| 200 | 8 | 219 | 10 | 4.5 | 0.08 | ||
| Type | Pressure (MPa) | Pressure Drop | Leakage | Structural Change | |||||
|---|---|---|---|---|---|---|---|---|---|
| DN | Inch | Water | Air | Water | Air | Water | Air | Water | Air |
| 80 | 3 | 15 | 0.2 | × | × | × | × | × | × |
| 100 | 4 | 7 | 0.1 | × | × | × | × | × | × |
| 150 | 6 | 6 | 0.1 | × | × | × | × | × | × |
| 200 | 8 | 4.5 | 0.08 | × | × | × | × | × | × |
| Type | Mean Burst Pressure (MPa) | Pressure Drop | Leakage | Structural Change | ||
|---|---|---|---|---|---|---|
| DN | Inch | Current | Previous | |||
| 80 | 3 | 45 | 36 | √ | × | √ |
| 100 | 4 | 33 | 30 | √ | × | √ |
| 150 | 6 | 20 | 20 | × | × | √ |
| 200 | 8 | 12 | 10 | × | × | √ |
Disclaimer/Publisher’s Note: The statements, opinions and data contained in all publications are solely those of the individual author(s) and contributor(s) and not of MDPI and/or the editor(s). MDPI and/or the editor(s) disclaim responsibility for any injury to people or property resulting from any ideas, methods, instructions or products referred to in the content. |
© 2023 by the authors. Licensee MDPI, Basel, Switzerland. This article is an open access article distributed under the terms and conditions of the Creative Commons Attribution (CC BY) license (https://creativecommons.org/licenses/by/4.0/).
Share and Cite
Li, Z.; Wang, G.; Yao, S.; Yun, F.; Jia, P.; Li, C.; Wang, L. A Semi-Analytical Method for the Sealing Performance Prediction of Subsea Pipeline Compression Connector. J. Mar. Sci. Eng. 2023, 11, 854. https://doi.org/10.3390/jmse11040854
Li Z, Wang G, Yao S, Yun F, Jia P, Li C, Wang L. A Semi-Analytical Method for the Sealing Performance Prediction of Subsea Pipeline Compression Connector. Journal of Marine Science and Engineering. 2023; 11(4):854. https://doi.org/10.3390/jmse11040854
Chicago/Turabian StyleLi, Zhenyu, Gang Wang, Shaoming Yao, Feihong Yun, Peng Jia, Chao Li, and Liquan Wang. 2023. "A Semi-Analytical Method for the Sealing Performance Prediction of Subsea Pipeline Compression Connector" Journal of Marine Science and Engineering 11, no. 4: 854. https://doi.org/10.3390/jmse11040854