Article

Wave Overtopping at Sea Dikes on Shallow Foreshores: A Review, an Evaluation, and Remaining Challenges

1
Department of Civil Engineering, Middle East Technical University, Ankara 06800, Turkey
2
Department of Civil Engineering, Izmir Institute of Technology, Izmir 35430, Turkey
3
Department of Civil Engineering, Ghent University, 9000 Ghent, Belgium
*
Author to whom correspondence should be addressed.
J. Mar. Sci. Eng. 2023, 11(3), 638; https://doi.org/10.3390/jmse11030638
Submission received: 2 February 2023 / Revised: 8 March 2023 / Accepted: 10 March 2023 / Published: 17 March 2023
(This article belongs to the Special Issue Wave Interactions with Coastal Structures II)

Abstract

:
Wave overtopping is a critical parameter in the design of coastal defense structures. Nowadays, several empirical formulations based on small-scale experiments are available in the literature to predict the mean overtopping discharge at dikes on shallow foreshores. Although the accuracy of the predictions has improved due to each approach’s contributions, the formulations’ performance depends on their range of applicability. In engineering applications, it is important to know the performance and limitations of the different formulas. This work presents a new experimental dataset focused on very shallow and extremely shallow foreshore conditions for a range of foreshore slopes (i.e., 1/20, 1/35, 1/50, and 1/80) and relative water depths. The recent developments in wave overtopping research on very shallow and extremely shallow foreshore conditions have been reviewed using this dataset to reflect the existing uncertainties and challenges in the wave-overtopping literature. We find that predicting wave overtopping for extremely shallow foreshore conditions still requires improvement. Additional research is needed to understand the (residual) influence on the wave overtopping of the foreshore slope and relative magnitude of the infragravity wave height to the sea-swell wave height at the dike toe, especially for extremely shallow foreshore conditions. The variation in performance of the formulas for different foreshore slopes is demonstrated. Finally, some of the remaining uncertainties that need further exploration are discussed.

1. Introduction

The accurate assessment of wave overtopping parameters is an essential step in the design of coastal structures, as the flood protection performance of the structure depends on the volume of water passing over during extreme events. The incident wave characteristics and water level at the toe of the structure are the key hydrodynamic inputs to estimate the wave overtopping. The dike geometry and the material are also important parameters affecting the overtopping volumes. The water depth at the toe of the structure and the slope of the foreshore transform the wave properties, and the impact is significant when wave breaking occurs in front of the structure; i.e., shallow foreshore [1]. The shallowness of the foreshore can change the degree of breaking and the spectra of the wave such that the overtopping volume is affected by the same dike geometry or material [2]. Dikes on shallow foreshore occur in different parts of the world, such as northwestern European coasts and coastal deltas such as Mekong, Vietnam. The shallowness of the foreshore can be described using relative water depth (htoe/Hm0,o), breaker index (ξm,1,0), or steepness (sm−1,0). Any change in water depth or wave height at the coast, in front of the structure over time, could affect the overtopping performance. Considering the economic and social importance of sea dikes along coastal areas, it is crucial to use accurate tools to determine wave overtopping. As the hydrodynamic conditions are changing due to climate change impacts, the dynamics of wave overtopping under different climate and geomorphological conditions have become important.
Mean overtopping discharge and wave-by-wave overtopping are the parameters on which the research is focused. The focus on wave-by-wave overtopping has increased in recent years since parameters such as overtopping flow velocity and thickness associated with individual overtopping events improve safety and design considerations. Thus, some of these parameters are now included in design manuals such as EurOtop [3]. However, challenges in the measurement and analysis of data combined with limited accurate available datasets hinder the applicability of the recent studies in the design process [4]. Therefore, the mean overtopping discharge per meter width of the structure is still the most widely used parameter worldwide.
Empirical formulations based on laboratory experiments have been proposed in the literature to estimate the mean overtopping discharge. The accuracy of this estimation has improved with new experimental data focusing on different parameters of the phenomena such as the effect of foreshore, including extremely shallow conditions, directional spreading, and infragravity (IG) wave energy [5,6,7,8]. There are several existing methods to estimate the mean wave overtopping. Goda [9] proposes a unified formula for vertical and sloped structures with limited inclusion of data of (very) shallow conditions. Mase et al. [10] developed a set of formulas based on deep-water characteristics for run-up and overtopping under very shallow foreshore conditions. An imaginary slope concept for complex geometries was introduced for overtopping estimation based on the initial calculation of the run-up. Yuhi et al. [11] improved the tendency of Mase et al. [10] to underestimate the discharge in the range of relatively high freeboard conditions. EurOtop [3] recommends the use of the Van Gent [12] empirical model modified by Altomare et al. [2] for shallow foreshore cases, based on an equivalent slope concept. Lashley et al. [7] proposed another set of formulas for very shallow and extremely shallow conditions revisiting Goda et al. [13] and using deep-water characteristics as input.
Although each method has contributed to a better understanding of the wave overtopping in shallow foreshore conditions, there are significant differences among them. Many of these formulas use the wave conditions at the toe as input parameters, so that when no measurements at the toe of the dike are available, changes in the wave characteristics from deep water to the water depth at the dike toe need to be calculated separately. In this case, any change in the wave characteristics as the wave propagates over the foreshore slope (such as breaking, change in spectra) is already inherently part of the input. Recent studies showed that waves at the toe of dikes with very shallow and extremely shallow foreshores have an important contribution by IG waves (wave period T = 20–200 s, wave frequency f = 0.005–0.05 Hz [14]). The wave characteristics at the dike toe for shallow foreshores can be calculated using empirical models for Hs [15] and Tm−1,0 [1], but the uncertainty of these empirical models introduces additional uncertainty into the result of the overtopping calculation. A more accurate estimation of the wave characteristics at the dike toe generally requires the application of numerical modeling, such as phase-averaged spectral wave models (e.g., SWAN) with empirical inclusion of IG waves, Boussinesq (e.g., BOSZ), nonhydrostatic nonlinear shallow water (e.g., SWASH), Reynolds-averaged Navier–Stokes (e.g., OpenFOAM), or Smooth-Particle Hydrodynamics (e.g., DualSPHysics) equations models [6,16]. However, many of these numerical methods are computationally expensive and are also capable of estimating the wave-overtopping discharge directly, without further need for an empirical model. Lashley et al. [7] therefore proposed the use of deep-water wave characteristics as input for their empirical model, to overcome the added uncertainty in the estimation of wave overtopping and to preclude numerical modeling in very shallow and extremely shallow foreshore conditions. However, a disadvantage of this model is that directional spreading is not taken into account, which is known to significantly affect IG wave growth [17], and, therefore, the overtopping [5]. While the wave characteristics and relative freeboard are the common parameters of all the empirical methods, a variety of additional parameters are introduced in each formulation which affect the performance for different conditions. Van Gent [12] uses the breaker parameter to consider the breaking over the structure slope; however, the influence of foreshore and water depth at the toe are assumed to be included within the wave characteristics at the toe. Altomare et al. [2] introduced the equivalent slope concept, which combines the foreshore slope and dike slope indirectly; however, the influence of water depth at the toe is not considered. Goda [9] integrates relative water depth at the toe, dike slope, and foreshore slope directly in the equation, but wave steepness is not considered. Lashley et al. [7] use relative water depth, dike slope, foreshore slope, and wave steepness as direct input parameters; however, the relationship between overtopping and wave characteristics are based on deep-water conditions. The formula inherently considers the wave transformation via parameters to determine the coefficients of the empirical formula.
All the different empirical methods are based on the physical model tests available at the time of their formulations. However, the data have been very limited for very shallow and extremely shallow foreshore conditions, including the ability to generate and analyze infragravity waves at the toe of the dikes. Although all the formulations are recommended to be used within their range of applicability (i.e., range of the experimental dataset), they are also applied for a varied range of conditions. Even though the range of parameters directly included in the estimation methods has been expanded with recent studies, the validation is still limited and most of these studies use common datasets such as the CLASH database [18]. In this paper, the recent developments in wave overtopping research on very shallow and extremely shallow foreshore conditions have been reviewed using a newly introduced set of experimental data. The data are focused on very shallow and extremely shallow foreshore conditions for wave overtopping on a constant dike geometry; thus, the influence of hydrodynamic conditions at the toe of the dike can be exclusively assessed on the prediction capability of the existing empirical formulations. The performances of the methods for the new dataset highlight the existing uncertainties and challenges regarding the different approaches of estimating the mean wave-overtopping discharge at sea dikes in very-shallow-to-extremely-shallow foreshore conditions.

2. Foreshore Classification

The foreshore is the part of the seabed bathymetry, extended from the toe of the coastal structure to the seaward direction, that is characterized by depth-induced wave processes such as shoaling and wave breaking. It can be horizontal or up to a maximum slope of 1:10 and has a minimum length of one wavelength Lo (i.e., a deep-water wavelength, calculated with the wave period at the toe of the structure). A foreshore steeper than 1:10 directly in front of a structure can better be considered as part of that structure (EurOtop, 2018). For smaller water depths, the foreshore is able to dissipate sea-swell (SS) waves (T = 1–20 s, f = 0.05–1.00 Hz) by depth-induced wave breaking and increase IG wave heights by shoaling and/or by a time-varying breakpoint, so that both SS and IG waves have important contributions to the wave conditions at the toe of the structure. Therefore, it is important to determine the shallowness of the foreshore to know when to take the effect(s) of the foreshore on the wave characteristics at the toe of the structure (and the overtopping process) into account.

2.1. Based on Breaker Parameter
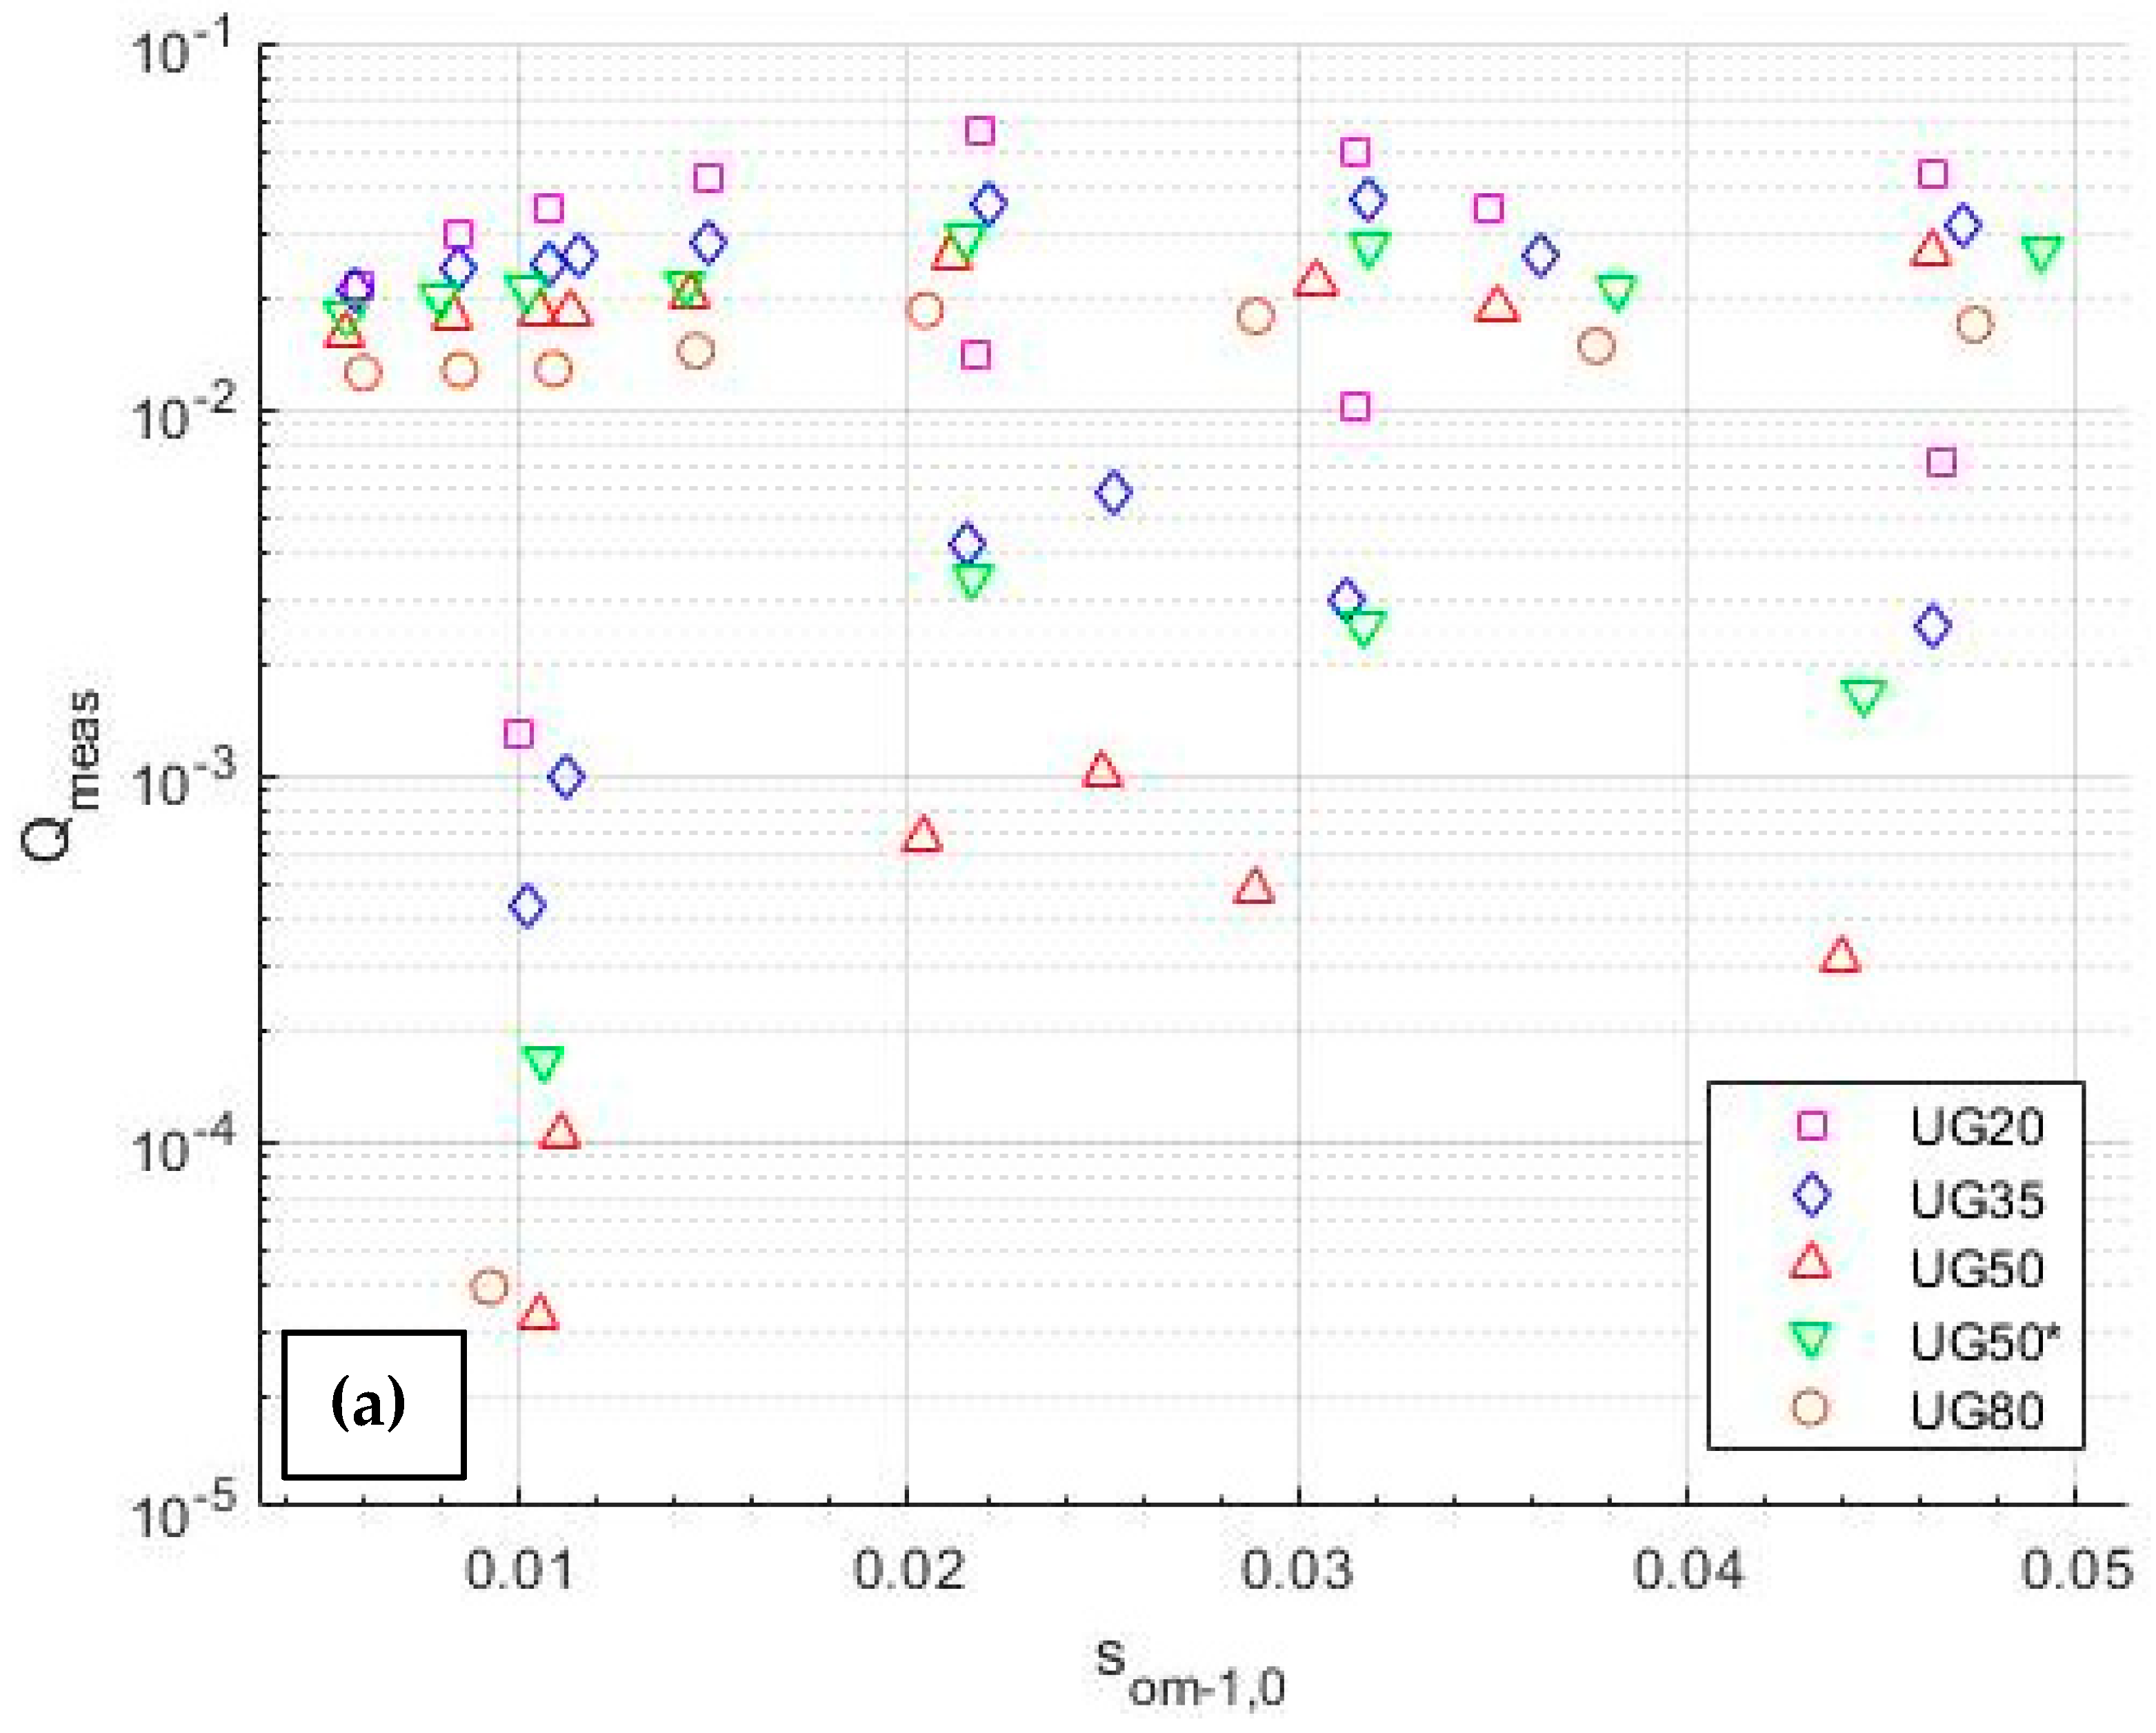
The breaker parameter, surf similarity, or Iribarren number is defined as:
ξ m 1 , 0 = t a n ( α ) / ( H m 0 , t o e / L m 1 , 0 )
where α is the slope of the front face of the structure, H m 0 , t o e is the spectral significant wave height at the toe of the dike, and L m 1 , 0 is the (fictitious) deep-water wavelength. Note that not the actual wavelength for the water depth at the toe of the structure is used, but the fictitious deep-water wavelength definition is used instead, based on the spectral wave period at the toe of the structure (i.e., L m 1 , 0 = g . T m 1 , 0 , t o e 2 / 2 π ).
The wave height at a structure on a very shallow foreshore is much smaller than in deep-foreshore-depth situations. This means that the wave steepness becomes much smaller, too. Consequently, the breaker parameter, which is used in the formulae for wave run-up and wave overtopping, becomes much larger. Van Gent [12] and TAW [19] propose the use of an overtopping formula for (very) shallow foreshore cases when the breaker parameter is larger than 7. For cases with a breaker parameter less than 5, a deep foreshore is assumed and another set of overtopping formulas is presented. For 5 < ξ m 1 , 0 < 7 , a linear interopolation of q between the deep and (very) shallow foreshore overtopping predictions was recommended. However, several experiments by Van Gent [12] show values of the breaker parameter less than 5, although heavy breaking is observed and the conditions indicate a shallow foreshore, thus representing a discrepancy in these criteria based on the breaker parameter.

2.2. Wave Steepness

Altomare et al. [2] proposed using the wave steepness, sm−1,0 (defined as the ratio of wave height to wavelength), to identify the shallowness of the foreshore:
s m 1 , 0 = H m 0 , t o e / L m 1 , 0  
Typical wind seas generally have a steepness of 0.04–0.06, whereas a steepness of 0.01 in deep water indicates a typical swell sea [3]. The overtopping is affected by the long period waves of swell seas. Additionally, the steepness of wind seas may become lower as wave height decreases due to wave breaking on a gentle foreshore where the wave period does not change initially. The lower wave steepness of wind seas in depth-limited locations often indicates broken waves on a foreshore. The wave steepness at the toe of the structure is often smaller than 0.01 and indicates that there might be a very shallow or extremely shallow foreshore. Altomare et al. [2] used this wave steepness definition to describe shallow (or very shallow) foreshore conditions when proposing their overtopping formula.

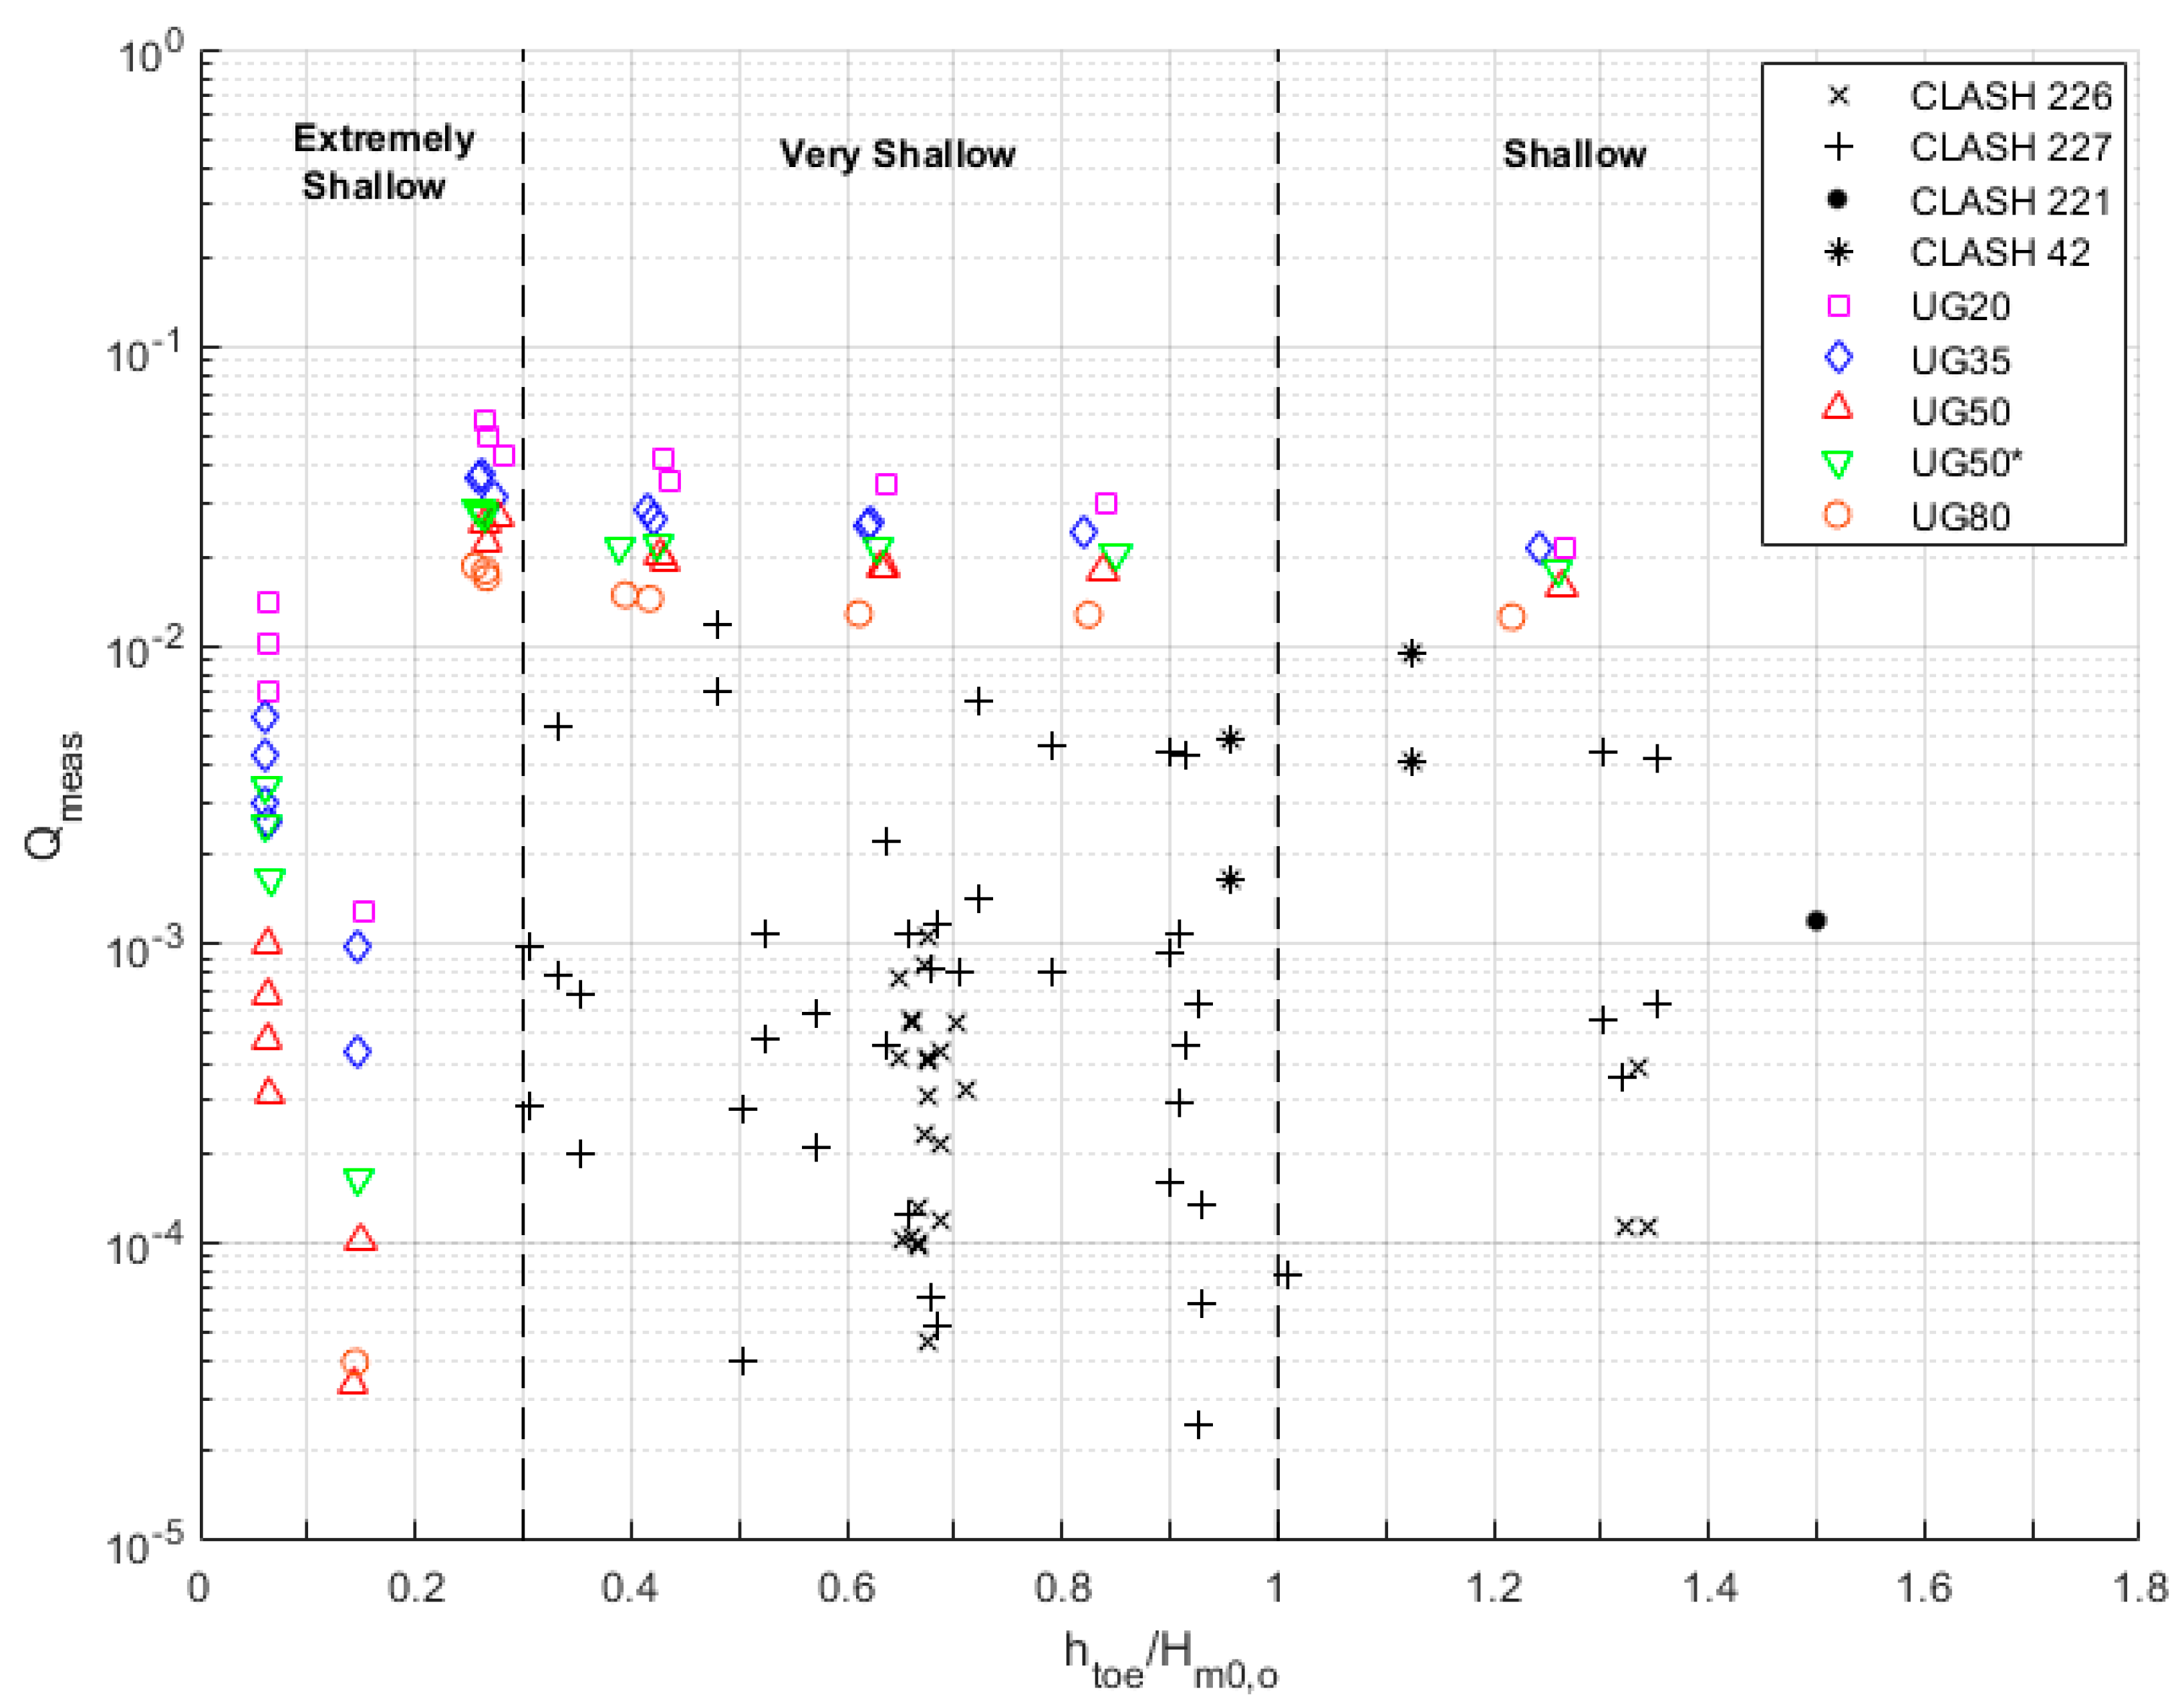
2.3. Based on Relative Water Depth (htoe/Hm0,o)

Van Gent [12] proposed using the ratio of deep-water wave height (Hm0,o) to water depth at the toe (htoe) as a classification parameter to describe the shallowness of the foreshore. If Hm0,o/htoe is greater than 3.0 (or htoe/Hm0,o < 0.33), then the foreshore can be considered very shallow, whereas if the ratio is between 0.75 and 1.5 (or 0.67 < htoe/Hm0,o < 1.33), the foreshore is shallow. A ratio of less than 0.4 (or htoe/Hm0,o > 2.5) defines a deep foreshore.
Recently, Hofland et al. [1] described the shallowness of foreshore using the same two parameters as Van Gent [12], but introducing an additional shallow foreshore definition as extremely shallow foreshore. The ratio is based on the relative water depth at the toe of the structure, defined as htoe/Hm0,o. If the water depth is at least four times the wave height at deep water (htoe/Hm0,o > 4), then it is considered a deep foreshore depth. A shallow foreshore depth is considered for 1 < htoe/Hm0,o < 4. This is the area where waves may shoal and then start to break. The spectral shape still resembles the single-peaked offshore spectrum, with minor second-order effects as increased energy at lower and higher frequencies. A very shallow foreshore depth is defined for the range of 0.3 < htoe/Hm0,o < 1. This is the region where waves break further, but where the wave period Tm−1,0 may also increase. Typical single-peaked offshore spectra may become either flattened, form a second peak, or experience a complete shift in wave energy from higher (wind sea) to lower (infragravity) frequencies. These so-called IG waves are defined by wave energy at less than half the deep-water peak frequency and may become enhanced, certainly, if waves come into the extremely shallow foreshore depth with htoe/Hm0,o < 0.3. The transition between shallow and very shallow foreshores can be indicated as the point where the original total incident wave height, due to breaking, is decreased significantly. The classification by Hofland et al. [1] has been used extensively in the recent literature on wave overtopping on shallow foreshores. Altomare et al. [2] observed that the foreshore starts to influence the overtopping when the ratio htoe/Hm0,toe is less than 1.5, although the wave height used in this ratio is taken as the wave height at the toe of the structure.
Lashley et al. [7] defined another set of limits for the definition of very shallow and extremely shallow foreshores when they proposed another set of wave-overtopping formulas for shallow foreshores. While htoe/Hm0,o > 1 describes a deep-to-shallow foreshore, 0.5 ≤ htoe/Hm0,o ≤ 1 describes very shallow cases and htoe/Hm0,o ≤ 0.1 means an extremely shallow or emergent foreshore depth at the toe of the structure. They also represent a transition region from very shallow to extremely shallow, and propose using wave-overtopping formulas accordingly.
In the present paper, the classification by Hofland et al. [1] is followed (unless otherwise specified), as it is currently prescribed in EurOtop [3].

3. Existing Empirical Methods

The estimation of wave overtopping on coastal structures has been mainly associated with the relative freeboard (Rc/Hm0,toe) [3]. Depending on the structure material (roughness), geometry (berm, wall), and wave obliqueness, reduction factors are introduced into the equations. Based on experimental data, calibration coefficients are also widely used. Generally, it was assumed that any transformation on wave characteristics would be reflected into the estimations by using the wave height at the toe of the structure. However, as experimental data became available for shallower foreshore cases, the formulas evolved to include parameters to reflect the physics both along the foreshore and at the slope of the structure.

3.1. Van Gent (1999)

Van Gent [3] introduced two equations to estimate the overtopping discharge for (very) shallow foreshore depths based on small-scale model tests on 1/100 and 1/250 foreshore slopes. The results showed that the spectral wave period increased while the wave heights were reduced significantly. This implied a very low wave steepness and therefore a very large breaker parameter. Consequently, the breaker parameter was integrated into the empirical model to reflect the influence of the spectral wave period as well as the dike slope on the overtopping discharge. The tested structure had smooth slopes of 1/4 and 1/2.5. Equation (3) is valid for ξ m 1.0     > 7 and refers to the probabilistic approach in EurOtop [20].
q g H m 0 , t o e 3 = 0.12 e x p [ R c H m 0 , t o e γ f γ β ( 0.33 + 0.22 ξ m 1 , 0 ) ]  
where q is the overtopping discharge per meter width of the structure (m3/s/m) and Rc is the crest freeboard (m). Equation (4) is recommended in the case of ξ m 1.0 < 5 with a maximum of Equation (5) [20].
q g H m 0 , t o e 3 = 0.067 t a n α   γ b   ξ m 1 , 0   e x p [ 4.75 R c H m 0 , t o e γ f γ β γ v γ b ξ m 1 , 0 ]  
  q g H m 0 , t o e 3 = 0.2   e x p [ 2.6 R c H m 0 , t o e γ f γ β ]  
where, γb, γv, γf, and γβ are the influence factors for a berm, a wave wall, roughness elements on the slope, and oblique wave attack, respectively.
The experiments of Van Gent [12] cover a range of conditions from deep to very shallow foreshore depths, so not including the conditions for extremely shallow foreshore depths. Additionally, not all the results reflect the breaker criteria used to differentiate the shallow foreshore cases, as there were results with low breaker values (<5–7) and still with very low steepness. Goda [9] showed that Van Gent [12] underestimated the overtopping significantly for cases of htoe/Hm0,toe < 1 based on experimental data from Tamada et al. [21], which had steeper foreshore slopes of 1/10 and 1/30. On the other hand, Altomare et al. [2] showed that Van Gent [12] overestimated the wave overtopping for values of htoe/Hm0,toe < 1–1.5, for milder-sloped very shallow foreshores. Similarly, the results indicated that the influence of a very shallow foreshore is not well accounted for, because the overestimation is also significant for sm−1,0 < 0.001 (long waves with limited wave height). Both studies attributed the limitation of the formula for not including the influence of foreshore slope on the wave-overtopping discharge. On the other hand, Nguyen et al. [8] demonstrated that Van Gent [12] performed comparably well for very gently sloping and very shallow foreshores (i.e., 1/500 to 1/1000).

3.2. Goda (2009)

Goda [9] showed that the formulas recommended by EurOtop [20] showed overestimation for large overtopping rates and underestimation for small values. Therefore, a set of unified formulas for mean wave overtopping at coastal structures was derived through the analysis of selected cases from the CLASH dataset. The formulas are applicable for both vertical walls and inclined seawalls (down to slope 1/7) with smooth and impermeable surfaces. The proposed formulas included the influence of relative water depth at the toe (htoe/Hm0,toe), the foreshore slope angle m, and the dike slope angle α as coefficients (Equations (7)–(10)) in the main equation (Equation (6)).
  q g H m 0 , t o e 3 = e x p [ ( A + B R c H m 0 , t o e ) ]  
A = A 0   t a n h [ ( 0.956 + 4.44 t a n   m ) · ( h t o e / H m 0 , t o e + 1.242 2.032 t a n 0.25   m ) ]  
B = B 0   t a n h [ ( 0.822 2.22 t a n   m ) · ( h t o e / H m 0 , t o e + 0.578 + 2.22 t a n   m ) ]  
A 0 = 3.4 0.734 c o t   α + 0.239 c o t 2   α 0.0162 c o t 3   α  
B 0 = 2.3 0.5 c o t   α + 0.15 c o t 2   α 0.011 c o t 3   α  
The data analyzed by Goda [9] only had h t o e / H m 0 , t o e   > 1.0. Data from Tamada et al. [21] were included to reflect the case of a very shallow foreshore depth; however, no data for extremely shallow foreshore depths were included. Additionally, the foreshore slopes of the Tamada et al. [21] dataset were 1/10 and 1/30, which are steeper foreshore slopes. Altomare et al. [2] showed that the errors increased significantly for sm−1,0 < 0.001 and htoe/Hm0,toe < 1.5. The inaccuracy of Equation (10) for very and extremely shallow foreshore conditions was attributed to the limited representation of these cases in the analysis dataset.

3.3. Altomare et al. (2016) in EurOtop (2018)

Altomare et al. [2] introduced another set of experimental data that focused on wave overtopping with shallow-to-extremely-shallow foreshore conditions (htoe/Hm0,toe < 1). Tests were conducted with a foreshore slope of 1/35 and smooth dike slopes of 1/2, 1/3, and 1/6, whereas tests with a 1/50 foreshore slope had a dike slope of 1/2. They also included data from the CLASH database with a wave steepness smaller than 0.01 and dike slopes between 1/8 and 1/2. All the tests used in the analysis were characterized by smooth impermeable slopes and simple geometries (no berm). They concluded that the breaking limit chosen in EurOtop [20] (htoe/Hm0,toe < 1.5) is also a significant limit for wave overtopping behavior observed in their datasets. This led to the consideration of the foreshore slope in the estimation of overtopping for (very) shallow foreshores in addition to the wave characteristics observed at the toe of the structure by modifying the Van Gent [12] formulation. They proposed using an equivalent slope concept (Equation (11)) in the breaker parameter used in the Van Gent [12] formula.
  t a n   δ = 1.5 · H m 0 , t o e + R u 2 % ( 1.5 · H m 0 , t o e h t o e ) · c o t   m + ( h t o e + R u 2 % ) · c o t   α
where δ is the equivalent slope, and
R u 2 % H m 0 , t o e = 4 1.5 ξ m 1 , 0
Both ξ m 1 , 0 and R u 2 % must be obtained iteratively until R u 2 % converges with an initial estimate of R u 2 % = 1.5 · H m 0 , t o e .
The equivalent slope is defined as an average slope between the foreshore and the dike. The approach integrates the influence of the water depth at the toe, foreshore slope, and dike slope for the cases with the ratio htoe/Hm0,toe < 1.5. The wave characteristics used in the formulations are defined as the conditions at the toe. If Tm−1,0,toe is not known, empirical formulas of Hofland et al. [1] can be used. The proposed formula includes emergent toes (dry conditions) as well.
The Van Gent [12] formula modified with the equivalent slope concept still underestimates the overtopping, albeit showing an improvement with respect to the original approach for the conditions tested by Altomare et al. [2]. Therefore, an improved fitting of the overtopping data was performed and a new coefficient was introduced as included in EurOtop [3] (Equation (13)):
q g H m 0 , t o e 3 = 0.16 e x p [ R c H m 0 , t o e ( 0.33 + 0.22 ξ m 1 , 0 ) ]
This approach is applicable for sea dikes with smooth and impermeable surfaces, without berm and storm walls within the range of the selected datasets. It is recommended only for cases with sm−1,0 < 0.01 and when htoe is smaller than 1.5 times the incident spectral wave height measured at the toe (Hm0,toe). For cases with htoe > 1.5 · Hm0,toe, only the dike slope (i.e., original Van Gent [12] formula) should be considered. Lashley et al. [7] noted that the data used were mainly based on foreshores with slopes 1/250 to 1/35; therefore, the applicability in steeper foreshore slopes is not well established. They show an increase in the accuracy of Altomare et al. [2] when their dataset is limited to slopes milder than 1:35. Nguyen et al. [8] also demonstrated that the equivalent slope approach is inaccurate for very gently sloping foreshores (i.e., 1/500 to 1/1000). The equivalent slope almost reduces to the foreshore slope under very gently sloping conditions, and the breaker parameter becomes much lower than 7. Altomare et al. [5] proposed a reduction factor in both Equations (7) and (14) to take into account the influence of directional spreading on the wave overtopping, and found that q is reduced by almost one order of magnitude for short-crested waves compared to long-crested waves.

3.4. Lashley et al. (2021)

Lashley et al. [7] proposed another set of mean overtopping-discharge formulas revising the approach by Goda et al. [13] for very and extremely shallow foreshore depths. The wave characteristics at the toe of the structure are needed for the previous presented formulas as the main input. However, the wave transformations from offshore to the dike toe cannot be calculated easily; additional empirical or numerical models need to be employed, which is a major drawback of these overtopping formulas. Therefore, they based their formulas entirely on deep-water wave characteristics, eliminating the need for data at the toe of the structure. Based on selected data points from the datasets by Altomare et al. [2], Tamada et al. [21] (as used by Goda [9]), and Van Gent [12], the following formula was derived:
q g H m 0 , o 3 = d i · e x p ( e i · R c H m 0 , o + f i · h t o e H m 0 , o )
where di, ei, and fi (for i = 1, 2) are defined for very shallow cases (i = 1), with 0.5 ≤ htoe/Hm0,o ≤ 1:
d 1 = 1.90 · s o m 1 , 0 1.15
e 1 = 7.40 · s o m 1 , 0 0.60 t a n ( m ) 0.25 · t a n ( α ) 0.60
f 1 = 0.70 · t a n ( m ) 0.80 s o m 1 , 0 0.80
and for extremely shallow cases (i = 2), with htoe/Hm0,o ≤ 0.1:
d 2 = 1.35 · t a n ( m ) 0.35 · s o m 1 , 0 0.85
e 2 = 3.75 · s o m 1 , 0 0.70 t a n ( m ) 0.70 · t a n ( α ) 0.60
f 2 = 0.20 · s o m 1 , 0 0.35 t a n ( m ) 1.30
An exponential interpolation is required for the transition regime of 0.1 < htoe/Hm0,o < 0.5.
The formulas directly include the influence of the wave steepness, the foreshore slope, and dike slope, whereas other approaches either combine them in a single parameter such as the equivalent slope or do not include them at all. Lashley et al. [7] argues that this approach shows a higher accuracy and broader range of applicability compared to the EurOtop [3] approach. Additionally, Lashley et al. [22] stated that a large amount of IG wave energy is to be expected under very shallow conditions, and IG wave dominance is to be expected for extremely shallow conditions. Lashley et al. [7] state the need for validation with other datasets, especially to evaluate the empirical model’s accuracy outside the range of conditions for which it was derived (e.g., emergent toe conditions: htoe/Hm0,o ≤ 0). Disadvantages of this method are that a uniform foreshore slope is assumed, and that the influence of directional spreading is not taken into account.

4. Methods and Datasets

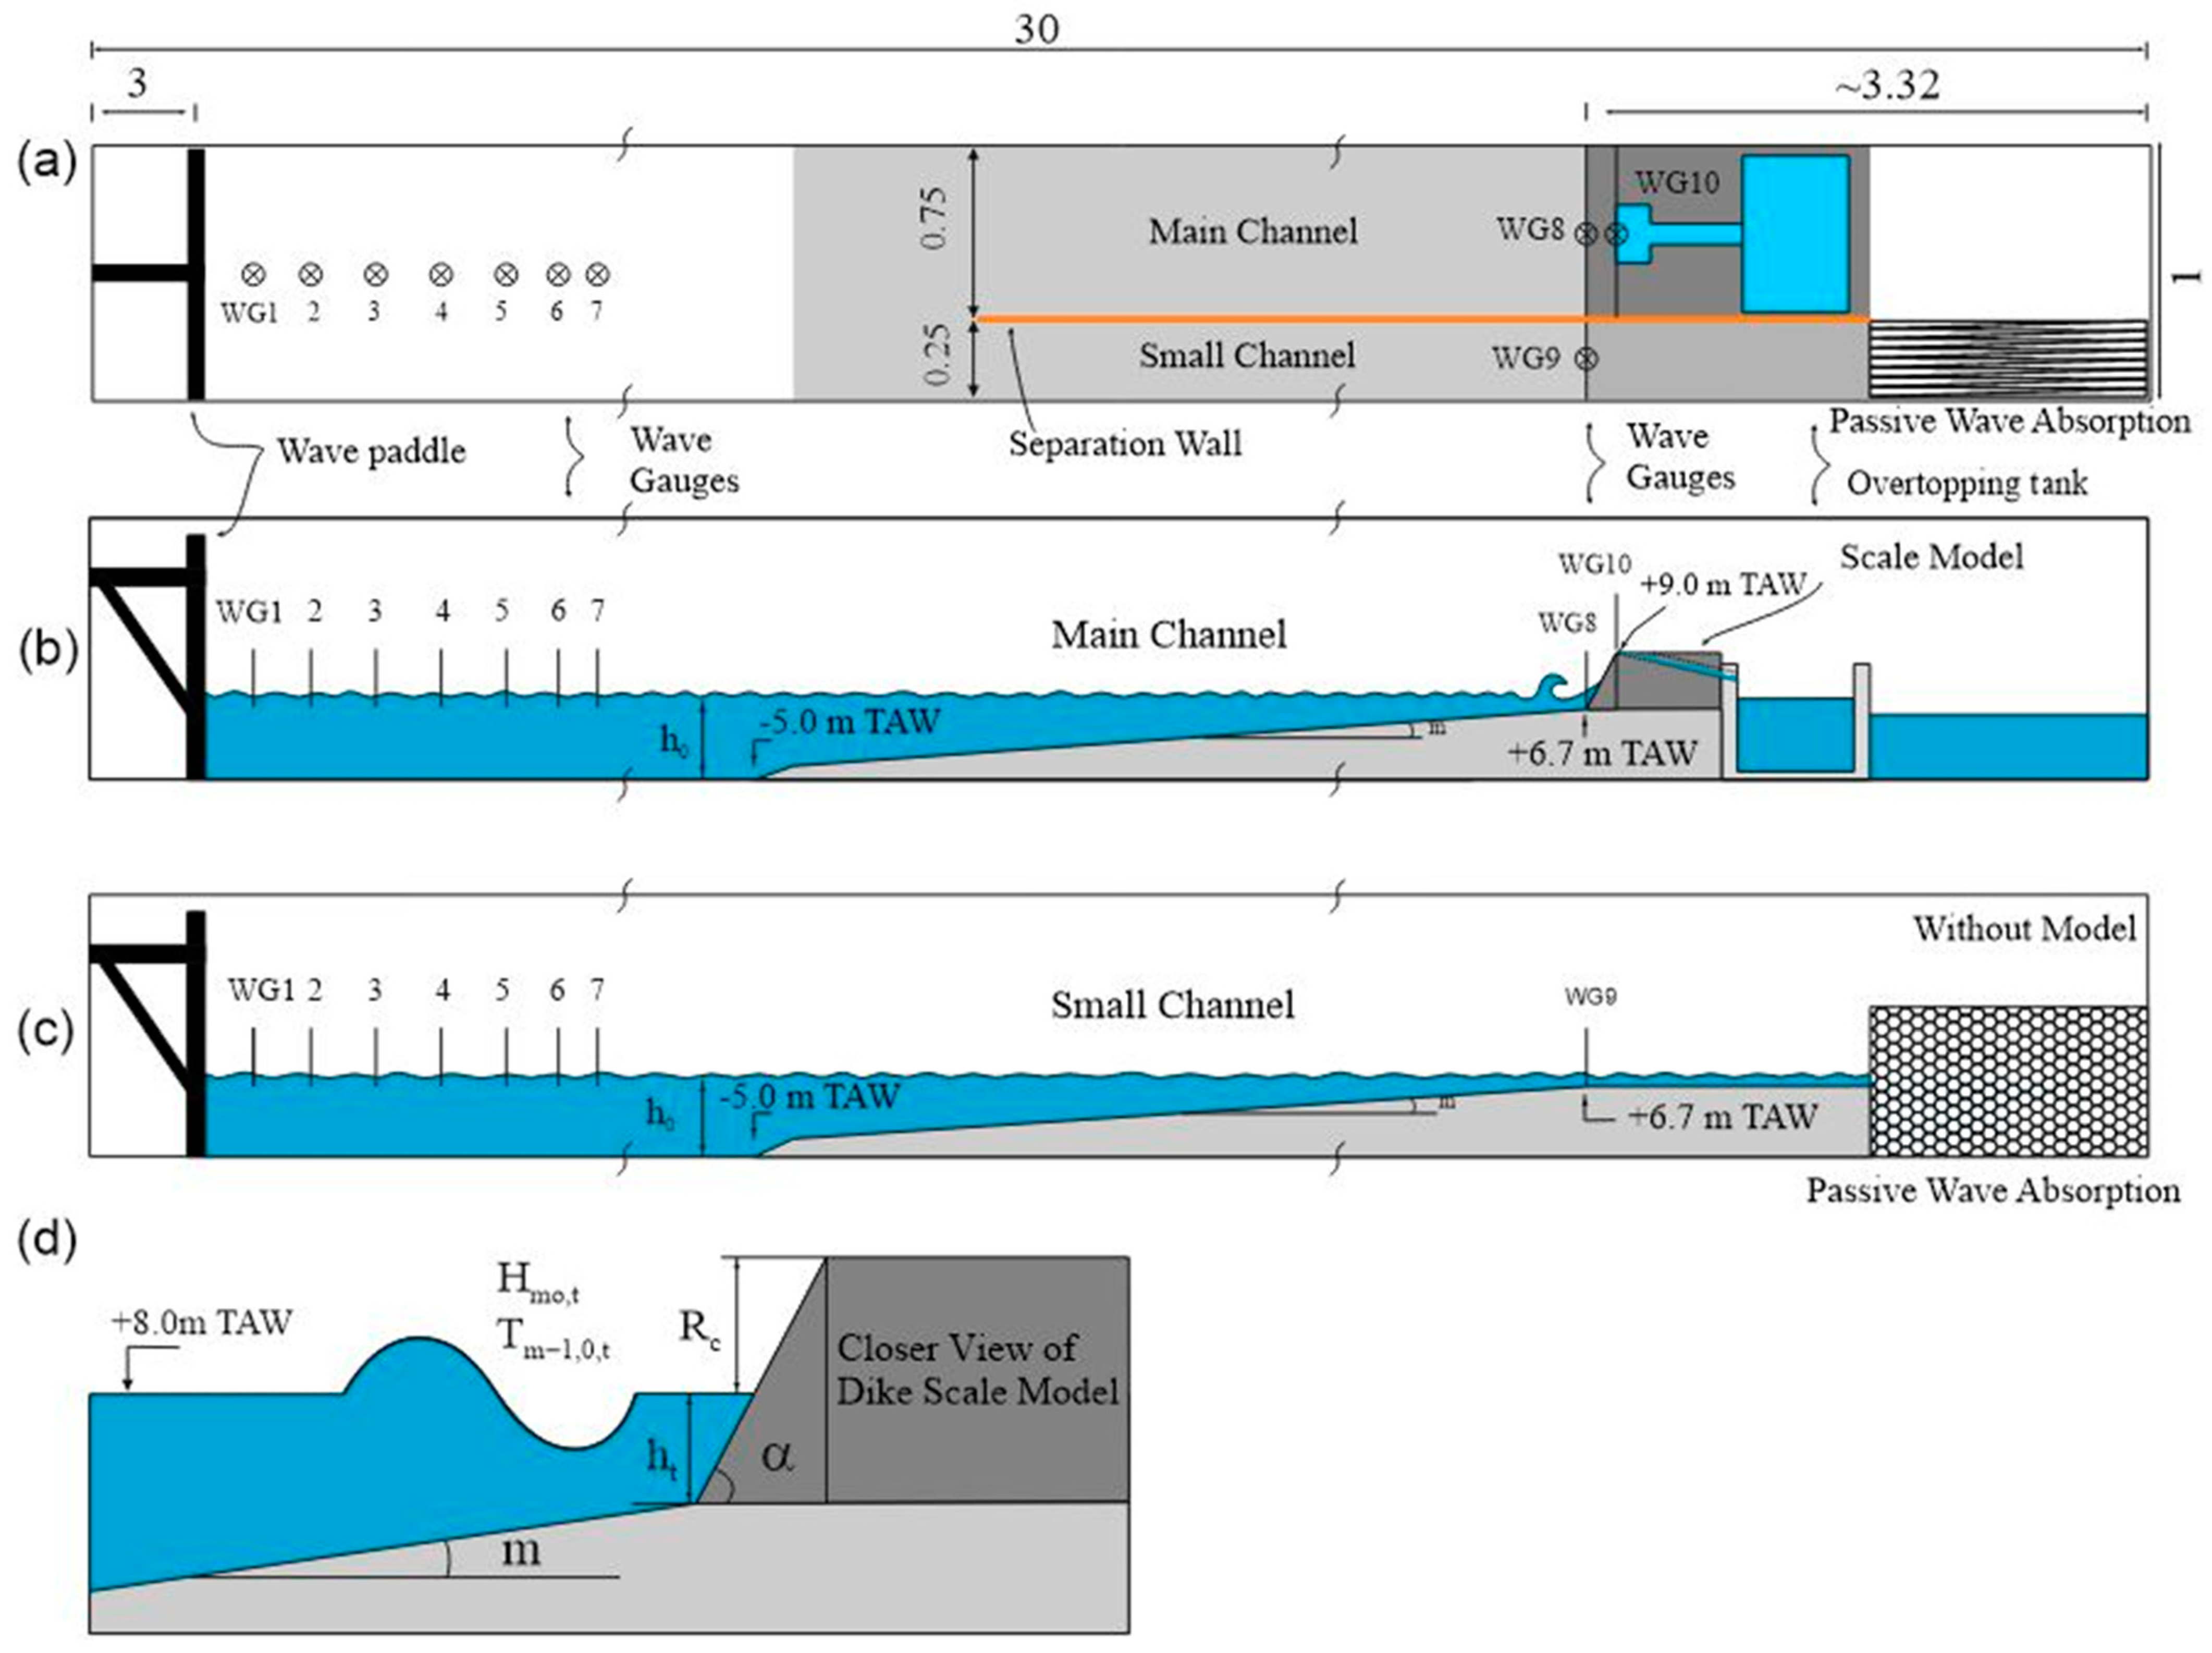
4.1. Physical Model Tests

Physical model tests have been carried out in the wave flume (30.0 m × 1.0 m × 1.2 m) of Ghent University in Belgium (Figure 1) within the framework of the CREST project (www.crestproject.be/en), accessed on 1 February 2023. Waves were generated by a piston-type wave maker with Active Wave Absorption (AWA) controlled by both in-house developed software for first-order wave generation and the AwaSys7 software [23] for second-order wave generation.
The wave flume was partially divided into two channels by a separation wall to be able to measure the undisturbed incident-wave conditions (IWC) at the toe of the dike (small channel), while simultaneously, overtopping tests were ongoing (main channel). The main channel was 0.75 m wide and the small channel was 0.25 m wide. The separation wall was made of metal plates and extended along the wave flume to a point approximately 8.0 m away from the dike toe. Kamphuis [24] investigated the effects of the length of a separation wall (i.e., 27 m, 18 m, and 9 m over a foreshore slope of 1/50) on the long-wave energy at the toe of the dike and found none. In the main channel, the dike slope was always present. Consequently, it is where the wave overtopping (see Figure 1b) measurements (see Figure 1d) were conducted. In the small channel, no dike was constructed, but instead a horizontal leveling-off at the dike-toe level was installed (see Figure 1c). The flat part ended in a dissipative material, limiting the wave reflection as much as possible.
The scale model was located in the main channel about 25 m away from the paddle on a smooth foreshore. It was a simplified cross-shore profile of a dike fronted by a very-to-extremely shallow-foreshore. The dike had a 1/2 front slope (α), and the dike crest and toe were located at +9.0 and +6.7 m TAW (Tweede Algemene Waterpassing, i.e., the reference level in Belgium) in the prototype, respectively. For the overtopping tests, the dike up to the crest was considered. A Froude model scale of 1:25 was used for the tests with foreshore slopes tan(m) of 1/20, 1/35, and 1/50. To be able to accommodate the foreshore slopes of 1/50 and 1/80 in the wave flume accurately, a Froude model scale of 1:35 was used instead. The end of the foreshore slope was connected to the flume bottom by a 1/10 transition slope. This transition ended approximately 0.05 m above the bottom to allow a connection with the return flow channel along the bottom of the flume. The foreshore slope of 1/50 was modeled in both scales to be able to take into account the differences due to scale effects. However, due to small differences in the realized-dike-crest level at both scales, no scale-effect analysis could be performed.
The selection of foreshore slopes was based on the range of actual foreshore slopes occurring along the coast of Belgium (i.e., 1/20–1/90). A beach slope of ~1/35–1/40 is often stated as being a limit between steeply and mildly (or low) sloping beaches [1,25] for the energetic wave conditions during storms along the coasts of northwestern Europe. The difference between both types of slopes is that the wave nonlinearity has a different character. Even if the foreshore is considered to be very shallow, this mostly pertains to the water depth at the toe of the dike and not to the nonlinear behavior over the foreshore slope. The range of tests here covers both steep foreshores and mildly sloped foreshores to cover the complete range of nonlinear behavior in combination with the very shallow foreshore in front of the dike.
The model was instrumented with ten wave gauges (WGs). Seven wave gauges were located between the wave maker and the foreshore slope toe for (non-) linear reflection analysis purposes. Of those, three gauges were spaced according to the recommendations made by Mansard and Funke [26] to allow a linear reflection analysis. The inter-WG distances of the remaining WGs were provided by Lykke Andersen (by e-mail comm.) to allow a nonlinear reflection analysis [27] using the WaveLab software [23]. Then, two WGs were placed at the toe of the dike: one in the main channel (with dike) and one in the small channel (without dike). Finally, an in-house-made resistive wave gauge was located at the crest of the dike, which was used to help record individual overtopping events. The data acquisition system DHI Wave Amplifier 102E was used to record surface elevations at 40 Hz.
Then, a basin with a scale and pump was placed inside the wave flume behind the dike crest according to the weigh cell technique described by Victor and Troch [28], which was necessary to allow measurements of individual wave-overtopping volumes. Finally, photo and video cameras were used to record tests during simulations.
The main test program consisted of the generation of random waves with correct reproduction of second-order-bound sub- and superharmonics (RS). It was already established that IG waves play an essential role at the toe of a dike with a very shallow foreshore. Therefore, to be able to realistically represent the IG waves at the toe of the dike, second-order wave generation was used for this study, so that spurious free sub (and super) harmonics were suppressed.
Second-order waves were generated using a JONSWAP spectrum defined with a shape parameter of γ = 3.3 and a fixed seed number to obtain the same wave phase combinations for all conditions over all tested foreshore slopes. The duration of each test was ~1000 waves long.
The generated offshore significant wave height Hm0,o and peak wave period Tp,o were varied to represent low-, intermediate-, and high-energy sea states. Two water levels were tested: +7.00 m TAW and +8.00 m TAW (both are prototype values), represented by water depths at the wave paddle ho of 0.65 m and 0.69 m (model scale 1:25), respectively.
Table 1 provides an overview of all the test conditions (values at model scale). The most energetic conditions tested (RS01), in combination with the lowest tested water level, represent the nearshore wave conditions expected during a super storm of a return period of 1000 years. These are the official design and safety check conditions for sea defense structures along the Belgian coast. In test condition RS05, the significant wave height was lowered compared to RS01 to a value that is estimated to closely represent the real (i.e., in a 3D environment with directional spreading) IG wave energy content at the toe of the dike. The other test conditions were chosen in such a way that a range of relative water depths (htoe/Hm0,o) at the toe of the dike were obtained relevant for comparison to the prediction formula of Hofland et al. [1] (i.e., 0.06–1.30, from extremely shallow to shallow foreshore depths). Similarly, the test conditions provide a broad range of mean overtopping discharges for comparison with the prediction formula of Altomare et al. [2]. The data collected within this experimental campaign will be denoted as the UGent dataset for the remainder of the paper.
A summary of the wave and dike geometry characteristics of the UGent dataset is presented in Table 2. The test data in Table 2 are grouped into five sets based on the foreshore slope and the model scale. These five groups are used in the analysis of the results and denoted as UGXX, which indicates that the data of UGXX belong to all the experiments with a foreshore slope of 1/XX. It should be noted that UG50* and UG80 have a Froude scale of 1:35 instead of 1:25.

4.2. CLASH Dataset

The CLASH database is one of the most used resources for wave-overtopping studies, as it combines data from 163 experimental campaigns worldwide [18]. Goda [9], Altomare et al. [2], and Lashley et al. [7] used data from CLASH to validate their formulations for shallow foreshore conditions. Altomare et al. (2016) investigated the database extensively to select data representative of shallow and very shallow foreshore cases based on sm−1,0 < 0.01. In this study, the same sub-dataset from CLASH by Altomare et al. (2016) was included in the analysis to compare the characteristics of the UGent dataset to the available data commonly used in the formulations. A summary of the characteristics is presented in Table 3.

4.3. Performance Indicators

The existing empirical formulations commonly used the same performance indicators to assess their accuracy. Goda [9], Altomare et al. [2], and Lashley et al. [7] applied the geometric mean x ¯ G and the geometric standard deviation σ( x ¯ G ) to quantify the error and the level of scattering. The geometric mean (Geo) is determined by:
x ¯ G = e x p [ 1 N i = 1 N l n x i ]
where xi = qpred,i/qmeas,i, N is the number of data points, and qpred,i is the calculated mean overtopping discharge, while qmeas,i corresponds to the observed values. The geometric mean indicates possible bias if the value is different from 1, with over- and underestimation of q for values larger and smaller than 1, respectively.
The geometric standard deviation (GSD) serves as an indication of the level of scatter of the data around the prediction line, and is calculated as:
σ ( x ¯ G ) = e x p { [ 1 N i = 1 N [ ( l n x i ) 2 ( l n x ¯ G ) 2 ] ] 0.5 }
When the data are assumed to be normally distributed, 90% of the data fall within the boundaries x ¯ G   [ σ ( x ¯ G ) 1.65 ] and x ¯ G   [ σ ( x ¯ G ) 1.65 ] .

5. Results and Discussion

This section discusses the influence of the main parameters on the mean overtopping discharge based on the UGent dataset. The CLASH dataset is also provided to supply a broader range of geometric conditions in the discussions as the UGent dataset has a constant dike geometry of 1:2 slope and crest height. The relative freeboard, the shallowness of the foreshore depth, and the IG wave dominance have been investigated. A comparison of existing prediction methods with the new datasets is also presented.

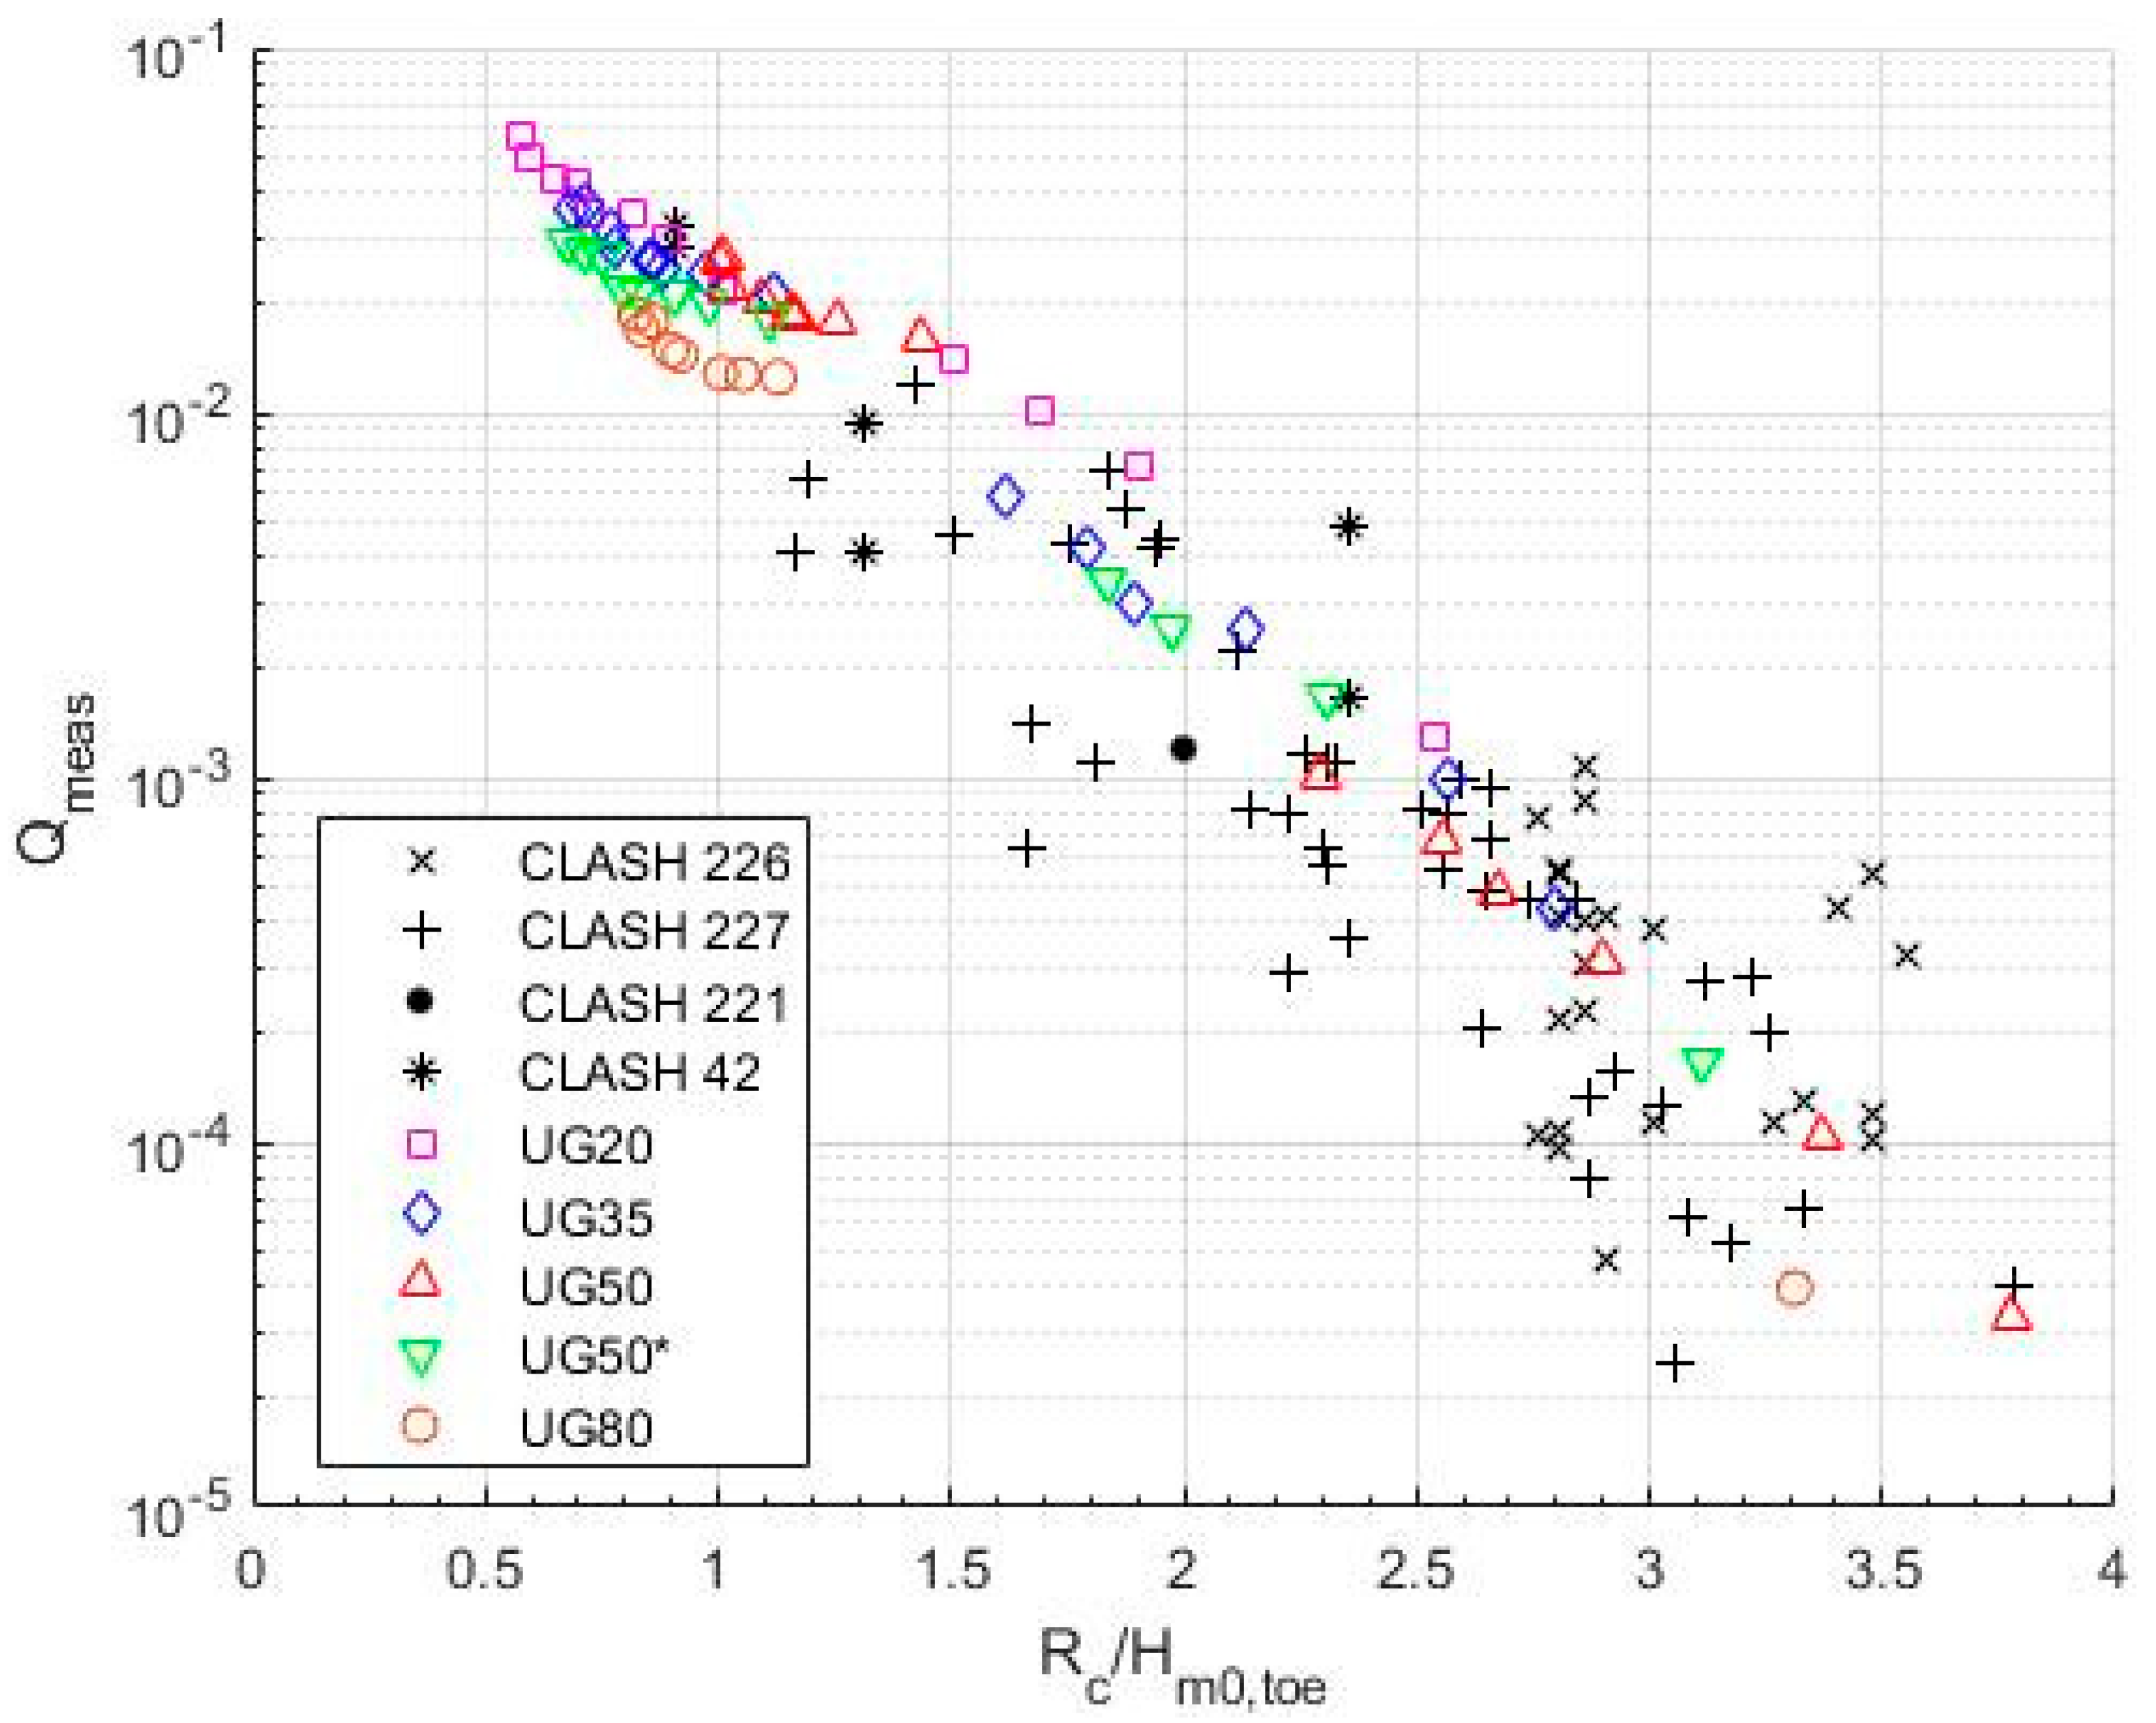
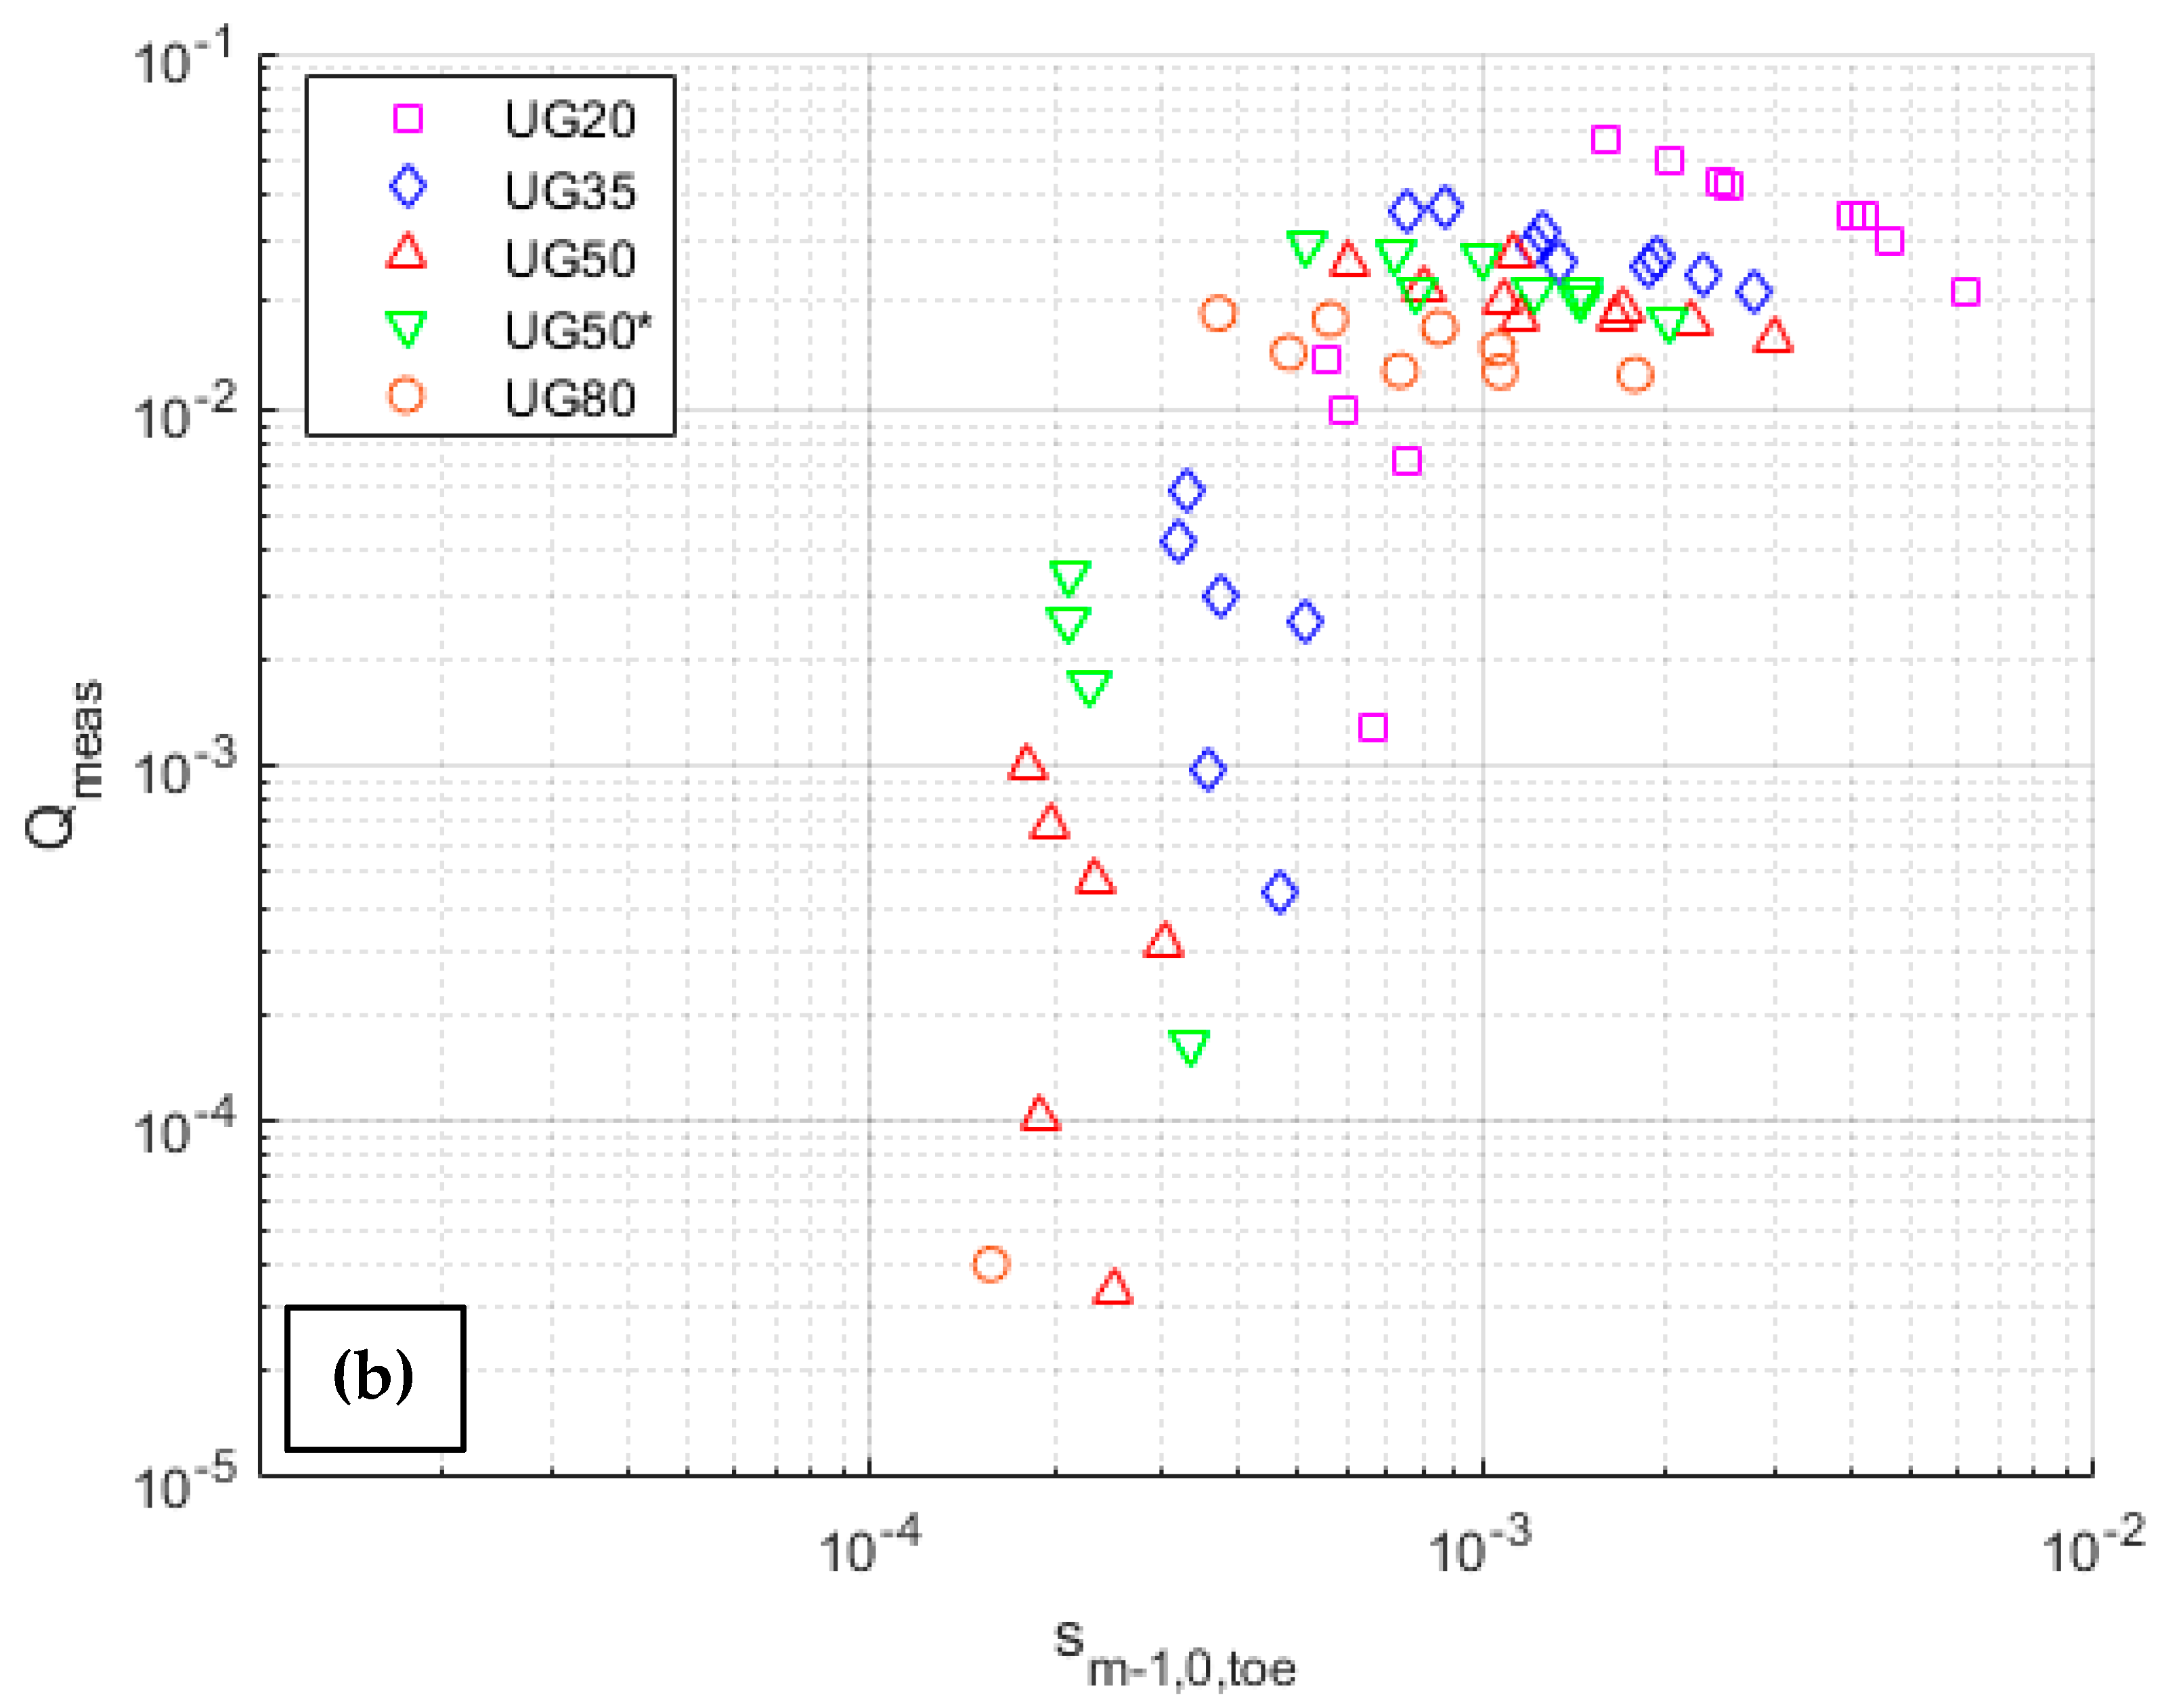
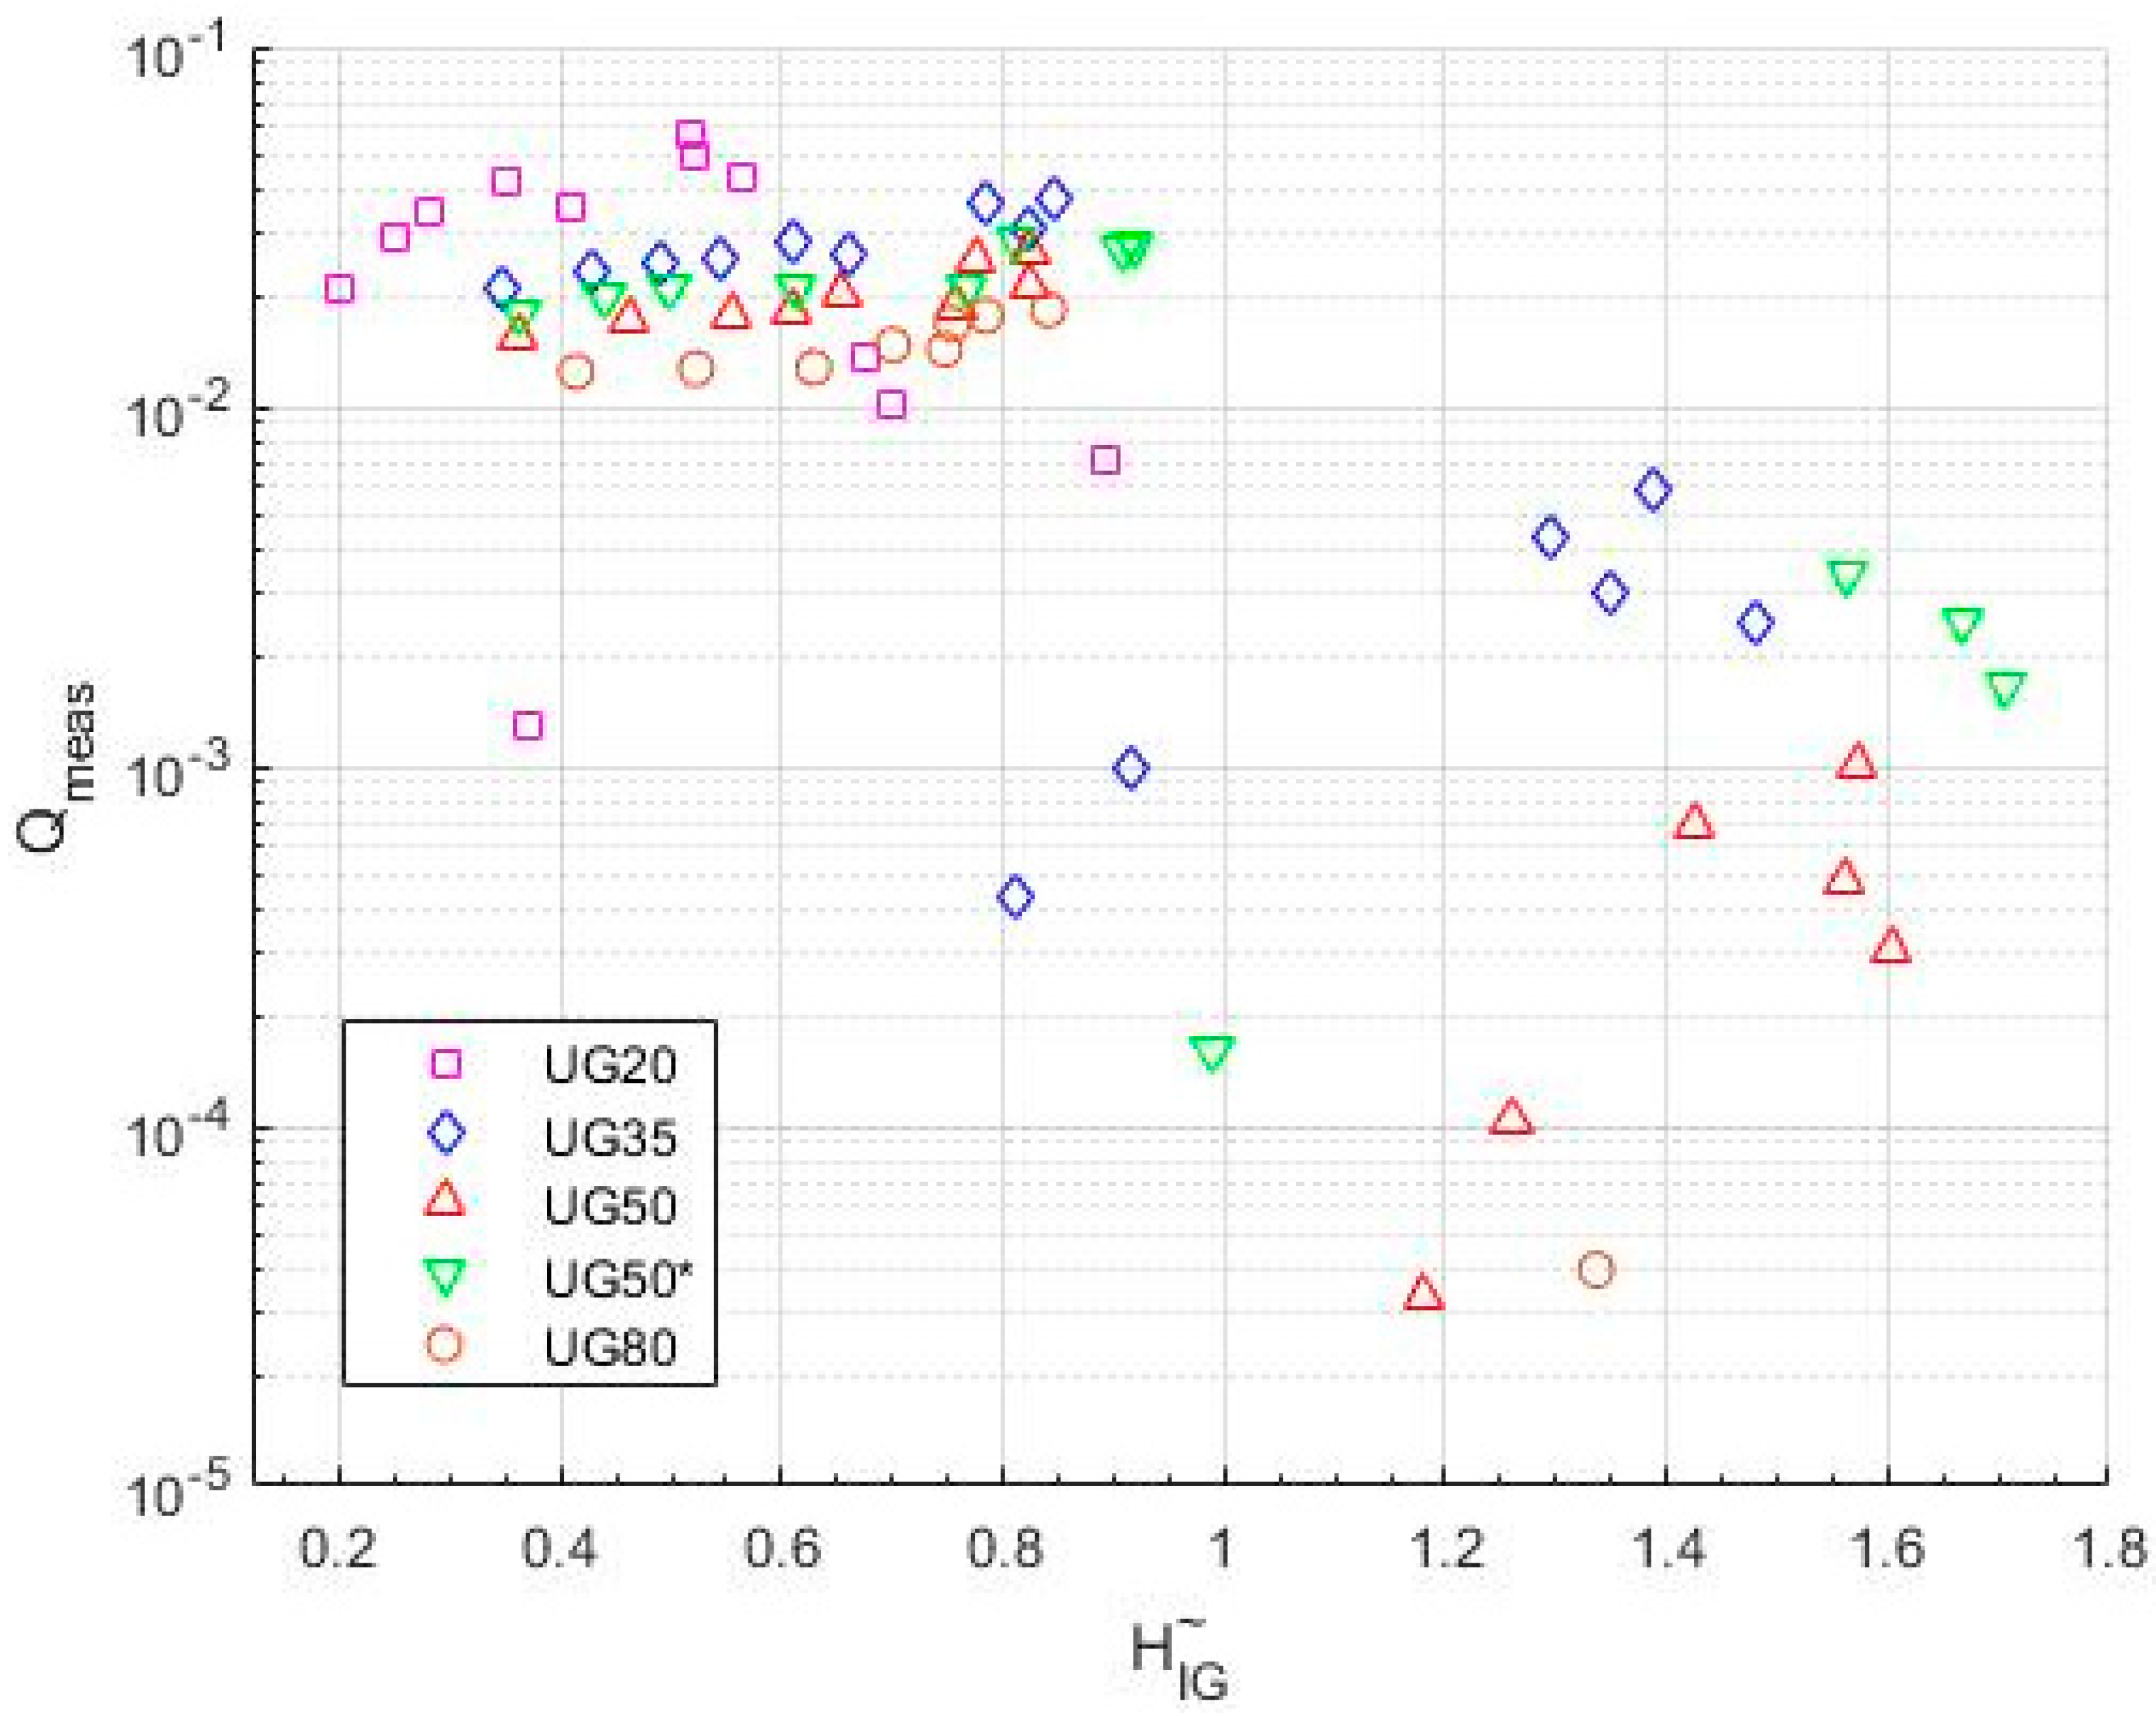
5.1. Analysis of Physical Model Tests

The relative freeboard, Rc/Hm0,toe, is the main parameter in wave overtopping, since a higher relative freeboard decreases the overtopping discharge. Figure 2 demonstrates the variation in dimensionless measured overtopping discharge, Qmeas (q/(gH3m0,toe)0.5), with the relative freeboard for both the UGent dataset and the selected CLASH dataset. The exponential relationship between Qmeas and relative freeboard (Rc/Hm0,toe) exists across all the data of UGent experiments, and mainly has very shallow and extremely shallow foreshore conditions. The trend of the UGent dataset indicates a possible influence of the foreshore slope on the overtopping results in addition to the relative freeboard. Qmeas for steeper slopes (1:20 and 1:35) exhibit larger values than milder slopes (1:50 and 1:80) for similar freeboard conditions.
The wave conditions at the toe, and thus the wave overtopping, are significantly affected by the shallowness of the foreshore. Figure 3 presents the variation in Qmeas with the relative water depth (htoe/Hm0,o), considering the shallowness definition of Hofland et al. (2017). Focusing on the UGent dataset, it is clear that the majority of the dataset belongs to extremely shallow foreshore conditions (htoe/Hm0,o < 0.3). It is also observed that the dataset consists of two groups with distinctly different behavior based on the overtopping discharge and the trends across the relative water depth. The limit for the two groups seems to be htoe/Hm0,o = 0.2, which is close to the limit of Hofland et al. [1] for extremely shallow foreshore conditions (htoe/Hm0,o = 0.3). The results of the UGent dataset push the extremely shallow foreshore limit to shallower water depths. Note that Lashley et al. [7] defined the limit of extremely shallow foreshore as htoe/Hm0,o ≤ 0.1, but more datasets are still needed to define their limit accurately. Both studies by Altomare et al. [2] and Lashley et al. [7] show that the shallowness of the foreshore influences the wave overtopping, with lower overtopping observed in extremely shallow foreshore conditions. The trend in the UGent dataset is consistent with the literature, showing that extremely shallow foreshore conditions limit wave overtopping.
The trend of Qmeas for the UGent dataset shows that in the very shallow region there is a mildly decreasing trend in overtopping as htoe/Hm0,o increases, while the same trend is more significant for the extremely shallow region, with a clear discontinuity between the regions (i.e., a strong increase over the extremely shallow region to the very shallow region). This observation is similar to result of Altomare et al. [5], suggesting that further investigation is needed to understand the influence of water depth at the toe, especially for extremely shallow foreshore conditions. In addition, both regions show an influence of the foreshore slope as overtopping increases for steeper foreshore slopes. Similarly, the influence is more significant for extremely shallow conditions compared to very shallow conditions. This observation is consistent with the discussions of Lashley et al. [7].
As the data from CLASH include a range of dike geometry compared to the constant geometry of UGent experiments, the scatter is higher and a clear trend was not observed for the very shallow region where the data exist. However, UGent tests with a dike slope of 1/2 having the larger overtopping values is consistent with the findings of Lashley et al. [7], which show that maximum overtopping is reached for dike slopes of 1/2, considering the full range of structure slopes in their study (2 < cot α < 7). Additionally, the majority of the CLASH data having a foreshore slope of 1/100 and lower overtopping rates than UGent tests is consistent with the discussion on steeper slopes increasing wave overtopping.
The wave steepness at the dike toe (sm−1,0,toe, Equation (2)) has been used as an indicator for the shallowness of the foreshore (Section 2.2). This parameter, or the deep-water version (som−1,0 = Hm0,o/(gT2m−1,0,o/(2π))), is also included in many empirical formulations, such as in the breaker parameter [2] or directly [7]. Figure 4a presents the variation in Qmeas with respect to som−1,0 and Figure 4b with respect to sm−1,0,toe for the UGent dataset. Data for Qmeas < 10−2 in Figure 4 all represent extremely shallow foreshore cases (see Figure 3). Lashley et al. [7] discuss that Qmeas increases as the deep-water wave steepness decreases, since larger overtopping volumes are observed for longer waves. Figure 4a shows a similar observation for som−1,0 > 0.02; however, the trend is inverted for lower steepness values in the very shallow foreshore region of the graph. The UGent dataset is too limited for extremely shallow foreshore conditions in the range of som−1,0 < 0.02 to be able to come to similar conclusions. However, the foreshore slope clearly affects the overtopping much more in the extremely shallow than in the very shallow foreshore region for the same deep-water wave steepness value (e.g., som−1,0 = 0.01). Figure 4b shows an increasing Qmeas for increasing wave steepness at the dike toe. The overtopping increase is significant for the extremely shallow cases (Qmeas < 10−2), and is much less pronounced for the very shallow foreshore conditions. Changes in sm−1,0,toe are mostly caused by changes in the foreshore slope, especially for extremely shallow foreshores.
The very low sm−1,0,toe values in Figure 4b are due to the very high Tm−1,0,toe values for extremely shallow foreshore conditions [1], as a result of the increased significance of IG wave energy (compared to SS wave energy) at the dike toe. Lashley et al. [22] also showed that a large amount of IG wave energy is expected at the dike toe under very shallow foreshore conditions, while extremely shallow foreshore conditions are expected to be dominated by IG waves. A parameter, H ˜ I G ,   was proposed to define the relative magnitude of nearshore IG waves as the ratio of IG wave height to SS wave height at the toe of the structure:
H ˜ I G = H m 0 , I G , t o e H m 0 , S S , t o e
where Hm0,IG,toe and Hm0,SS,toe are the spectral significant wave heights calculated based on, respectively, the IG (i.e., 0.005 Hz < f < fp/2, with fp the offshore peak wave frequency) and SS (f > fp/2) parts of the wave spectrum at the dike toe. IG wave dominance is defined as H ˜ I G > 1.
Figure 5 presents the variation in Qmeas of UGent dataset with H ˜ I G . Again, all the data points with Qmeas < 10−2 belong to extremely shallow foreshore conditions. It is observed that the majority of the data with extremely shallow foreshore (htoe/Hm0,o < 0.3) are governed by IG waves ( H ˜ I G > 1) and exhibit lower overtopping values. IG wave dominance is observed for higher, directionally narrow banded offshore waves, shallower water depths, and milder foreshore slopes [22]. The UGent dataset in the IG-wave-dominant region of the graph also corresponds to conditions with htoe/Hm0,o < 0.1 and milder slopes of the experiments, which is consistent with these previous observations. For any given foreshore slope, an increasing trend of Qmeas can be observed for increasing H ˜ I G , for both the very shallow and extremely shallow foreshore regions of the graph. For extremely shallow foreshore conditions, the increasing trend is found to be stronger. Although H ˜ I G has not been integrated explicitly into any empirical model, the recent discussions and our results suggest that IG wave dominance could be an essential parameter, especially for the extremely shallow foreshore conditions.

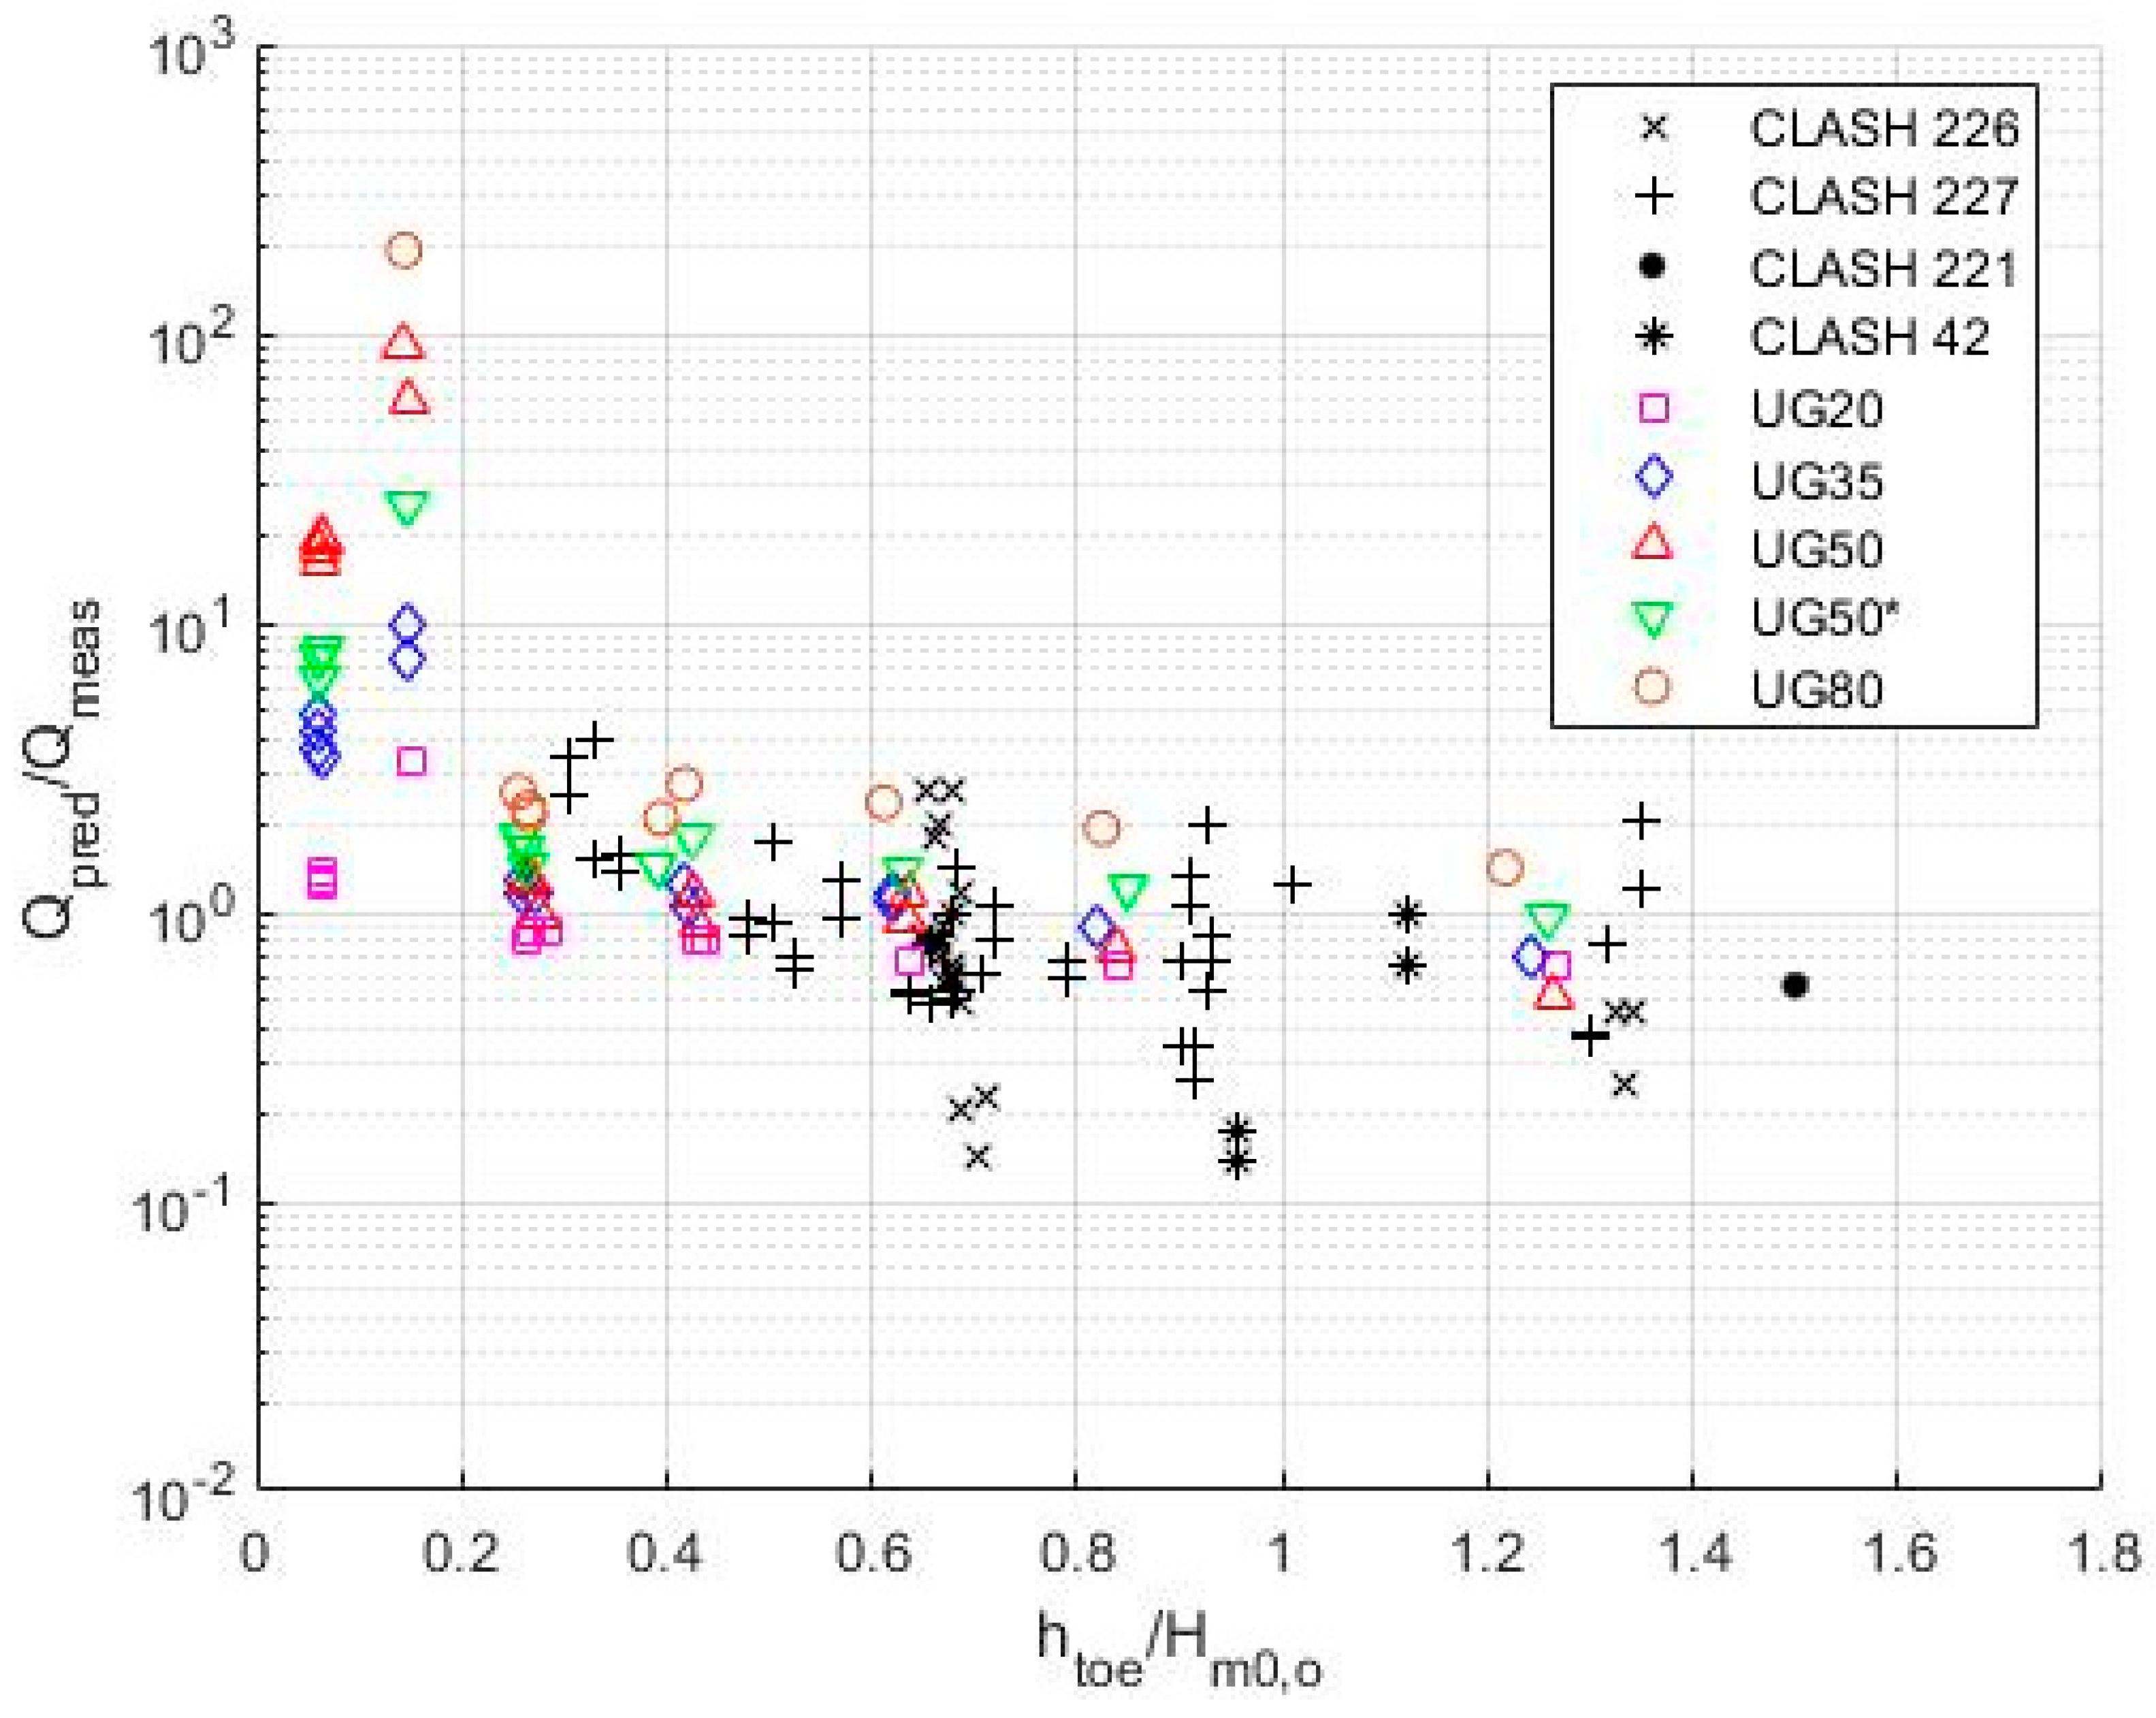
5.2. Performance of Existing Empirical Methods

The results of mean overtopping discharge of the UGent dataset and the selected CLASH data were compared with the empirical methods commonly referred to in the literature. The performance of these methods is discussed to highlight the future studies needed for wave overtopping at sea dikes with very-to-extremely shallow foreshores. The performance indicators Geo and GSD (Section 4.3) of the methods for each dataset and the combined dataset are presented in Table 4. Although the results of the performance indicators are discussed in detail with respect to the empirical models in the following sections, Table 4 already indicates that the Geo of the combined dataset is not a good indicator of the performance of the models when the GSD is very high. The empirical model performance can differ depending on the shallowness of the foreshore of the data included in a particular dataset. Since the datasets include both very shallow and extremely shallow cases but in different amounts, the different behaviors of the empirical models can improve the Geo for each database, which can be misleading when comparing the performance between datasets. Further investigation is recommended, but this is not part of the present study.

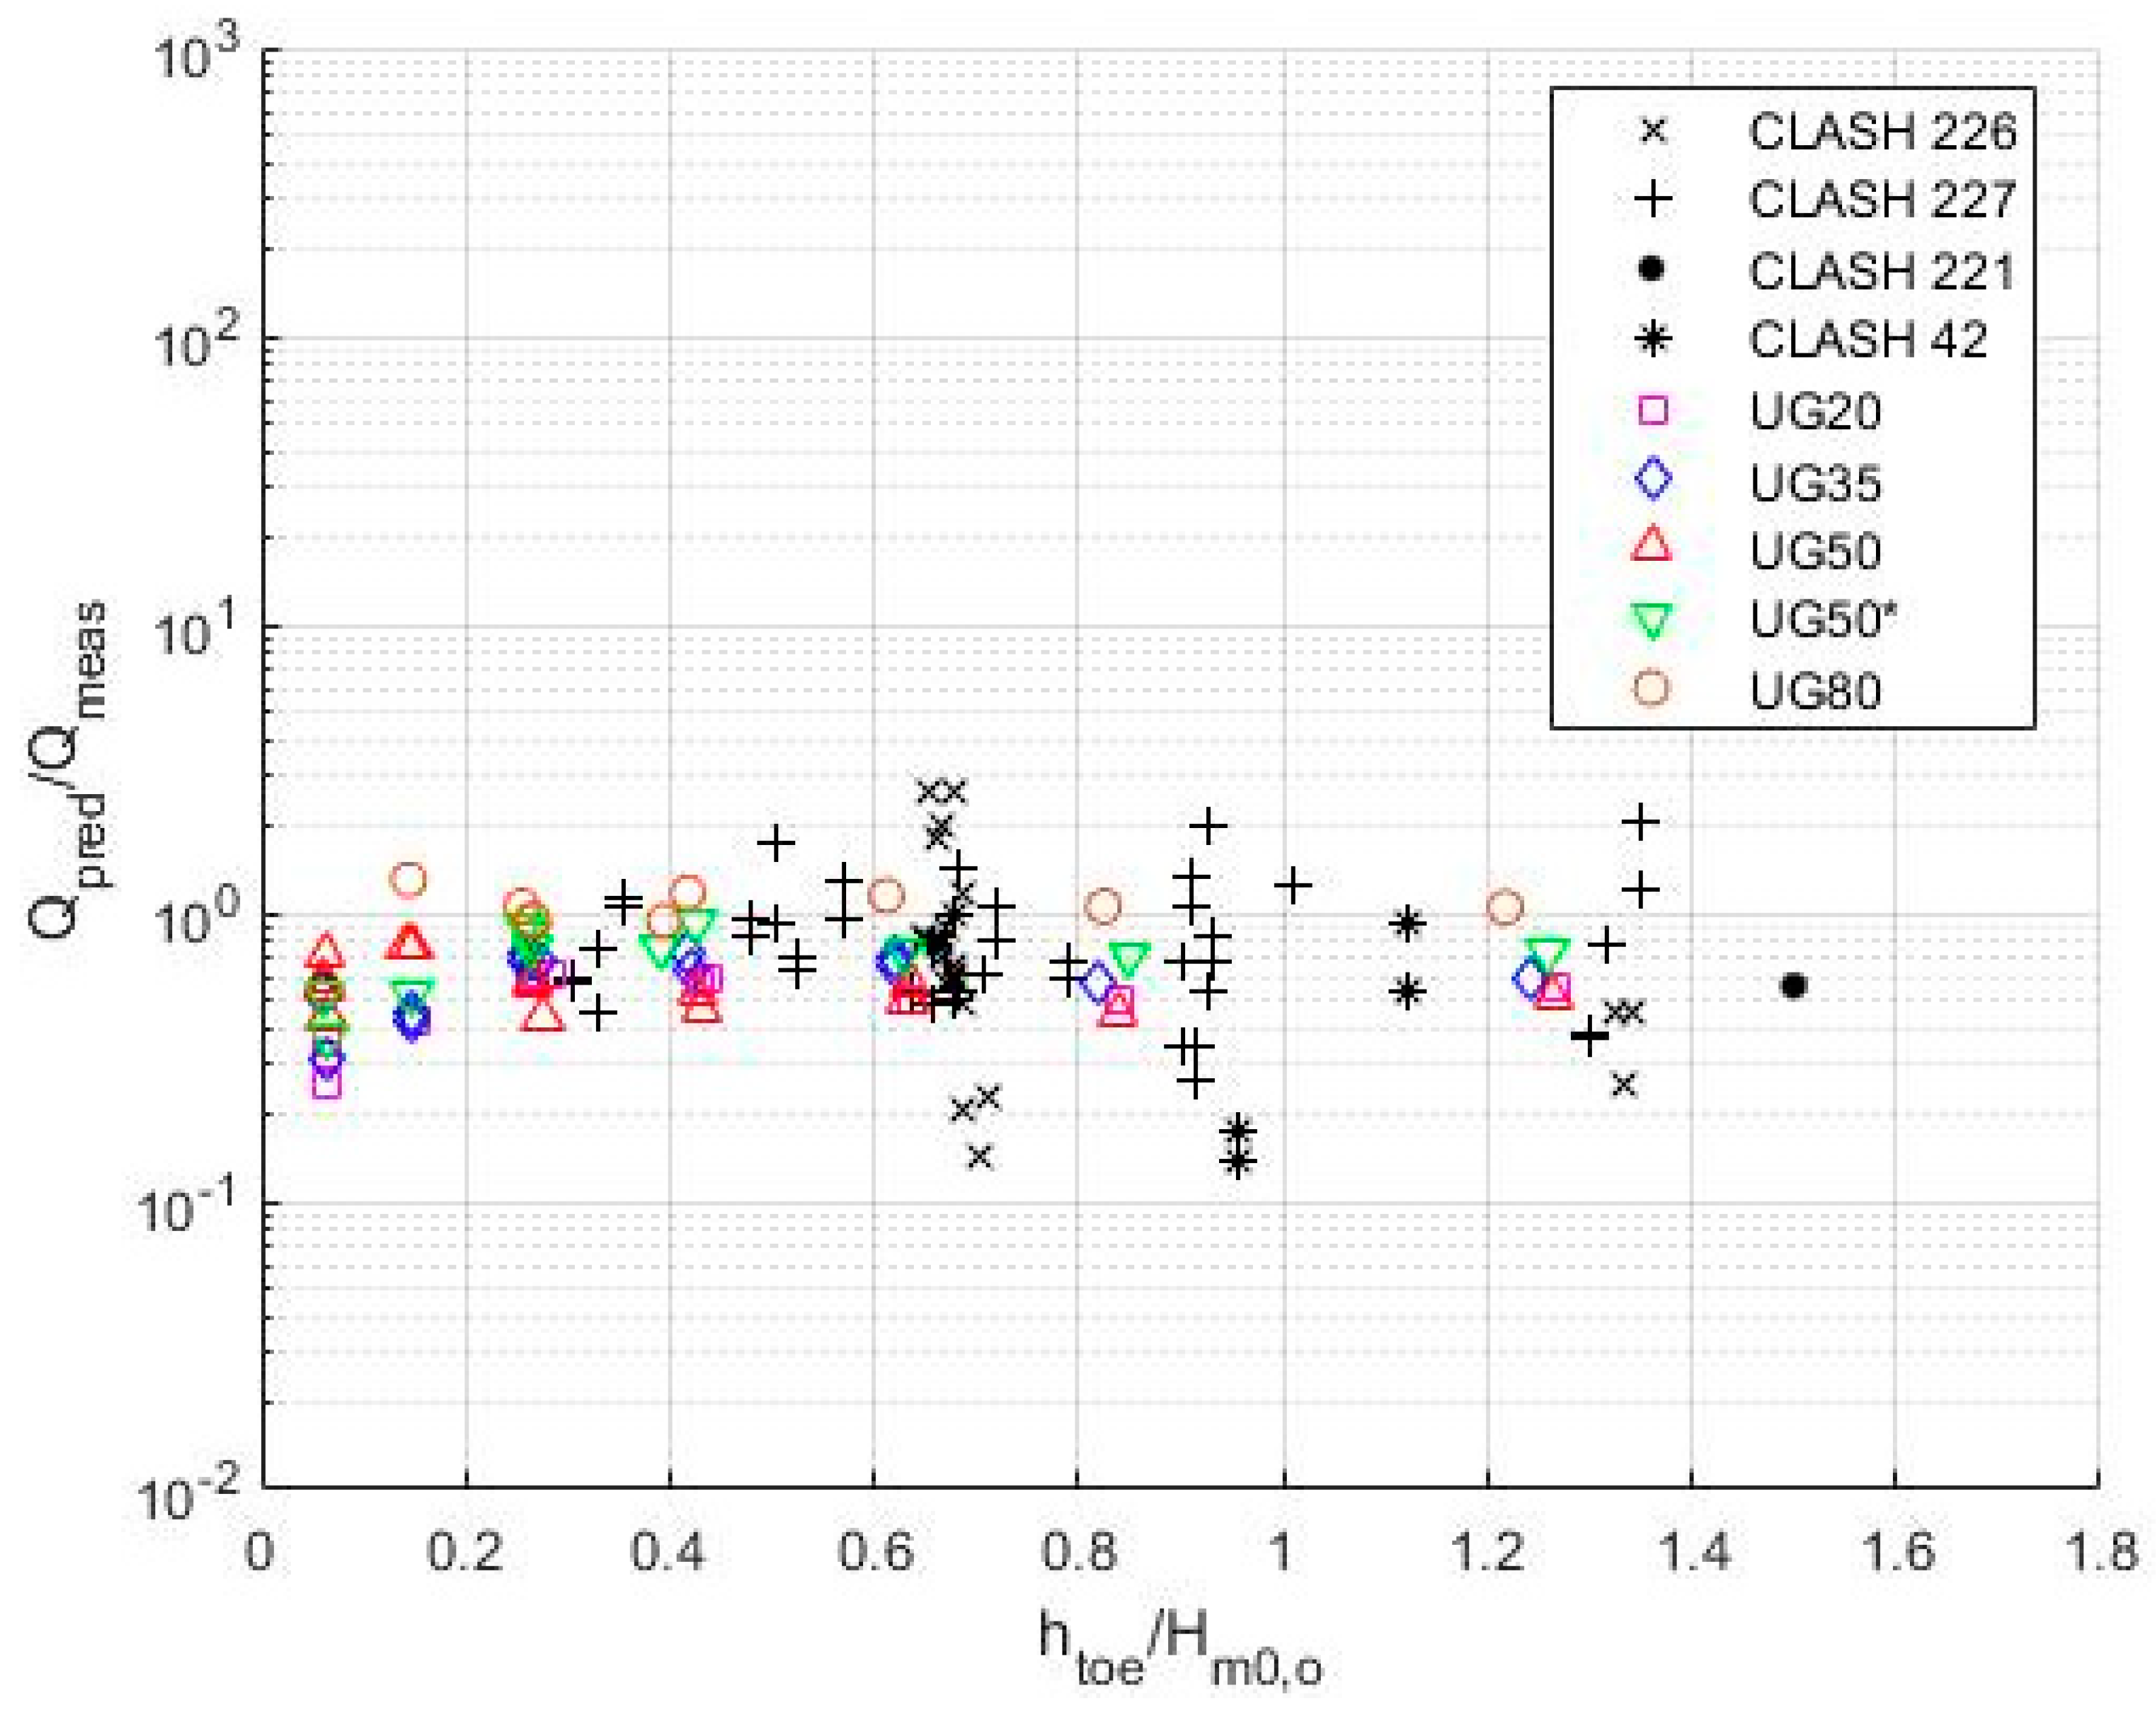
5.2.1. Van Gent (1999)

Figure 6 presents the dimensionless measured overtopping, Qmeas, versus the dimensionless freeboard, R c / H m 0 , t o e ( 0.33 + 0.22 ξ m 1 , 0 ) . The solid line represents the probabilistic approach of Van Gent [12], and the dashed line is the deterministic formula. The dotted lines indicate the confidence interval limits. The results show a tendency to overestimate overtopping for UGent data for higher dimensionless freeboard values and milder foreshore slopes. The performance of Van Gent [12] is significantly better for tests with steeper foreshore slopes for which higher overtopping volumes are measured. The CLASH database is mostly scattered around the probabilistic formula and is therefore better predicted by Van Gent [12].
Figure 7 indicates that Van Gent’s formula overestimates the overtopping for extremely shallow foreshore cases (htoe/Hm0,o < 0.3). The overestimation increases for milder foreshore slopes, and this is also true for very shallow foreshore conditions. The tendency to overestimate becomes significant as the relative water depth becomes shallower and the IG wave dominance is present. These results are consistent with the conclusion of Altomare et al. [2] that the influence of very shallow foreshores on wave overtopping is not well accounted for by Van Gent [12]. However, it should be noted that the UGent dataset for the very shallow foreshore fits much better than the data they have presented in their studies.
The geometric mean and the geometric standard deviation of the entire dataset of our study are 1.26 and 3.17. In the study by Altomare et al. [2], the same indicators were 2.61 and 3.44 for the datasets used in their analysis (including the CLASH datasets used in our study). As both studies selected the same CLASH data, the difference mainly depends on the other experiments considered by each study separately. The better fit of the UGent dataset has contributed to a lower Geo value, whereas the GSD is similar for both studies. While the overtopping for the CLASH dataset is underestimated (i.e., Geo < 1 in Table 4), the UGent dataset with 1:20 foreshore is estimated very well (Geo = 0.98). In contrast, the performance is significantly reduced (i.e., overestimation, Geo > 1 in Table 4) for milder slopes and tests that classify as extremely shallow foreshore conditions where IG wave dominance is also present (see H ˜ I G > 1 in Figure 5 and htoe/Hm0,o < 0.3 in Figure 7). Both the results of Figure 6 and Figure 7, as well as Altomare et al. [2], present the limitation of Van Gent [12] in extremely-to-very-shallow-foreshore conditions, as Van Gent [12] does not consider the influence of foreshore slope on overtopping waves explicitly as a prediction parameter.

5.2.2. Goda (2009)

Figure 8 presents the measured and predicted overtopping discharge in dimensionless form using the Goda [9] prediction formula (Equation (6)). The solid line on the graph corresponds to perfect estimation, whereas the dashed lines indicate predictions that are 10 times higher and lower than the measurements. The results show that the formula of Goda [9] exhibits two distinct performances for the UGent dataset. The ratio of Qpred to Qmeas versus htoe/Hm0,o is provided in Figure 9. When both figures are examined, it is clear that Goda [9] significantly overestimates the overtopping for extremely shallow foreshore conditions. The performance is better for very shallow foreshore conditions, albeit with a slight underestimation that is observed, contrary to the performance of Van Gent [12] for the same region (see Figure 7). The data of the CLASH database fall within the factor 10 and 0.1 boundaries, and a tendency for slight underestimation can be observed in Figure 8. These results are consistent with the conclusion of Altomare et al. [2] on the performance of the Goda [9] model for their data (however, no distinction is made yet for extremely shallow foreshore conditions).
The geometric mean and the geometric standard deviation of the entire dataset of our study are 1.11 and 2.89. In the study by Altomare et al. [2], the same indicators were 4.66 and 7.34 for the datasets used in their analysis (including the CLASH datasets used in our study). As both studies selected the same CLASH data, the difference mainly depends on the other experiments considered by each study separately. Disregarding the CLASH dataset, the performance of Goda [9] for the UGent dataset is slightly better than Van Gent [12], as well as more consistent for different slopes (see Table 4). Although the improvement could be due to the direct inclusion of the foreshore slope in the Goda [9] equation, the performance is significantly reduced for milder slopes that classify as extremely shallow foreshore conditions by an overestimation of one order of magnitude, similar to the result obtained with Van Gent [12]. Goda [9], using the CLASH dataset for his formulations, had only a very limited amount of data representing the extremely shallow foreshore conditions; therefore, the use of the formula for the UGent dataset of extremely shallow foreshore conditions is actually outside its natural range of application.

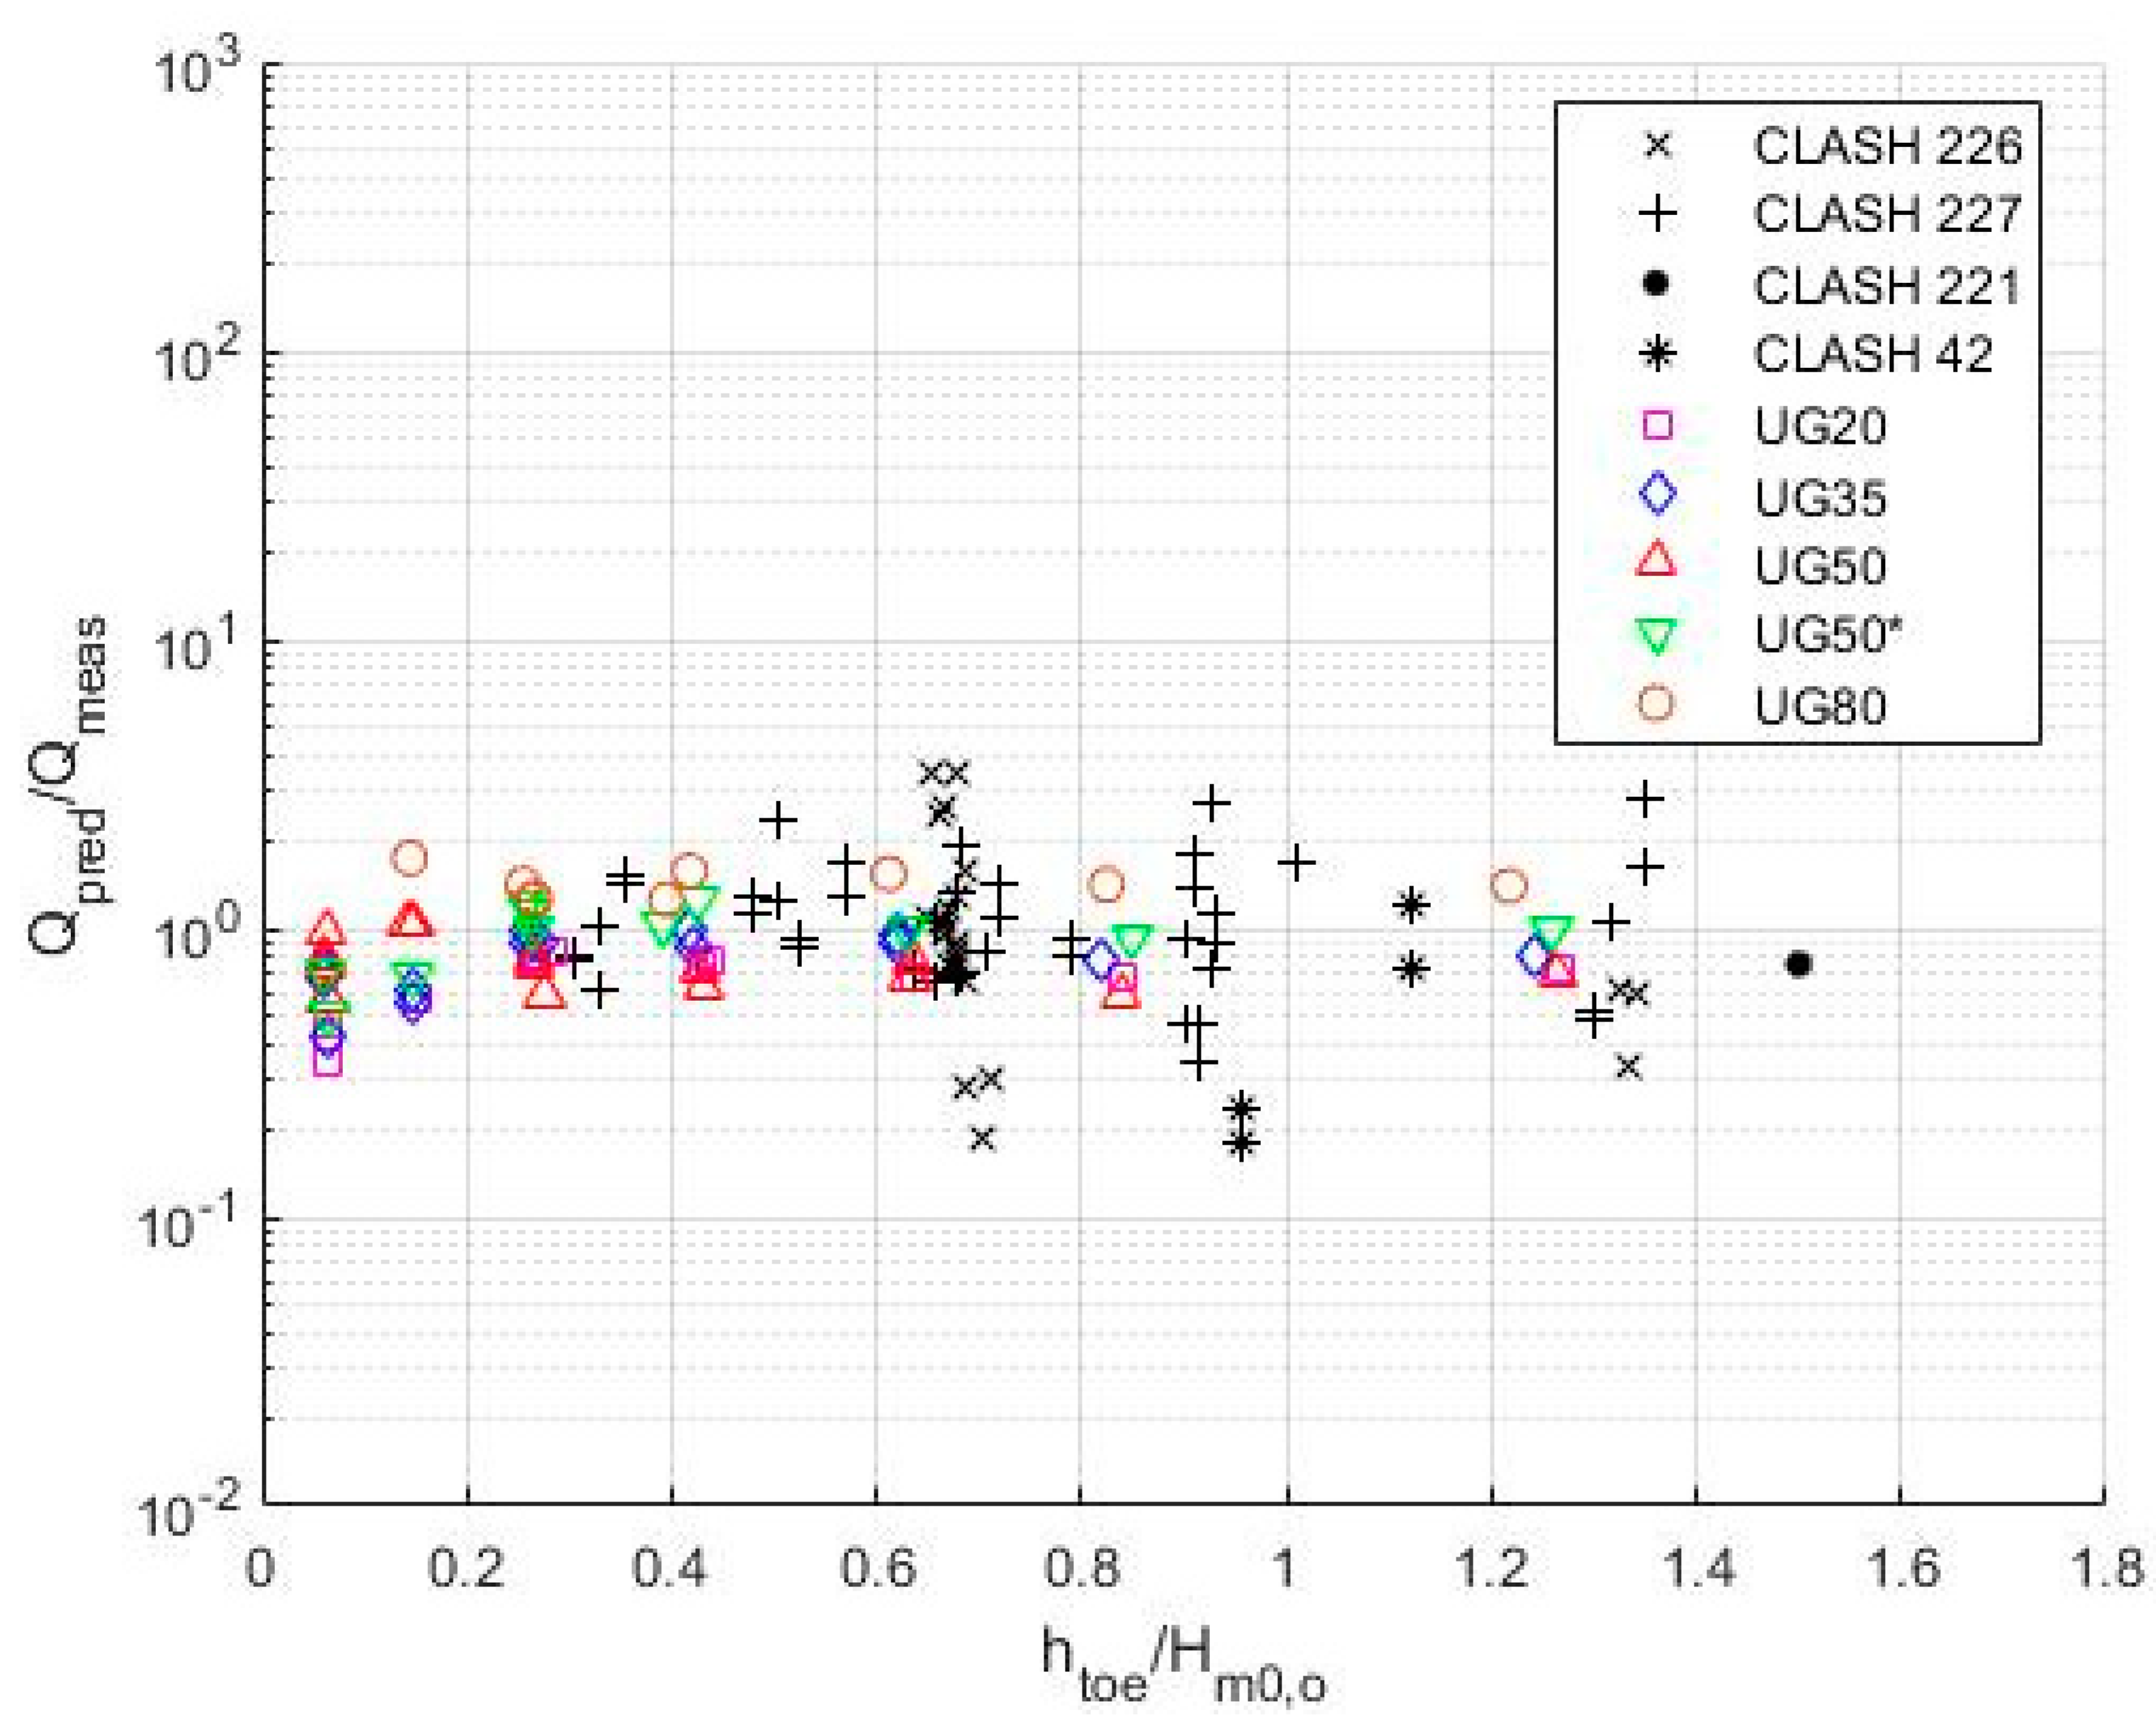
5.2.3. Altomare et al. (2016) in EurOtop (2018)

Figure 10 presents the dimensionless measured overtopping, Qmeas, versus the dimensionless freeboard,   R c / H m 0 , t o e ( 0.33 + 0.22 ξ m 1 , 0 ) , with the breaker parameter calculated using the equivalent slope. The solid line represents the probabilistic approach of Altomare et al. [2], as also included in EurOtop [3] (Equation (13)). The dashed line is the deterministic formula, which is the conservative approach. The dotted lines indicate the confidence interval limits, representing the upper and lower 5% exceedance probability. The results indicate a tendency to underestimate the overtopping for UGent data. However, all data are located within the confidence intervals, contrary to the prediction by Van Gent [12] (see Figure 6).
Figure 11 and Figure 12 indicate that both Altomare et al. [2] and Van Gent [12], using the equivalent slope, tend to underestimate the overtopping for extremely shallow foreshore cases (htoe/Hm0,o < 0.3). The tendency is most significant for the steep foreshore slopes. For very shallow foreshore conditions, the underestimation is still present in Van Gent [12] with an equivalent slope, whereas the Altomare et al. [2] prediction performance is better. The equivalent-slope approach, which is calculated including the foreshore slope, has significantly improved the prediction for overtopping on a very shallow foreshore. For extremely shallow foreshore conditions, the improvement is again significant; however, there remains an underprediction, but these data still fall within the confidence interval.
The geometric mean and the geometric standard deviation of the entire dataset of our study are 0.87 and 1.66. In the study by Altomare et al. [2], the same indicators were 1.00 and 1.97 for the datasets used in their analysis (including the CLASH datasets used in our study). As both studies selected the same CLASH data, the difference mainly depends on the other experiments considered by each study separately. The improvement in the recalibrated formula of Altomare et al. [2] over the formula of Van Gent [12], calculated with an equivalent slope, is clearly observed in performance indicator results (i.e., Geo = 0.87 compared to Geo = 0.65, respectively, in Table 4, the GSD is the same because the scatter of the data remains the same). The geometric mean for the individual datasets indicates an improvement in the estimation as the slope becomes milder, which is consistent with the limitations of the equivalent-slope approach. The range of applicability of Altomare et al. [2] is limited to foreshore slopes milder than 1/35. The UGent dataset is one of the first studies to check the validity for steeper slopes. The result of the Altomare et al. [2] model for the steeper foreshore slope dataset UG20 is better than the performance reported by Lashley et al. [7] of the same model for another steep foreshore slope dataset (with slopes of 1/10 and 1/30). This requires further study and shows the need for more data with steeper foreshore slopes.

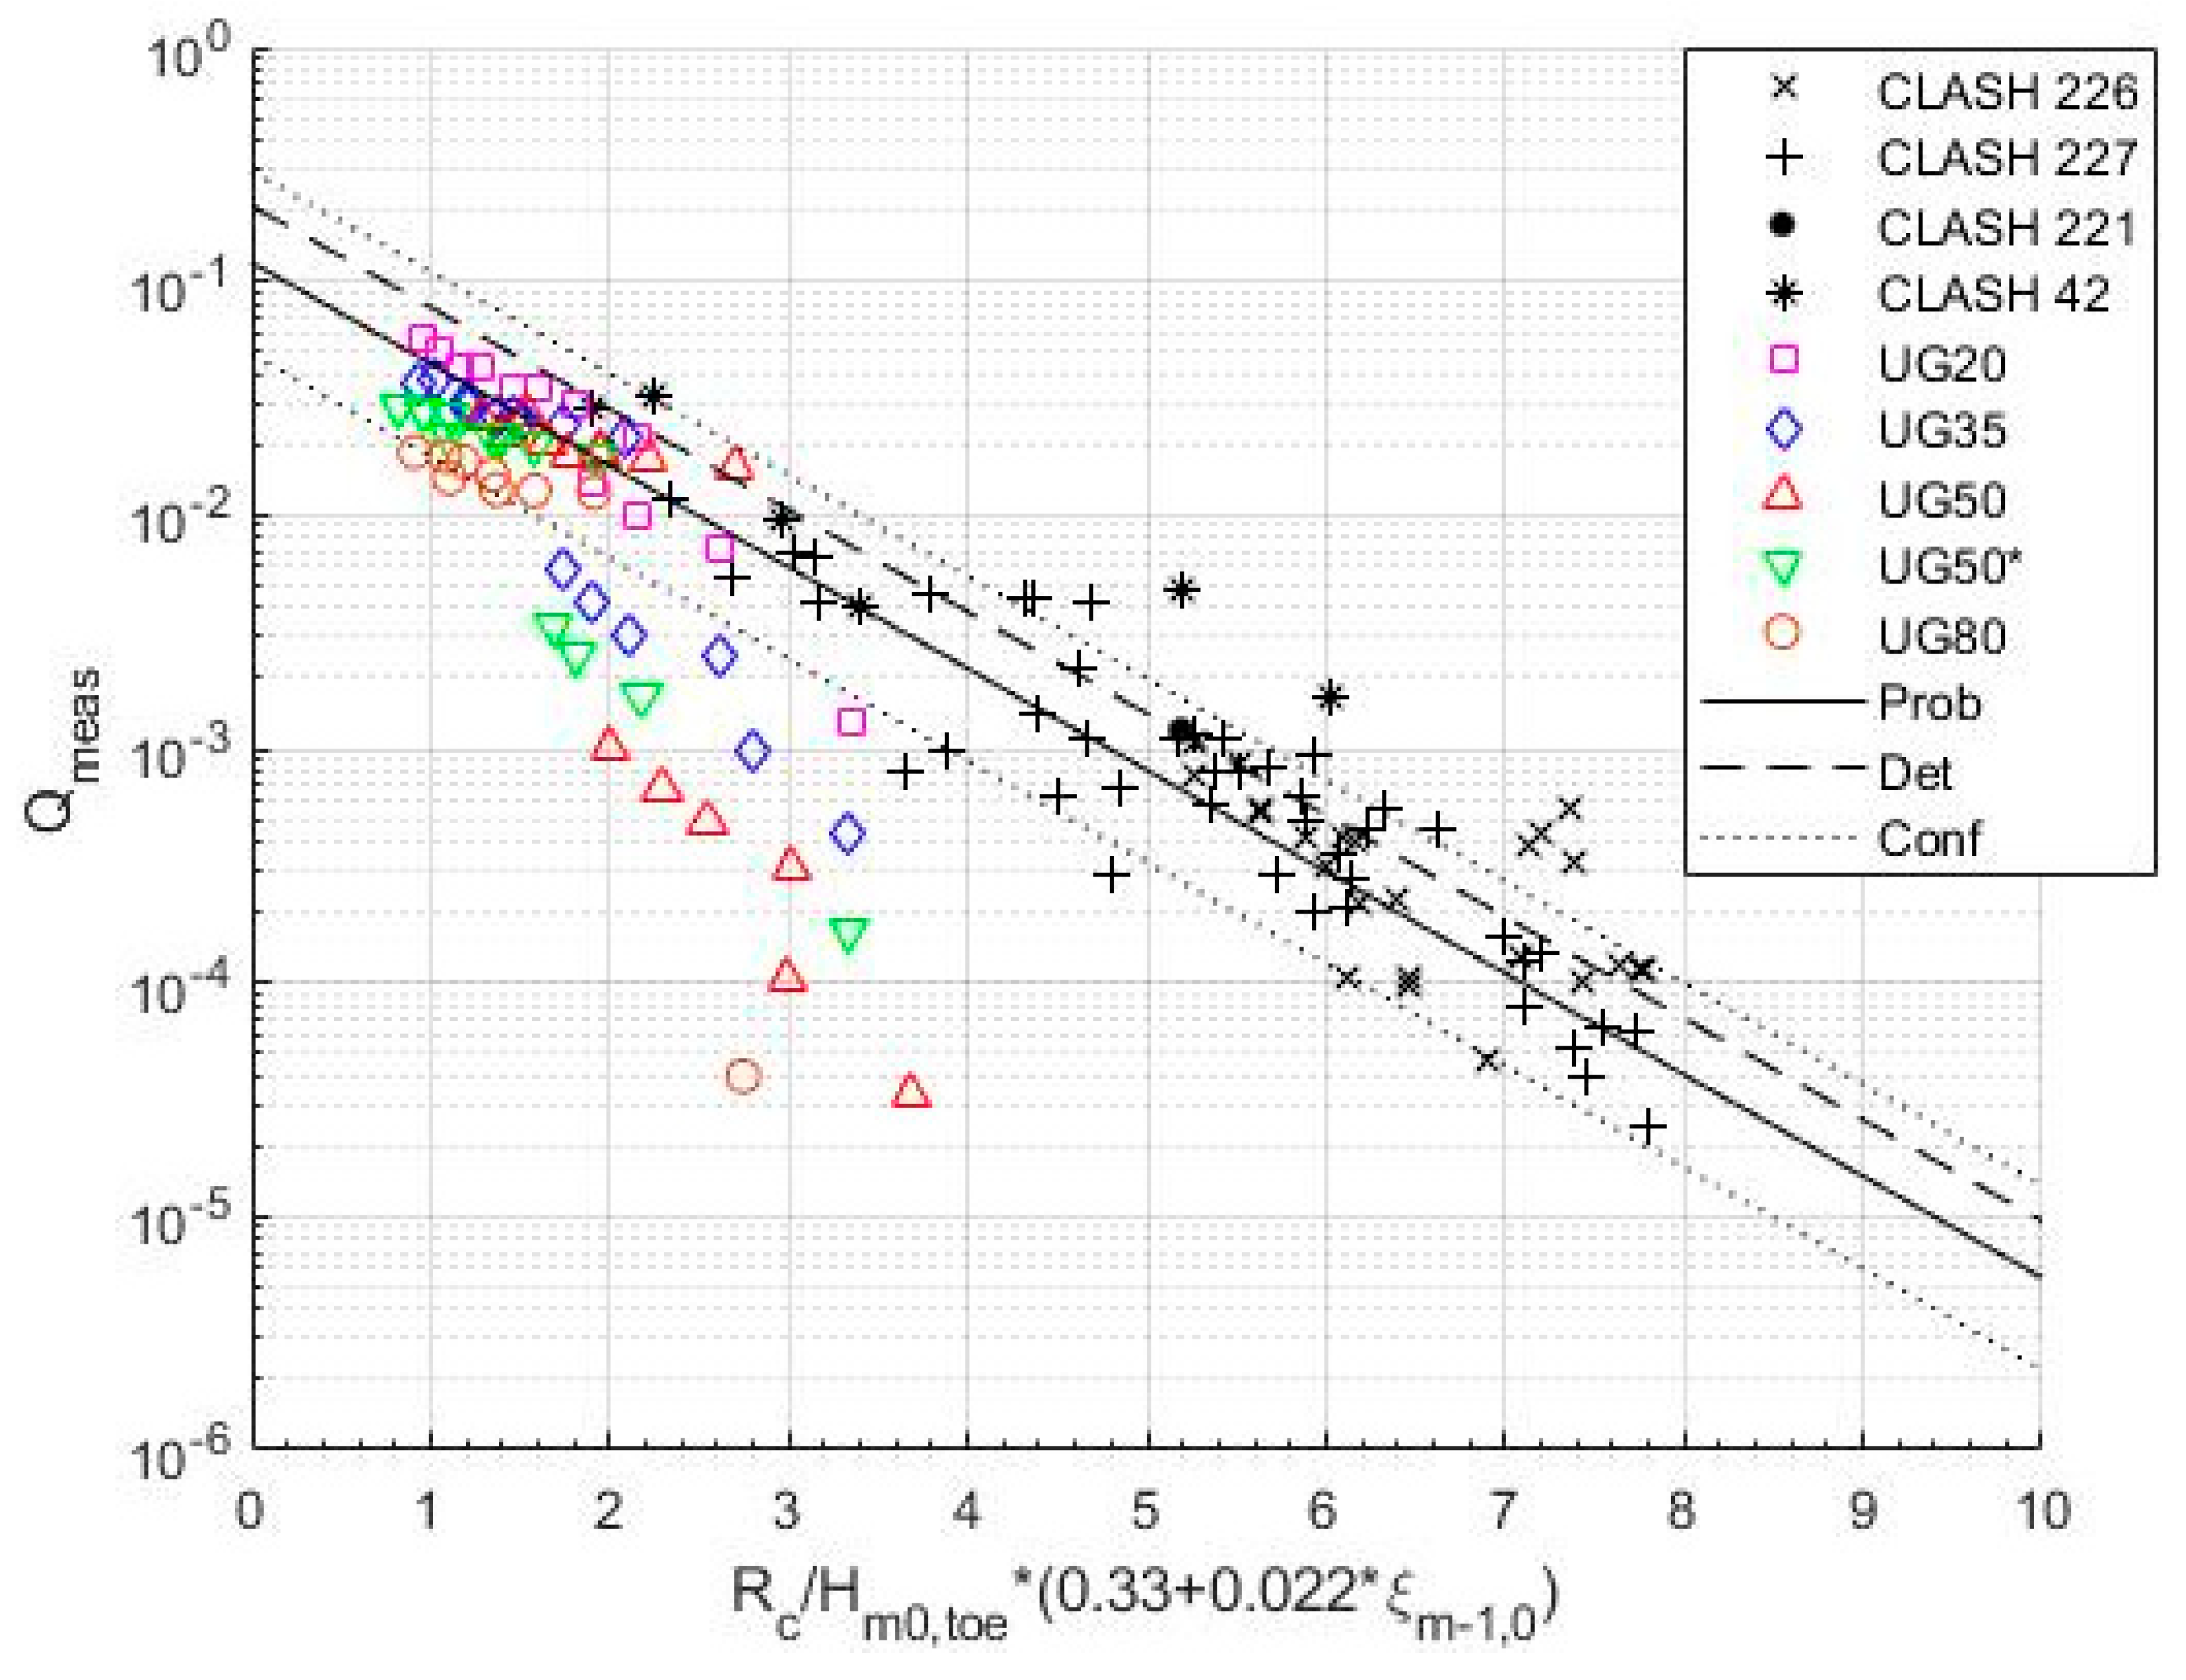
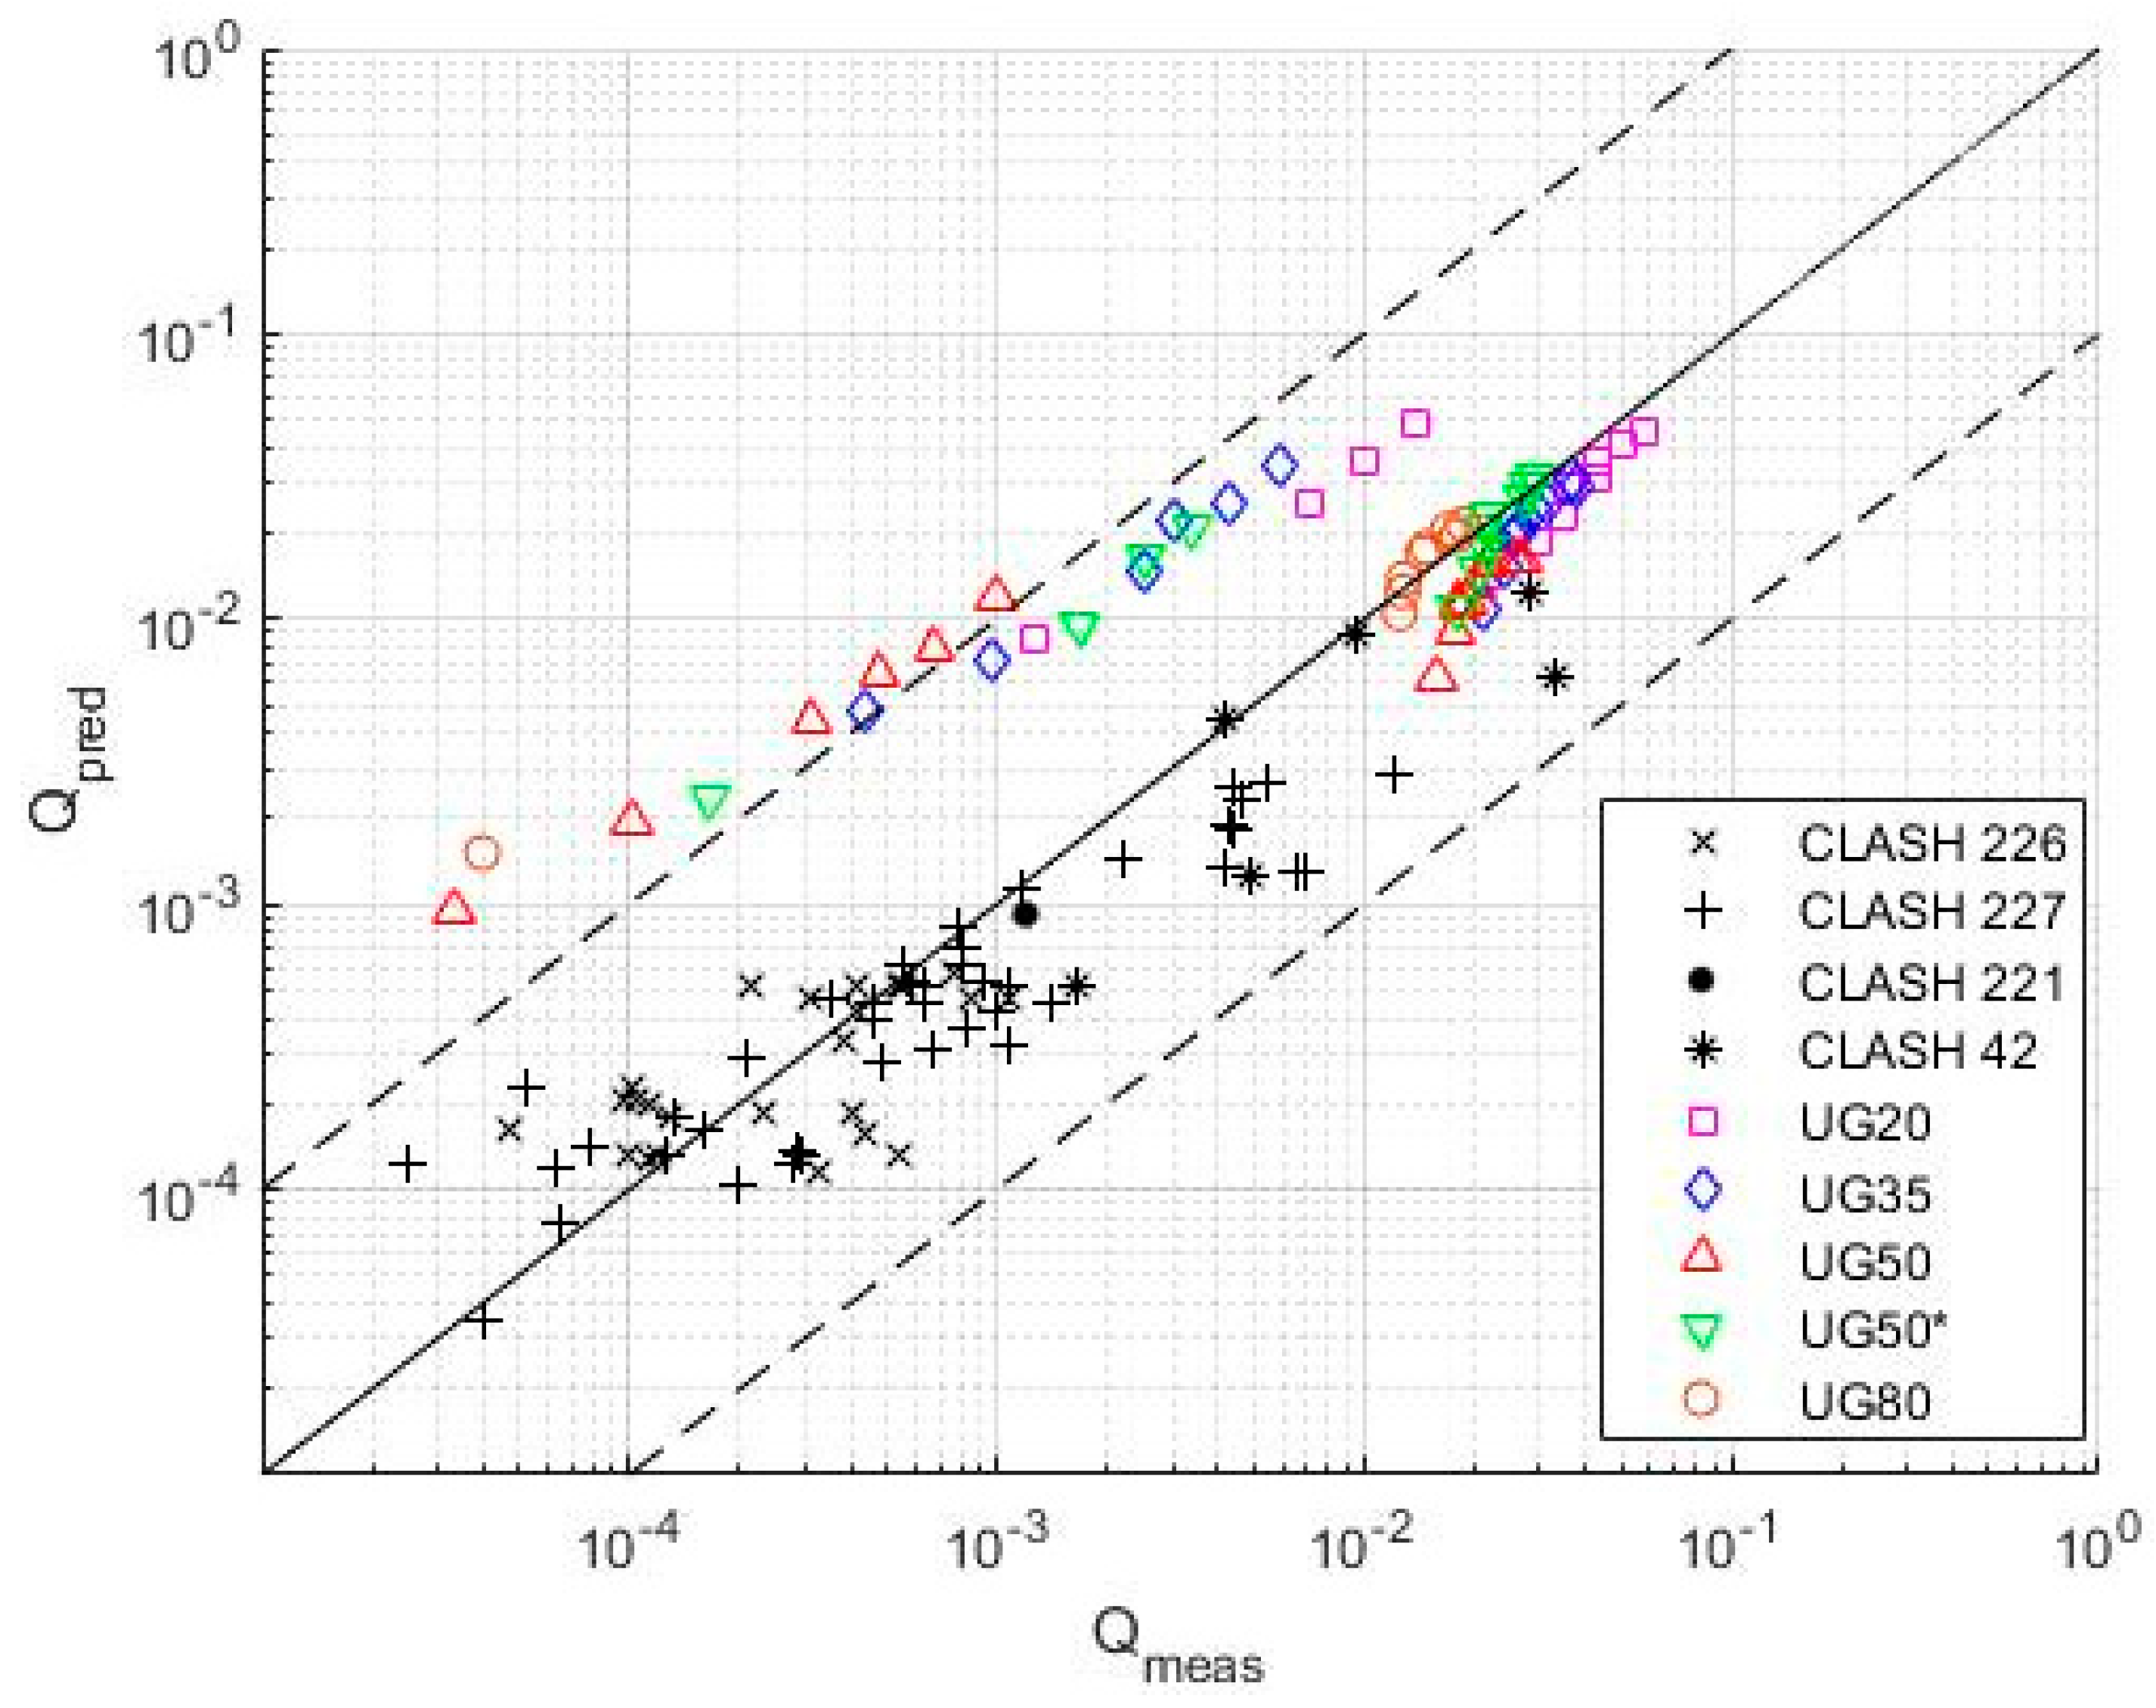
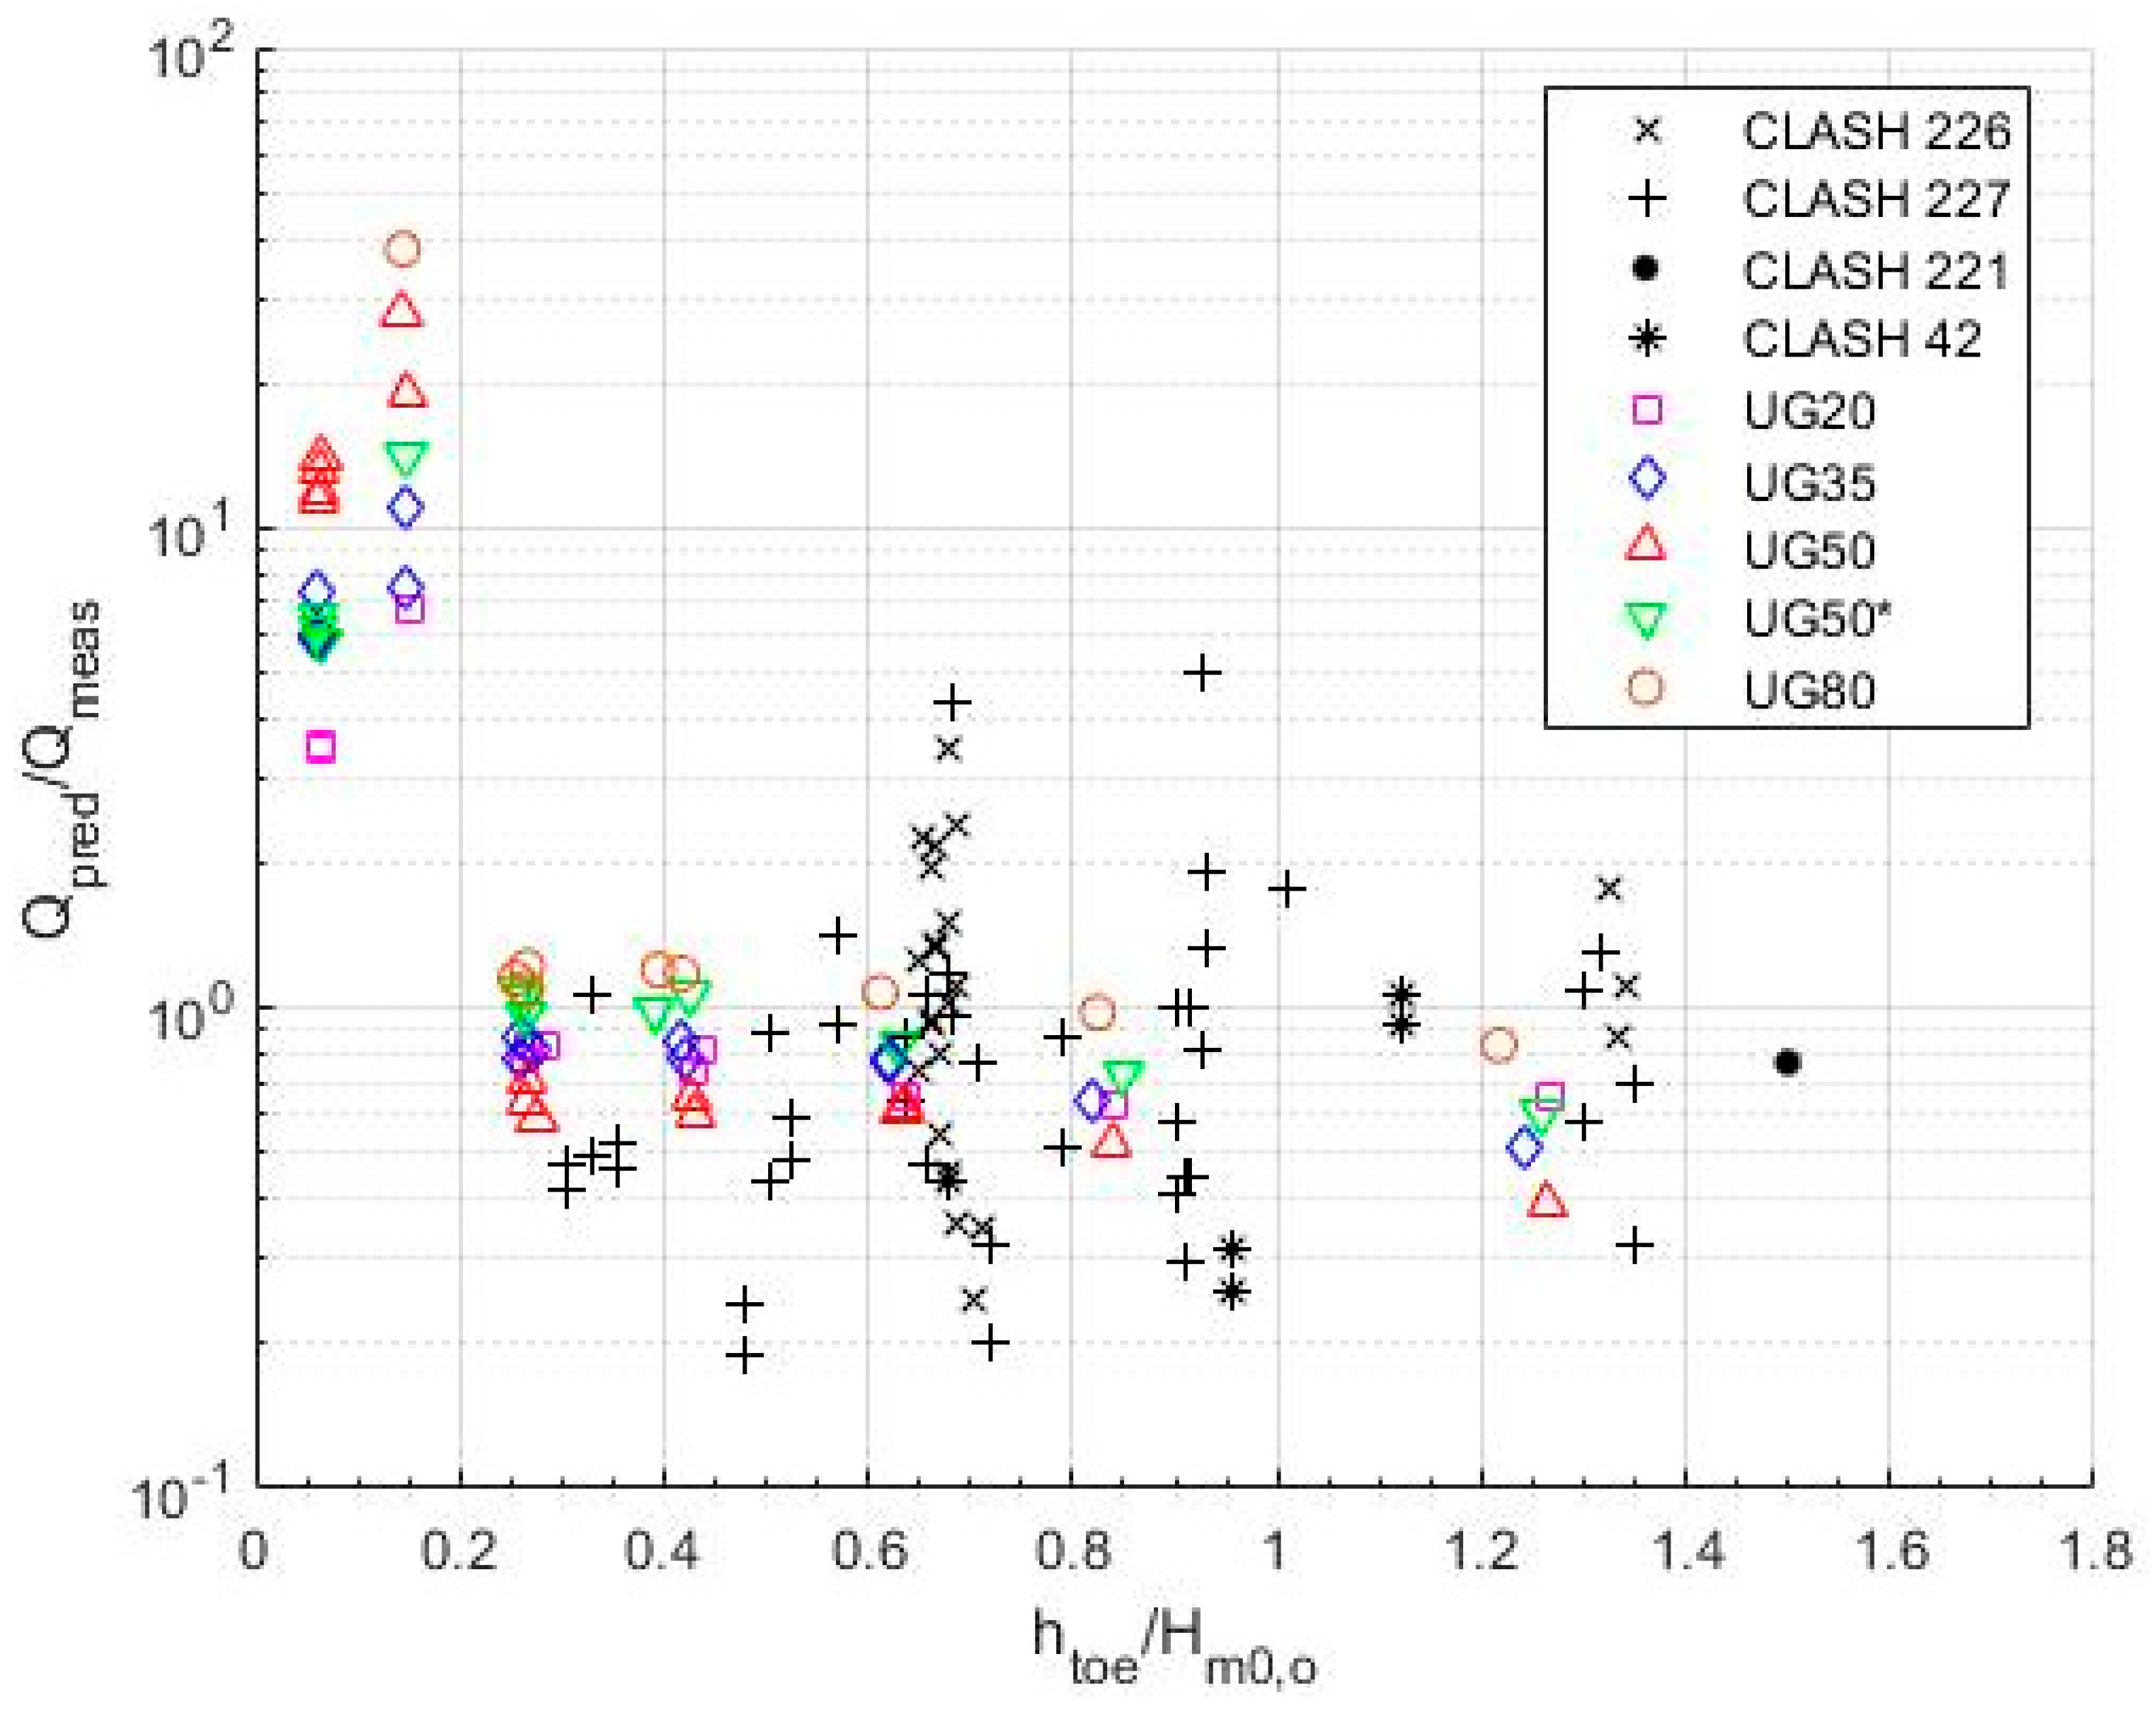
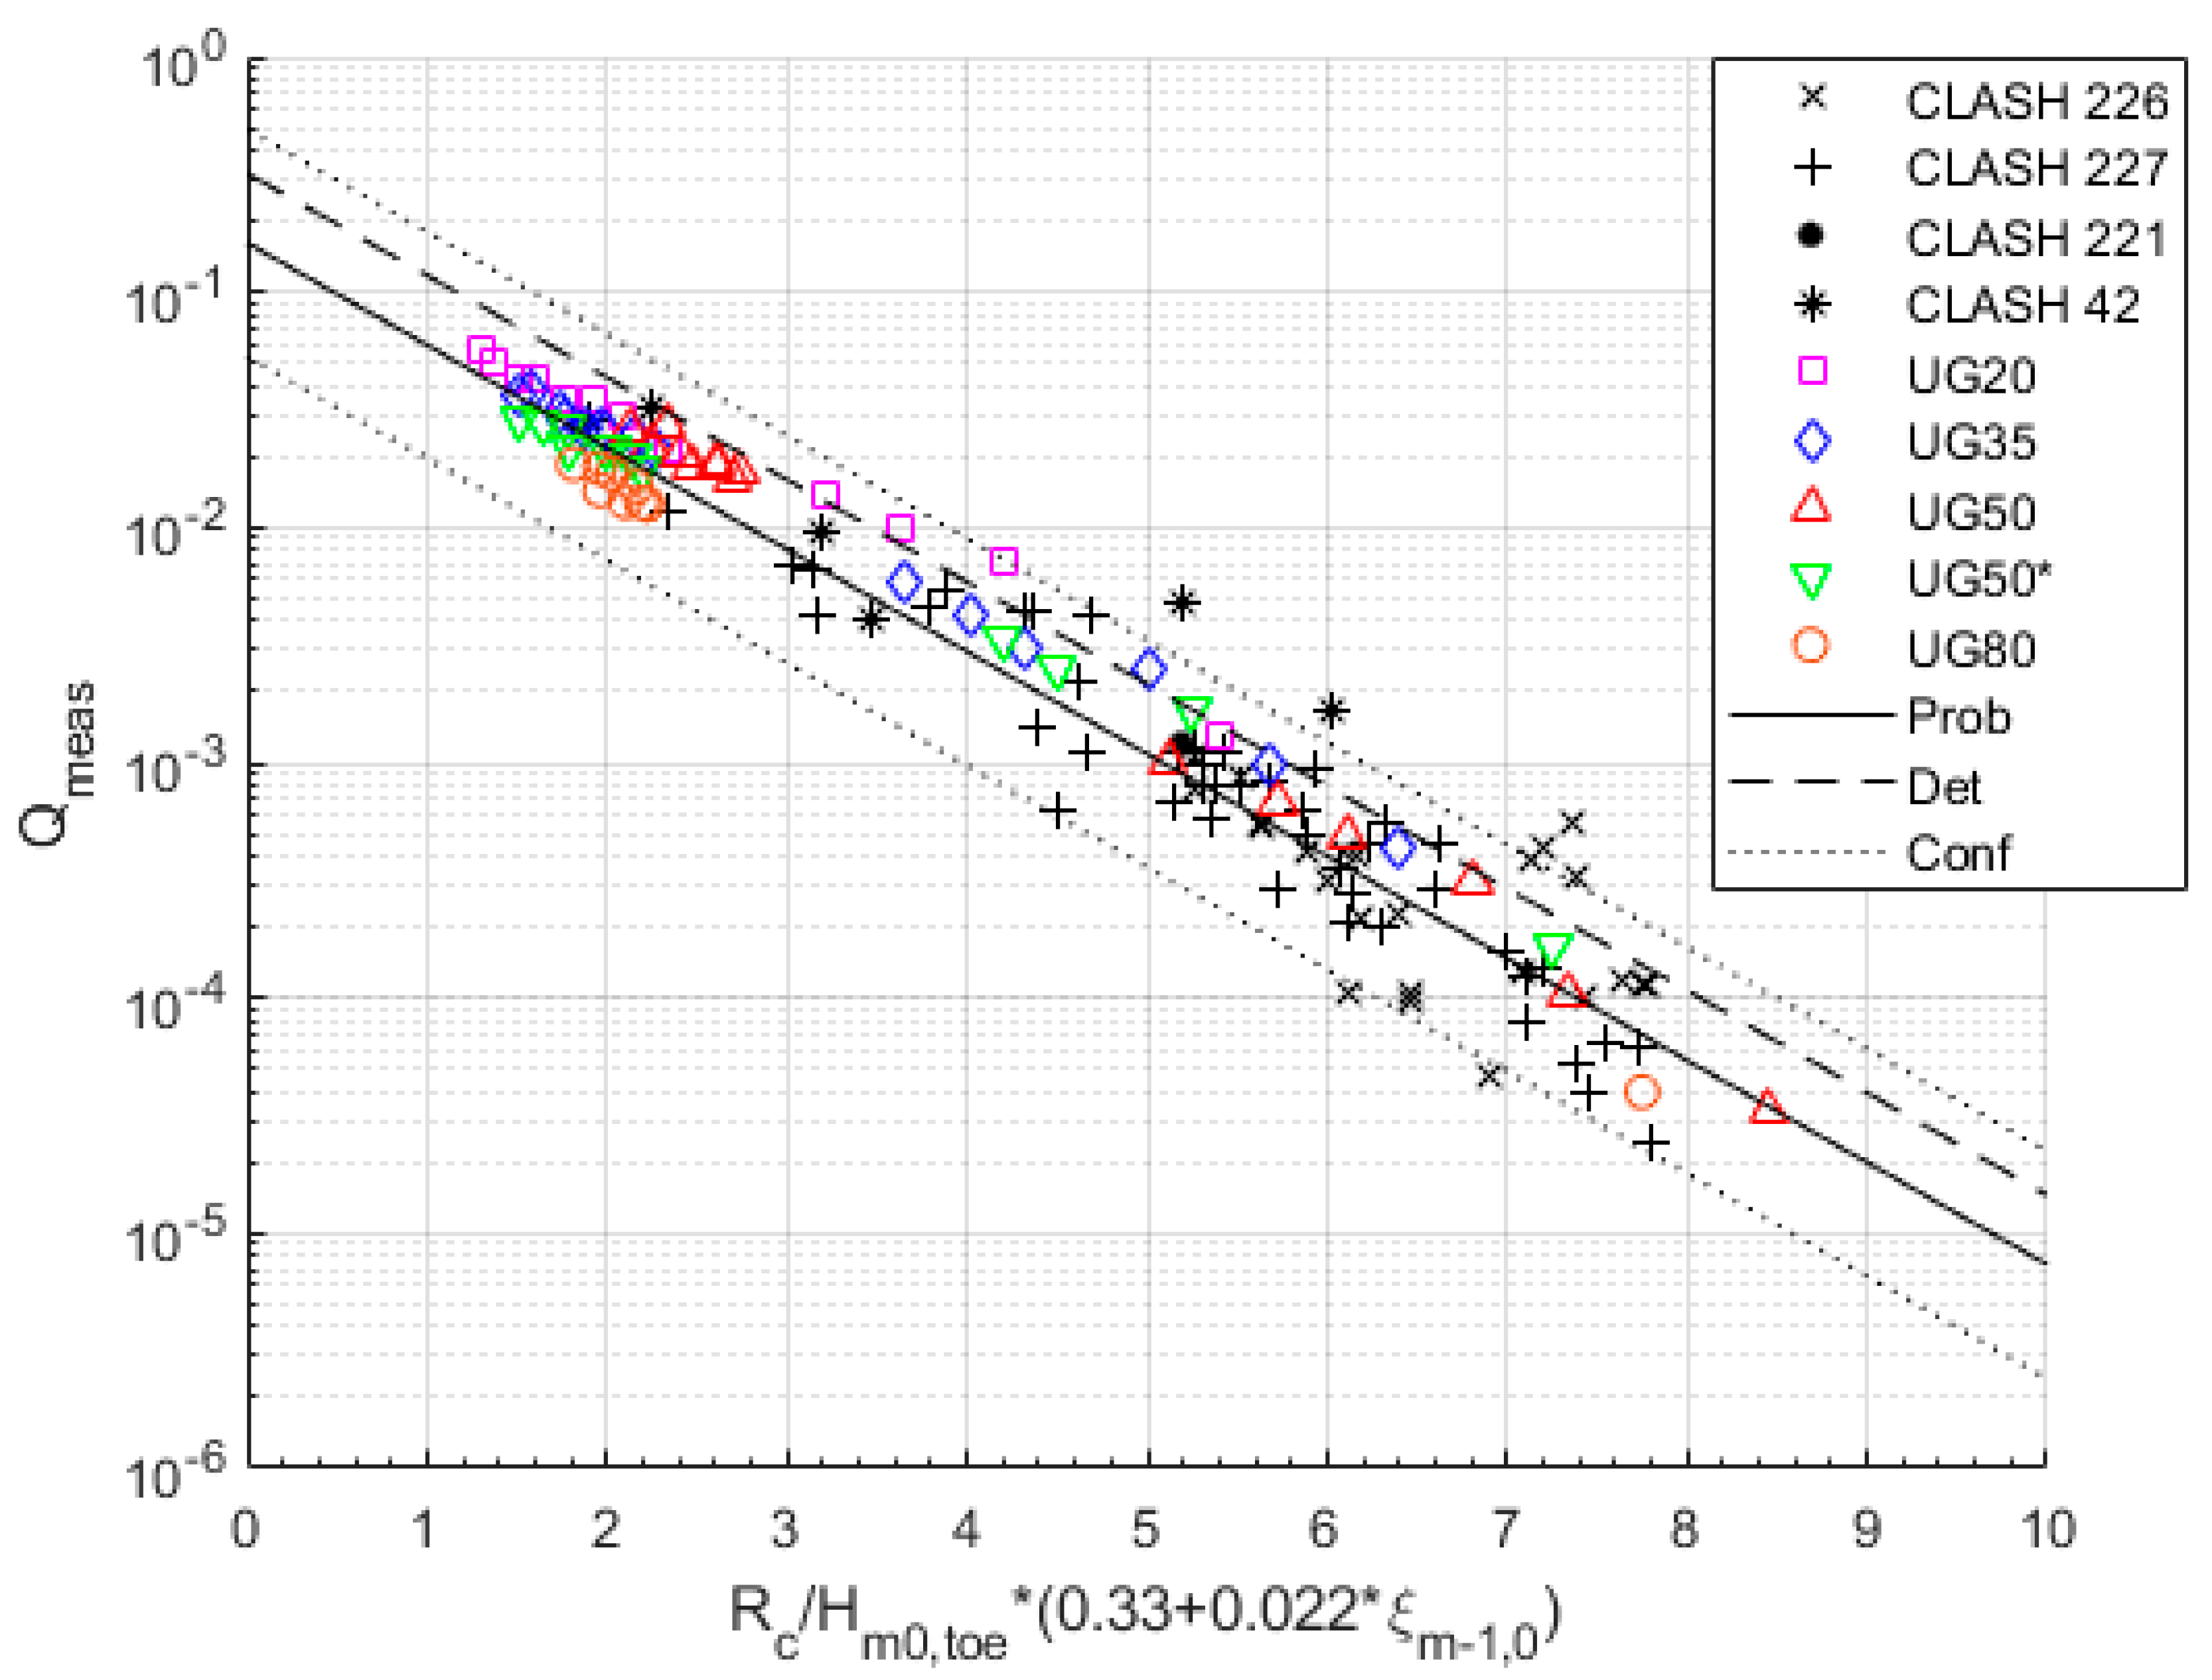
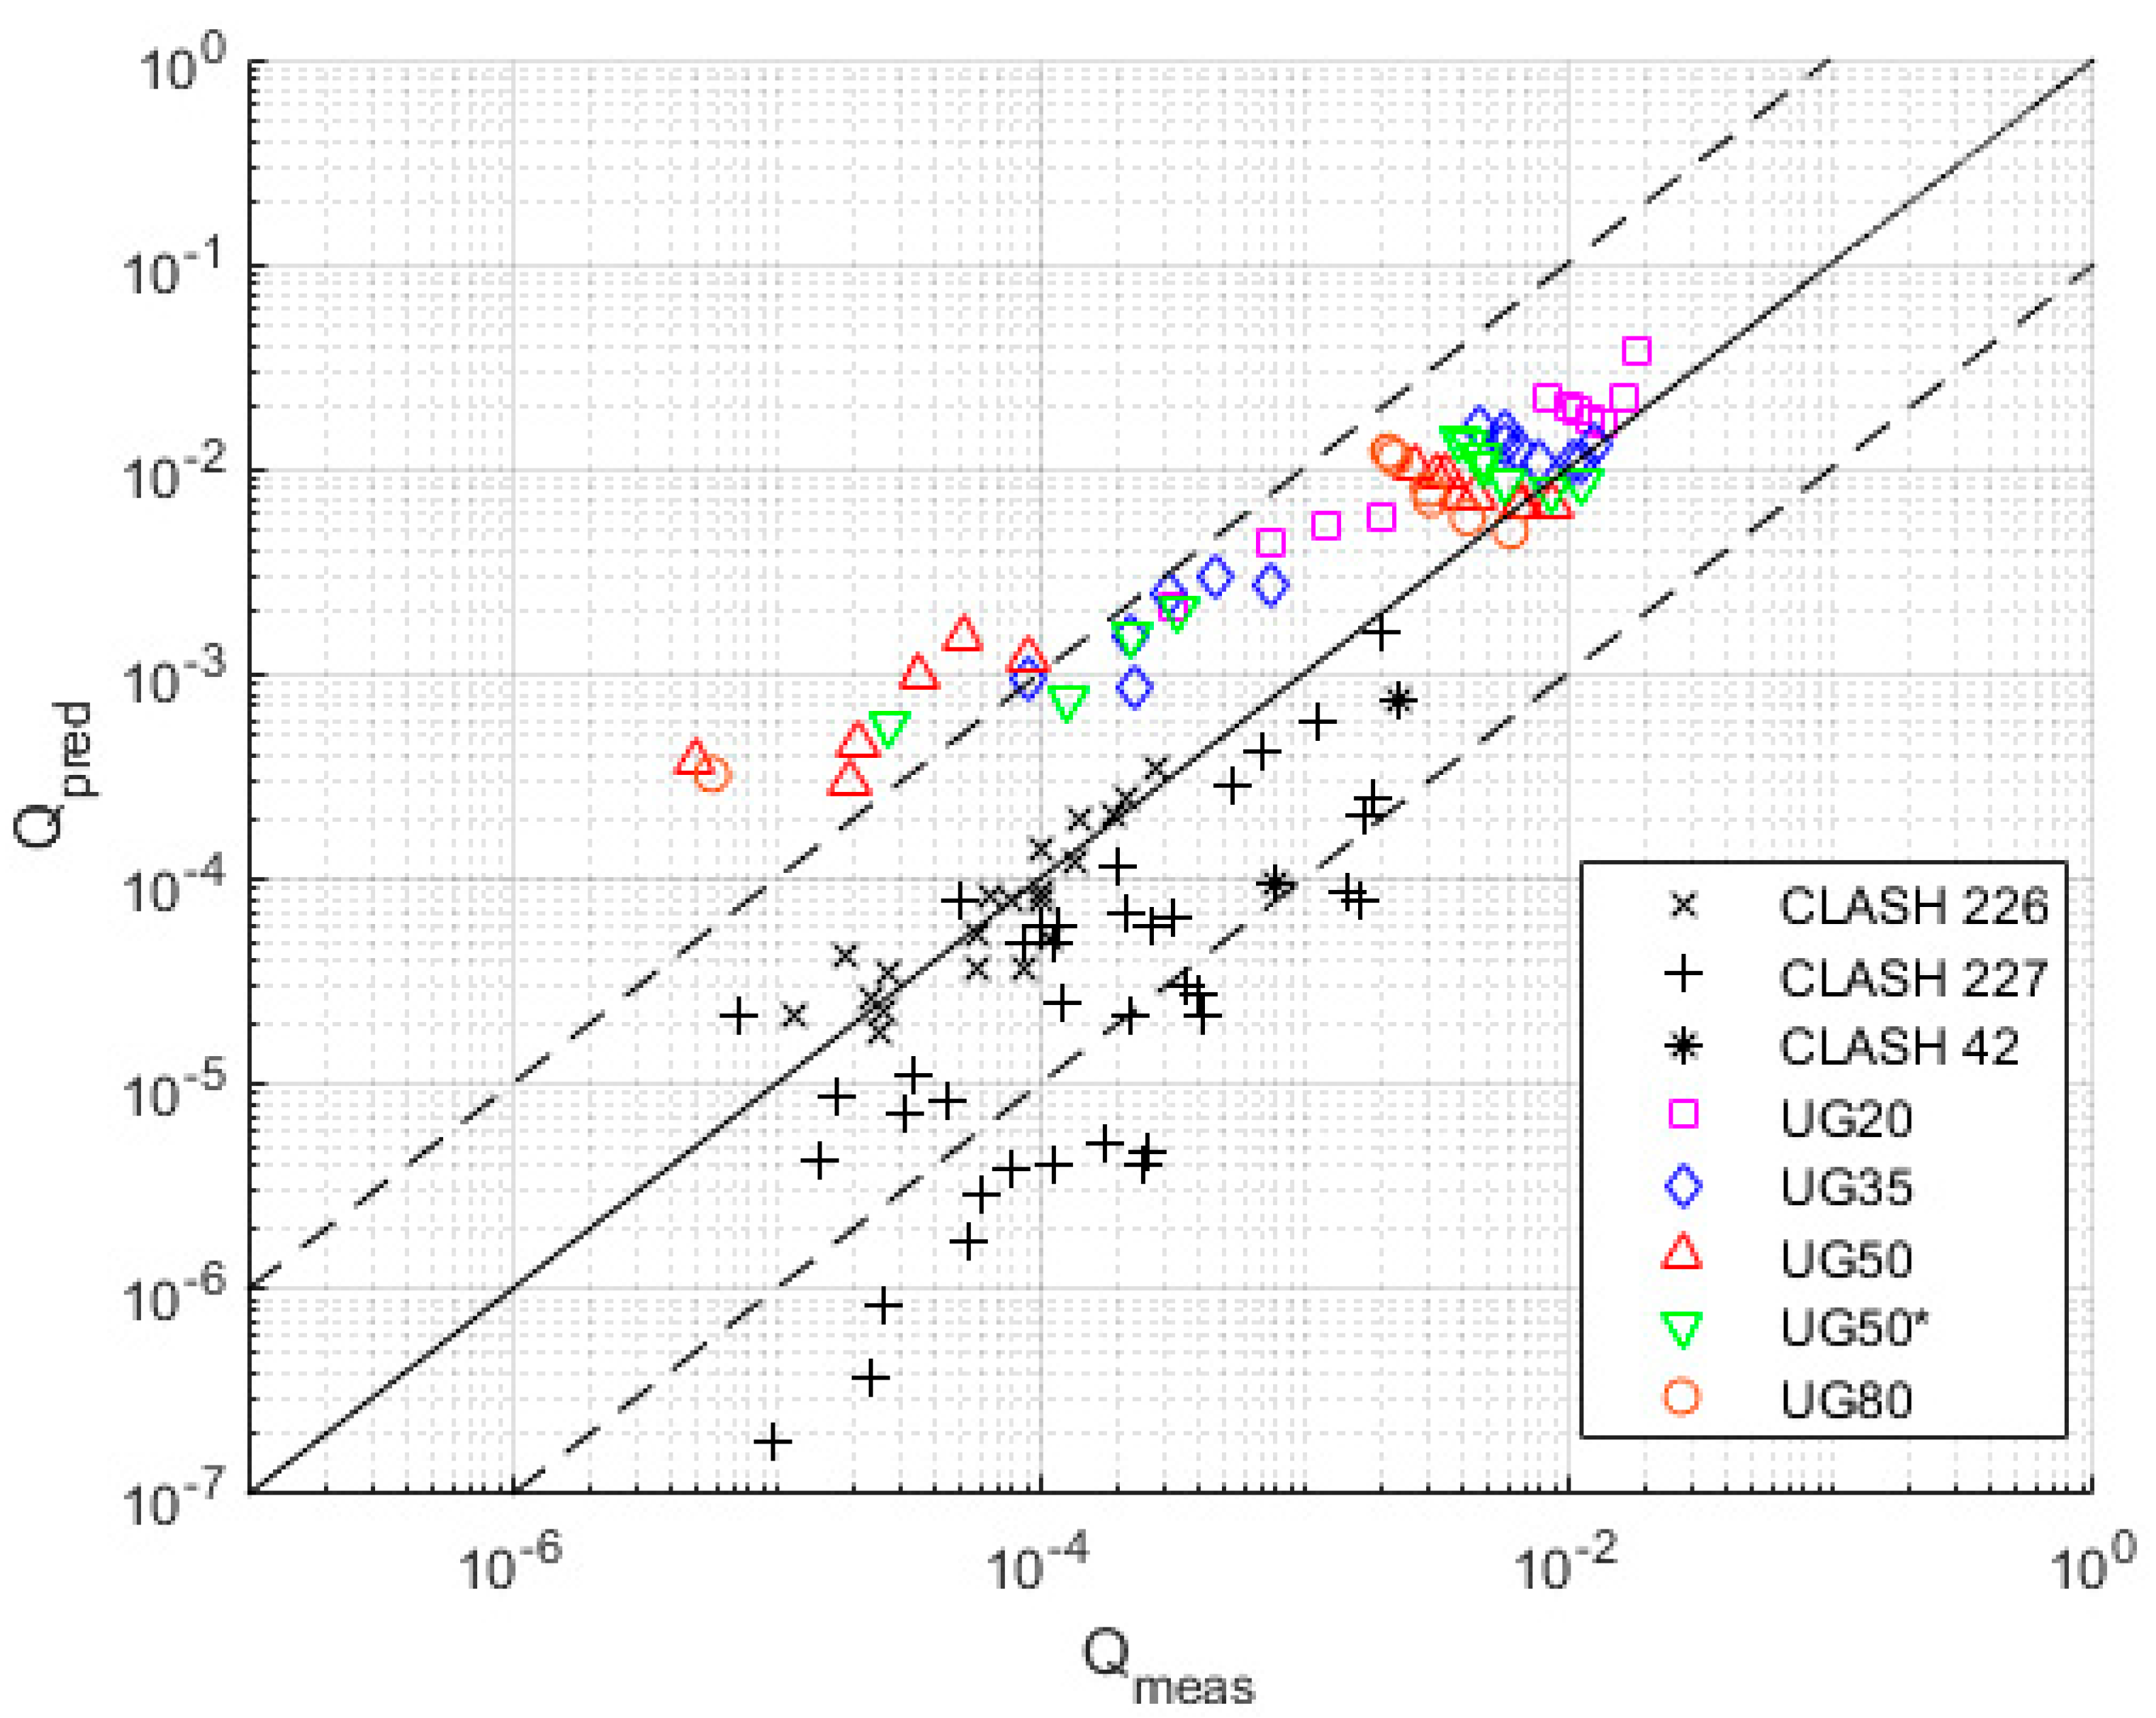
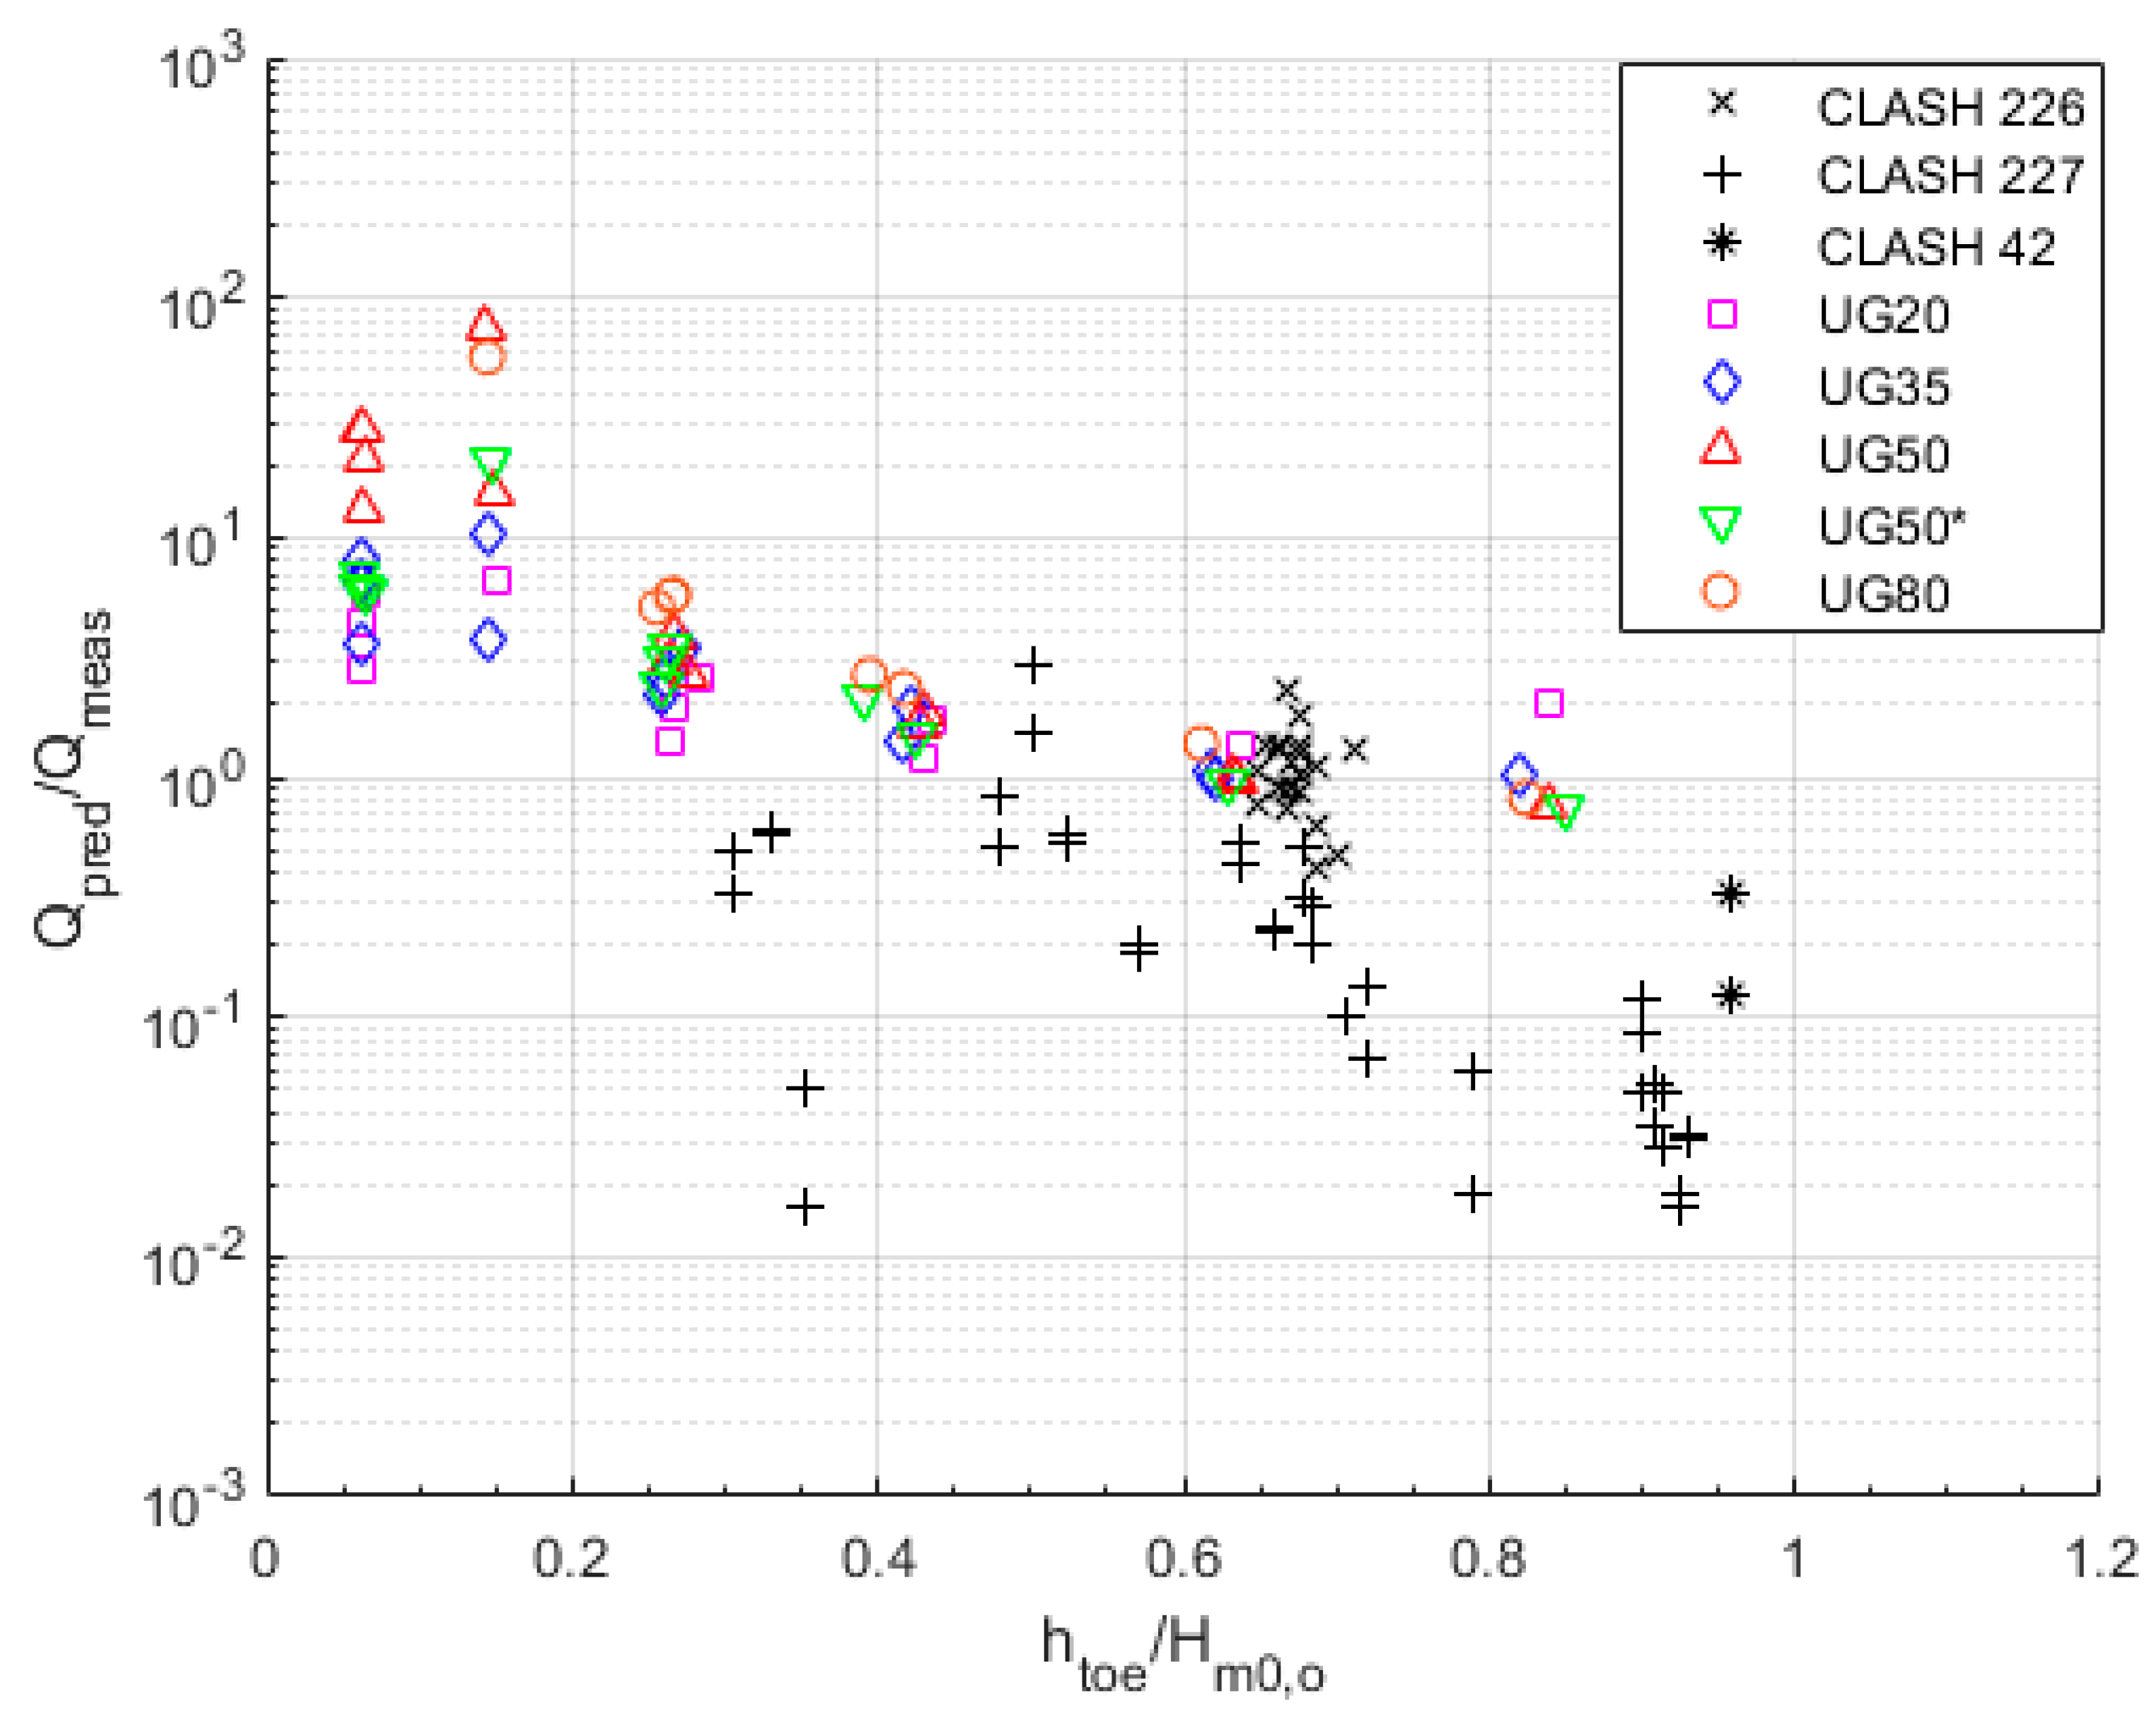
5.2.4. Lashley et al. (2021)

Lashley et al. [7] used deep-water wave conditions and the foreshore slope and dike slope directly in their equations. Due to the limited amount of data in very and extremely shallow foreshore conditions, the validation of the formulas with independent datasets was recommended. The UGent dataset presented in this paper is used to assess the performance of Lashley et al. [7], while only the CLASH dataset for htoe/Hm0,o < 1 is included following the range of application of the formula.
Figure 13 compares the measured and predicted overtopping discharge in dimensionless form (Q = q/(gH3m0,o)0.5) using the Lashley et al. [7] formula (Equation (14)). The ratio of Qpred to Qmeas versus htoe/Hm0,o is provided in Figure 14. When both figures are examined, it is clear that Lashley et al. [7] estimate the overtopping discharge for very shallow foreshore (defined by Lashley et al. [7] as 0.5 < htoe/Hm0,o < 1) of the UGent dataset well, with a slight overprediction. However, a trend of overestimation for the extremely shallow foreshore cases becomes significant, including the transition regime defined by Lashley et al. [7]. The CLASH 226 dataset was the only CLASH dataset used in the derivation of their prediction formula. Therefore, an almost-perfect fit is shown (i.e., Geo = 1.01 and GSD = 1.49). On the other hand, the formula tends to underpredict the rest of the CLASH dataset, which has very shallow foreshore conditions and includes data with high relative freeboard values. The possible reason for this weak performance is the range of applicability of the formula regarding the relative freeboard and wave steepness.
The geometric mean of the entire dataset presented in Table 4 shows a strong performance (i.e., Geo = 0.98). However, the high geometric standard deviation (i.e., GSD = 5.85) is a result of the different performance trends for the different datasets (i.e., an over- and underprediction for the UGent and CLASH datasets, respectively). The formula’s performance decreases for milder foreshore slopes considering the UGent dataset. This behavior of the formula is similar to Goda [9], which is to be expected since Lashley et al. [7] based their formulation on the same parameters as used by Goda et al. [13] and on IG-wave considerations within the wave-transformation approach by Goda [15]. However, the weak performance related to the CLASH dataset requires further investigation. Although the set of formulas proposed by Lashley et al. [7] uses a variety of parameters to consider the wave transformation and its influence on wave overtopping, the results presented here show that further improvement is necessary for extremely shallow foreshore conditions.

6. Conclusions and Recommendations

A wide range of empirical models exists with an increasing number of input parameters to predict wave overtopping at dikes on a shallow foreshore. The influence of the shallowness of the foreshore on the wave spectra at the dike toe, and thus the wave overtopping, has become an essential parameter in recent years as more datasets and observations are becoming available. In this paper, we focused on reviewing and assessing the performance of the main approaches in estimating wave overtopping at dikes on shallow foreshores (i.e., [2,7,9,12]) by introducing a new experimental dataset. The new UGent dataset focuses on a range of foreshore slopes (i.e., 1/20, 1/35, 1/50, and 1/80) for repeated offshore wave conditions and a range of shallow foreshore depths. This is the first time that this many foreshore slopes have been considered in the same physical modeling experiment. Although the prediction capability of these empirical models increased considerably for wave overtopping at dikes on a shallow foreshore compared to deep-foreshore methods, our evaluation highlighted several points of uncertainties and challenges that still need further consideration.
The classification of the shallowness of the foreshore generally follows Hofland et al. [1]. However, it is evident in both our assessment and Lashley et al. [7] that a transition phase exists from very shallow to extremely shallow foreshore conditions (i.e., 0.1< htoe/Hm0,o < 0.5), where the wave overtopping trend changes. Further exploration is recommended to reflect this transition phase better in the existing models.
Except for the model of Lashley et al. [7], the available empirical models propose one formula to predict the wave overtopping over all classifications of the shallow foreshore condition (htoe/Hm0,o < 4). The assessment of these models for the UGent dataset clearly shows that the performance decreases once the foreshore is extremely shallow, with a significant overprediction by the models of Van Gent [12], Goda [9], and Lashley et al. [7], and a small underprediction by the model of Altomare et al. [2]. Moreover, the model by Altomare et al. [2] is shown to provide the best prediction results for the entire UGent dataset, although with a slight trend of underestimation, especially for steeper foreshore slopes. Overall, including the CLASH dataset, again, the model by Altomare et al. [2] provides the best prediction. However, there is still a need for more data on extremely shallow foreshore conditions (including emergent toe cases htoe/Hm0,o < 0), so that further improvements in the existing formulations for these specific conditions can be achieved.
With the exception of Altomare et al. [2], all models exhibited a strong (residual) influence of the foreshore slope on the prediction of wave overtopping in extremely shallow foreshore conditions, with an increasing overprediction from steep to milder foreshore slopes. Therefore, the effect of the foreshore slope on the wave overtopping is still not fully taken into account yet, especially for extremely shallow foreshore conditions. In addition, the literature review also showed that there is a need for more datasets with steep (10 ≤ cot m < 35) and very gentle foreshore slopes (cot m > 250), to be able to extend the applicability of the empirical models to a larger range of foreshore slopes.
A rising dominance of IG waves (indicated by an increasing H ˜ I G ) and a decrease in wave overtopping was observed for the UGent dataset when going from (very) shallow to extremely shallow foreshore conditions. However, the wave overtopping was found to increase with an increasing H ˜ I G for a given foreshore slope in both the very and extremely shallow foreshore cases separately (with the limit between both cases rather at htoe/Hm0,o = 0.2 than htoe/Hm0,o = 0.3). Further exploration is recommended to reflect this parameter or physical process better in the prediction formulas.
Finally, major limitations still not fully explored in physical model tests (and therefore in the derived empirical models) are: (1) irregular foreshores (only uniform foreshore slopes have been considered) (2) and 3D effects, such as directional spreading and oblique incidence of the wave field. In reality, many foreshores present complex features (e.g., bars, ridges), and waves are directionally spread, which influence the wave transformations along the foreshore (and thus wave overtopping at the dike), especially for very and extremely shallow foreshore conditions.

Author Contributions

Conceptualization, G.O.T., D.K., V.G. and P.T.; methodology, G.O.T., D.K., V.G. and P.T.; validation, G.O.T., D.K. and V.G.; formal analysis, G.O.T.; investigation, G.O.T., D.K. and V.G.; resources, P.T.; data curation, G.O.T. and V.G.; writing—original draft preparation, G.O.T. and D.K.; writing—review and editing, G.O.T., D.K. and V.G.; visualization, G.O.T.; supervision, P.T.; project administration, P.T.; funding acquisition, P.T. All authors have read and agreed to the published version of the manuscript.

Funding

This research was part of the CREST (Climate REsilient CoaST) project (http://www.crestproject.be/en), funded by the Flemish Agency for Innovation by Science and Technology, grant number 150028.

Institutional Review Board Statement

Not applicable.

Informed Consent Statement

Not applicable.

Data Availability Statement

Publicly available datasets were analyzed in this study. The CLASH data can be found here: http://www.overtopping-manual.com/eurotop/neural-networks-and-databases/ (accessed on 1 February 2022); and the UGent data here: http://www.crestproject.be (accessed on 1 February 2022).

Conflicts of Interest

The authors declare no conflict of interest. The funders had no role in the design of the study; in the collection, analyses, or interpretation of data; in the writing of the manuscript; or in the decision to publish the results.

References

  1. Hofland, B.; Chen, X.; Altomare, C.; Oosterlo, P. Prediction formula for the spectral wave period T m-1,0 on mildly sloping shallow foreshores. Coast. Eng. 2017, 123, 21–28. [Google Scholar] [CrossRef] [Green Version]
  2. Altomare, C.; Suzuki, T.; Chen, X.; Verwaest, T.; Kortenhaus, A. Wave overtopping of sea dikes with very shallow foreshores. Coast. Eng. 2016, 116, 236–257. [Google Scholar] [CrossRef]
  3. Van der Meer, J.W.; Allsop, N.W.H.; Bruce, T.; De Rouck, J.; Kortenhaus, A.; Pullen, T.; Schüttrumpf, H.; Troch, P.; Zanuttigh, B. (Eds.) EurOtop—Manual on Wave Overtopping of Sea Defences and Related Structures: An Overtopping Manual Largely Based on European Research, but for Worldwide Application; TU Delft: Delft, The Netherlands, 2018; Available online: www.overtopping-manual.com (accessed on 2 February 2022).
  4. Koosheh, A.; Etemad-Shahidi, A.; Cartwright, N.; Tomlinson, R.; van Gent, M.R.A. Distribution of individual wave overtopping volumes at rubble mound seawalls. Coast. Eng. 2022, 177, 104173. [Google Scholar] [CrossRef]
  5. Altomare, C.; Suzuki, T.; Verwaest, T.; Verwaest, T. Influence of directional spreading on wave overtopping of sea dikes with gentle and shallow foreshores. Coast. Eng. 2020, 157, 103654. [Google Scholar] [CrossRef] [Green Version]
  6. Gruwez, V.; Altomare, C.; Suzuki, T.; Streicher, M.; Cappietti, L.; Kortenhaus, A.; Troch, P. An inter-model comparison for wave interactions with sea dikes on shallow foreshores. J. Mar. Sci. Eng. 2020, 8, 985. [Google Scholar] [CrossRef]
  7. Lashley, C.H.; van der Meer, J.; Bricker, J.D.; Altomare, C.; Suzuki, T.; Hirayama, K. Formulating Wave Overtopping at Vertical and Sloping Structures with Shallow Foreshores Using Deep-Water Wave Characteristics. J. Waterw. Port Coast. Ocean Eng. 2021, 147, 04021036. [Google Scholar] [CrossRef]
  8. Nguyen, T.-H.; Hofland, B.; Chinh, V.D.; Stive, M.J.F. Wave Overtopping Discharge for Very Gently Sloping Foreshores. Water 2020, 12, 1695. [Google Scholar] [CrossRef]
  9. Goda, Y. Derivation of unified wave overtopping formulas for seawalls with smooth, impermeable surfaces based on selected CLASH datasets. Coast. Eng. 2009, 56, 385–399. [Google Scholar] [CrossRef]
  10. Mase, H.; Tamada, T.; Yasuda, T.; Hedges, T.S.; Reis, M.T. Wave runup and overtopping at seawalls built on land in very shallow water. J. Waterw. Port Coast. Ocean Eng. 2013, 139, 346–357. [Google Scholar] [CrossRef]
  11. Yuhi, M.; Mase, H.; Kim, S.; Umeda, S.; Altomare, C. Refinement of integrated formula of wave overtopping and runup modeling. Ocean Eng. 2020, 220, 108350. [Google Scholar] [CrossRef]
  12. Van Gent, M.R.A. Physical Model Investigations on Coastal Structures with Shallow Foreshores: 2D Model Tests with Single and Double-Peaked Wave Energy Spectra; H3608; TU Delft: Delft, The Netherlands, 1999; Available online: https://repository.tudelft.nl/islandora/object/uuid%3A1b4729de-2e86-4b8a-98d5-48d8e07d5902 (accessed on 2 February 2022).
  13. Goda, Y.; Kishara, Y.; Kamiyama, Y. Laboratory investigation on the overtopping rate of seawalls by irregular waves. Rep. Port Harb. Res. Inst. 1975, 14, 3–44. (In Japanese) [Google Scholar]
  14. Herbers, T.H.C.; Elgar, S.; Guza, R.T. Infragravity-Frequency (0.005–0.05 Hz) Motions on the Shelf. Part I: Forced Waves. J. Phys. Oceanogr. 1994, 24, 917–927. [Google Scholar] [CrossRef]
  15. Goda, Y. Random Seas and Design of Maritime Structures, 2nd ed.; Advanced Series on Ocean Engineering; World Scientific: Singapore, 2000; Volume 15. [Google Scholar]
  16. Lashley, C.H.; Zanuttigh, B.; Bricker, J.D.; van der Meer, J.; Altomare, C.; Suzuki, T.; Roeber, V.; Oosterlo, P. Benchmarking of numerical models for wave overtopping at dikes with shallow mildly sloping foreshores: Accuracy versus speed. Environ. Model. Softw. 2020, 130, 104740. [Google Scholar] [CrossRef]
  17. Okihiro, M.; Guza, R.T.; Seymour, R.J. Bound infragravity waves. J. Geophys. Res. 1992, 97, 11453–11469. [Google Scholar] [CrossRef] [Green Version]
  18. Verhaeghe, H.; van der Meer, J.W.; Steendam, G.J. Database on Wave Overtopping at Coastal Structures; CLASH Report Workpackage 2; Ghent University: Ghent, Belgium, 2004. [Google Scholar]
  19. TAW. Technical Report on Wave Run-Up and Wave Overtopping at Dikes; Technical Advisory Committee on Flood Defence: Delft, The Netherlands, 2002. [Google Scholar]
  20. Pullen, T.; Allsop, N.W.H.; Kortenhaus, A.; Schüttrumpf, H.; van der Meer, J.W. (Eds.) EurOtop—European Overtopping Manual for the Assessment of Wave Overtopping; TU Delft: Delft, The Netherlands, 2007. [Google Scholar]
  21. Tamada, T.; Inoue, M.; Tezuka, T. Experimental studies on diagrams for the estimation of wave overtopping rate on gentle slope-type seawalls and these reduction effects on wave overtopping. Proc. Coast. Eng. JSCE 2002, 49, 641–645. (In Japanese) [Google Scholar]
  22. Lashley, C.H.; Bricker, J.D.; van der Meer, J.; Van der Meer, J.W.; Altomare, C.; Suzuki, T. Relative magnitude of infragravity waves at coastal dikes with shallow foreshores: A prediction tool. J. Waterw. Port Coast. Ocean Eng.-Asce 2020, 146, 04020034. [Google Scholar] [CrossRef]
  23. Meinert, P.; Lykke Andersen, T.; Frigaard, P. AwaSys 7 User Manual; Aalborg University: Aalborg, Denmark, 2017. [Google Scholar]
  24. Kamphuis, J.W. Long waves in flume experiments. In Proceedings of the 26th Conference on Coastal Engineering, Copenhagen, Denmark, 22–26 June 1998. [Google Scholar]
  25. Ruessink, B.G.; Michallet, H.; Bonneton, P.; Mouaze, D.; Lara, J.; Silva, P.A.; Wellens, P. Globex: Wave dynamics on a gently sloping laboraty beach. In Proceedings of the Coastal Dynamics, Arcachon, France, 24–28 June 2013; pp. 1351–1362. Available online: http://dspace.library.uu.nl/handle/1874/310236 (accessed on 2 February 2022).
  26. Mansard, E.P.D.; Funke, E.R. The measurement of incident and reflected spectra using a least squares method. In Proceedings of the 17th Coastal Engineering Conference Proceedings, Sydney, Australia, 23–28 March 1980; pp. 154–172. [Google Scholar]
  27. Eldrup, M.R.; Lykke Andersen, T. Applicability of Nonlinear Wavemaker Theory. J. Mar. Sci. Eng. 2019, 7, 14. [Google Scholar] [CrossRef] [Green Version]
  28. Victor, L.; Troch, P. Development of a test set-up to measure large wave-by-wave overtopping masses. In Proceedings of the Third International Conference on the Application of Physical Modelling to Port and Coastal Protection, Barcelona, Spain, 28–30 September 2010. [Google Scholar]
Figure 1. Small-scale model set up for the overtopping tests. (a) is the top view, (b) is the side view of the main channel, (c) is the side view of the small channel, and (d) is the detailed view of the scale model.
Jmse 11 00638 g001
Figure 2. Variation in the dimensionless overtopping discharge versus relative freeboard.
Jmse 11 00638 g002
Figure 3. Variation in the dimensionless overtopping discharge versus ratio of the water depth at the toe and the deep-water wave height (relative water depth).
Jmse 11 00638 g003
Figure 4. Variation in the dimensionless overtopping discharge versus (a) the deep-water steepness and (b) the wave steepness at the dike toe.
Jmse 11 00638 g004aJmse 11 00638 g004b
Figure 5. Variation in the dimensionless overtopping discharge versus the ratio of IG wave height to SS wave height at the toe of the structure.
Jmse 11 00638 g005
Figure 6. Wave overtopping data and prediction using the Van Gent [12] equations in EurOtop [20] with 5% upper and lower exceedance limits.
Jmse 11 00638 g006
Figure 7. Ratio of dimensionless predicted by Van Gent [12] to measured overtopping discharge versus the relative water depth.
Jmse 11 00638 g007
Figure 8. Measured versus predicted nondimensional overtopping discharge using the Goda [9] formula (solid line: prediction equal to measured rate; dashed lines: prediction equal to 10 times higher and lower than the measured rate).
Jmse 11 00638 g008
Figure 9. Ratio of dimensionless predicted by Goda [9] to measured overtopping discharge versus the relative water depth.
Jmse 11 00638 g009
Figure 10. Wave overtopping data and prediction using the Altomare et al. [2] approach in EurOtop [3] with 5% upper and lower exceedance limits.
Jmse 11 00638 g010
Figure 11. Ratio of dimensionless predicted by Altomare et al. [2] to measured overtopping discharge versus the relative water depth.
Jmse 11 00638 g011
Figure 12. Ratio of dimensionless predicted (Van Gent [12] with equivalent slope approach) to measured overtopping discharge versus the relative water depth.
Jmse 11 00638 g012
Figure 13. Measured versus predicted nondimensional overtopping discharge (by deep-water wave height) using the Lashley et al. [7] formula (solid line: prediction equal to measured rate; dashed lines: prediction equal to 10 times higher and lower than the measured rate).
Jmse 11 00638 g013
Figure 14. Ratio of dimensionless predicted by Lashley et al. [7] to measured overtopping discharge versus the relative water depth.
Jmse 11 00638 g014
Table 1. Test matrix of the UGent dataset with the target hydrodynamic conditions, with 2nd-order generated irregular waves.
Test IDho
(m)
htoe
(m)
Rc
(m)
Hm0,o
(m)
Top
(s)
Scale1:251:351:251:351:251:351:251:351:251:35
RS010.650.4670.0120.0090.080.0570.200.1432.402.03
RS020.650.4670.0120.0090.080.0570.200.1432.001.69
RS030.650.4670.0120.0090.080.0570.200.1431.601.35
RS050.650.4670.0120.0090.080.0570.080.0572.402.03
RS060.690.4950.0520.0370.040.0290.200.1432.402.03
RS070.690.4950.0520.0370.040.0290.200.1432.001.69
RS080.690.4950.0520.0370.040.0290.200.1431.601.35
RS090.690.4950.0520.0370.040.0290.120.0861.601.35
RS100.690.4950.0520.0370.040.0290.120.0862.402.03
RS110.690.4950.0520.0370.040.0290.080.0572.402.03
RS120.690.4950.0520.0370.040.0290.060.0432.402.03
RS130.690.4950.0520.0370.040.0290.040.0292.402.03
Table 2. Characteristics of the UGent dataset, grouped per foreshore slope.
Dataset IDcot mcot αFroude ScaleHm0,toe (m)Tm−1,0 (s)Rc (m)htoe/Hm0,oNo. of Tests
UG202021:250.031–0.0692.014–6.0310.040, 0.0800.062–1.31812
UG353521:250.029–0.0592.921–8.7390.040, 0.0800.060–1.28515
UG505021:250.024–0.0492.728–9.5410.040, 0.0800.061–1.30515
UG50*5021:350.018–0.0433.015–9.7450.029, 0.0570.073–1.35612
UG808021:350.017–0.0363.164–10.3200.029, 0.0570.058–1.26312
Table 3. Characteristics of the datasets selected from the CLASH database.
Dataset IDcot mcot αHm0,toe (m)Tm−1,0 (s)Rc (m)htoe/Hm0,oNo. of Tests
CLASH 226100, 2502.5, 40.045–0.1032.45–4.580.160–0.3100.648–1.34324
CLASH 2271003, 4, 60.039–0.1192.41–10.640.066–0.3660.306–1.35144
CLASH 22110040.1052.6090.2101.5001
CLASH 4220, 502, 40.111–0.1533.167–3.6470.100–0.3000.957–3.4486
Table 4. Results of prediction performance of existing empirical formulas related to wave overtopping at a dike on shallow foreshores. In the No. of tests, the number between parentheses is the amount of tests that fall within the applicability range of Lashley et al. [7].
Van Gent (1999)Goda (2009)Van Gent (1999) with Equivalent SlopeAltomare et al. (2016) in EurOtop (2018)Lashley et al. (2021)
Dataset IDNo. of TestsGeoGSDGeoGSDGeoGSDGeoGSDGeoGSD
CLASH 22624 (21)0.6842.0810.9971.9520.6842.0810.9212.0811.0141.488
CLASH 22744 (29)0.8601.8540.6941.9830.7381.6200.9931.6200.1503.843
CLASH 2211 (0)0.5591.0000.7701.0000.5591.0000.7521.000N/AN/A
CLASH 426 (2)0.3962.0470.4331.8870.3771.9720.5071.9720.1971.629
UG2012 (11)0.9831.5551.3122.3050.4701.3200.6331.3202.4661.749
UG3515 (14)2.0042.2721.8403.0480.5681.2530.7641.2532.8772.136
UG5015 (14)3.7485.6702.1595.0560.5501.2050.7401.2055.4094.253
UG50*12 (11)2.7642.6781.8332.8220.6711.2970.9041.2973.1792.524
UG8012 (8)3.5814.1501.6133.0731.0591.1131.4261.1134.0143.305
TOTAL141 (119)1.2593.1661.1082.8850.6491.6630.8731.6630.9765.850
Disclaimer/Publisher’s Note: The statements, opinions and data contained in all publications are solely those of the individual author(s) and contributor(s) and not of MDPI and/or the editor(s). MDPI and/or the editor(s) disclaim responsibility for any injury to people or property resulting from any ideas, methods, instructions or products referred to in the content.

