Article

Non-Hydrostatic Modelling of Coastal Flooding in Port Environments

1
Flanders Hydraulics Research, 2140 Antwerp, Belgium
2
Faculty of Civil Engineering and Geosciences, Delft University of Technology, 2628 CN Delft, The Netherlands
3
Maritime Engineering Laboratory, Universitat Politècnica de Catalunya-BarcelonaTech, 08034 Barcelona, Spain
*
Author to whom correspondence should be addressed.
J. Mar. Sci. Eng. 2023, 11(3), 575; https://doi.org/10.3390/jmse11030575
Submission received: 27 January 2023 / Revised: 27 February 2023 / Accepted: 6 March 2023 / Published: 7 March 2023
(This article belongs to the Special Issue Wave Interactions with Coastal Structures II)

Abstract

:
Understanding key flooding processes such as wave overtopping and overflow (i.e., water flows over a structure when the crest level of the structure is lower than the water level in front) is crucial for coastal management and coastal safety assessment. In port and harbour environments, waves are not only perpendicular to the coastal structure but also very oblique, with wavefronts almost perpendicular to the main infrastructures in the harbour docks. Propagation and wave–structure interaction of such perpendicular and (very) oblique waves need to be appropriately modelled to estimate wave overtopping properly. Overflow can also be critical for estimating flooding behind any coastal defence. In this study, such oblique and parallel waves (i.e., main wave direction is parallel to the structures) are modelled in a non-hydrostatic wave model and validated with physical model tests in the literature. On top, overflow is also modelled and validated using an existing empirical formula. The model gives convincing behaviours on the wave overtopping and overflow.

1. Introduction

Flooding risk in coastal areas is increasing due to ongoing sea level rise [1,2]. Wave overtopping and overflow are key processes for coastal flooding and influence the safety of people and economic losses inland. For sustainable coastal management, it is essential to predict wave overtopping and overflow based on sea level rise scenarios.
In ports and harbours, offshore waves enter from the openings of ports, and the waves propagate inside the harbour basins. Overflow occurs when the water level rises above the structure level, while wave overtopping occurs when the crest of the waves or the runup exceeds the level of the structures. Much knowledge is available in the literature on wave overtopping and overflow (e.g., in EurOtop [3]). However, many cases are still out of the applicable range in reality. For example, wave overtopping over a vertical wall (i.e., a quay wall) cannot be estimated when there is a storm wall inland (i.e., a storm wall with a berm on a quay) using existing formulas. It is noted that such configurations are not exceptional, as storm walls are often constructed on quay walls to protect the hinterland as a countermeasure for wave overtopping and overflow. The locations of such storm walls depend on the area to be protected; therefore, the berm width (i.e., the distance between the vertical quay and the storm wall) can be broad. Another example is very oblique wave cases. When the wave directions are very oblique to the structures, even in the extreme case of the primary wave direction being parallel to the structure, the knowledge is limited, excepting some recent studies [4,5]. Dan et al. [4] conducted physical model tests in a wave basin to characterise wave overtopping over sloping dikes and quay walls in combination with storm walls under long-crested very oblique waves and associated forces acting on the storm walls. van Gent [5] investigated the influence of obliqueness on wave overtopping over caisson breakwaters and proposed the gamma factors applicable to vertical structures with and without parapets for short-crested and long-crested waves. The hydraulic boundary conditions (e.g., significant wave height and peak wave period) in ports and harbours range widely, including with different wave angles. The wave direction does not always show a single peak, but can be multiple if the wave reflections from the adjacent quays and dikes inside ports and harbours are dominant. The frequency spectrum can also possess two peaks due to the combination of swell and locally generated wind waves. As such, various geometrical and hydraulic conditions make it even more challenging to estimate wave overtopping discharge precisely over the coastal structures inside ports and harbours.
Under such circumstances, physical models and numerical models play essential roles. A physical model can provide data on the wave overtopping over the target structures. However, modelling a detailed 3D structure and execution of the test usually costs more than using numerical models. A typical use of numerical models for such port and harbour applications is to first estimate the hydraulic boundary conditions along the quays. Consequently, the wave overtopping discharge is calculated based on the empirical equations in combination with the estimated hydraulic boundary conditions. However, as mentioned above, suitable empirical equations are not always available due to the complexity of the structure. On top, the hydraulic boundary conditions cannot always be described by a simple combination of wave properties (e.g., multiple peaked spectra, both for frequency and directional domain inside the port, as described above). Furthermore, the number of applicable wave models is somewhat limited due to the high computational load for such 3D problems. High-end models, for instance, OpenFOAM [6] and SPH-based models [7,8], cannot deal with such problems, because the computational time can be too demanding. On the other hand, phase-averaged wave models such as SWAN [9] or Tomawac [10] are not the best options because the diffraction inside ports cannot be calculated directly based on the governing equations. It must be noted that wave diffraction can be modelled in a simplified manner using a phase-decoupled refraction–diffraction approach such as that proposed by Holthuijsen et al. [11]. Instead, Boussinesq models such as Mike21BW [12,13] and FUNWAVE [14] have often been used to obtain hydraulic boundary conditions, and these models will help estimate hydraulic boundary conditions in port environments. As an option, non-hydrostatic wave models, such as SWASH [15], can also be used for port applications.
This study investigates the applicability of the non-hydrostatic model SWASH [15] for wave overtopping estimation in port environments. Special attention is given to very oblique and parallel waves over port banks (i.e., quays and sloping dikes) with storm walls. On top, the applicability of SWASH for the overflow is investigated, as it is an essential application. To this end, relevant physical model tests conducted in the past (Dan et al. [4], Willems et al. [16]) and empirical formulas are used for the model validation.

2. Methods

2.1. Numerical Model

SWASH is a wave-flow model based on a Non-Linear Shallow Water equation with non-hydrostatic pressure terms. The model can be run either in 1D mode (flume-like) or 2D mode (basin-like) for the horizontal domain and in depth-averaged mode or multi-layer mode for the vertical domain. It is possible to maintain frequency dispersion by increasing the number of layers instead of increasing the order of derivatives of the dependent variables like the Boussinesq models. Wave breaking is controlled by HFA (hydrostatic front approximation [17]) when the number of vertical layers is limited. On top, it preserves nonlinear wave properties such as asymmetry and skewness. For more details, see [15]. Since the first version of SWASH was released in 2011, the number of applications of SWASH has been increasing, as can be seen in the literature; these are not limited to traditional wave propagation and coastal structure interaction (e.g., breakwater), but also include interaction with ships [18], infragravity waves [19], overtopping in shallow foreshores [20], internal wave generation [21] and interaction with vegetation [22,23].
SWASH maintains a good accuracy of wave transformation and overtopping for coastal applications and is not too computationally demanding. Once the model has been validated for wave overtopping estimation over quays, the application range will be widened. As mentioned, SWASH is computationally less demanding, and thus it is useful for engineering applications. The drawback of SWASH is that it cannot deal with complex structures, such as parapets and overhanging structures, due to the nature of the depth-integrated model. On such occasions, detailed wave modelling using RANS models [24] or SPH models [8,25] can be coupled with SWASH to solve the problem [26,27].

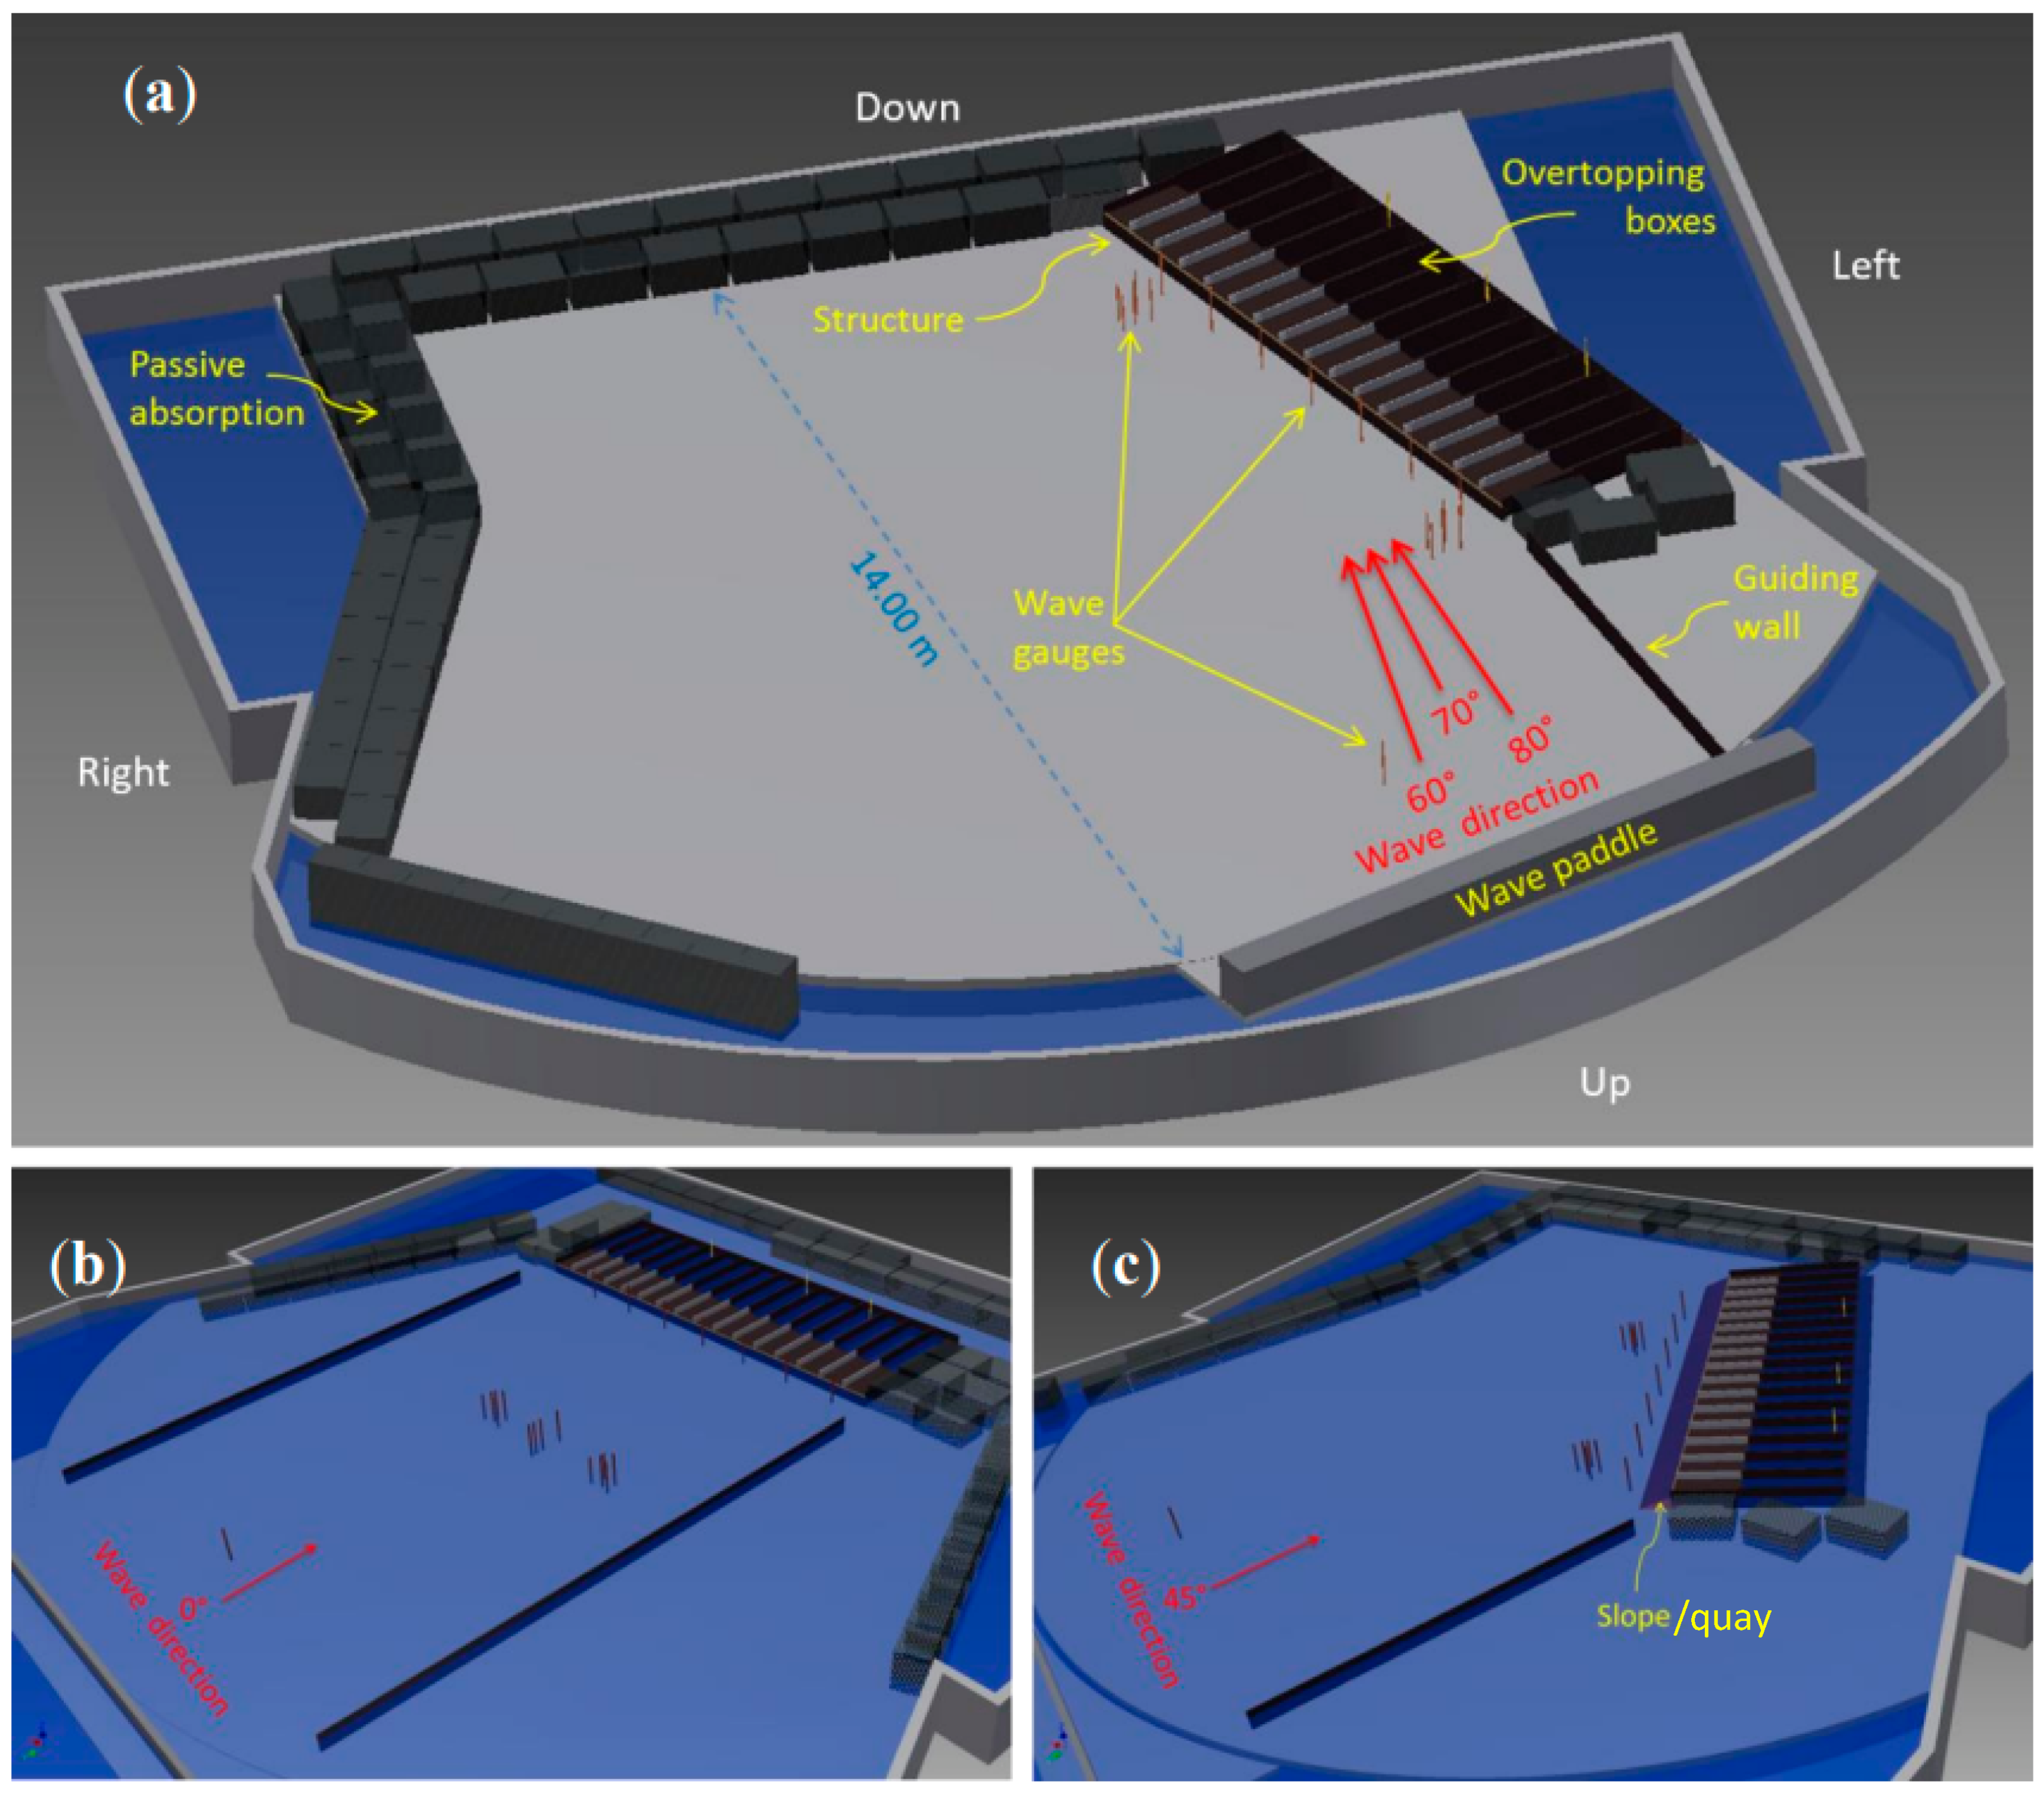
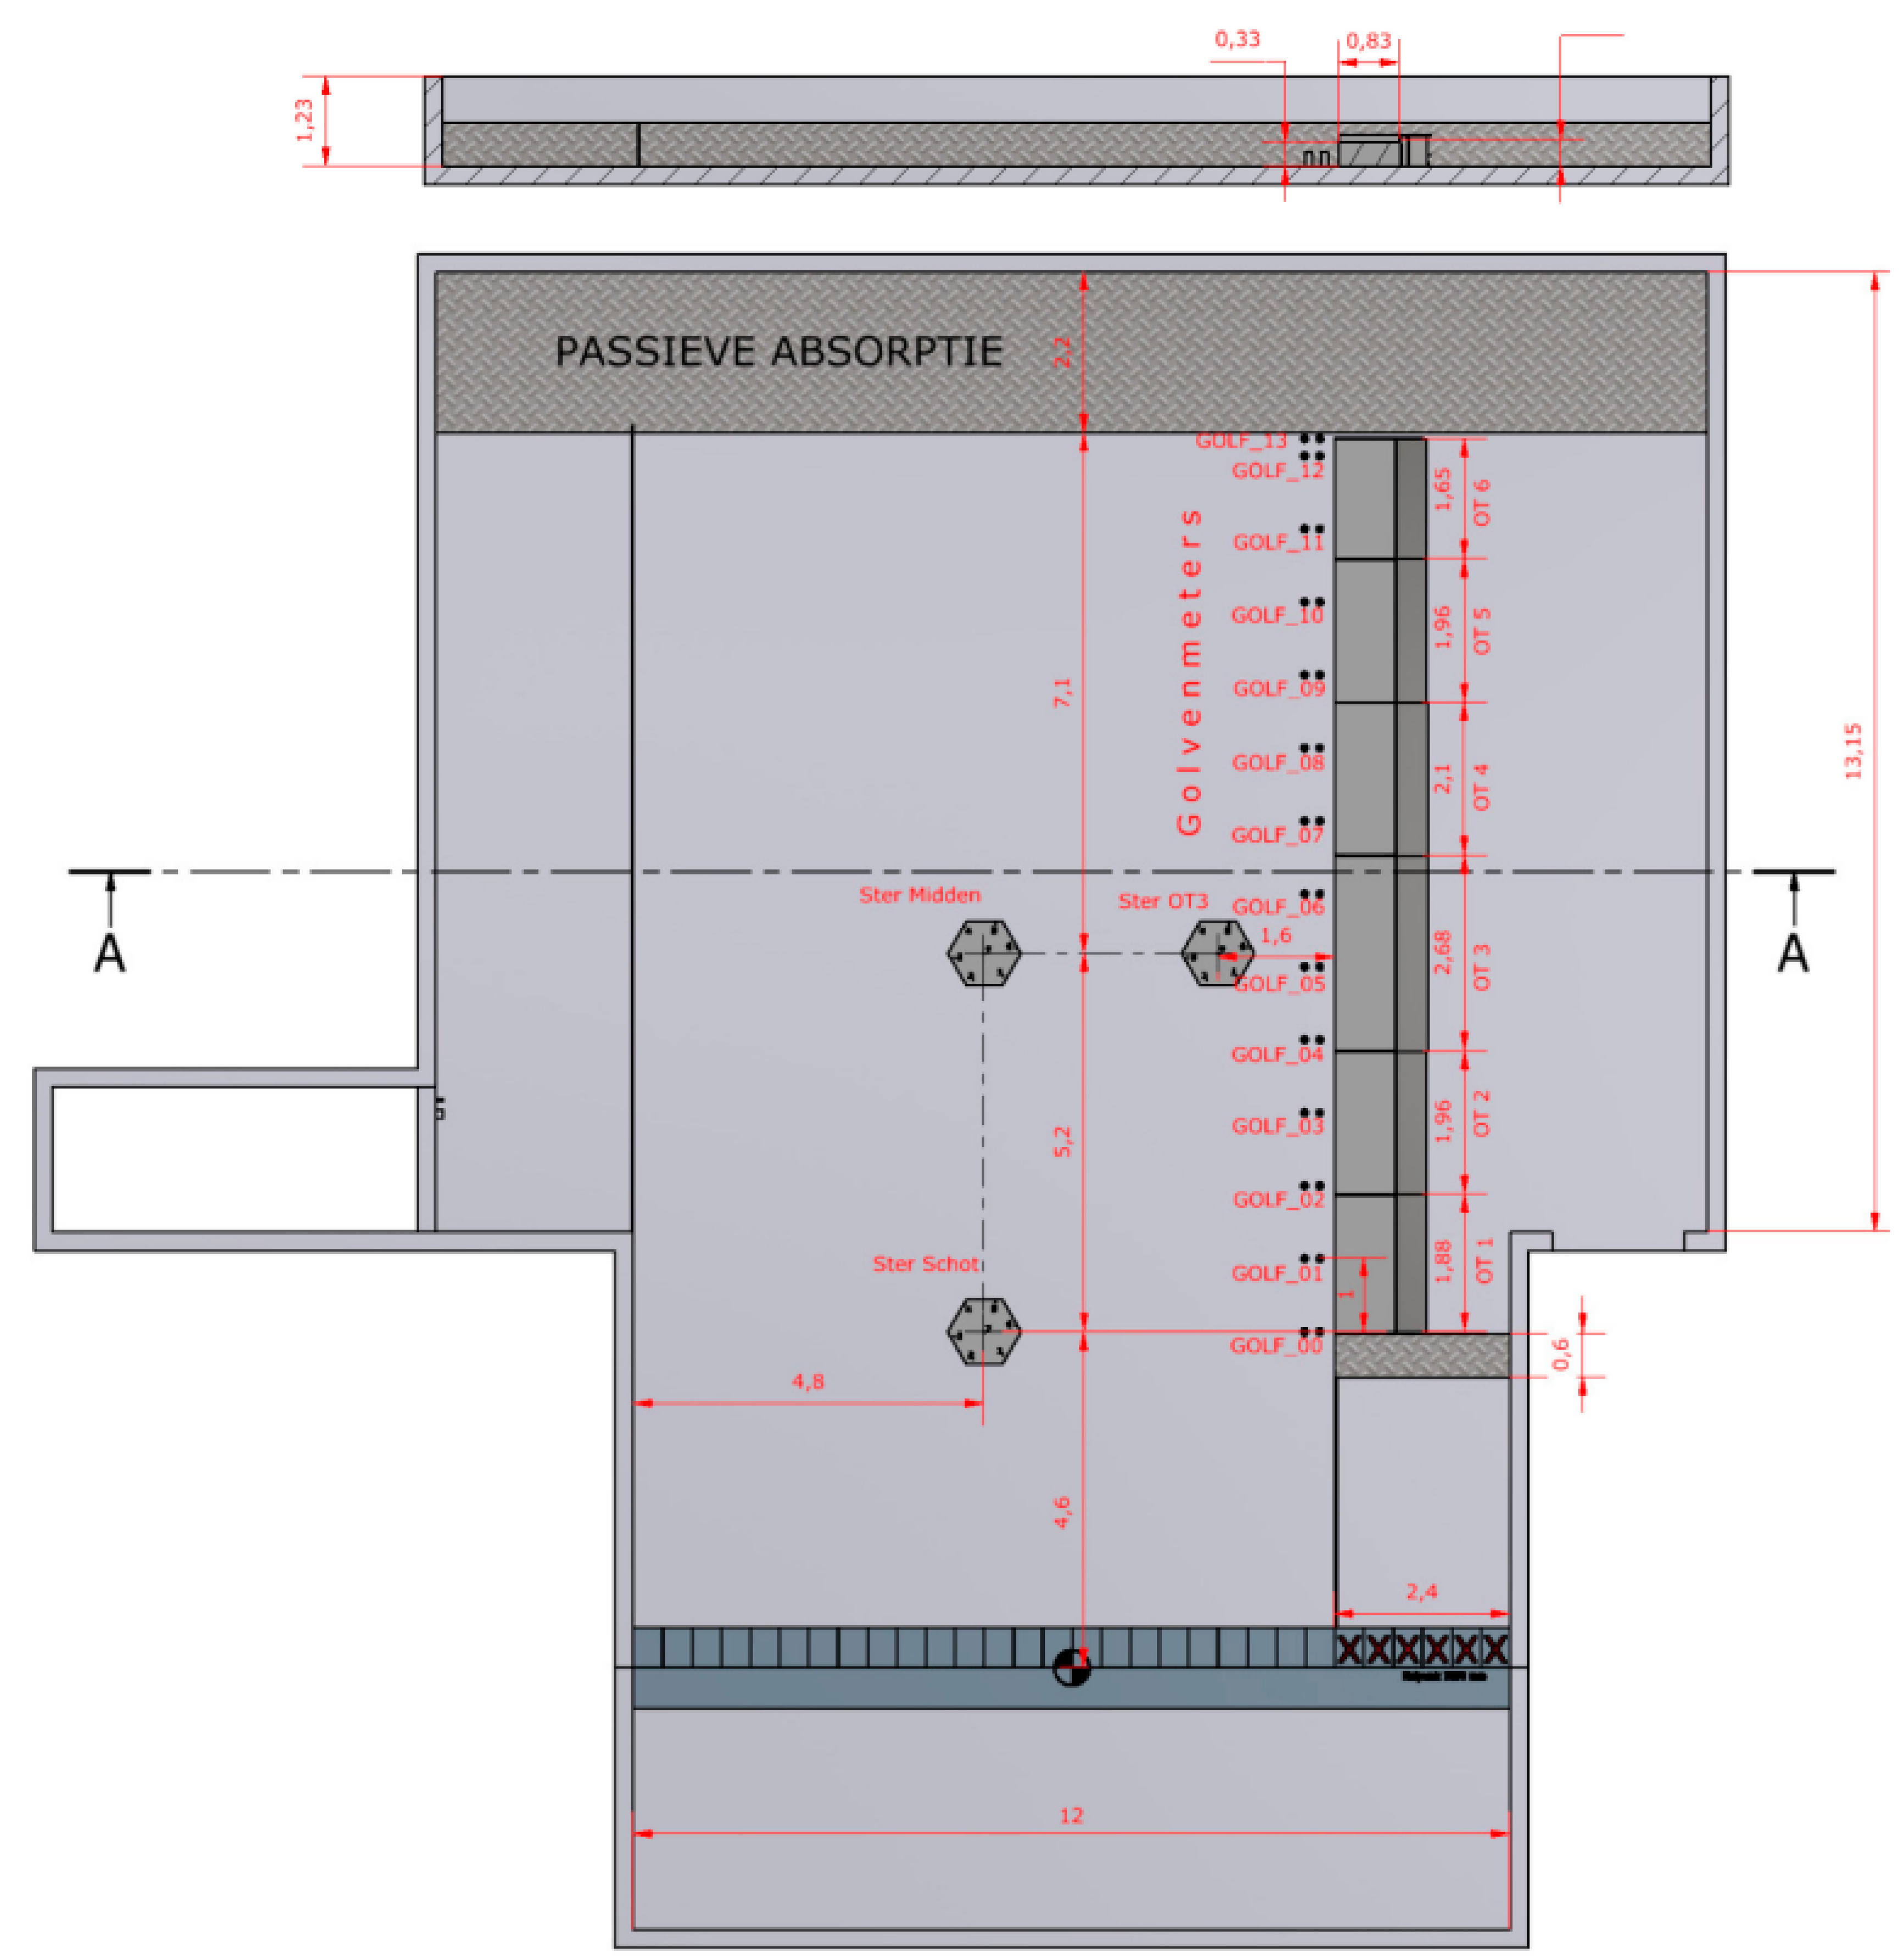
2.2. Physical Models

Data sets from two physical model campaigns were selected (Dan et al. [4], Willems et al. [16]) for validation. Both physical model campaigns were conducted in Flanders Hydraulics Research, Belgium. Dan et al. [4] used the wave basin with the uni-directional wave maker to measure perpendicular and (very) oblique wave overtopping over a dike/quay with storm walls (the long-crested wave angle ranges from 0 to 80 degrees, where 0 degrees is perpendicular to the structure), see Figure 1. The generated waves were long-crested and irregular waves based on the JONSWAP spectrum, with a peak enhancement factor of 3.3. The incident wave properties were measured at the upstream side of the structure. For further details, see Dan et al. [4]. The scale factor was 1 in 50. Willems et al. [16] used a wave basin with the multi-directional wave maker to measure parallel wave overtopping (i.e., the short-crested waves with the main direction of 90 degrees to the structure) over a quay wall with storm walls on top; see the overview of the wave basin setting in Figure 2. The scale factor was 1 in 48. The multi-directional wave maker is 12 m in width in total, with 30 piston paddles (0.4 m each). The wave maker equipped with super-harmonic second-order wave generation and active wave absorption can generate regular and irregular long and short-crested waves. For more details on the wave maker and wave basin of Flanders Hydraulics Research, see [28]. It is noted that 24 paddles out of 30 were used for this physical model campaign, as shown in Figure 2, to generate short-crested waves with a one-sided directional spreading value of 17 degrees, and irregular waves based on JONSWAP spectrum with the peak enhancement factor of 3.3. A straight quay wall model of 12.3 m (590 m in prototype) was built in the wave basin. Six boxes (OT1-6; each box has a different width, ranging from 1.63 to 2.67 m) were placed behind the crest of the structure to collect the overtopping. An ultrasonic sensor was used to measure the water level inside each overtopping box. The average overtopping discharge was calculated based on the collected water volume. In total, 35 wave gauges were used to measure the wave field during the tests. It is noted that only one array consisting of seven wave gauges was used for the multi-wave directional analysis and 28 wave gauges (two gauges for 14 places, each one 0.208 m and 0.417 m in front of the structure, which are 10 m and 20 m in prototype, respectively) were analysed to obtain the wave properties in front of the structure. The location of the array was changed during the campaign. It is noted that the array data was not used in this paper. A passive wave absorption was placed at the end of the domain to minimize the influence of the reflected waves. All the tests were conducted with the active wave absorption. The post-processing was conducted using the Wavelab software package developed by Aarborg University. Willems et al. [16] reported the significant wave height obtained at GOLF_04, GOLF_05 and GOLF_06 (i.e., averaged value for Zone OT 3; ‘GOLF’ stands for wave gauge) as a representative significant wave height in their physical model campaign. In line with the significant wave height measurement, the wave overtopping discharge is determined by the overtopping measurement at OT3.
A total of 25 cases were selected for each validation based on Dan et al. [4], and Willems et al. [16]. Detailed information can be found in Table 1.

2.3. SWASH Model Settings

All the wave overtopping simulations are conducted in 3D (three-dimensional; multi-layer mode in combination with a horizontal domain) in prototype scale. As discussed in Dan et al. [4], the scale effects are limited, and therefore the physical model test results are upscaled to the prototype scale for comparison. It is useful to discuss the overtopping at prototype scale, since the characteristics of the discharge depend on the magnitude (e.g., standard deviation). The version of the model applied in this study is version 7.01. A model domain is created with the size of 700 m (x-direction) × 1000 m (y-direction) for the horizontal domain, see Figure 3. It is noted that the configuration (e.g., basin shape and size, quay wall length) is not the same as the physical model settings of Dan et al. [4] (i.e., mobile wave generator placed at 45–80°, 400 m straight quay) and Willems et al. [16] (i.e., fixed wave generator, 590 m straight quay). However, the numerical model can effectively reproduce the same/similar waves in the physical model tests. It was decided that the grid size would be 4 m both in the x- and y-directions in the prototype based on the grid convergence (see details in Section 3.1), taking into account model efficiency and stability. The threshold water level (DEPMIN) is 0.01 m for the prototype calculation, which increases the computational stability compared to the default value of 0.00005 m. The default BOTCEL function is applied here for simplicity and computational stability. Two equidistant layers are employed in the simulation to maintain frequency dispersion. The waves are generated from the offshore boundary, along the first grids of the x-direction for very oblique (i.e., 80 degrees) and parallel wave direction (i.e., 90 degrees) cases. Two offshore boundaries (i.e., along the x- and y-axes) are used by specifying the wave generation segments for the oblique waves (i.e., 45 degrees). JONSWAP spectrum with the gamma factor 3.3 is adopted for all cases. It is noted that a directional spreading of 17 degrees is applied to the case of Willems et al. [16], while a directional spreading of 0 degrees (i.e., long-crested waves) is applied to the case of Dan et al. [4]. A sponge layer with a width of 100 m is used at the end of the domain to dissipate the wave energy. Internal wave generation [21,29] is not used, since the reflection from the structure is very limited for very oblique and parallel wave cases. For the oblique wave cases, the reflection cannot be ignored, but the re-reflection from the offshore wave generation boundary has no influence on the overtopping geometrically. The momentum conservation is applied in the simulations. The Keller-box scheme is employed for the scheme for the vertical pressure gradient since the number of the vertical layer is two. ILU preconditioner is used for computational robustness. The standard first-order up-wind scheme is employed for the discretization of the vertical term for the w-momentum equation for stability, while other discretization uses MUSCL limiter to achieve second-order accuracy. Time integration is explicit, and a Courant number of 0.5 is used to cope with high and nonlinear waves used in this study. The Manning formula with a Manning coefficient of 0.012 is employed to represent bottom friction for the entire domain, taking into account that smooth concrete for the bottom and a Polyvinyl chloride for the structures were used in the physical models (Dan et al. [4]; Willems et al. [16]). Standard wave breaking control parameters, alpha = 0.6 and beta = 0.3, are used for wave breaking, and those values are also used in [20]. A total duration of 50 min is simulated. The wave properties for the wave generations in the models are based on representative incident wave properties from the physical model tests.
Incident wave properties obtained at the upstream 3D array are used as the input parameters at the wave generators in SWASH for the cases of Dan et al., while the significant wave heights modelled in SWASH (in front of the structure; average value from y = 200–800) are calibrated with the measured data for the cases of Willems et al. The accepted error of the wave height for the calibration is 5%. Different methods are adopted for Dan et al. and Willems et al. since these are most represented values used in their studies.
An overflow simulation is conducted in ‘2D’ at prototype scale. Here, 2D simulation means a simulation with the one-dimensional mode (simulation with a horizontal domain) in combination with multi-layers in the vertical direction in SWASH. The 2DV modelling is good enough for the overflow simulation since the overflow occurs in principle in the cross-section perpendicular to the structure. The domain of 2000 m is created to have enough space to avoid the influence of the boundary. The grid size is 4 m. The target water level is assigned at the offshore boundary and keeps it to the crest of the sloping dike structure, where the overflow is measured, while the water level behind the crest is kept dry (no water). Two wave gauges are placed to monitor the water level during the overflow. See details in Figure 4. The still water level is 17.43 m, and the crest level of the dike is 16.91 m in this case. A total duration of 12 min is simulated.

2.4. Post-Processing of SWASH Output

For the overtopping cases, SWASH outputs a time series of discharge at the selected locations, see Figure 3 (at the points on the crest of the structure). Only the x component of discharge is taken into account. A 50 min simulation is analysed to calculate wave overtopping discharge, corresponding to ~250 waves. The number of locations is eight, and equally distributed every 100 m (y = 200–800 m). The discharge time series is used to calculate the average overtopping discharge at each point first, and space averaged q is calculated from the eight average overtopping discharges.
In the case of overflow, the discharge is measured at the crest of the dike. The last 2 min (out of the 12 min simulation) is analysed to calculate overflow discharge, where the flow system becomes stable.

3. Results

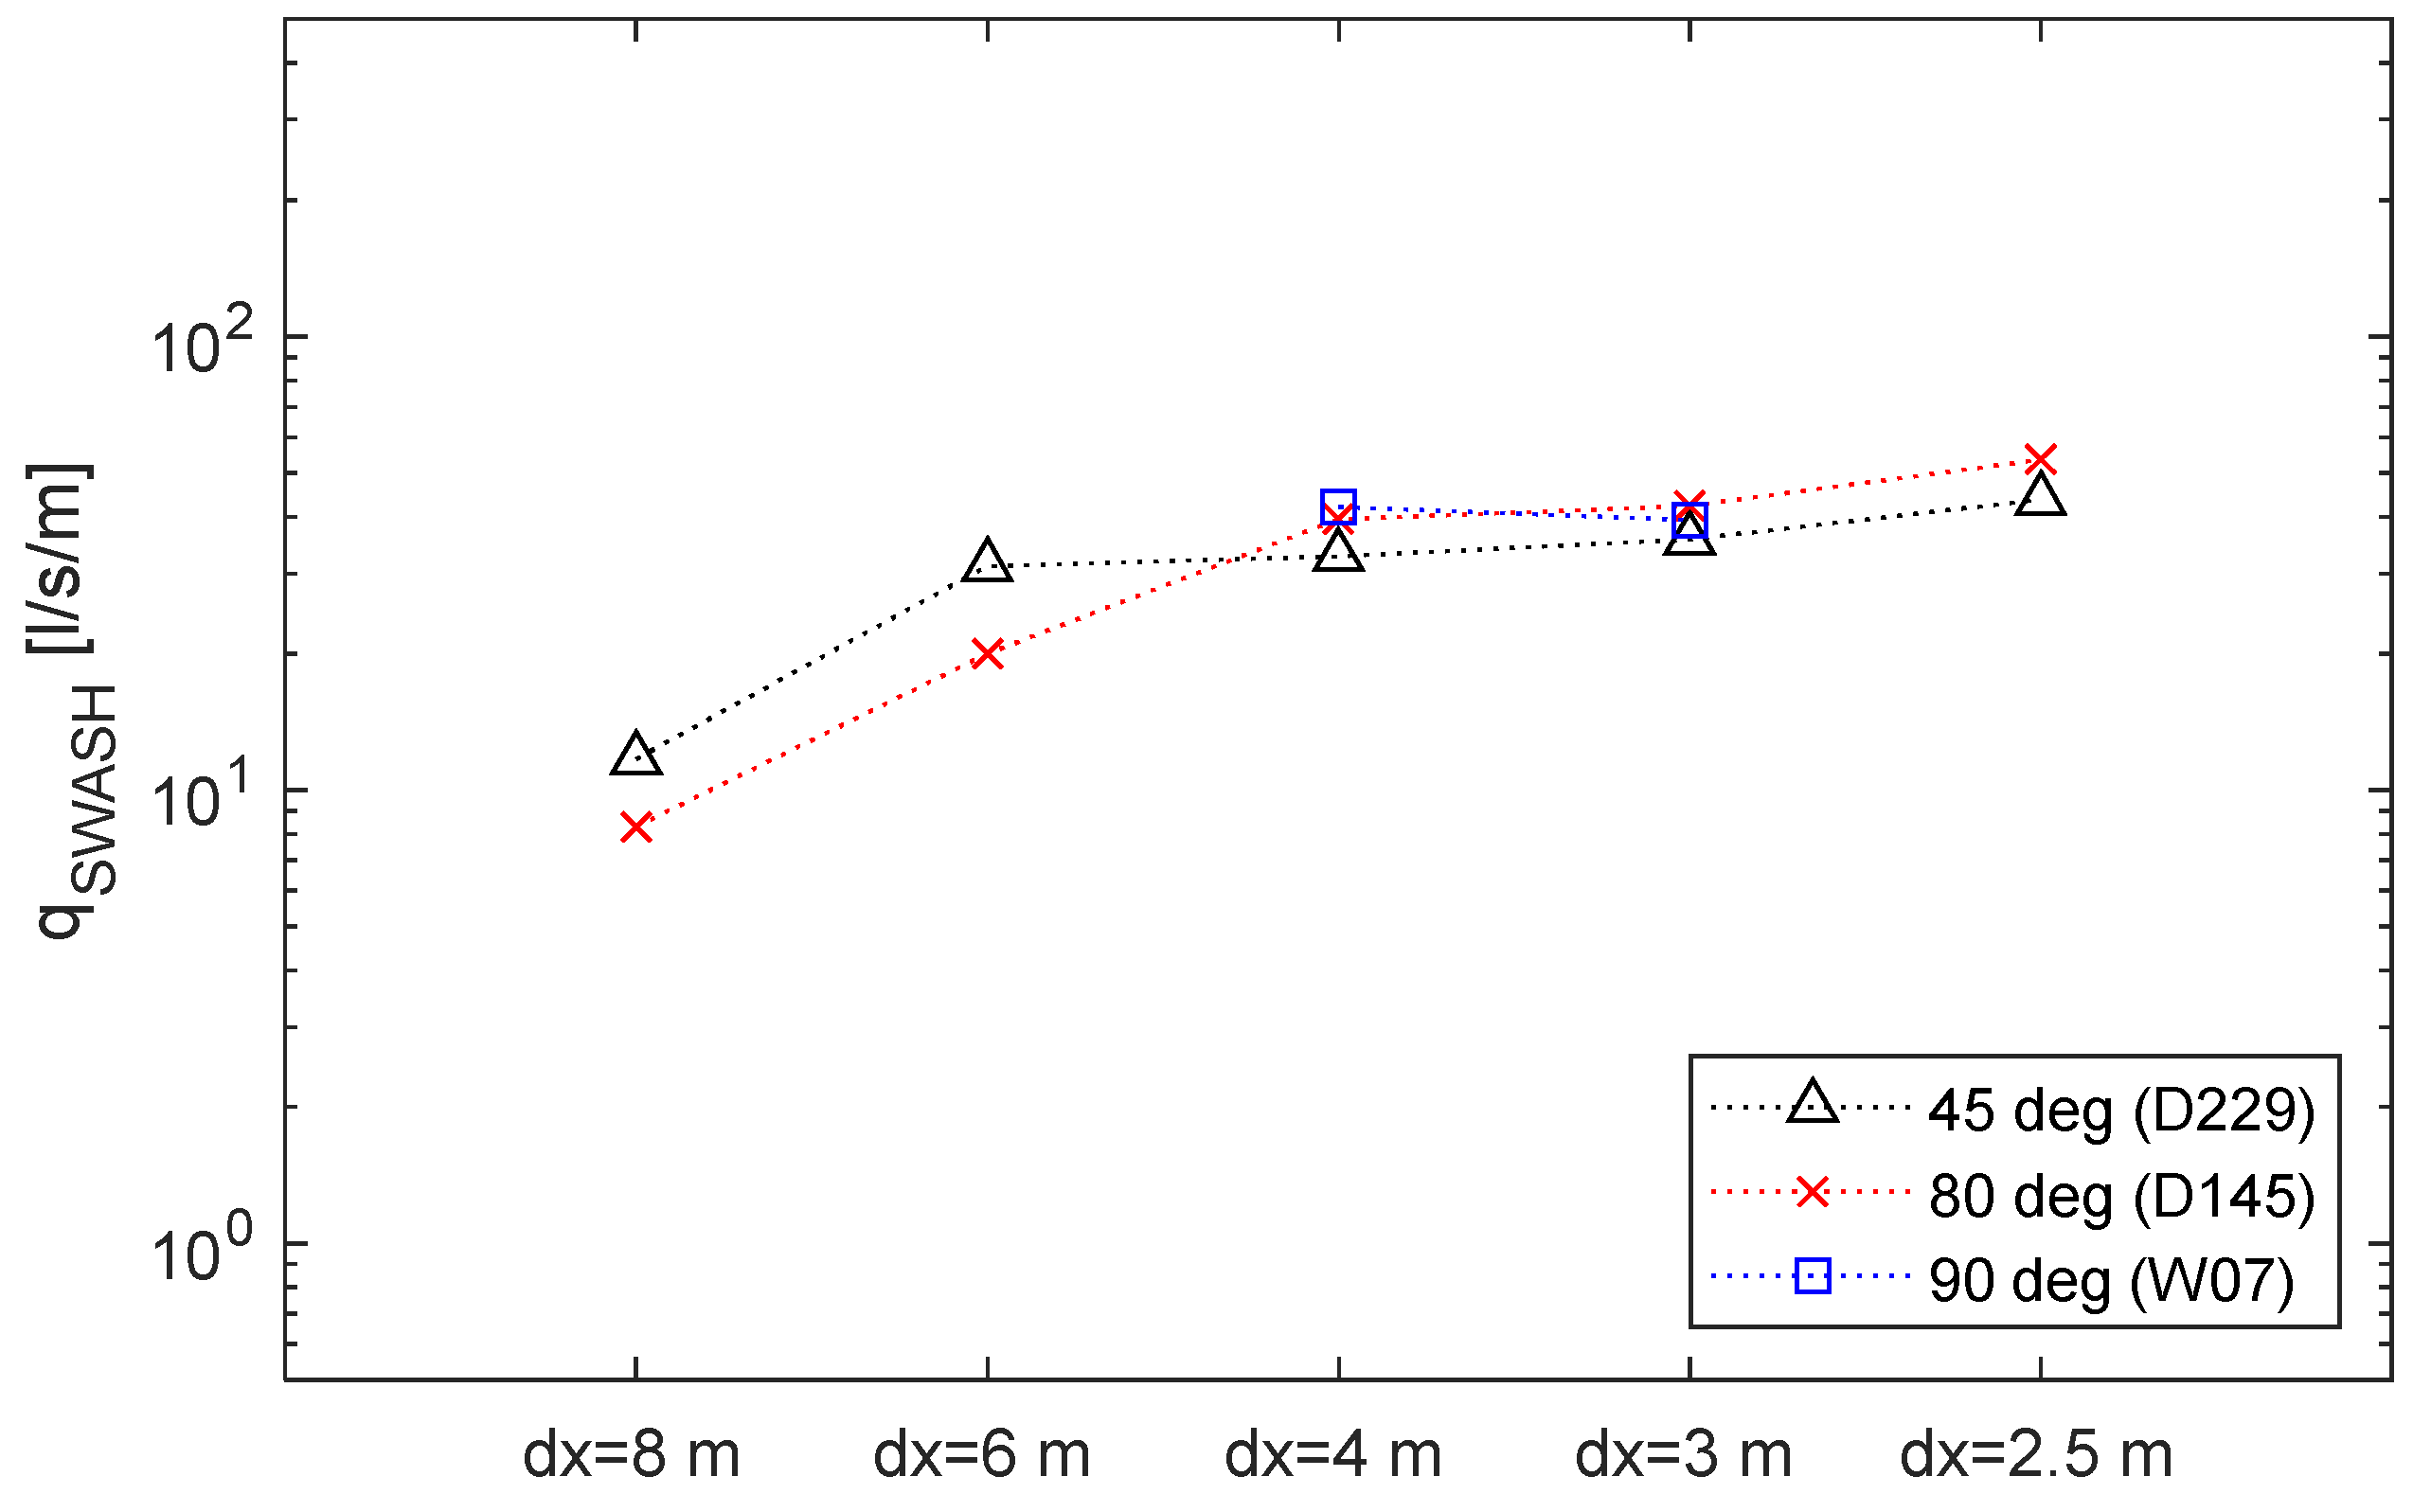
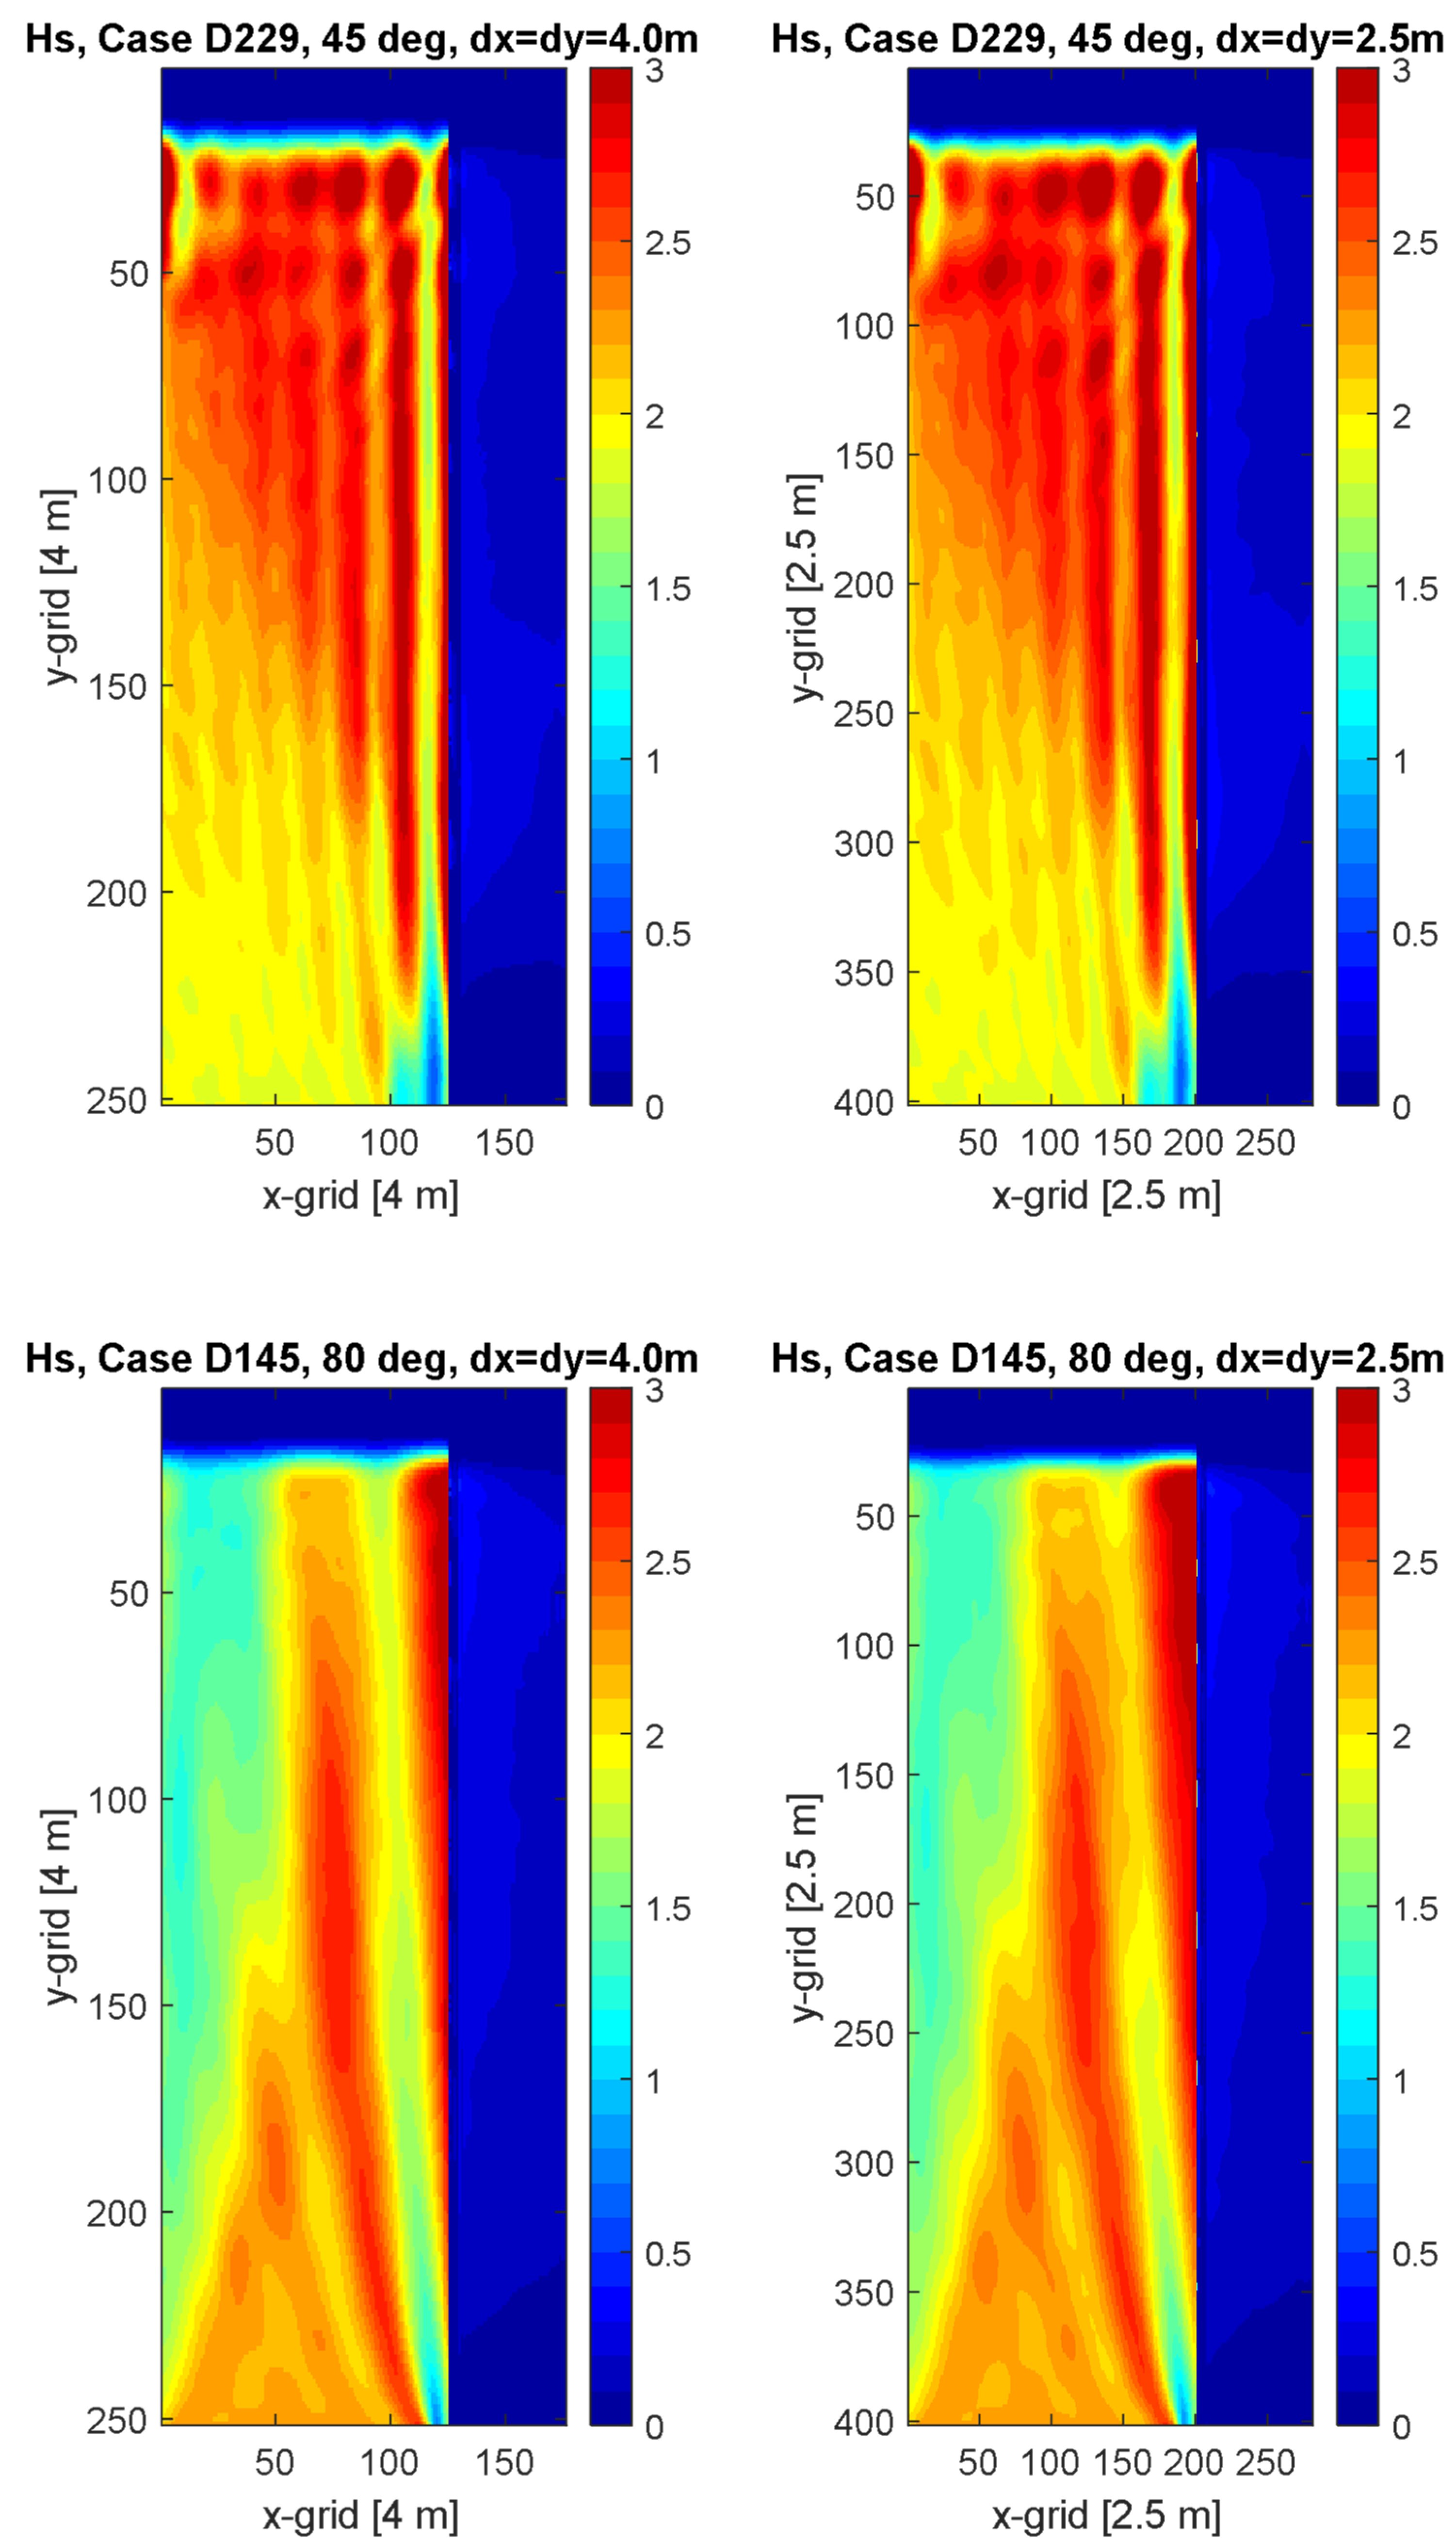
3.1. Sensitivity of Grid Size

Prior to validation, the sensitivity of the grid size is investigated, since the performance of the model, in principle, depends on the grid size. An optimum grid size needs to be explored for the sake of maintaining the reliability and feasibility of the model. Figure 5 shows the relationship between the simulated wave overtopping discharge and the grid size for cases D229, D145 and W07 (see the condition of the cases in Table 1). It is noted that the grid size is uniform for the entire domain (dy is the same size as dx). As can be seen, the overtopping discharges are saturated when dx is equal to 4 m (Lo/dx~50). Figure 6 shows the spatial distribution of significant wave heights for the case of D229 and D145. The spatial distribution of the significant wave heights is qualitatively the same.

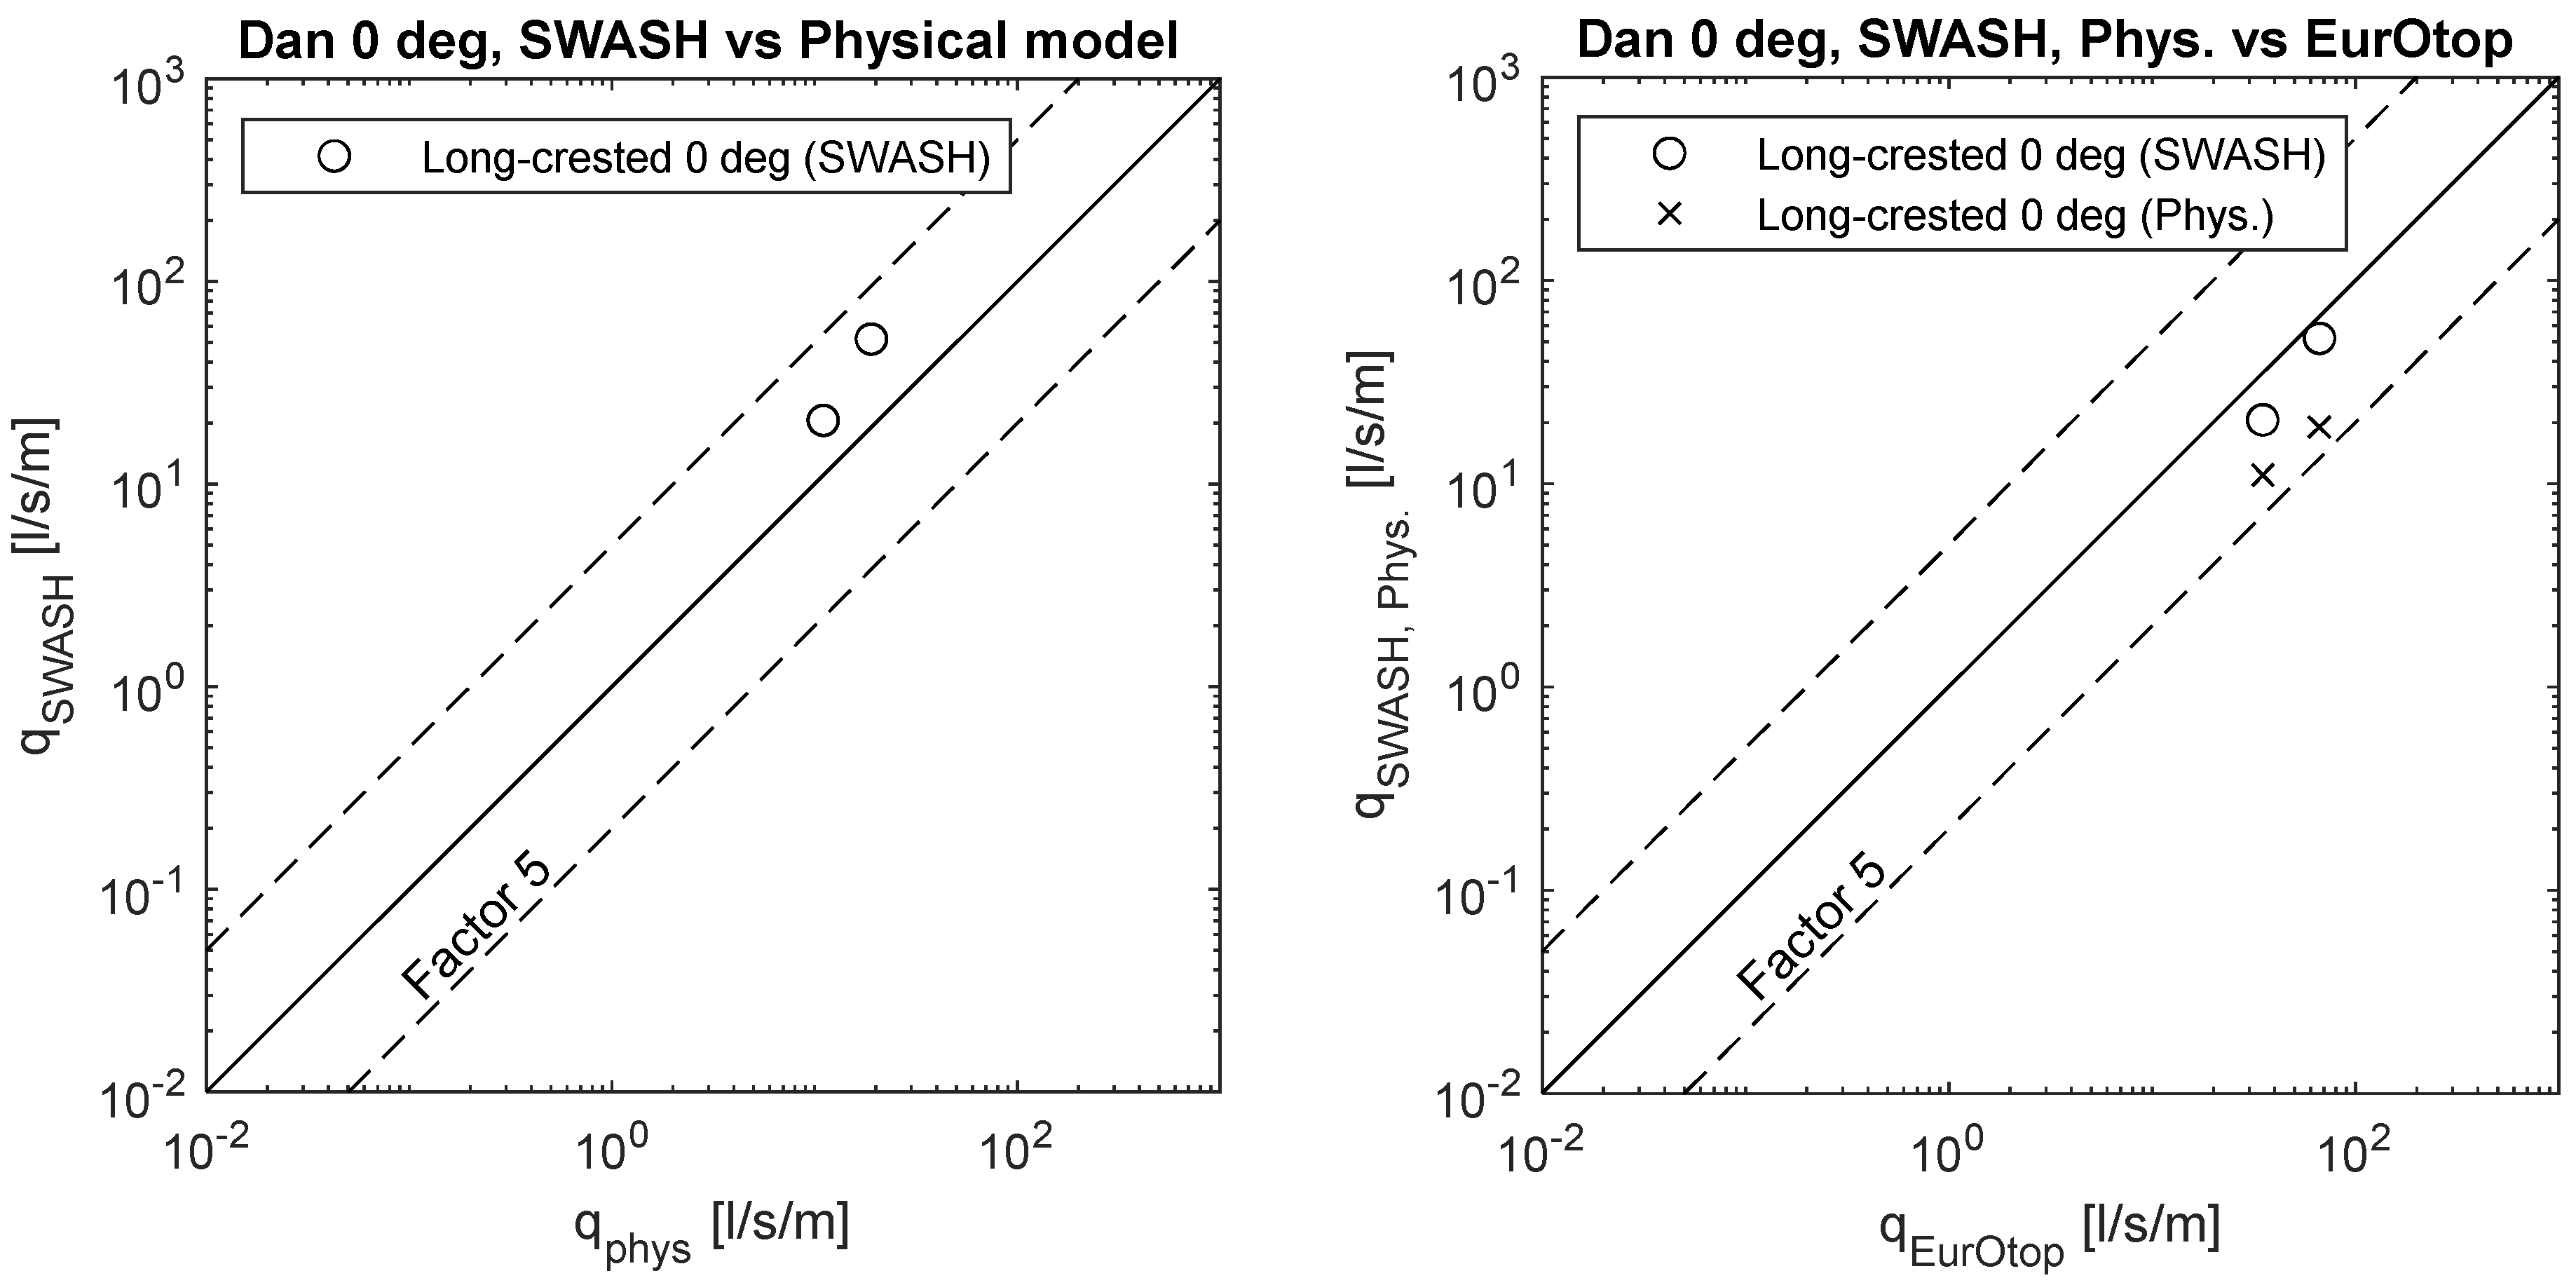
3.2. Control Case—Overtopping over a Quay Wall without a Storm Wall

Before validating wave overtopping for (very) oblique and parallel waves over the port banks, a simple wave overtopping case, namely long-crested perpendicular waves over a quay without a storm wall, is tested (Case D343 and D344). The same settings are used for SWASH, and the waves are generated from the west boundary (along the y-axis).
The results are shown in Figure 7. As can be seen, the overtopping discharge was estimated inside a range of a factor 5 line against the physical model and also EurOtop. The right figure also compares the physical model result with EurOtop—this indicates that the physical model results give slightly lower values compared to the empirical estimation while they are still inside the factor 5 line. In overtopping estimation, estimation quality is good when the estimated value is within factor 3 (e.g., Ref. [20]) compared to the physical model test results. Factor 5 is still a reasonable estimation, seeing the scatter in [3,30,31]. In this case, SWASH results are always within factor 3 compared to both physical model and EurOtop. Based on this observation, it can be concluded that the SWASH model is capable of reproducing overtopping discharge for the simple quay geometry.

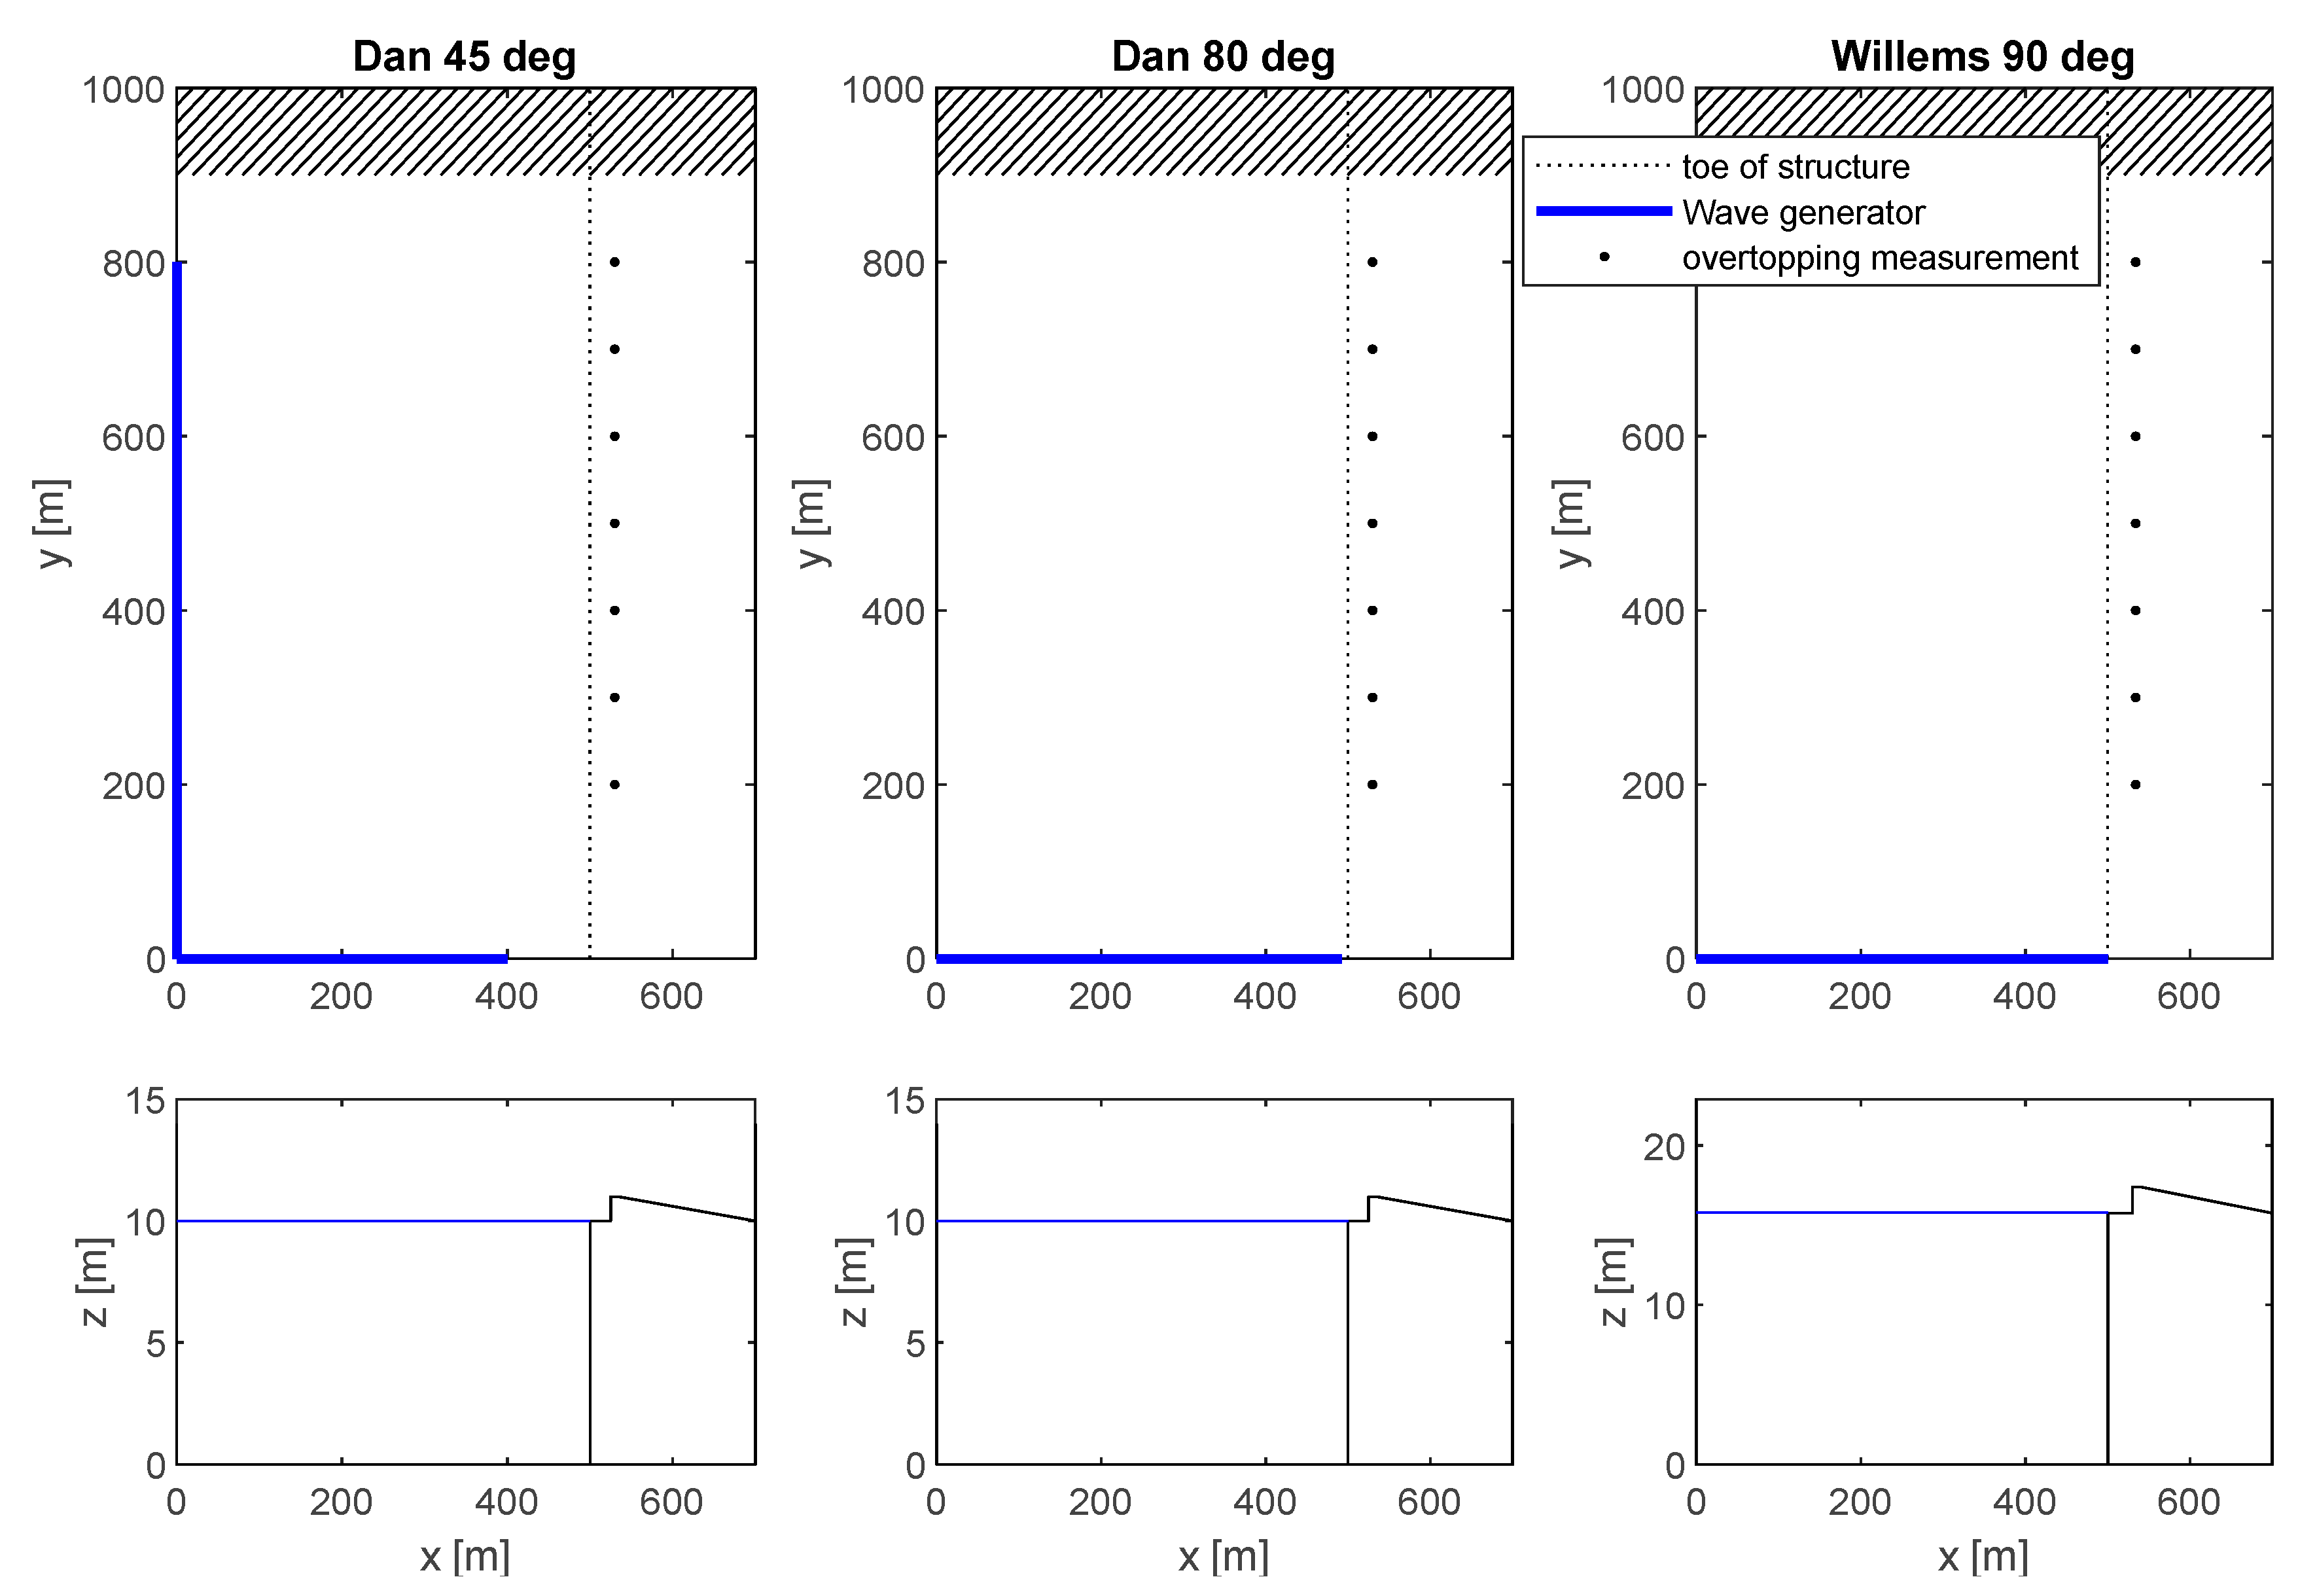
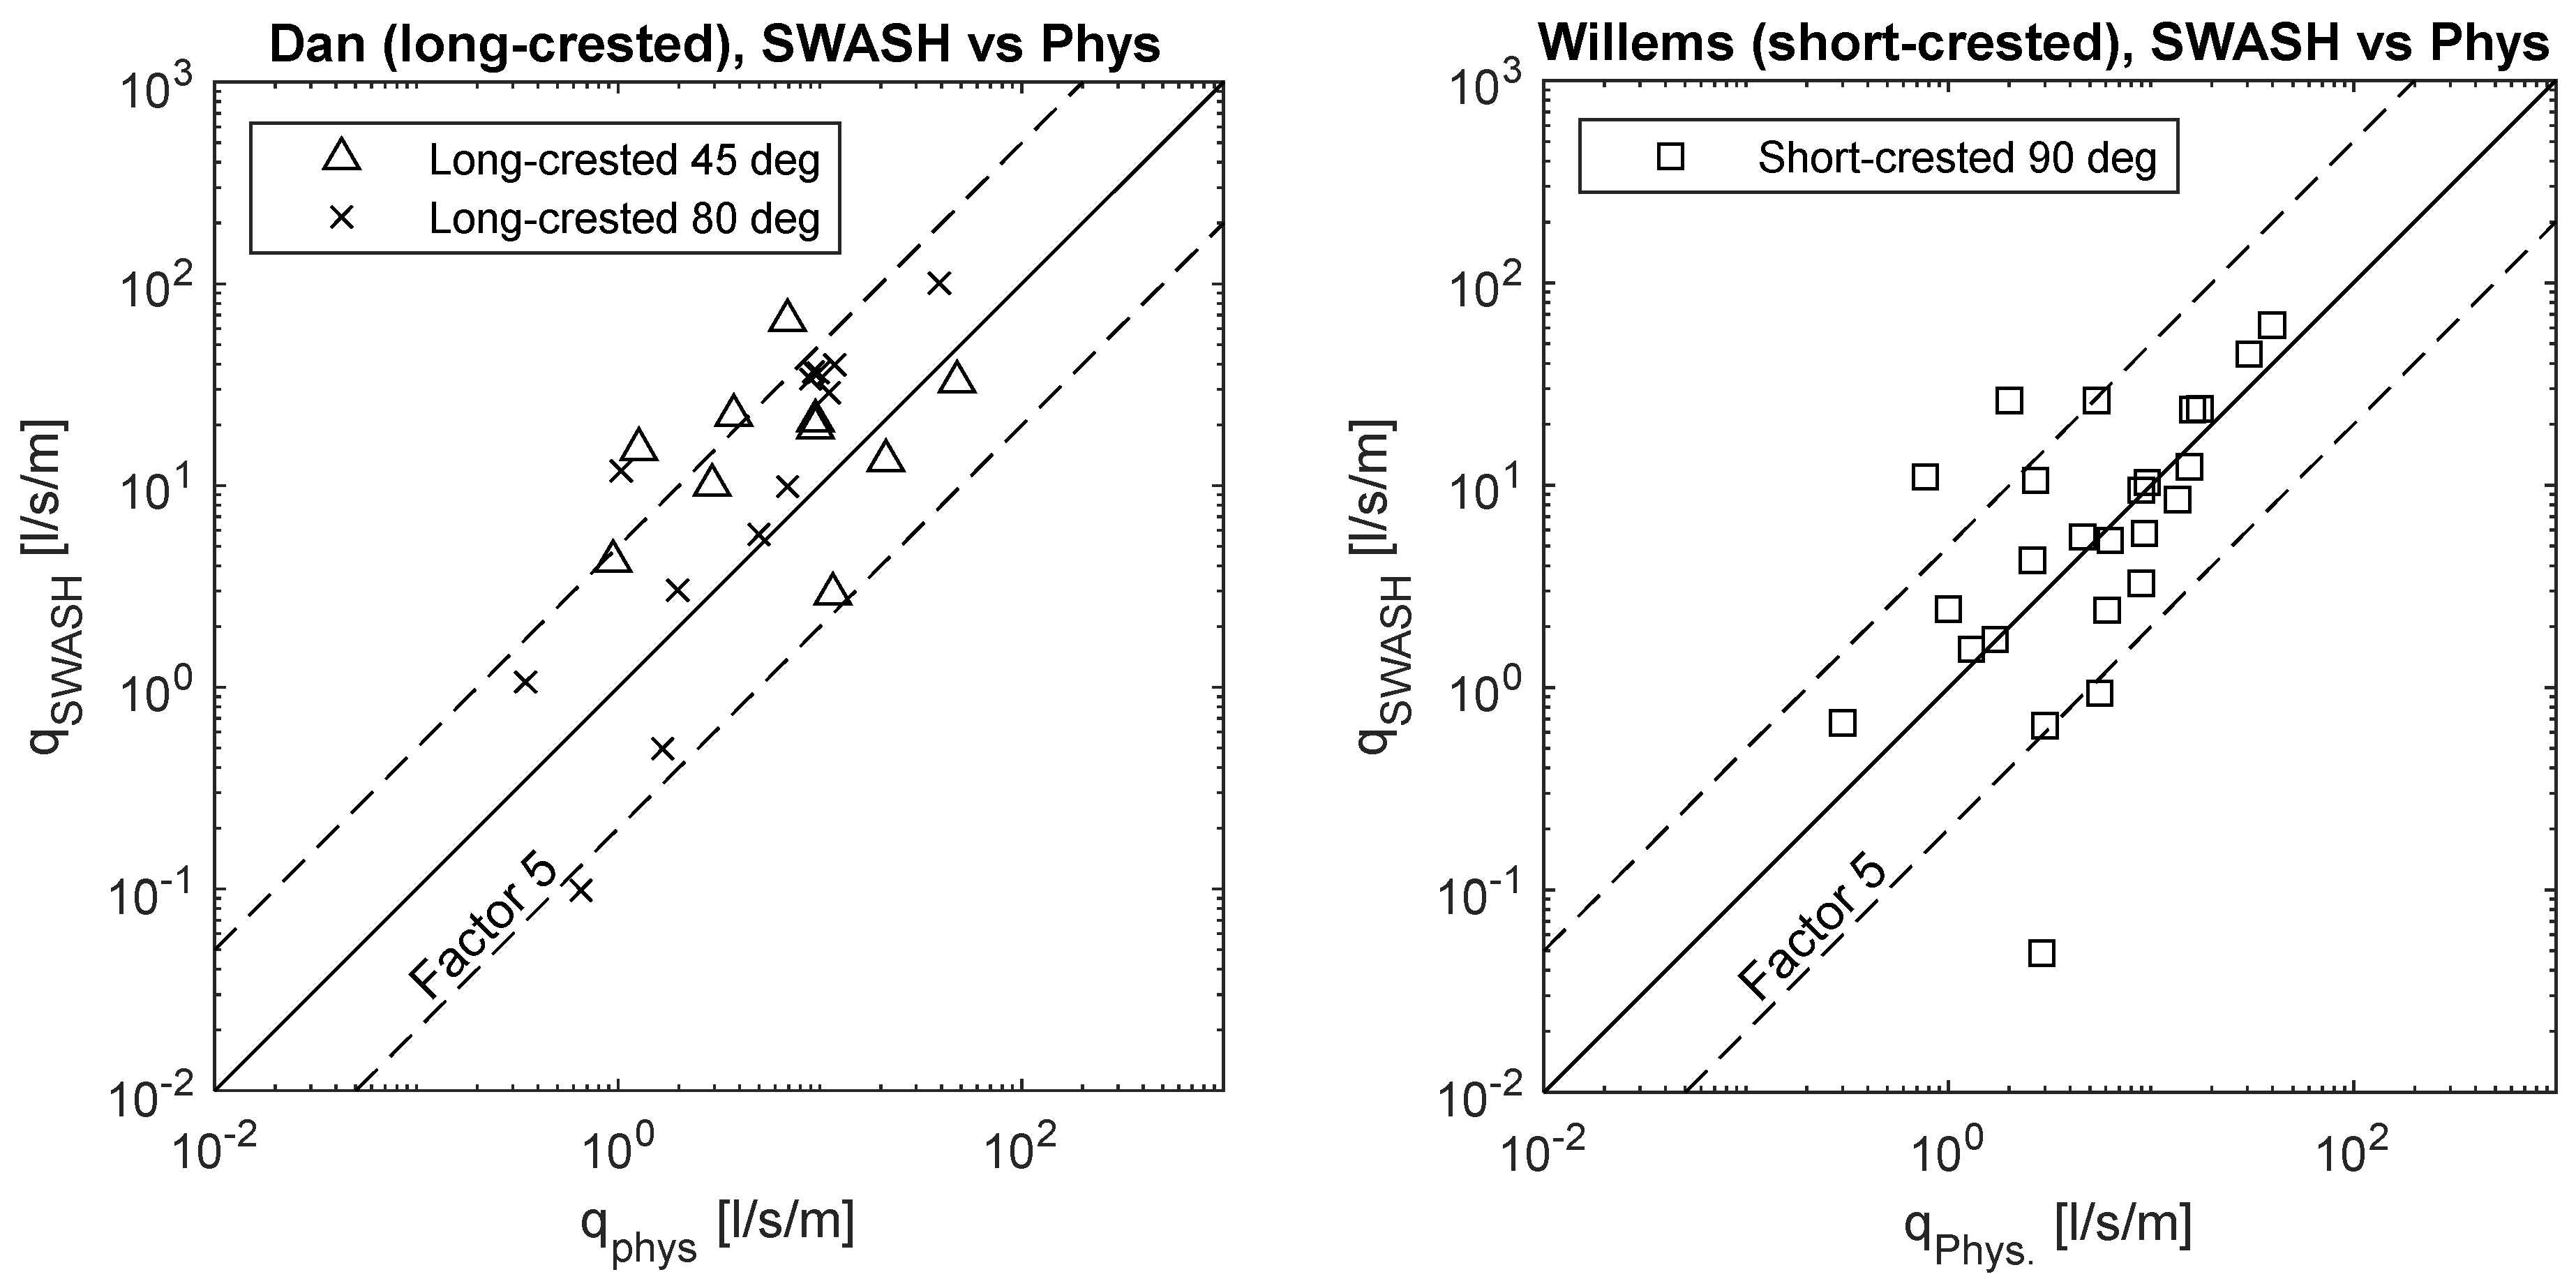
3.3. Validation for (Very) Oblique and Parallel Wave Cases

Figure 8 shows a comparison between measured averaged wave overtopping discharge from the physical models and simulated wave overtopping discharge using SWASH for wave angles of 45, 80 (long crested) and 90 degrees (short crested). As can be seen, the results are scattered around the 1:1 line, and most of the data are located inside the range of a factor 5 line. The quality of the prediction performance by the SWASH model is quantified by geometric mean (Geo) and geometric standard deviation (GSD), where the Geo values for Dan et al. (i.e., 45 and 80 degrees) and for Willems et al. (i.e., 90 degrees) are 2.11 and 1.07, respectively. This indicates that the SWASH slightly overestimates the overtopping discharge for the cases of Dan et al. On the other hand, SWASH results for Willems et al. give an excellent estimation as a mean value. When all the results are integrated, Geo value is 1.50. The GSD values, which represents deviation of the data, for Dan et al. and Willems et al. are 3.01 and 3.82, respectively. The integrated value is 3.57. It is noted that the duration of the simulation of this validation is around 250 waves. Based on these observations, it can be concluded that the SWASH model is capable of reproducing overtopping discharge over dikes and quays with storm walls for different wave angles and types of waves (long-crested and short-crested).

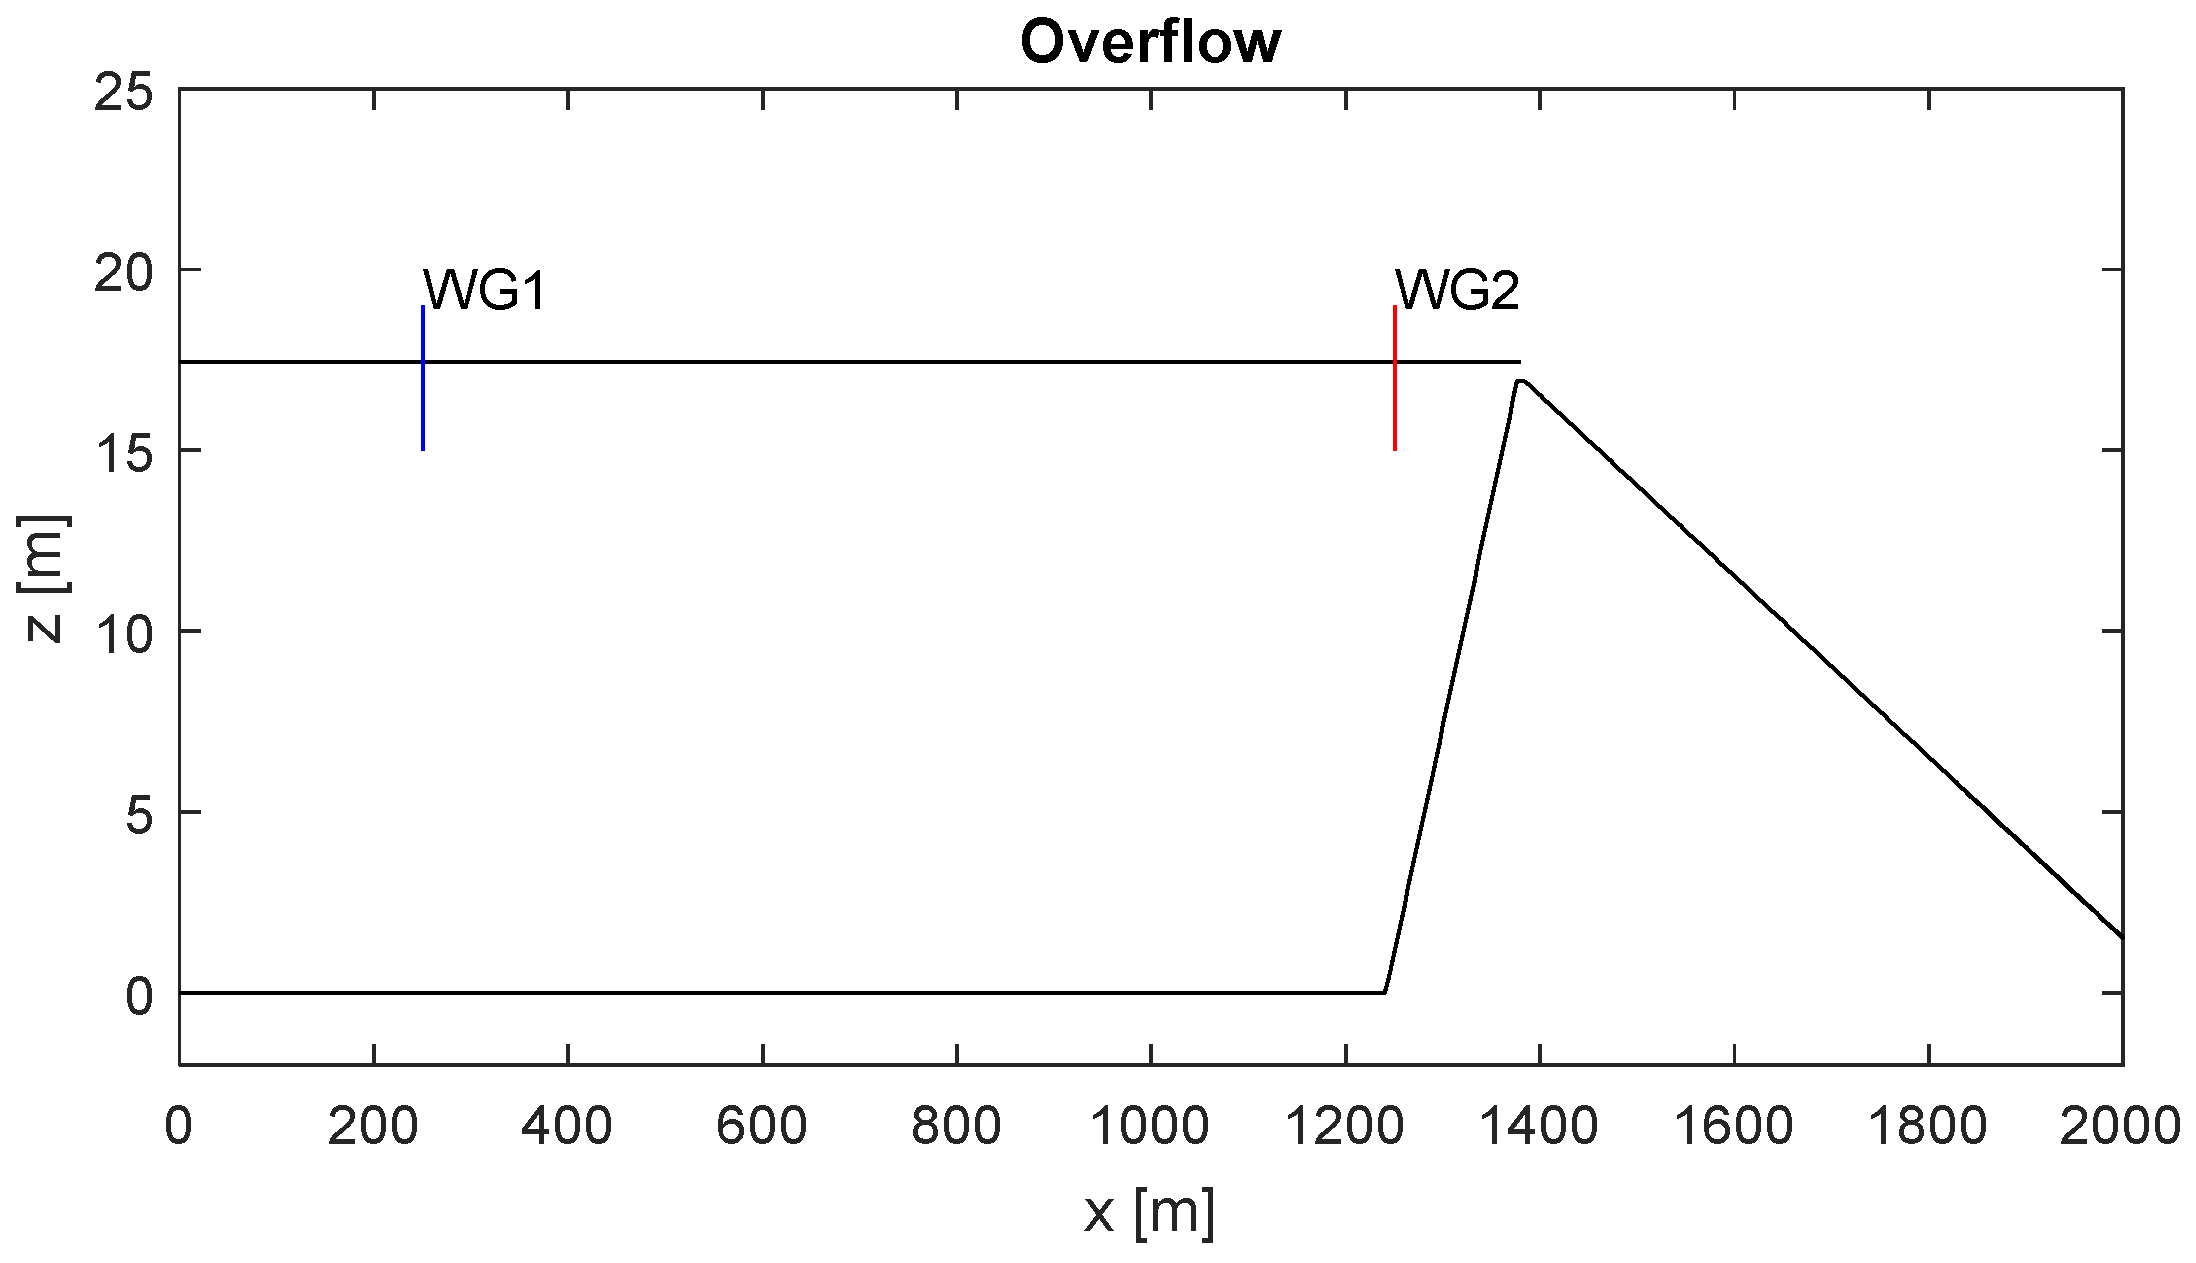
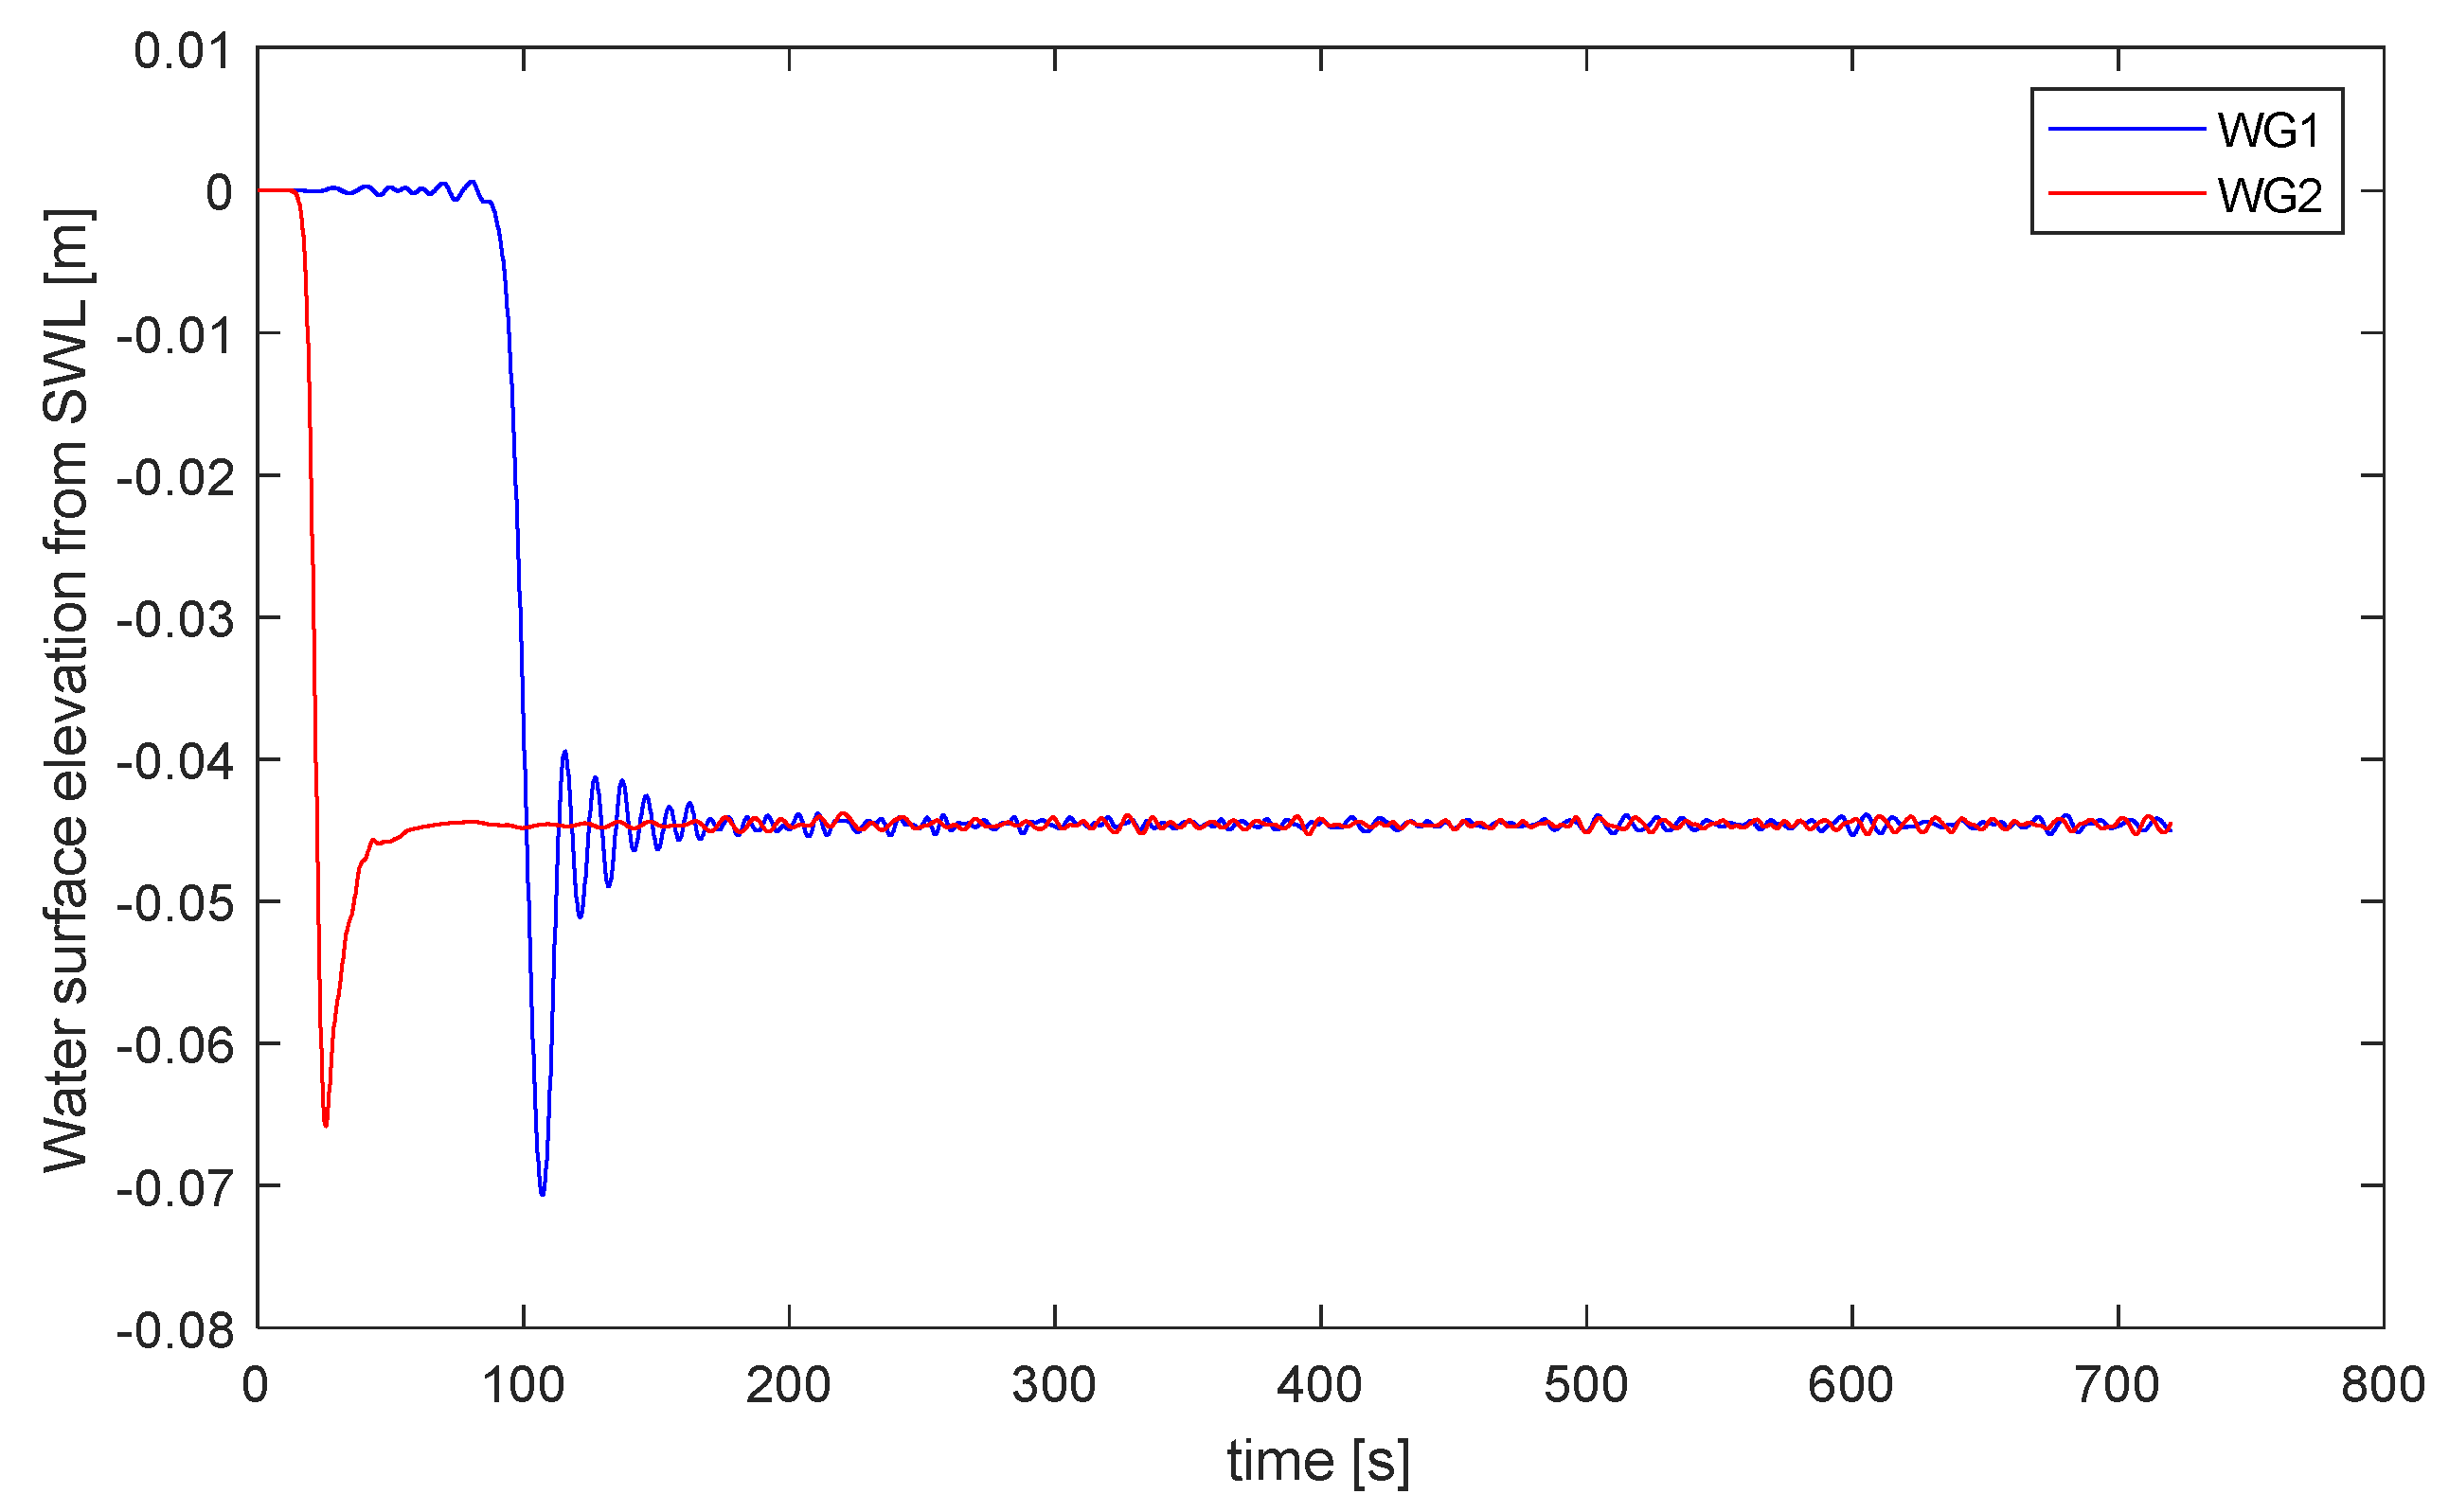
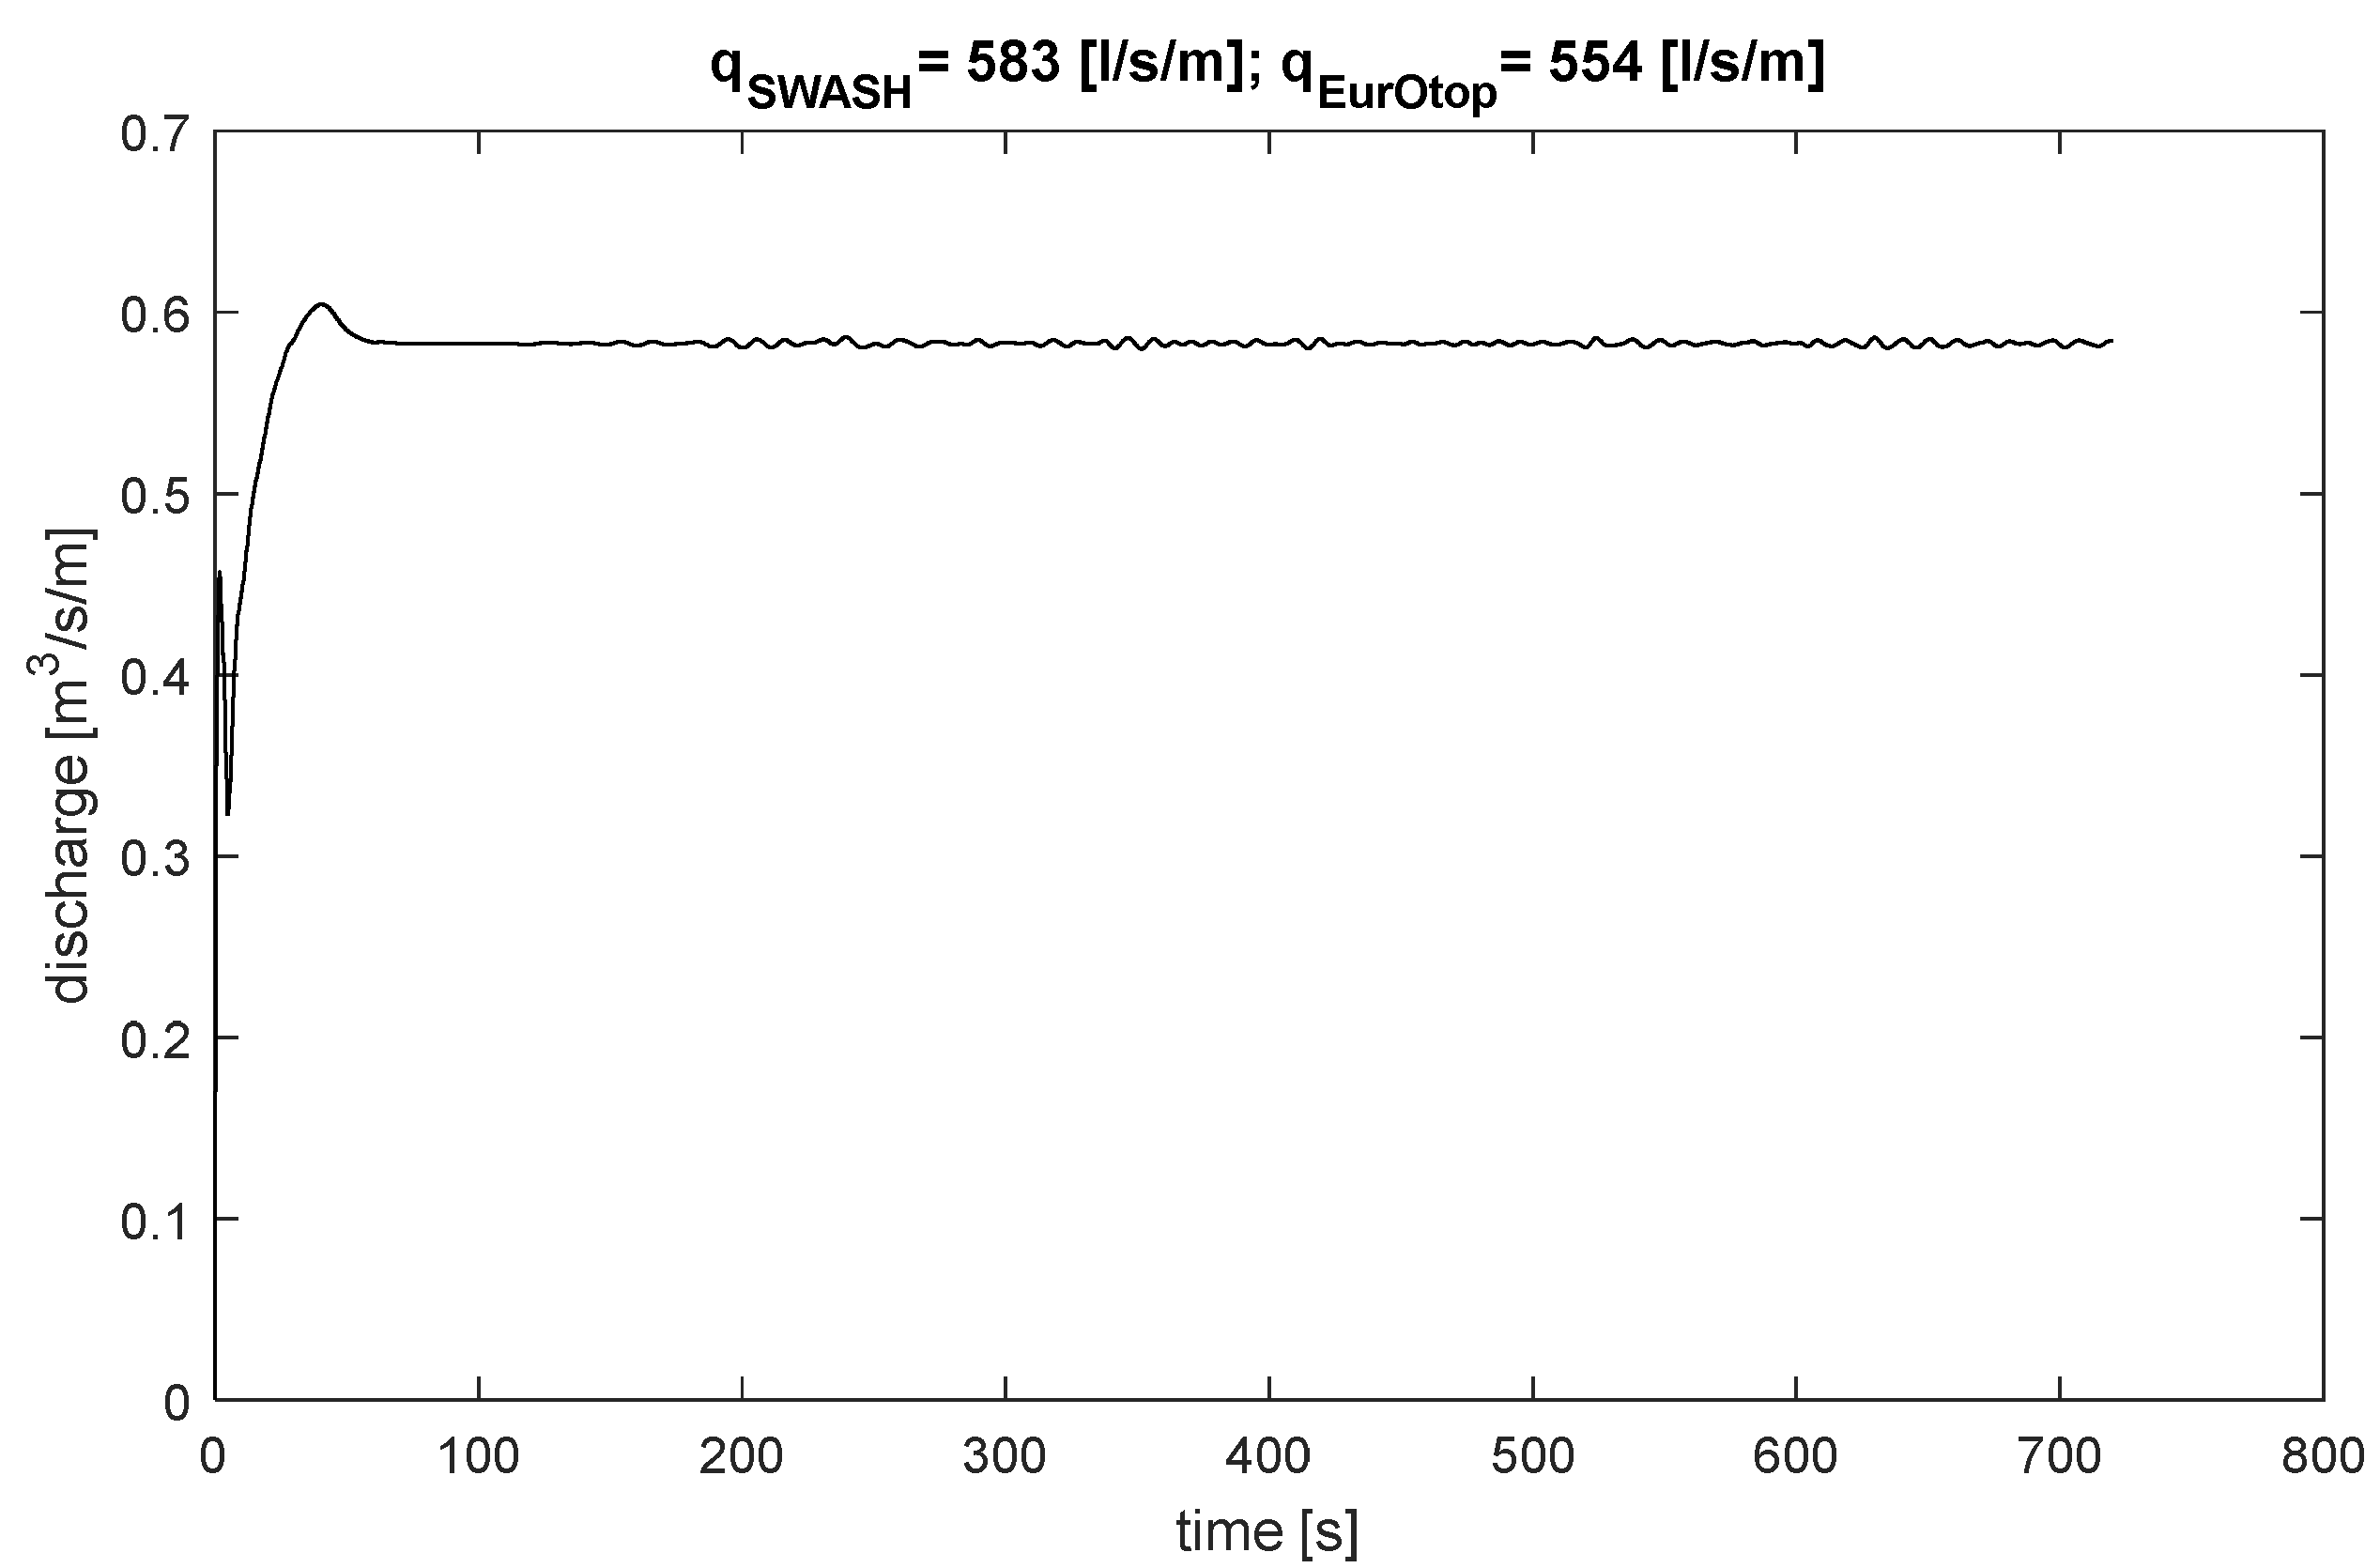
3.4. Validation for Overflow Case

Figure 9 shows the water surface elevation and overflow discharge time series. As can be seen, the system needs some time to reach a stable overflow state. The fixed water level is assigned at the offshore boundary; however, the water level is slightly reduced due to the constant overflow. The model estimates the overflow discharge as 583 l/s/m, while the empirical equation of overflow (EurOtop) indicates 554 l/s/m under the same conditions, considering the slightly reduced water level.
The difference in the estimated overflow discharge is 5%; thus, SWASH estimates overflow with good quality.

4. Discussion

4.1. Computational Stability and Time

The results obtained using the SWASH model were compared with the results obtained using physical models reported in the literature for the cases essential to flooding estimation in port environments. Here, flooding means wave overtopping and overflow, with particular attention on oblique to parallel waves for the wave overtopping over different quay and dike configurations. The model was designed to be applicable and feasible in engineering applications—it is foreseen that the model can be extended to a large domain, O(km), for each x- and y-direction, with long simulation durations, for example, 500–1000 waves. It is noted that in reality, storm durations of 200–300 waves are generally accepted for wave statistics, while 500 waves in general is recommended for overtopping estimation [32] (in this work, 250 waves were used for validation, and the estimation error could be decreased by using more waves). These are typical requirements for engineering applications. Furthermore, repeating calculations with different wave boundary conditions and seeds of waves is also in scope. For this reason, the model needs to be robust and efficient. In order to develop such a model, the model was designed with particular attention to be computationally stable.
For this reason, the grid size was set to be relatively large (4 m, which is around 50 grid cells per peak wavelength) based on the sensitivity analysis on the grid. As far as the results are concerned, the quality of the wave overtopping estimation in this study with a 4 m grid was good enough for a range of wave steepness of 0.005–0.015 (based on the peak wave period), and was computationally stable. According to the SWASH manual, the number of the grid per wavelength can be higher, especially for cases with higher waves (e.g., 100 grid cells per peak wavelength). The overflow cases are not so critical for the computational grid since it is not a short wave propagation case.
In engineering applications, computational stability is also very important. Computational stability is something to do with the configuration of the structure. In this study, a quay wall (with a storm wall) was applied for most of the validation cases. For such vertical configurations, the computational stability is less compared to sloping structures in SWASH, based on the authors’ experience. For this reason, some numeric and treatment of computational cell centres, a relatively large threshold water level, and a relatively large grid size were applied as described in the model settings.
The computational time was about one hour (with some scatter depending on the cases) in a cluster with 32 processors (the machine CPUs are 2 × Intel Xeon X5550 quad core 2.67 GHz, with RAM of 12 GB) for the physical time of 50 min. As described earlier, the model domain is 1000 m by 700 m, and the number of waves applied here is around 200. As stated above, the computation for engineering applications can be longer for one case (with 500–1000 waves and potentially larger domains). Based on the computational time applied here, the computation will be feasible with the setting developed in this study.

4.2. Quality of Overtopping Estimation

It is also possible to estimate wave overtopping discharge using empirical formulas based on the incident wave properties for those cases without berm (i.e., the structures are a simple vertical quay wall for the selected cases 229 and 145). Table 2 shows the estimated overtopping discharge using EurOtop eq 5.17 (Equation (1)) and Kim et al. [33] (Equation (4)) as examples, see the all equations below.
5.17 :   q g H m 0 3 = 0.047 exp 2.35 R c H m 0 γ β 1.3
where q is overtopping discharge, g is gravitational acceleration, Hm0 is significant wave height, Rc is free board, and γ β is a reduction factor for obliqueness. In EurOtop, for long-crested waves, γ β is expressed as follows.
γ β = 1 0.0062   for   0 °   <   β   <   45 °
γ β = 0.72   for   45 °
q g H m 0 3 = 0.04 exp 2.6 γ β R c H m 0
The γ β values are given by the figure in their paper—reading the figure, γ β = 0.70 for 45° and 0.37 for 80° for the long-crested waves.
The γβ value is thus a crucial factor in determining overtopping discharge for oblique wave attack. In the literature, many different values have been proposed especially for very oblique waves (e.g., 80 degrees). This high degree of variability was also reported in Dan et al. [4]. EurOtop recommends using a constant γβ value of 0.72 for angles greater than 45 degrees (Equation (3)), while van Gent [5] recommends a relatively higher value (0.8 or higher for long-crested waves) based on their observation of the physical model tests. On the other hand, Dan et al. [4] and Kim et al. [33] show much lower values for very oblique waves (e.g., less than 0.4 for long-crested waves with a wave angle of 80 degrees). The estimation of γβ value from Kim et al. [33] is interesting, since the value remains more or less constant between 40 and 60 degrees and shows a rapid decrease again towards 80 degrees. This rapid change can also be seen in the dataset of van Gent [5], even though they noted that the low value was due to scale effects. The discharges estimated in SWASH are close to the discharges estimated based on the γβ value of Kim et al. [33] (within factor 2).
As such the overtopping discharges for the very oblique waves show a large variety of the estimation. It indicates the necessity of further study on wave overtopping estimation for very oblique waves.
Table 2. Measured (physical model), simulated (numerical model) and estimated (EurOtop, Kim et al.) wave overtopping discharge (vertical structure, no berm).
Case NoRc
[m]
Hm0
[m]
Wave
Angle
[deg]
q
Phys
[l/s/m]
q
Num.
[l/s/m]
γβ
EO *
[-]
q
EO
[l/s/m]
γβ
Kim
[-]
q
Kim
[l/s/m]
D2291.51.964547.632.80.7215.20.7020.0
D1451.02.268011.839.50.72104.50.3720.2
* EO stands for EurOtop.

4.3. Applicability

The benefit of using SWASH for the estimation of wave overtopping instead of using empirical equations is that the model provides more information on the physical processes. It gives average wave overtopping discharge at a point of interest and time-dependent overtopping discharge, individual overtopping volume, overtopping flow thickness and velocity at any location. If necessary, pressure and force can also be output [24]. In practice, the geometries and hydraulic boundary conditions are often very complex. For instance, it is not certain how incident significant wave height can be calculated in a 3D environment—in other words, the necessary widths of energy bins (in terms of directionality) to be integrated in order to calculate incident Hm0 from a 3D spectrum for hydraulic boundary conditions. Geometries are always much more complex than simplified/schematized geometries that derive the empirical equation. There are, for example, some bumps on the quay in front of the storm wall. Under such complex situations, applying empirical equations in combination with a specific boundary condition is challenging to estimate wave overtopping discharge. Therefore, it is a great help for engineers to use a numerical model capable of simulating from offshore to the point of interest where wave overtopping discharges are calculated.
This study tested SWASH for different geometrical configurations with a certain range of hydraulic boundary conditions. However, the geometries and hydraulic boundary conditions applied here could be outside the range. In this case, extra validation would be helpful to confirm the applicability of SWASH with the necessary conditions. It was not tested in this study, but it would be interesting to know if the model works for the combination of overflow and overtopping, which will occur in sea level rise scenarios.

5. Conclusions

In this study, a non-hydrostatic model SWASH was applied to model flooding (i.e., overflow, perpendicular, oblique and very oblique overtopping) and evaluated the model applicability. The model could generally reproduce wave overtopping discharge and overflow well for the cases randomly selected from Dan et al. [4] and Willems et al. [16]. The selected cases from Dan et al. [4] include a simple quay configuration with a perpendicular long-crested wave case (0 degrees) as a control case, quays and 1 in 2.5 sloping dikes with various berm lengths and storm wall heights in combination with long-crested oblique (45 degrees) and very oblique waves (80 degrees). The selected cases from Willems et al. [16] are based on a quay with various berm lengths and storm wall heights in combination with short-crested parallel waves (90 degree waves propagate along the quay wall). The range of the wave steepness was 0.005–0.015.
The results indicated that the model could estimate the average wave overtopping well.
Further study on the validation of wave overtopping will be useful since the variety of the bank configuration in port environments is broad and diverse. In this study, the number/variety of the tested cases for validation is somewhat limited. Extra validation with different configurations and the number of test cases can give more insight into the SWASH model for further applications.

Author Contributions

Conceptualization, T.S.; methodology, T.S.; analysis, T.S. and C.A.; investigation, T.S. and C.A.; writing—original draft preparation, T.S.; writing—review and editing, S.D., M.W. and C.A. All authors have read and agreed to the published version of the manuscript.

Funding

Corrado Altomare acknowledges funding from Spanish government and the European Social Found (ESF) under the programme ‘Ramón y Cajal 2020′ (RYC2020-030197-I/AEI/10.13039/501100011033).

Institutional Review Board Statement

Not applicable.

Informed Consent Statement

Not applicable.

Data Availability Statement

Numerical data can be available by contacting the first author.

Acknowledgments

The authors are grateful to Tim Spiesschaert for the dedicated work on the physical model tests conducted at Flanders Hydraulics.

Conflicts of Interest

The authors declare no conflict of interest.

References

  1. Weisse, R.; von Storch, H.; Niemeyer, H.D.; Knaack, H. Changing North Sea Storm Surge Climate: An Increasing Hazard? Ocean Coast. Manag. 2012, 68, 58–68. [Google Scholar] [CrossRef]
  2. Neumann, B.; Vafeidis, A.T.; Zimmermann, J.; Nicholls, R.J. Future Coastal Population Growth and Exposure to Sea-Level Rise and Coastal Flooding-A Global Assessment. PLoS ONE 2015, 10, e0118571. [Google Scholar] [CrossRef] [PubMed] [Green Version]
  3. Van der Meer, J.W.; Allsop, N.W.H.; Bruce, T.; De Rouck, J.; Kortenhaus, A.; Pullen, T.; Schüttrumpf, H.; Troch, P.; Zanuttigh, B. Manual on Wave Overtopping of Sea Defences and Related Structures; An Overtopping Manual Largely Based on European Research, but for Worldwide Application; EurOtop 2018. Available online: www.overtopping-manual.com (accessed on 7 February 2023).
  4. Dan, S.; Altomare, C.; Suzuki, T.; Spiesschaert, T.; Verwaest, T. Reduction of Wave Overtopping and Force Impact at Harbor Quays Due to Very Oblique Waves. J. Mar. Sci. Eng. 2020, 8, 598. [Google Scholar] [CrossRef]
  5. Van Gent, M.R.A. Influence of Oblique Wave Attack on Wave Overtopping at Caisson Breakwaters with Sea and Swell Conditions. Coast. Eng. 2021, 164, 103834. [Google Scholar] [CrossRef]
  6. Gruwez, V.; Altomare, C.; Suzuki, T.; Streicher, M.; Cappietti, L.; Kortenhaus, A.; Troch, P. Validation of RANS Modelling for Wave Interactions with Sea Dikes on Shallow Foreshores Using a Large-Scale Experimental Dataset. J. Marine Sci. Eng. 2020, 8, 650. [Google Scholar] [CrossRef]
  7. Domínguez, J.M.; Fourtakas, G.; Altomare, C.; Canelas, R.B.; Tafuni, A.; García-Feal, O.; Martínez-Estévez, I.; Mokos, A.; Vacondio, R.; Crespo, A.J.C.; et al. DualSPHysics: From Fluid Dynamics to Multiphysics Problems. Comp. Part. Mech. 2021, 9, 867–895. [Google Scholar] [CrossRef]
  8. Crespo, A.J.C.; Domínguez, J.M.; Rogers, B.D.; Gómez-Gesteira, M.; Longshaw, S.; Canelas, R.; Vacondio, R.; Barreiro, A.; García-Feal, O. DualSPHysics: Open-Source Parallel CFD Solver Based on Smoothed Particle Hydrodynamics (SPH). Comput. Phys. Commun. 2015, 187, 204–216. [Google Scholar] [CrossRef]
  9. Booij, N.; Ris, R.C.; Holthuijsen, L.H. A Third-Generation Wave Model for Coastal Regions 1. Model Description and Validation. J. Geophys. Res. 1999, 104, 7649–7666. [Google Scholar] [CrossRef] [Green Version]
  10. Benoit, M.; Marcos, F.; Becq, F. TOMAWAC. A Prediction Model for Offshore and Nearshore Storm Waves; EDF-97-NV-00027; Electricite de France (EDF): Clamart, France, 1997. [Google Scholar]
  11. Holthuijsen, L.H.; Herman, A.; Booij, N. Phase-Decoupled Refraction–Diffraction for Spectral Wave Models. Coast. Eng. 2003, 49, 291–305. [Google Scholar] [CrossRef]
  12. Warren, I.R.; Bach, H.K. MIKE 21: A Modelling System for Estuaries, Coastal Waters and Seas. Environ. Softw. 1992, 7, 229–240. [Google Scholar] [CrossRef]
  13. Suzuki, T.; Gruwez, V.; Bolle, A.; Verwaest, T. Wave Penetration into a Shallow Marina-Case Study for Blankenberge in Belgium. In Book of Proceedings of the 4th International Conference on the Application of Physical Modelling to Port and Coastal Protection-Coastlab12; Department of Civil Engineering, Ghent University: Ghent, Belgium, 2012. [Google Scholar]
  14. Bruno, D.; De Serio, F.; Mossa, M. The FUNWAVE Model Application and Its Validation Using Laboratory Data. Coast. Eng. 2009, 56, 773–787. [Google Scholar] [CrossRef]
  15. Zijlema, M.; Stelling, G.; Smit, P. SWASH: An Operational Public Domain Code for Simulating Wave Fields and Rapidly Varied Flows in Coastal Waters. Coast. Eng. 2011, 58, 992–1012. [Google Scholar] [CrossRef]
  16. Willems, M.; Suzuki, T.; Mostaert, F. Oostende Schaalmodel Golfovertopping Bij Zeer Schuine Golven; Flanders Hydraulics Research: Antwerp, Belgium, 2020. [Google Scholar]
  17. Smit, P.; Zijlema, M.; Stelling, G. Depth-Induced Wave Breaking in a Non-Hydrostatic, near-Shore Wave Model. Coast. Eng. 2013, 76, 1–16. [Google Scholar] [CrossRef]
  18. Rijnsdorp, D.P.; Wolgamot, H.; Zijlema, M. Non-Hydrostatic Modelling of the Wave-Induced Response of Moored Floating Structures in Coastal Waters. Coast. Eng. 2022, 177, 104195. [Google Scholar] [CrossRef]
  19. Rijnsdorp, D.P.; Smit, P.B.; Zijlema, M. Non-Hydrostatic Modelling of Infragravity Waves under Laboratory Conditions. Coast. Eng. 2014, 85, 30–42. [Google Scholar] [CrossRef]
  20. Suzuki, T.; Altomare, C.; Veale, W.; Verwaest, T.; Trouw, K.; Troch, P.; Zijlema, M. Efficient and Robust Wave Overtopping Estimation for Impermeable Coastal Structures in Shallow Foreshores Using SWASH. Coast. Eng. 2017, 122, 108–123. [Google Scholar] [CrossRef]
  21. Vasarmidis, P.; Stratigaki, V.; Suzuki, T.; Zijlema, M.; Troch, P. Internal Wave Generation in a Non-Hydrostatic Wave Model. Water 2019, 11, 986. [Google Scholar] [CrossRef] [Green Version]
  22. Suzuki, T.; Hu, Z.; Kumada, K.; Phan, L.K.; Zijlema, M. Non-Hydrostatic Modeling of Drag, Inertia and Porous Effects in Wave Propagation over Dense Vegetation Fields. Coast. Eng. 2019, 149, 49–64. [Google Scholar] [CrossRef]
  23. Reis, R.A.; Pires-Silva, A.A.; Fortes, C.J.; Suzuki, T. Experiences with SWASH on Modelling Wave Propagation over Vegetation. J. Integr. Coast. Zone Manag. 2020, 20, 145–150. [Google Scholar]
  24. Gruwez, V.; Altomare, C.; Suzuki, T.; Streicher, M.; Cappietti, L.; Kortenhaus, A.; Troch, P. An Inter-Model Comparison for Wave Interactions with Sea Dikes on Shallow Foreshores. JMSE 2020, 8, 985. [Google Scholar] [CrossRef]
  25. Altomare, C.; Crespo, A.J.C.; Domínguez, J.M.; Gómez-Gesteira, M.; Suzuki, T.; Verwaest, T. Applicability of Smoothed Particle Hydrodynamics for Estimation of Sea Wave Impact on Coastal Structures. Coast. Eng. 2015, 96, 1–12. [Google Scholar] [CrossRef]
  26. Altomare, C.; Domínguez, J.; Crespo, A.; Suzuki, T.; Caceres, I.; Gómez-Gesteira, M. Hybridization of the Wave Propagation Model SWASH and the Meshfree Particle Method SPH for Real Coastal Applications. Coast. Eng. J. 2015, 57, 1550024-1–1550024-34. [Google Scholar] [CrossRef]
  27. Altomare, C.; Tagliafierro, B.; Dominguez, J.; Suzuki, T.; Viccione, G. Improved Relaxation Zone Method in SPH-Based Model for Coastal Engineering Applications. Appl. Ocean Res. 2018, 81, 15–33. [Google Scholar] [CrossRef]
  28. Altomare, C.; Suzuki, T.; Verwaest, T. Influence of Directional Spreading on Wave Overtopping of Sea Dikes with Gentle and Shallow Foreshores. Coast. Eng. 2020, 157, 103654. [Google Scholar] [CrossRef] [Green Version]
  29. Vasarmidis, P.; Stratigaki, V.; Suzuki, T.; Zijlema, M.; Troch, P. On the Accuracy of Internal Wave Generation Method in a Non-Hydrostatic Wave Model to Generate and Absorb Dispersive and Directional Waves. Ocean Eng. 2021, 219, 108303. [Google Scholar] [CrossRef]
  30. Altomare, C.; Suzuki, T.; Chen, X.; Verwaest, T.; Kortenhaus, A. Wave Overtopping of Sea Dikes with Very Shallow Foreshores. Coast. Eng. 2016, 116, 236–257. [Google Scholar] [CrossRef]
  31. Goda, Y. Derivation of Unified Wave Overtopping Formulas for Seawalls with Smooth, Impermeable Surfaces Based on Selected CLASH Datasets. Coast. Eng. 2009, 56, 385–399. [Google Scholar] [CrossRef]
  32. Romano, A.; Bellotti, G.; Briganti, R.; Franco, L. Uncertainties in the Physical Modelling of the Wave Overtopping over a Rubble Mound Breakwater: The Role of the Seeding Number and of the Test Duration. Coast. Eng. 2015, 103, 15–21. [Google Scholar] [CrossRef]
  33. Kim, Y.-T.; Shin, S.; Choi, J.-W.; Lee, J.-I. Effects of Obliquely Incident Waves on Overtopping for Vertical Walls. J. Coast. Res. 2016, 75, 1357–1361. [Google Scholar] [CrossRef]
Figure 1. The position of the structure in the wave basin during experiments of Dan et al. [4]: (a) wave direction 80°; (b) perpendicular wave attack 0°; (c) wave direction 45°. The length of the structure is 8 m in the model scale (1/50) (this figure is reproduced from Dan et al. [4]).
Jmse 11 00575 g001
Figure 2. Plan and cross-sectional view of the physical model in the multi-directional wave basin (reproduced from Willems et al. [16].) ‘GOLF’ stands for wave gauge, and the decimal signs here are expressed as ‘,’ instead of ‘.’ (e.g., ‘4,8’ is ‘4.8’).
Jmse 11 00575 g002
Figure 3. Plan and cross-sectional view of the SWASH domain settings for wave overtopping simulations (3 different wave directions: 45, 80 and 90 degrees).
Jmse 11 00575 g003
Figure 4. Cross-sectional view of the SWASH model domain setting applied to the overflow simulation (the straight line represents the initial water level).
Jmse 11 00575 g004
Figure 5. The mean overtopping discharges with different grid sizes (dx = 2.5 to 8 m) for different wave directions (45, 80 and 90 degrees) to check the grid conversion. Directions of 45 and 80 degrees are the cases with long-crested waves, while directions of 90 degrees correspond to the cases with short-crested waves.
Jmse 11 00575 g005
Figure 6. Spatial distribution of significant wave heights with different grid sizes (upper: Case D229, 45 deg, dx = dy = 4.0 m and dx = xy = 2.5 m; lower Case D145, 80 deg, dx = dy = 4.0 m and dx = xy = 2.5 m).
Jmse 11 00575 g006
Figure 7. Measured and computed mean wave overtopping discharge (Case D343 and D344: Dan et al. [4], wave direction 0 degrees). Dashed lines show factor 5 overtopping deviation from 1:1 line (e.g., the upper line crosses 5 l/s/m and the lower line crosses 0.2 l/s/m at the target overtopping discharge 1 l/s/m).
Jmse 11 00575 g007
Figure 8. Measured and computed mean wave overtopping discharge (left: Dan et al., long-crested wave cases, right: Willems et al., short-crested wave cases). Dashed lines show factor 5 overtopping deviation from 1:1 line.
Jmse 11 00575 g008
Figure 9. Time series of water surface elevation at offshore wave gauge WG1 and nearshore wave gauge WG2 (upper) and measured overflow discharge on the crest of the dike.
Jmse 11 00575 g009aJmse 11 00575 g009b
Table 1. Data for the validation cases (prototype scale). Case names starting with D are from Dan et al., and those starting with W are from Willems et al.
Case
[-]
Wave Angle [deg]Dike Slope
[1/x]
Dike Height [m]Wall Height [m]Wall Position [m]Rc
[m]
Water Level [m]Hm0
[m]
Tp
[m]
D3430010000.759.251.1812.3
D3440010000.509.501.1611.2
D219452.510202.509.502.5412.6
D225452.510101.509.501.6012.6
D212452.510151.0010.001.4712.6
D209452.5101251.0010.001.5512.6
D208452.5101501.0010.001.5812.6
D23145010202.509.501.9612.6
D22945010101.509.501.9612.6
D18945010151.0010.001.1612.6
D176450101251.0010.001.2112.6
D173450101501.0010.001.2012.6
D111802.510101.0010.001.5212.6
D105802.510151.0010.001.4912.6
D107802.510151.0010.002.2512.6
D16280010201.0011.002.3211.8
D14580010101.0010.002.2912.6
D16080010251.0011.002.2911.8
D14980010151.0010.002.2912.6
D157800102251.0011.002.3111.8
D165800102501.0011.003.0711.8
D158800102251.0011.003.0911.8
D16180010251.0011.003.111.8
D153800101251.0010.002.2912.6
D155800101251.0010.003.0611.8
W0190015.771.6300.7916.612.8110.7
W0290015.771.63150.7316.671.8610.7
W0390015.771.63300.7116.691.7010.7
W0490015.771.6301.2616.142.8810.7
W0590015.771.63151.2516.152.1710.7
W0690015.771.63301.2316.171.9610.7
W0790015.771.6300.7516.652.5310.7
W0890015.771.63150.7116.691.6410.7
W0990015.771.63300.6916.711.4910.7
W1090015.771.6301.2516.152.5711.1
W1190015.771.63151.2416.161.9410.7
W1290015.771.63301.2416.161.7410.7
W1390015.771.6300.6816.721.8610.7
W1490015.771.63150.7016.701.2710.7
W1590015.771.63300.6816.721.0710.7
W1690015.771.13151.1515.752.2910.7
W1790015.771.13301.1015.802.2210.7
W1890015.771.13151.1315.772.0310.7
W1990015.771.13301.1115.792.0010.7
W2090015.771.6300.7316.672.2210.7
W2190015.771.63150.7216.681.4910.7
W2290015.771.63300.6616.741.2810.7
W2390015.771.1300.7316.172.1811.1
W2490015.771.13150.7416.161.5910.7
W2590015.771.13300.7116.191.4310.7
Disclaimer/Publisher’s Note: The statements, opinions and data contained in all publications are solely those of the individual author(s) and contributor(s) and not of MDPI and/or the editor(s). MDPI and/or the editor(s) disclaim responsibility for any injury to people or property resulting from any ideas, methods, instructions or products referred to in the content.

