Article

Material Cost Minimization Method of the Ship Structure Considering Material Selection

by
Gerry Liston Putra
1,* and
Mitsuru Kitamura
2
1
Department of Mechanical Engineering, Universitas Indonesia, Depok 16424, Indonesia
2
Department of Transportation and Environmental Systems, Hiroshima University, 1-4-1 Kagamiyama, Higashi-Hiroshima City 739-8527, Japan
*
Author to whom correspondence should be addressed.
J. Mar. Sci. Eng. 2023, 11(3), 640; https://doi.org/10.3390/jmse11030640
Submission received: 31 January 2023 / Revised: 8 March 2023 / Accepted: 16 March 2023 / Published: 17 March 2023
(This article belongs to the Special Issue Failure Analysis of Marine Structure II)

Abstract

:
Numerous studies have been conducted to minimize material costs and improve efficiency, one of which involves using the genetic algorithm (GA) for material selection. Although the GA provides the best solution, it is computationally intensive. To mitigate this issue, a simple method was proposed. The stiffened plate, a primary component of ship structure, was chosen as the optimization model for this study, with the objective of minimizing material costs using the proposed simple method. Two design variables, plate thickness (t) and plate material type (m), were selected with specific constraints. The simple method was used to determine the appropriate plate material types to reduce material costs. Additionally, size optimization was conducted using stress equations to produce the optimal thickness. The results showed that this method significantly reduced the computational time and material cost of the ship structure.

1. Introduction

The financial crisis has affected nearly every country and has reduced the demand for new shipbuilding. To survive this crisis, shipyard industries need to think innovatively and creatively by comparing various research results and developing new techniques to achieve efficiency. Additionally, the cost of steel, the primary material used in ship construction, has significantly increased in recent years. Therefore, reducing material usage can decrease ship weight, material cost, and emissions. Dong and Cai (2018) [1] highlight that a 5% difference in hull weight can impact the Energy Efficiency Design Index (EEDI) of ships by up to 1.2% at certain speed ranges (Council, 2010) [2].
In general, the ship structure consists of several components, including plates, stiffeners, frames, floors, and deck beams, which are divided into longitudinal and transverse members, as shown in Figure 1. The plate serves to protect the ship’s hull from leaks and is the primary strength component of the ship in both longitudinal and transverse directions. Several previous studies aimed to reduce ship weight and costs by addressing the strict rules issued by the classification bureau regarding the required plate thickness for a ship.
Numerous research projects have been conducted to optimize the design of plates and stiffeners. For instance, Kallassy and Marcelin (1997) [3] used the genetic algorithm to optimize the number of stiffeners based on topology optimization. Marcelin (2001) [4] developed a genetic algorithm that was implemented on a stiffened plate by the Ritz method to create an approximation equation for use in computationally intensive design optimization. Alinia (2005) [5] suggested optimizing the number of stiffeners in plates subjected to shear loading, which is critical in structural design. Wang et al. (2015) [6] showed a simple hybrid workflow in buckling analysis and stiffened plate optimization. Nonami et al. (2014) [7] presented a straightforward calculation method to obtain the optimal scantling of the structure without recreating the FEM model. Um and Roh (2015) [8] minimized hatch cover weight through optimization based on sequential quadratic programming (SQP). Shin and Ko (2017) [9] applied the genetic algorithm to minimize the weight of the corrugated bulkhead of a chemical tanker. Despite several previous studies, weight minimization remains an area that requires improvement in efficient ship design. Moreover, Putra, Kitamura, and Takezawa (2019) [10] optimized design variables, including stiffener number, stiffener size, stiffener spacing, and plate thickness using a Hybrid Genetic Algorithm (GA) in the stiffened plate of ship construction.
There have been many studies on material selection aimed at reducing production costs. For example, Poulikidou et al. (2015) [11] minimized weight by considering the environmental life cycle during material selection for an automotive component. Kaspar, Baehre, and Vielhaber (2016) [12] integrated considerations of products, material information, and production processes into the material selection process. Yang et al. (2017) [13] used a Fuzzy Technique to develop a material selection process that promoted the remanufacturing of automotive components. Mehmood, Haneef, and Udrea (2018) [14] comprehensively applied Ashby’s approach to the material selection process for MEMS. Finally, Putra and Kitamura (2021) [15] proposed a genetic algorithm for the material selection process to obtain the appropriate material types for the plate and stiffener of a hatch cover structure. Aires and Ferreira (2022) [16] considered sustainable material selection as identifying materials that have the least environmental impact while still meeting the required performance criteria for the intended application.
The proposed method in this study aims to replace the genetic algorithm in optimizing the material type and plate thickness for ship structures. The genetic algorithm has been widely used in previous studies to reduce the weight and cost of ship structures, but it has a weakness in terms of its computation time. Therefore, the proposed method aims to provide a simpler and faster approach to achieving the same objective. The proposed method uses certain criteria and a fixed-point iteration method as the optimization technique, taking into account the constraints imposed by class rules. The objective is to minimize the total material cost, with the material type (m) and plate thickness (t) chosen as design variables. These variables were selected due to their direct impact on reducing the total material cost. The proposed method is expected to improve upon previous research by providing a novel and more efficient approach to material selection and optimization for ship structures. The comparison with the genetic algorithm in terms of computational time and resulting total material cost will provide insights into the effectiveness of the proposed method.
Overall, this study contributes to the ongoing efforts to improve the efficiency and sustainability of shipbuilding industries by providing a novel method for reducing material usage and costs while maintaining structural integrity and meeting class rules.

2. Optimization Algorithm

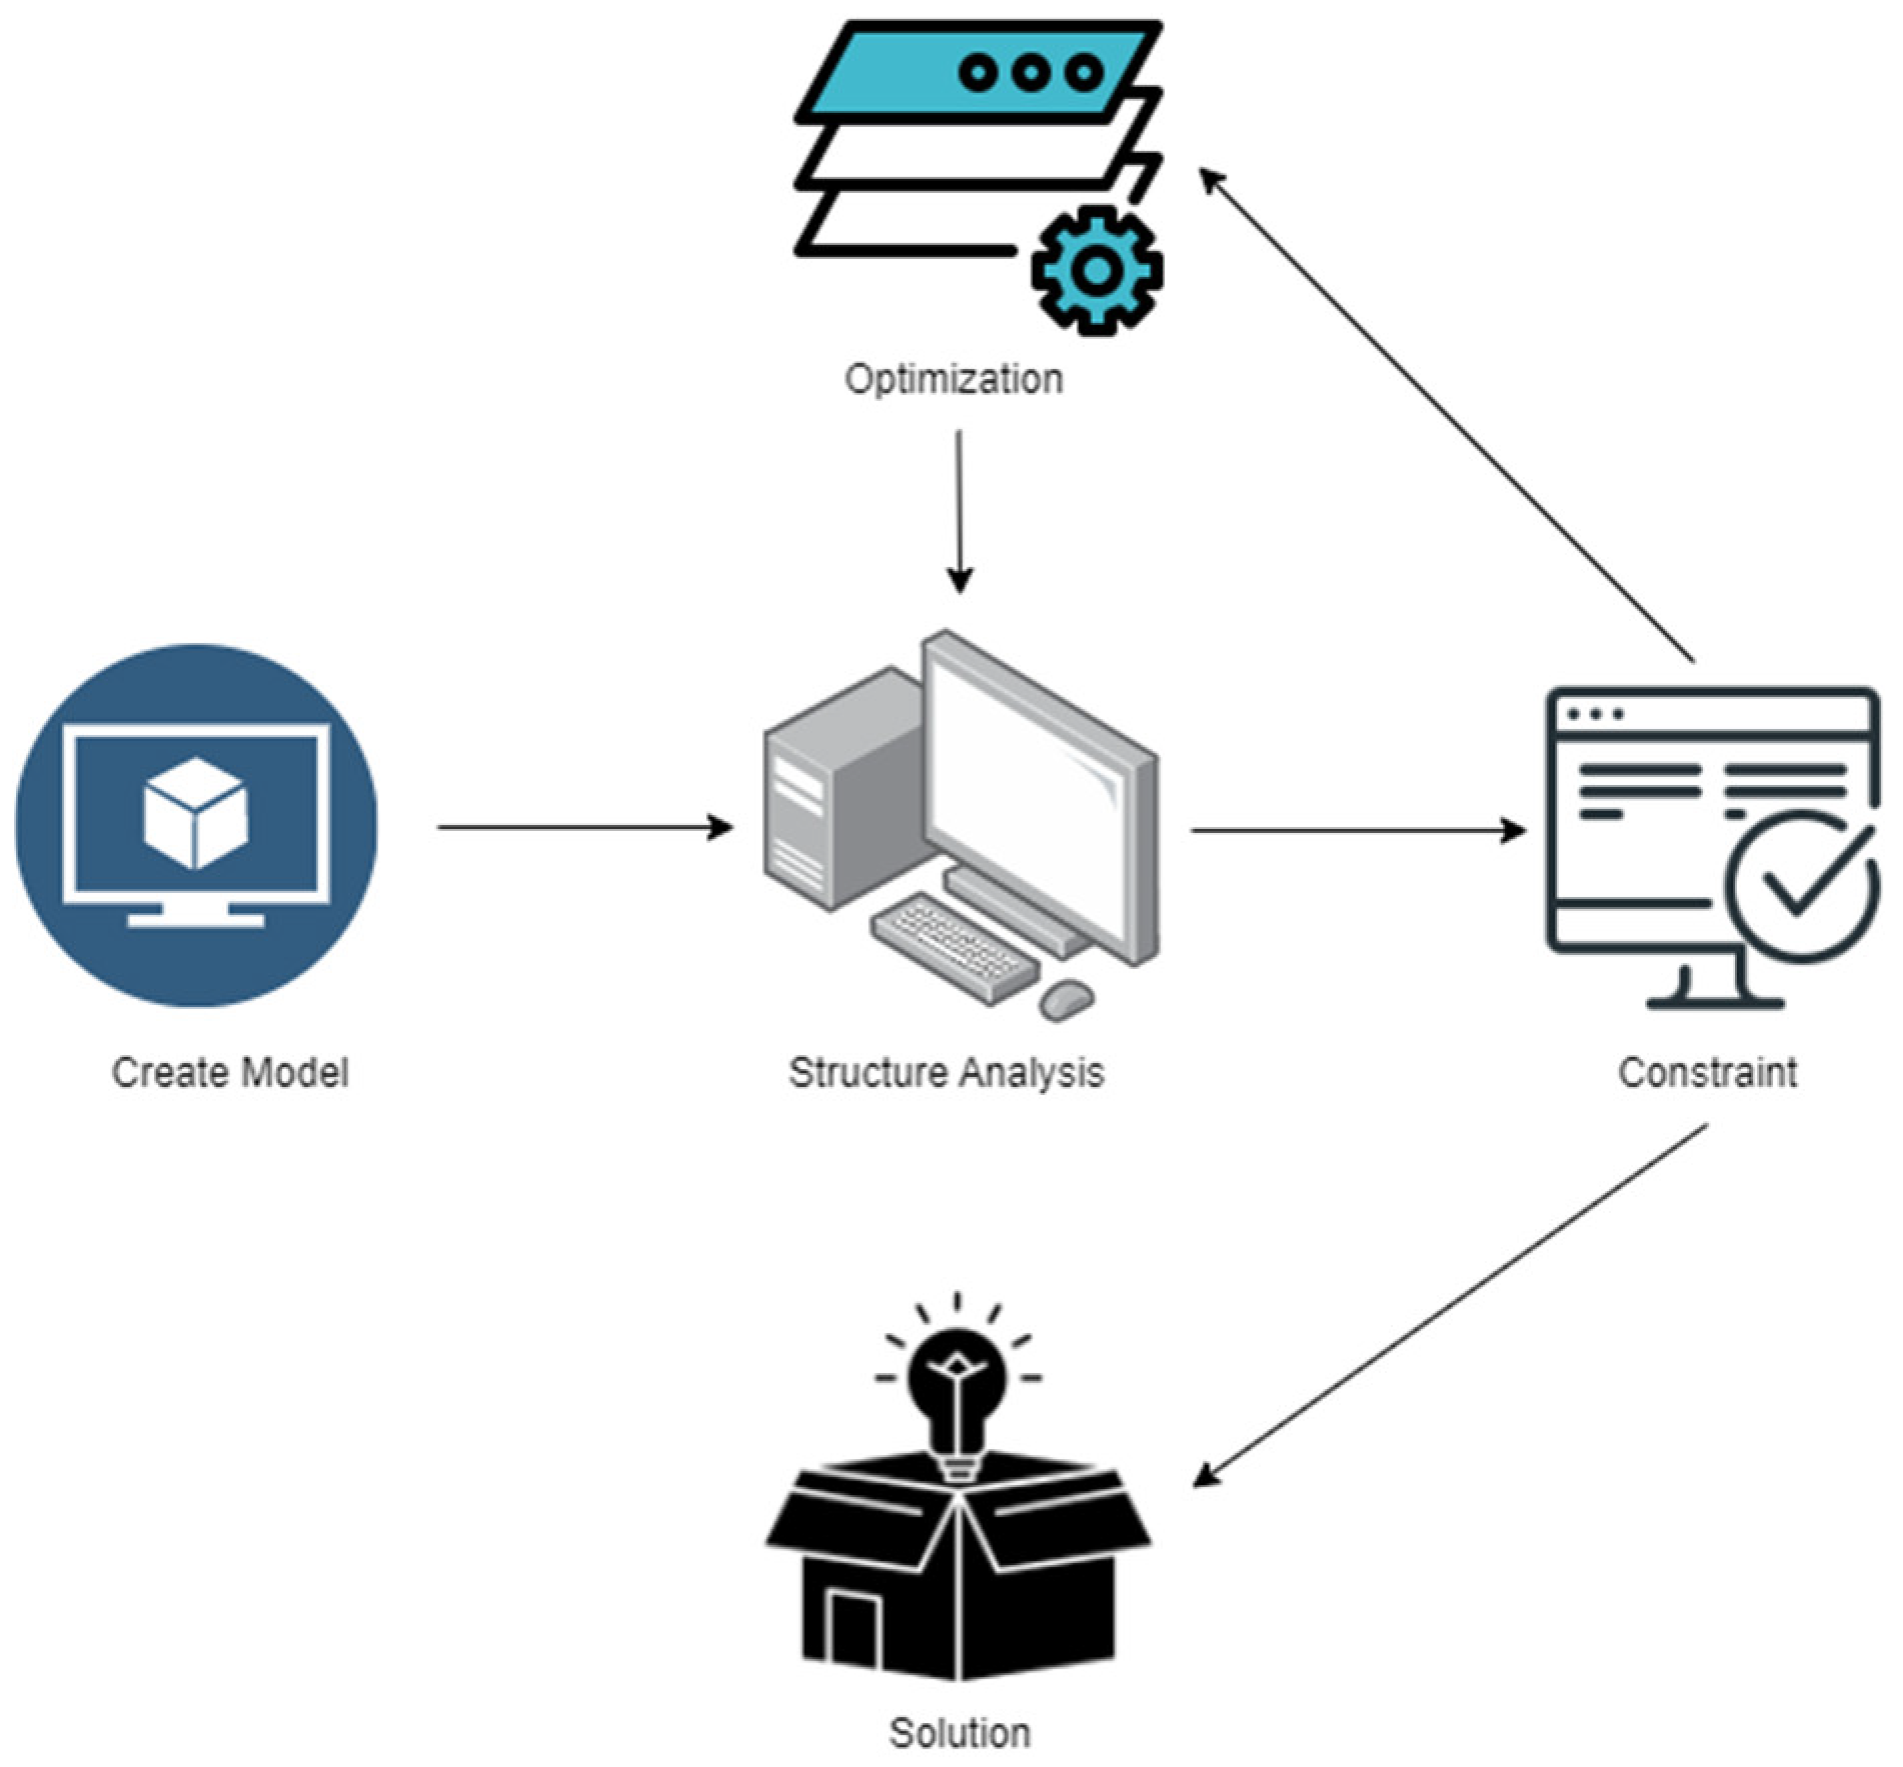
The study integrates an optimization program and Finite Element Method (FEM) into the C language to propose an optimization algorithm. The proposed algorithm combines a material selection process using the proposed method and size optimization method to generate an optimal solution for a plate structure, as shown in Table 1. The proposed method selects the material type for the plate, while the size optimization method determines the optimal thickness of the plate. The algorithm starts by downgrading all the plate material types of the initial design to the cheapest material type and performing size optimization. This step eases the material selection process since all plates start from the same material type.
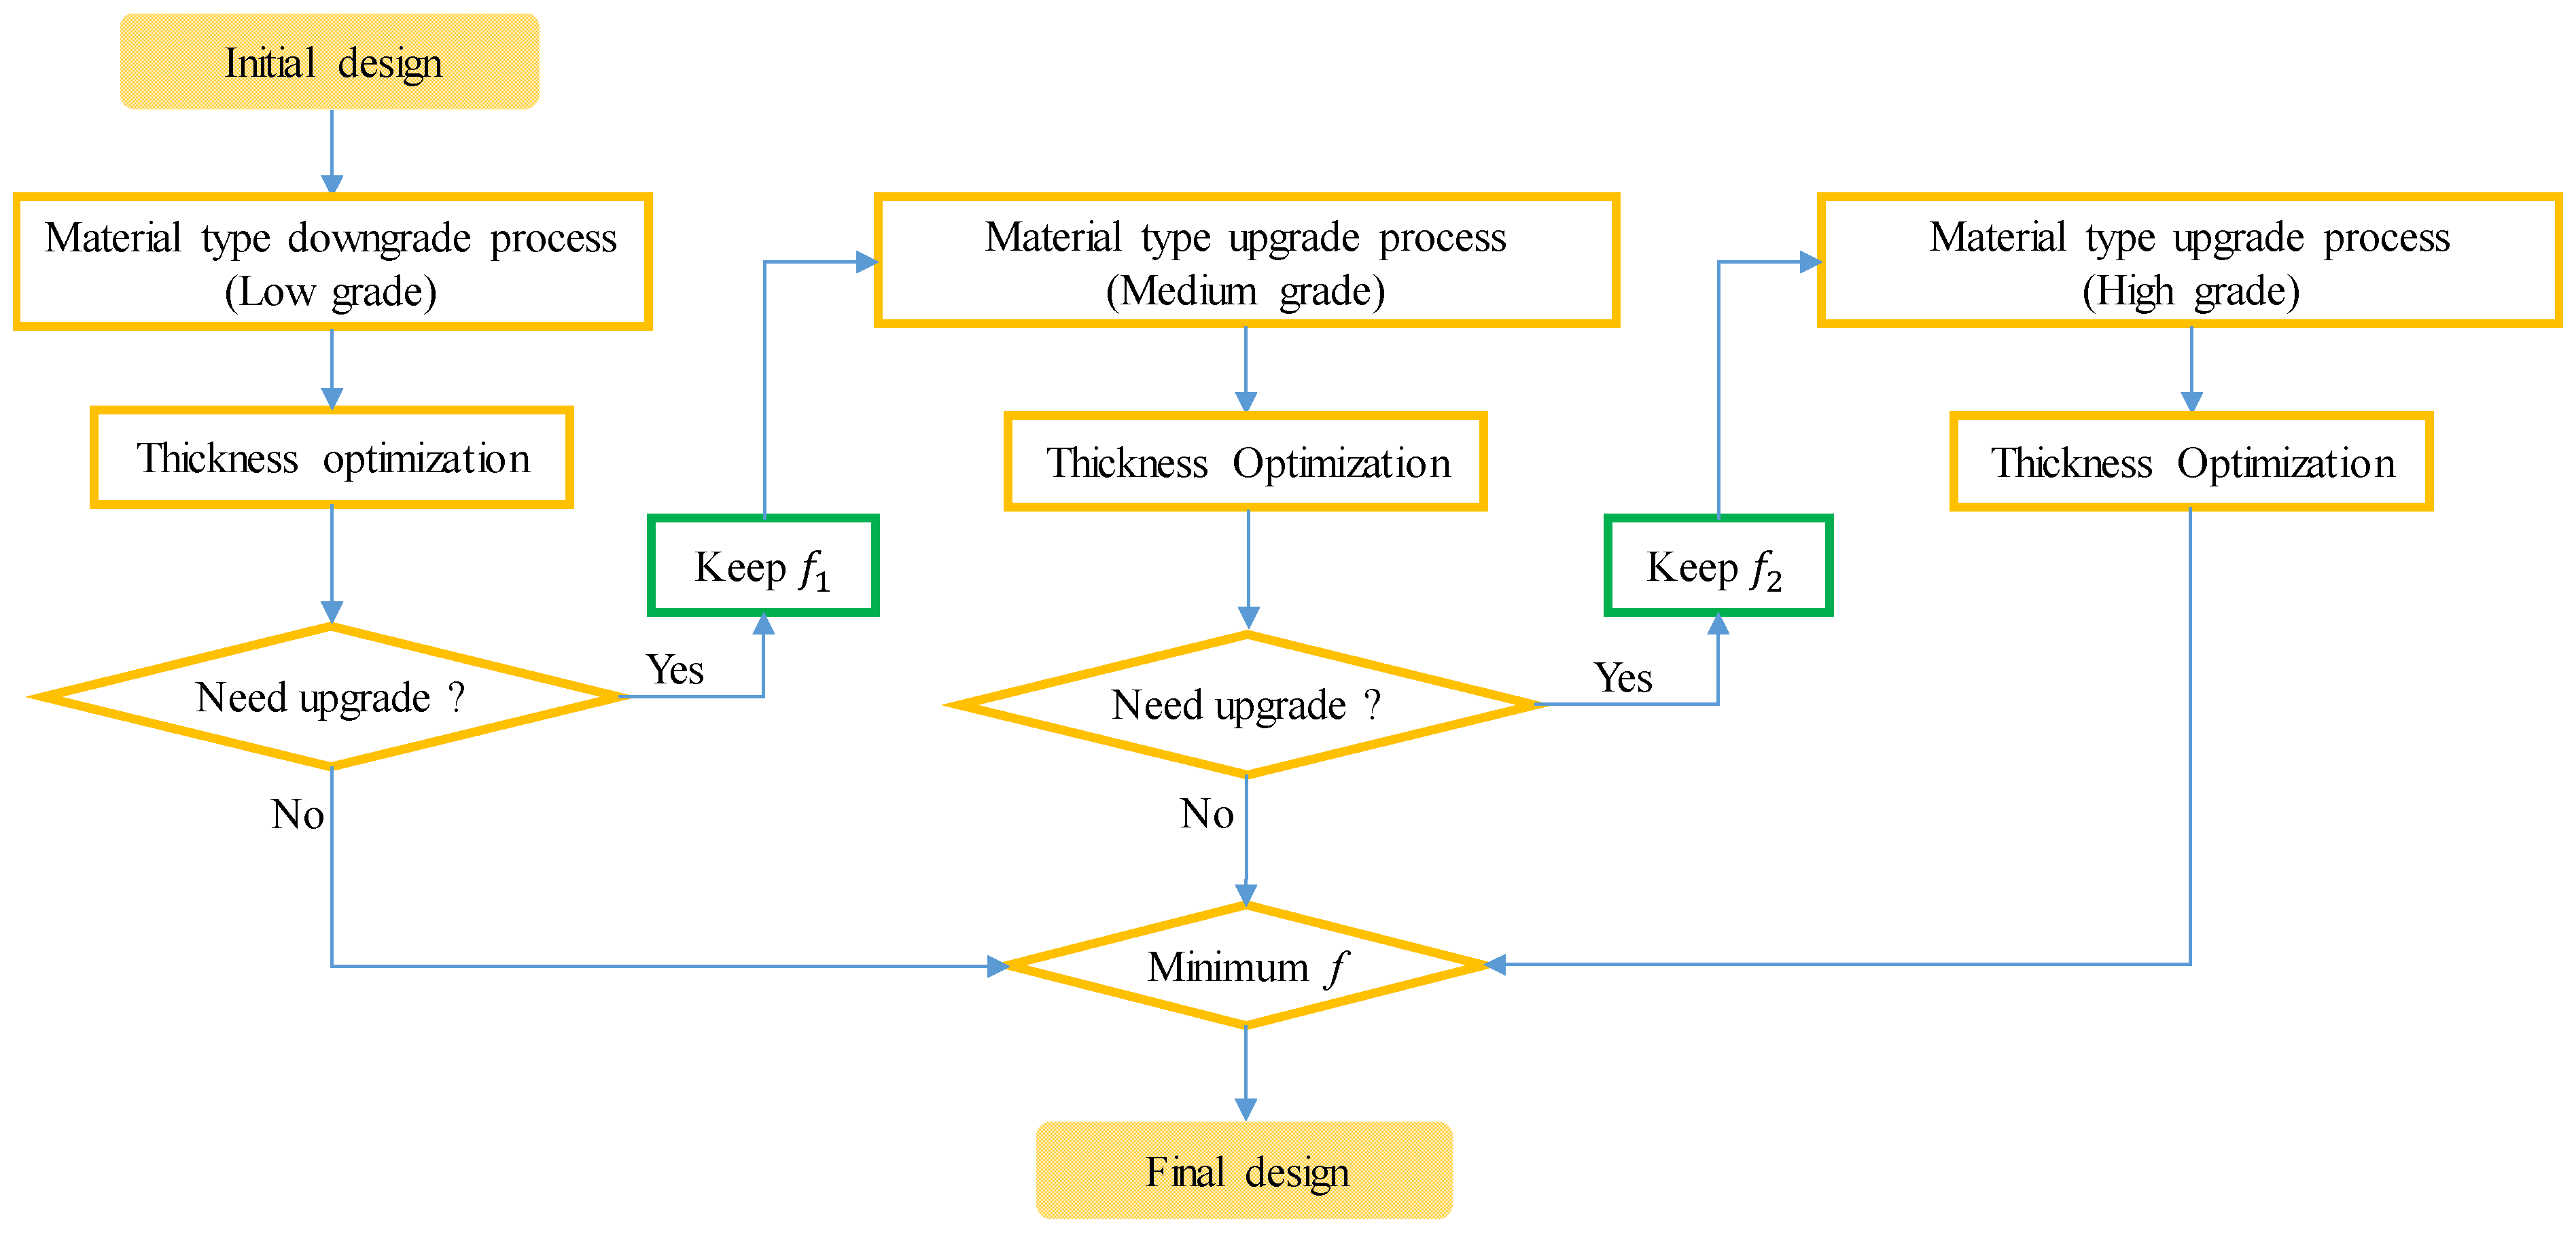
The next step is to identify the plate that needs an upgrade and change it to a suitable material type. The process continues until the last stage, where the minimum objective function f, which is the material cost from each stage, is found. The optimization algorithm is represented in Figure 2, which shows the step-by-step process of the proposed method. The integration of FEM and optimization algorithms provides an effective way to optimize the material selection process and the size optimization of a plate structure.

2.1. Material Selection Strategy

Material selection is an essential aspect of engineering design, and it involves choosing the most appropriate material for a given application based on various factors such as mechanical properties, cost, availability, and environmental impact (Emovon and Oghenenyerovwho, 2020) [17]. The selection of the wrong material can lead to failure, which can be costly and even catastrophic. As shown in Figure 2, the downgrading and upgrading processes are used to simplify the process of selecting a suitable material for a given application. In the downgrading process, all plate material types are initially downgraded to the cheapest materials to equalize the distribution of material types. This means that all plate materials are evaluated based on their cost, and the cheapest material is selected as the baseline material.
However, it is essential to note that the cheapest material may not always meet the required mechanical properties for the application. Therefore, in the upgrading process, several plates that exceed the expected thickness criteria are upgraded to a higher-grade material with better mechanical properties. This ensures that the selected material meets both the cost and mechanical requirements of the application. Overall, the downgrading and upgrading processes are useful tools for simplifying the material selection process, ensuring that the selected material meets both the cost and mechanical requirements of the application.
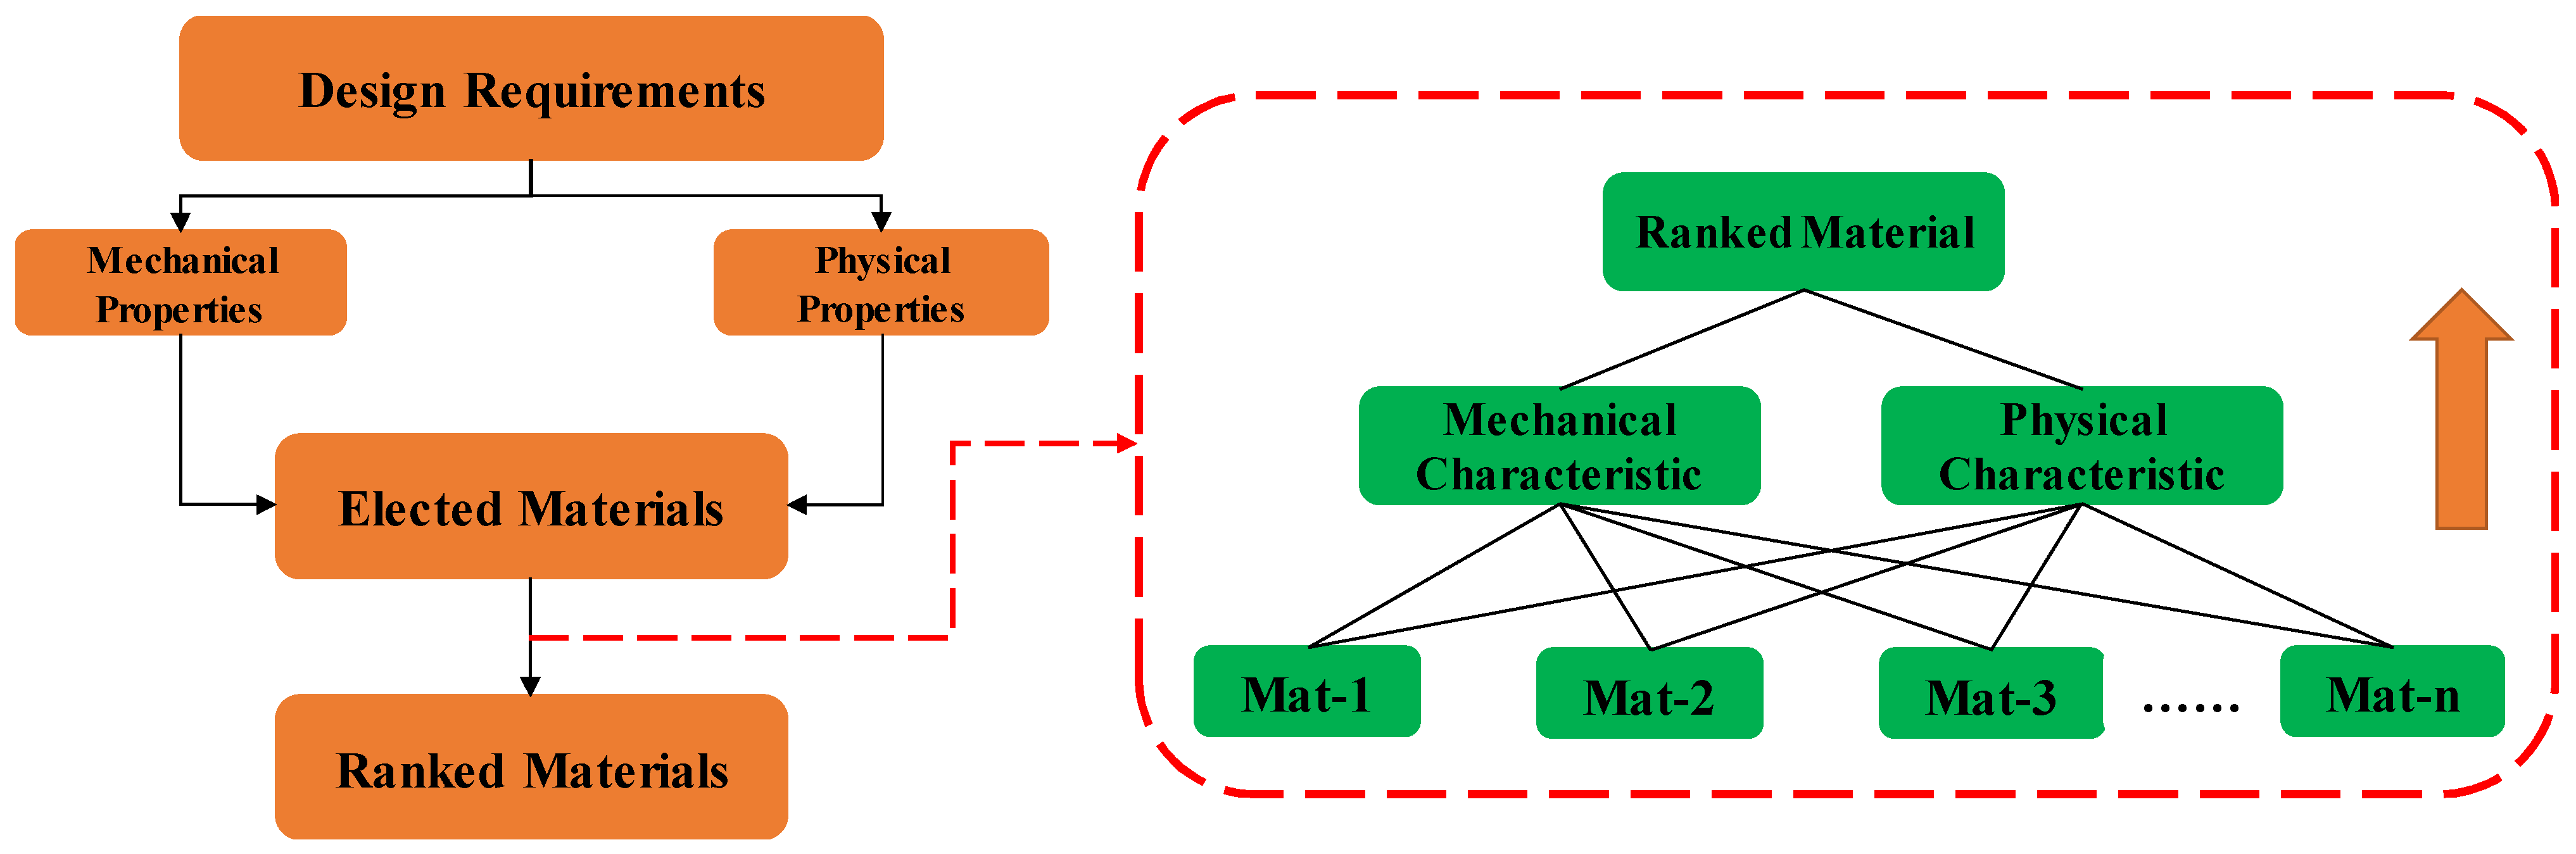
As shown in Figure 3 above, the material selection process involves obtaining material data from supplier data sheets or manuals, which provide information on the mechanical and physical properties of various materials. The mechanical properties typically include parameters such as yield strength, ultimate strength, modulus of elasticity, and toughness, while the physical properties may include parameters such as density and material cost.
To rank the materials based on their suitability for a given application, a combination of high-yield strength and low material cost is often considered. The reason for this is that materials with high yield strength can withstand higher stress levels, which can lead to better performance and reliability in the application. At the same time, selecting a material with a low material cost can help to minimize the overall material cost of the application.
Equation (1) is likely used to obtain the material rank based on the criteria of yield strength and material cost, where σ y is the yield strength and C is the material cost. Dividing the yield strength by the material cost gives a dimensionless quantity that can be used to rank the materials. This ratio represents the amount of yield strength that can be obtained per unit of material cost, with higher values indicating a better value for money. By calculating the material rank for each candidate material using this ratio, it is then possible to rank them in order of suitability and select the most appropriate material for the application.
σ y C
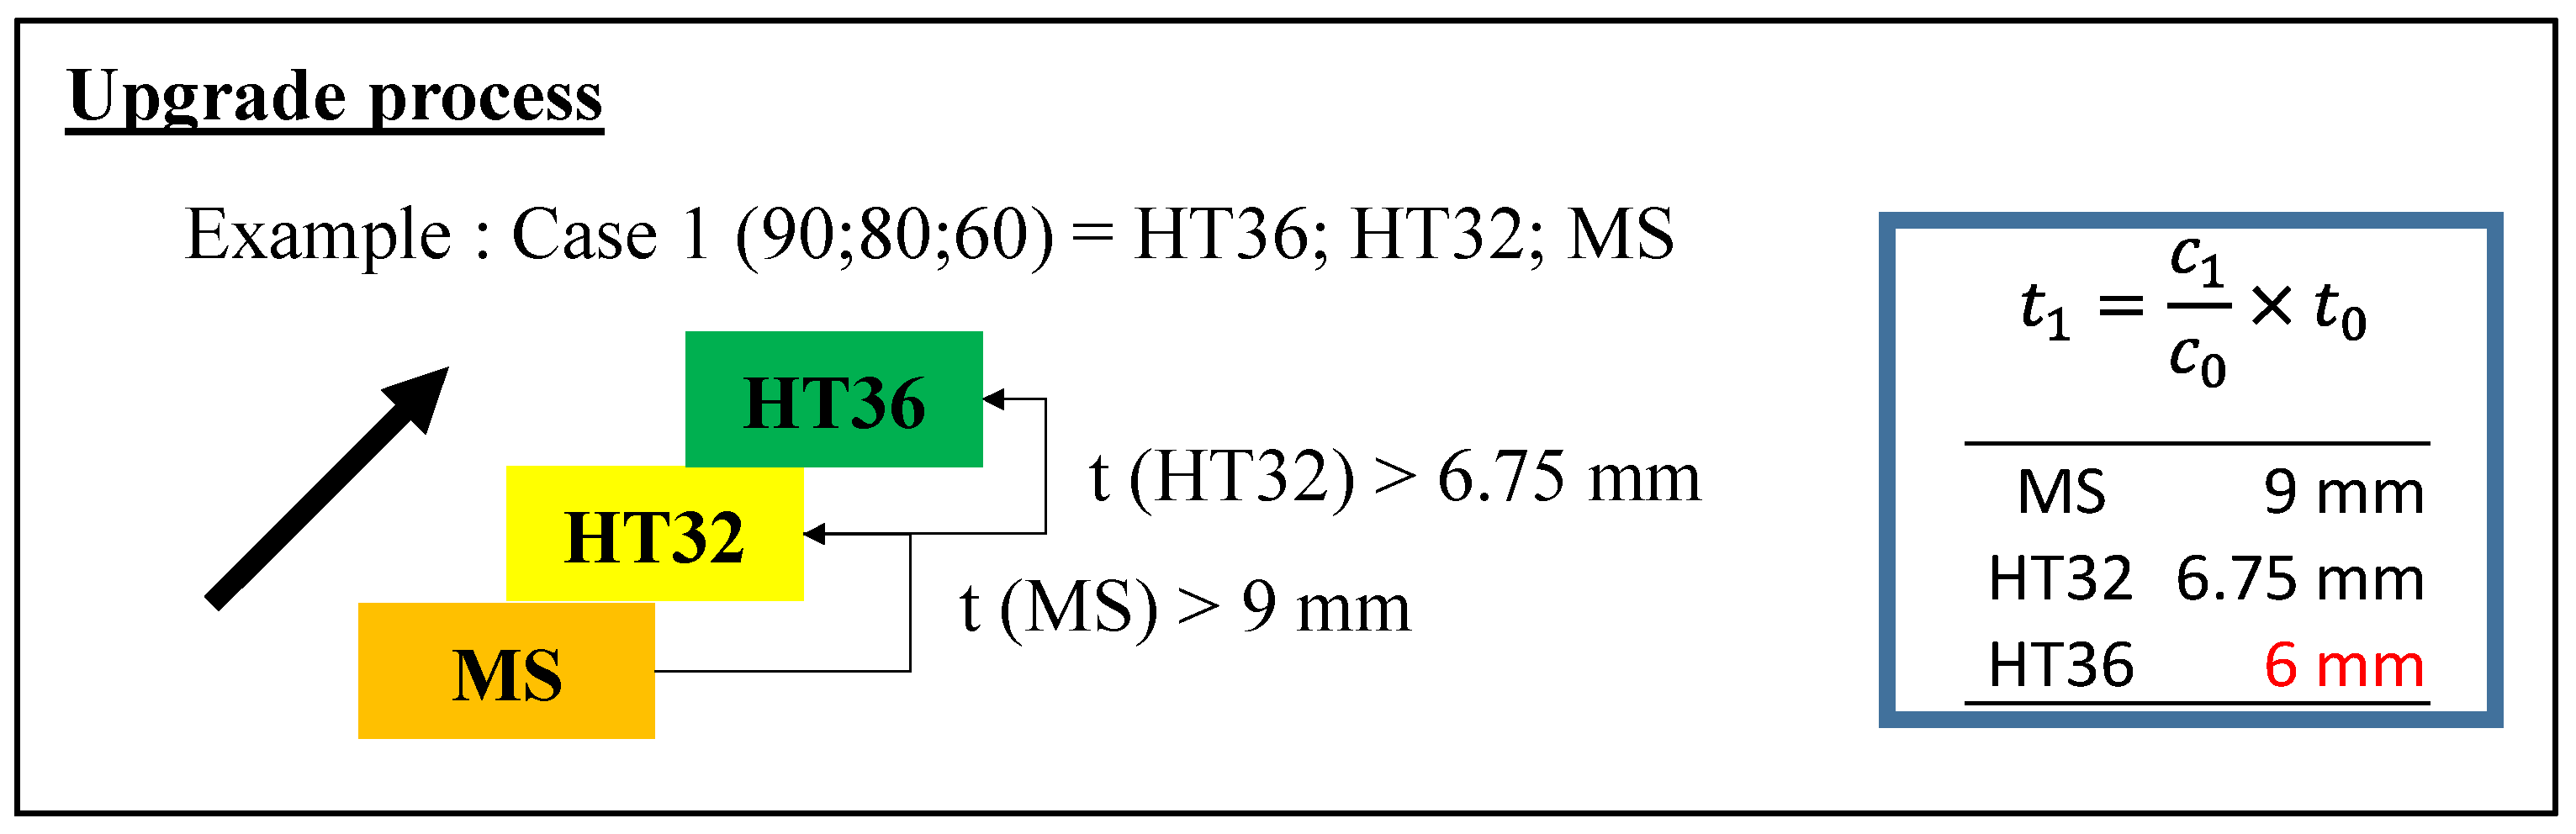
Equation (2) is used to determine the thickness of the substitute material (t1) based on the original material thickness (t0) and the ratio of material prices (c1/c0) between the original and substitute materials. The equation implies that the thickness of the substitute material can be adjusted to maintain the same total material cost, even if the cost per unit thickness of the substitute material is different from that of the original material.
t 1 = c 1 c 0 × t 0
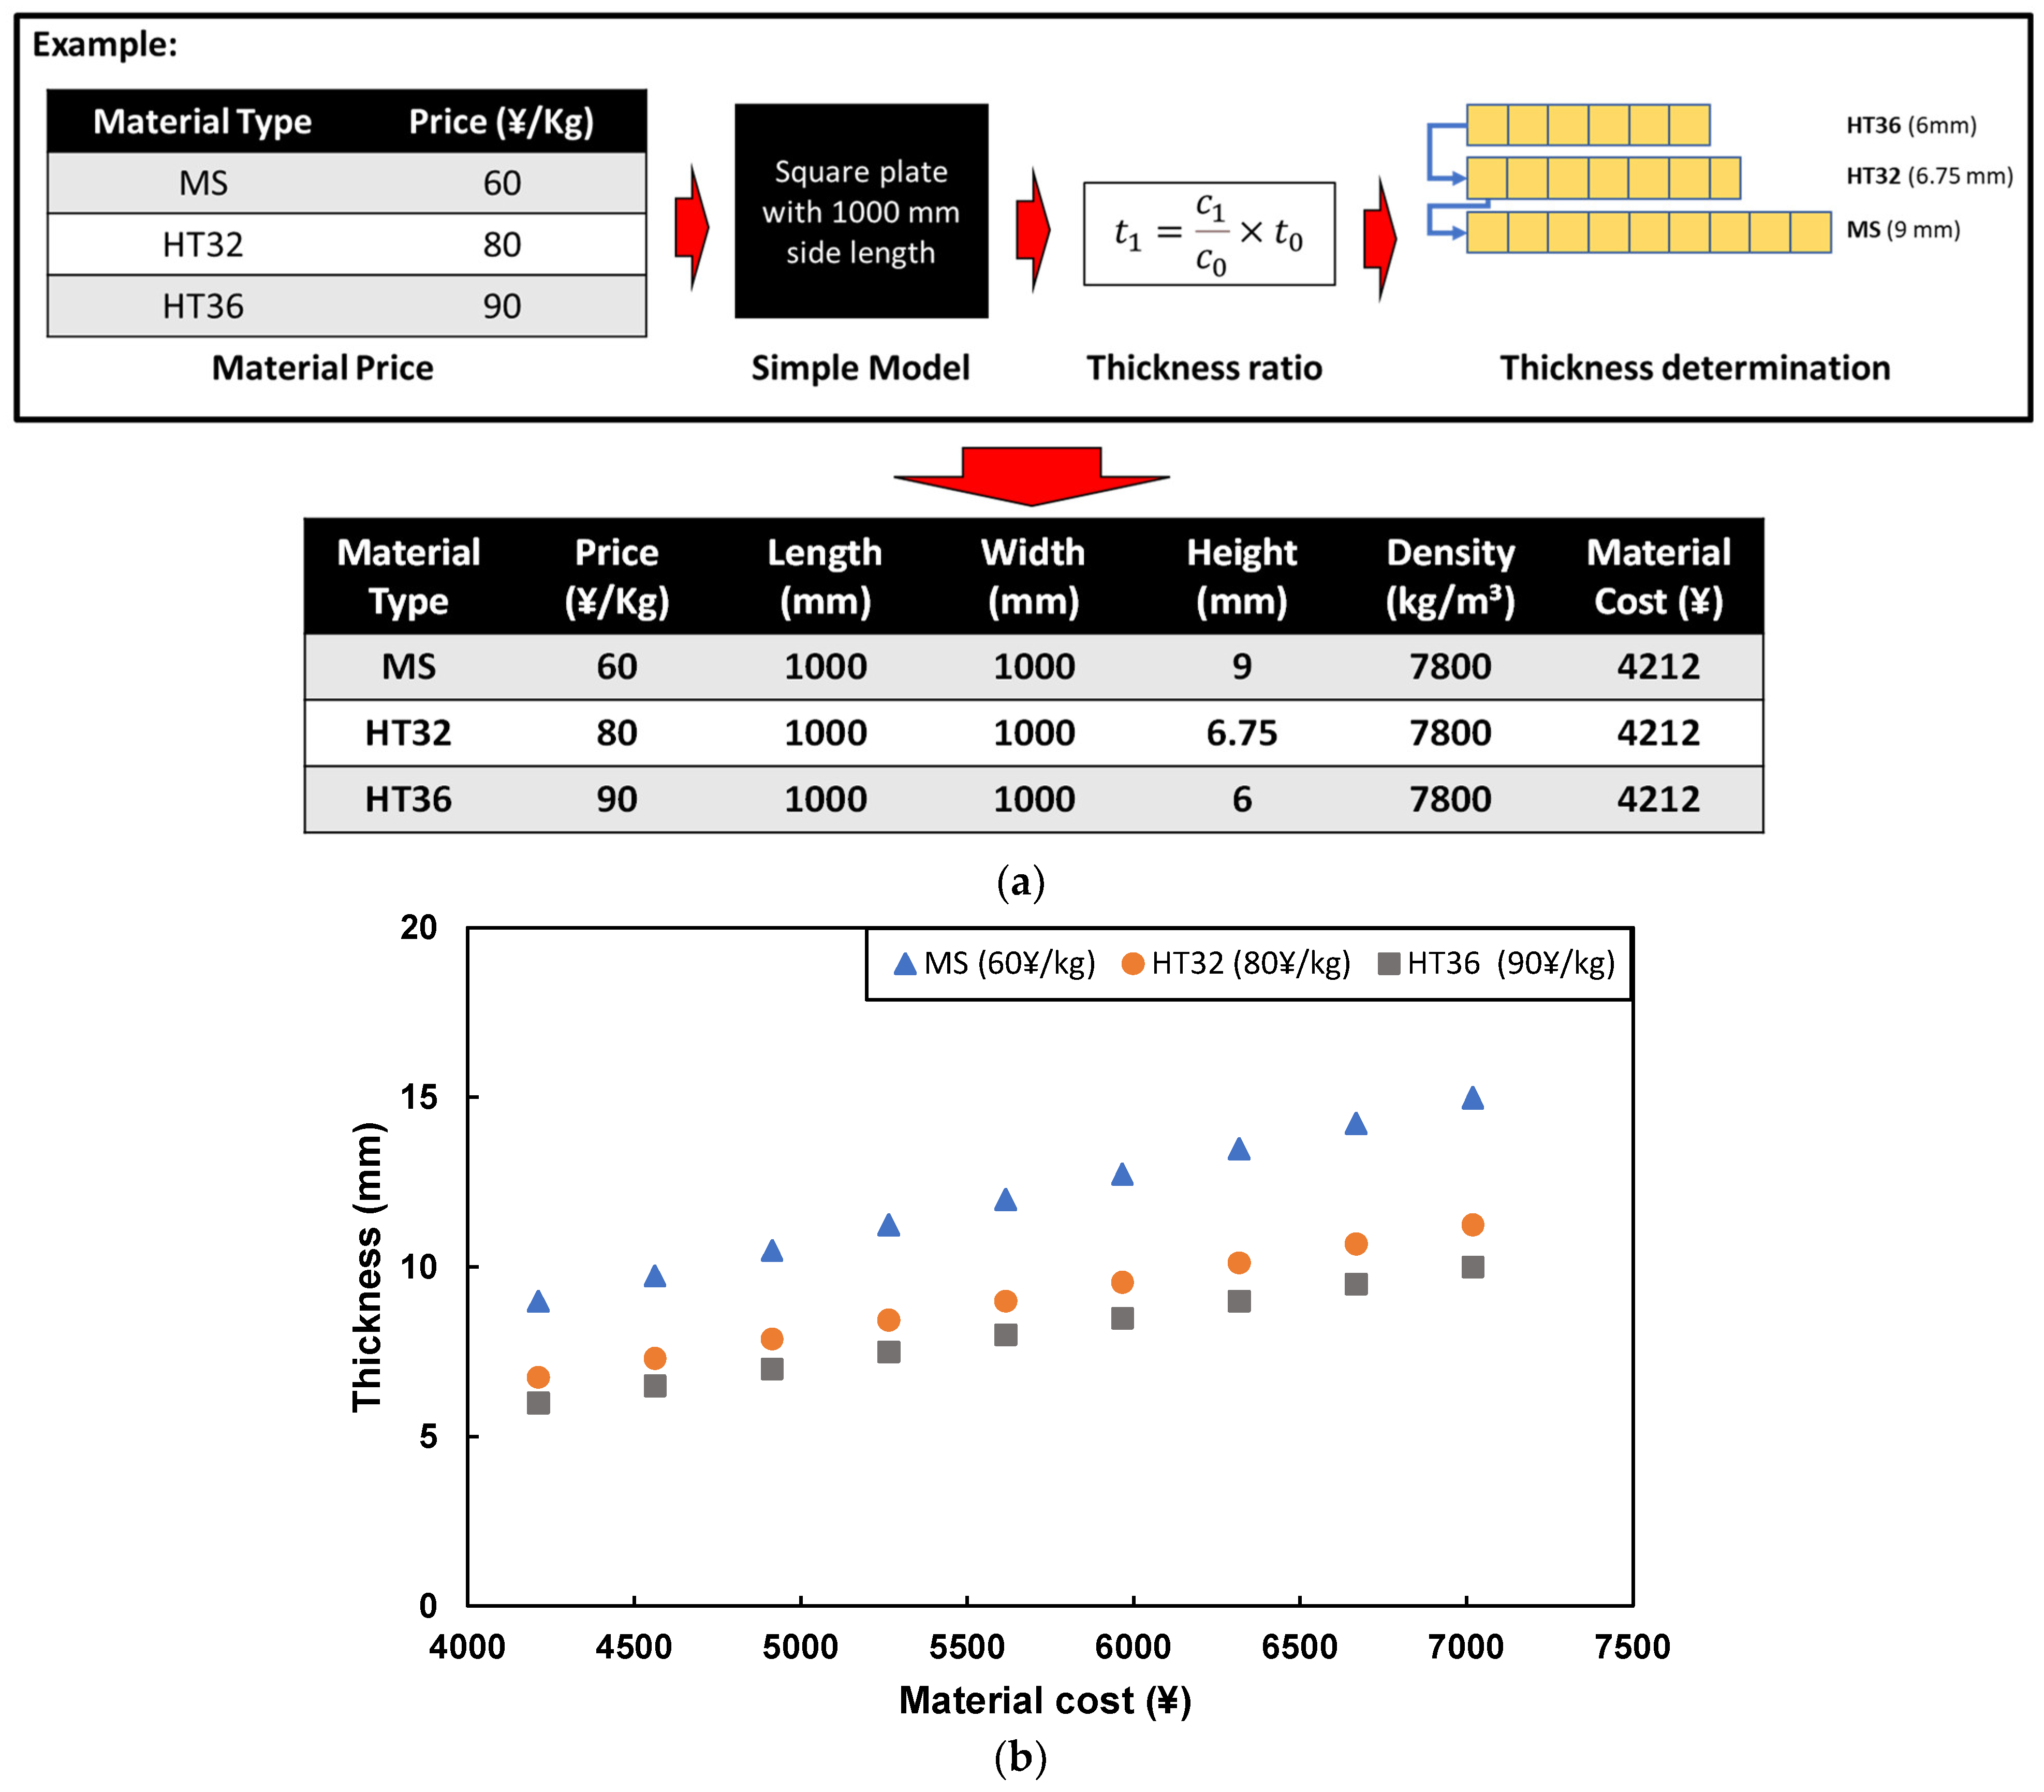
Figure 4 illustrates the principle of material upgrading based on plate thickness. When the plate thickness is the same for different materials, the total material cost is also the same. However, if the thickness of a particular material exceeds a certain threshold, the upgrading process is initiated to reduce the material cost while maintaining the required mechanical properties. For example, if an MS plate exceeds a thickness of 9 mm, upgrading to a higher yield strength material such as HT32 can reduce the thickness to 6.75 mm and lower the material cost.
Equation (3) specifies the conditions for material upgrading based on the Cost-Effectiveness Score (CES), which is the ratio of yield strength to material cost. The equation implies that the CES of the low-grade material should be less than or equal to that of the medium-grade material, which should in turn be less than or equal to that of the high-grade material. The upgrading process should be initiated when the CES of the original material is lower than that of the substitute material. This ensures that the upgraded material provides better value for money in terms of yield strength and material cost.
σ y C L o w g r a d e σ y C M e d g r a d e σ y C H i g h g r a d e
Figure 4. (a) Thickness determination based on price; (b) Thickness ratio.
Jmse 11 00640 g004
The material selection process in Figure 4 is based on the thickness ratio determination process, which considers both the yield strength and the price of each material. The CES (Cost Effectiveness Score) formula in Equation (1) is used to calculate the CES for each material, which is then used to determine the CER (Cost Effectiveness Rank) for each material. The CER provides a ranking of materials based on their CES values, allowing for quick and efficient material upgrading in the optimization process.
Table 2 provides an example of determining CES and CER based on price variations for five different materials. The purpose of testing the method under different price conditions is to ensure that it is effective even when prices are highly fluctuating. The results of the analysis will allow the user to select the most cost-effective material for a given application, based on the desired mechanical properties and material cost. By using the material selection process described in Figure 4 and Table 2, the user can optimize material selection to achieve the desired balance between cost and performance.
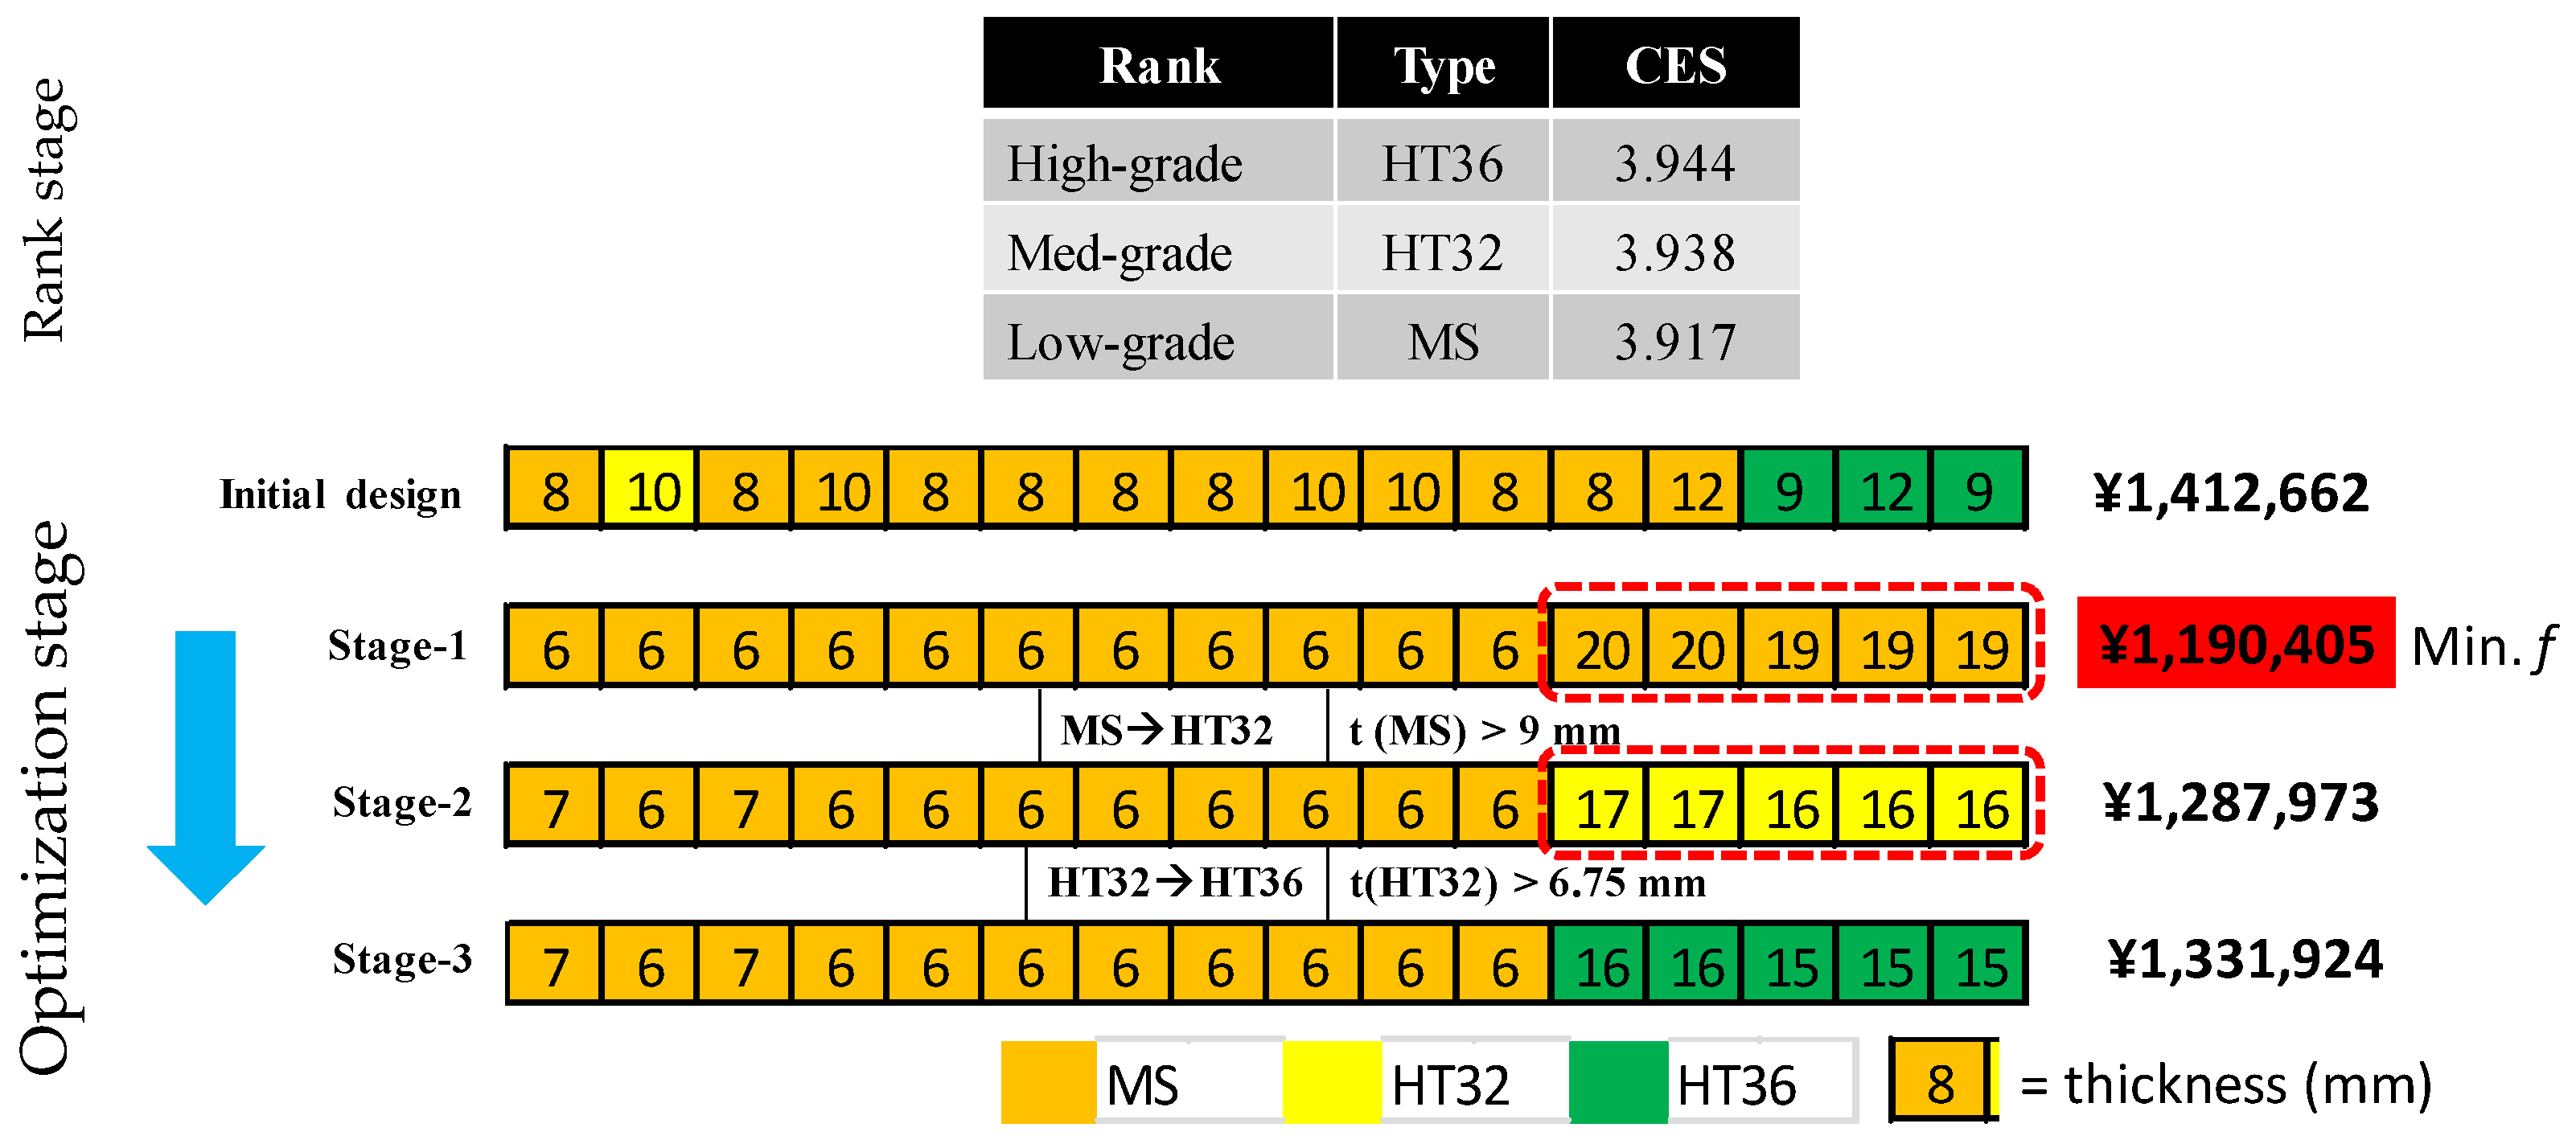
Figure 5 illustrates the step-by-step process for upgrading material types based on the Cost Effectiveness Rank (CER) and thickness criteria. The process begins with the lowest-rank material, in this case, MS plate. The determination of thickness limitations starts with the minimum thickness of the high-rank material, which is 6 mm, following Class regulations. Price ratios are used to determine the thickness limitations of other materials. When the thickness of the MS plate exceeds 9 mm, the upgrade process begins, and the plate is replaced with a higher-rank material, HT32 plate. Similarly, when the thickness of the HT32 plate exceeds 6.75 mm, it is upgraded to the highest-rank material, HT36 plate. The thickness ratio (Equation (2)) is used to determine the thickness of the upgraded material based on the material price ratio. Upgrading to higher-yield strength materials reduces the plate’s thickness, resulting in a decrease in material weight and cost. This process continues until the desired material type that satisfies both rank and thickness criteria is achieved.

2.2. Size Optimization

The size optimization process involves updating the plate thickness based on stress constraints to obtain an optimal thickness. The stress constraints include maximum stress σ m a x , shear stress σ s h , and bending stress σ b d . Equations (4)–(6) are used to determine the updated plate thickness estimates for each stress constraint (Kitamura et al., 2011) [18]. Equation (4) shows the thickness estimate for maximum stress, where t σ m a x a + 1 represents the updated thickness estimate, t a represents the initial thickness, σ m a x a represents the initial maximum stress, and σ c represents the stress constraint from the yield strength of the material used.
t σ m a x a + 1 = t a σ m a x a σ c
t σ s h a + 1 = t a σ s h a σ c
t σ b d a + 1 = t a σ b d a σ c
Equation (5) shows the thickness estimate for shear stress, where t σ s h a + 1 represents the updated thickness estimate and σ s h a represents the initial shear stress. Equation (6) shows the thickness estimate for bending stress, where t_ t σ b d a + 1 represents the updated thickness estimate and σ b d a represents the initial bending stress.
After obtaining the thickness estimates, the program will choose the thickest plate that does not exceed any of the stress constraints. This means that a plate will only reach the stress limit in one stress component. The program will then recalculate the thickness estimates until they produce the same stress values as the FEM analysis, without the need to recreate the FEM model. Overall, the size optimization process aims to reduce the weight of the plate while ensuring that it can withstand the stress constraints. By updating the plate thickness based on stress constraints, this process helps to minimize material usage and cost.

2.3. Optimization Process

The simplification of the optimization process proposed in the study involves two stages: material selection and size optimization (as shown in Figure 6). The process starts with creating a model in CAD software for structural analysis using FEM. Load and boundary conditions are determined, and constraint checking is carried out based on the rules to ensure that all conditions are within the allowed limits.
In the first stage of optimization, the suitable plate material type is selected based on the CES score, which considers the yield strength of the material and its price. In the second stage, size optimization is performed to determine the optimal plate thickness. The optimization results are then verified using FEM, and several constraints are applied in the iterative process until convergence is achieved. The combination of the down- and upgrading method and the size optimization method is expected to reduce material cost while keeping computational time low. The optimization process is divided into two stages: plate material type rank stage and optimization stage. The initial design is input into the first stage, where all material types are applied using low-rank plate material as shown in Figure 7. The red background color in the figure highlights the thickness limitation for each material type. If a plate’s thickness exceeds this limit, it must be replaced with a higher-ranked material, as shown in the upgrading process. The final step of the optimization process involves identifying the minimum objective function from all stages to arrive at the ultimate solution, which is indicated by the red box as the minimum material cost.

2.4. Genetic Algorithm

The genetic algorithm is widely used in optimization problems due to its ability to search for optimal solutions in a large search space (Liu et al., 2023) [19]. However, it has some limitations, such as the possibility of becoming stuck in local optima and the need for a large number of iterations to obtain the optimal solution (Wang, Cao, and Si, 2021) [20]. On the other hand, the proposed method in this study aims to simplify the optimization process by dividing it into two stages, making it computationally efficient while still obtaining the optimal solution.
The genetic algorithm is a powerful optimization technique that can be used to find the optimal solution for a given problem (Rojas et al., 2023) [21], (Hatamizadeh and Sedaee, 2023) [
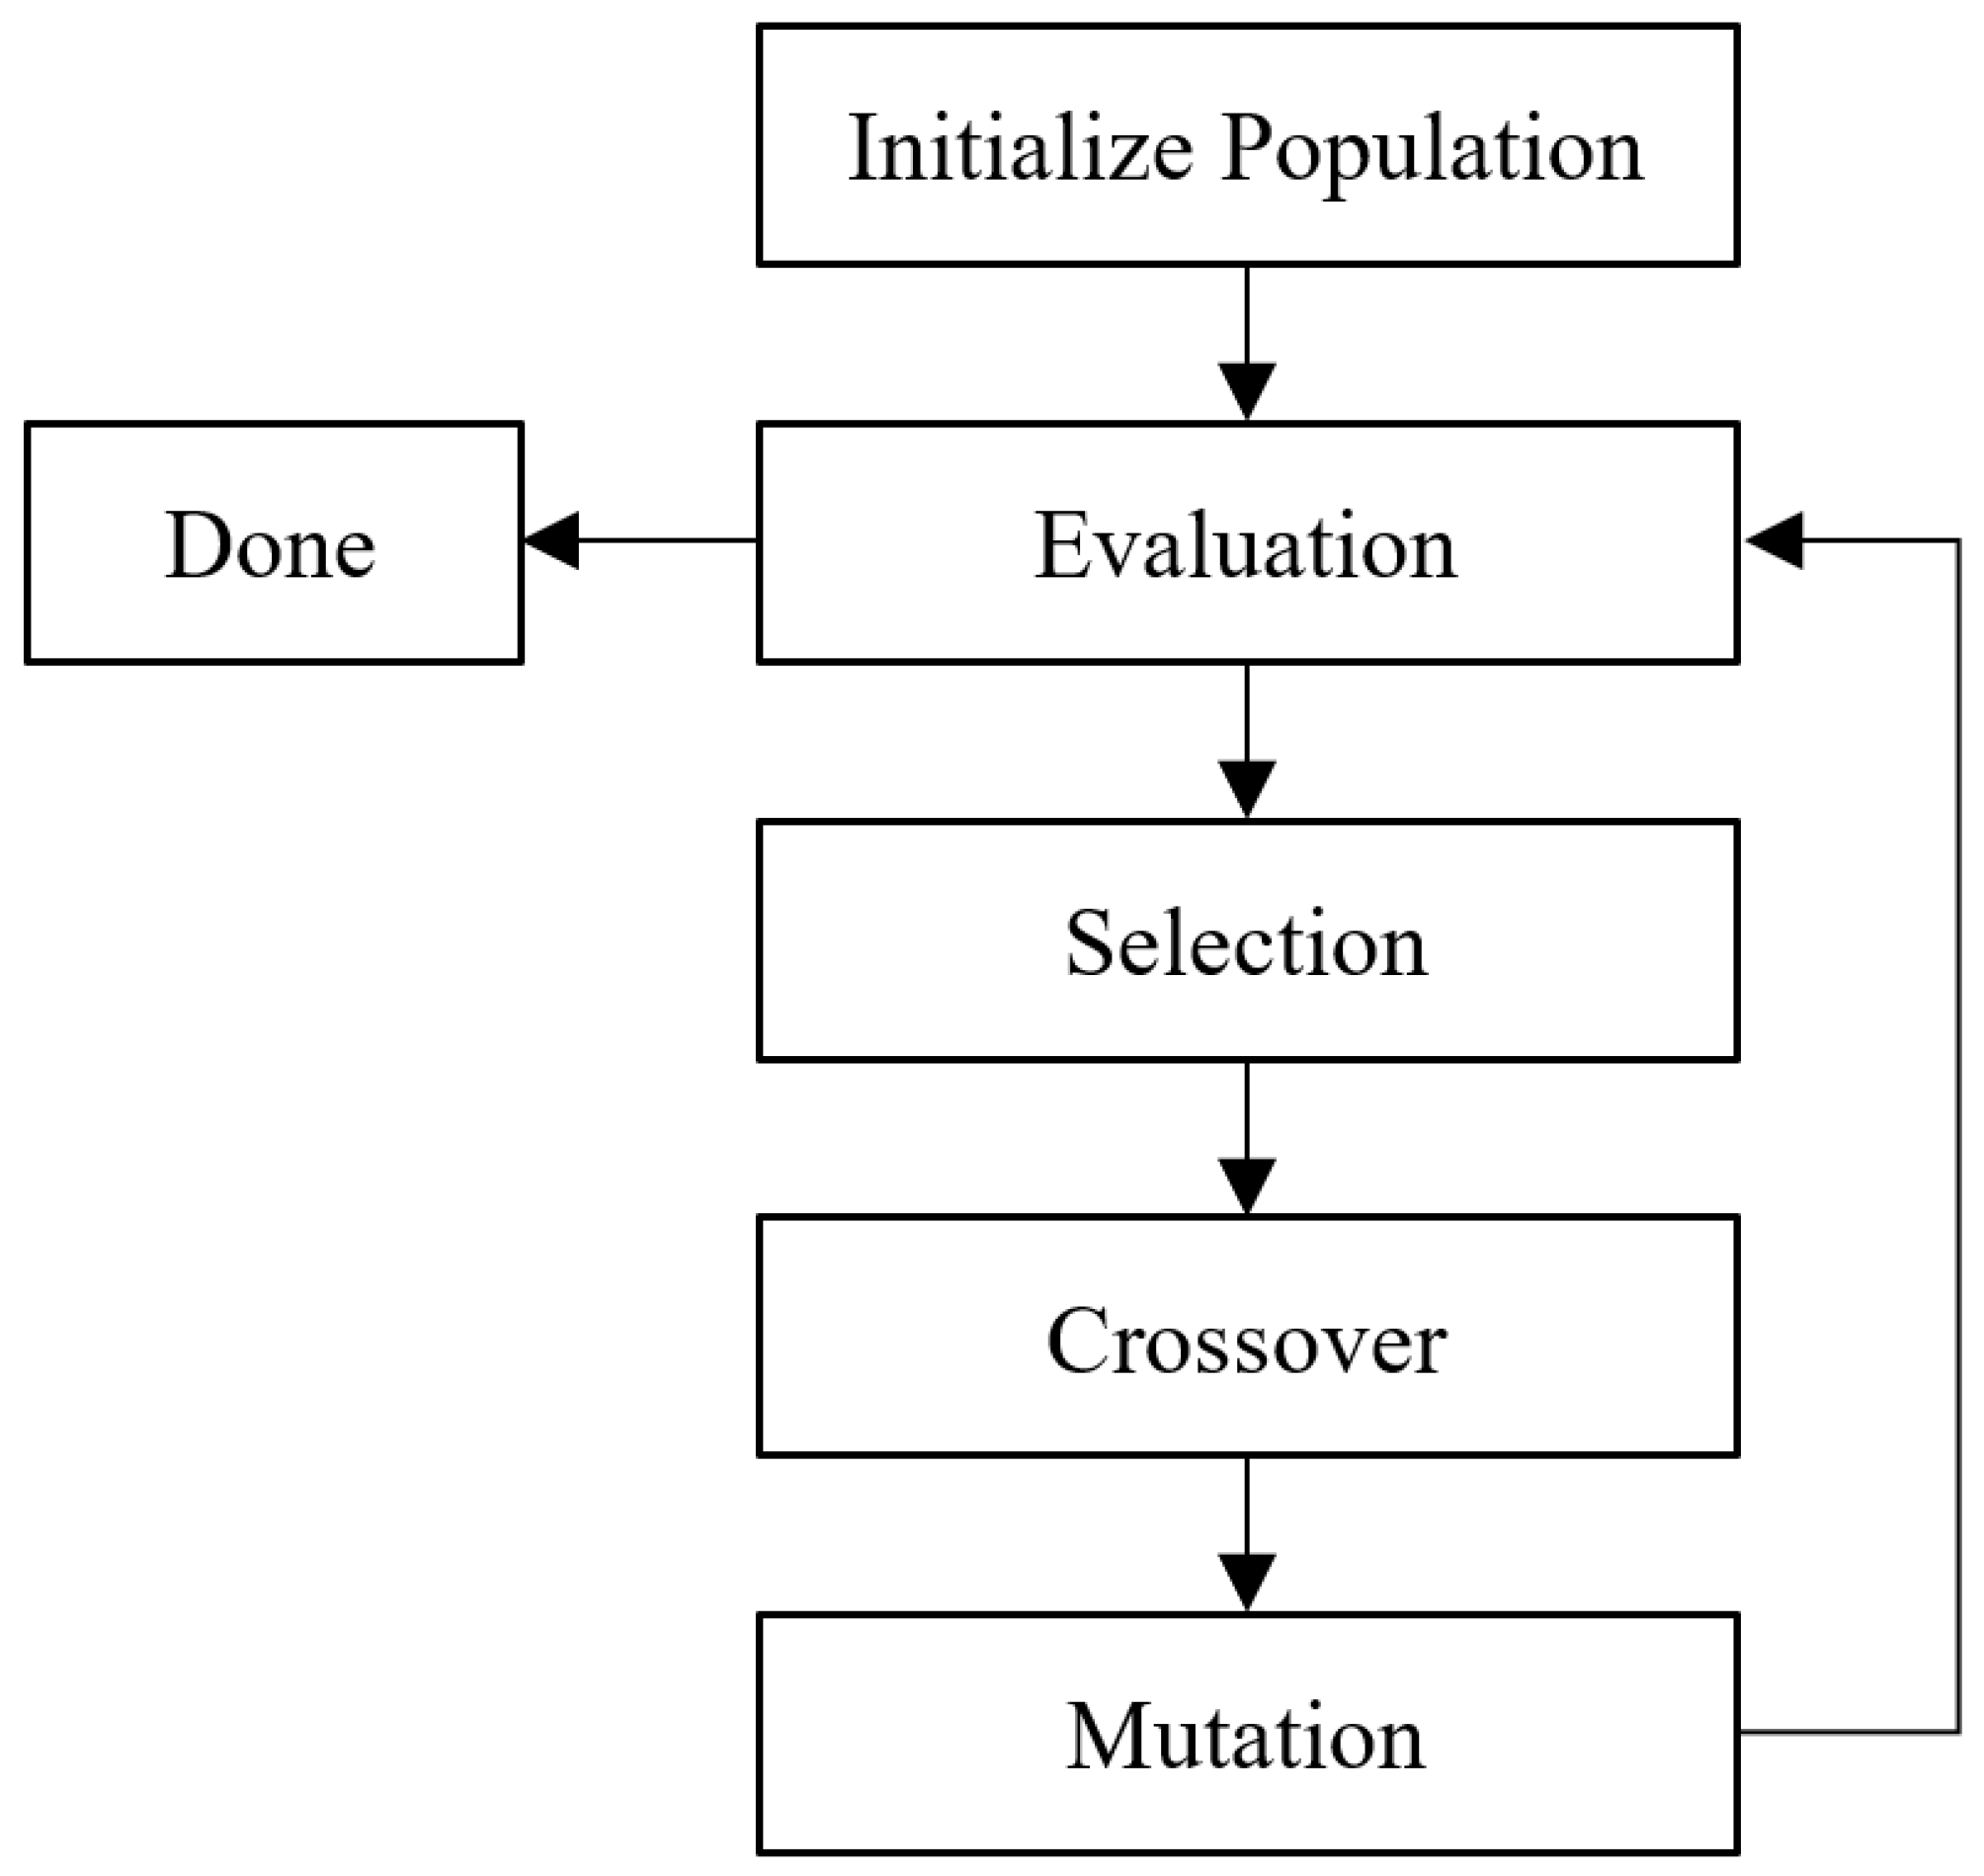
22]. In the context of plate optimization, the genetic algorithm can be used to find the optimal combination of material type and plate thickness. The genetic algorithm works by creating a population of individuals, each representing a potential solution to the problem. The population is then evaluated based on a fitness function, which measures how well each individual satisfies the constraints and objectives of the problem. The selection process chooses the fittest individuals from the population to be the parents of the next generation. The crossover process then combines the genetic information of two parents to create new offspring, which are then mutated randomly to create additional diversity in the population. As shown in Figure 8, this process of selection, crossover, and mutation is repeated for a number of generations until a satisfactory solution is found (Futuyma, 2014) [23].

3. Case Study

3.1. Model

The objective of the study is to optimize the design of these hatch covers by selecting the appropriate plate material type and reducing the plate thickness while maintaining compliance with class regulation recommendations. It is important to note that optimizing the design of ship components such as hatch covers can lead to significant benefits in terms of weight reduction, cost savings, and improved performance. However, it is also critical to ensure that any modifications made to the design comply with the regulations and safety standards set by the classification societies.
Figure 9 depicts the first model with a partially covered bottom plate, presents a unique challenge in terms of optimization as the stiffness and strength requirements may differ between the top and bottom plates. The use of different materials and stiffener configurations can help achieve the desired performance while minimizing weight. The second and third models, with full cover stiffened plates, also offer opportunities for optimization by selecting the appropriate plate material and stiffener configuration. The existing design provided by the shipyard company can serve as a baseline for comparison with the optimized design, as shown in Table 3.

3.2. Design Variables

The selection of design variables also determined the optimization method utilized to achieve optimal and efficient outcomes. In this study, the chosen design variables were the plate material type (mi) and the plate thickness (ti). Three material types were chosen from a pool of commonly used configurations in the shipyard industry, as shown in Table 4.

3.3. Constraints

In an optimization problem, constraints limit the results according to design requirements, where the value is constant during the optimization process. Constraints can be classified as equality or inequality constraints. An equality constraint is easy to incorporate but requires more effort to satisfy and is more restrictive, as it narrows down the region. On the other hand, an inequality constraint is more flexible in the design selection (Venkataraman, 2002) [24].
In this study, the constraint followed the recommendation of the IACS Common Structural Rules for Tankers and Bulk Carriers (IMO, 2012) [25], which recommended an inequality constraint to create more design choices. This constraint is expected to be implemented in real conditions. There were four constraints applied as follows:
δ 0.0056 · l m a x   mm
In Equation (7), δ refers to the deformation limit and l m a x refers to the greatest span of the primary supporting members.
σ m a x 0.8 R e H   N / m m 2
σ s h 0.46 σ m a x   N / m m 2
In Equation (8), σ m a x refers to the maximum stress on the structure and R e H refers to the yield strength of the material used, which, in this case, was 235 N/mm2 for MS, 315 N/mm2 for HT32, and 355 N/mm2 for HT36. Finally, in Equation (9), σ s h refers to the shear stress on the structure.
t = F p 15.8 s p 0.95 R e H   mm
where:
  • F p : factor for combined membrane and bending response (1.50 in general);
  • s: stiffener spacing (mm);
  • p: pressure (N/mm2);
  • σ a : allowable stress (N/mm2).
In Equation (10), t refers to the minimum plate thickness of the hatch cover which is to be not less than 1% of the stiffener spacing or 6 mm if that is the greater spacing.

3.4. Objective Function

The objective of this study is to minimize the total material cost of the structure. The optimal solution corresponds to the lowest objective function result. The material cost of the plate structure can be computed using Equation (11), which is defined as follows:
m i n   f t , C = i = 0 n 1 t i l x L y ρ C i   [ ¥ ]
where:
  • Lx = width or length in x-direction (mm);
  • Ly = width or length in y-direction (mm);
  • ρ = material density (kg/mm3);
  • ti = plate thickness (mm);
  • Ci = material price (¥/kg).

4. Result and Discussion

An optimization program was developed by integrating finite element analysis using a C language program to optimize the initial design. The results of the proposed method will be compared with those of the genetic algorithm (GA). The initial design of the hatch cover is obtained from the company and will be optimized by changing the plate material type and reducing the plate thickness.
The material prices obtained from the company will be entered as the input data in the optimization process. The optimization process is carried out on three different models by comparing the proposed method and the genetic algorithm (GA). The GA parameters used are explained in Table 5 above. The GA’s role is to select the appropriate plate material type to minimize the total material cost and proceed to the stage of determining plate thickness by size optimization.
As shown in Figure 10, Figure 11 and Figure 12, the proposed method has the ability to choose the appropriate plate material type and perform as well as the genetic algorithm in terms of minimizing the total material cost. This is a positive result for the proposed method and suggests that it can be a viable alternative to the GA approach. However, it is important to verify these results with different models and parameter settings to ensure the robustness of the proposed method.
In this study, the proposed method was tested on three different FEM models, and the results were compared to those obtained by the genetic algorithm. The second and third FEM models had a different number of plates and material types compared to the first model. Despite the differences, the proposed method still produced significant results that were comparable to the genetic algorithm. The advantage of the proposed method is that it uses a simple method to upgrade materials by mimicking the process of climbing stairs, which is much faster compared to the genetic algorithm that selects the best individuals from each generation.
The proposed method is noteworthy as it exhibits comparable results to the genetic algorithm in terms of selecting appropriate plate materials and thickness distributions while being more computationally efficient. The proposed method’s capability to optimize the plate thickness distribution while considering the deformation and stress constraints set in the design indicates its potential for use in real-life engineering problems. In future studies, it would be beneficial to further validate and compare the proposed method with other optimization algorithms.
Figure 13 depicts the total material cost of the optimization results for various price variations. The results for the first model indicate a negligible difference in the outcome for price variation no. 2, where the difference is only 0.2%. Conversely, other price variations exhibit the same results as the GA. Similarly, for the second model, the outcomes tend to be similar to those of the first model, with a difference in results of 0.5% for price variation no. 4. The third model shows a difference of less than 0.2% for price variation no. 3. In summary, the results of the proposed method demonstrate considerable accuracy in minimizing material costs.
The proposed method has demonstrated satisfactory results in the three models above, where only one or two materials differ from the results obtained through the GA. The method’s ability to select materials is tested using various price variations to evaluate its performance. Price variations no. 1, 3, and 4 have significant price differences between MS, HT32, and HT36, and the results indicate that in the first model, the proposed method selects the same type of material as the GA. However, in the second model, there are one or two different materials, which can be attributed to the larger number of plates compared to the first model. In the third model, only one price variation is different, while the others are the same.
Price variation no. 2 has a very slight price difference, making the material selection decision slightly more challenging compared to other price variations. In the first and third models, only two types of materials differ, while the second model has the same results. Price variation no. 5, which has no price difference, tends to choose the HT36 material, which has the advantage of high yield strength, enabling it to produce plates with lower thicknesses. Therefore, selecting HT36 can be very profitable in terms of weight and cost. In general, the proposed method is very impressive in choosing the type of material as a substitute for GA. Another benefit of the proposed method is its low computation time, requiring only 2% of the time needed by the genetic algorithm (GA), as shown in Table 6.

5. Conclusions

In order to improve efficiency in terms of material cost and computational time, this study focuses on plate structures as the object of optimization. The optimization algorithm consists of two stages: the proposed method for selecting a suitable plate material type and the size optimization method for determining the optimal plate thickness. The proposed method provides a faster and easier way to choose materials compared to the commonly used genetic algorithms, which require a longer computational time. The key to the proposed method is the price ratio, which ensures that the maximum plate thickness is maintained while keeping the material cost low.
The results show that the proposed method yields solutions that are almost similar to those obtained by the genetic algorithm, with differences in the objective function result being less than 1%. This indicates that the proposed method is successful in providing a suitable plate material type. Furthermore, the proposed method offers the benefit of lower time consumption, which is also an important issue that needs to be addressed in optimization studies. Recently, many studies have focused on developing new algorithms and methods to reduce computational time.

Author Contributions

Methodology, G.L.P. and M.K.; Writing—original draft, G.L.P.; Writing—review & editing, G.L.P. and M.K. All authors have read and agreed to the published version of the manuscript.

Funding

Hibah Publikasi Terindeks Internasional (PUTI) Q2 No: NKB-1473/UN2.RST/HKP.05.00/2022.

Institutional Review Board Statement

Not applicable.

Informed Consent Statement

Not applicable.

Data Availability Statement

Not applicable.

Acknowledgments

This work was partially supported by Hibah Publikasi Terindeks Internasional (PUTI) Q2 No: NKB-1473/UN2.RST/HKP.05.00/2022.

Conflicts of Interest

The authors declare no conflict of interest.

References

  1. Dong, D.T.; Cai, W. A comparative study of life cycle assessment of a Panamax bulk carrier in consideration of lightship weight. Ocean Eng. 2018, 172, 583–598. [Google Scholar] [CrossRef]
  2. Council, E.M.E. Green Ship Technology Book: Existing Technology by the Marine Equipment Industry: A Contribution to the Reduction of the Environmental Impact of Shipping. European Marine Equipment Council. 2010. Available online: https://books.google.co.id/books?id=qXyhAQAACAAJ (accessed on 20 December 2022).
  3. Kallassy, A.; Marcelin, J.L. Optimization of stiffened plates by genetic search. Struct. Multidiscip. Optim. 1997, 13, 134–141. [Google Scholar] [CrossRef]
  4. Marcelin, J.L. Genetic optimization of stiffened plates and shells. Int. J. Numer. Methods Eng. 2001, 51, 1079–1088. [Google Scholar] [CrossRef]
  5. Alinia, M. A study into optimization of stiffeners in plates subjected to shear loading. Thin-Walled Struct. 2005, 43, 845–860. [Google Scholar] [CrossRef]
  6. Wang, B.; Tian, K.; Hao, P.; Cai, Y.; Li, Y.; Sun, Y. Hybrid analysis and optimization of hierarchical stiffened plates based on asymptotic homogenization method. Compos. Struct. 2015, 132, 136–147. [Google Scholar] [CrossRef]
  7. Nonami, R.; Kitamura, M.; Takezawa, A.; Hirakawa, S. A Study on Optimization the Structure of Ship in Consideration of Layout of the Stiffeners. In Proceedings of the Twenty-Fourth International Ocean and Polar Engineering Conference, Busan, Republic of Korea, 15–20 June 2014; Volume 3, pp. 876–882. [Google Scholar]
  8. Um, T.-S.; Roh, M.-I. Optimal dimension design of a hatch cover for lightening a bulk carrier. Int. J. Nav. Arch. Ocean Eng. 2015, 7, 270–287. [Google Scholar] [CrossRef] [Green Version]
  9. Shin, S.-H.; Ko, D.-E. A study on minimum weight design of vertical corrugated bulkheads for chemical tankers. Int. J. Nav. Arch. Ocean Eng. 2017, 10, 180–187. [Google Scholar] [CrossRef]
  10. Putra, G.L.; Kitamura, M.; Takezawa, A. Structural optimization of stiffener layout for stiffened plate using hybrid GA. Int. J. Nav. Arch. Ocean Eng. 2019, 11, 809–818. [Google Scholar] [CrossRef]
  11. Poulikidou, S.; Schneider, C.; Björklund, A.; Kazemahvazi, S.; Wennhage, P.; Zenkert, D. A material selection approach to evaluate material substitution for minimizing the life cycle environmental impact of vehicles. Mater. Des. 2015, 83, 704–712. [Google Scholar] [CrossRef] [Green Version]
  12. Kaspar, J.; Baehre, D.; Vielhaber, M. Material Selection Based on a Product and Production Engineering Integration Framework. Procedia CIRP 2016, 50, 2–7. [Google Scholar] [CrossRef] [Green Version]
  13. Yang, S.; Nasr, N.; Ong, S.; Nee, A. Designing automotive products for remanufacturing from material selection perspective. J. Clean. Prod. 2017, 153, 570–579. [Google Scholar] [CrossRef]
  14. Mehmood, Z.; Haneef, I.; Udrea, F. Material selection for Micro-Electro-Mechanical-Systems (MEMS) using Ashby’s approach. Mater. Des. 2018, 157, 412–430. [Google Scholar] [CrossRef]
  15. Putra, G.L.; Kitamura, M. Study on optimal design of hatch cover via a three-stage optimization method involving material selection, size, and plate layout arrangement. Ocean Eng. 2021, 219, 108284. [Google Scholar] [CrossRef]
  16. Aires, R.F.D.F.; Ferreira, L. A New Multi-Criteria Approach for Sustainable Material Selection Problem. Sustainability 2022, 14, 11191. [Google Scholar] [CrossRef]
  17. Emovon, I.; Oghenenyerovwho, O.S. Application of MCDM method in material selection for optimal design: A review. Results Mater. 2020, 7, 100115. [Google Scholar] [CrossRef]
  18. Kitamura, M.; Hamada, K.; Takezawa, A.; Uedera, T. Shape optimization system of bottom structure of ship incorporating individual mesh subdivision and multi-point constraint. Int. J. Offshore Polar Eng. 2011, 21, 209–215. [Google Scholar]
  19. Liu, H.; Niu, Z.; Du, J.; Lin, X. Genetic algorithm for delay efficient computation offloading in dispersed computing. Ad. Hoc. Netw. 2023, 142, 103109. [Google Scholar] [CrossRef]
  20. Wang, Z.; Cao, L.; Si, H. An improved genetic algorithm for determining the optimal operation strategy of thermal energy storage tank in combined heat and power units. J. Energy Storage 2021, 43, 103313. [Google Scholar] [CrossRef]
  21. Rojas, M.G.; Olivera, A.C.; Carballido, J.A.; Vidal, P.J. Memetic micro-genetic algorithms for cancer data classification. Intell. Syst. Appl. 2023, 17, 200173. [Google Scholar] [CrossRef]
  22. Hatamizadeh, A.; Sedaee, B. Simulation of carbonate reservoirs acidizing using machine and meta-learning methods and its optimization by the genetic algorithm. Geoenergy Sci. Eng. 2023, 223, 211509. [Google Scholar] [CrossRef]
  23. Futuyma, D. Evolution. Sinauer Associates. 2014. Available online: https://books.google.co.id/books/about/Evolution.html?id=CQJFAQAAIAAJ&redir_esc=y (accessed on 15 November 2022).
  24. Venkataraman, P. Applied Optimization with MATLAB Programming; John Wiley and Sons: Hoboken, NJ, USA, 2002. [Google Scholar]
  25. IMO. IACS Common Structural Rules for Bulk Carriers and Oil Tankers; International Association of Classification Societies: London, UK, 2012. [Google Scholar]
Figure 1. Midship construction.
Jmse 11 00640 g001
Figure 2. Optimization algorithm.
Jmse 11 00640 g002
Figure 3. Material selection process.
Jmse 11 00640 g003
Figure 5. Upgrading process.
Jmse 11 00640 g005
Figure 6. Optimization process.
Jmse 11 00640 g006
Figure 7. Process of material change.
Jmse 11 00640 g007
Figure 8. Genetic algorithm flowchart.
Jmse 11 00640 g008
Figure 9. Hatch cover 3D model.
Jmse 11 00640 g009
Figure 10. Plate material type and thickness distribution of 1st model.
Jmse 11 00640 g010
Figure 11. Plate material type and thickness distribution of 2nd model.
Jmse 11 00640 g011
Figure 12. Plate material type and thickness distribution of 3rd model.
Jmse 11 00640 g012
Figure 13. Total material cost of each price variation.
Jmse 11 00640 g013
Table 1. Current study.
ParameterPrevious MethodProposed Method
Plate MaterialGenetic AlgorithmUpgrade Method
Plate ThicknessSize Optimization
Table 2. Material price variation.
Price No.Yield Strength [N/mm2]Material Cost [\/kg]Cost Effectiveness ScoreCost Effectiveness Rank
HT36HT32MSHT36HT32MSHT36HT32MSHighMediumLow
13553152359080603.9443.9383.917HT36HT32MS
29085803.9443.7062.938HT36HT32MS
39075603.9444.2003.917HT32HT36MS
49075503.9444.2004.700MSHT32HT36
59090903.9443.5002.611HT36HT32MS
Table 3. Initial data.
ItemUnit1st Model2nd Model3rd Model
L (length)Mm18,03094629462
W (width)Mm747549705705
H (height)Mm800815815
LoadN/mm20.03430.03430.0343
Initial material type-MS, HT32, HT36MS, HT32MS, HT32
Densitykg/m3780078007800
Plate number 162018
Table 4. Material properties.
Material TypeYoung Modulus (N/mm2)Density (kg/m3)Poisson RatioYield Strength (N/mm2)
MS200,00078000.3235
HT32200,00078000.3315
HT36200,00078000.3355
Table 5. GA Parameter.
Parameter
Max. Generation50
Population size200
Mutation rate0.1
Random seed0
Table 6. Computation time.
Proposed Method (Hour)GA (Hour)
1st model0.06>3.0
2nd model0.22>13.0
3rd model0.12>7.0
Disclaimer/Publisher’s Note: The statements, opinions and data contained in all publications are solely those of the individual author(s) and contributor(s) and not of MDPI and/or the editor(s). MDPI and/or the editor(s) disclaim responsibility for any injury to people or property resulting from any ideas, methods, instructions or products referred to in the content.

