
Numerical Study on the Effects of the Multiple Porous Medium Breakwaters on the Propagation of the Solitary Wave


Abstract
:1. Introduction
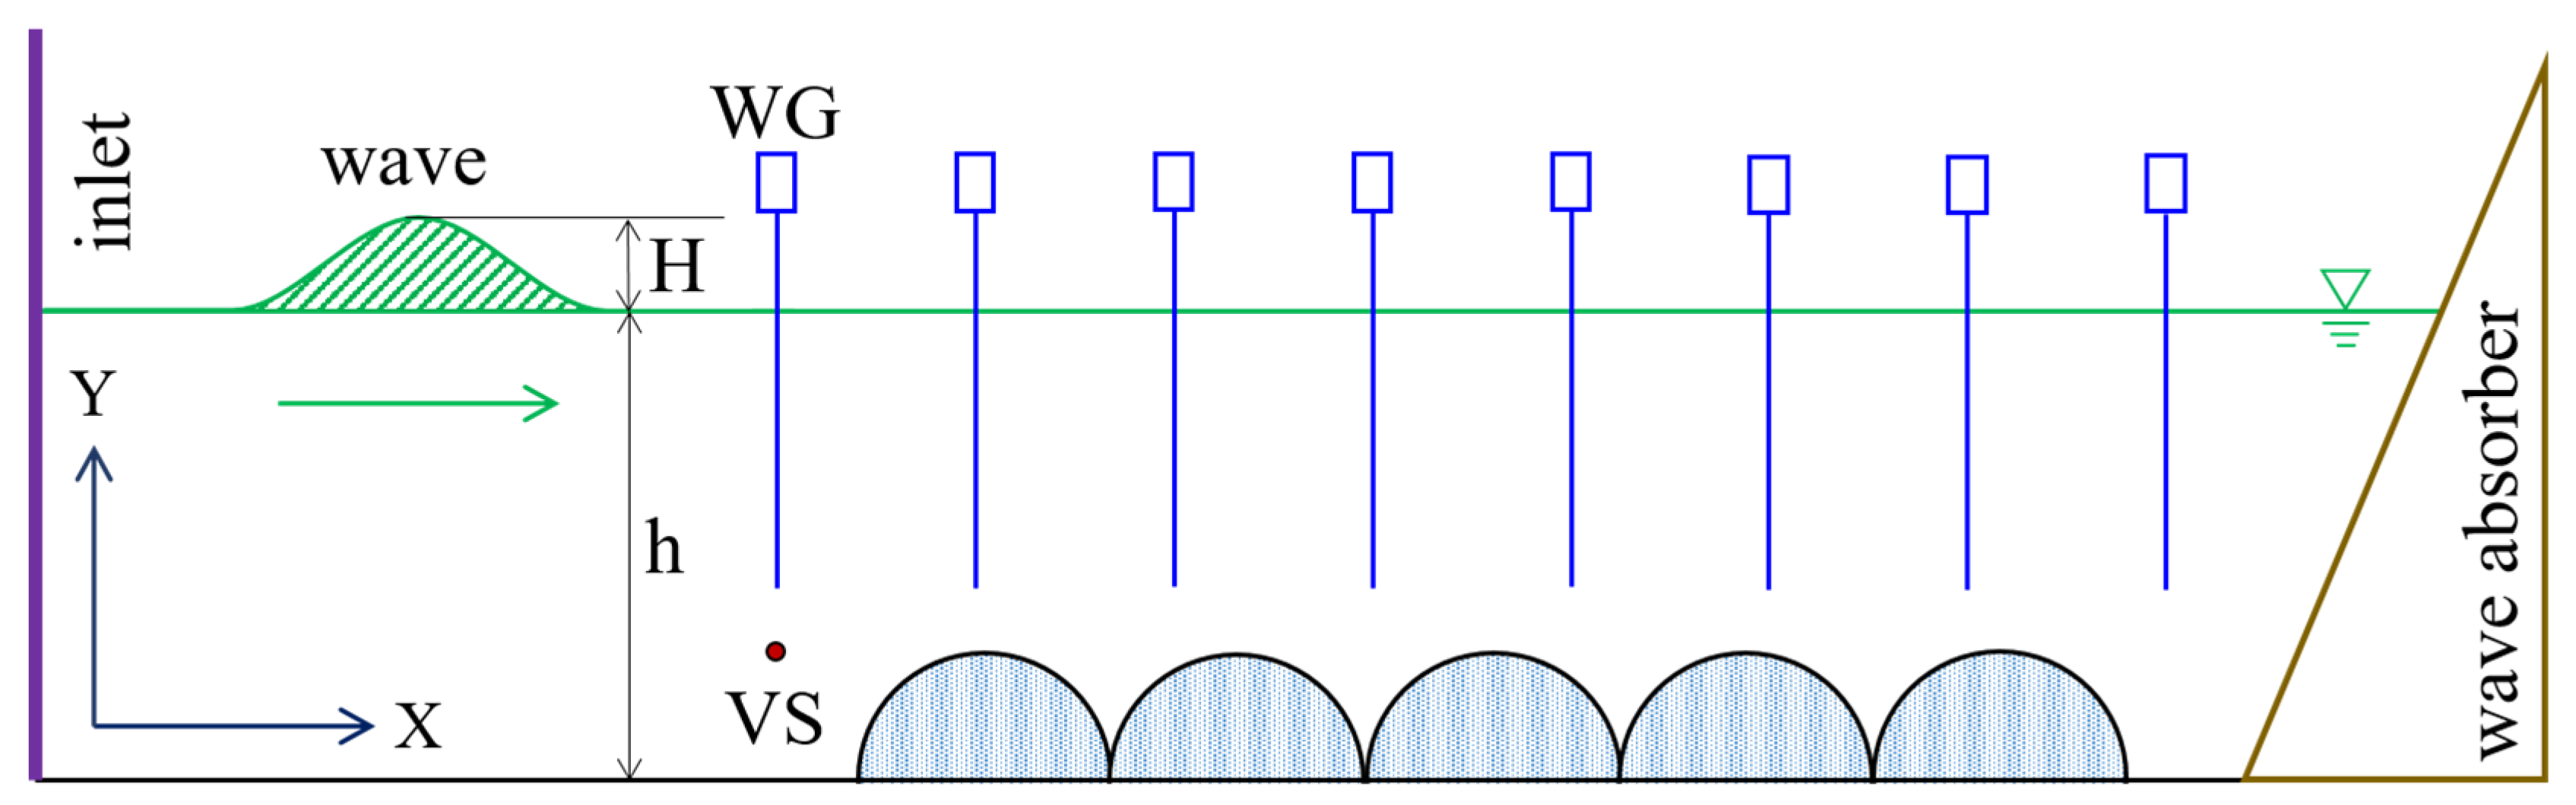
2. Numerical Model
3. Model Verification
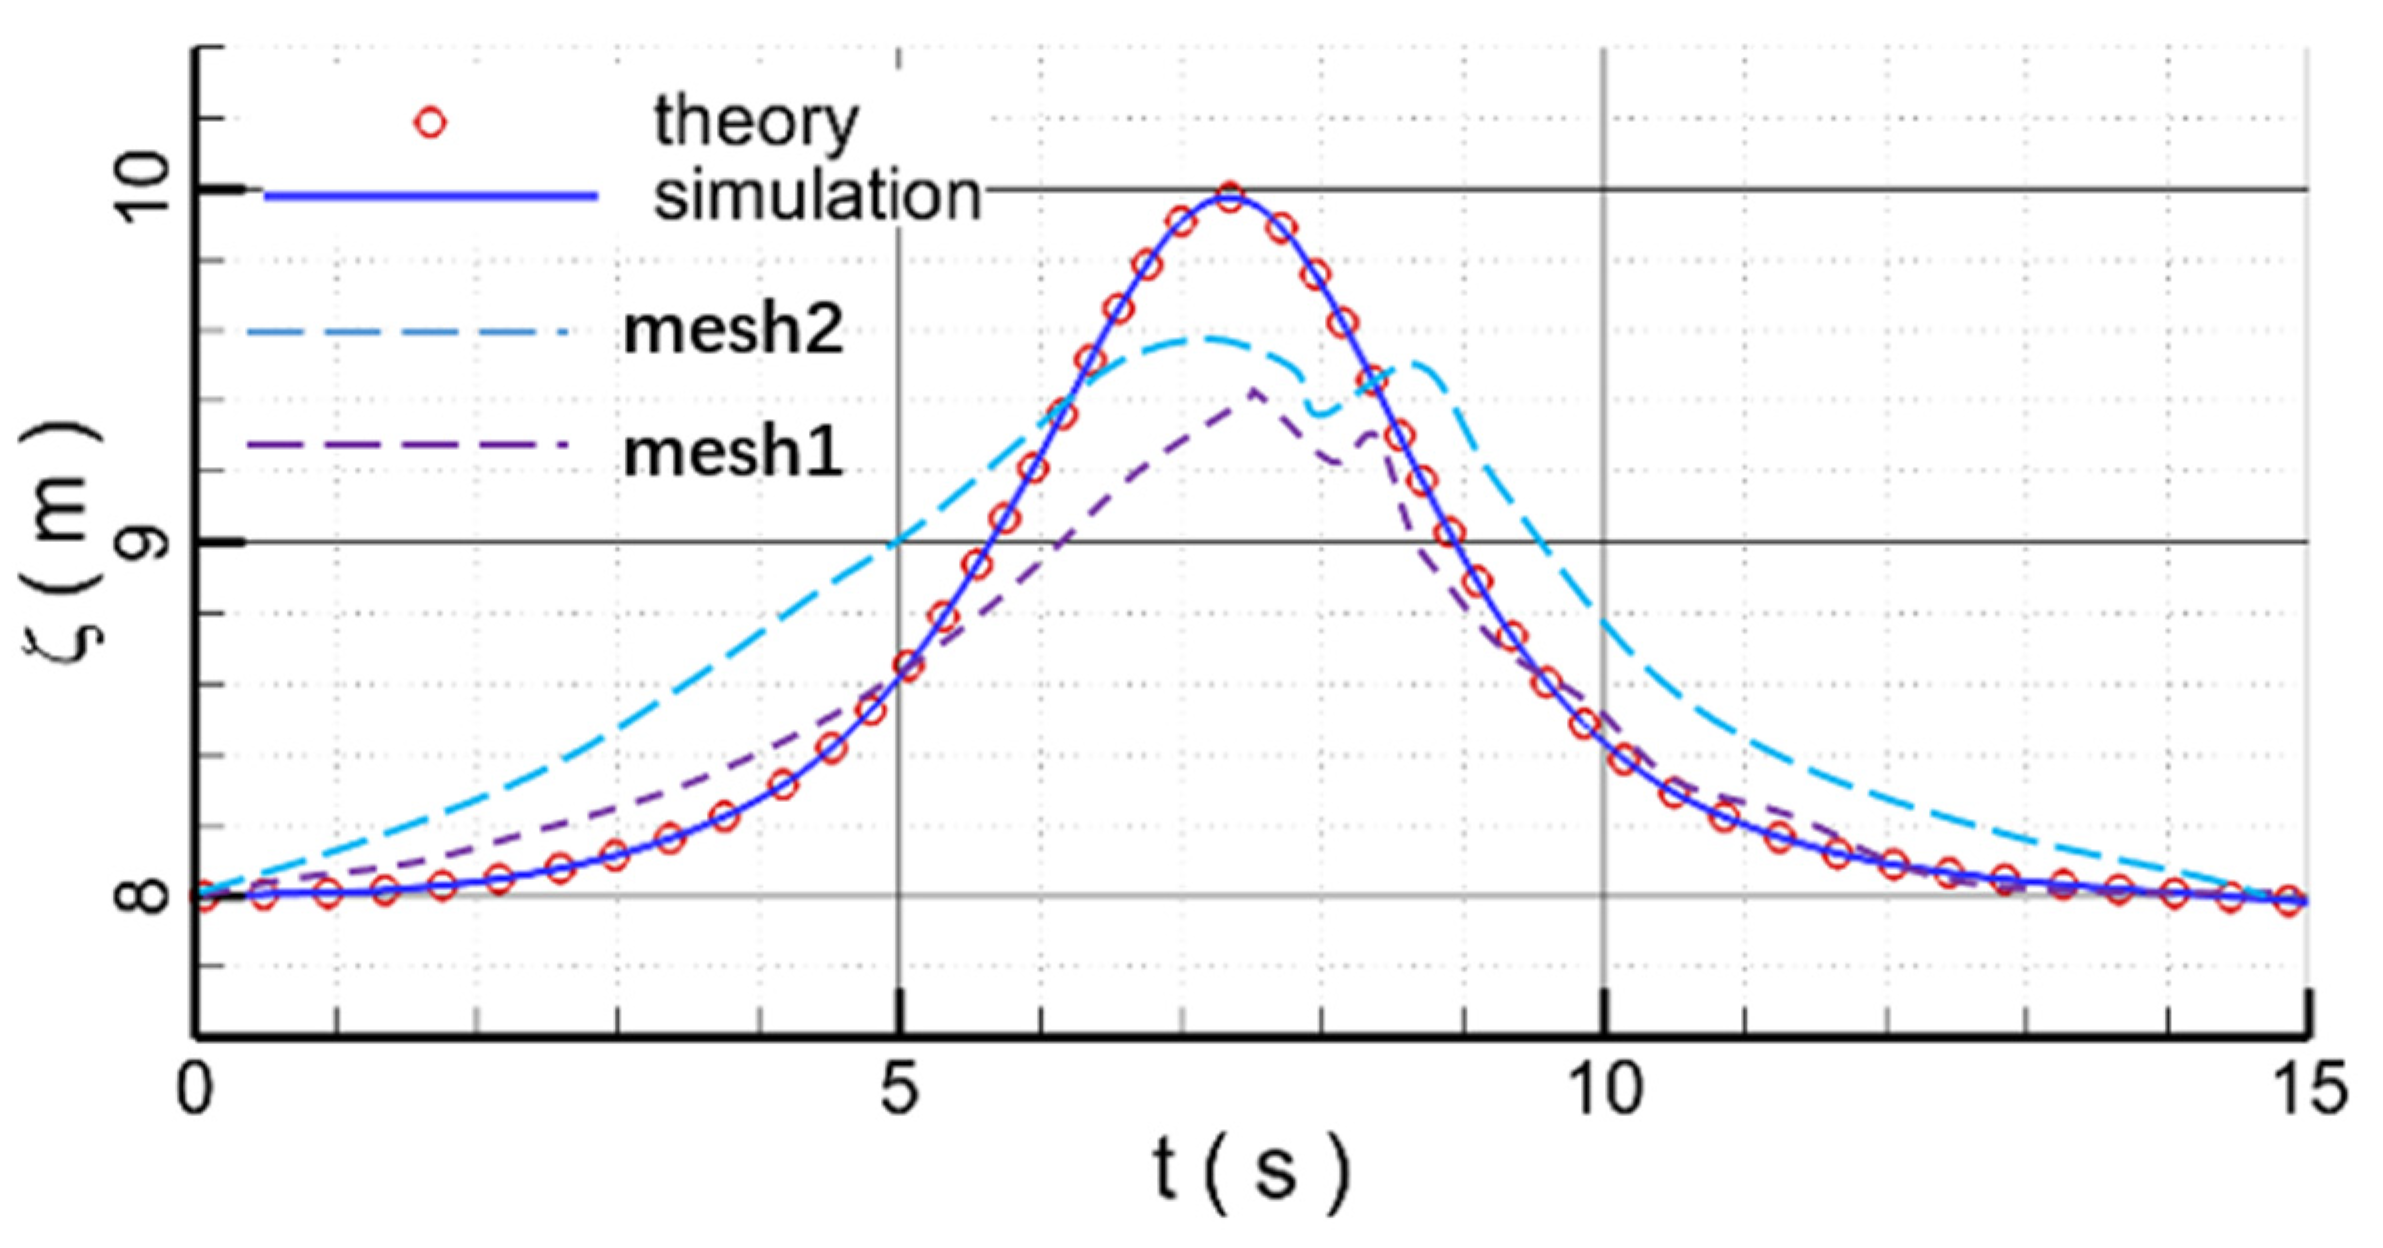
3.1. Solitary Wave
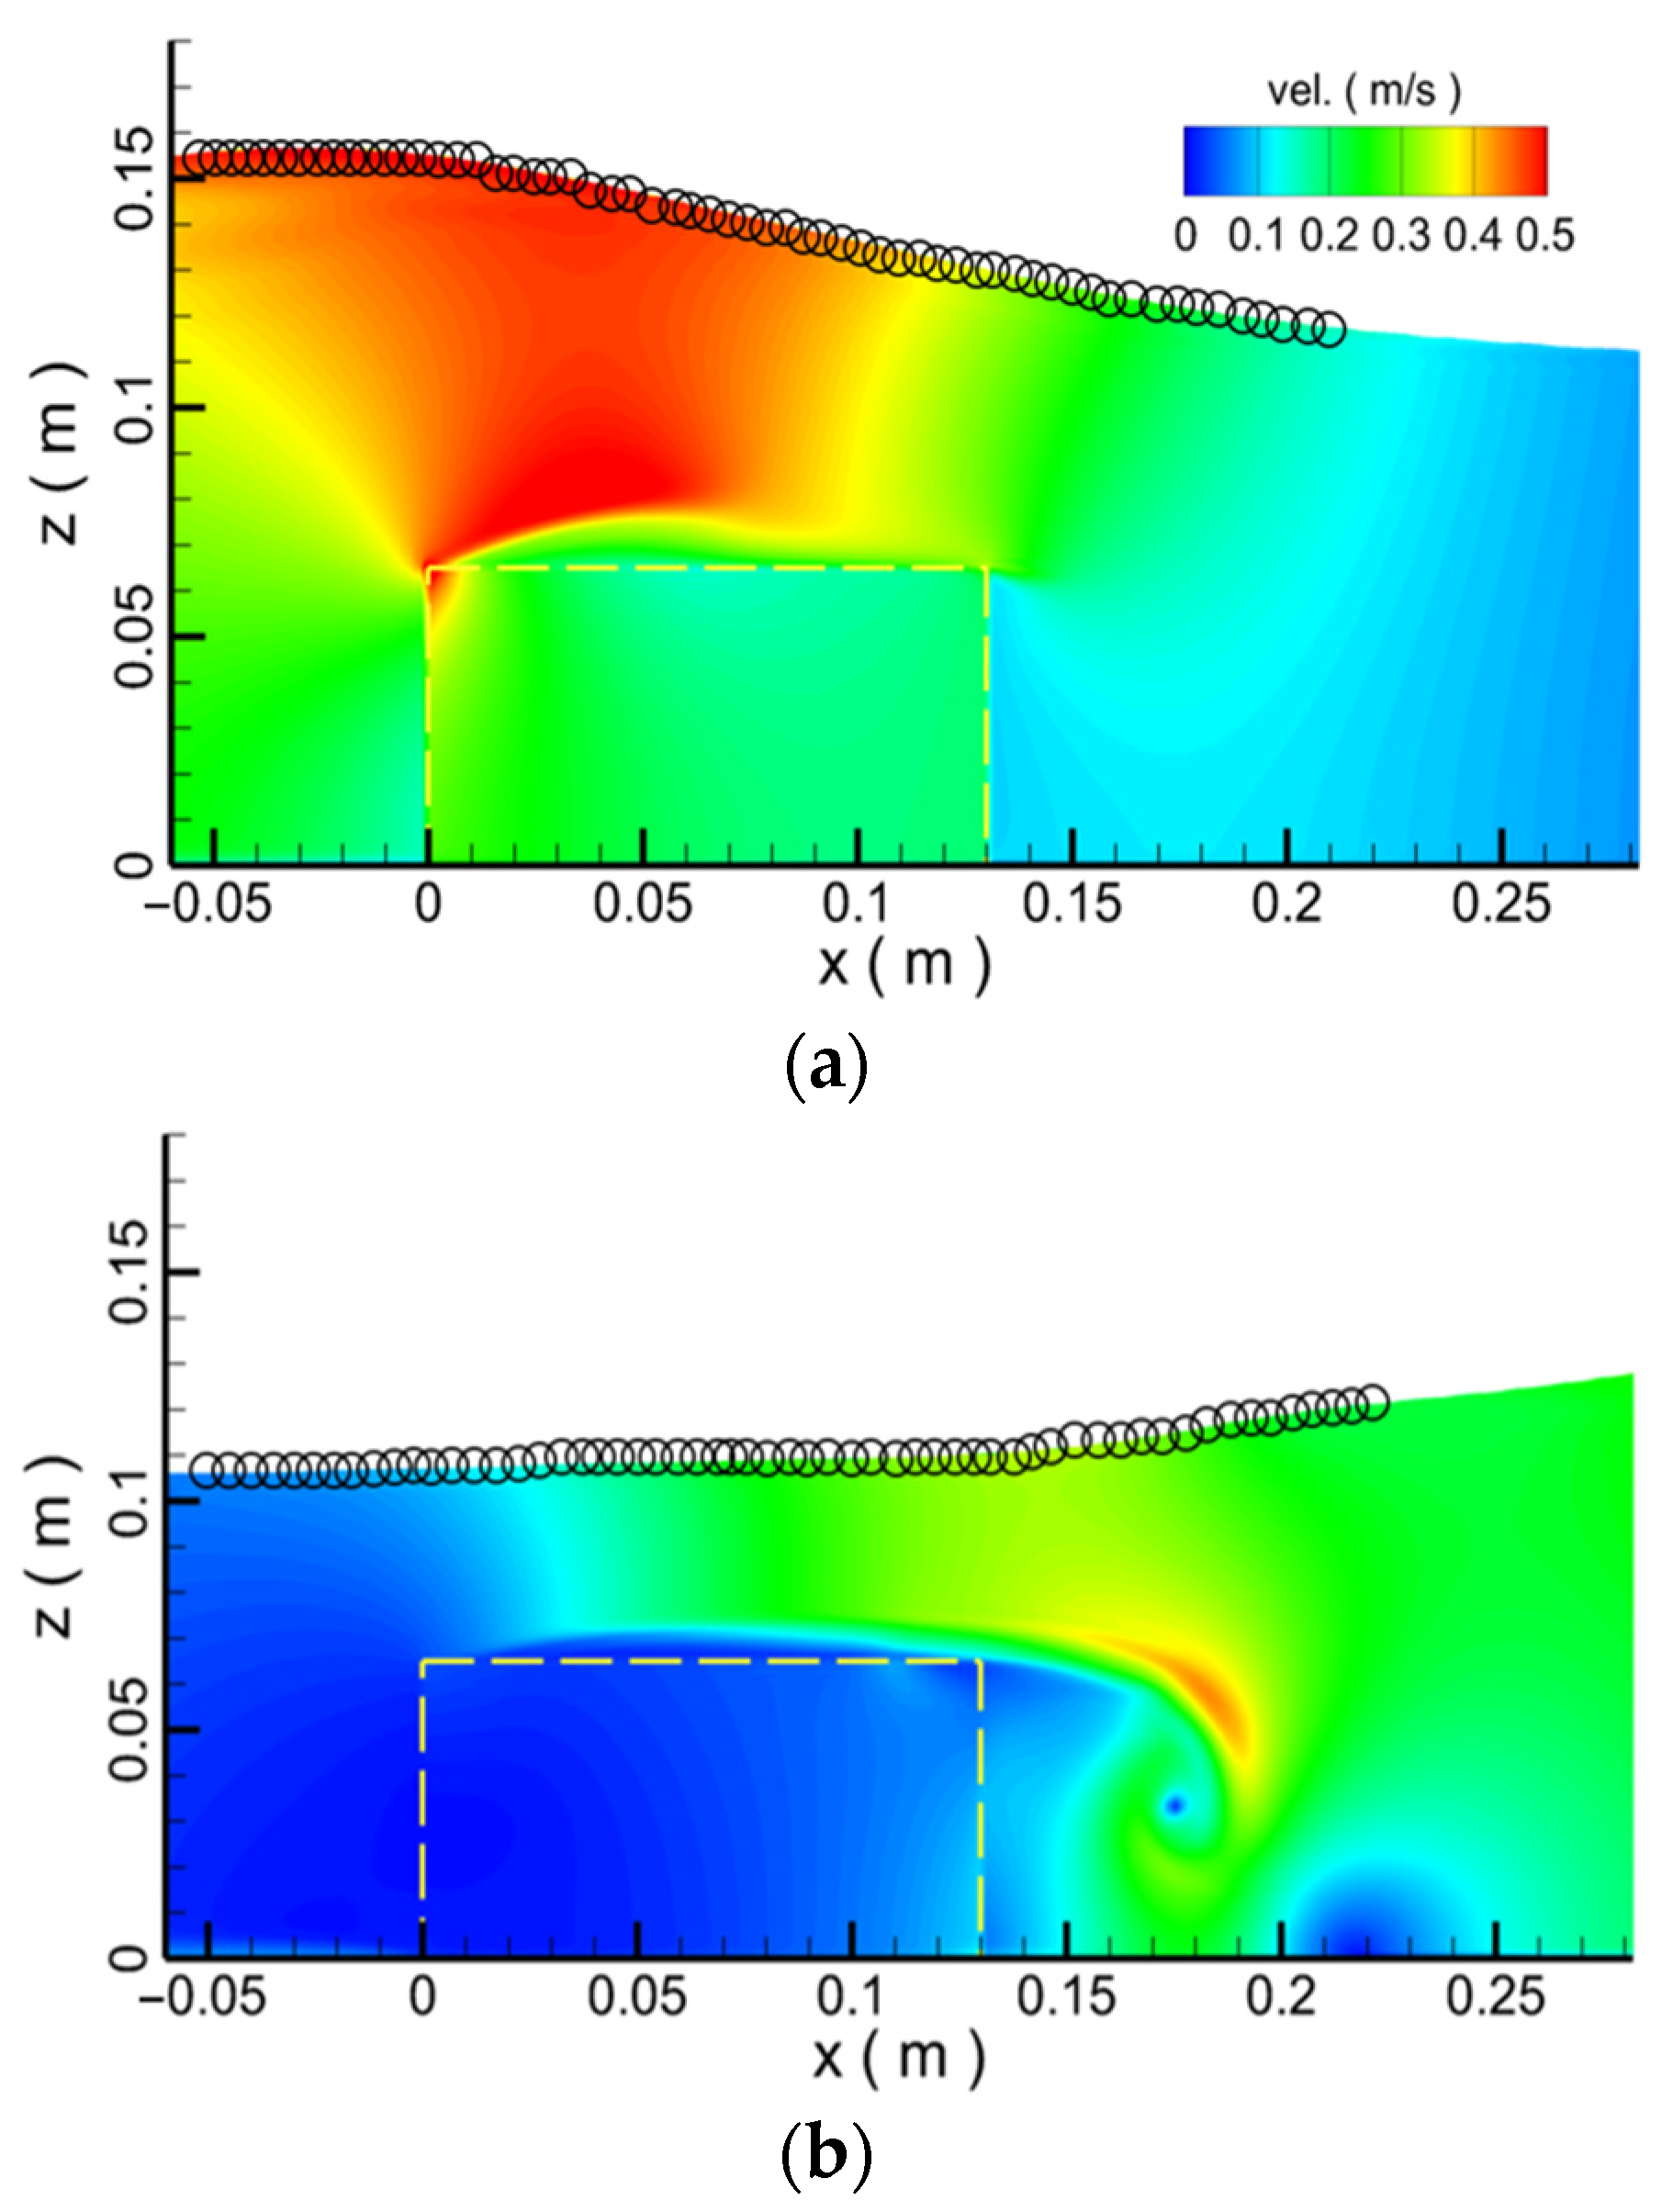
3.2. Wave Propagation over the Porous Medium Structure
4. Results and Discussion
4.1. Effect of the Porosity
4.2. Effect of the Diameter
4.3. Effect of the Distance
4.4. Effect of the Wave Height
5. Conclusions
- (1)
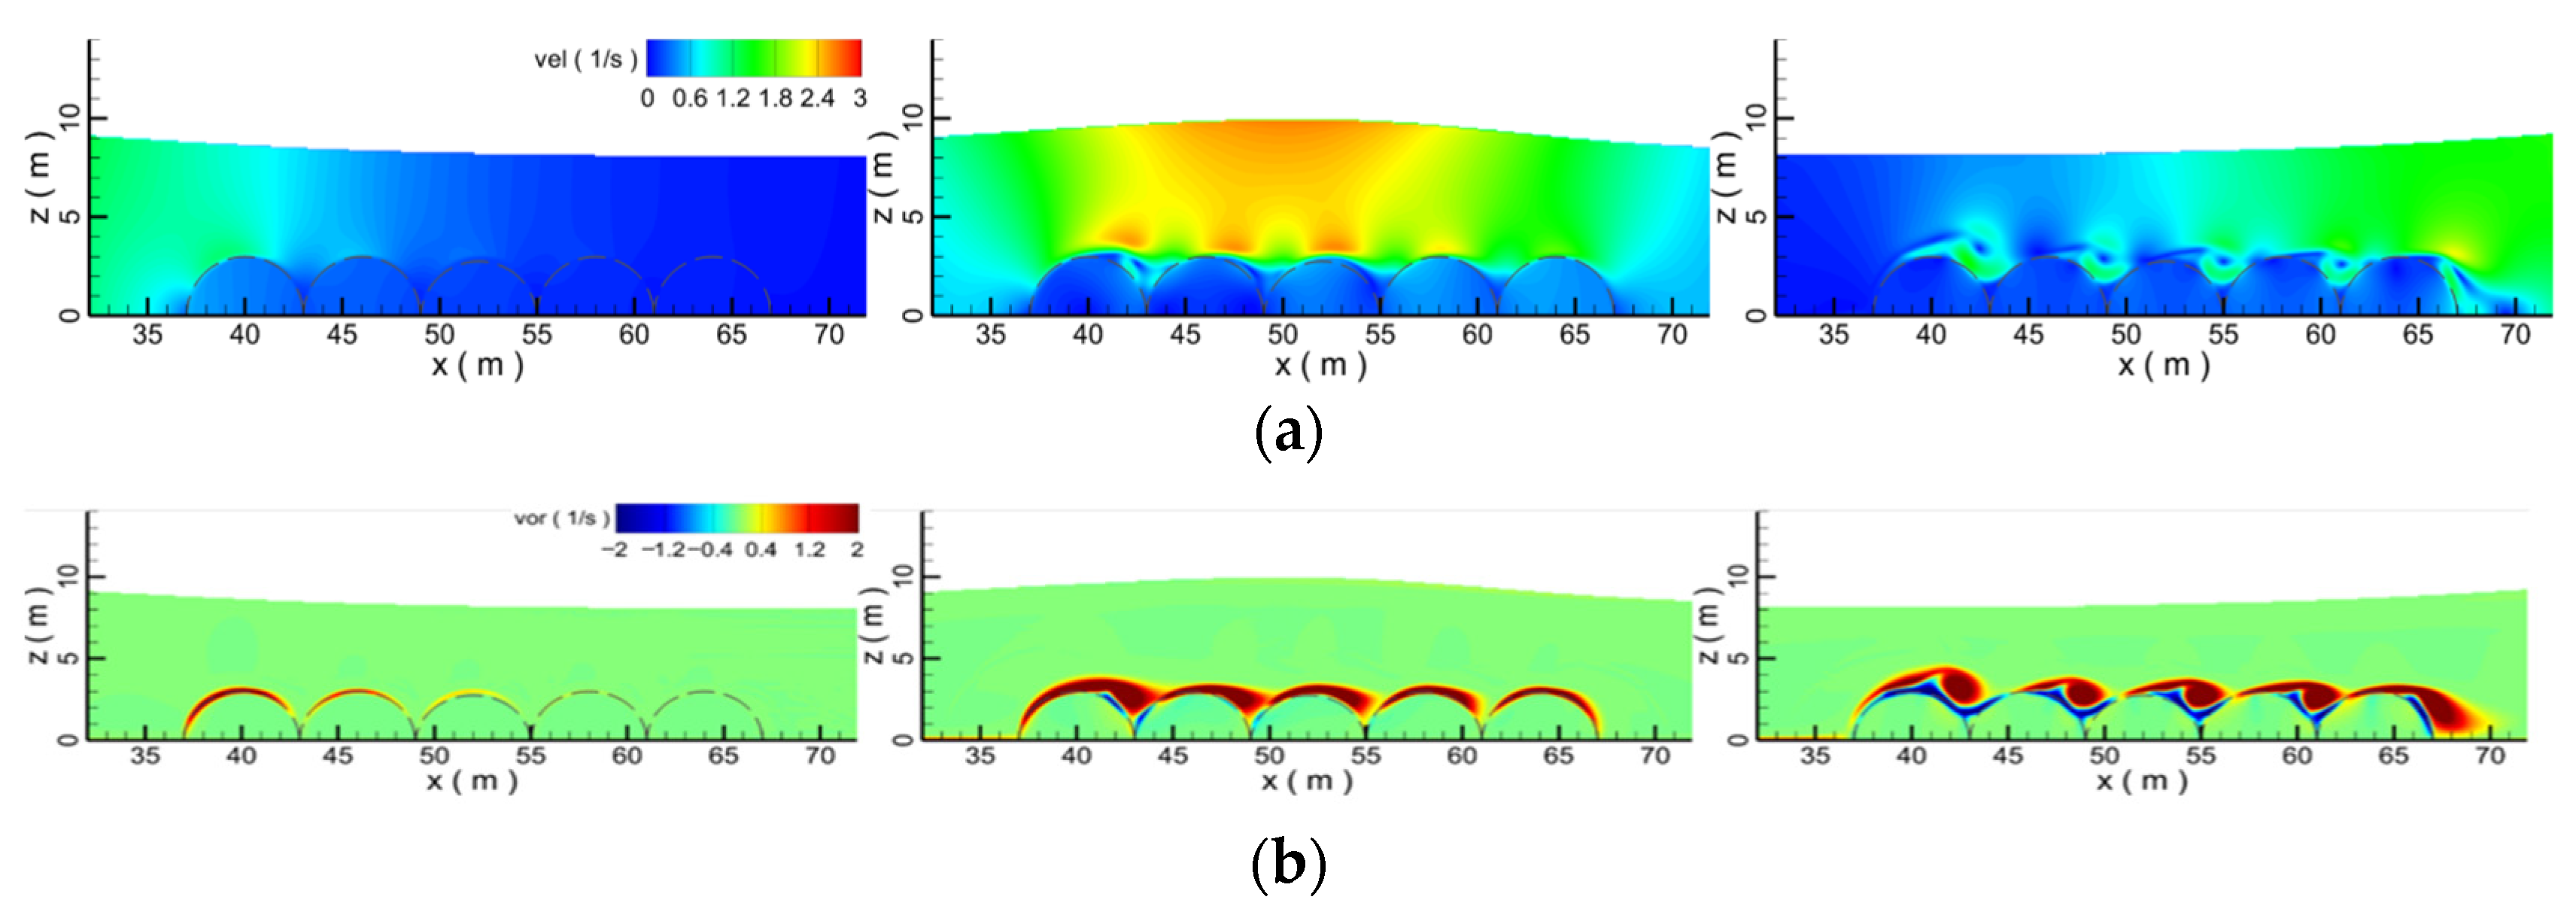
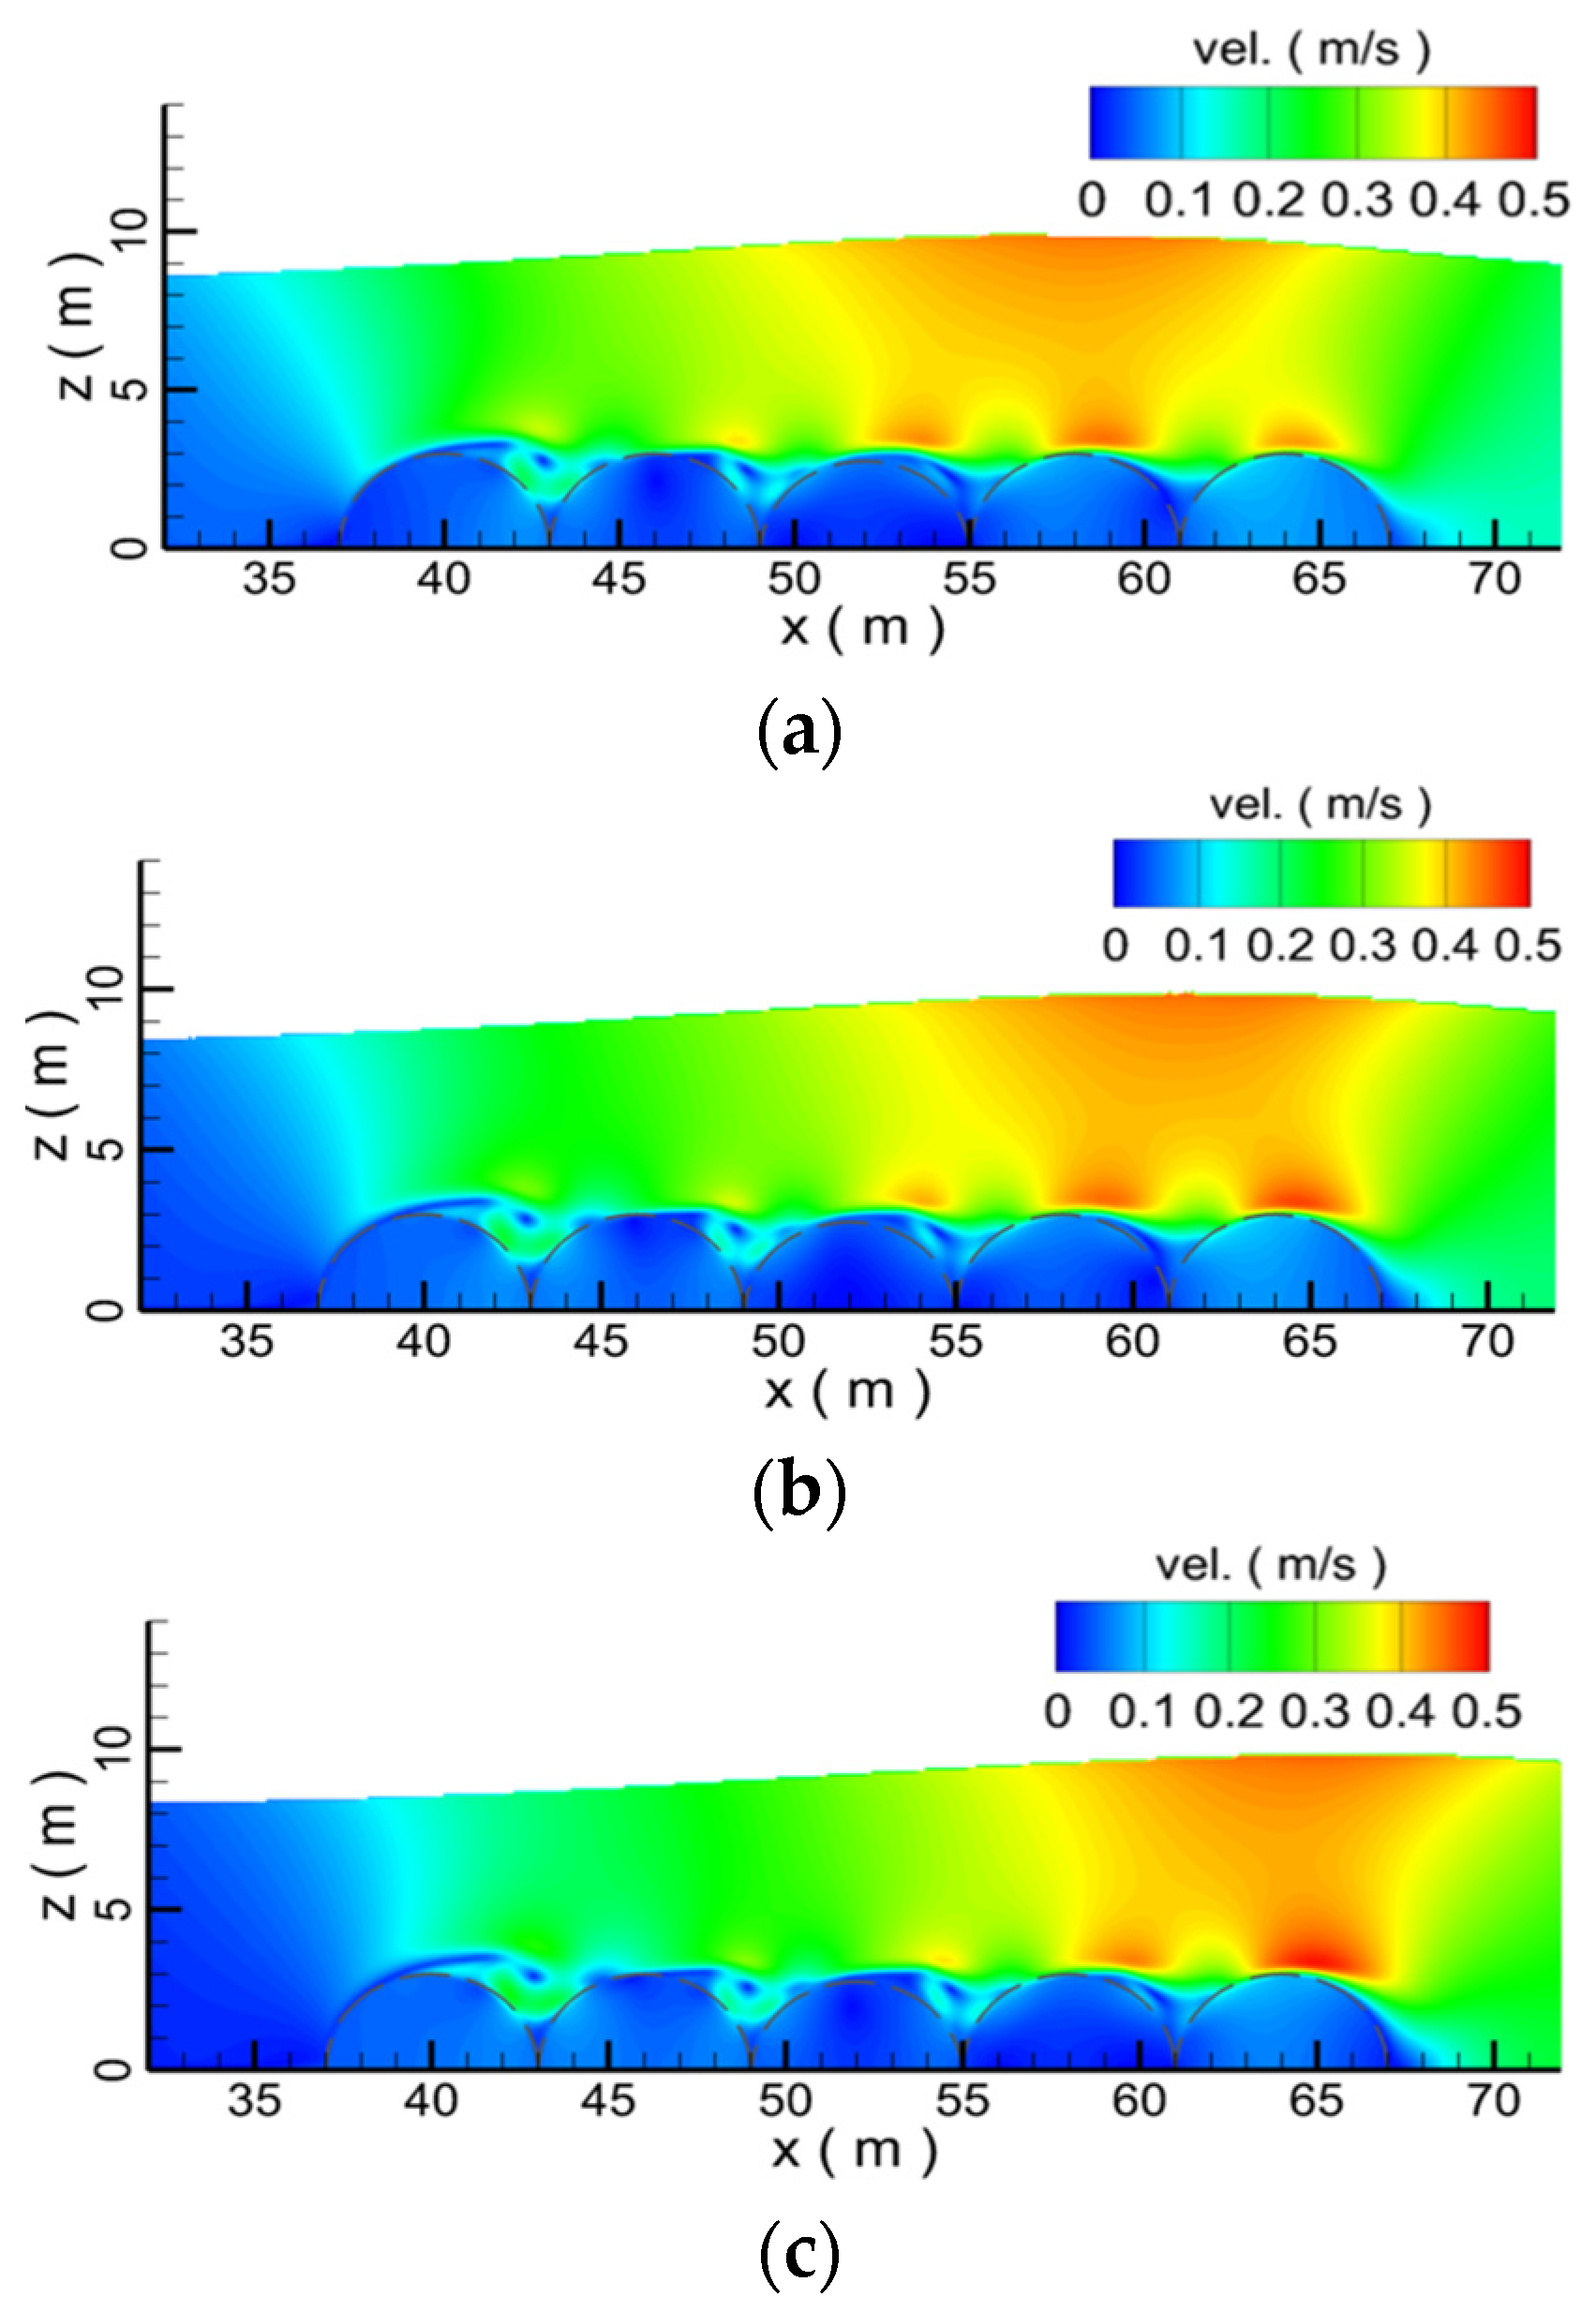
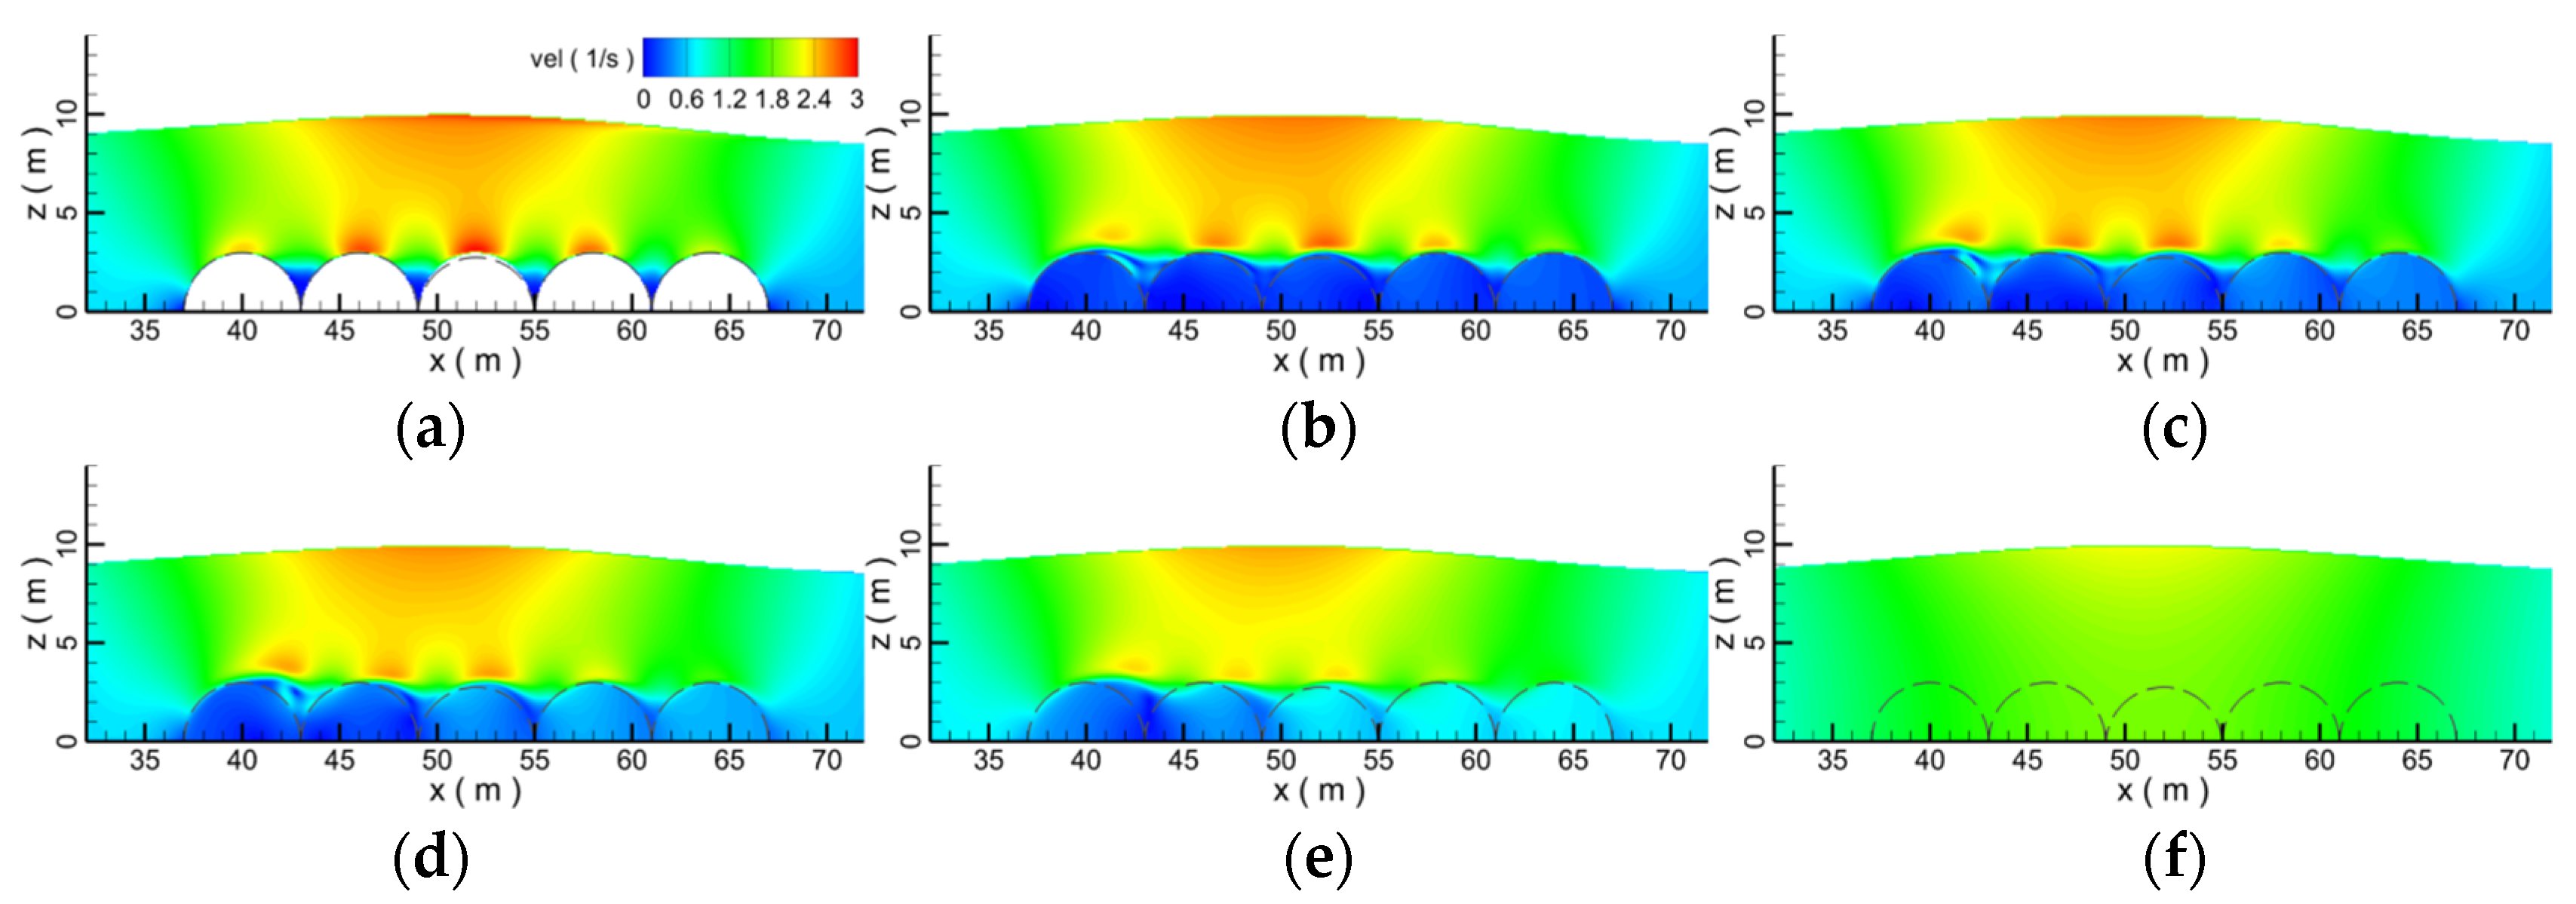
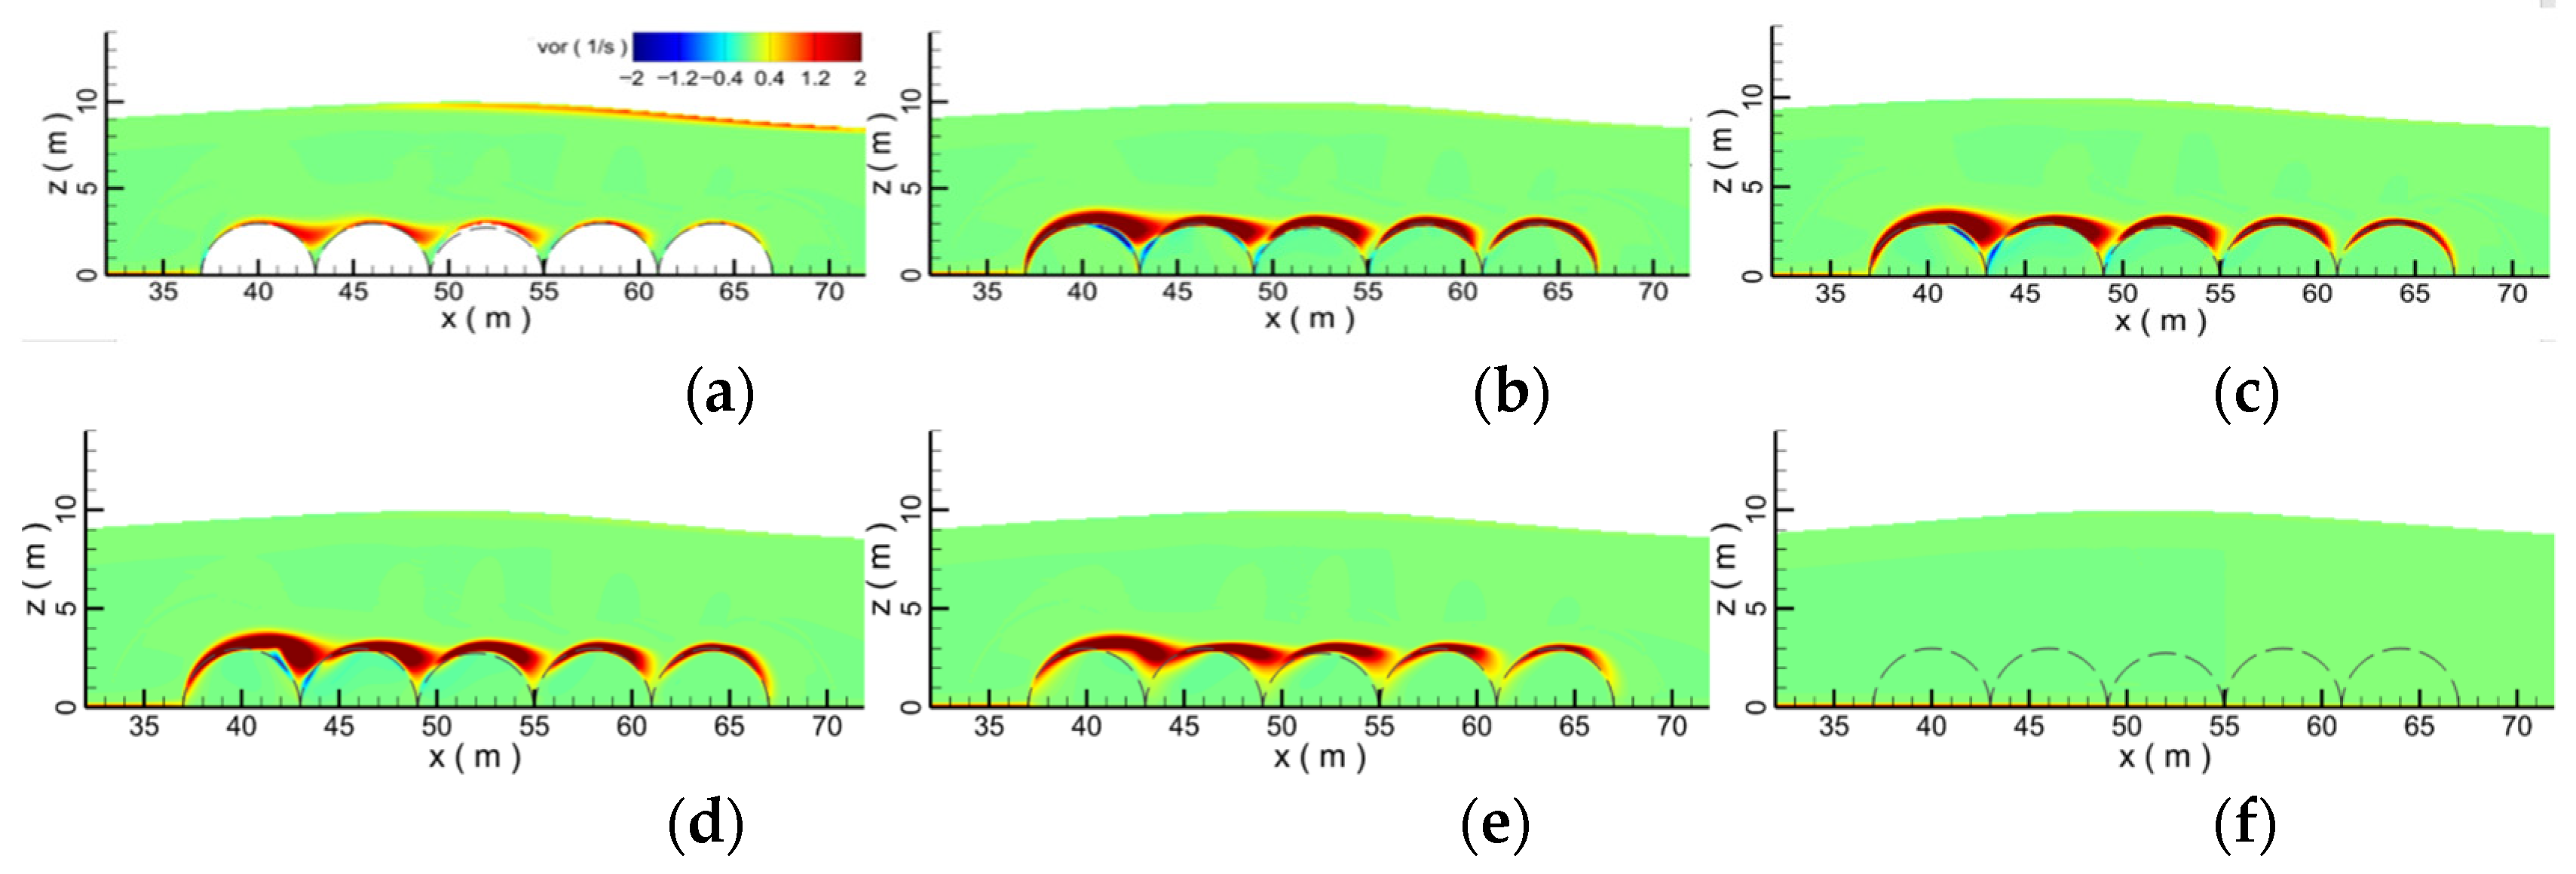
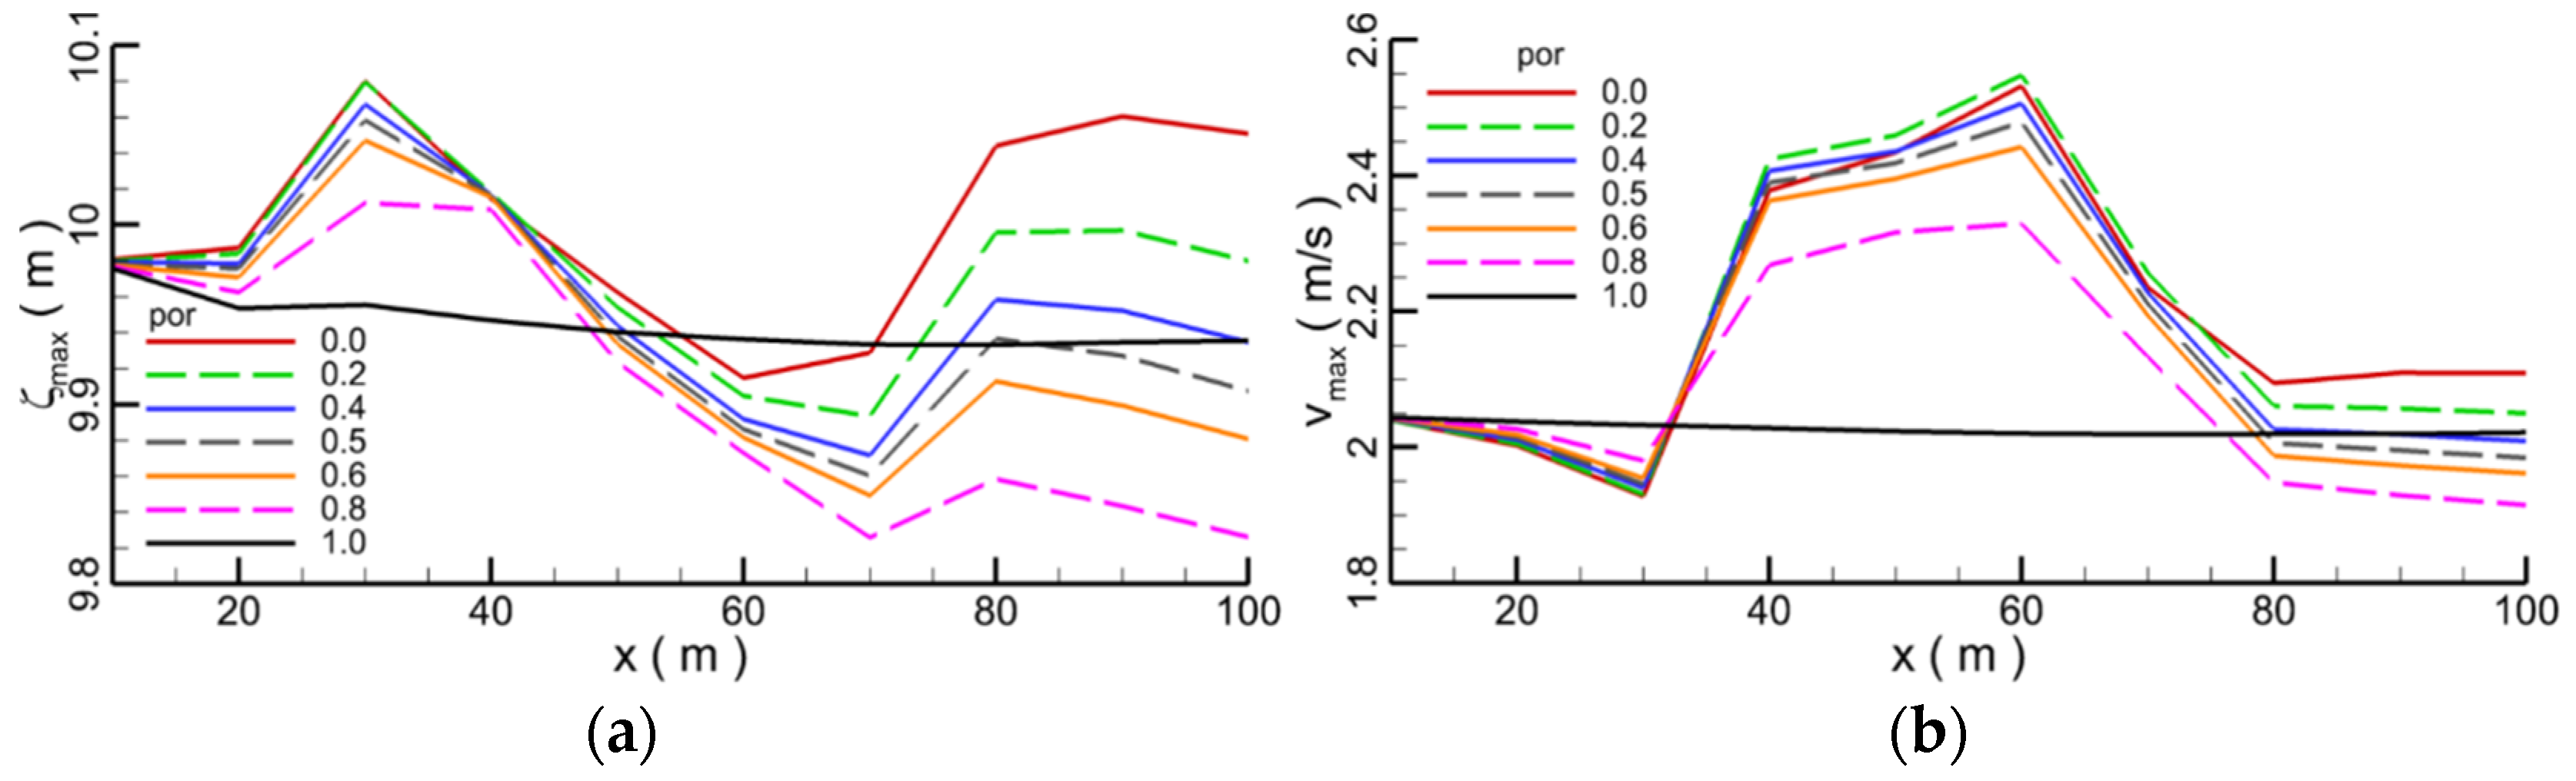
- Due to the influence of the porous submerged breakwater, at the interface between the water body and the submerged breakwater, the vortex is squashed and presents a strip shape. Submerged breakwaters with different porosities have different interference effects on the flow field, resulting in the change of velocity distribution in the whole flow field, thus affecting the propagation of solitary waves. Submerged breakwaters with different porosities have different effects on wave propagation. When the porosity is 0.8, the force on the submerged breakwaters is the smallest, and the water level and velocity through the submerged breakwaters drop the most seriously.
- (2)
- With the increase in the diameter of the submerged breakwater, the wave profile gradually becomes flat. When the diameter of submerged breakwaters is 4.0 m, compared with the vortex formed by submerged breakwaters with other diameters, the vortex reaches the maximum. The larger the diameter of submerged breakwater is, the stronger the disturbance of convection field is, the more serious the wave water level decreases, and the more intensive the fluctuation of the velocity, which indicates that the larger the diameter of the submerged breakwater, the more significantly the attenuation effect on the waves. With the increase in the diameter of the submerged breakwater, the blocking and attenuation effect of the submerged breakwater on the waves increases, and at the same time, the force on the submerged breakwater also increases.
- (3)
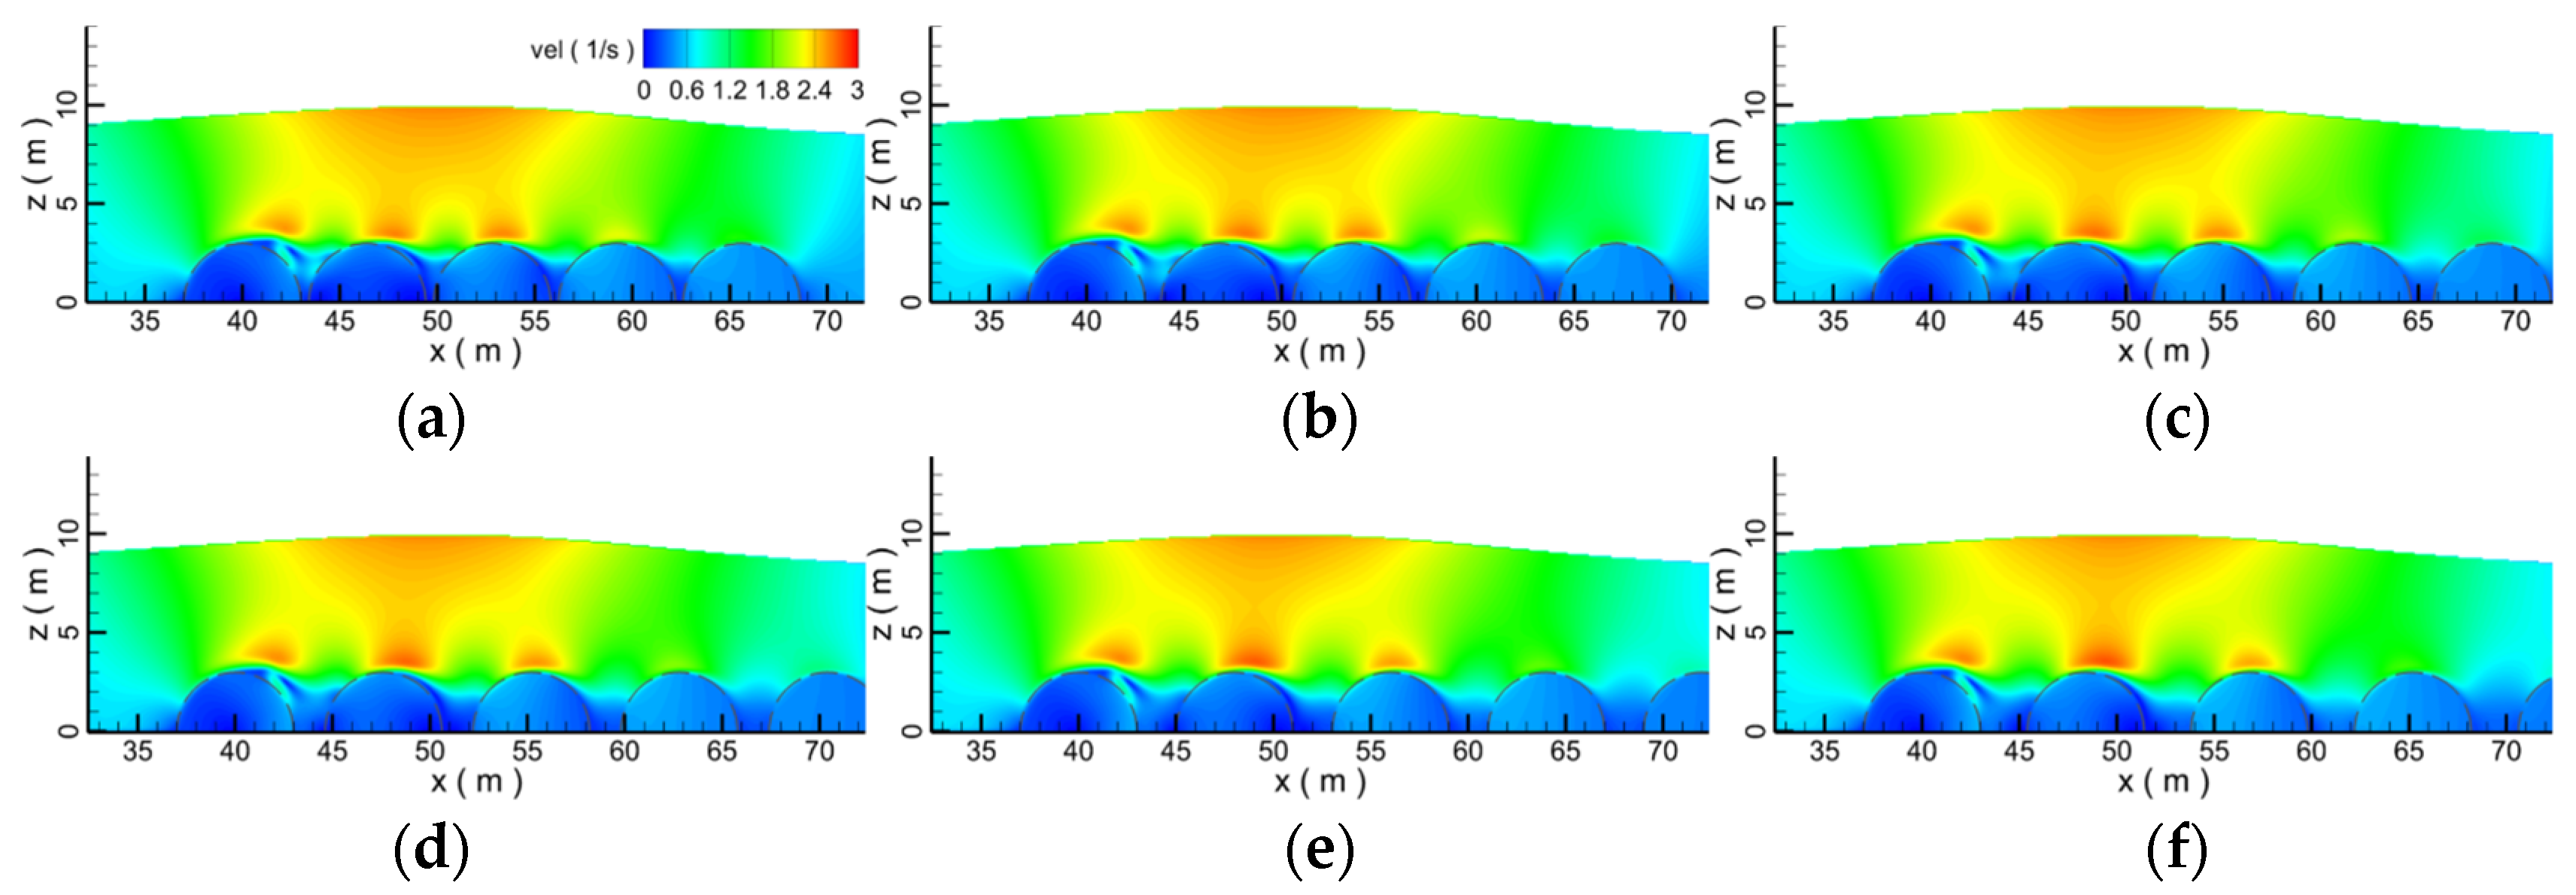
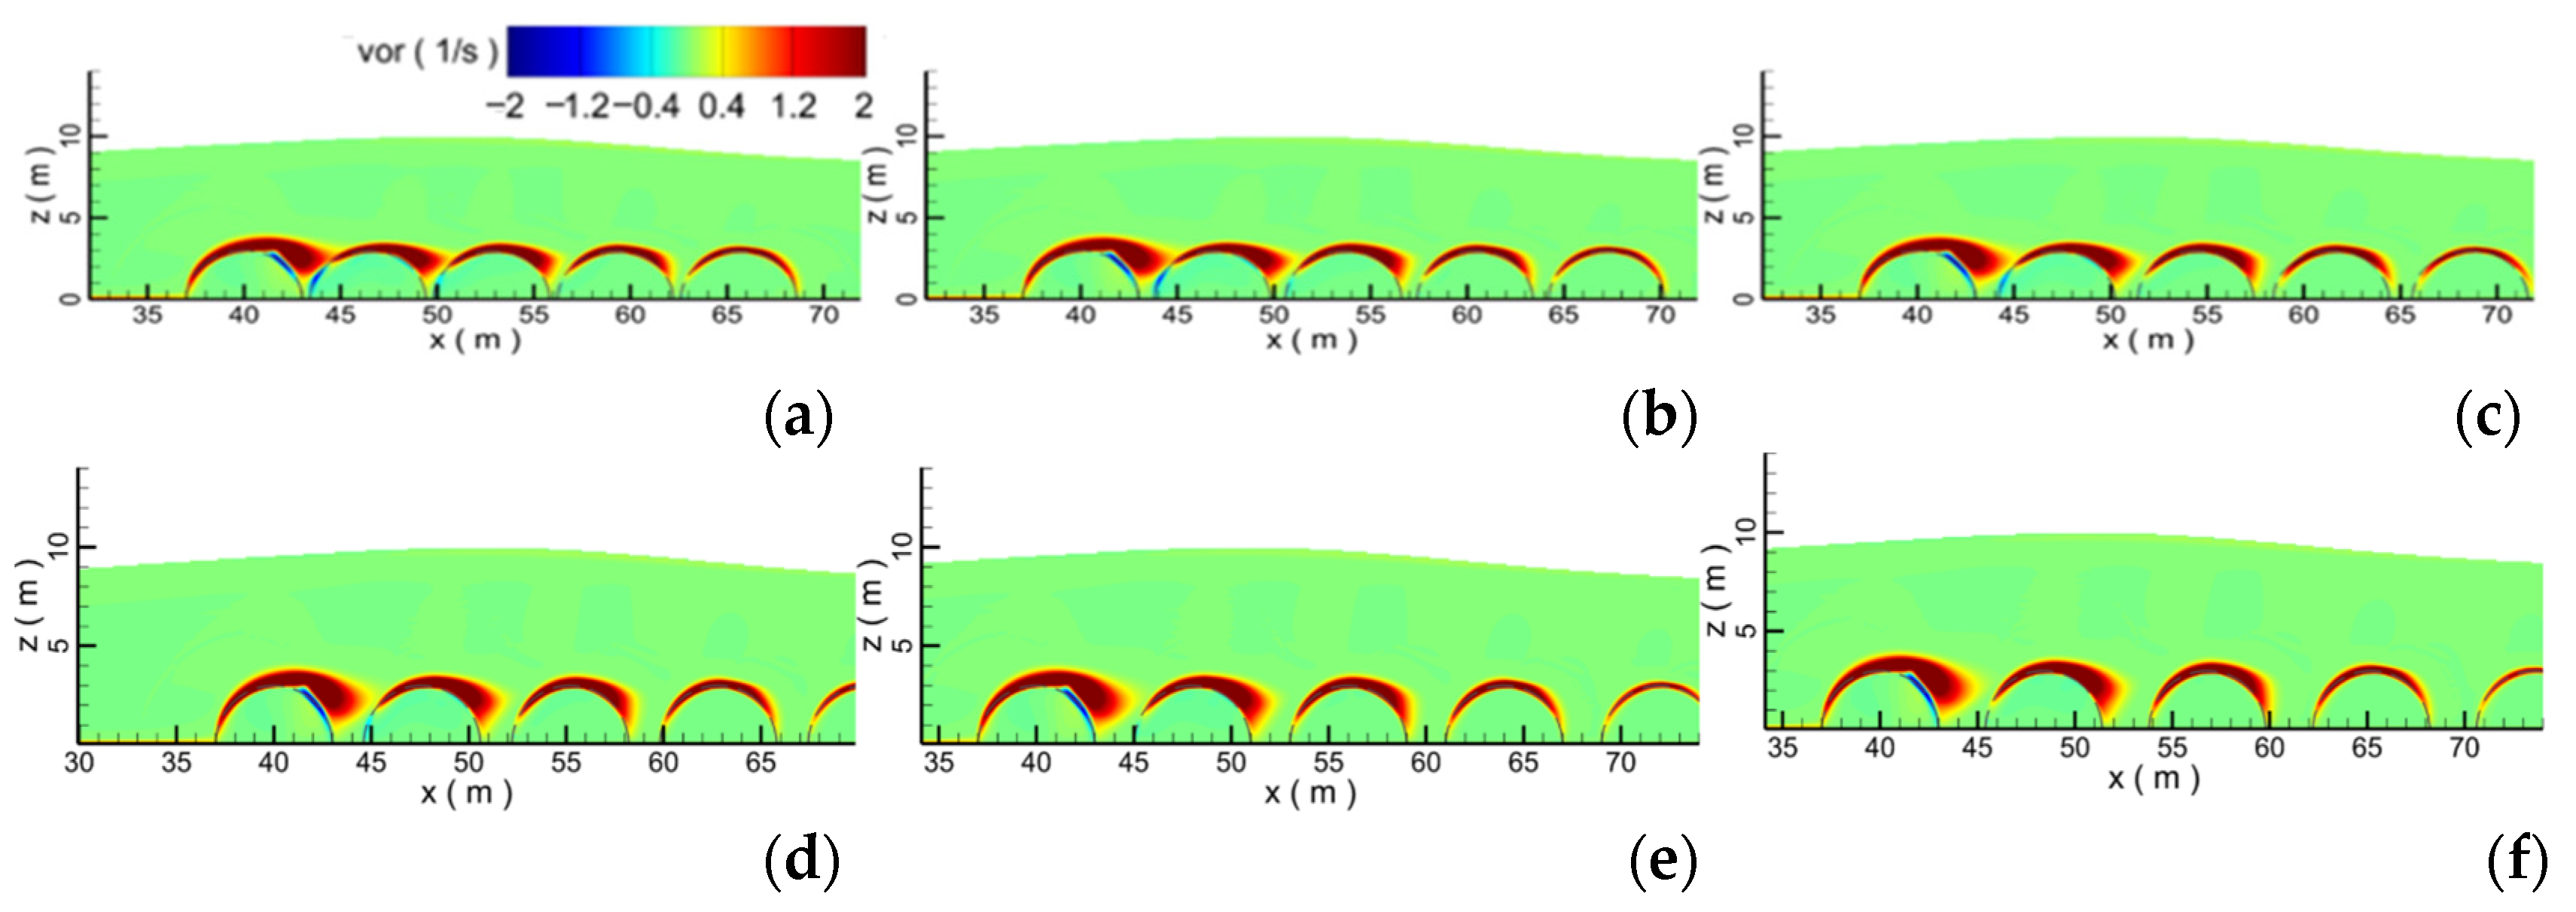
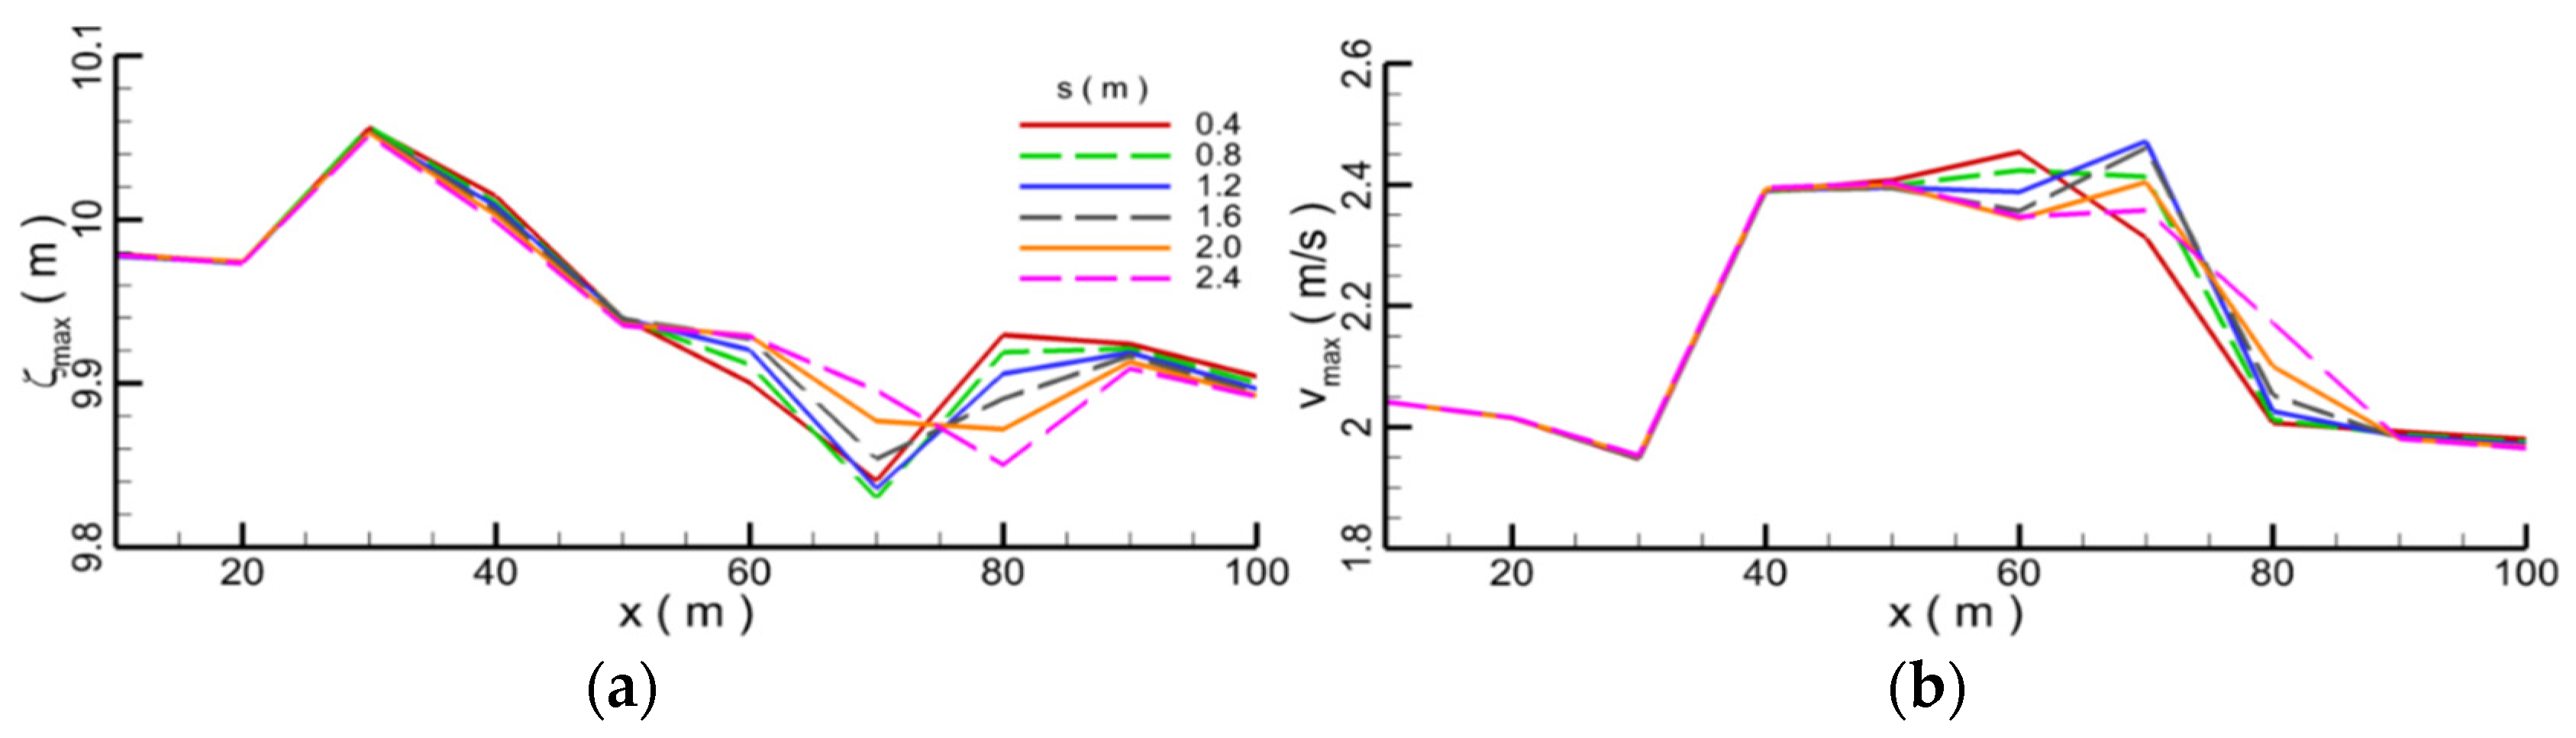
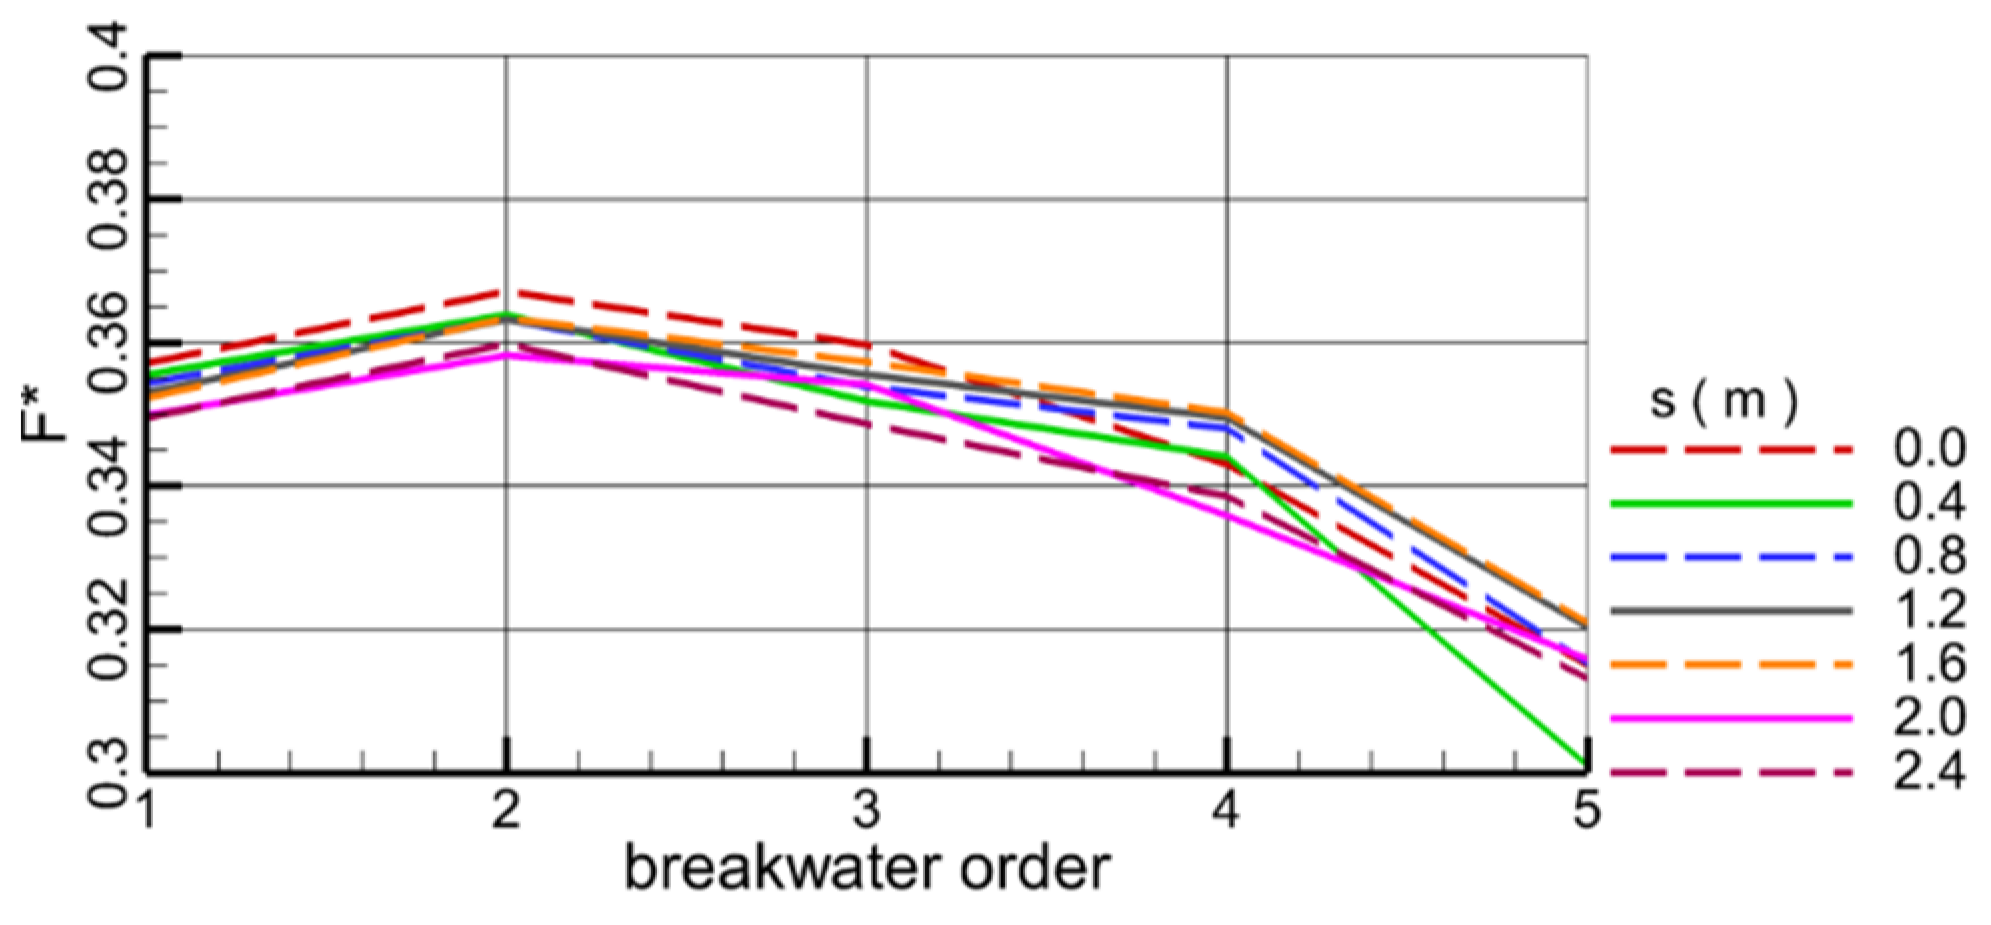
- Appropriately increasing the distance between submerged breakwaters is equivalent to increasing the relative length of obstacles, which is conducive to weakening the wave propagation. With the increase in the distance between the submerged breakwaters, the disturbance to the water is enhanced, and the vortex around the submerged breakwaters is fully developed. With the increase in distance, the water level and flow velocity decrease. The force on the submerged breakwater in front is greater than that of the submerged breakwater in rear. With the increase in the distance, the force on the submerged breakwater decreases slightly.
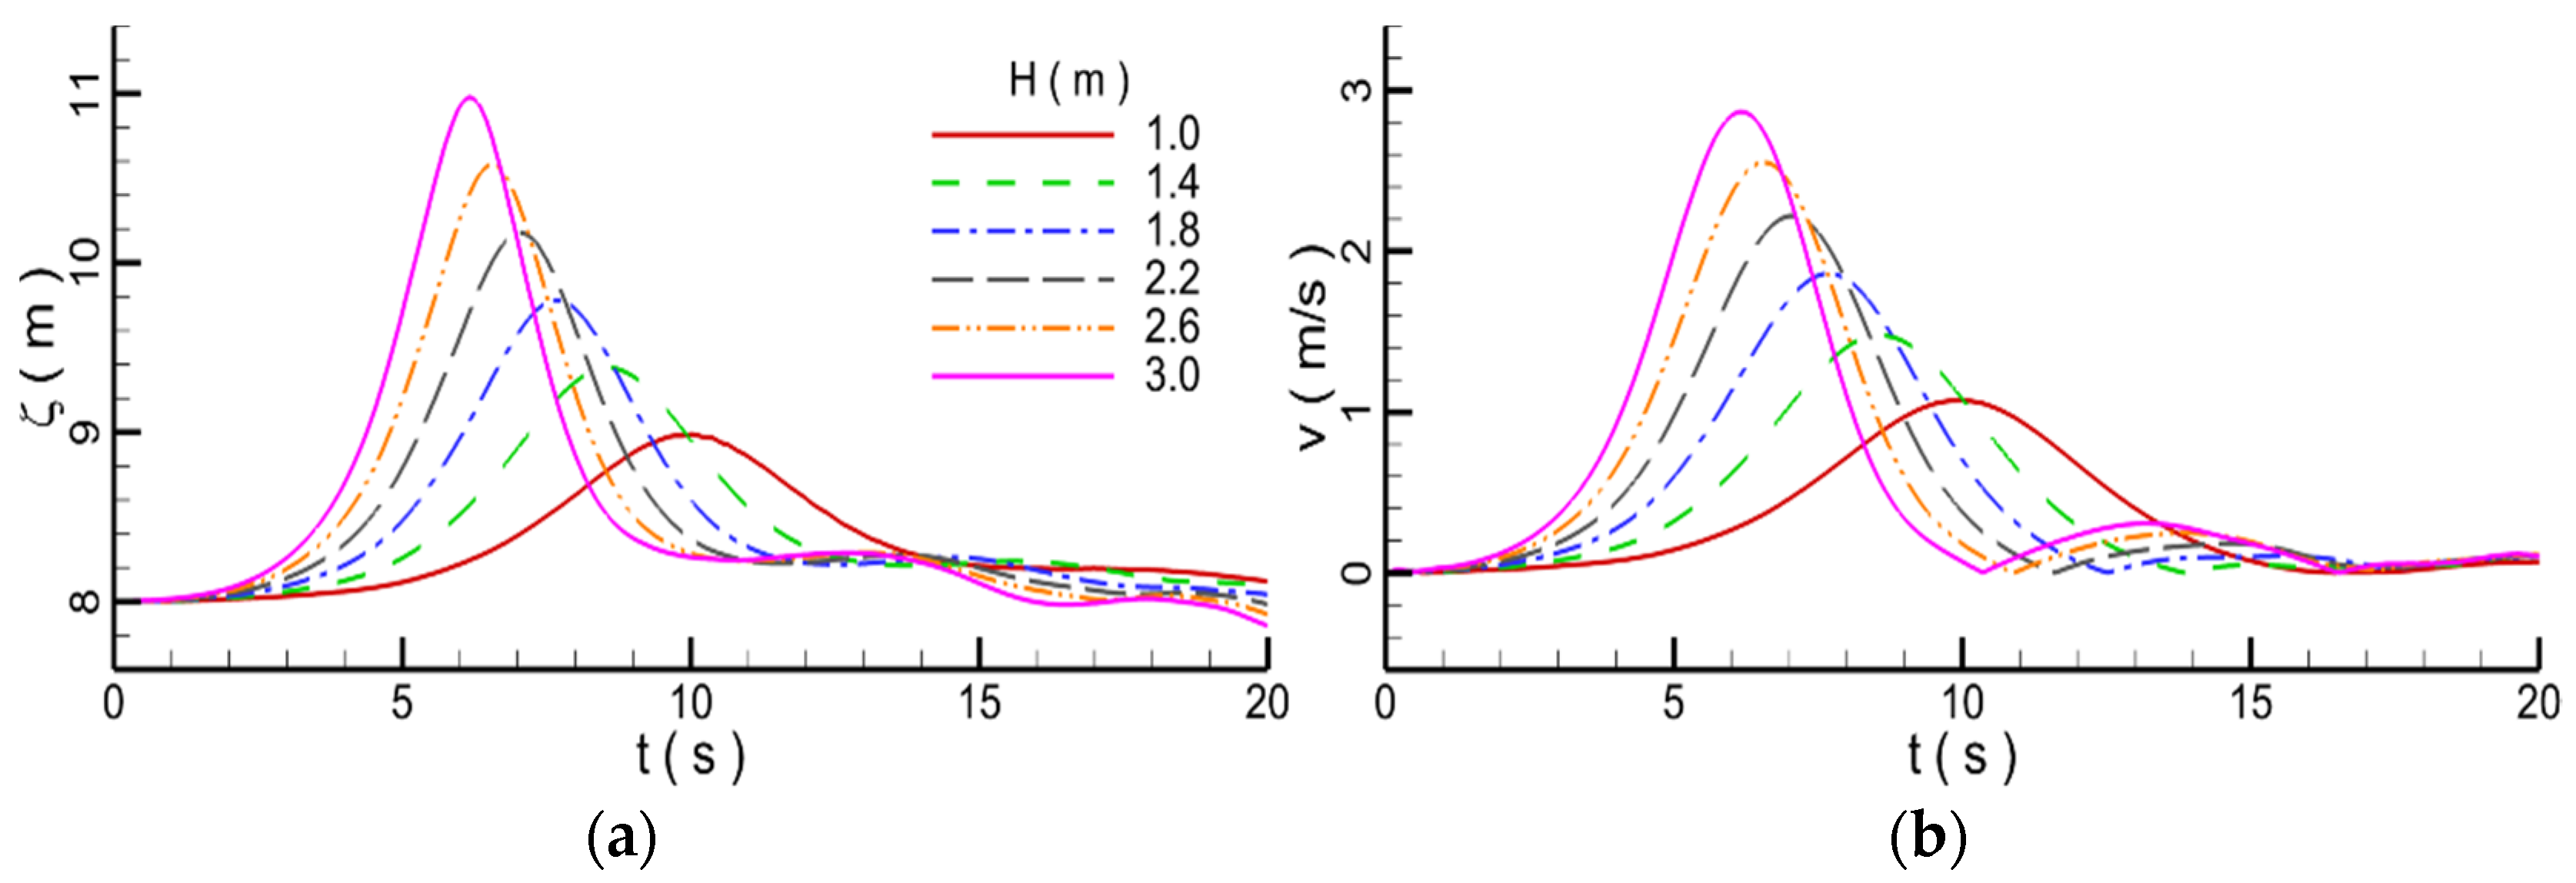
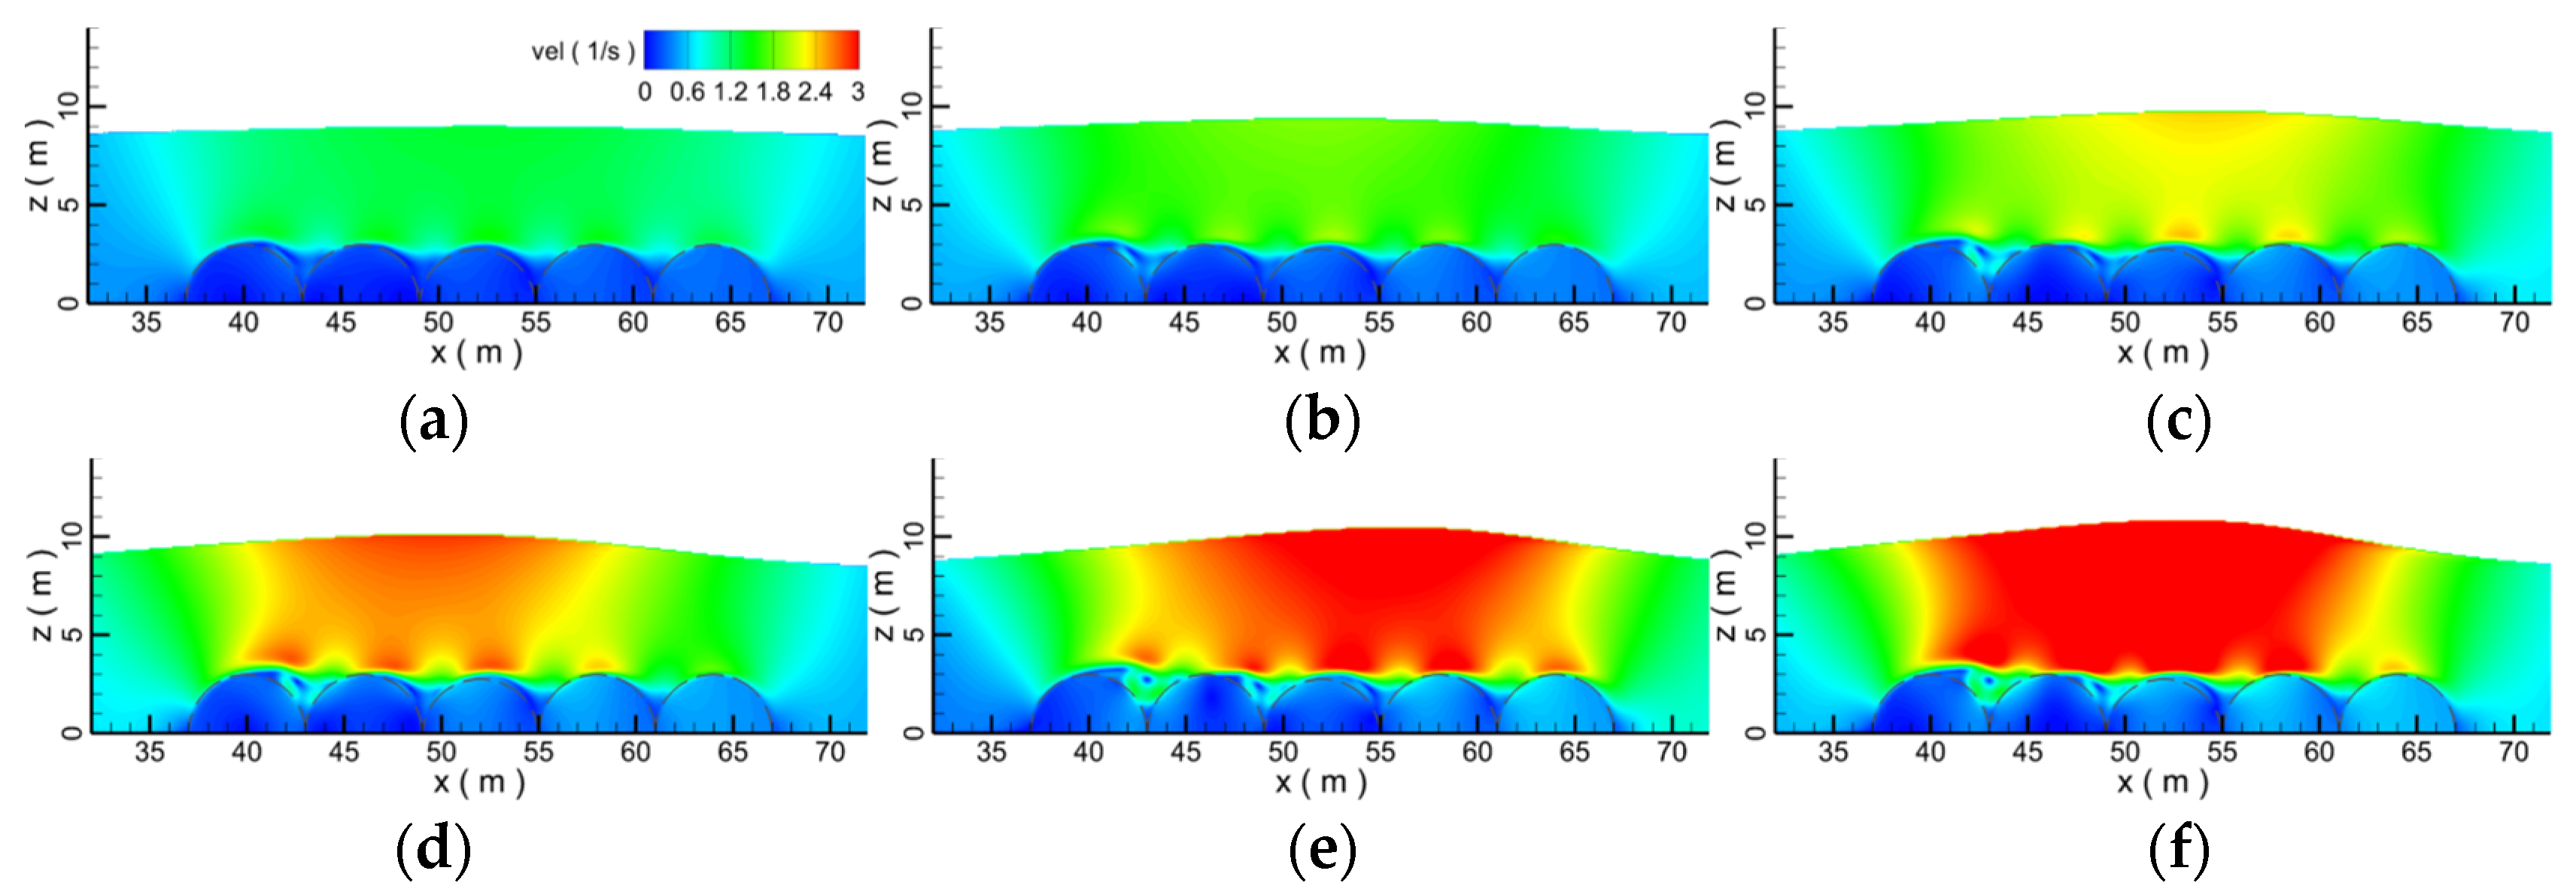
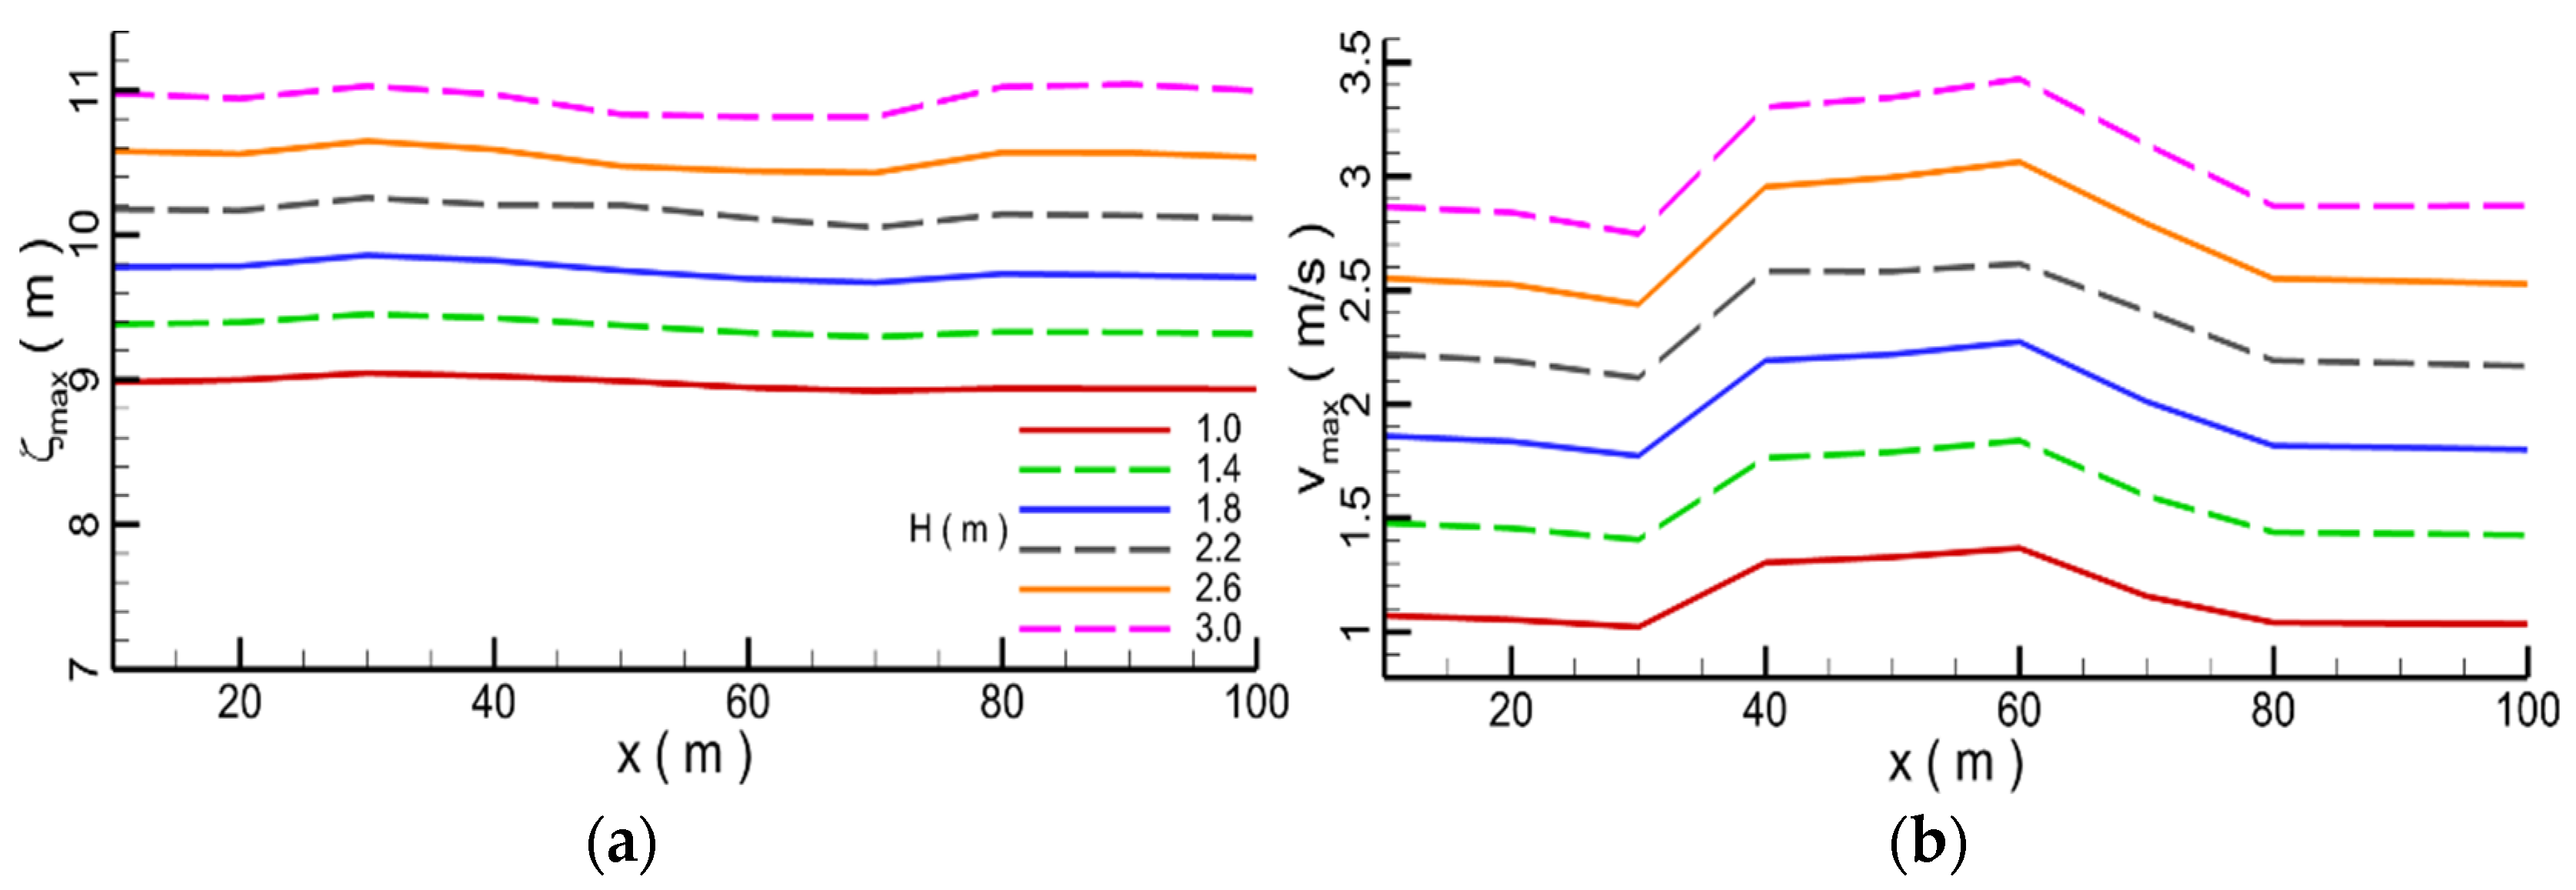
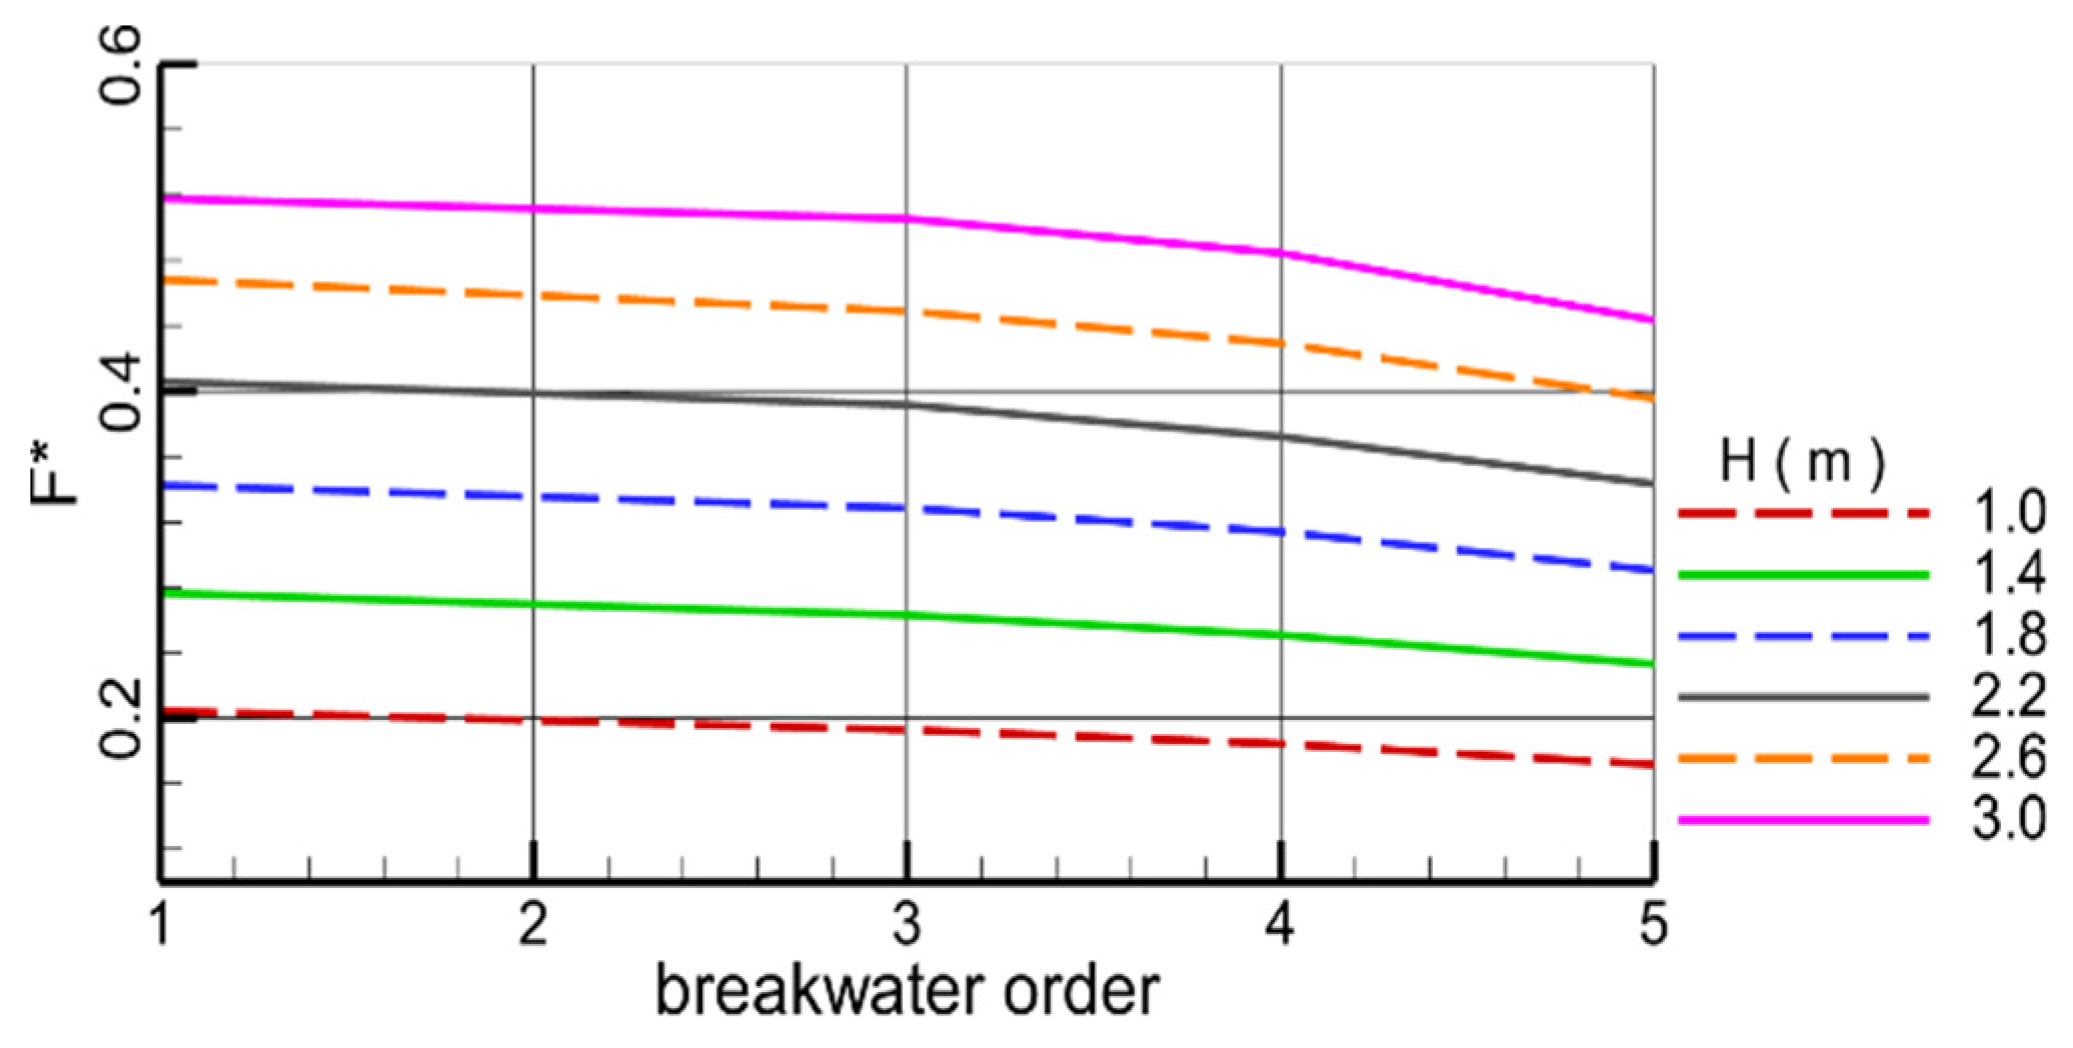
- (4)
- The higher the wave height, the more serious the wave deformation after passing through the submerged breakwater. The higher the wave height, the bigger the vortex behind the submerged breakwater, which indicates that the submerged breakwater has serious influence on waves with high wave height. With the increase in wave height, the influence of submerged breakwaters on waves is greater, the energy consumed by wave propagation is greater, and the water level and velocity decrease more obviously. The higher the wave height, the more obvious the blocking effect of the submerged breakwater on the waves, and the greater the force on the submerged breakwater.
- (5)
- By contrasting with a single breakwater, we obtain the conclusion that the influence of the porous breakwater on wave propagation is more significant than that of the solid breakwater. Additionally, compared with a single breakwater, the porous breakwater has a more significant impact on wave propagation.
Author Contributions
Funding
Institutional Review Board Statement
Informed Consent Statement
Data Availability Statement
Conflicts of Interest
Notation List
| ρ | fluid density |
| u | velocity vector in Cartesian coordinate system |
| t | time |
| pr | relative pressure |
| p | total pressure |
| g | the acceleration of the gravity |
| xr | he reference position coordinate |
| μt | dynamic viscosity |
| up | velocity in the porous medium |
| γp | closure coefficient |
| υ | kinematic viscosity |
| d50 | median particle diameter of the granular material |
| KC | Keulegan-Carpenter number |
| ur | relative velocity |
| F | VOF function where when it is filled with water |
| σ | local coordinate in the relaxation zone |
| a | wave height of solitary wave |
| h | initial water depth |
References
- Sun, J.; Ma, Z.; Wang, D.; Dong, S.; Zhou, T. Numerical study of the run-up of a solitary wave after propagation over a saw-tooth-shaped submerged breakwater. Int. J. Nav. Arch. Ocean Eng. 2020, 12, 283–296. [Google Scholar] [CrossRef]
- Fu, D.; Zhao, X.; Wang, S.; Yan, D. Numerical study on the wave dissipating performance of a submerged heaving plate breakwater. Ocean Eng. 2021, 219, 108310. [Google Scholar] [CrossRef]
- Zhao, E.; Mu, L.; Hu, Z.; Wang, X.; Sun, J.; Zhang, Z. Physical and Numerical Investigations on Wave Run-Up and Dissipation under Breakwater with Fence Revetment. J. Mar. Sci. Eng. 2021, 9, 1355. [Google Scholar] [CrossRef]
- Ali, K.K.; El Salam, M.A.A.; Mohamed, E.M.H.; Samet, B.; Kumar, S.; Osman, M.S. Numerical solution for generalized nonlinear fractional integro-differential equations with linear functional arguments using Chebyshev series. Adv. Differ. Equ. 2020, 2020, 494. [Google Scholar] [CrossRef]
- Osman, M.S.; Rezazadeh, H.; Eslami, M.; Neirameh, A.; Mirzazadeh, M. Analytical study of solitons to Benjamin-Bona-Mahony-Peregrine equation with power law nonlinearity by using three methods. UPB Sci. Bull. Ser. A Appl. Math. Phys. 2018, 80, 267–278. [Google Scholar]
- Akbar, M.A.; Wazwaz, A.-M.; Mahmud, F.; Baleanu, D.; Roy, R.; Barman, H.K.; Mahmoud, W.; Al Sharif, M.A.; Osman, M. Dynamical behavior of solitons of the perturbed nonlinear Schrödinger equation and microtubules through the generalized Kudryashov scheme. Results Phys. 2022, 43, 106079. [Google Scholar] [CrossRef]
- Han, X.; Dong, S. Interaction of solitary wave with submerged breakwater by smoothed particle hydrodynamics. Ocean Eng. 2020, 216, 108108. [Google Scholar] [CrossRef]
- Nassiraei, H.; Heidarzadeh, M.; Shafieefar, M. Numerical simulation of long waves (tsunami) forces on caisson breakwaters. Civ. Eng. 2016, 32, 3–12. [Google Scholar]
- Mahmoudof, S.M.; Hajivalie, F. Experimental study of hydraulic response of smooth submerged breakwaters to irregular waves. Oceanologia 2021, 63, 448–462. [Google Scholar] [CrossRef]
- Zhao, X.; Zhou, Y.; Zong, Y.; Yang, Z.; Luo, M. A CIP-based numerical simulation of wave interaction with a fluid-filled membrane submerged breakwater. Ocean Eng. 2022, 260, 111819. [Google Scholar] [CrossRef]
- Bautista, E.; Bahena-Jimenez, S.; Quesada-Torres, A.; Méndez, F.; Arcos, E. Interaction between long water waves and two fixed submerged breakwaters of wavy surfaces. Wave Motion 2022, 112, 102926. [Google Scholar] [CrossRef]
- Chen, Y.-K.; Liu, Y.; Meringolo, D.D.; Hu, J.-M. Study on the hydrodynamics of a twin floating breakwater by using SPH method. Coast. Eng. 2023, 179, 104230. [Google Scholar] [CrossRef]
- Liang, J.-M.; Chen, Y.-K.; Liu, Y.; Li, A.-J. Hydrodynamic performance of a new box-type breakwater with superstructure: Experimental study and SPH simulation. Ocean Eng. 2022, 266, 112819. [Google Scholar] [CrossRef]
- Magdalena, I.; Karima, N.; Marcela, I.; Farid, M. Generalization of a three-layer model for wave attenuation in n-block submerged porous breakwater. Results Eng. 2022, 16, 100428. [Google Scholar] [CrossRef]
- Aristodemo, F.; Filianoti, P. On the stability of submerged rigid breakwaters against solitary waves. Coast. Eng. 2022, 177, 104196. [Google Scholar] [CrossRef]
- Liang, B.; Wu, G.; Liu, F.; Fan, H.; Li, H. Numerical study of wave transmission over double submerged breakwaters using non-hydrostatic wave model. Oceanologia 2015, 57, 308–317. [Google Scholar] [CrossRef] [Green Version]
- Lyu, Z.; Liu, Y.; Li, H.; Mori, N. Iterative multipole solution for wave interaction with submerged partially perforated semi-circular breakwater. Appl. Ocean Res. 2020, 97, 102103. [Google Scholar] [CrossRef]
- Liu, Z.; Wang, Y. Numerical investigations and optimizations of typical submerged box-type floating breakwaters using SPH. Ocean Eng. 2020, 209, 107475. [Google Scholar] [CrossRef]
- Metallinos, A.S.; Klonaris, G.T.; Memos, C.D.; Dimas, A.A. Hydrodynamic conditions in a submerged porous breakwater. Ocean Eng. 2019, 172, 712–725. [Google Scholar] [CrossRef]
- Li, X.; Zhang, W. 3D numerical simulation of wave transmission for low-crested and submerged breakwaters. Coast. Eng. 2019, 152, 103517. [Google Scholar] [CrossRef]
- Xue, S.; Xu, Y.; Xu, G.; Wang, J.; Chen, Q. A novel tri-semicircle shaped submerged breakwater for mitigating wave loads on coastal bridges part I: Efficacy. Ocean Eng. 2022, 245, 110462. [Google Scholar] [CrossRef]
- Sun, W.; Qu, K.; Kraatz, S.; Deng, B.; Jiang, C. Numerical investigation on performance of submerged porous breakwater to mitigate hydrodynamic loads of coastal bridge deck under solitary wave. Ocean Eng. 2020, 213, 107660. [Google Scholar] [CrossRef]
- Patil, S.B.; Karmakar, D. Hydrodynamic analysis of floating tunnel with submerged rubble mound breakwater. Ocean Eng. 2022, 264, 112460. [Google Scholar] [CrossRef]
- He, Y.; Ji, W.; Han, B.; Yan, L.; Han, X. Influence of submerged annular rippled breakwater on hydrodynamic performance of column floating pier. Ocean Eng. 2022, 247, 110756. [Google Scholar] [CrossRef]
- Zhao, E.; Dong, Y.; Tang, Y.; Xia, X. Performance of submerged semi-circular breakwater under solitary wave in consideration of porous media. Ocean Eng. 2021, 223, 108573. [Google Scholar] [CrossRef]
- Guo, Y.; Mohapatra, S.; Soares, C.G. Submerged breakwater of a flexible porous membrane with a vertical flexible porous wall over variable bottom topography. Ocean Eng. 2021, 243, 109989. [Google Scholar] [CrossRef]
- Koley, S.; Vijay, K.; Nishad, C.; Sundaravadivelu, R. Performance of a submerged flexible membrane and a breakwater in the presence of a seawall. Appl. Ocean Res. 2022, 124, 103203. [Google Scholar] [CrossRef]
- Koraim, A.; Heikal, E.; Zaid, A.A. Hydrodynamic characteristics of porous seawall protected by submerged breakwater. Appl. Ocean Res. 2014, 46, 1–14. [Google Scholar] [CrossRef]
- Jensen, B.; Jacobsen, N.G.; Christensen, E.D. Investigations on the porous media equations and resistance coefficients for coastal structures. Coast. Eng. 2014, 84, 56–72. [Google Scholar] [CrossRef]
- van Gent, M.R.A. Porous Flow through Rubble-Mound Material. J. Waterw. Port Coast. Ocean. Eng. 1995, 121, 176–181. [Google Scholar] [CrossRef]
- Zhao, E.; Qu, K.; Mu, L. Numerical study of morphological response of the sandy bed after tsunami-like wave overtopping an impermeable seawall. Ocean Eng. 2019, 186, 106076. [Google Scholar] [CrossRef]
- Zhao, E.; Shi, B.; Qu, K.; Dong, W.; Zhang, J. Experimental and Numerical Investigation of Local Scour around Submarine Piggyback Pipeline under Steady Current. J. Ocean Univ. China 2018, 17, 244–256. [Google Scholar] [CrossRef]
- Zhao, E.; Dong, Y.; Tang, Y.; Cui, L. Numerical study on hydrodynamic load and vibration of pipeline exerted by submarine debris flow. Ocean Eng. 2021, 239, 109754. [Google Scholar] [CrossRef]
- Zhao, E.; Dong, Y.; Tang, Y.; Sun, J. Numerical investigation of hydrodynamic characteristics and local scour mechanism around submarine pipelines under joint effect of solitary waves and currents. Ocean Eng. 2021, 222, 108553. [Google Scholar] [CrossRef]
- Wu, Y.-T.; Hsiao, S.-C. Propagation of solitary waves over a submerged permeable breakwater. Coast. Eng. 2013, 81, 1–18. [Google Scholar] [CrossRef]
- Ye, J.H.; He, K.P.; Shan, J.P. Experimental Study on Stability of Revetment Breakwater Built on Reclaimed Coral Reef Islands in South China Sea under Extreme Wave Impact. Blasting 2019, 36, 11. [Google Scholar] [CrossRef]


Disclaimer/Publisher’s Note: The statements, opinions and data contained in all publications are solely those of the individual author(s) and contributor(s) and not of MDPI and/or the editor(s). MDPI and/or the editor(s) disclaim responsibility for any injury to people or property resulting from any ideas, methods, instructions or products referred to in the content. |
© 2023 by the authors. Licensee MDPI, Basel, Switzerland. This article is an open access article distributed under the terms and conditions of the Creative Commons Attribution (CC BY) license (https://creativecommons.org/licenses/by/4.0/).
Share and Cite
Zhu, K.; Jiang, R.; Sun, Z.; Qin, H.; Cheng, Z.; Wang, Y.; Zhao, E. Numerical Study on the Effects of the Multiple Porous Medium Breakwaters on the Propagation of the Solitary Wave. J. Mar. Sci. Eng. 2023, 11, 565. https://doi.org/10.3390/jmse11030565
Zhu K, Jiang R, Sun Z, Qin H, Cheng Z, Wang Y, Zhao E. Numerical Study on the Effects of the Multiple Porous Medium Breakwaters on the Propagation of the Solitary Wave. Journal of Marine Science and Engineering. 2023; 11(3):565. https://doi.org/10.3390/jmse11030565
Chicago/Turabian StyleZhu, Kui, Runxiang Jiang, Zhaolong Sun, Hao Qin, Zeqi Cheng, Yang Wang, and Enjin Zhao. 2023. "Numerical Study on the Effects of the Multiple Porous Medium Breakwaters on the Propagation of the Solitary Wave" Journal of Marine Science and Engineering 11, no. 3: 565. https://doi.org/10.3390/jmse11030565