Article

Changing Arctic Northern Sea Route and Transpolar Sea Route: A Prediction of Route Changes and Navigation Potential before Mid-21st Century

1
College of Marine Sciences, Shanghai Ocean University, Shanghai 201306, China
2
Southern Marine Science and Engineering Guangdong Laboratory (Zhuhai), Zhuhai 519082, China
3
School for Marine Science and Technology, University of Massachusetts-Dartmouth, New Bedford, MA 02744, USA
*
Authors to whom correspondence should be addressed.
J. Mar. Sci. Eng. 2023, 11(12), 2340; https://doi.org/10.3390/jmse11122340
Submission received: 16 November 2023 / Revised: 4 December 2023 / Accepted: 6 December 2023 / Published: 12 December 2023
(This article belongs to the Special Issue Safety and Efficiency of Maritime Transportation and Ship Operations)

Abstract

:
Sea ice concentration and thickness are key parameters for Arctic shipping routes and navigable potential. This study focuses on the changes in shipping routes and the estimation of navigable potential in the Arctic Northern Sea Route and Transpolar Sea Route during 2021–2050 based on the sea ice data predicted by eight CMIP6 models. The Arctic sea ice concentration and thickness vary among the eight models, but all indicate a declining trend. This study indicates that, under the two scenarios, the least-cost route will migrate more rapidly from the low-latitude route to the high-latitude route in the next 30 years, showing that the Transpolar Sea Route will be navigable for Open Water (OW) and Polar Class 6 (PC6) before 2025, which is advanced by nearly 10 years compared to previous studies. The sailing time will decrease to 16 and 13 days for OW and PC6 by 2050, which saves 3 days compared to previous studies. For OW, the navigable season is mainly from August to October, and the Northern Sea Route is still the main route, while for PC6, the navigable season is mainly from July to January of the following year, and the Transpolar Sea Route will become one of the important choices.

1. Introduction

Sea ice is an important factor in the climate system. Climate changes affect the characteristics of sea ice, and changes in sea ice also have an impact on local or global climate to some extent, playing a crucial role in global heat balance, atmospheric circulation, ocean circulation, and temperature and salinity balance. The profound impacts of climate change are revealed by the Sixth Assessment Report (AR6) of the Intergovernmental Panel on Climate Change (IPCC) and the 27th session of the Conference of the Parties of the United Nations Framework Convention on Climate Change (COP 27) [1,2].
The rise in Arctic temperatures has intensified the melting and retreat of sea ice, the reduction in snow cover, and the thawing of permafrost in the Arctic region [3,4,5,6]. The areas of sea that have been covered by thick ice year-round are gradually transforming into ice-free or thin-ice regions. The rate of decline in Arctic sea ice extent in September has a range from 0.015 × 10⁶ km2/year to 0.049 × 10⁶ km2/year during 1979–1998 but has accelerated to the range from 0.116 × 10⁶ km2/year to 0.192 × 10⁶ km2/year during 1999–2010 [7,8]. During 2013–2019, the mean annual extent of Arctic sea ice decreased from 9.23 × 10⁶ km2 to 8.51 × 10⁶ km2, with an annual decline rate of 1.34% [9]. In addition, Arctic sea ice thickness is also experiencing rapid changes. According to satellite data, between 2003 and 2018, the volume of Arctic sea ice decreased by 5130 km3 per decade during the autumn and by 2870 km3 per decade during the winter. Furthermore, the mean sea ice thickness in some areas of the Arctic decreased by 2 m over a period of 60 years (1958–2018) [10]. The reduction in sea ice thickness and coverage in the Arctic region has led to a continuous increase in open water areas and an extension of the summer melting season. Therefore, the Arctic shipping routes have a longer navigational period, greatly enhancing their navigational potential [11,12]. The development of Arctic shipping routes has close connections with the Sustainable Development Goals (SDGs), including Climate Action, Life Below Water, and Affordable and Clean Energy [13].
The Arctic Passage, which connects the North Pacific and the North Atlantic, serves as a maritime shortcut [14]. It is typically separated into the Northern Sea Route (NSR), the Northwest Passage (NWP), and the Transpolar Sea Route (TSR) that crosses the North Pole. The Northern Sea Route is along the offshore waters of northern Russia, connecting Asia and Europe. It is the least ice-covered and most navigable of the three Arctic routes and is divided into four routes by latitude: low-latitude, mid-latitude, high-latitude, and near-polar routes [15,16,17]. Compared to the traditional Suez Canal route, the Northern Sea Route can shorten the journey by 15% to 50% [18,19,20,21,22]. The Transpolar Sea Route, which crosses the North Pole, is the shortest sea route connecting the North Pacific and North Atlantic [19], but it is often heavily ice-covered, making navigation difficult, and currently has low feasibility for navigation. The Northwest Passage is along the Arctic coast of Alaska, the Canadian Arctic Archipelago, and the Davis Strait, connecting Asia and eastern North America. In 2020, the Protection of the Arctic Marine Environment Working Group released the Arctic shipping status report, which suggested that Arctic shipping had increased by 25% from 2013 to 2019 [23,24]. Against the background of global climate change, the future planning and navigational potential of the Arctic shipping routes will be of great concern. Compared with the Northern Sea Route, the Northwest Passage has heavier sea ice conditions and less developed navigation infrastructure, making it more difficult to navigate [18,19]. In addition, the Canadian Arctic Archipelago has complex coastlines, narrow waterways, and limited spatiotemporal observed sea ice data in the region. Furthermore, the Transpolar Sea Route is adjacent to the near-polar route of the Northern Sea Route. Therefore, this study focuses on the Northern Sea Route, which currently has the highest navigability, and the Transpolar Sea Route, which has the greatest potential for future navigation, to conduct research on future route changes and navigation potential estimation.
Currently, most studies of Arctic sea ice and Arctic shipping prediction rely on models [18,25,26,27,28,29,30,31,32,33,34,35,36,37,38]. The Coupled Model Intercomparison Project Phase 6 (CMIP6) has gathered the latest prediction data of climate models. It is better suited to the current global warming background than the CMIP5 model data due to the incorporation of Shared Socioeconomic Pathways (SSPs) [37]. The Arctic sea ice prediction data provided by CMIP6 under various scenarios can reduce the uncertainty of future prediction data and better represent the changing trend of Arctic sea ice in the future.
Sea ice concentration and thickness are two important parameters for planning Arctic shipping routes and assessing navigational potential, and their accuracy significantly affects the reliability of future estimates for Arctic shipping. However, there has been limited research on the accuracy of CMIP6 sea ice data. Watts et al. conducted an evaluation of the historical data of sea ice concentration and thickness between 1979 and 2014 from 13 CMIP6 climate models, utilizing ICESat and CryoSat-2 satellite data [35]. Similarly, Shen et al. compared the sea ice concentration historical data of CMIP6 and CMIP5 with observational data and evaluated the performance of 36 CMIP6 models during 1979–2014 [38]. Both studies presented a clear demonstration of the differences between CMIP6 models and observational data, enabling a comprehensive assessment of their performance.
In addition, the current studies related to Arctic shipping routes based on CMIP6 sea ice data are primarily conducted using the multi-model mean (MMM). Li et al. conducted an assessment of the navigability of Arctic shipping routes from 2015 to 2065 using 16 models [29]. Their findings revealed that three feasible shipping scenarios demonstrated a significant reduction in navigation risk starting from 2045, but this result was only applicable to the SSP5-8.5 scenario (very high greenhouse gas emissions: CO2 emissions triple by 2075). Chen et al. predicted a significant increase and extension of navigable areas and navigable windows during 2045–2055, but further navigability assessments were lacking [27]. Wei et al. conducted an analysis of the navigation probability and route changes of the Arctic Passage by the end of the 21st century using the Arctic Transport Accessibility Model (ATAM) [36]. Their study utilized the MMM to predict the future conditions of the Arctic under the SSP2-4.5 (intermediate GHG emissions: CO2 emissions around current levels until 2050, then falling but not reaching net zero by 2100) and SSP5-8.5 scenarios. The study predicted that the Arctic will be ice-free in September by 2076 and 2055 under the SSP2-4.5 and SSP5-8.5 scenarios, respectively, enabling navigation through the Transpolar Sea Route. Min et al. conducted an analysis of the changes in the navigation potential of Arctic shipping between 2021 and 2100 using the ATAM [31]. The results of the study, based on the MMM, indicated that the navigable area for Open Water (OW) and Polar Class 6 (PC6) is expected to continue to increase in September before 2050 under both the SSP2-4.5 and SSP5-8.5 scenarios. However, similar to the study of Wei et al. [36], both studies did not conduct further detailed analysis of route planning. Moreover, the results of the MMM do not clearly depict the route planning and navigation potential evaluation results of different models, and they are also inadequate for comparing the similarities and differences between the results of different models. Furthermore, the sea ice thickness division of ATAM, which has been commonly employed in previous studies, is relatively coarse.
In this study, the seven models with better performances were selected based on the sea ice concentration and thickness data evaluation results of various models in CMIP6 from Watts et al. [35] and Shen et al. [38], and the CMCC-ESM2 model with relatively large differences of sea ice concentration and thickness was also added as a comparison. Based on the Polar Operational Limit Assessment Risk Indexing System (POLARIS) with more detailed sea ice thickness classification (IMO, 2016), the navigational risk of each model was quantified under two scenarios (SSP2-4.5 and SSP5-8.5), represented by two types of vessels, Open Water (OW) and Polar Class 6 (PC6), and the navigability of each model was evaluated and analyzed from multiple perspectives to find out the similarities and differences between the models and to comprehensively predict the changes in Arctic shipping routes and navigability potential in the next 30 years.

2. Data and Methods

2.1. CMIP6 Sea Ice Data

Based on the evaluation results of sea ice concentration and thickness from Watts et al. [35] and Shen et al. [38], this study utilizes monthly sea ice concentration and thickness data with the better performances obtained from seven climate models, including ACCESS-ESM1-5, CESM2-WACCM, EC-Earth3-CC, MIROC6, MPI-ESM1-2-HR, NorESM2-MM, and UKESM1-0-LL. The CMCC-ESM2 model with smaller simulation results of sea ice concentration and thickness was additionally utilized as a comparison (Table 1). CMIP6 data show that there will be completely ice-free months in the Arctic before 2050 [39], and 30 years before 2050 is the period with the largest change in navigation potential [29,33]. Therefore, this study focuses on the period between 2021 and 2050, with a particular emphasis on the Northern Sea Route and the Transpolar Sea Route (Figure 1). The SSP2-4.5 and SSP5-8.5 scenarios are selected for this research. Due to the difference in grid resolution in the CMIP6 models, we employed the inverse distance weighting (IDW) interpolation technique to convert the model data grids into a consistent grid size with a resolution of 12.5 km × 12.5 km.

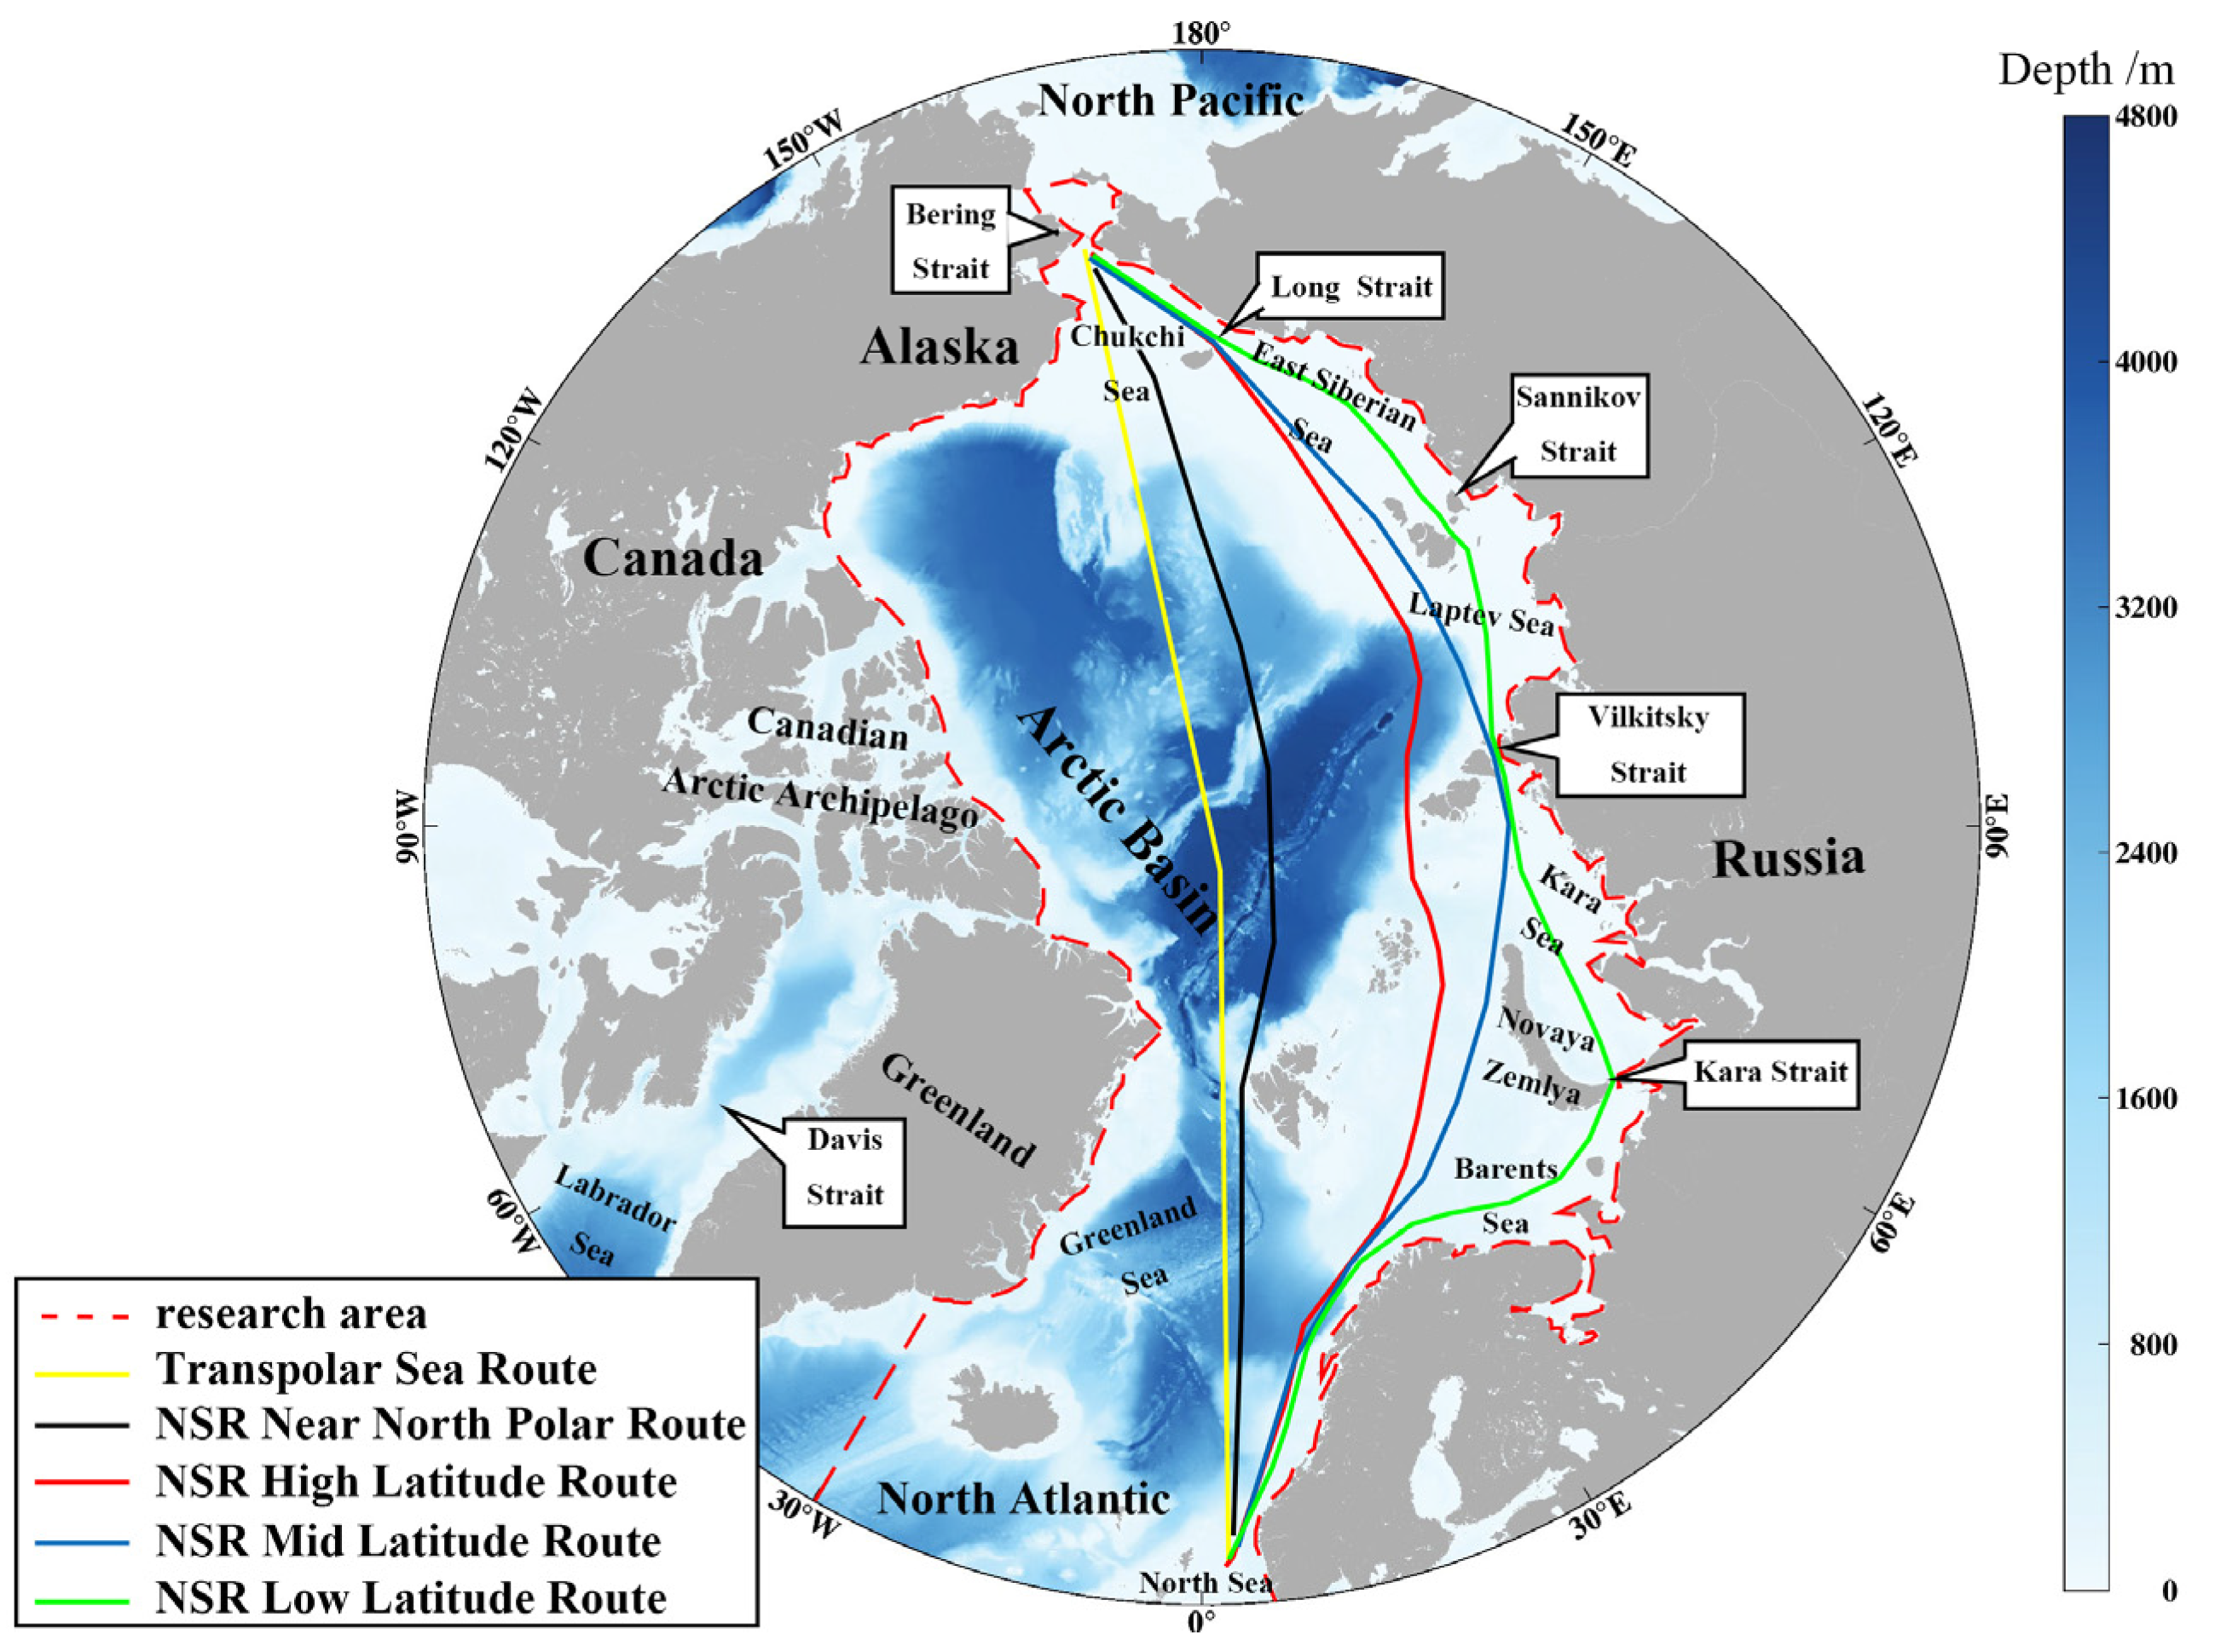
2.2. Arctic Shipping Route Calculation

The POLARIS, released by the International Maritime Organization in 2016, is the latest mechanism for evaluating navigation risks in ice-covered waters. This system integrates the experience and best practices derived from the Canadian Arctic Ice Regime Shipping System (AIRSS) and the Russian Ice Certificate concept, with additional input provided by other coastal administrations with experience regulating marine traffic in ice conditions. The basis of POLARIS is an evaluation of the risks posed to the ship by ice conditions using the World Meteorological Organization (WMO) nomenclature and the ship’s assigned ice class.
This study quantifies the navigation risk using POLARIS. The risk value (RV) of two types of vessels, OW and PC6, are obtained based on the monthly sea ice thickness (SIT) and the vessel’s ice-breaking capability. The RV is then combined with sea ice concentration data to calculate the risk index outcome (RIO) of navigation. The RIO is used to plan the least-cost path [40], which is referred to as the least-cost route in this study. The starting and ending points of the route are, respectively, the Bering Strait and the Rotterdam Port in Europe (Figure 1), which is similar to Melia et al. [30], Min et al. [31], and Wei et al. [36].
R V OW = { 3 ,   SIT = 0   cm 1 ,   0   cm < SIT 10   cm 0 ,   10   cm < SIT 15   cm 1 ,   15   cm < SIT 30   cm 2 ,   30   cm < SIT 50   cm 3 ,   50   cm < SIT 120   cm 4 ,   120 < SIT 200   cm 5 ,   200 < SIT 250   cm 6 ,   SIT > 250   cm
R V PC 6 = { 3 ,   SIT = 0   cm 2 ,   0   cm < SIT 50   cm 1 ,   50   cm < SIT 95   cm 0 ,   95   cm < SIT 120   cm 1 ,   120   cm < SIT 200   cm 2 ,   200   cm < SIT 250   cm 3 ,   SIT > 250   cm
The RIO can be calculated based on the RV values and sea ice concentration data. If RIO is greater than or equal to 0, the area is considered navigable, and a higher RIO indicates safer navigational conditions. Conversely, if RIO is less than 0, the area is risky and considered as no transit. The equation is as follows:
RI O v = C T × R V V , T
The subscript V denotes vessel type, the subscript T denotes sea ice thickness, the subscript V denotes vessel type, C T indicates sea ice concentration corresponding to sea ice thickness T, and RV V , T indicates the RV of V-type vessels navigating in the area covered by sea ice thickness T. Note that in the POLARIS, there are two types of sea ice with different RV in the 120–200 cm thickness range, and there is a lack of RV for the 200–250 cm thickness range. Therefore, the RV for the 120–200 cm range and 200–250 cm range are determined based on the RV of one-year ice and second-year ice, respectively.

2.3. Sailing Time of Arctic Shipping Route

Based on the AIRSS released by the Canadian Department of Transportation in 1998, the safe speed can be obtained according to the ice numeral (IN) of each point along the route, and then the sailing time for each route is calculated [25]. The time it takes to pass through the shortest Transpolar Sea Route at the fastest safe speed is approximately 12.77 days, which is referred to as the shortest sailing time in this study.
Safe   speed = { 0 ,   IN < 0 , ( unnavigable ) 4 ,   0 IN 8 5 ,   9 IN 13 6 ,   14 IN 15 7 ,   IN = 16 8 ,   IN = 17 9 ,   IN = 18 10 ,   IN = 19 11 ,   IN = 20 , ( n   mile / h )
The IN value is calculated based on the sea ice concentration and the ice multipliers (IM) determined by sea ice thickness and vessel type:
I N V = C T ×   I M V , T
The IM values are set by the following conditions, where TYPE E corresponds to OW, and TYPE A corresponds to PC6 [32,41].
I M TYPE   A = { 2 ,   0   cm SIT 70   cm 1 ,   70   cm < SIT 120   cm 1 ,   120   cm < SIT 200   cm 3 ,   200   cm < SIT 250   cm 4 ,   SIT > 250   cm
I M TYPE   E = { 2 ,   0   cm SIT 10   cm 1 ,   10   cm < SIT 15   cm 1 ,   15   cm < SIT 70   cm 2 ,   70   cm < SIT 120   cm 3 ,   120   cm < SIT 200   cm 4 ,   SIT > 200   cm

3. Results

3.1. Analysis of Key Parameters for Sea Ice along Shipping Routes

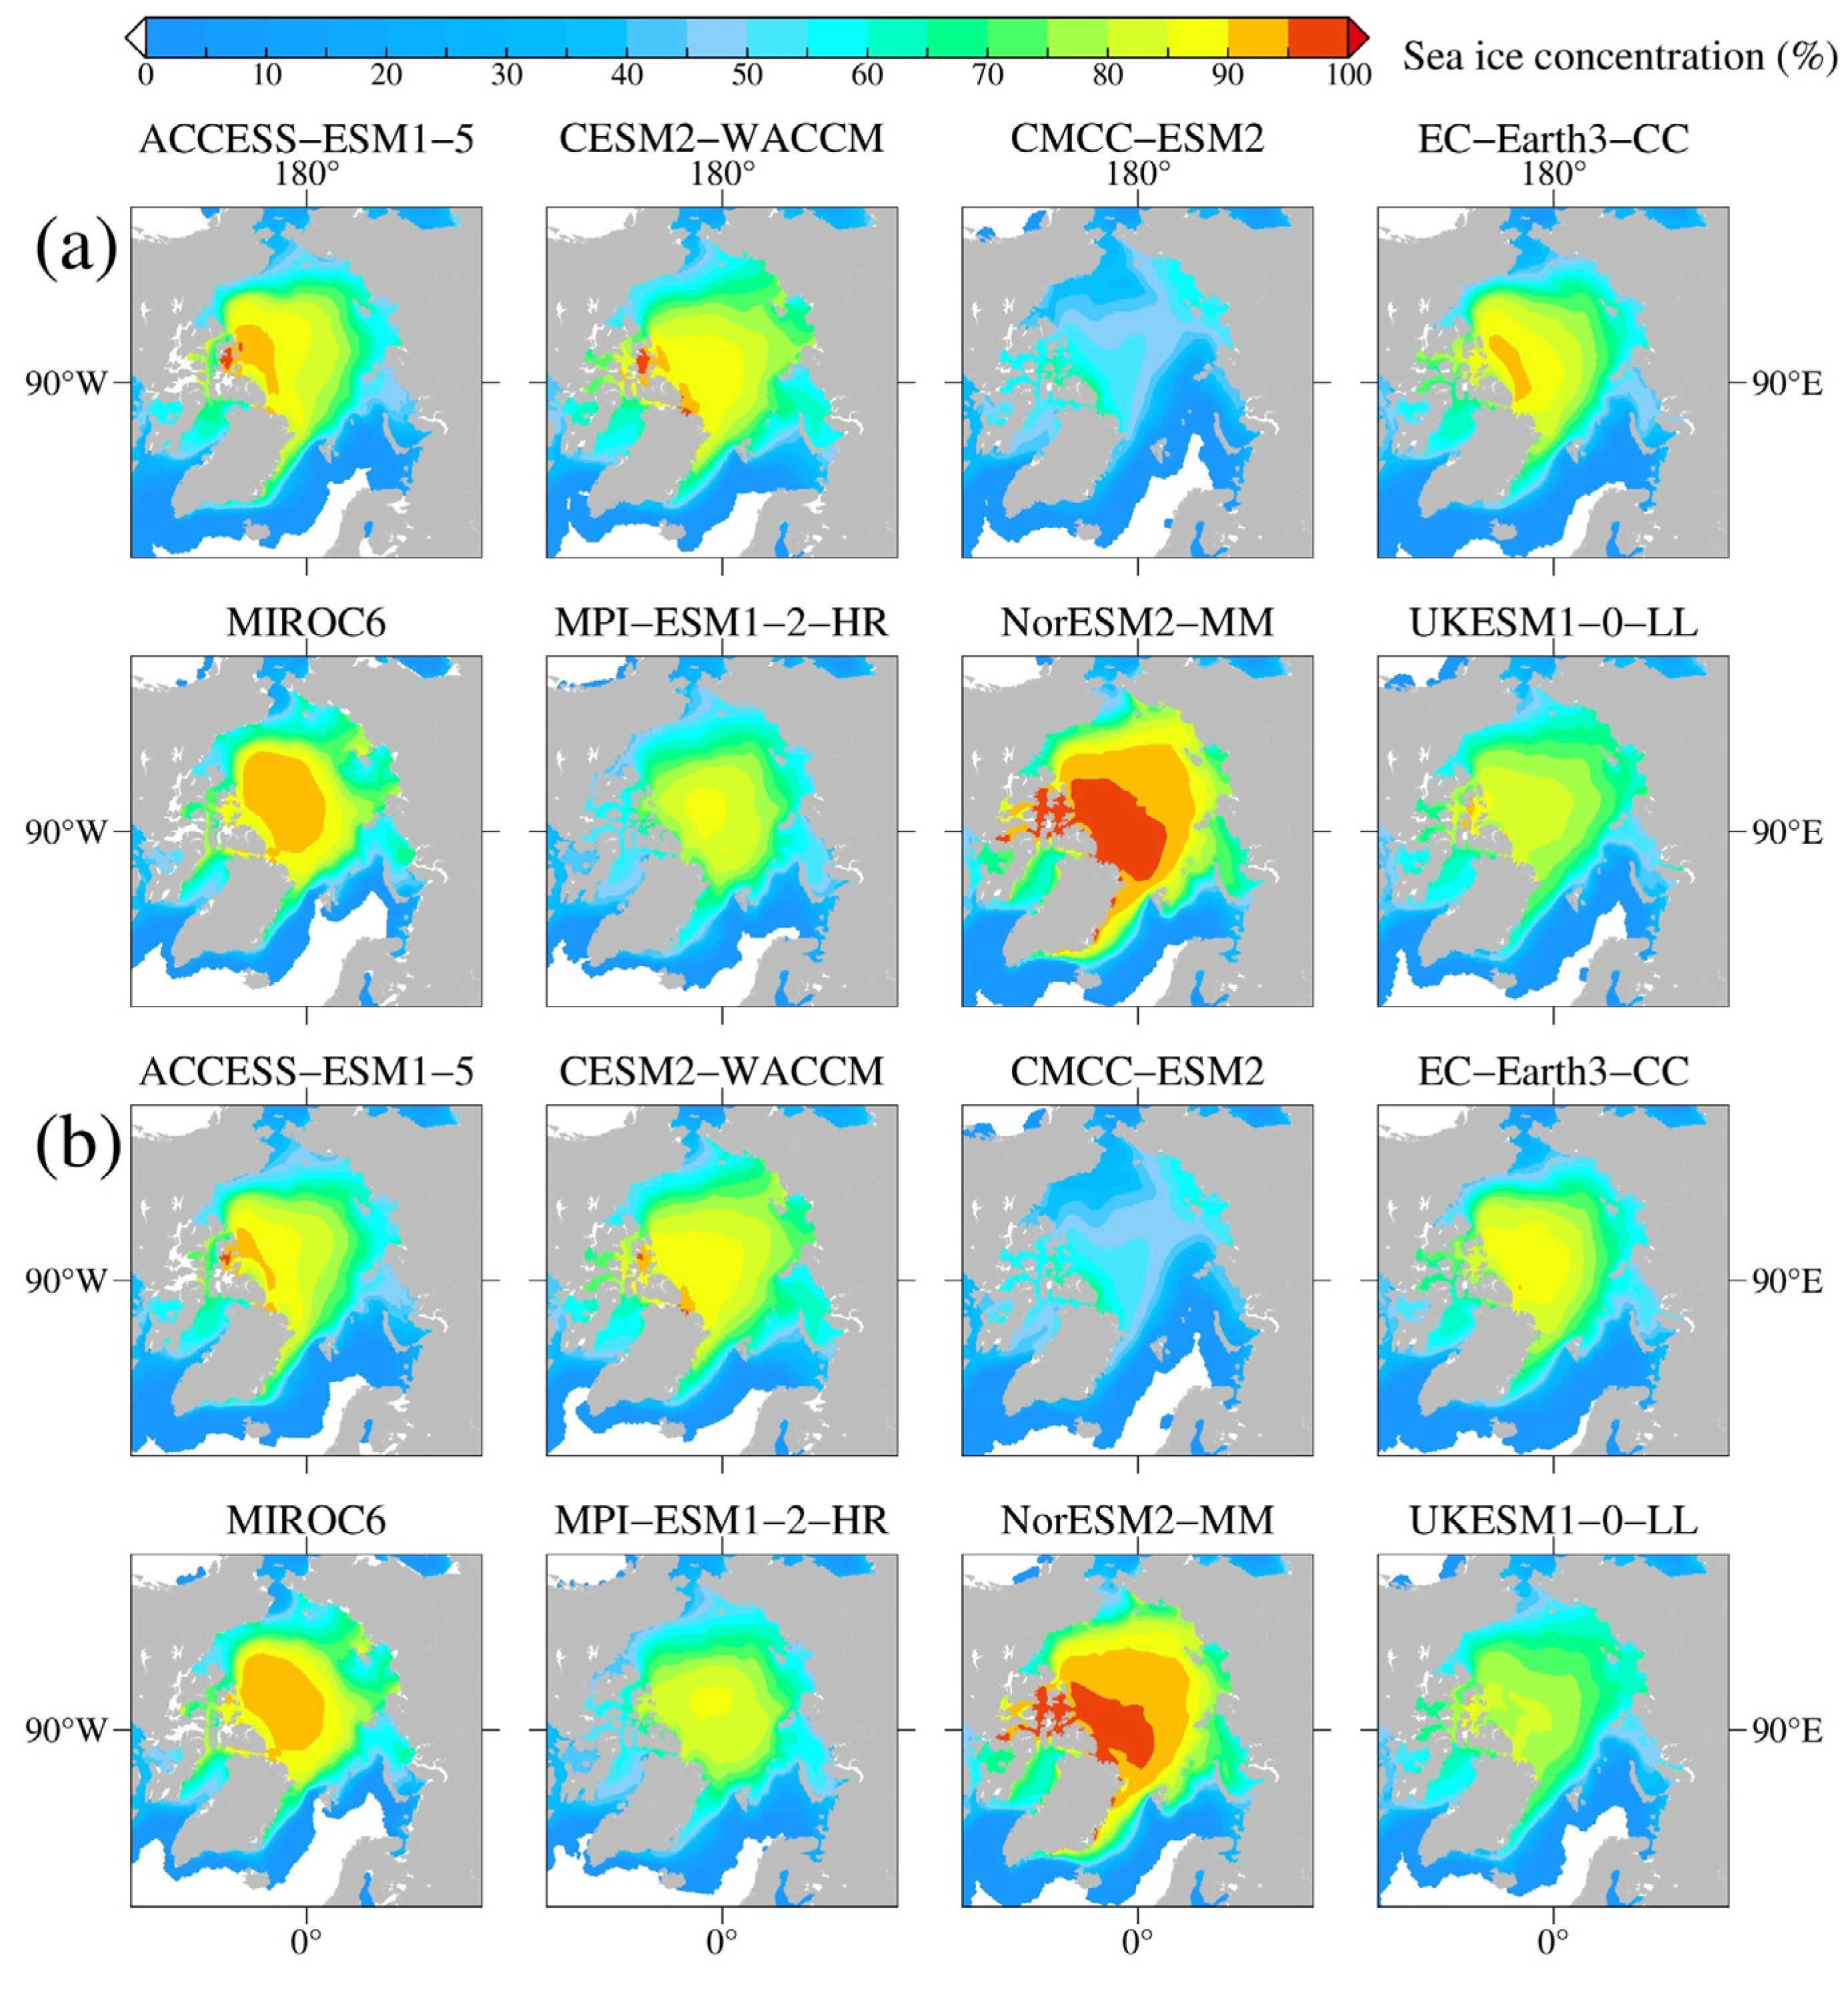
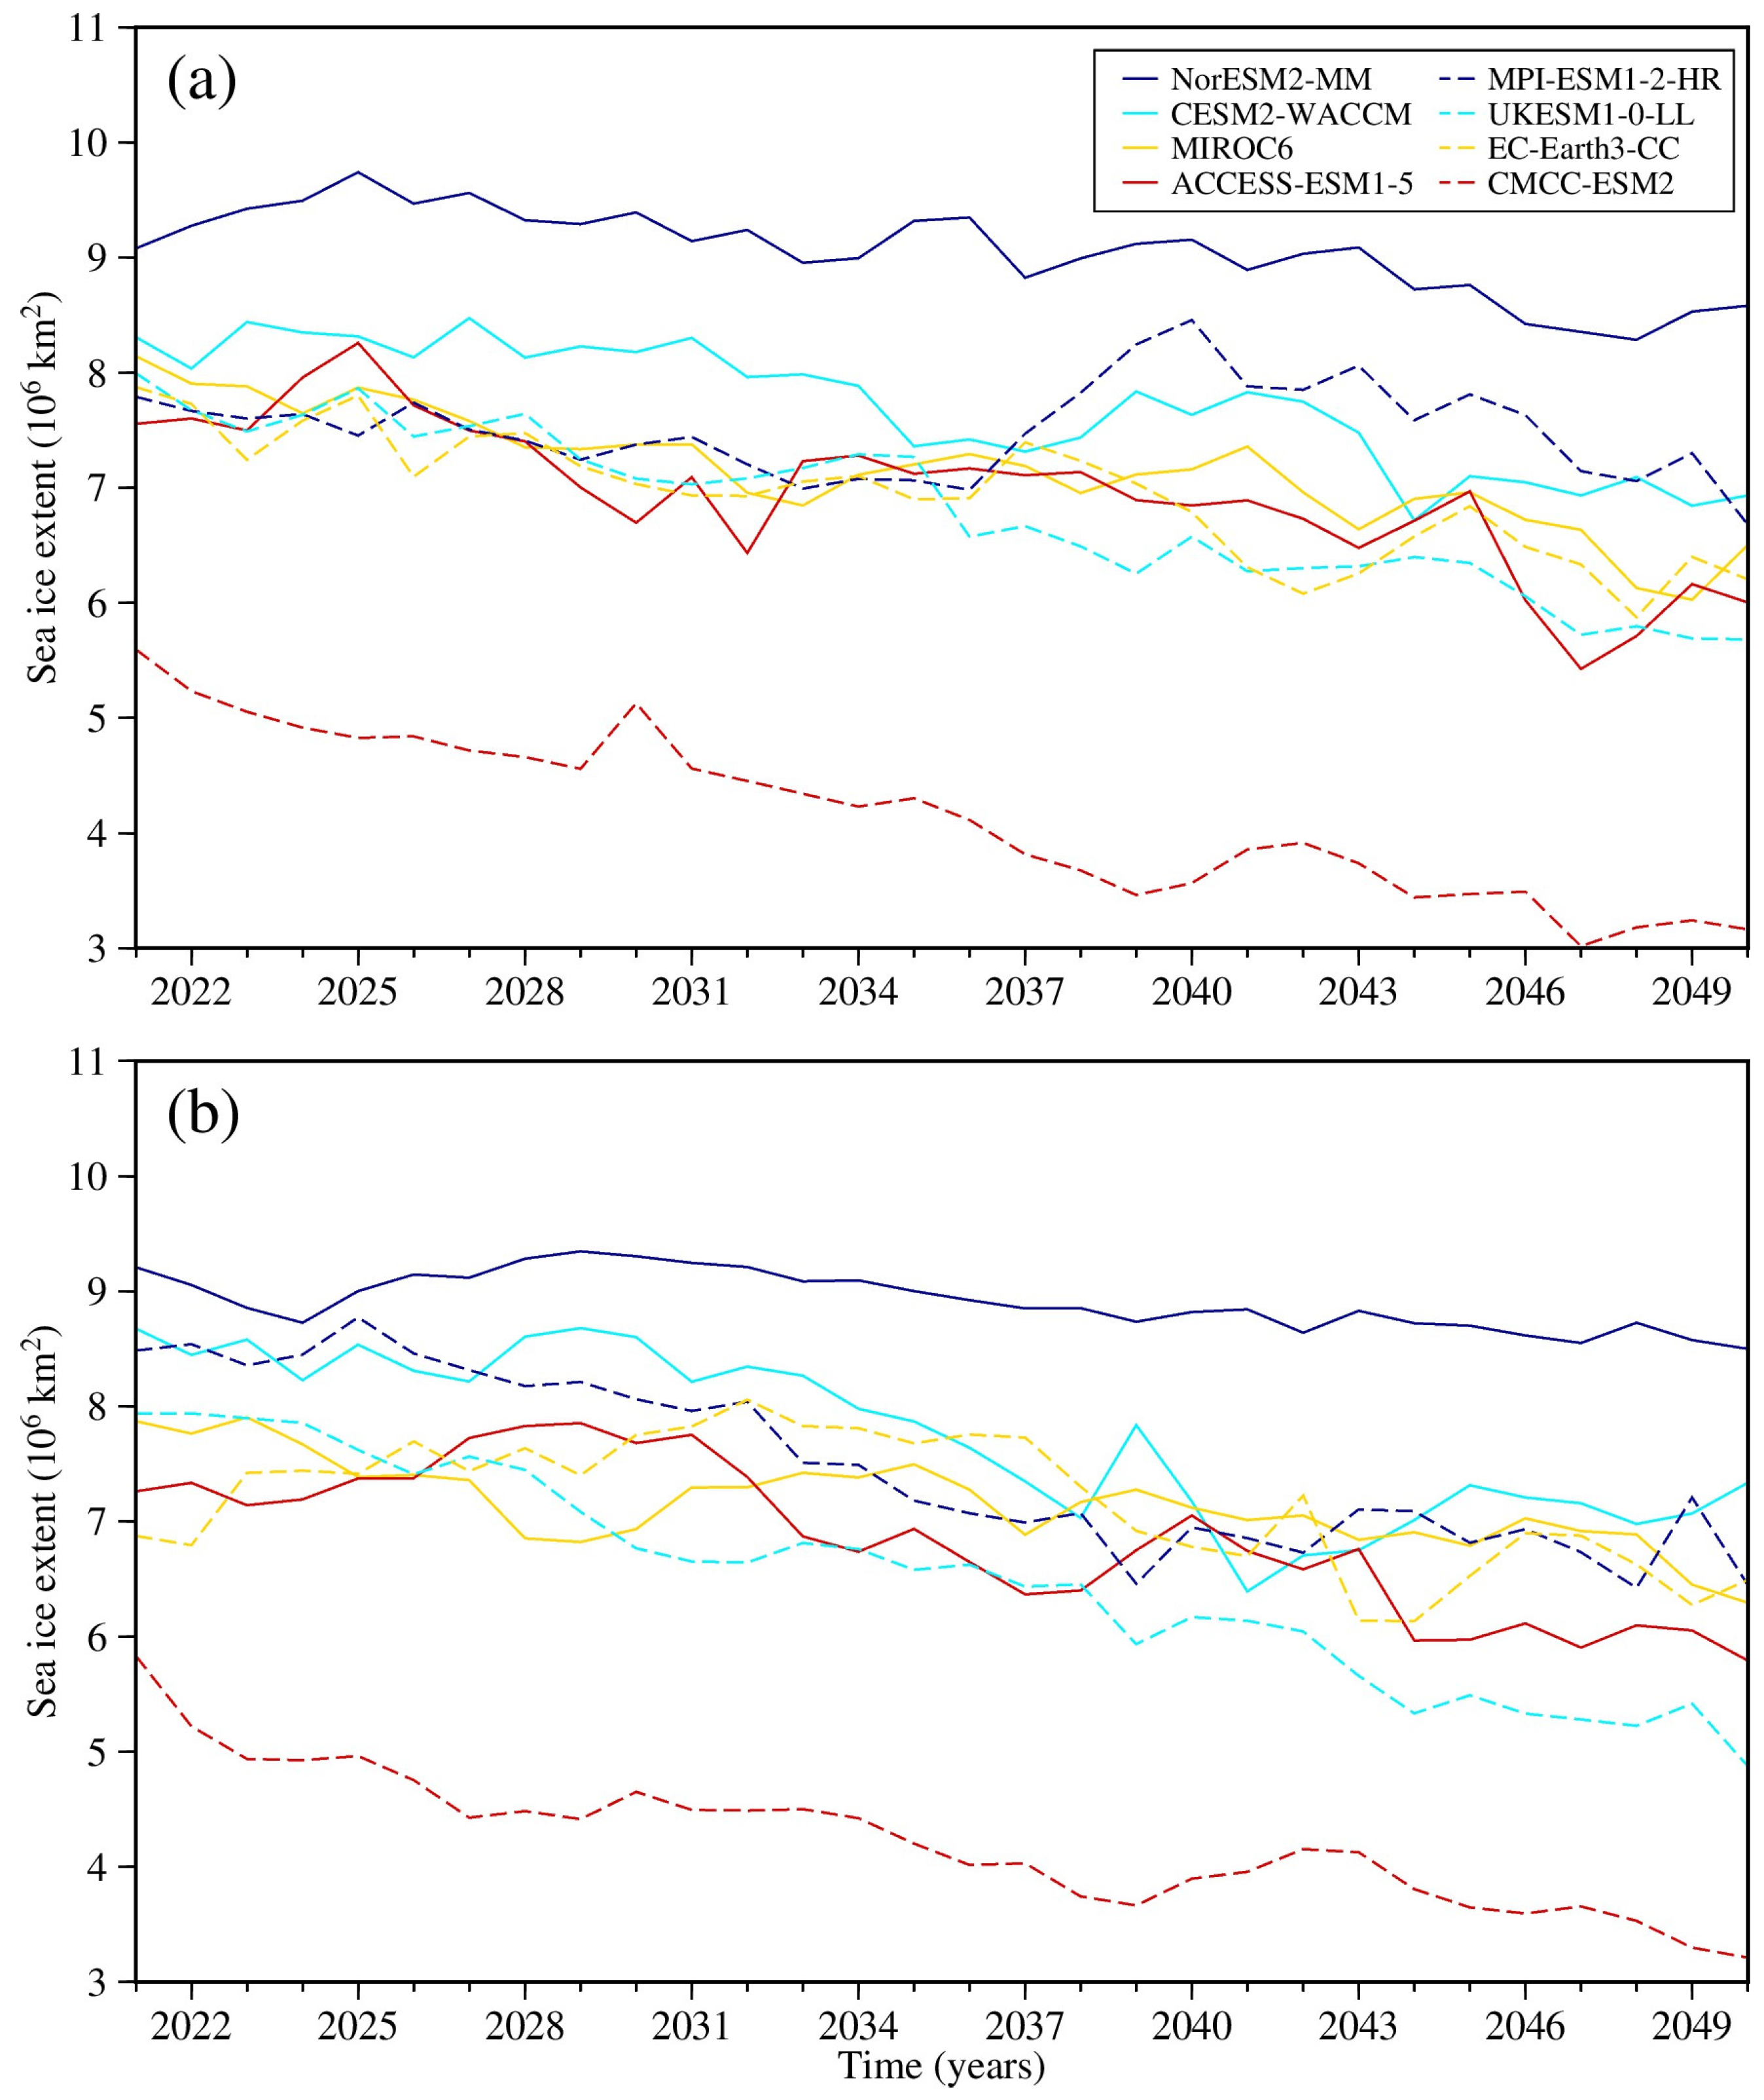
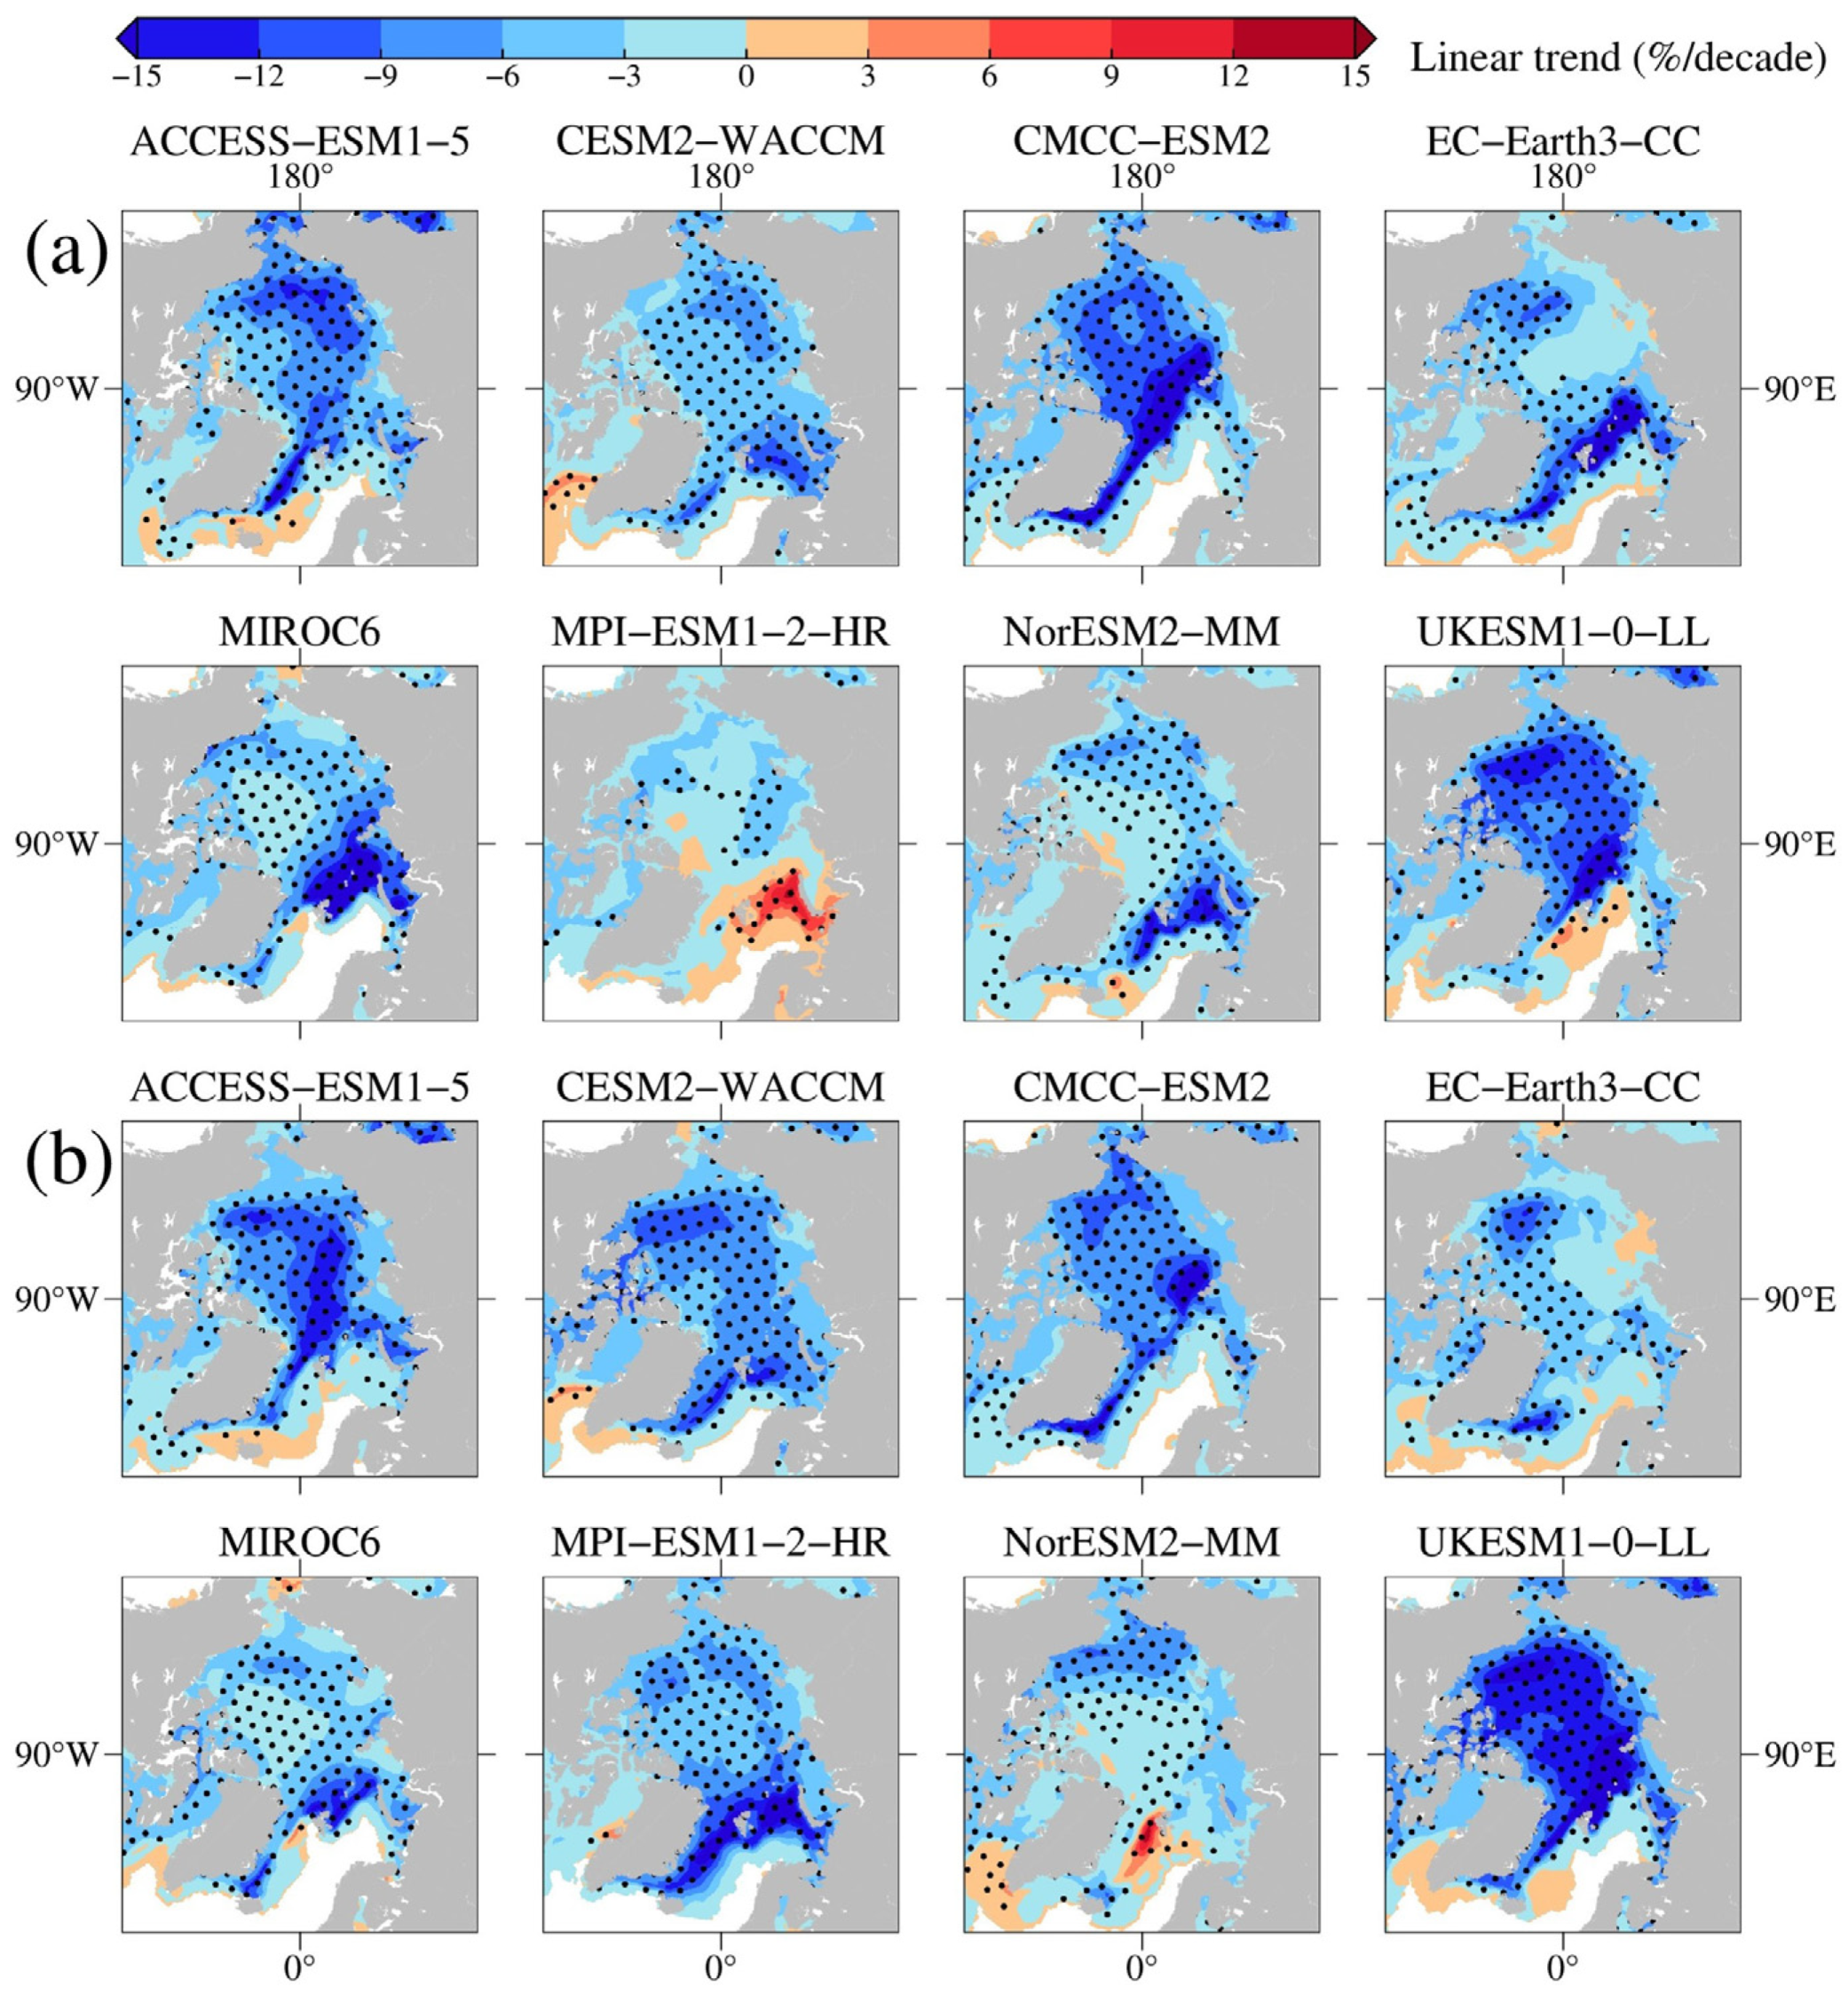
3.1.1. Sea Ice Concentration

In terms of the spatial distribution of multi-year mean sea ice concentration from 2021 to 2050, under the SSP2-4.5 scenario (Figure 2a), most models show that high sea ice concentration is located in the northern Canadian Arctic Archipelago and the north of Greenland, while only the MIROC6 and MPI-ESM1-2-HR models display high sea ice concentration in the Central Arctic Ocean. The sea ice concentration in the Arctic coastal regions of Alaska, Canada, and Eurasia is relatively low. Within the study area (with a minimum latitude of 66.57° N), multi-year mean sea ice concentration data from the different models suggest that the maximum mean value is 71.5% for NorESM2-MM, while the minimum is only 30.2% for CMCC-ESM2. The mean sea ice concentration values for other models are between 50% and 60%. Along the Russian coast of the Northern Sea Route, the CESM2-WACCM and MIROC6 models show higher sea ice concentration in the Sannikov Strait, about 20% higher than those in the Long Strait and Vilkitsky Strait.
In each model, the spatial distribution of multi-year mean sea ice concentration under the SSP5-8.5 scenario is generally consistent with that under the SSP2-4.5 scenario (Figure 2b). The maximum multi-year mean sea ice concentration is 70% for NorESM2-MM, while the minimum is 30.8% for CMCC-ESM2. The mean values for other models have a range from 49% to 60%. Note that the sea ice concentration spatial mean values for CESM2-WACCM, CMCC-ESM2, EC-Earth3-CC, and MPI-ESM1-2-HR have slightly increased compared to SSP2-4.5, with increases of 0.48%, 0.59%, 1.76%, and 0.21%, respectively. Overall, the two scenarios do not have significant impacts on the reduction in sea ice concentration.
Further calculations based on sea ice concentration reveal an overall decreasing trend in sea ice extent for all models under the SSP2-4.5 scenario from 2021 to 2050 (Figure 3a). Based on the mean sea ice extent predicted by each model for 30 years, CMCC-ESM2 has the smallest prediction result, with a mean sea ice extent of 4.15 × 10⁶ km2. On the other hand, NorESM2-MM has the largest predicted mean result of 9.06 × 10⁶ km2, while the predicted results of other models have a range from 6.8 × 10⁶ km2 to 7.7 × 10⁶ km2. In terms of the trend in reducing sea ice extent (Table 2), the other models vary from 0.51 × 10⁶ km2/10a to 0.77 × 10⁶ km2/10a, while MPI-ESM1-2-HR only has a decreasing trend in sea ice extent of 0.035 × 10⁶ km2/10a over 30 years, primarily due to an abnormal increase in sea ice extent between 2036 and 2040.
There are no significant differences in the declining trend and mean sea ice extent between the SSP5-8.5 and SSP2-4.5 scenarios for each model (Figure 3b). The two models with the minimum and maximum mean sea ice extent are still CMCC-ESM2 and NorESM2-MM, with mean values of 4.23 × 10⁶ km2 and 8.92 × 10⁶ km2, respectively. CESM2-WACCM is the only model that predicted a slight increasing trend during 2041–2050. Five models, including ACCESS-ESM1-5, CMCC-ESM2, EC-Earth3-CC, MIROC6, and NorESM2-MM, exhibited smaller decreasing trends under the SSP5-8.5 scenario compared with their performances under the SSP2-4.5 scenario (Table 2). Furthermore, UKESM1-0-LL is the only model that exhibited a decreasing trend exceeding 1 × 10⁶ km2/10a.
Regarding the linear trend in sea ice concentration for each model from 2021 to 2050 (Figure 4), the predicted sea ice concentration in all models displays a decreasing trend in most regions. The distribution characteristics of linear trends are similar under the two scenarios. Note that the decrease in sea ice concentration in the regions with relatively large sea ice concentration, such as the northern Canadian Arctic Archipelago and the north of Greenland, is smaller than that in the surrounding regions with lower sea ice concentration.
Under the SSP2-4.5 scenario, ACCESS-ESM1 in the Greenland Sea, CESM2-WACCM in the Labrador Sea, and MPI-ESM1-2-HR and UKESM1-0-LL in the Barents Sea region exhibit some increasing trends. However, under the SSP5-8.5 scenario, the distribution of the increasing trends decreases.

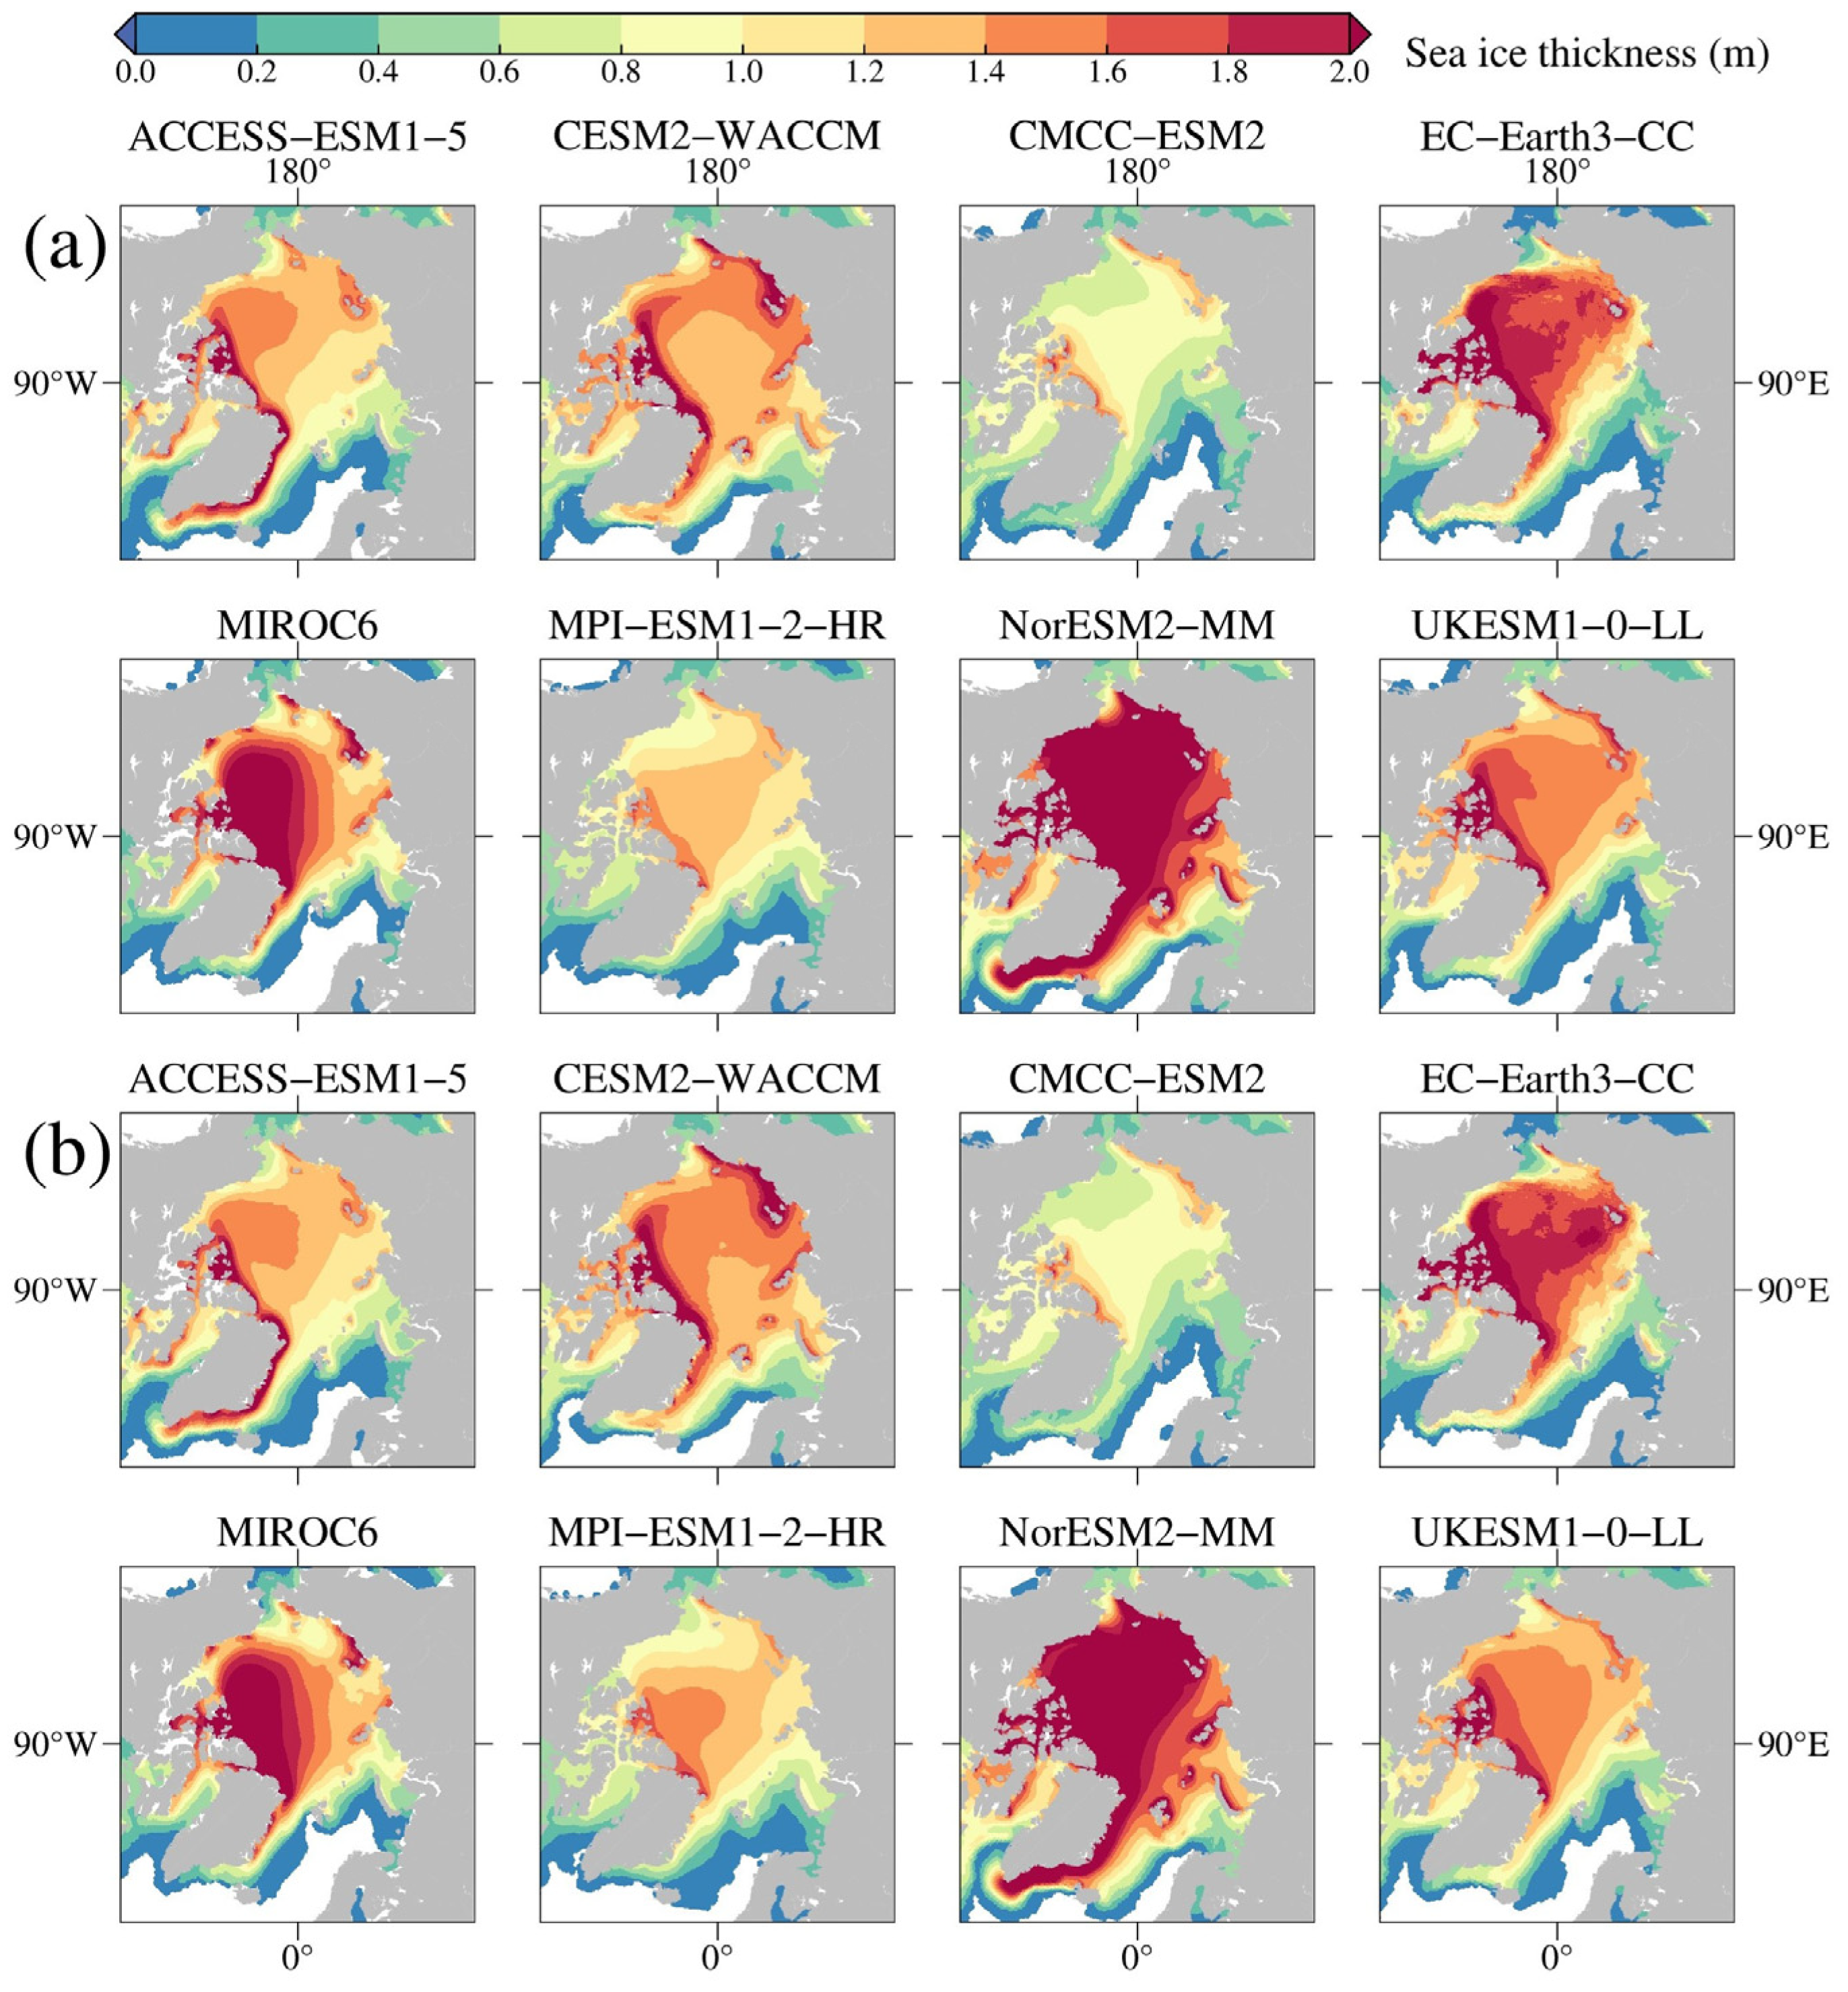
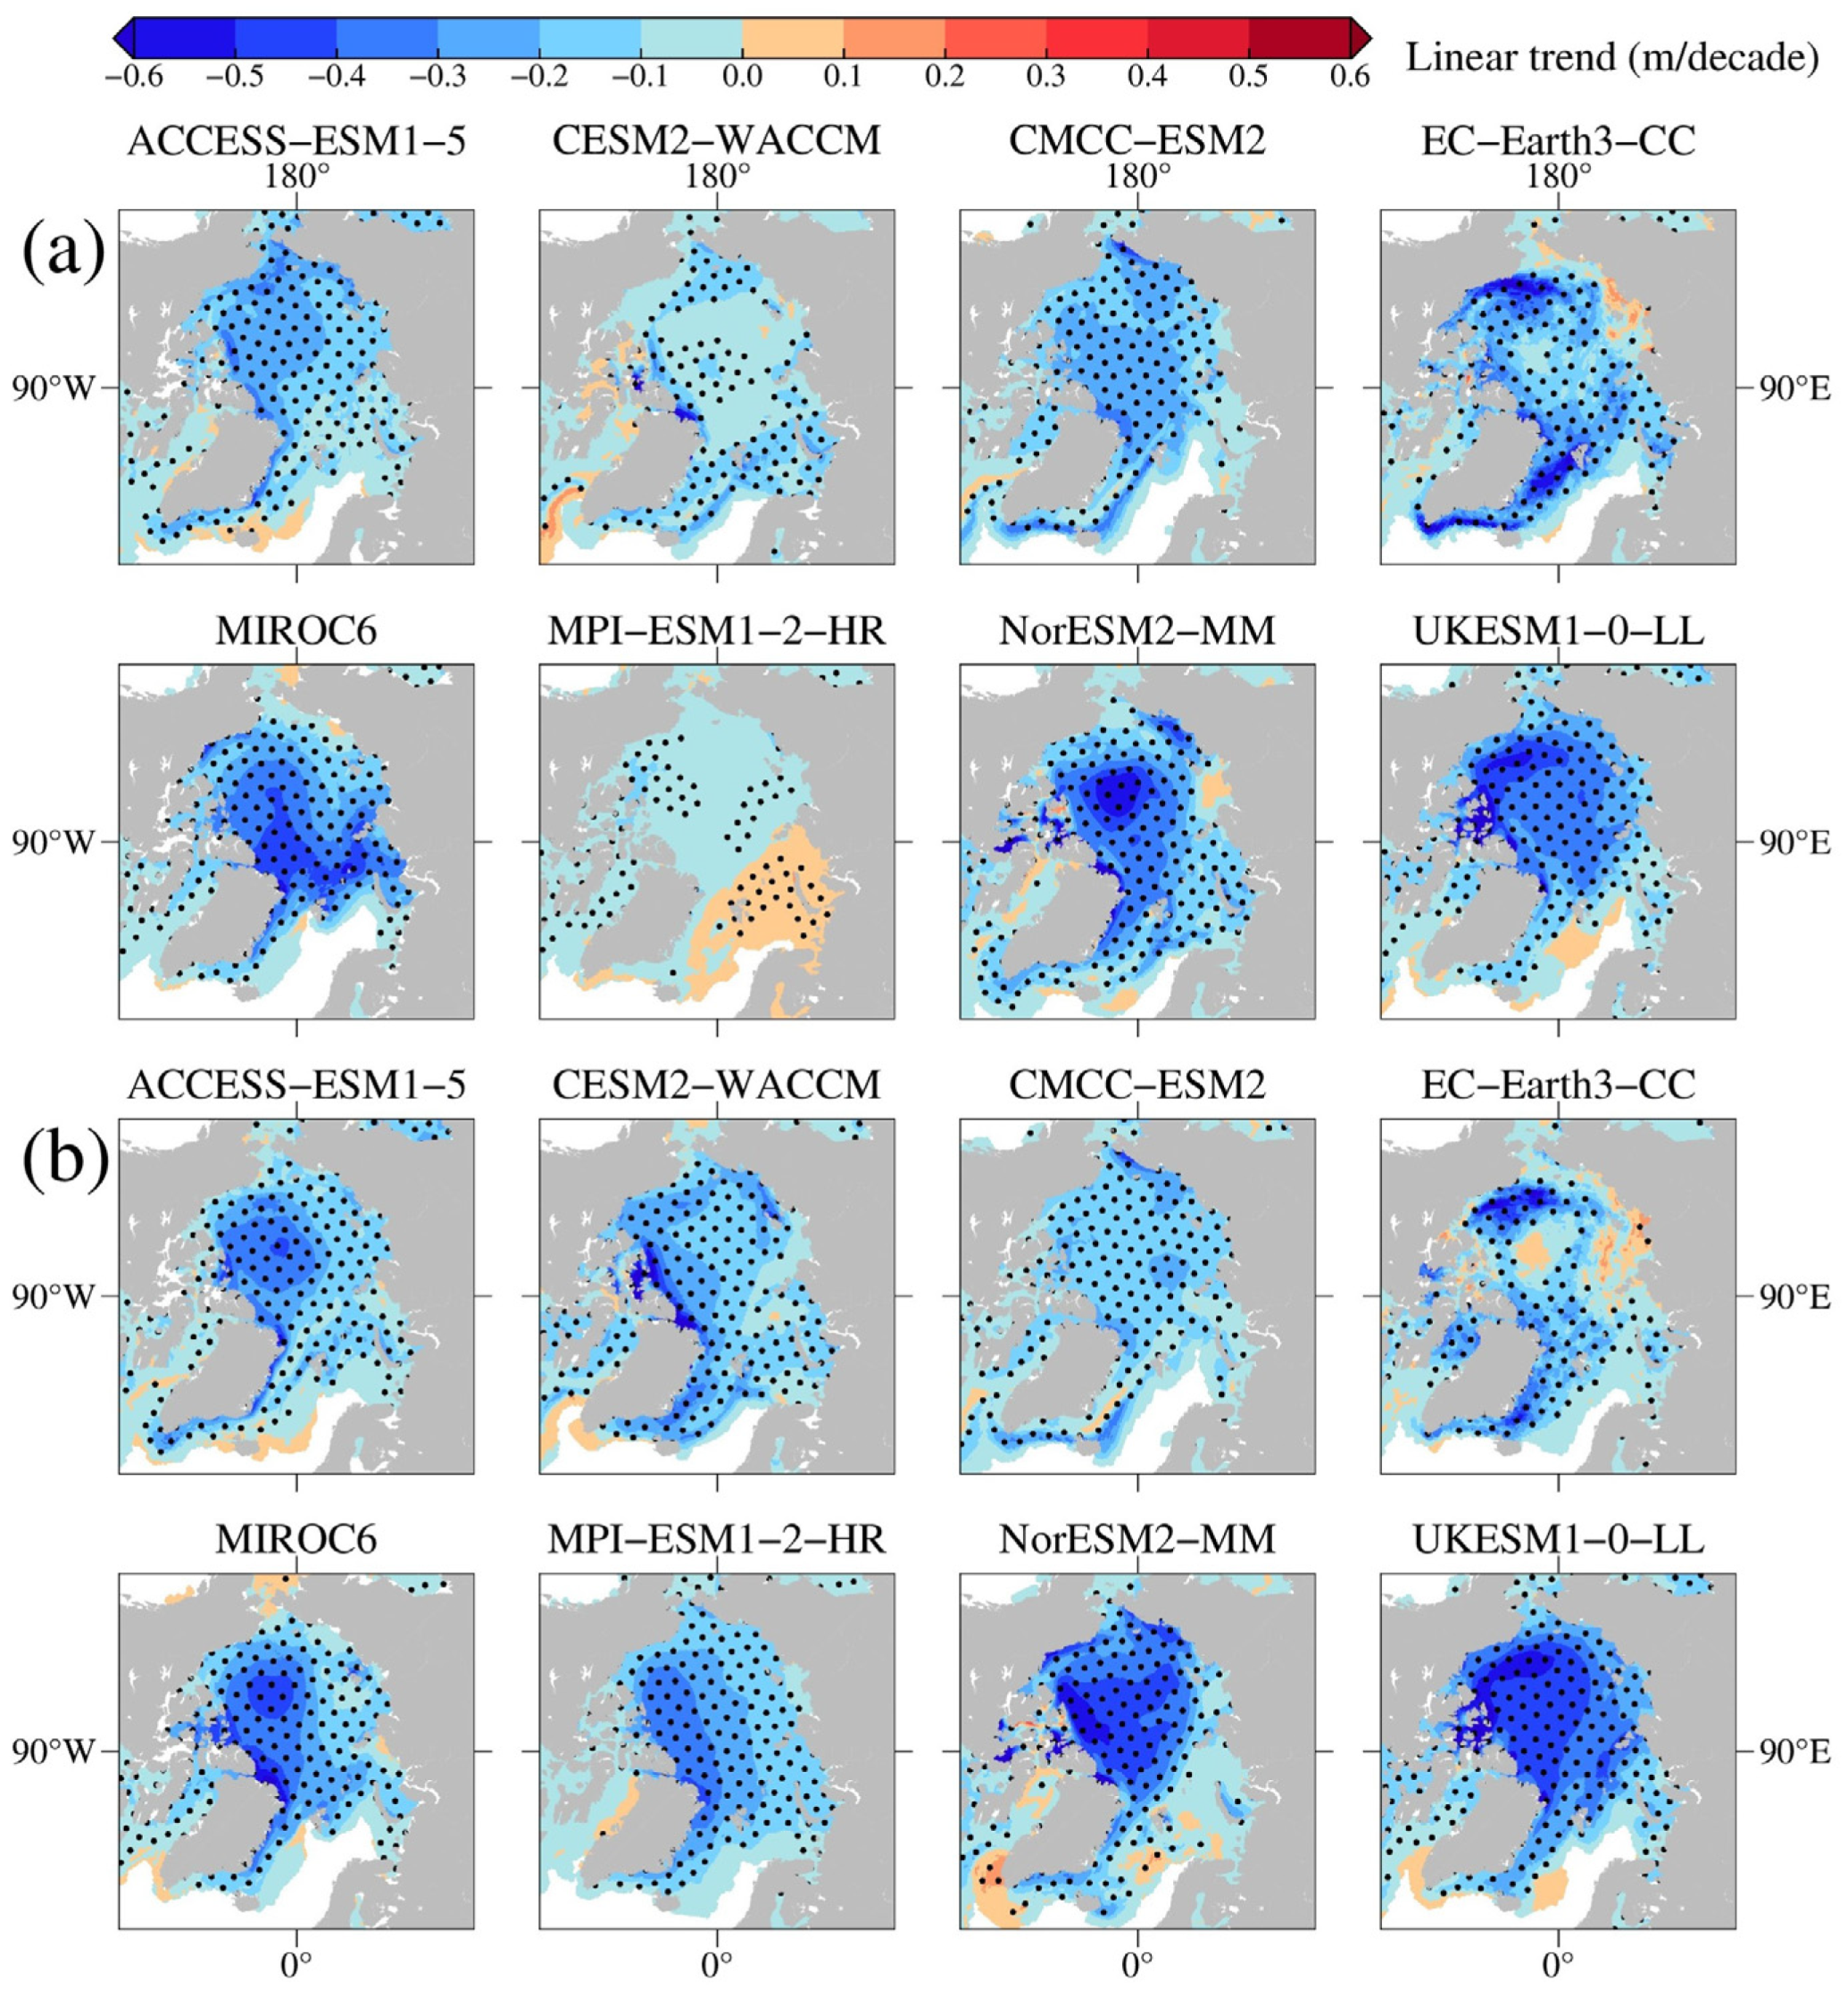
3.1.2. Sea Ice Thickness

There are similarities between the spatial distribution of multi-year mean sea ice thickness and the distribution characteristics of the multi-year mean sea ice concentration in each model for the period of 2021 to 2050 (Figure 5a). Specifically, under the SSP2-4.5 scenario, all models indicate that large values of sea ice thickness are concentrated in the northern Canadian Arctic Archipelago and the north of Greenland. In the eight models, the smallest mean sea ice thickness predicted by CMCC-ESM2 in the study area is only 0.63 m, while the largest mean value of 1.96 m is found in NorESM2-MM. CESM2-WACCM and MIROC6 suggest that sea ice thickness in the East Siberian Sea, the Long Strait, and the Sannikov Strait is similar to that found in the northern Canadian Arctic Archipelago and the north of Greenland, with thickness exceeding 1.8 m. Additionally, ACCESS-ESM1-5 shows a greater sea ice thickness in the Long Strait and the Sannikov Strait, with values exceeding 1.4 m. The spatial distribution characteristics of sea ice thickness under the SSP5-8.5 scenario are similar to those of SSP2-4.5 (Figure 5b), with NorESM2-MM exhibiting the largest mean sea ice thickness, decreasing by 0.15 m compared to its SSP2-4.5 scenario. The mean values of the other seven models do not change by more than ±0.05 m compared to their respective mean values under the SSP2-4.5 scenario.
In terms of the linear trend in sea ice thickness in each model from 2021 to 2050 (Figure 6), most regions exhibit a decreasing trend. Under the SSP2-4.5 scenario, the Greenland Sea in ACCESS-ESM1-5, the Labrador Sea in CESM2-WACCM, and the Barents Sea region in MPI-ESM1-2-HR show a slightly increasing trend, which is generally consistent with the regional distribution of the increasing trend in sea ice concentration. Under the SSP5-8.5 scenario, the five models display further decreasing trends of sea ice thickness compared to the SSP2-4.5 scenario, although the differences are not significant. Moreover, only the result of EC-Earth3-CC indicates that the sea ice thickness near the Sannikov Strait exhibits a slightly increasing trend under both scenarios.

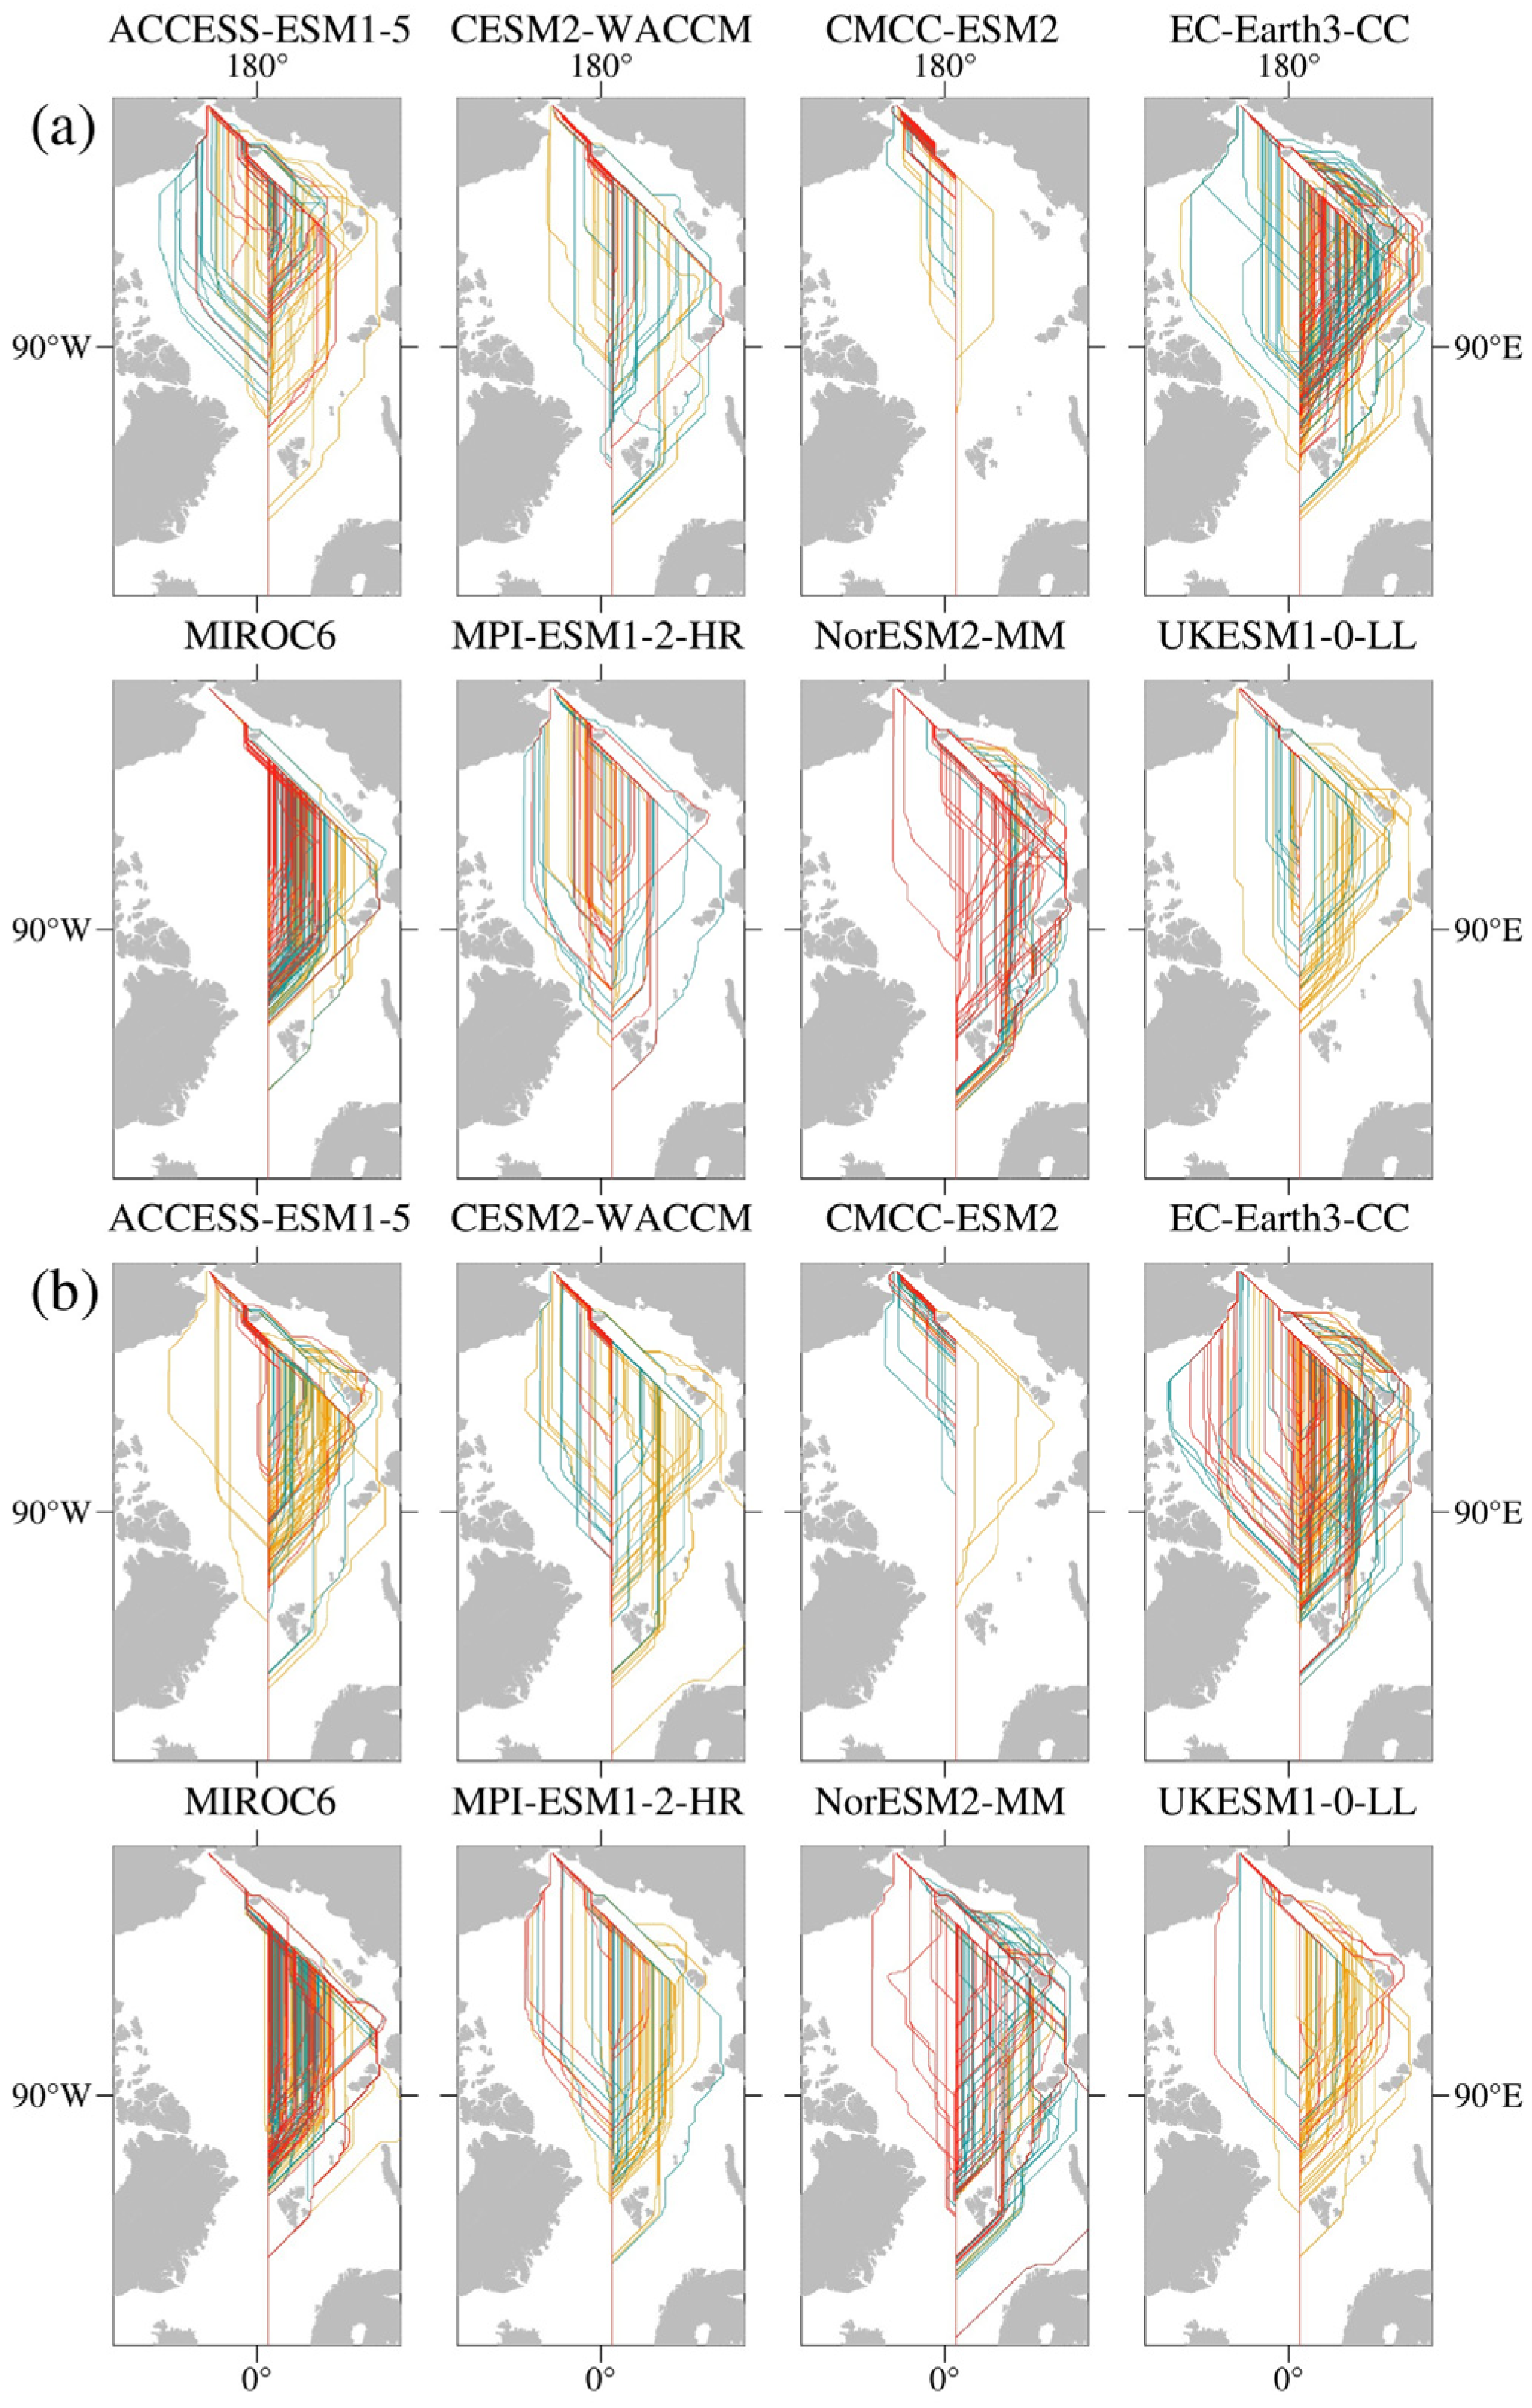
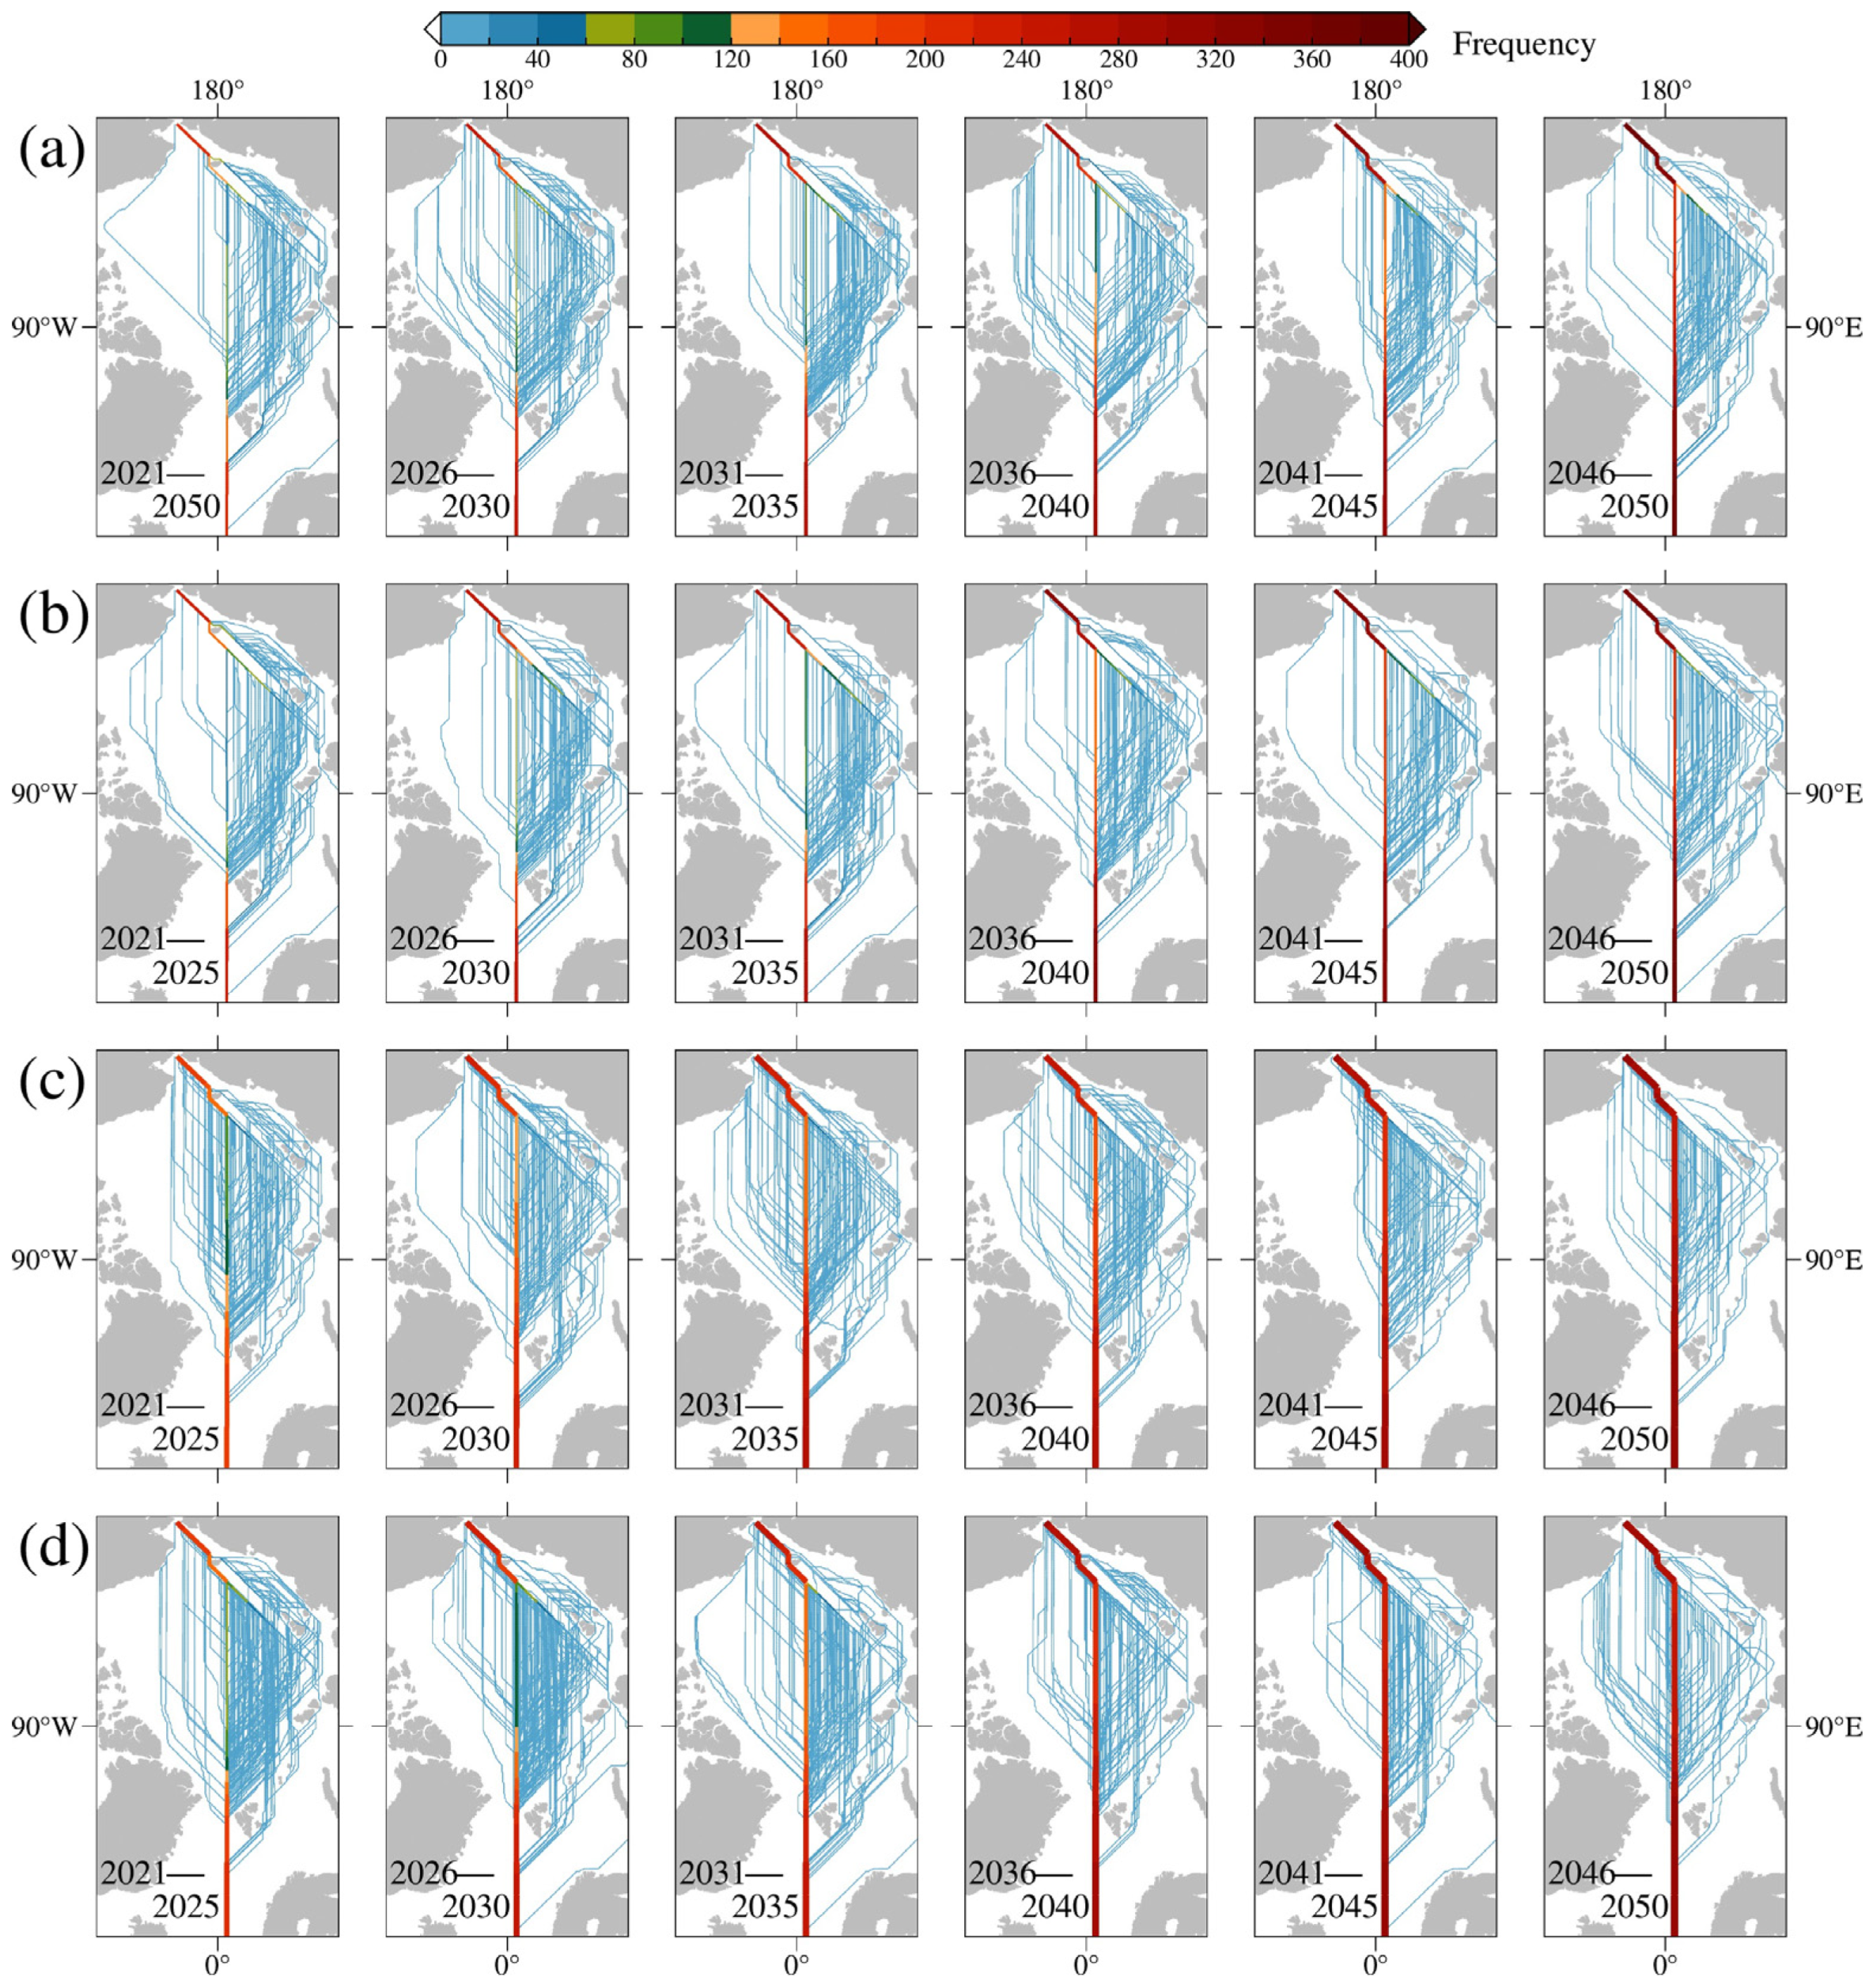
3.2. Prediction of Arctic Shipping Route Changes and Navigation Potential

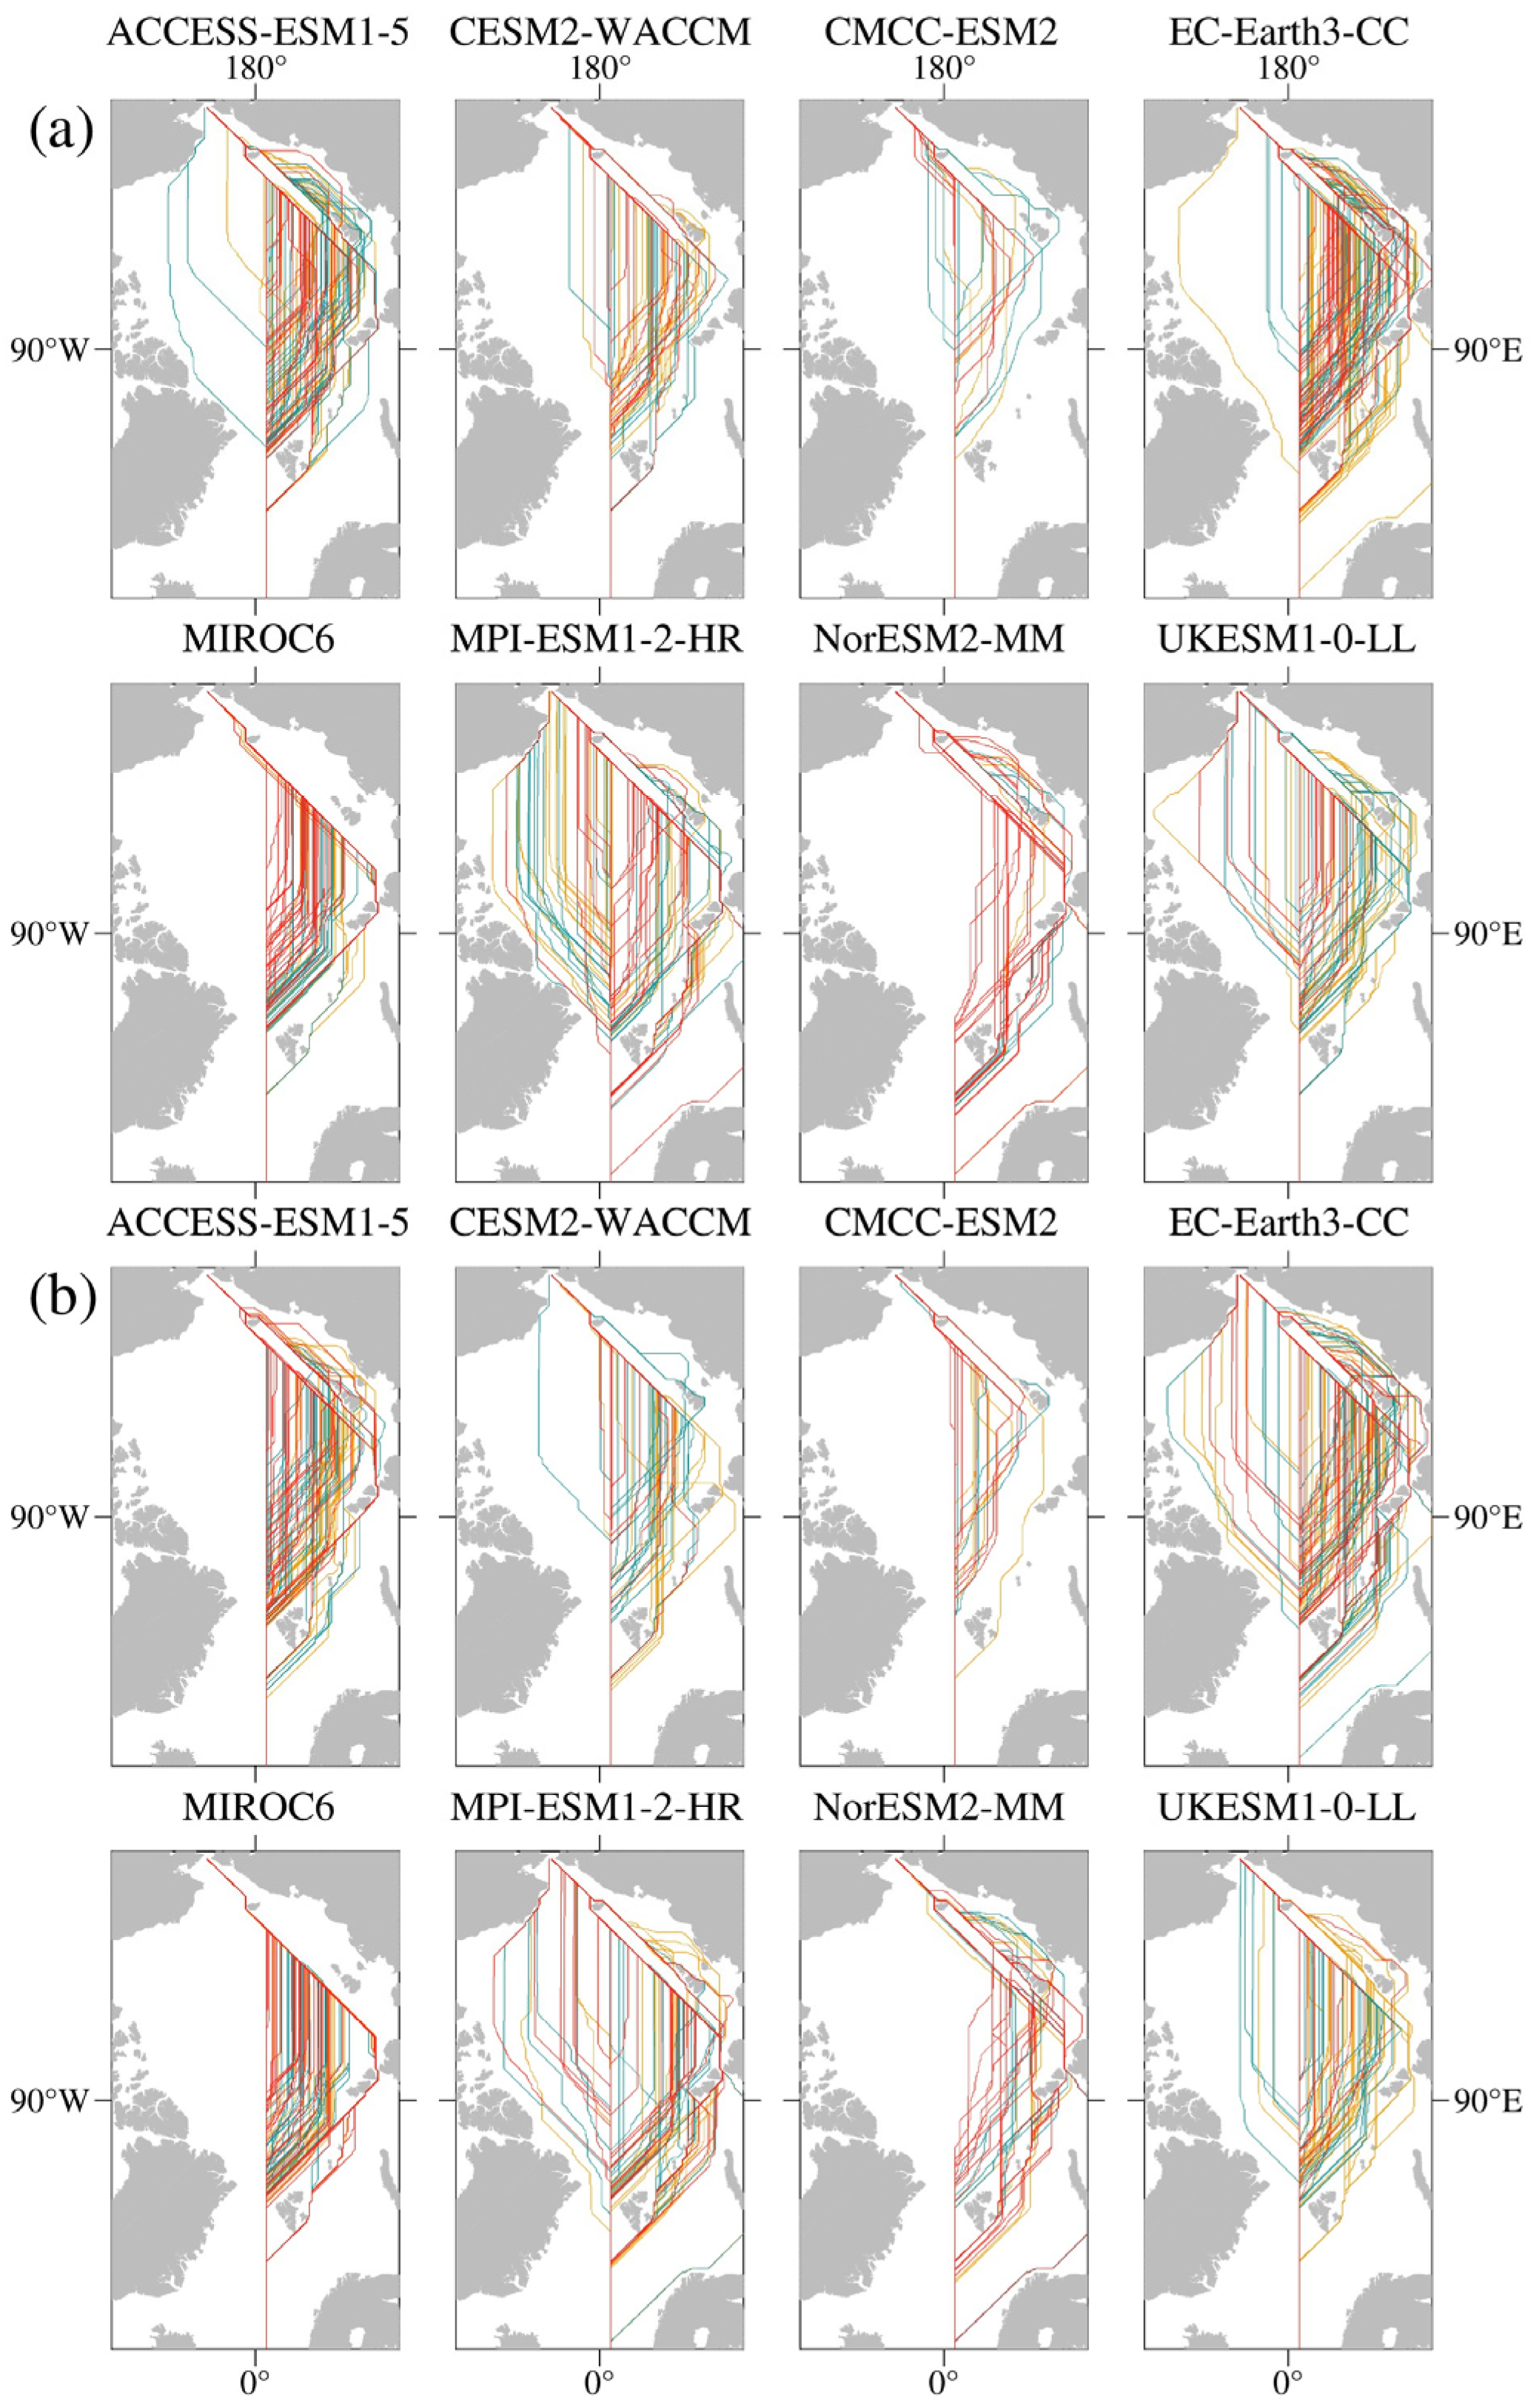
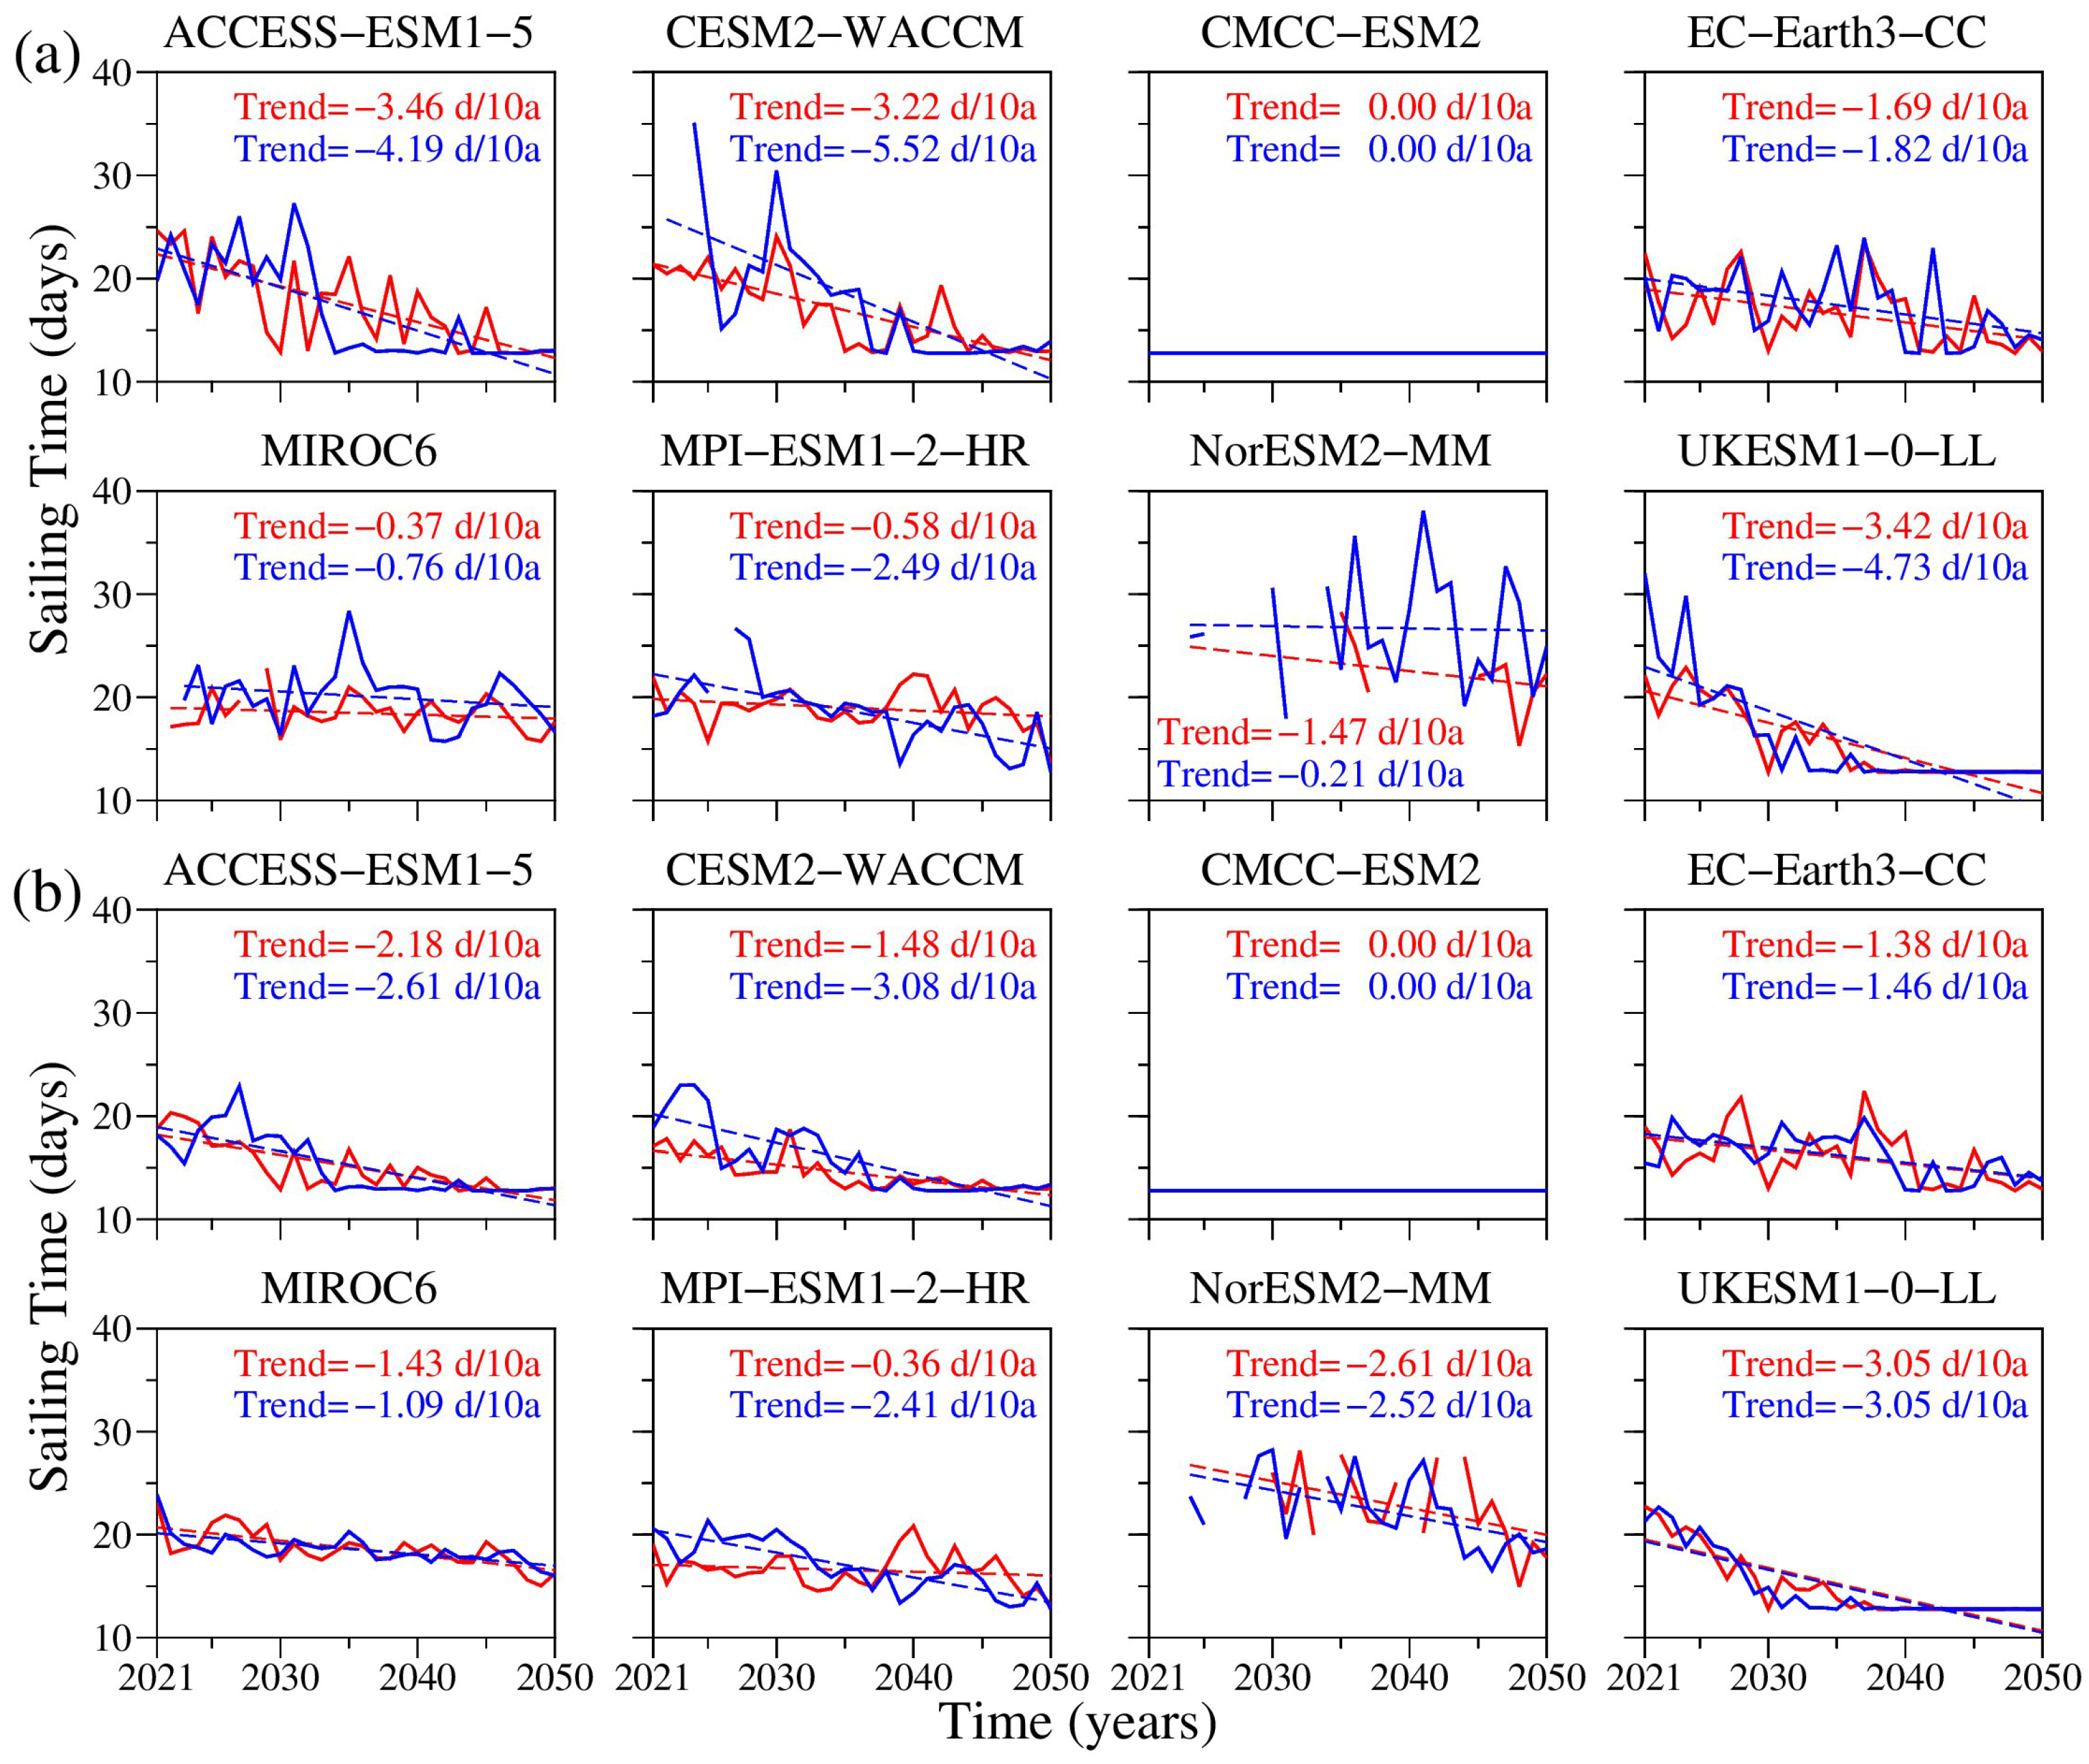
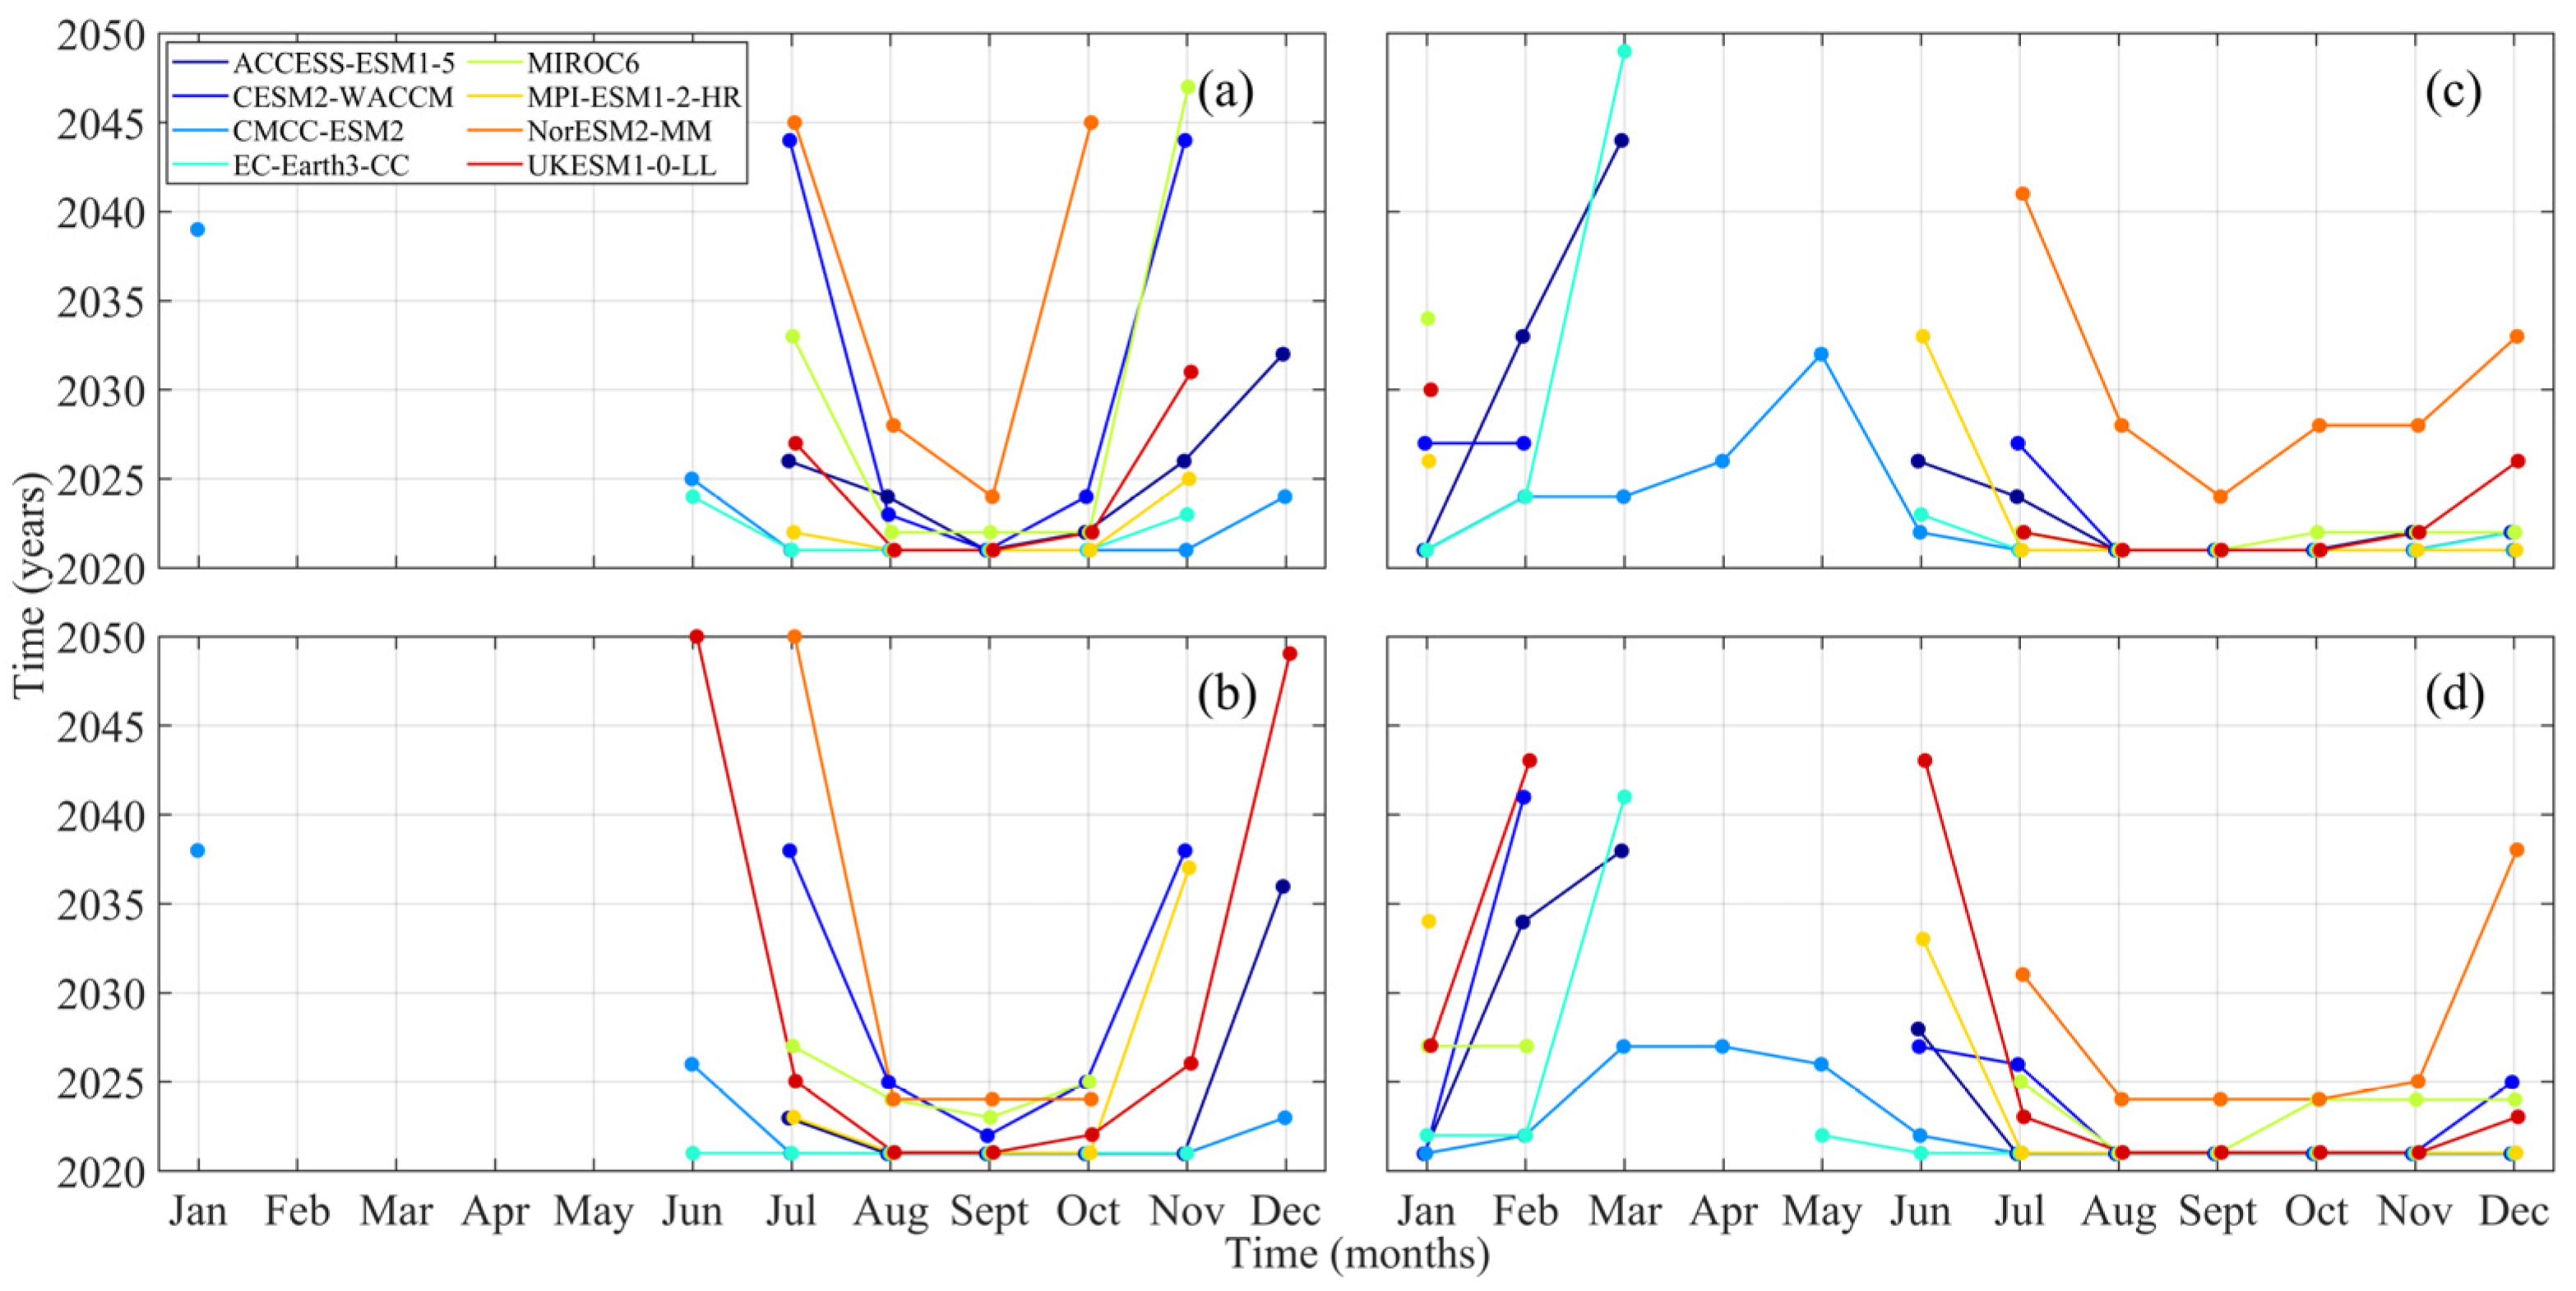
3.2.1. Analysis of Arctic Least-Cost Route and Sailing Time

The risk of navigation for Open Waters (OW) is relatively high. Figure 7 illustrates the distribution of least-cost routes planned by the RIO from 2021 to 2050. The earlier routes will be overlaid by later routes in the same region in order to indicate the trend of northward shift in the least-cost route every decade. The regional distribution and interdecadal changes of routes under the two scenarios (SSP2-4.5 and SSP5-8.5) show similarities, but significant disparities exist in the temporal and spatial distribution of routes among the models.
From a regional perspective, the utilization frequency of traditional low-latitude routes has decreased. Rather than passing through the Kara Strait after the Vilkitsky Strait, most routes opt to travel directly to northern Europe via the area north of Novaya Zemlya. Shorter mid-latitude or high-latitude routes will become the preferred choice for vessels in the next 30 years. Some models indicate that shipping routes in certain months tend to shift towards the coast of North America after passing through the Bering Strait, suggesting that during these months, sea ice conditions in the East Siberian Sea and adjacent Arctic Basin are not favorable for OW navigation.
The interdecadal changes in the distribution of least-cost routes suggest that, under two scenarios, the routes for most models will gradually shift towards higher latitudes over the next 30 years (Figure 8a). This trend indicates the potential for navigation through the Transpolar Sea Route, although the Northern Sea Route will remain the optimal choice for OW navigation over the next 30 years. The seven models, excluding NorESM2-MM, predict that the Northern Sea Route will be retained as the main shipping route for the next 30 years. However, for NorESM2-MM, it is projected that the route crossing the North Pole for OW navigation will not be feasible until 2050.
From the perspective of the shortest sailing time for each model, except for CMCC-ESM2 and NorESM2-MM, the sailing time for OW in other models under both scenarios exhibits a decreasing trend. This trend suggests that the navigation efficiency of the Arctic Passage is continually improving.
CMCC-ESM2 predicts the minimum sea ice concentration and thickness among the eight models, providing an opportunity for OW to achieve the shortest sailing time of 12.77 days every year. It indicates that the OW and PC6 in CMCC-ESM2 were able to navigate through the Transpolar Sea Route before 2021. UKESM1-0-LL predicts the shortest sailing time to be achieved before 2040, and ACCESS-ESM1-5 and CESM2-WACCM predict it to occur after 2045. The other four models cannot predict the shortest sailing time through the Transpolar Sea Route before 2050.
Similar to OW, there is no significant difference in the distribution of the least-cost routes for PC6 between the SSP2-4.5 and SSP5-8.5 scenarios (Figure 9), indicating that the scenario has no significant impact on the navigation route planning. From the perspective of route regional distribution, all models indicate the potential for navigation through the Transpolar Sea Route before 2050. The distribution of PC6 least-cost routes is significantly more concentrated towards the Transpolar Sea Route compared with OW, with the majority of routes located near the high-latitude routes of the Northern Sea Route and the Transpolar Sea Route. Note that CMCC-ESM2 will no longer navigate through the low-latitude routes.
Based on the interdecadal changes in the distribution of PC6’s least-cost routes (Figure 8b), it is obvious that the majority of models have shifted towards higher latitudes under both scenarios, more significantly than OW. Additionally, the sailing time for each year is generally shorter than that of OW, which leads to a smaller decreasing trend than that of OW. Although PC6 in all models does not achieve an earlier navigation date with the shortest sailing time compared to OW, under the SSP5-8.5 scenario, the mean sailing time over 30 years for most models has been reduced by more than 1.2 days. However, NorESM2-MM is still unable to ensure smooth navigation every year.
Using the distribution of the least-cost routes every five years (Figure 10), it is found that the Transpolar Sea Route is poised to become a significant option for Arctic navigation. The routes for the next 30 years are mainly distributed near the Transpolar Sea Route and the high-latitude routes of the Northern Sea Route. The frequency of using the low-latitude routes decreases gradually, while the frequency of using the Transpolar Sea Route gradually increases. The primary route is expected to gradually shift towards the Transpolar Sea Route for PC6. Under both scenarios, it is projected that the Transpolar Sea Route will be navigable for over six months per year from 2046 to 2050, which would significantly improve navigation efficiency along the Arctic shipping route. In addition, PC6 will be able to navigate through the Transpolar Sea Route before 2025.
For OW, the mid-latitude and high-latitude routes of the Northern Sea Route will be more suitable over the next 30 years. The navigational capacity under both scenarios is similar, with the mean frequency of using the Transpolar Sea Route increasing from 1 month per year during 2021–2025 to approximately 3 months in the last 5 years, which means a relatively low navigation probability.

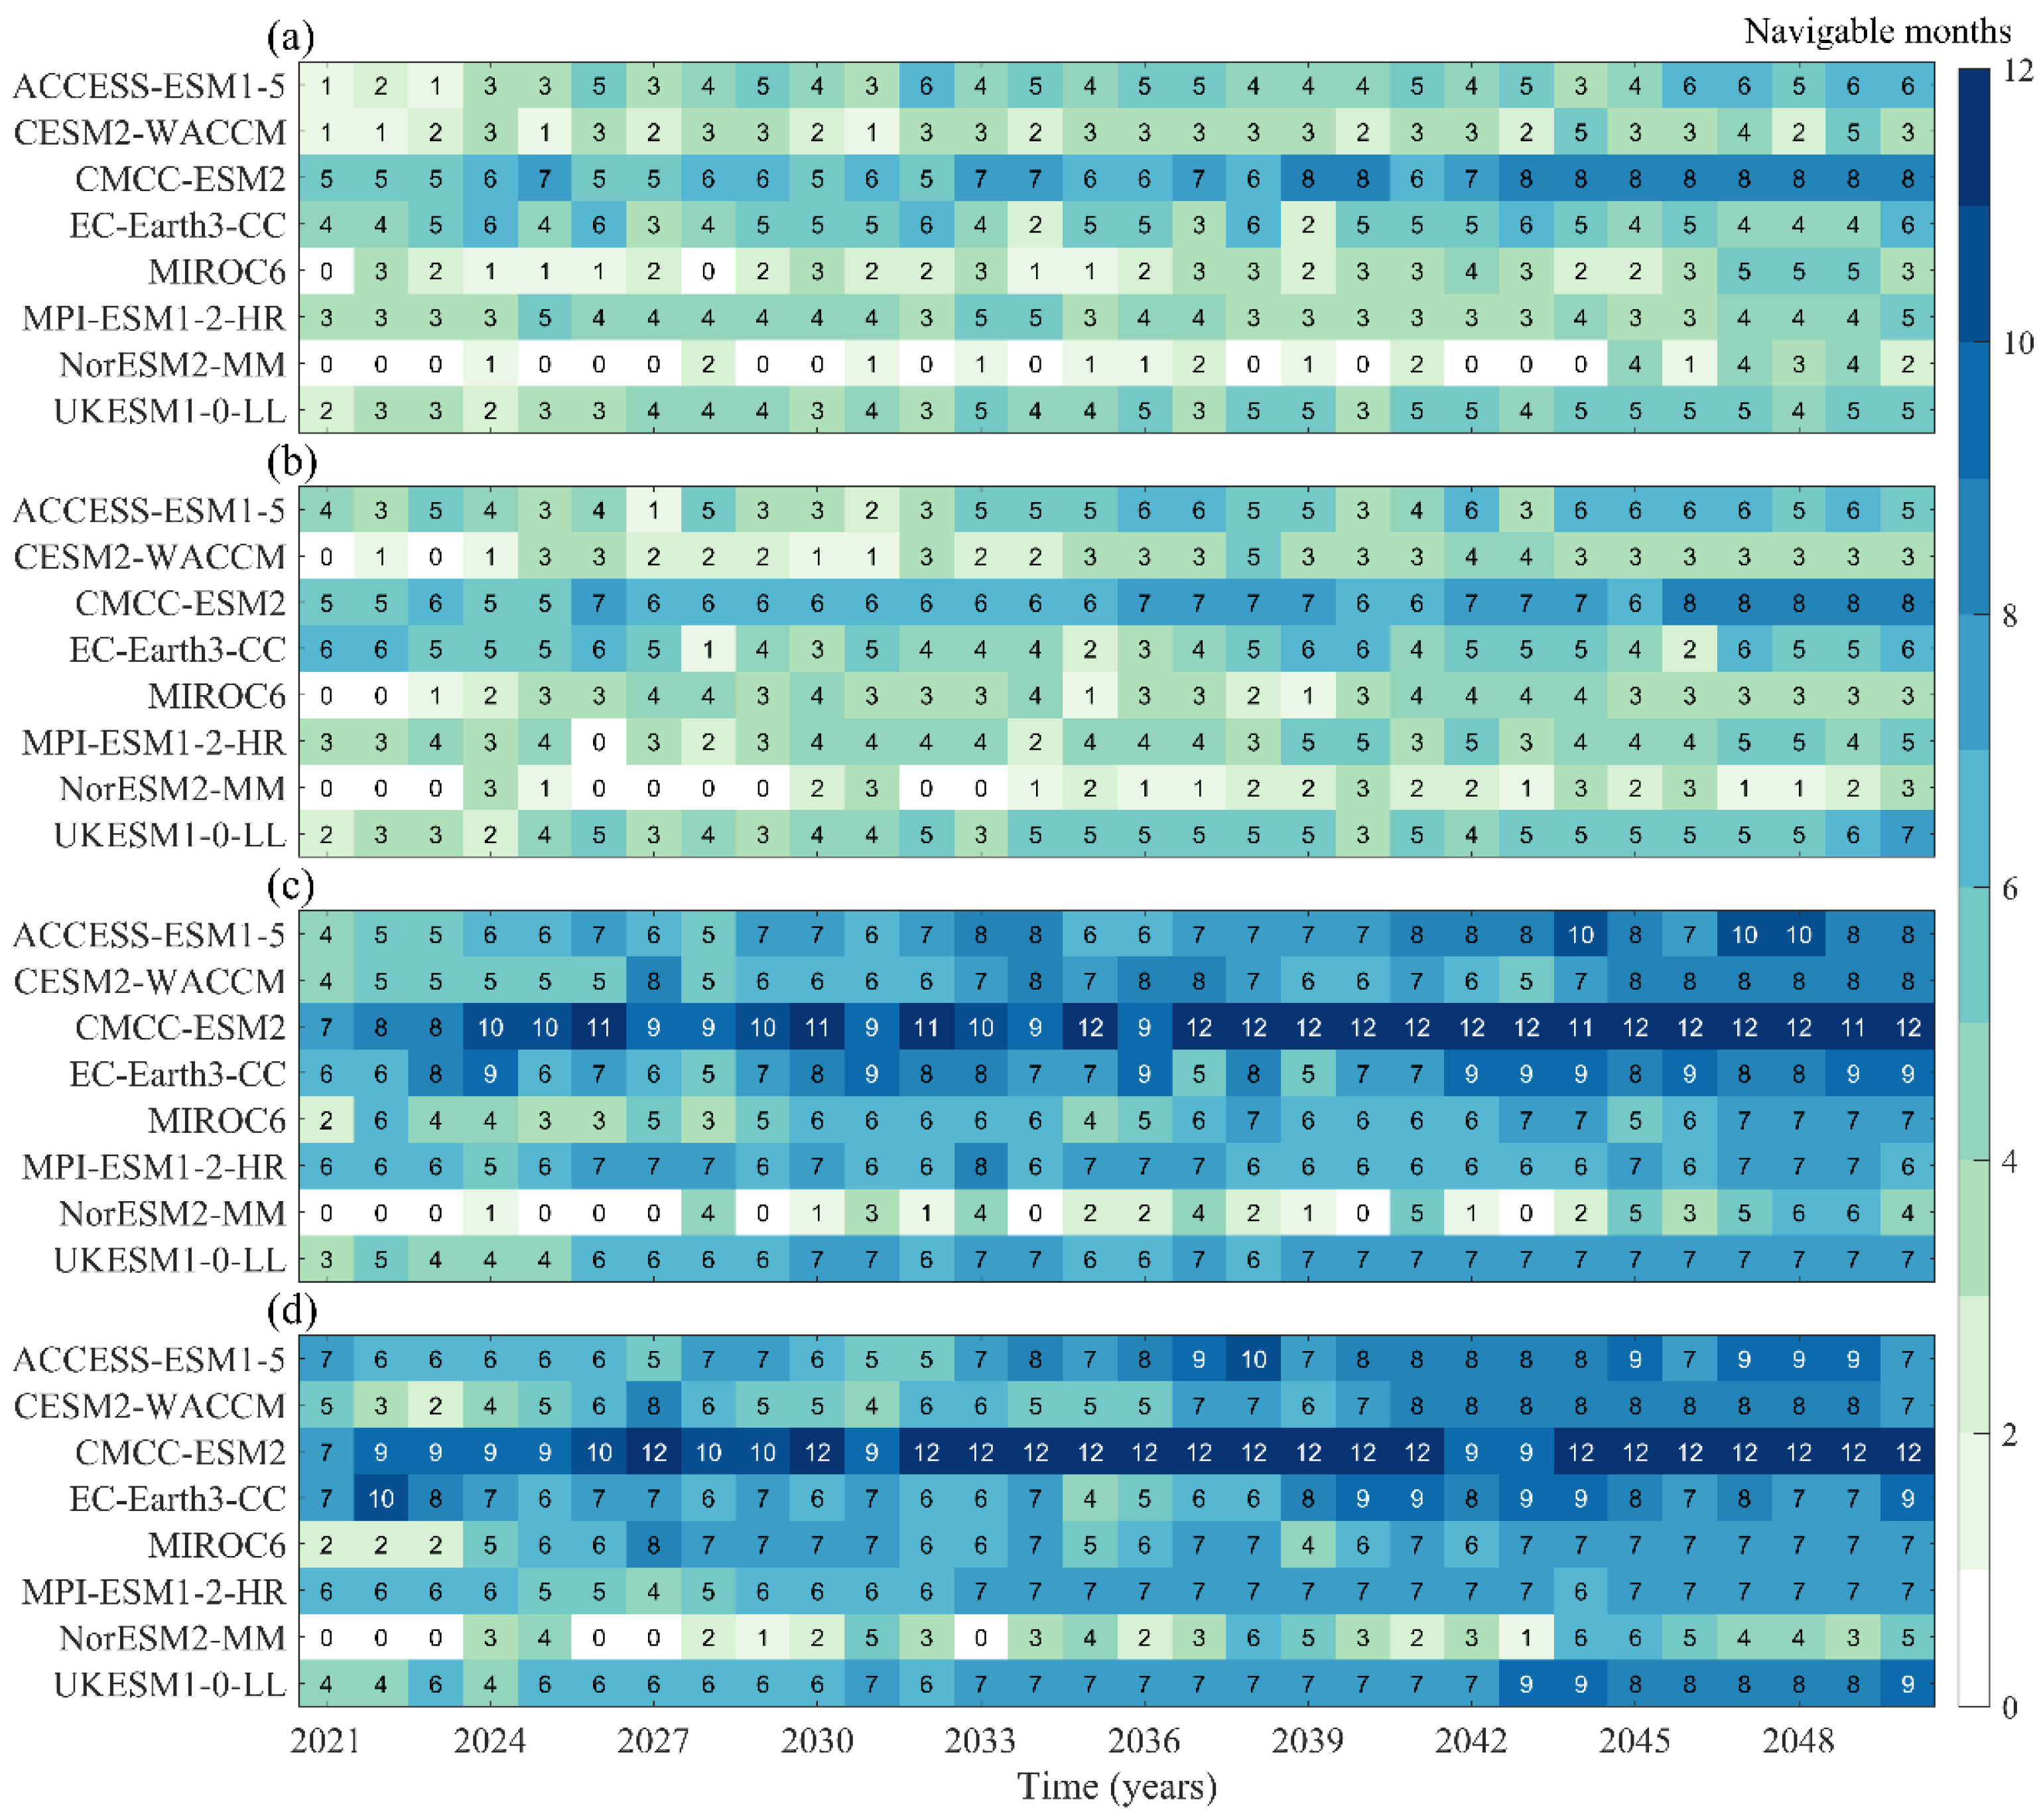
3.2.2. Analysis of Navigation Potential for Northern Sea Route and Transpolar Sea Route

Based on the results of the first navigable year for each month, under both scenarios, OW achieves navigation primarily between July and October, while it is not navigable from February to May (Figure 11a,b). Under the SSP2-4.5 scenario, all models indicate that the Arctic Passage will be navigable from July to October no later than 2045, with five models projecting an earlier navigable time of 2027. Furthermore, except for NorESM2-MM, the seven models predict navigability in November before 2047. There are differences under the SSP5-8.5 scenario. The earliest time for NorESM2-MM to be navigable in July is postponed to 2050, while the latest time for the other seven models to be navigable from July to October is 2038. Furthermore, the six models are expected to be navigable in November before 2038.
The duration of navigability for PC6 in the Arctic region is projected to be greater than that of OW before 2050 (Figure 11c,d). Additionally, the first year of navigability for PC6 is expected to occur earlier than previously estimated. The navigation months for PC6 under both scenarios are primarily from July to January of the following year. All the models under the SSP2-4.5 scenario show that the latest navigation time from July to October is four years earlier than OW. Furthermore, the seven models under the SSP5-8.5 scenario, except for NorESM2-MM, show that the latest navigation time from July to October is twelve years earlier than OW. In terms of navigability for each month, only CMCC-ESM2 has achieved year-round navigation. However, for most models, PC6 still cannot maintain stable navigation from March to May.
According to the statistics of the number of navigable months per year for OW and PC6 under the two scenarios, all models show an increasing trend. For OW, under the two scenarios, the navigable season will increase from 0–3 months before 2025 to 2–8 months per year in 2050, with a mean increase of 2.6 months for each model in 30 years (Figure 12a,b). Despite OW in NorESM2-MM being almost unnavigable in the first 25 years, it is still expected to be navigable during the summer months in the last 5 years. Under the SSP5-8.5 scenario, the navigation time in NorESM2-MM is advanced to 2034. For the other seven models, the time to achieve at least one month of navigation each year is projected to be 2029 under the SSP2-4.5 scenario and 2027 under the SSP5-8.5 scenario, respectively.
Under both scenarios, PC6 outperforms OW in terms of the number of navigation months (Figure 12c,d). Most models have achieved a navigable season of at least 6 months since 2040. Notably, the mean annual navigable season of CMCC-ESM2 reached 10.6 and 10.9 months, respectively. It can be inferred that, except for the spring season, this model will be fully navigable by PC6 in the Northern Sea Route or Transpolar Sea Route over the next 30 years. NorESM2-MM predicts that, under the two scenarios, PC6 will be navigable for a minimum of one month annually after 2044 and 2034, respectively. Nevertheless, the navigable season is anticipated to remain below six months by 2050. Conversely, the other six models suggest that the navigable season will increase from 2–6 months in 2021 to 6–9 months in 2050, with a mean increment of about 3.4 months per year.

4. Discussion

The results of this study show some differences compared with previous research (Table 3). Previous research based on MMM has shown that the Transpolar Sea Route will become navigable for OW and PC6 in mid-century (2036–2060) under both RCP4.5 and RCP8.5 [32,41]. However, in this study, the Transpolar Sea Route is navigable before 2025 under SSP2-4.5 and SSP5-8.5, which is indicated in six models, excluding MIROC6 and NorESM2-MM.
In addition, Wei et al. suggested that the navigational probability in the Transpolar Sea Route is less than 20% for both OW and PC6 under SSP2-4.5 and SSP5-8.5 in 2050 [36]. Melia et al. reported that the navigational probability is less than 20% under RCP4.5 and less than 30% under RCP8.5 for OW in the summer of 2050 [30]. In this study, the navigable season of the Transpolar Sea Route will approximate to more than 3 months for OW shown in the five models and 6 months for PC6 shown in the seven models in 2050, which means the navigational probability reaches 25% and 50%.
Moreover, Melia et al. indicated that the sailing time for Type-E to reach Europe from the Bering Strait is expected to decrease to approximately 20 days in 2050 under RCP4.5 and RCP8.5 [30]. Min et al. suggested the sailing time will decrease to approximately 19 days for OW and 16 days for PC6 in 2050 under SSP2-4.5 and SSP5-8.5 [31]. The sailing time in this study will decrease to approximately 16 days for OW and 13 days for PC6, excluding NorESM2-MM, which saves 3 days compared to the two previous studies under the two scenarios.
The previous studies mainly focused on the result of MMM, which cannot reveal specific differences among the models. Moreover, the planning of the least-cost route is particularly model-dependent, indicating that selecting different models will significantly influence the result of MMM, leading to varying results. In this study, we selected monthly sea ice concentration and thickness data from eight CMIP6 models during 2021–2050 based on existing data evaluation results. The results are supported to be more reasonable.
Note that there is limited work being performed to analyze and verify the accuracy of CMIP6 prediction data. Therefore, this study selects models based on previous evaluations of CMIP6 historical data. However, it should be emphasized that the evaluation results of historical data may not fully represent the accuracy of the prediction data. Assessing the accuracy of model prediction data and selecting models reasonably will be the key points of future research on the Arctic shipping routes based on model prediction results.
In addition, the POLARIS, as the latest navigation risk quantification system, has incorporated more vessel types and finer sea ice thickness level divisions. However, it does not take into account natural factors such as real-time ice conditions, weather, and sea conditions, as well as human factors such as the degree of coastal navigation infrastructure and local navigation policies. In addition, the POLARIS is designed for application within spatial scales corresponding to the size of the ship and temporal scales of minutes. In this study, the CMIP6 data exhibit relatively low resolutions with spatial scales exceeding 50 km and a temporal scale characterized by monthly means. Therefore, the RIO calculated solely based on data such as icebreaking capability, sea ice thickness, and concentration cannot accurately reflect the navigational conditions of the Arctic Passage. Further development of a quantification system for navigation risk in the Arctic that considers various natural factors such as sea ice conditions, ocean conditions, and weather is necessary. Providing prompt navigation safety services for vessels in the Arctic based on real-time data on sea ice, marine, and meteorology can be an important direction for development.

5. Conclusions

In this study, we selected monthly sea ice concentration and thickness data predicted from eight CMIP6 models under the two scenarios (SSP2-4.5 and SSP5-8.5) from 2021 to 2050 based on existing data evaluation results. We analyzed the distribution characteristics and linear trends of sea ice concentration and thickness, as well as the variations in sea ice extent in the Arctic for the next 30 years, and compared the similarities and differences among the models in detail. Subsequently, we introduced the POLARIS to derive a navigation risk index of RIO and route planning for two types of vessels (OW and PC6). We focused on the route changes and navigational potential in the next 30 years to conduct an assessment and analysis.
All models predict a similar spatial and temporal variability of sea ice concentration and thickness under both scenarios, with a decreasing trend of sea ice concentration and thickness in most Arctic regions in the future. However, there are differences among the models in simulating the spatial distribution and temporal variability of sea ice. Severe sea ice conditions are expected in the northern Canadian Arctic Archipelago and the north of Greenland. In the eight models, NorESM2-MM and CMCC-ESM2 have significant differences compared to the other six models. NorESM2-MM predicts more Arctic sea ice and still has larger sea ice concentration and thickness, as well as a smaller decreasing trend for the next 30 years. On the other hand, CMCC-ESM2 predicts less sea ice, with an extremely small sea ice concentration and thickness in all regions except the northern Canadian Arctic Archipelago and the north of Greenland, as well as the Russian coast region east of the Sanikov Strait.
The impact of the two scenarios on route changes and navigational potential is not significant. The models predict that Arctic sea ice will decrease over the next 30 years, resulting in a decrease in the frequency of using the low-latitude route of the Northern Sea Route. Individual models exhibit more details compared to the MMM in the previous studies. Different from the previous results, this study reveals that, within the next 30 years, the least-cost route is projected to migrate more rapidly from the low-latitude route to the high-latitude route under the two scenarios. Specifically, it is anticipated that the Transpolar Sea Route will become navigable for both OW and PC6 prior to 2025, which is nearly a decade earlier than previously suggested. Furthermore, by 2050, the sailing time is expected to decrease to 17 and 13 days for OW and PC6, respectively, which saves 3 days compared to previous studies. For OW, the Northern Sea Route will be retained as the main route in the next 30 years, while the route of PC6 will gradually migrate to the Transpolar Sea Route. The navigable season for both types of vessels in the Arctic Passage is expected to gradually increase. The navigable season for PC6 is much longer than that for OW. Specifically, by 2050, OW is expected to have a navigable season of 3–6 months per year, while PC6 is projected to have a navigable season of 6–9 months. The navigable season for OW is mainly concentrated from August to October, and PC6 extends from July to January of the following year. Considering both sailing distance and safety, the mid-latitude and high-latitude routes of the Northern Sea Route are better choices for OW in the next 30 years. The Transpolar Sea Route will become an important option for PC6.

Author Contributions

Conceptualization, Y.Z. (Yu Zhang) and C.C.; methodology, X.S. and K.W.; software, Y.Z. (Yufan Zha) and K.W.; validation, X.S. and Y.Z. (Yufan Zha); formal analysis, Y.Z. (Yu Zhang) and K.W.; resources, K.W.; data curation, X.S.; writing—original draft preparation, Y.Z. (Yu Zhang), Y.Z. (Yufan Zha), and K.W.; writing—review and editing, X.S. and C.C.; visualization, K.W.; supervision, Y.Z. (Yu Zhang). All authors have read and agreed to the published version of the manuscript.

Funding

This research was funded by the National Natural Science Foundation of China (No. 42130402 and No. 42376231), the National Key Research and Development Program of China (No. 2019YFA0607001), the Natural Science Foundation of Shanghai (No. 22ZR1427400), and the Innovation Group Project of Southern Marine Science and Engineering Guangdong Laboratory (Zhuhai) (No. 311022006).

Data Availability Statement

The sea ice concentration and thickness data are available from the CMIP6 homepage (https://esgf-node.llnl.gov/search/cmip6/), accessed on 25 September 2021.

Acknowledgments

We would like to thank the editors and the anonymous reviewers for their constructive comments and advice.

Conflicts of Interest

The authors declare no conflict of interest.

References

  1. Gulev, S.K.; Thorne, P.W.; Ahn, J.; Dentener, F.J.; Domingues, C.M.; Gerland, S.; Gong, D.; Kaufman, D.S.; Nnamchi, H.C.; Quaas, J.; et al. IPCC 2021: Summary for policymakers. In Climate Change 2021: The Physical Science Basis. Contribution of Working Group I to the Sixth Assessment Report of the Intergovernmental Panel on Climate Change; Cambridge University Press: Cambridge, UK, 2021. [Google Scholar] [CrossRef]
  2. Arora, P.; Arora, N.K. COP27: A summit of more misses than hits. Environ. Sustain. 2023, 6, 99–105. [Google Scholar] [CrossRef]
  3. Biskaborn, B.K.; Smith, S.L.; Noetzli, J.; Matthes, H.; Vieira, G.; Streletskiy, D.A.; Schoeneich, P.; Romanovsky, V.E.; Lewkowicz, A.G.; Abramov, A. Permafrost is warming at a global scale. Nat. Commun. 2019, 10, 264. [Google Scholar] [CrossRef] [PubMed]
  4. Box, J.E.; Colgan, W.T.; Christensen, T.R.; Schmidt, N.M.; Lund, M.; Parmentier, F.-J.W.; Brown, R.; Bhatt, U.S.; Euskirchen, E.S.; Romanovsky, V.E. Key indicators of Arctic climate change: 1971–2017. Environ. Res. Lett. 2019, 14, 045010. [Google Scholar] [CrossRef]
  5. Loomis, B.D.; Rachlin, K.E.; Luthcke, S.B. Improved Earth Oblateness Rate Reveals Increased Ice Sheet Losses and Mass-Driven Sea Level Rise. Geophys. Res. Lett. 2019, 46, 6910–6917. [Google Scholar] [CrossRef]
  6. Schuler, D.V.; Bulygina, O.; Derksen, C.; Luojus, K.; Mudryk, L.; Wang, L.; Yang, D. Arctic Terrestrial Snow Cover. Snow, Water, Ice and Permafrost in the Arctic (SWIPA) 2017; Arctic Monitoring and Assessment Programme: Tromsø, Norway, 2017; pp. 25–64. [Google Scholar]
  7. Cavalieri, D.J.; Parkinson, C.L. Arctic sea ice variability and trends, 1979–2010. Cryosphere 2012, 6, 881–889. [Google Scholar] [CrossRef]
  8. Stroeve, J.C.; Serreze, M.C.; Holland, M.M.; Kay, J.E.; Malanik, J.; Barrett, A.P. The Arctic’s rapidly shrinking sea ice cover: A research synthesis. Clim. Chang. 2011, 110, 1005–1027. [Google Scholar] [CrossRef]
  9. Qu, L.; Fu, D.; Liu, B.; Yu, G.; Liu, D. Spatio-temporal Variation of Arctic Sea lce Area Based on AMSR-2 Microwave Remote Sensing Data. J. Zhanjiang Ocean Univ. 2021, 41, 9. [Google Scholar] [CrossRef]
  10. Kwok, R. Arctic sea ice thickness, volume, and multiyear ice coverage: Losses and coupled variability (1958–2018). Environ. Res. Lett. 2018, 13, 105005. [Google Scholar] [CrossRef]
  11. Barnhart, K.R.; Miller, C.R.; Overeem, I.; Kay, J.E. Mapping the future expansion of Arctic open water. Nat. Clim. Chang. 2015, 6, 280–285. [Google Scholar] [CrossRef]
  12. Chen, S.; Cao, Y.; Hui, F.; Cheng, X. Observed spatial-temporal changes in the autumn navigability of the Arctic Northeast Route from 2010 to 2017. Chin. Sci. Bull. 2019, 64, 1515–1525. [Google Scholar] [CrossRef]
  13. Hák, T.; Janoušková, S.; Moldan, B. Sustainable Development Goals: A need for relevant indicators. Ecol. Indic. 2016, 60, 565–573. [Google Scholar] [CrossRef]
  14. Ji, Q.; Jiang, D.; Pang, X.; Zhu, Y.; Zhang, C.; Hu, X. Analysis of sea ice conditions and navigability of Arctic Northeast Passage in summer. J. Ship Mech. 2021, 25, 10. [Google Scholar] [CrossRef]
  15. Marchenko, N. Russian Arctic Seas: Navigational Conditions and Accidents; Springer Science & Business Media: Berlin/Heidelberg, Germany, 2012. [Google Scholar]
  16. Mulherin, N.D. The Northern Sea Route: Its Development and Evolving State of Operations in the 1990s; CRREL Research Report 96-3; US Army Corps of Engineers: Hanover, NH, USA, 1996. [Google Scholar]
  17. Wang, L.; Zhao, Y.; Liu, J.; Han, S. China’s First Trans-ARCTIC Voyage and Related Expectations. Polar Res. 2014, 2, 276–284. [Google Scholar] [CrossRef]
  18. Buixadé Farré, A.; Stephenson, S.R.; Chen, L.; Czub, M.; Dai, Y.; Demchev, D.; Efimov, Y.; Graczyk, P.; Grythe, H.; Keil, K. Commercial Arctic shipping through the Northeast Passage: Routes, resources, governance, technology, and infrastructure. Polar Geogr. 2014, 37, 298–324. [Google Scholar] [CrossRef]
  19. Cao, Y.; Yu, M.; Hui, F.; Zhang, J.; Cheng, X. Review of navigability changes in trans-Arctic routes. Chin. Sci. Bull. 2021, 66, 13. [Google Scholar] [CrossRef]
  20. Lasserre, F. Case studies of shipping along Arctic routes. Analysis and profitability perspectives for the container sector. Transp. Res. Part A Policy Pract. 2014, 66, 144–161. [Google Scholar] [CrossRef]
  21. Meng, S.; Li, M.; Tian, Z.; Zhang, L. Characteristics of the sea ice variation in the Arctic Northeast Passage. Mar. Forecast. 2013, 30, 8–13. [Google Scholar] [CrossRef]
  22. Schøyen, H.; Bråthen, S. The Northern Sea Route versus the Suez Canal: Cases from bulk shipping. J. Transp. Geogr. 2011, 19, 977–983. [Google Scholar] [CrossRef]
  23. Gunnarsson, B.; Moe, A. Ten years of international shipping on the Northern Sea Route: Trends and challenges. Arct. Rev. Law Politics 2021, 12, 4–30. [Google Scholar] [CrossRef]
  24. Min, C.; Yang, Q. Introduction to the Arctic Shipping Status Report of the Protection of the Arctic Marine Environment Working Group (PAME). Polar Res. 2020, 32, 279. [Google Scholar]
  25. Aksenov, Y.; Popova, E.E.; Yool, A.; Nurser, A.J.G.; Williams, T.D.; Bertino, L.; Bergh, J. On the future navigability of Arctic sea routes: High-resolution projections of the Arctic Ocean and sea ice. Mar. Policy 2017, 75, 300–317. [Google Scholar] [CrossRef]
  26. Cable, W.L.; Brigham, L.W.; Smith, L.C. Marine accessibility along Russia’s Northern Sea Route. Polar Geogr. 2013, 37, 111–133. [Google Scholar] [CrossRef]
  27. Chen, J.; Kang, S.; Du, W.; Guo, J.; Xu, M.; Zhang, Y.; Zhong, X.; Zhang, W.; Chen, J. Perspectives on future sea ice and navigability in the Arctic. Cryosphere 2021, 15, 5473–5482. [Google Scholar] [CrossRef]
  28. Gascard, J.C.; Riemann-Campe, K.; Gerdes, R.; Schyberg, H.; Randriamampianina, R.; Karcher, M.; Zhang, J.; Rafizadeh, M. Future sea ice conditions and weather forecasts in the Arctic: Implications for Arctic shipping. Ambio 2017, 46 (Suppl. S3), 355–367. [Google Scholar] [CrossRef] [PubMed]
  29. Li, X.; Stephenson, S.R.; Lynch, A.H.; Goldstein, M.A.; Bailey, D.A.; Veland, S. Arctic shipping guidance from the CMIP6 ensemble on operational and infrastructural timescales. Clim. Chang. 2021, 167, 23. [Google Scholar] [CrossRef]
  30. Melia, N.; Haines, K.; Hawkins, E. Sea ice decline and 21st century trans-Arctic shipping routes. Geophys. Res. Lett. 2016, 43, 9720–9728. [Google Scholar] [CrossRef]
  31. Min, C.; Yang, Q.; Chen, D.; Yang, Y.; Zhou, X.; Shu, Q.; Liu, J. The Emerging Arctic Shipping Corridors. Geophys. Res. Lett. 2022, 49, e2022GL099157. [Google Scholar] [CrossRef]
  32. Smith, L.C.; Stephenson, S.R. New Trans-Arctic shipping routes navigable by midcentury. Proc. Natl. Acad. Sci. USA 2013, 110, E1191–E1195. [Google Scholar] [CrossRef]
  33. Stephenson, S.R.; Smith, L.C.; Agnew, J.A. Divergent long-term trajectories of human access to the Arctic. Nat. Clim. Chang. 2011, 1, 156–160. [Google Scholar] [CrossRef]
  34. Stephenson, S.R.; Smith, L.C.; Brigham, L.W.; Agnew, J.A. Projected 21st-century changes to Arctic marine access. Clim. Chang. 2013, 118, 885–899. [Google Scholar] [CrossRef]
  35. Watts, M.; Maslowski, W.; Lee, Y.J.; Kinney, J.C.; Osinski, R. A spatial evaluation of Arctic sea ice and regional limitations in CMIP6 historical simulations. J. Clim. 2021, 34, 6399–6420. [Google Scholar] [CrossRef]
  36. Wei, T.; Yan, Q.; Qi, W.; Ding, M.; Wang, C. Projections of Arctic sea ice conditions and shipping routes in the twenty-first century using CMIP6 forcing scenarios. Environ. Res. Lett. 2020, 15, 104079. [Google Scholar] [CrossRef]
  37. O’Neill, B.C.; Tebaldi, C.; van Vuuren, D.P.; Eyring, V.; Friedlingstein, P.; Hurtt, G.; Knutti, R.; Kriegler, E.; Lamarque, J.-F.; Lowe, J.; et al. The scenario model intercomparison project (ScenarioMIP) for CMIP6. Geosci. Model Dev. 2016, 9, 3461–3482. [Google Scholar] [CrossRef]
  38. Shen, Z.; Duan, A.; Li, D.; Li, J. Assessment and ranking of climate models in Arctic Sea ice cover simulation: From CMIP5 to CMIP6. J. Clim. 2021, 34, 3609–3627. [Google Scholar] [CrossRef]
  39. Notz, D.; Community, S. Arctic Sea Ice in CMIP6. Geophys. Res. Lett. 2020, 47, e2019GL086749. [Google Scholar] [CrossRef]
  40. Dijkstra, E.W. A note on two problems in connexion with graphs. Numer. Math. 1959, 1, 269–271. [Google Scholar] [CrossRef]
  41. Stephenson, S.R.; Smith, L.C. Influence of climate model variability on projected Arctic shipping futures. Earth’s Future 2015, 3, 331–343. [Google Scholar] [CrossRef]
Figure 1. Schematic diagram of the Northern Sea Route and Transpolar Sea Route.
Jmse 11 02340 g001
Figure 2. Spatial distribution of multi-year mean sea ice concentration over 2021–2050 under the (a) SSP2-4.5 and (b) SSP5-8.5 scenarios.
Jmse 11 02340 g002
Figure 3. Variations in sea ice extent from 2021 to 2050 under the (a) SSP2-4.5 and (b) SSP5-8.5 scenarios.
Jmse 11 02340 g003
Figure 4. Spatial distribution of linear trend for sea ice concentration from 2021 to 2050 under the (a) SSP2-4.5 and (b) SSP5-8.5 scenarios. The black dots indicate statistical significance of the regression slopes at the 95% confidence level.
Jmse 11 02340 g004
Figure 5. Spatial distribution of multi-year mean sea ice thickness over 2021–2050 under the (a) SSP2-4.5 and (b) SSP5-8.5 scenarios.
Jmse 11 02340 g005
Figure 6. Spatial distribution of linear trend for sea ice thickness from 2021 to 2050 under the (a) SSP2-4.5 and (b) SSP5-8.5 scenarios. The black dots indicate statistical significance of the regression slopes at the 95% confidence level.
Jmse 11 02340 g006
Figure 7. Least-cost route of OW from 2021 to 2050 under the (a) SSP2-4.5 and (b) SSP5-8.5 scenarios. Orange, indigo, and red lines indicate the routes in 2020s, 2030s, and 2040s, respectively.
Jmse 11 02340 g007
Figure 8. Variation (solid line) and linear trend (dashed line) of sailing time for (a) OW and (b) PC6. Red line indicates the SSP2-4.5 scenario, and blue line indicates the SSP5-8.5 scenario.
Jmse 11 02340 g008
Figure 9. Least-cost route of PC6 from 2021 to 2050 under the (a) SSP2-4.5 and (b) SSP5-8.5 scenarios. Orange, indigo, and red lines indicate the routes in 2020s, 2030s, and 2040s, respectively.
Jmse 11 02340 g009
Figure 10. Spatial distribution of the least-cost route every 5 years for (a) OW under the SSP2-4.5 scenario, (b) OW under the SSP5-8.5 scenario, (c) PC6 under the SSP2-4.5 scenario, and (d) PC6 under the SSP5-8.5 scenario. The width and color of line indicate the number of navigations using the same route.
Jmse 11 02340 g010
Figure 11. The first navigable year of each month for (a) OW under the SSP2-4.5 scenario, (b) OW under the SSP5-8.5 scenario, (c) PC6 under the SSP2-4.5 scenario, and (d) PC6 under the SSP5-8.5 scenario.
Jmse 11 02340 g011
Figure 12. Number of navigable months in each year from 2021 to 2050 for (a) OW under the SSP2-4.5 scenario, (b) OW under the SSP5-8.5 scenario, (c) PC6 under the SSP2-4.5 scenario, and (d) PC6 under the SSP5-8.5 scenario.
Jmse 11 02340 g012
Table 1. Basic information about the CMIP6 models used in this study.
Model NameLabelInstitution
(Country or Organization)
Resolution
(Longitude × Latitude)
ACCESS Earth Systems ModelACCESS-ESM1-5CSIRO (AUS)250 km (360 × 300)
CESM2-Whole Atmosphere Community Climate ModelCESM2-WACCMNCAR (USA)100 km (320 × 384)
CMCC Earth System Model 2CMCC-ESM2CMCC (ITA)100 km (360 × 291)
European Community Earth-System ModelEC-Earth3-CCEC-Earth-Consortium (EU)100 km (362 × 292)
Model for Interdisciplinary Research on Climate 6MIROC6MIROC (JPN)100 km (360 × 256)
Max Planck Institute ESM higher-resolution versionMPI-ESM1-2-HRDKRZ (GER)50 km (802 × 404)
Norwegian Earth System Model version 2NorESM2-MMNCC (NOR)100 km (360 × 384)
United Kingdom ESM version 1UKESM1-0-LLMOHC (GBR)100 km (360 × 330)
Table 2. The declining trend of sea ice extent under SSP2-4.5 and SSP5-8.5 scenarios.
Declining Trend
(×106 km2/10a)
Declining Trend
(×106 km2/10a)
SSP2-4.5SSP5-8.5SSP2-4.5SSP5-8.5
ACCESS-ESM1-50.6150.608MIROC60.5160.338
CESM2-WACCM0.5460.683MPI-ESM1-2-HR0.0350.770
CMCC-ESM20.7730.634NorESM2-MM0.3510.210
EC-Earth3-CC0.5200.378UKESM1-0-LL0.7611.034
Table 3. Comparisons of analysis results between the previous studies and this study.
ContentPrevious ResultsResults in This Study
Start time when the Transpolar Sea Route is navigable for OW and PC62036 [32,41]Before 2025 for OW and PC6
Navigational probability in the Transpolar Sea Route in 2050Less than 20% for both OW and PC6 [36]
Less than 20% under RCP4.5 and less than 30% under RCP8.5 for Type-E in summer [30]
More than 25% for OW and 50% for PC6
Sailing time in the Transpolar Sea Route in 205020 days for Type-E [30]
19 days for OW and 16 days for PC6 [31]
17 days for OW and 13 days for PC6
Disclaimer/Publisher’s Note: The statements, opinions and data contained in all publications are solely those of the individual author(s) and contributor(s) and not of MDPI and/or the editor(s). MDPI and/or the editor(s) disclaim responsibility for any injury to people or property resulting from any ideas, methods, instructions or products referred to in the content.

