Article

Integrating Software FMEA and STPA to Develop a Bayesian Network-Based Software Risk Model for Autonomous Ships

1
Navigation College, Dalian Maritime University, Dalian 116026, China
2
Dalian Key Laboratory of Safety & Security Technology for Autonomous Shipping, Dalian 116026, China
3
Department of Marine Technology, Norwegian University of Science and Technology, 7034 Trondheim, Norway
*
Authors to whom correspondence should be addressed.
J. Mar. Sci. Eng. 2024, 12(1), 4; https://doi.org/10.3390/jmse12010004
Submission received: 12 November 2023 / Revised: 12 December 2023 / Accepted: 16 December 2023 / Published: 19 December 2023
(This article belongs to the Special Issue Safety and Efficiency of Maritime Transportation and Ship Operations)

Abstract

:
The autonomous shipping industry is increasingly focusing on enhancing the safety and reliability of software-based systems. Conducting a risk assessment is a requirement for demonstrating the safety equivalence of autonomous ships based on such systems to conventional vessels. Traditional risk assessment models, however, primarily focus on hardware failures, often overlooking potential software-related failures and functional inadequacies. This study proposes a framework integrating Software Failure Mode and Effects Analysis (FMEA), System–Theoretic Process Analysis (STPA), and Bayesian Network (BN) for risk identification of autonomous ship software systems. The results of a case study reveal that the framework sufficiently addresses the multifaceted nature of risks related to software in autonomous ships. Based on the findings of this study, we suggest the need for standardization of software architecture development in the autonomous ship industry and highlight the necessity for an enhanced understanding of AI-specific risks and the development of tailored risk assessment methodologies.

1. Introduction

Autonomous ships, outfitted with cutting-edge software and automation technologies, are currently undergoing sea trials and operational testing. In 2022, Yara Birkland, the first fully autonomous electric container ship, embarked on a two-year trial aimed at certification. Initially, the vessel operated semi-autonomously with a full crew, but plans are in place for complete autonomy in navigation and loading/unloading by the trial’s end [1]. The Norwegian University of Science and Technology (NTNU) has successfully conducted operational trials for the second-generation autonomous monohull ferry, milliAmpere 2. This ferry is equipped with a range of sensors, including rangefinders, cameras, laser vision, and radar, providing the autonomous control system and the Shore Control Centre (SCC) with comprehensive navigational and environmental data. The ferry operates fully autonomously, with an option for the SCC to intervene if necessary. In China, the 117 m electric container ship Zhi Fei showcased autonomous and remote-control navigation, traveling between two ports in Shandong province [2]. Meanwhile, in 2023, Samsung Heavy Industries demonstrated the prowess of its Samsung Autonomous Ship (SAS) navigation system during a 1500 km sea trial from Geoje to Jeju Island and Kaohsiung Port in Taiwan. Subsequently, Korealine LNG, fitted with AI-powered Integrated Condition Diagnosis Solution (HiCBM) and Integrated Safety Control Solution (HiCAMS), was delivered to and received approval for autonomous sailing from Panama [3].
In general, the emergence of autonomous ships signifies a substantial advancement within the maritime sector. Compared with conventional ships, autonomous ships are generally anticipated to have lower emissions, reduced operational costs, and enhanced safety [4,5]. However, it is imperative to acknowledge that the critical technologies underpinning these autonomous systems are still in the process of maturation, and safety and security challenges remain [6]. Therefore, risk assessment is essential for demonstrating the safety equivalence of autonomous ships to conventional vessels [7,8,9,10,11,12].
Several studies have discussed and proposed methods applicable for the risk assessment for autonomous ships, given their complex nature. Wróbel et al. [13,14] were one of the pioneers in applying System–Theoretic Process Analysis (STPA) to assess the safety of remotely controlled merchant ships and fully autonomous merchant ships. Valdez Banda et al. [15] proposed a hazard analysis and management process based on STPA and applied the method to two autonomous vessel concepts for urban transport in Finland. Johansen et al. [16] developed an online risk model based on the Bayesian Belief Network (BBN) that was derived from STPA. The model was integrated with an electronic navigation chart module to obtain accurate environmental information. Basnet et al. [17] proposed a risk analysis method that combines STPA, Bayesian network (BN), and Noisy-OR gates, as well as a Parent Divorcing technique for remote pilotage operations. Carreras Guzman et al. [18] compared the new extensions of System–Theoretic Process Analysis (STPA-Extension) and Uncontrolled Flow of Information and Energy (UFoI-E) methods and developed a tailored combination of both methods to carry out risk analysis for autonomous ships. Zhang et al. [19] utilized the Hybrid Causal Logic (HCL) method on a remote-controlled ship based on both operational data from traditional ships and autonomous ship experiments. Tusher et al. [20] proposed a framework for assessing cybersecurity risks in an anonymous shipping environment. They employed the Bayesian Best–Worst Method (BWM) to collect and analyse expert survey data, ranking them based on the perceived vulnerability to network threats for different types of devices and systems. Zhang and Zhang [21] proposed a quantitative assessment method based on the Entropy-TOPSIS-Coupling coordination model to analyse the risks of autonomous ship navigation from the perspective of human–ship–environment–management.
In general, it is acknowledged that the traditional risk assessment models/methods centred around hardware failures are not suitable for autonomous ships that are characterized by complex interactions among systems. The aforementioned studies have attempted to solve the associated challenges; however, little attention has been paid to integrating software-related failures and functional inadequacies into the risk assessment process [22,23,24,25]. Thieme et al. [24] suggested that risk models for autonomous ships should focus more on assessing the control and software systems of the ship, and system–theoretic methods such as STPA and Functional Resonance Analysis Method (FRAM) could be more applicable compared to traditional methods. Thieme et al. [26] further proposed a framework to analyse functional software failures, their propagation, and their integration into traditional risk analysis methods. The method has been demonstrated in an Autonomous Remotely Operated Vehicle (AROV) and has the potential to be applied to autonomous ships. Nevertheless, elucidating the causes of failure and how different modules interact and communicate with each other is a task awaiting further study. Chang et al. [27] used Failure Mode and Effects Analysis (FMEA) in conjunction with an Evidential Reasoning and Rule-based Bayesian Network to quantify the risk level of autonomous ships in general. The focus of risk sources is mainly on human error, ships and objects, physical environment, communication failures, cyberattacks, and equipment failures, and software is not sufficiently considered within that framework. Yang and Utne [28] examined various existing risk analysis methods, namely, Preliminary Hazard Analysis, STPA, and Hazard and Operability Study (HAZOP), to understand how they contribute to meeting standards for online risk modelling of autonomous maritime systems. It was concluded that the STPA is a good foundation for developing online risk models that handle interactions between systems and software failures, although its demonstration was limited to Autonomous Underwater Vehicles (AUVs).
The issue of potential accidents arising from software functional failures has attracted considerable attention within the autonomous shipping industry. Multiple classification societies have responded by raising verification and validation requirements for ensuring the quality and reliability of software-based systems in autonomous ships [7,8,9]. The integration of intricate software systems and AI technology into these vessels introduces a host of new vulnerabilities and potential risks, which could have severe consequences [9]. Experience from other industries that have adopted AI-based autonomous systems prior to the shipping sector underscores the inherent risks associated with software faults. A database tracking AI-related accidents reports more than 1000 incidents [29]. These incidents include object detection failures in autonomous vehicles, resulting in tragic pedestrian fatalities [30,31]; collision accidents stemming from the inability to recognize sudden lane changes by a fire truck in front [31]; and accidents resulting in a driver’s fatality due to the failure to recognize a white trailer under strong sunlight [9]. Although the potential for accidents due to software functional failures has increasingly attracted academic attention [24,32], there remains a lack of in-depth research into the causes and impact of software failure or functional inadequacies on the navigation safety of autonomous ships. This research aims to address this gap, and the novelties of the study are summarized as follows:
In this paper, we propose a framework that leverages Software FMEA and STPA for identifying potential functional failures in software modules and their interactions. While the Software FMEA emphasizes internal software reliability and potential software failures, such as unstable algorithms and inadequate coverage, STPA offers insights into the interactions among software modules, highlighting issues such as inconsistent or incomplete data flows. These findings are crucial for evaluating the risks associated with the software involved in the autonomous control process.
The complementary results from Software FMEA and STPA are directly converted into BN, which enhances the development of the software risk assessment model by specifying the nodes included in the BN and the structural relationships between the nodes. Such a framework enables a combination of diverse hazard sources and facilitates the quantification of uncertainties and dependencies within complex, software-intensive systems.
Overall, the scientific contribution of this paper lies in demonstrating how software functional failures, as well as the complex interactions and dependencies among software modules, can be identified and modelled. This approach enhances the software risk assessment process for software-intensive systems, offering a more thorough understanding of potential software-related risks.
The rest of this paper is structured as follows. Section 2 introduces the proposed framework for software risk assessment of autonomous ships. Details of a case study conducted on the autonomous navigation system are provided in Section 3. The main results and key findings from the case study are provided in Section 4. The implications of the proposed framework and limitations are discussed in Section 5. Finally, Section 6 provides the conclusions drawn from this study.

2. Methods

2.1. Software FMEA

FMEA is a bottom-up, inductive, static analysis method that focuses on how each component can fail, how failures propagate within a system, and whether they could lead to hazards [33]. Software FMEA is an extension of FMEA that is specifically designed for software reliability and safety and is focused on identifying weaknesses in software design by analysing failure modes, potential failure causes, their impact and consequences on the system. This process involves causal reasoning and inductive summarization, with the offering of recommendations to enhance software product quality. In Software FMEA, all failures are linked to design aspects, including misinterpretation of requirements, algorithmic code errors, and insufficient memory allocation, among others. The analysis begins with identifying the software modules, assessing their potential failure modes and failure effects, and understanding the possible failure causes, as illustrated in Figure 1. This comprehensive approach helps in identifying vulnerabilities in software systems.

2.2. STPA

STPA is a method designed for evaluating the safety of complex, software-intensive systems that focus on establishing safety constraints and requirements. Unlike traditional methods that only consider component failures, STPA assumes that accidents may also be caused by unsafe interactions among system components in cases where none of the components have failed [33]. STPA follows a top-down approach, starting from a high abstract level, to model the system as a set of control actions and feedback control loops capturing functional relationships and interactions. It identifies unsafe control actions (UCAs) and their associated loss scenarios. The output from STPA can be used for formulating hazard control measures, improving system architecture, proposing design recommendations, evaluating existing design decisions, and forming leading risk indicators. An overview of the method is shown in Figure 2.

2.3. Bayesian Networks

A Bayesian Network (BN) is a directed acyclic graph featuring multiple nodes and directed arcs [35]. These elements graphically represent the joint probability distribution of variables, as shown in Equation (1).
p ( x 1 , , x D ) = i = 1 D p ( x i | p a ( x i ) )
where p(x1, …, xD) is a joint probability distribution and pa(xi) is the parent set of the variable [36].
The BN serves as a powerful knowledge representation tool, which is capable of performing reasoning based on expert knowledge and incomplete data [37]. It has been widely used in the risk assessment domain in recent years [38,39,40,41,42,43] and has gained popularity for assessing risk related to autonomous ships [16,27,44,45,46,47,48]. The main components of a network structure include nodes, directed arcs and arrows that indicate causal relationships between the nodes, and the Conditional Probability Table (CPT). The CPT holds conditional probabilities for each node state, quantifying their interrelations. In this structure, root nodes, without parent nodes, are assigned prior probabilities. Meanwhile, intermediate nodes are endowed with conditional probabilities outlined in CPTs [49]. According to Bayes’ theorem, the prior probabilities of root nodes can be updated with new observations, which are referred to as evidence, yielding posterior probabilities. The integration of posterior probabilities facilitates further inferential analysis [50,51].
The BN excels in visually representing relationships between variables and offers a high level of precision, even when dealing with partially missing data, thereby enabling accurate analysis [37]. To construct BN models, a data-driven approach is the most preferable method as it produces relatively accurate network structures and corresponding node parameters in large, complex systems. However, obtaining sufficient data samples is often challenging. Therefore, expert-based modelling is also widely applied to construct BN structures and obtain CPTs, especially for systems that are overly complex. For systems with limited data samples available, it is possible to apply a hybrid approach, which involves compromises between the above two approaches. BN nodes can be determined based on expert knowledge, followed by structural inference and construction using relevant methods. For an in-depth exploration of how a BN is applied to safety, reliability, and risk assessment, please refer to [41].

2.4. The Proposed Framework in the Context of Software Risk Assessment for Autonomous Ships

Outlined in this section is the three-phase framework combining Software FMEA, STPA, and BN, which is aimed towards assessing the software risk for autonomous ships. Software FMEA focuses on identifying the failure modes, failure effects, and potential failure causes of the software while taking the operating conditions into consideration. However, it does not address functional dependencies, sequences of events, or combinations of events [33]. STPA therefore complements by providing a structured approach to uncover hazards from interactions between modules and complex causation pathways in the system. Therefore, the integration of Software FMEA and STPA can be used towards addressing the multifaceted nature of software risks in autonomous ships by combining detailed failure analysis with a broader systemic perspective, offering a comprehensive and proactive approach to enhancing the safety and reliability of these advanced maritime systems. Figure 3 provides an overview of the three phases and steps of the proposed framework and how the outcome of Software FMEA and STPA relates to the risk model constructed based on the BN. Each of the phases and steps is described in the following subsections.

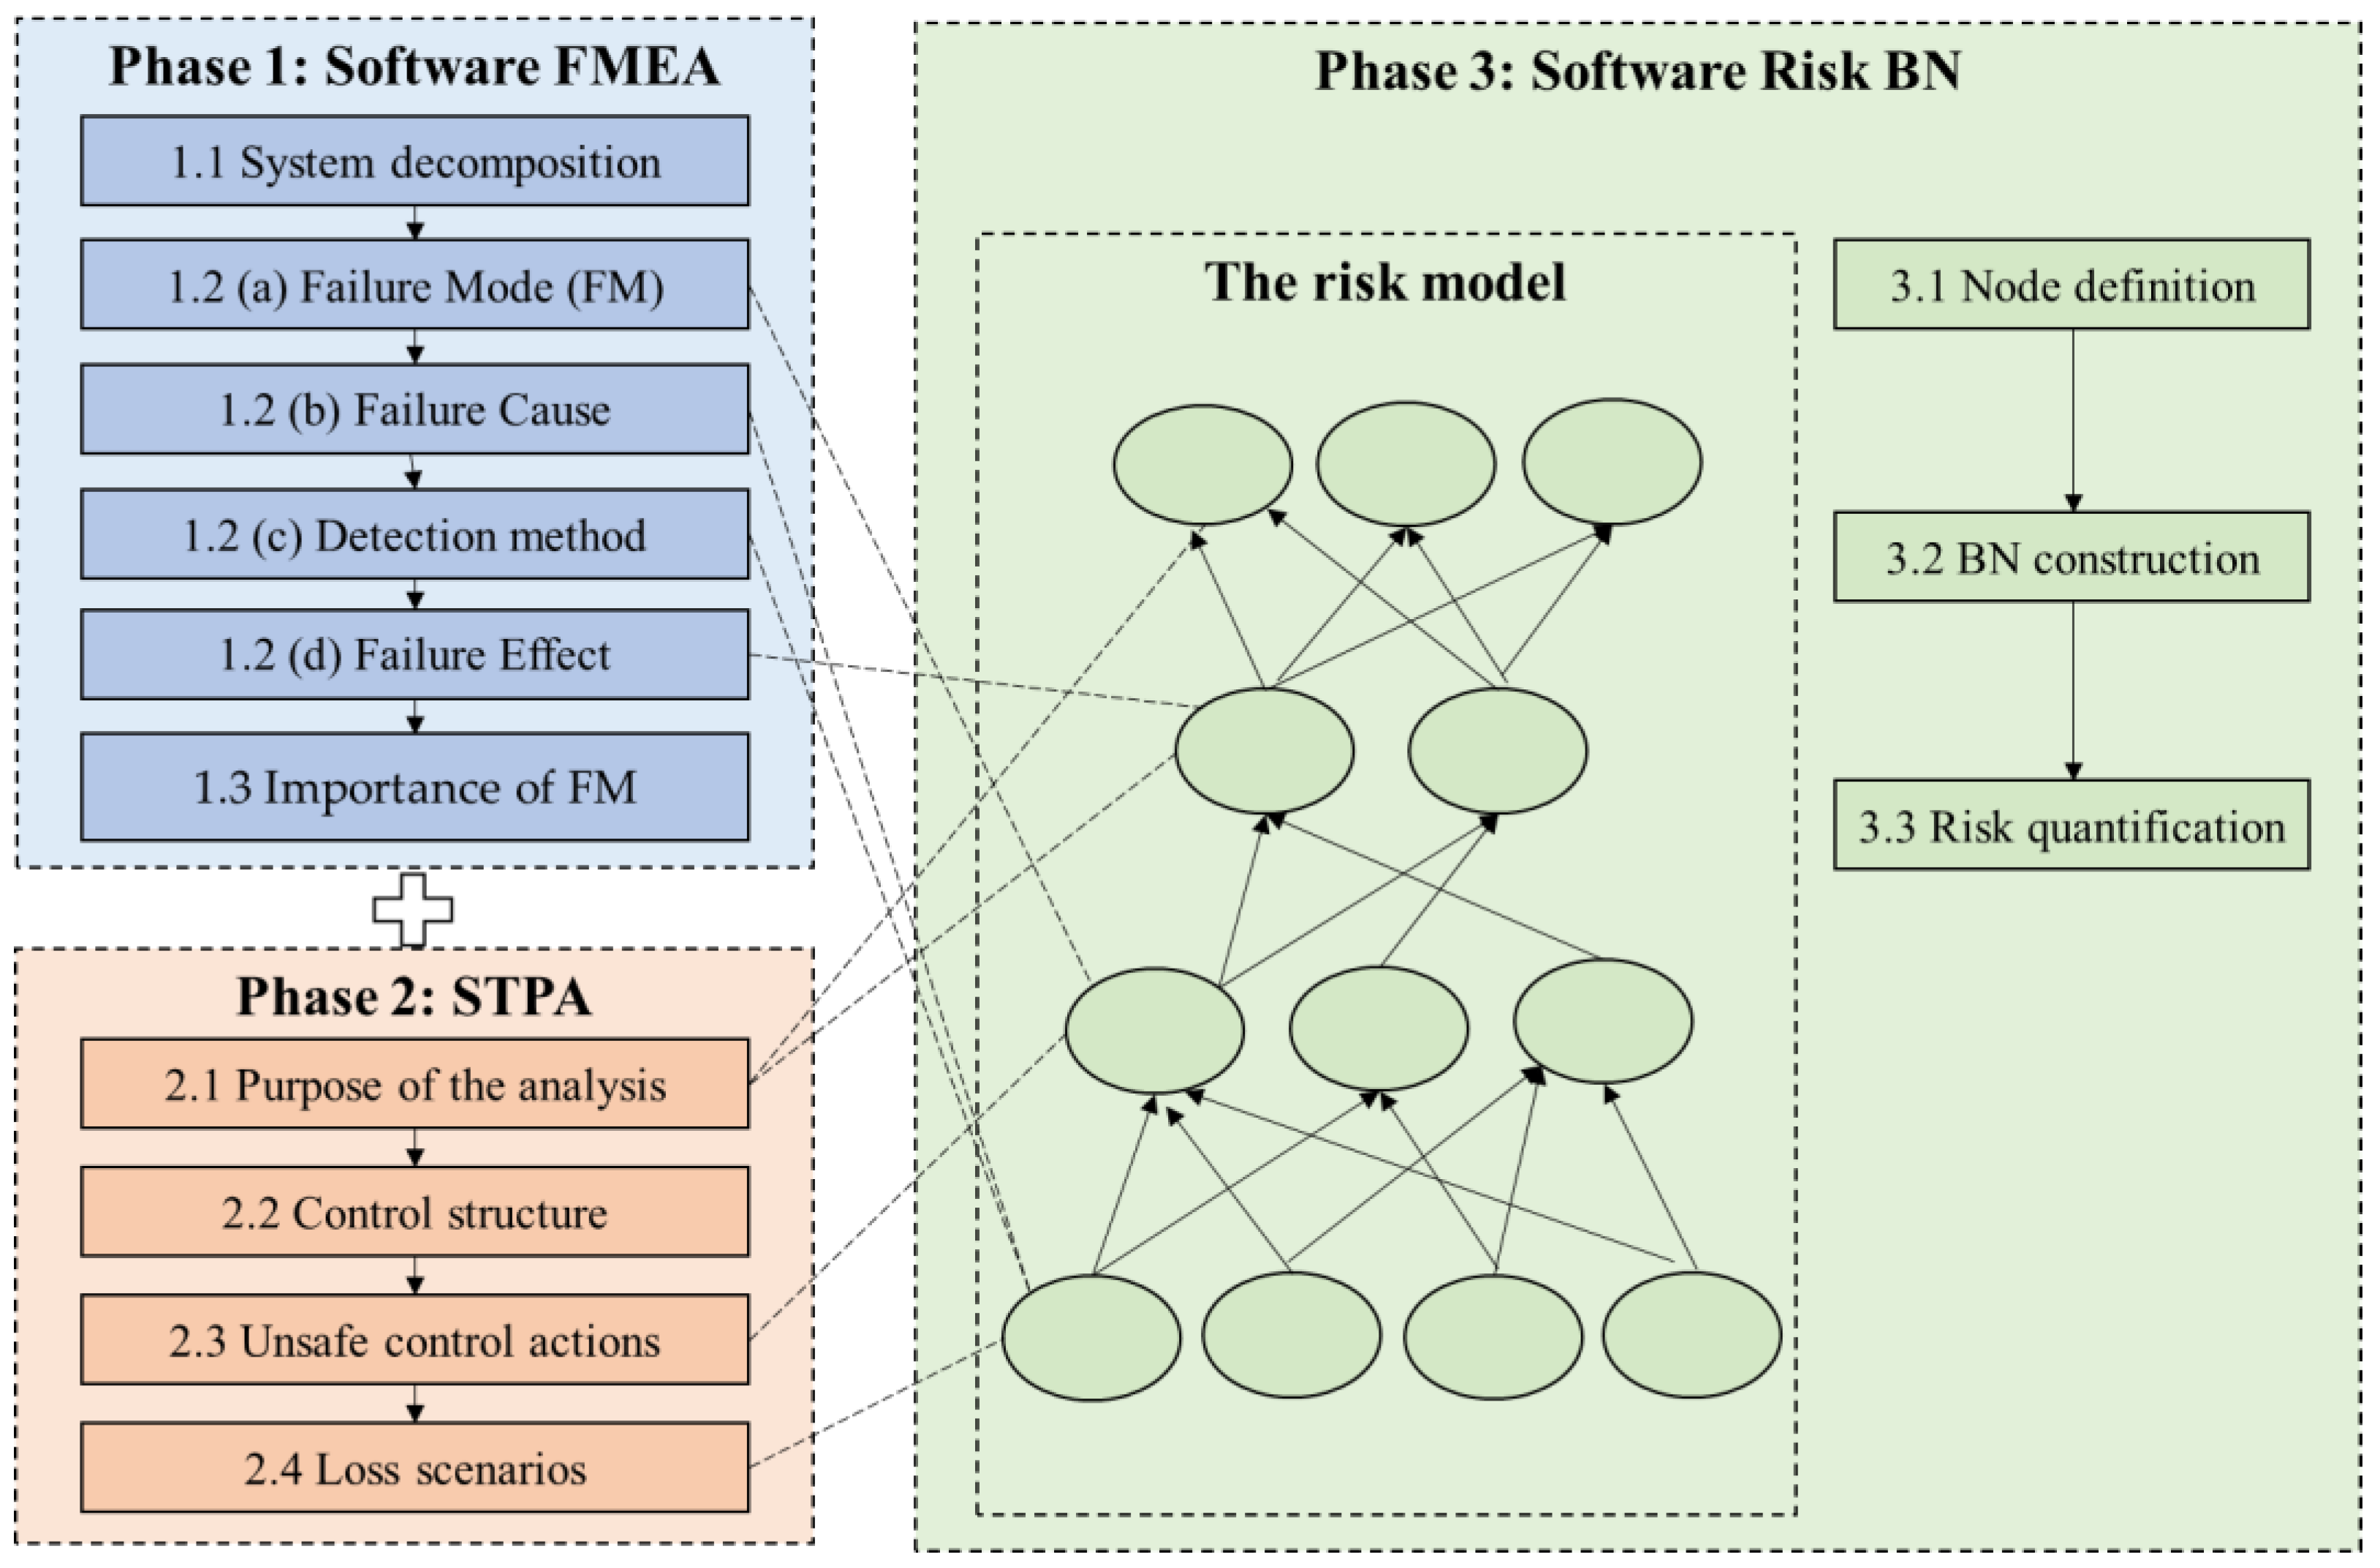
2.4.1. Phase 1: Analyse Software Failure Modes and Their Impacts Based on Software FMEA

Phase 1 consists of three steps:
  • Step 1.1: Analyse the software architecture to decompose the software into modules for further analysis.
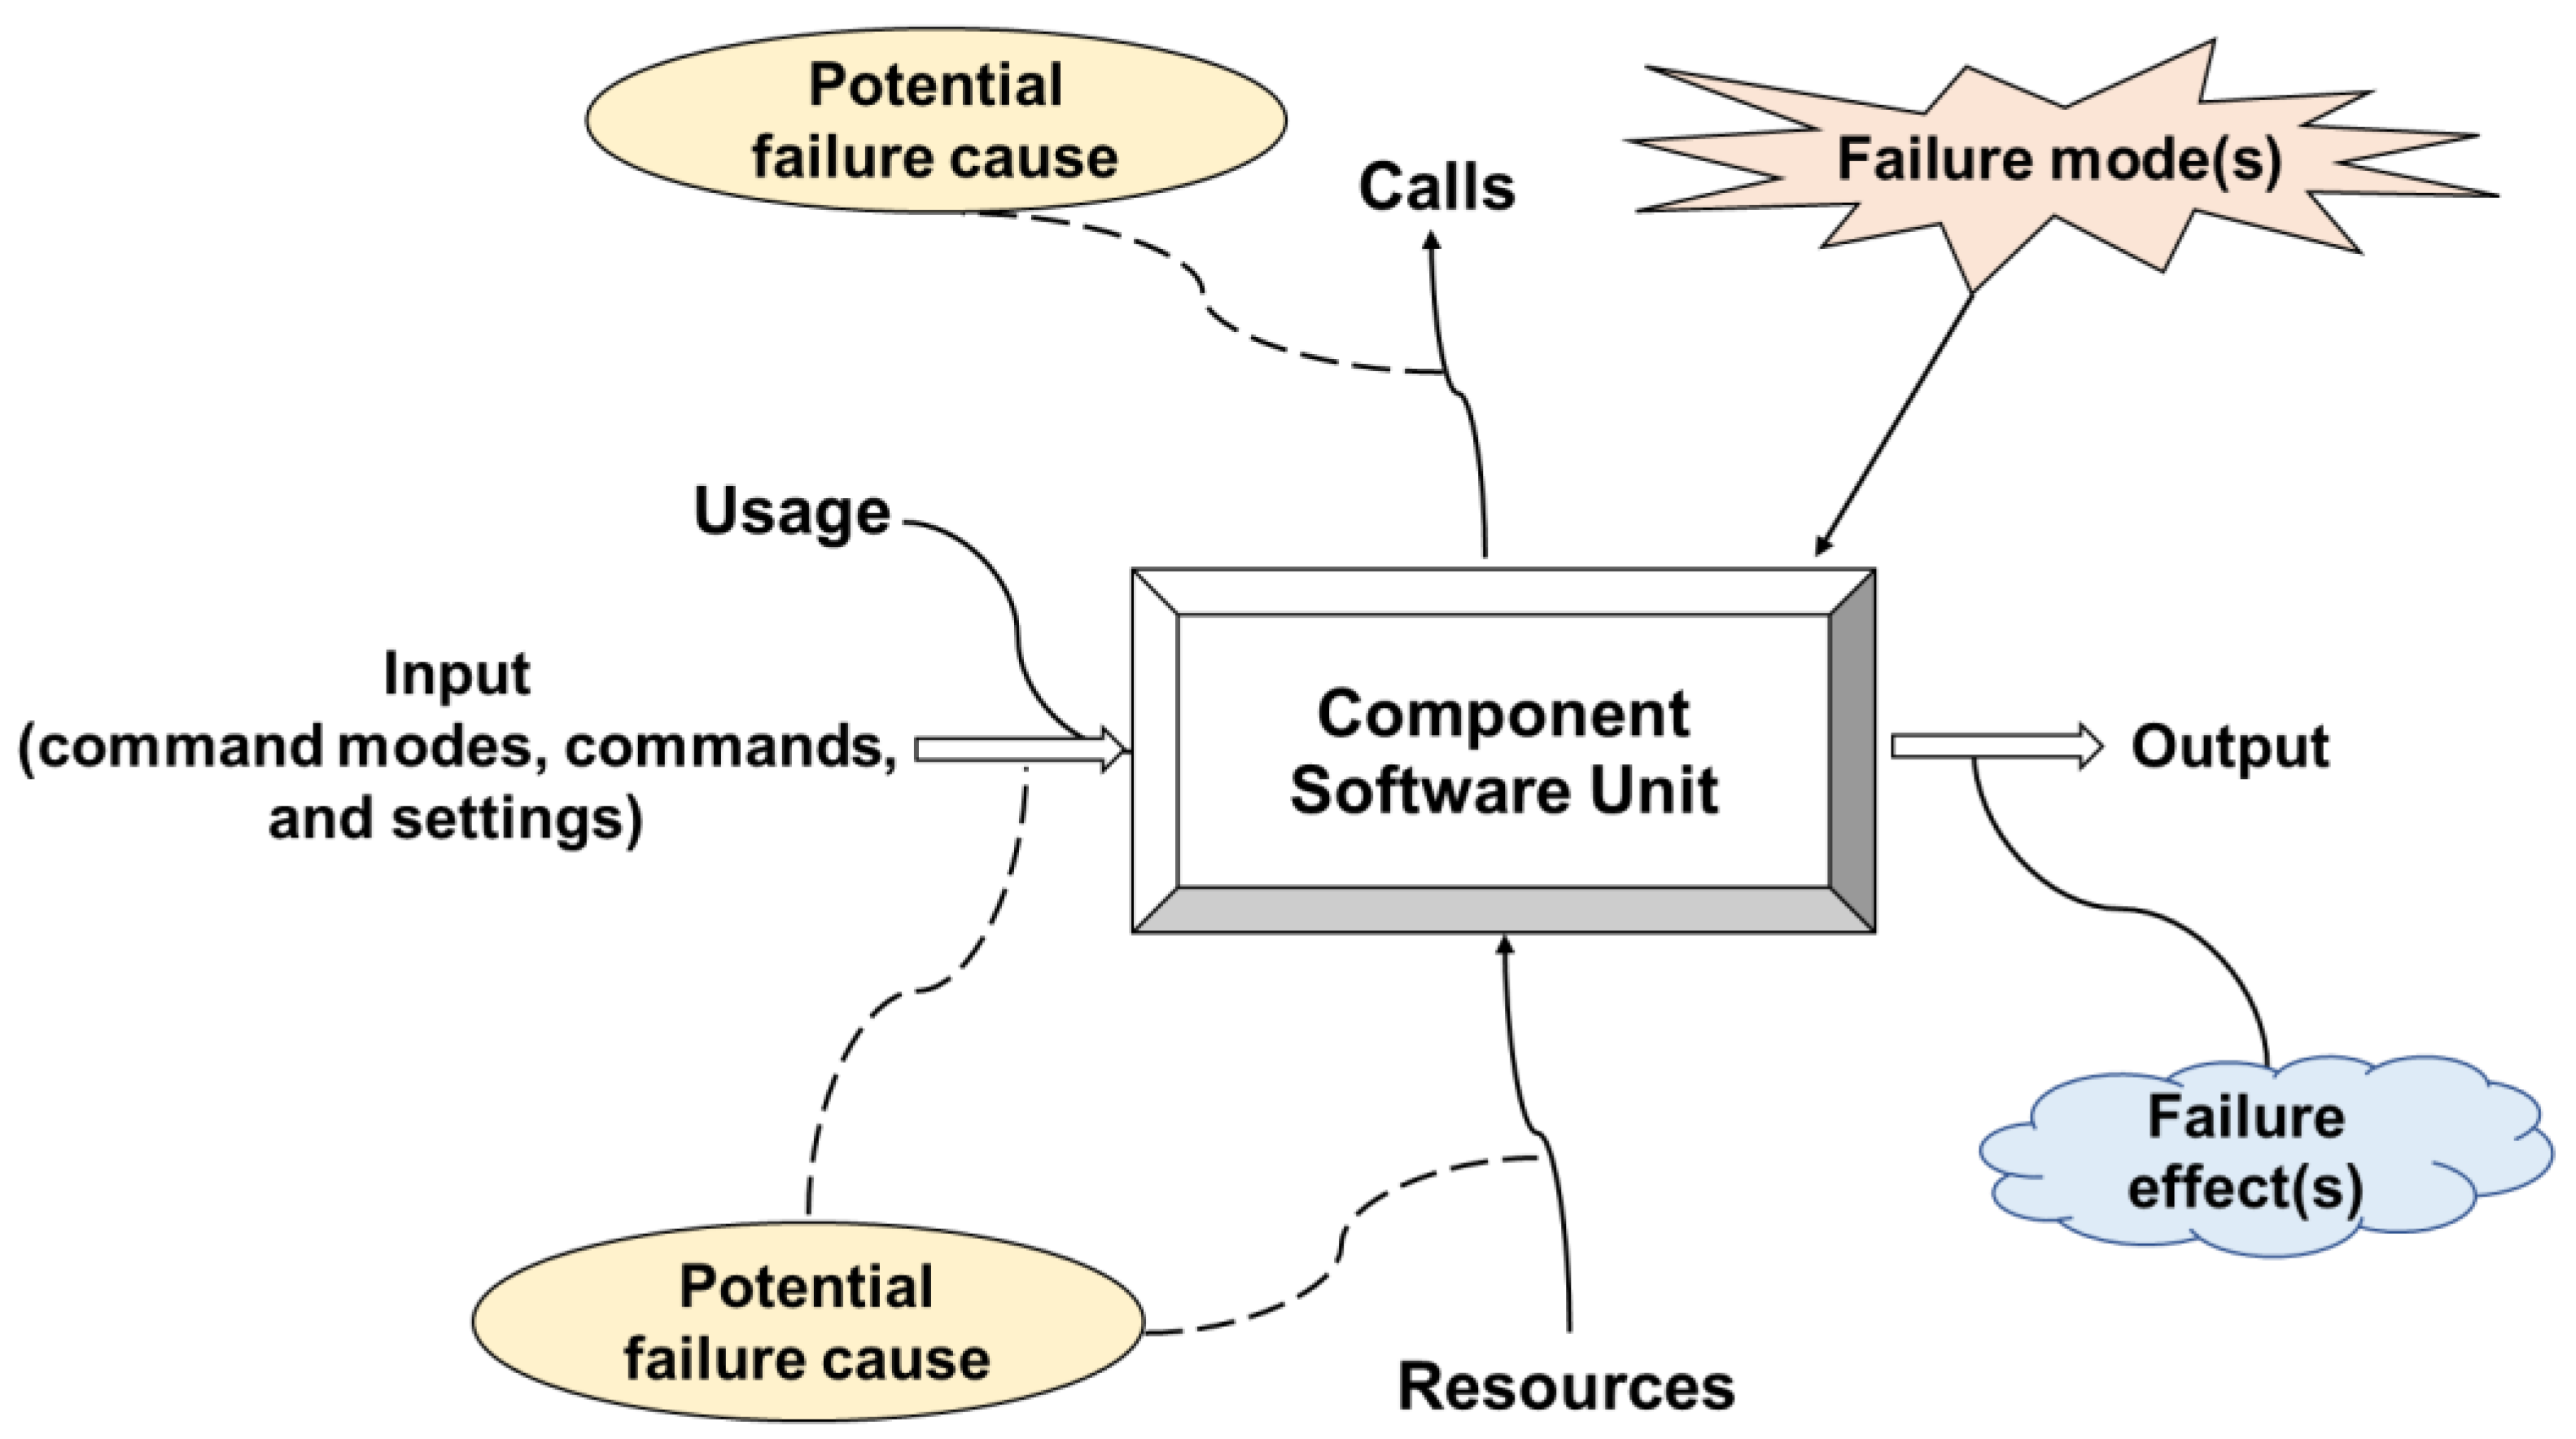
  • Step 1.2: Identify potential failure modes, detection methods, their causes, and local and final effects for the objects of analysis. The possible software failure modes and causes could cover data, timing, interface, logic or computation, resources, assumptions, operating conditions, etc. [52]. The detection methods are means to identify the failure modes, which are the existing measures by allowing operators to intervene and reduce the likelihood of failures or mitigate adverse effects [33].
  • Step 1.3: Evaluate the relative importance of failure modes, including determining the severity of the failure’s final effect and the likelihood of a failure mode. The criticality can be determined using Risk Priority Number (RPN) by evaluating the severity, occurrence, and detectability of software failure effects (S, O, and D, respectively) (Equation (2)).
RPN = S × O × D
  • Severity (S): Determine the severity value while considering potential failure consequences.
  • Occurrence (O): Assess the likelihood of occurrence, factoring in complexity, potential failure modes, and causes.
  • Detectability (D): The detectability hinges on the intricacy of hardware/software components and potential failure causes.

2.4.2. Phase 2: Identify Interaction Defects between Software Modules

This phase consists of the following main steps:
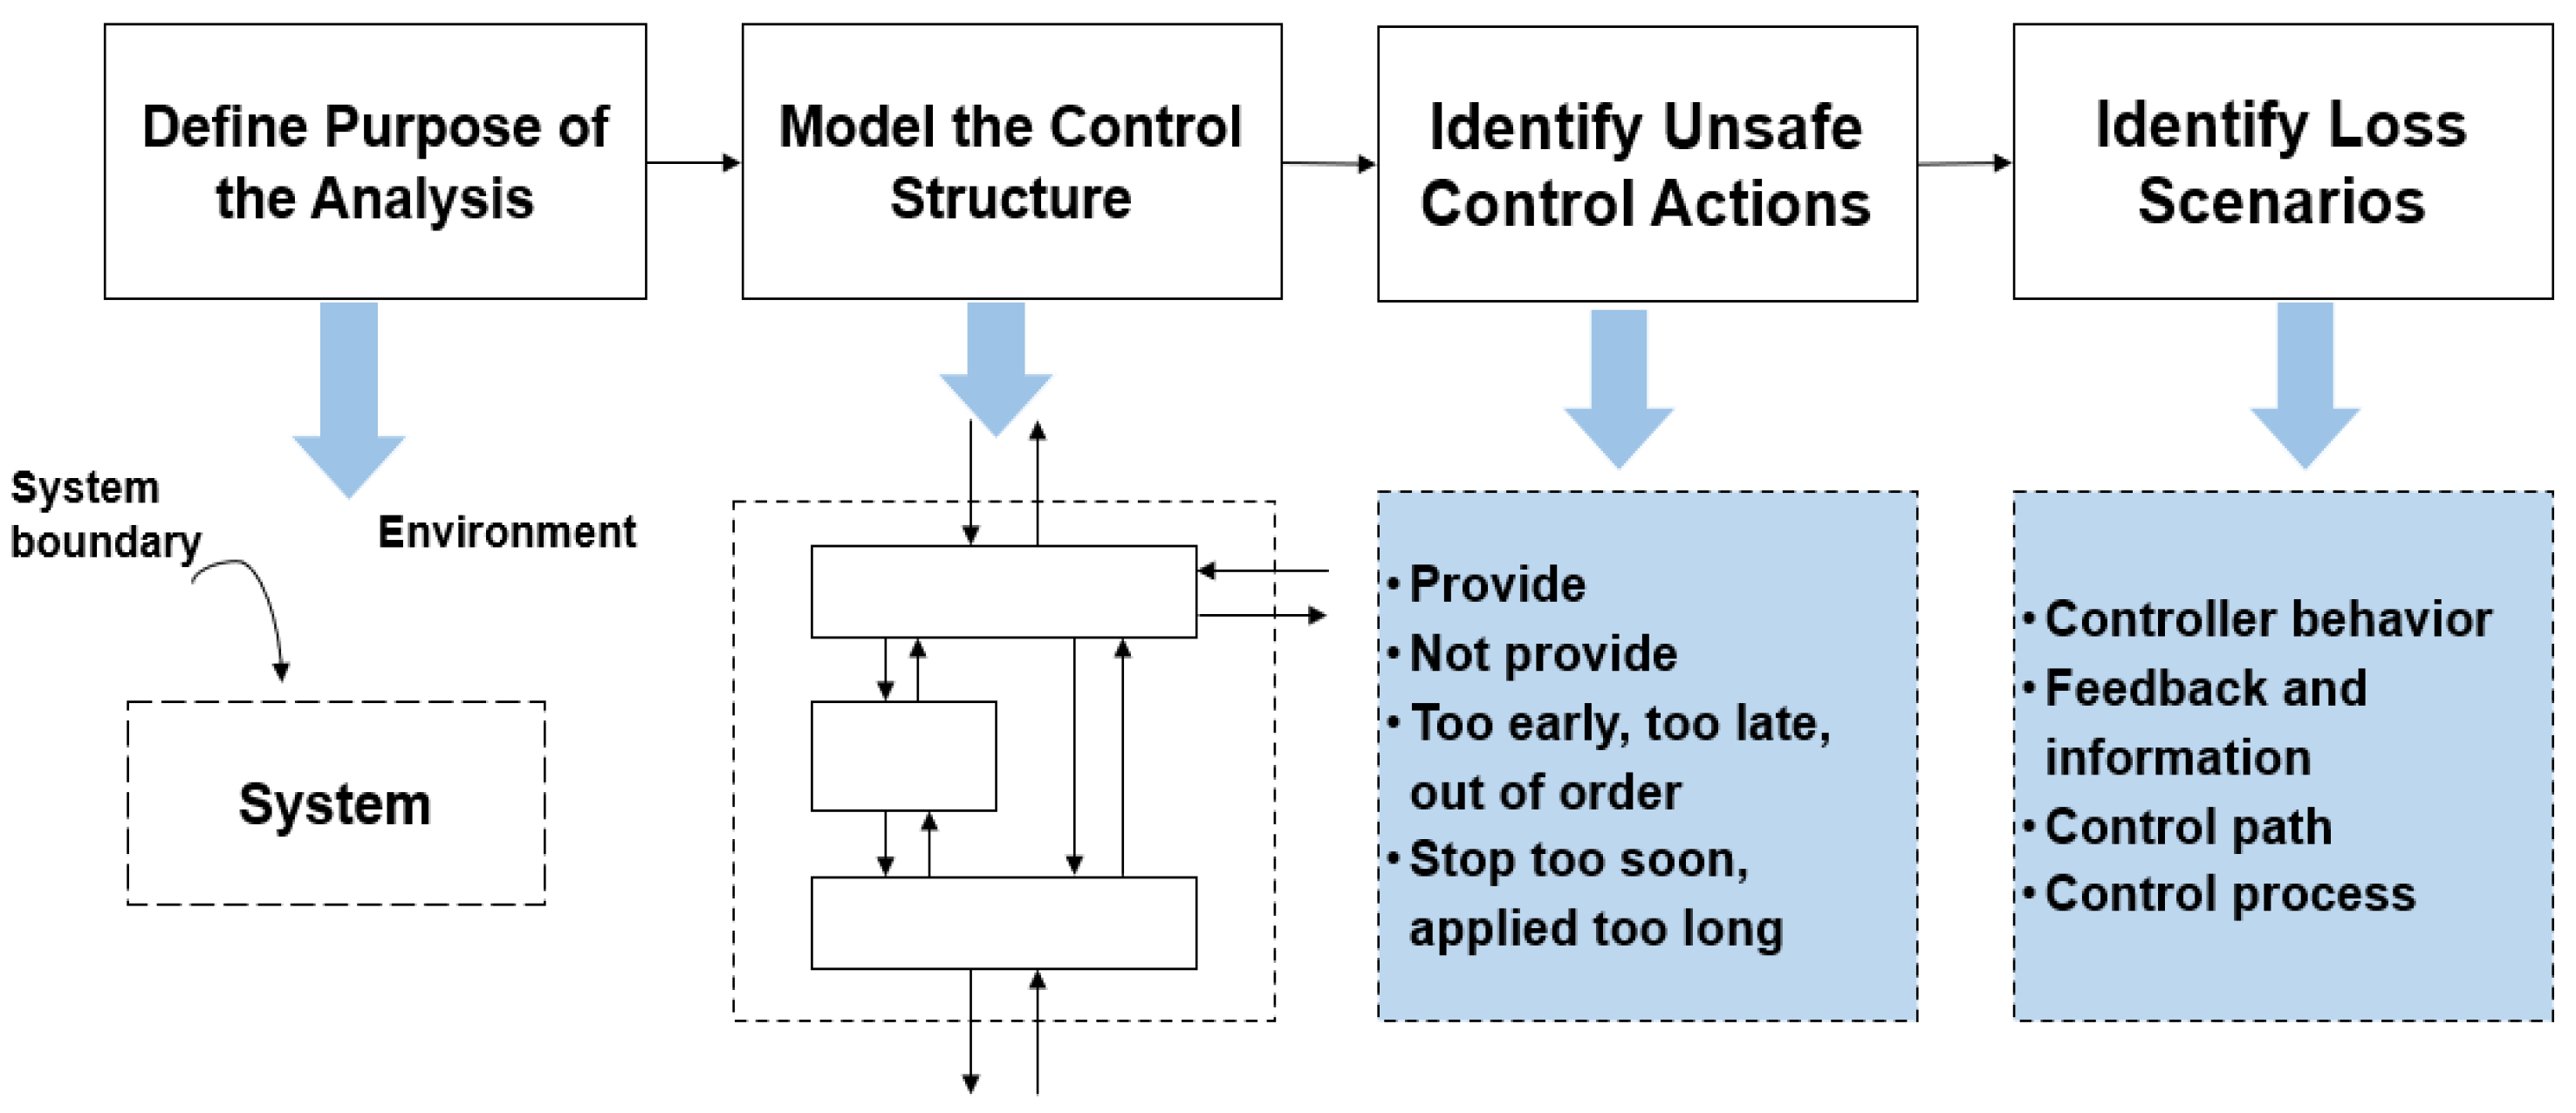
  • Step 2.1: Define the purpose of the analysis. The initial step involves defining the study’s purpose and system boundaries. It encompasses identifying potential losses (Ls), system-level hazards (Hs), and system constraints (SCs). Safety constraints, which are crucial for ensuring system safety, are established as mandatory conditions or rules that the system must adhere to.
  • Step 2.2: Model the control structure. This step involves constructing a control structure comprising controllers, control actions, and a feedback loop, which are supplemented by additional inputs and outputs from various system components. Responsibilities are assigned to each controller to ensure effective system management.
  • Step 2.3: Identify unsafe control actions (UCAs). This process entails pinpointing control actions that, under certain circumstances or in extreme cases, might lead to hazards. The objective is to explore how these UCAs could result in the hazards initially identified. Each UCA is characterized by five critical aspects: the responsible controller, the context of occurrence, the type of UCA, the specific action or command, and the potential hazards or sub-hazards it might activate. Additionally, controller constraints are established to outline necessary behaviours to prevent UCAs.
  • Step 2.4: Identify loss scenarios. This step involves outlining scenarios that could lead to UCAs and subsequently result in hazards. Two primary scenarios are scrutinized—those explaining UCAs’ emergence and those detailing flawed or missing execution of UCAs leading to hazards. To identify these scenarios, the process often involves tracing back from the UCA to determine the influencing factors acting on the controller’s decisions regarding control actions.

2.4.3. Phase 3: Develop Risk Models Using a BN Based on Results from Software FMEA and STPA

At this phase, the results from STPA and Software FMEA are converted to a BN to develop the software risk assessment model. Figure 3 provides an overview of the process. This primarily involves the following steps:
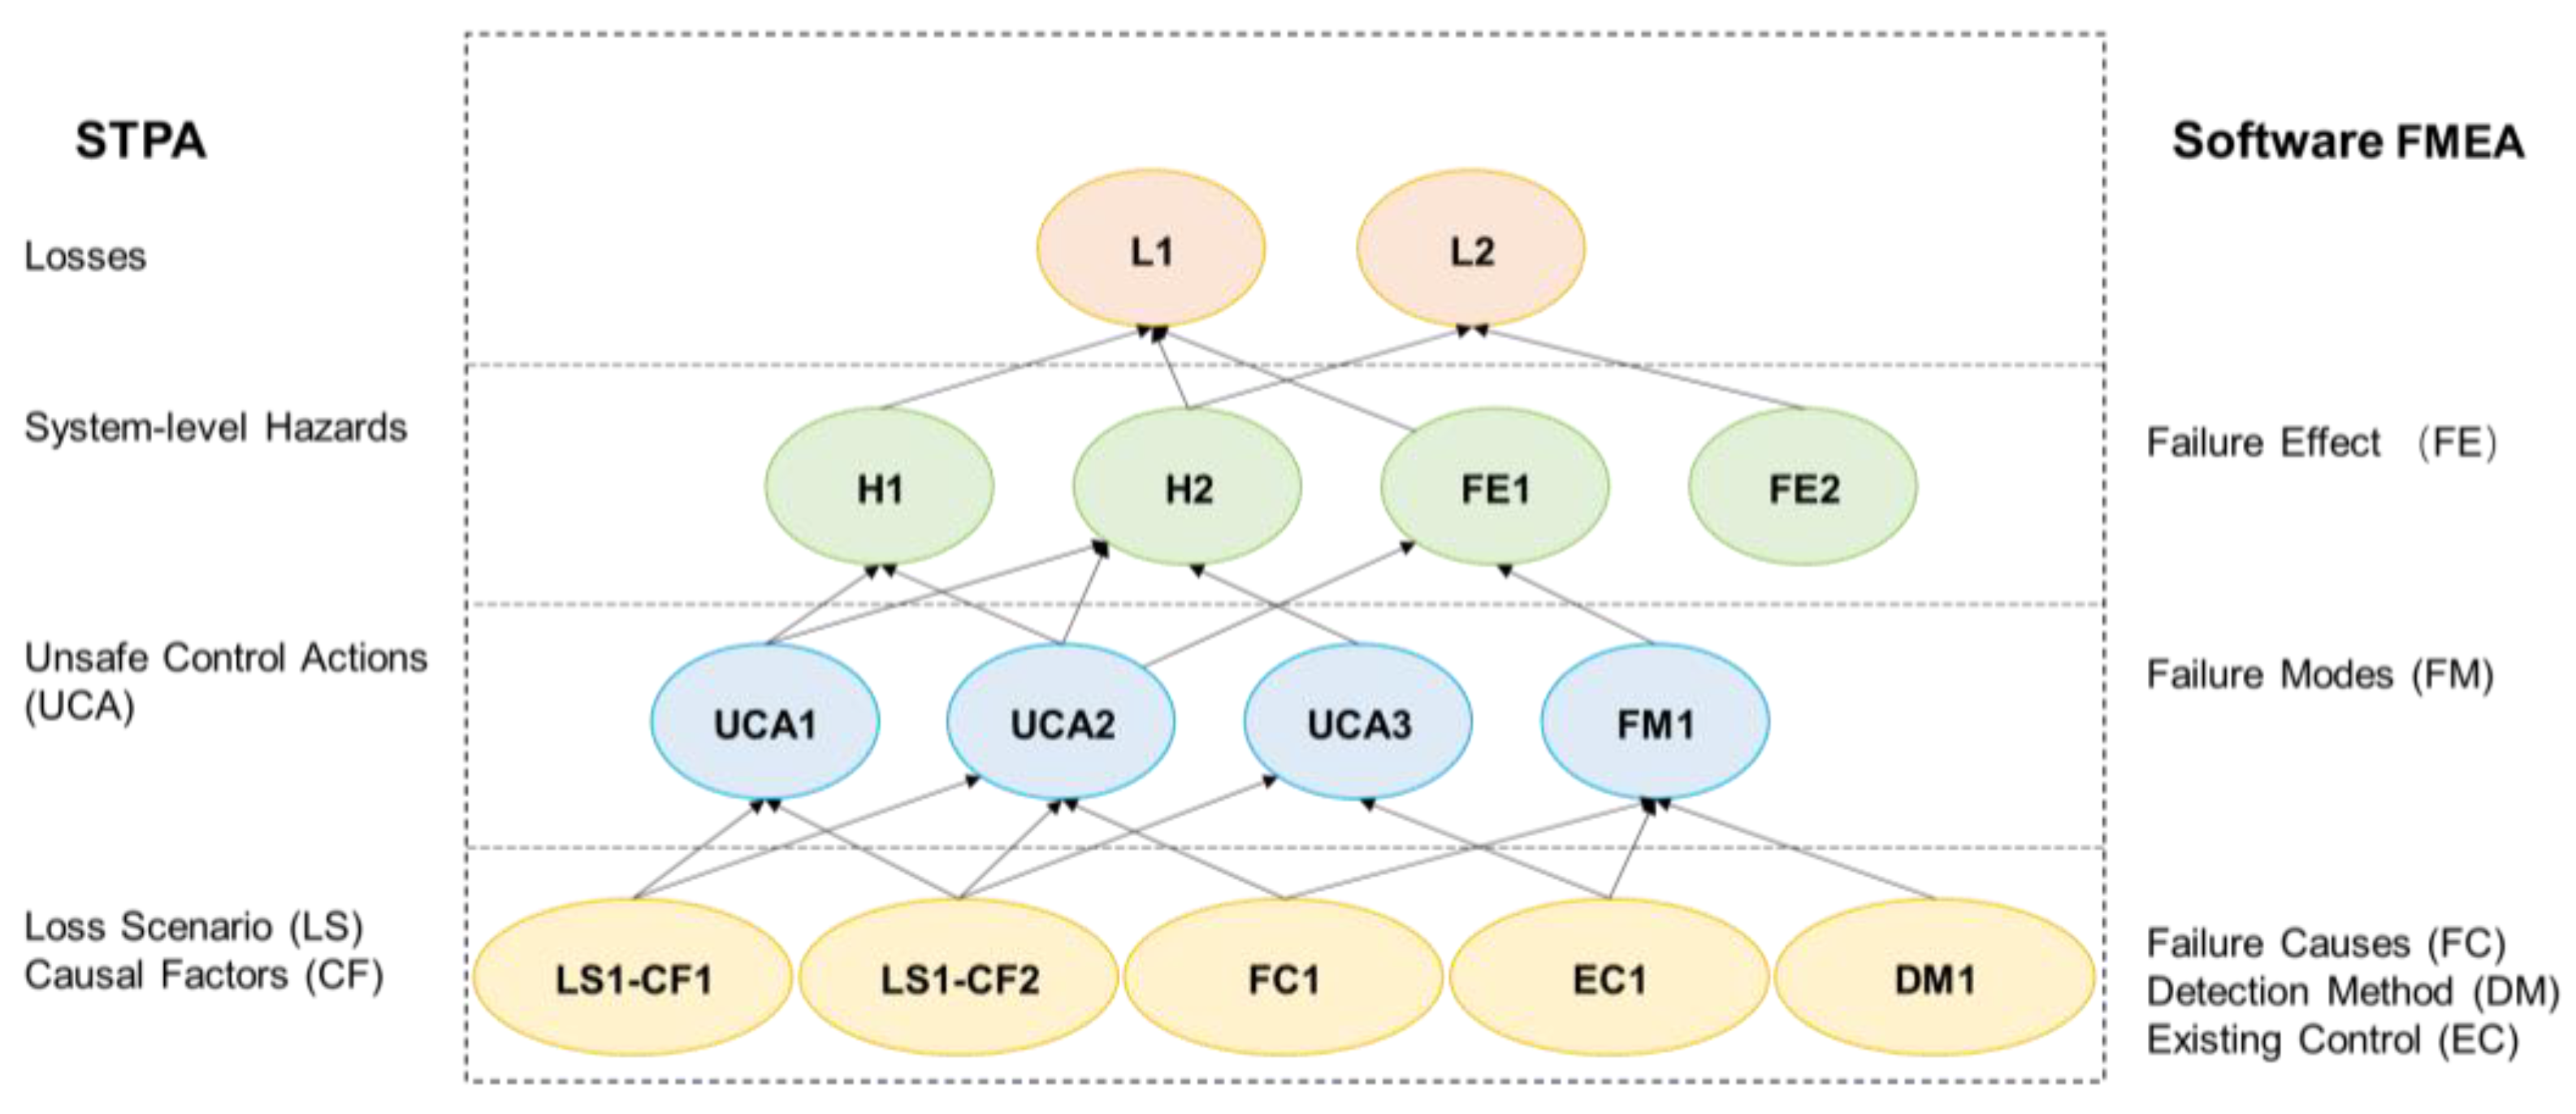
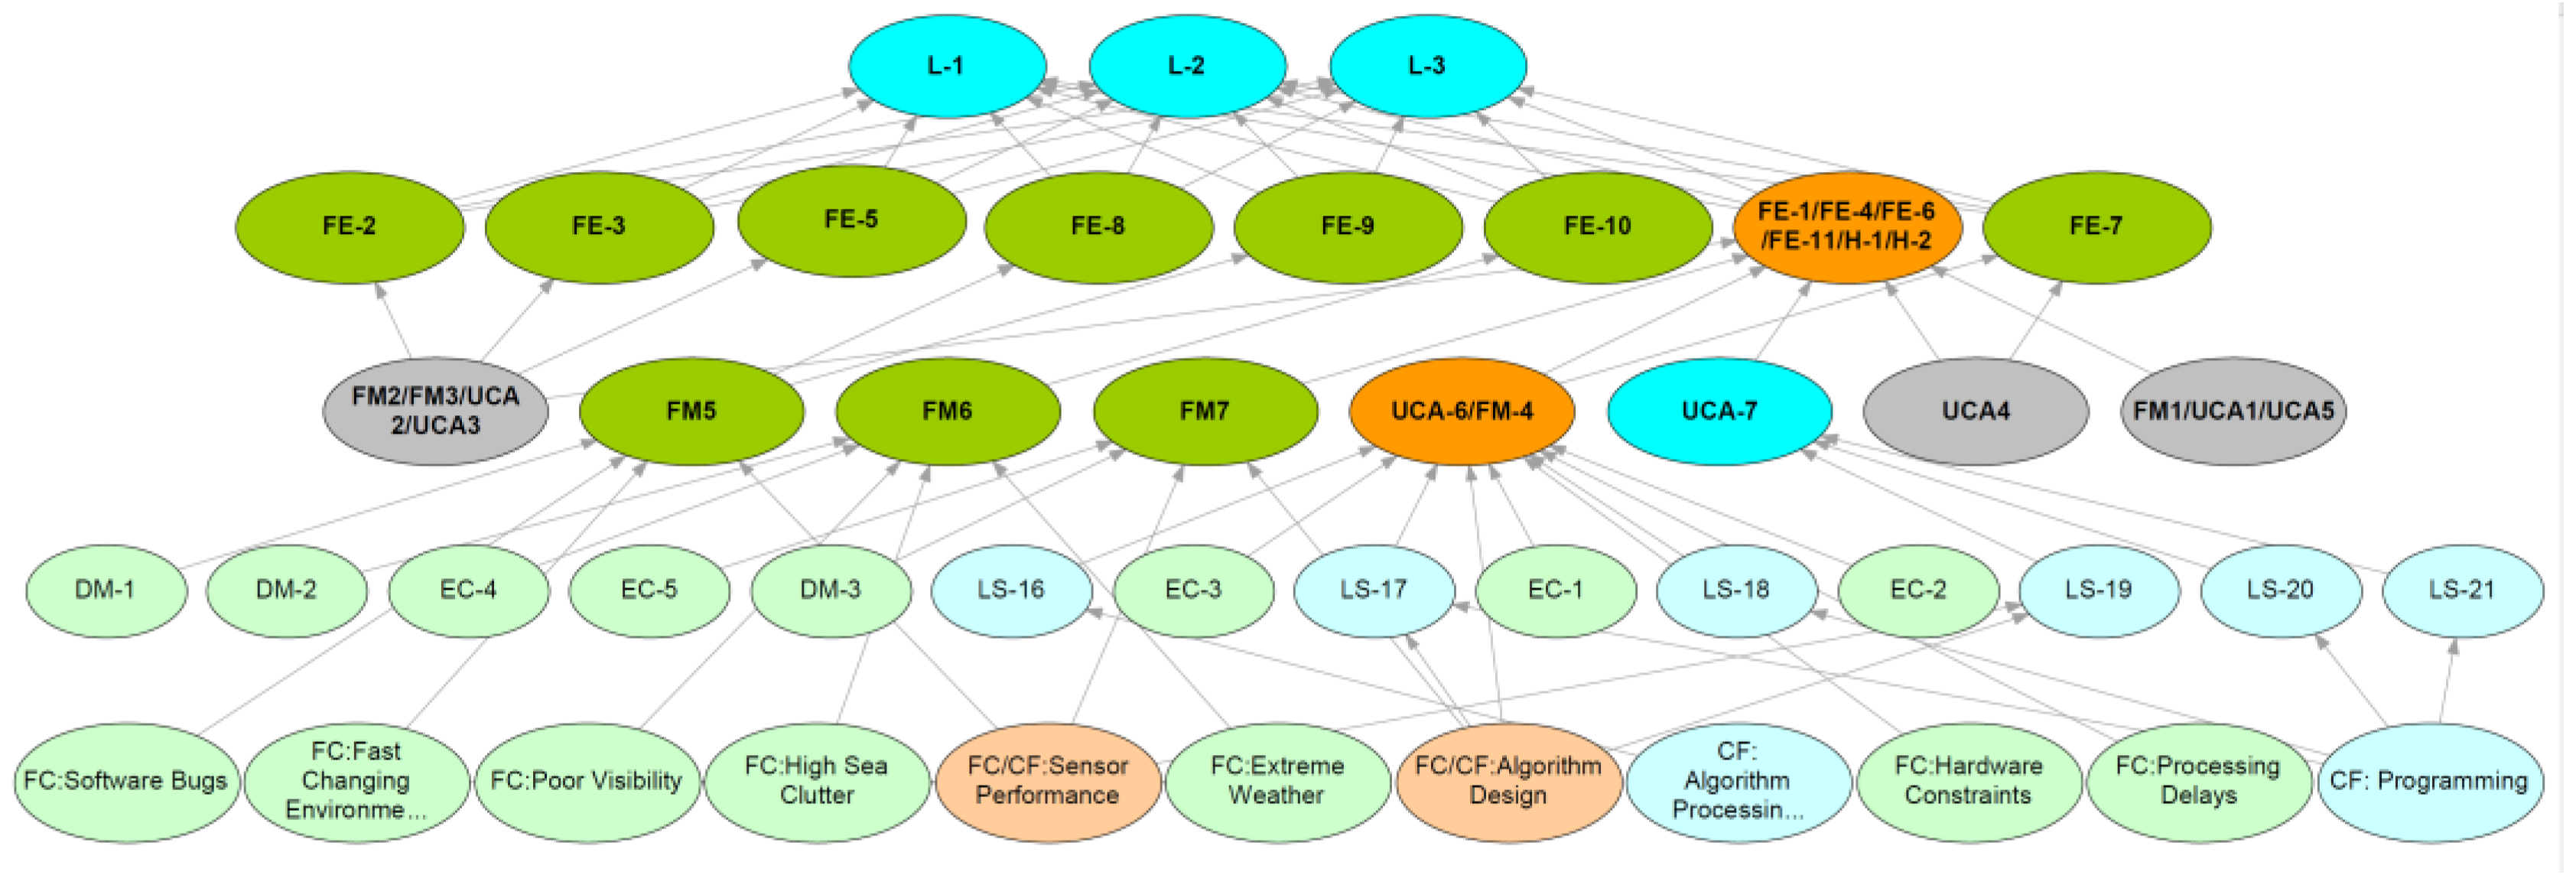
  • Step 3.1: Define nodes included in the software risk assessment model. The outcomes from STPA that are considered for modelling are losses (Ls), system-level hazards (Hs), UCAs, loss scenarios for UCAs, and causal factors [7]. Nodes for failure modes (FMs), failure causes (FCs), detection methods (DMs), and failure effects (FEs) derived from Software FMEA are also created as variables in the BN. Common hazards and causes may be identified from both methods, as revealed by [53]. Therefore, the findings should be consolidated to merge similar modes and harmonize the different ones.
  • Step 3.2: Define the relationship among nodes and the BN structure. Establish directional links between nodes that have a causal relationship. The target node is defined as the losses from STPA, which are caused by system-level hazards as the succeeding layer (see Figure 4). The hazards are caused by UCAs, and the UCAs are caused by causal scenarios. In cases where the failure effects identified by Software FMEA complement the list of system-level hazards, they are modelled at the same level. The same applies to failure modes and failure causes. The detection method is considered a causal factor for failure modes.
The hierarchical structure of the BN is illustrated in Figure 4. The process will be further explained in the case study presented in the following section.

3. Illustrative Case Study

Detailed in this section is an illustrative case study of software modules of an autonomous navigation system to exemplify the proposed framework.

3.1. System Description

The software design favours units of modularity [54]. In this case study, the autonomous navigation software system (ANSS) is constructed of three high-level modules according to Fossen [55], termed guidance, navigation, and control. The autonomous ships are provided with a destination for the leg of a voyage. The guidance module is involved in the process of directing a ship to ensure safe operations. The process includes adhering to maritime regulations, responding to emergencies, and manoeuvring in complex environments—tasks currently undertaken by the Officer on Watch (OOW). The navigation module supplies critical information such as position, velocity, water depth, environmental data, and other maritime-specific measurements. The control module involves calculating the required control forces and moments that the vessel must exert to achieve specific navigational objectives. In general, when compared to conventional vessels, the subsystems of an autonomous navigation system that are distinct are sensor fusion, collision risk analysis (CRA), collision avoidance, motion planning, and control [56].

3.2. Phase 1—Software FMEA

3.2.1. Decompose the Software System

As described in Section 3.1, the ANSS of autonomous ships is decomposed into modules and sub-modules, as shown in Figure 5. Since there is no consensus on the software architecture of the ANSS, as far as we know, the breakdown was implemented based on the related literature and expert knowledge. The submodules are described in detail in Table 1.

3.2.2. Identify Failure Mode, Failure Causes, Detection Method, and Effects

The potential failure modes, failure causes, and failure effects that may lead to a hazardous state are analysed in this step. Due to limited space, the case study only focuses on the obstacle detection module. The goal of the obstacle detection module is to accurately and reliably identify and classify obstacles in its operating environment. This function includes detecting obstacles, classifying obstacles, estimating the position and velocity of the detected obstacles, and so forth.

3.2.3. Evaluate Relative Importance of Failure Modes

In order to evaluate risk and calculate RPN, the likelihood of their occurrence, the severity of the failure effect, and the detectability of the failure causes are assessed first. The likelihood of occurrence is assessed based on a three-point scale, starting from 1 (low) and going to 3 (very high). A five-point scale is used for severity, ranging from 1 (very low) to 5 (very high), which refers to the potential to have a collision accident. The detectability depends mainly on the complexity of the software modules and the causes of the failure. The higher the detection number, the less likely the detection [33]. Therefore, the number for detectability ranges from 1 (very certain) to 5 (improbable). The definitions of the scales from [71,72] are adopted in this study and are shown in Table 2, Table 3 and Table 4.
The PRN is then calculated following Equation (2), with a range from 1 to 75.
In this study, expert knowledge was utilized to assess the severity (S), occurrence probability (O), and detectability (D) of failure modes in an ANSS. Four experts were invited for the assessment: a ship captain, a chief mate of conventional ships, and two associate professors with over 5 years of research experience within field of autonomous navigation safety. One of the associate professors has software development experience. These experts assessed SODs based on their practical experience, references from the international literature, and personal judgments. The results are summarized in the last four columns of Table 5. It is worth noting that the assessment was conducted for demonstration purposes only. When applying the framework to a practical software development process, a Software FMEA facilitator, system engineers, and software engineers should also be involved.

3.3. Phase 2—STPA

3.3.1. Define the Purpose of the Analysis

The system boundary of this case study is limited to the safe navigation of autonomous ships during voyages. The potential losses could be the following:
L-1: Causality or injury of seafarers onboard
L-2: Loss or damage of the ship
L-3: Damage to the environment
The primary accident that could lead to these losses is a collision during navigation (L-1, L-2, L-3). The following system-level hazards are selected for further discussion:
  • H1: Entry of other vessels into the ship’s safety domain
  • H2: Intrusion of static obstacles into the ship’s safety domain
The safety constraints to prevent hazards from happening and developing into accidents are described in Table 6.

3.3.2. Model the Control Structure

In this step, the control structure for the ANSS is constructed, emphasizing software controls. This model includes the software modules, sub-modules, and the interactions in between, as shown in Figure 6.

3.3.3. Identify Unsafe Control Actions (UCAs) and Loss Scenarios

This section outlines examples of identified UCAs related to control operations, with a special focus on obstacle detection. The obstacle detection module (ODM) takes in processed data from a data processing module (DPM). The data processing module processes data obtained from cameras, AIS, radar, LiDAR, AIS, GPS, etc., and attempts to handle the redundant and possibly conflicting data with their inherent errors to construct a best-perceived truth of the environment. The obstacle detection module provides a collision prediction module with obstacle information, including the type of obstacles, position, speed, heading, and so forth. The UCAs related to the obstacle detection module are defined in Table 7, with loss scenarios and causal factors described in detail. Loss scenarios describe the conditions under which the considered UCA may occur, while causal factors are the prerequisites leading to the occurrence of loss scenarios. Any factors that could cause a shift in behaviour from “normal” to “abnormal” have the potential to constitute a part of the loss scenario. Taking UCA-6 as an example, the design failures or programming errors in the ODM algorithm may cause loss scenario LS-17, wherein the DPM algorithm processing time is prolonged. As a result, the loss scenario may lead to UCA-6, specifically, the delayed transmission of obstacle information by ODM.

3.4. Phase 3—BN

3.4.1. Define Nodes Included in the Software Risk Assessment Model

The software risk assessment model based on the BN includes identified losses (Ls), system-level hazards (Hs), unsafe control actions (UCAs), loss scenarios (LSs), and causal factors (CFs) from STPA as well as failure modes (FMs), failure effects (FEs), failure causes (FCs), and detection methods (DMs) from Software FMEA. Orange nodes represent common items identified from both Software FMEA and STPA. For example, FE-1/FE-4/FE-6/FE-11/H-1/H-2 all represent “Obstacle enters safety domain”, and as such, they are combined into a single node. This is also applicable to UCA-6/FM-4, representing “ODM provides required obstacle information too late while an obstacle has entered the safety domain already”, where similar causes and failure reasons are merged into a single node, such as “Sensor performance” and “Algorithm design”. Green nodes represent items identified solely from Software FMEA, while blue nodes are items identified solely from STPA. Due to space limitations, not all UCAs and FMs have undergone further modelling and are represented in grey nodes. The node descriptions are provided in Table 8.

3.4.2. Define the Relationship among Nodes and the BN Structure

The BN constructed based on the results identified from Software FMEA in Table 5 and STPA in Table 7 is depicted in Figure 7. From the figure, it is evident that a software failure mode such as FM-5 “Instable algorithm” will result in FE-8 “Unpredictable system reliability”. There are multiple causes of software failure, including failure of DM-1 “Comprehensive software testing” or FC “Software bugs”, all of which can lead to software failure. Similar relationships exist for other nodes in the model. In the BN, directed arcs represent dependencies between nodes, thus arrows are used to illustrate their causal relationships. Figure 7 represents the constructed BN model. The illustrative initial definitions of states for each node are defined in Table 8 based on the interpretation of the results from Software FMEA and STPA.

4. Main Results and Key Findings from the Case Study

This section outlines the main findings, drawing on the comprehensive analysis results detailed in Section 3 (Table 1, Table 2, Table 3, Table 4, Table 5, Table 6, Table 7 and Table 8 and Figure 6 and Figure 7).

4.1. Key Findings from Phase 1

In the first phase of the method, Software FMEA is applied to the autonomous navigation software system. The software is broken down into guidance, navigation, and control modules and further decomposed into sub-modules. The case study is specifically focused on the obstacle detection module, aiming to identify failure modes, local and global failure effects, detection methods and existing controls, and failure causes. The RPN is also calculated based on expert judgment by multiplying the severity, occurrence, and detectability of the failure mode. The identified failure modes include false negatives (missed detection), false positives (false detection), incorrect classification, latency issues, unstable algorithms, degraded performance in adverse conditions, and inadequate coverage. For instance, the failure mode “incorrect classification” could cause an “Inability of the algorithm to distinguish between different object types or judge sizes” and a local effect of “erroneous identification of the type or size of an obstacle”. The global effect could be that an “increased probability of obstacles enters safety domain” and eventually results in a collision or “inappropriate navigational responses”. The causes could be “limited training data diversity”, namely, that certain situations were not trained for the learning process. The cause may also be rooted in the algorithm itself, that is, the algorithm itself is not able to distinguish between different obstacle types or judge sizes. The method also identifies the failure mode “false positive”, wherein a false alarm is generated. The failure itself may not threaten navigation safety; however, it may result in “reduced operational efficiency”, especially when the occurrence is high.

4.2. Key Findings from Phase 2

The second phase is focused on establishing a control structure for the ANSS, and the case study continued with identifying UCAs, loss scenarios, and causal factors for the obstacle detection module. The control structure (Figure 6) reveals the complexity of the whole control process, with the inclusion of 18 sub-modules that interact with each other. However, it is worth noting that the control structure is neither a physical model nor an executable model [34]. The components do not necessarily exist, but they can be used to derive the necessary specifications requiring enforcement. The connections in between also do not necessarily correspond to physical connection but, rather, information that can be sent or received. The analysis focused on control action “providing obstacle information” and identified 10 UCAs, with 20 loss scenarios that contribute to the UCAs. One example is “UCA-3: ODM provides obstacle information, but the information is wrong”. The wrong information could be the wrong type of obstacle or the wrong size of the obstacle. The loss scenarios that lead to this UCA could be that the data received from DPM are wrong, the ODM algorithm is defective, or simply the output is wrong. The causes may be the limited training data diversity for obstacle classification, ODM algorithm design failures, or programming errors.

4.3. Key Findings from Phase 3

The third phase in this study involves converting the results from Software FMEA and STPA to a BN, as illustrated in Figure 7. The results show that there are common hazards identified from both methods in addition to distinct hazards that could only be identified from one analysis method, either Software FMEA or STPA. Software FMEA focuses more on the internal reliability and potential failures of the software, which can be observed from the failure modes “FM-5: Instable algorithm” and “FM-7: inadequate coverage”, which may result in “unpredictable system reliability” and “obstacles enter safety domain”. The results have implications for software improvement for the obstacle identification module. The detection methods and existing controls are distinct items identified by Software FMEA. These function as safety barriers to reduce the probability of failure modes and mitigate the failures by detection for timely recovery. These safety barriers are not emphasized in STPA, since STPA is a worst-case analysis method [34]. It assumes the safeguards may be insufficient or ineffective for the situation, or not operate as intended. On the other hand, the guidewords for the identification of UCAs in STPA provide a more comprehensive understanding of how the information flow between modules may fail. For instance, “UCA-4: ODM provides obstacle information, but the information is incomplete after an obstacle is detected” and “UCA-5: ODM provides obstacle information, but the data are inconsistent, where an object might be detected in one instance and missed in another” are not identified in Software FMEA. Consequently, Software FMEA and STPA complement each other to provide a more inclusive software risk for safety and reliability improvement. The BN combines insights from both perspectives and offers a good integration of diverse hazard sources. Even though the quantification remains to be addressed in further work, the BN uses probabilistic reasoning, which allows for quantifying uncertainties and dependencies between the various factors identified from both methods. This is particularly valuable in complex software systems, where interactions and dependencies are not always straightforward.

5. Discussion

5.1. Industrial Implications for Software Development Related to Autonomous Ships

5.1.1. Enhancing Hazard Identification in Autonomous Ship Software Development through Software FMEA and STPA Integration

The key findings of this study show the potential of integrating Software FMEA and STPA to provide a more comprehensive approach to hazard identification, which is crucial for risk assessment in software systems for autonomous ships. Software FMEA is recommended by ISO 26262 as one of the main methods to carry out safety-oriented software analysis for autonomous drive (AD) vehicles. ISO 26262 is the functional safety standard for electrical/electronic systems in automobiles and addresses the software requirements for road vehicles [52]. Highlighted by the standard is the importance of a proactive approach in assessing system risks. It emphasizes the crucial role of software in autonomous vehicle safety and integrates strategies to mitigate these risks as a fundamental aspect of system development. A notable limitation of FMEA is inherent in its design, namely, to primarily consider single causes for any given effect. This constraint may lead to an incomplete risk assessment as it does not account for the possibility of multiple concurrent causes leading to a failure. STPA adopts a more holistic view, putting more emphasis on unsafe interactions that could lead to functional failure of the software. In an IMO seminar on the development of a regulatory framework for autonomous ships (2022), Japan reported on their successful application of STPA in autonomous ship development [73]. STPA enhances Software FMEA by offering insights grounded in system theory, control structures, and complex functional interactions. It identifies issues that might escape Software FMEA, enabling a thorough safety analysis. Therefore, industrial application for the proposed framework should be further explored.

5.1.2. Need for Standardization of Software Architecture for Autonomous Ships

It is worth noting that there is no established standard for autonomous navigation software architecture, and various systems may have different software architectures. For instance, the AUTOSEA project (sensor fusion and collision avoidance for autonomous surface vehicles) has presented a concept focusing on a collision avoidance module that includes collision detection, collision avoidance, and guidance. Target tracking is another sub-module providing input for collision detection [74]. In this study, the decomposition of the autonomous navigation software based on GNC control theory was quite time-consuming. This is due to the fact that the existing literature mainly presents examples of past developments where the architectural solutions are often an “aftermath” from the evolution of an existing system. The main issue is that the requirements are difficult to trace with respect to functional components. In the automotive industry, efforts have been focused on developing standard functional software architecture for fully autonomous vehicles such that the development process can be standardized and simplified [75]. Such standardization will allow different systems from various manufacturers to work seamlessly together, improve safety through consistent application of best practices, and ease the process to meet regulatory requirements. Therefore, whether there is a comparable need for standardization for the development of the autonomous navigation software industry requires further discussion.

5.1.3. Risk Assessment for AI-Based Autonomous Systems

The advancement of autonomous ships is becoming increasingly reliant on AI technology. In the case study, the primary purpose of the AI techniques was to fuse the sensor data and classify the obstacles in the environment. As indicated by Thombre et al. [63], deep learning and Gaussian processes represent the state of the art for obstacle classification. Along with the industrial deployment of AI-based autonomous systems, the risk brought by AI techniques is beginning to draw attention. Veitch and Andreas Alsos [76] underpin AI brittleness, represented by “adversarial attack” in computer vision and “tail risk” introduced by low-probability events, which is a new type of risk for autonomous cars. Thombre et al. [63] discussed the requirements for AI software and machine learning functions for sensor technologies for autonomous ships. Their focus, however, is more on suitable sensors and relevant AI techniques for an operational sensor system rather than risk assessment of the software. In the case study, the Software FMEA identified “limited training data diversity” and/or “inability of the algorithm to distinguish between different object types or judge sizes” for the failure mode “incorrect classification”. However, other significant concerns such as incorrect labelling, bias in data handling, choice of machine learning algorithms, etc., also bring risks for safe autonomous ship navigation. While traditional risk assessment methods could identify some associated hazards, there is a need for an enhanced understanding of AI-specific risks. Moreover, there is a need for more developed risk assessment methodologies and frameworks tailored to AI-based systems, along with research into a standardization process in risk assessment for these systems.

5.2. Quantification Based on BN

In the case study, the states of each node are defined; however, obtaining sufficient data samples for the defined nodes is challenging, especially in the field of software development. Consequently, a quantification process was not implemented for the case study, and this is a limitation of our study. Considering that expert-based modelling is also prevalent—particularly for highly complex systems—to establish CPTs, expert judgment will be employed for quantification in further work.

5.3. Limitation and Further Work

The proposed framework combines Software FMEA, STPA and the BN for software risk analysis of autonomous ships and is, therefore, subject to the limitations of these methods. The challenges include the time-consuming nature of the analysis, heavy dependency on the expertise and judgment of analysts, and difficulties in quantification and probability assessment of the constructed BN [16,18,25,77]. AI brittleness is emphasized as a challenge in this study; however, the AI-specific risks have not yet been fully addressed in the framework. The limitations highlight the need for further refinement of the framework towards developing more robust, effective, and comprehensive risk assessment strategies in the rapidly evolving field of software-intensive autonomous systems.

6. Conclusions

The safety and reliability of software-intensive autonomous systems are gaining increasing attention in the autonomous shipping industry. Comprehensive risk assessment is a requirement of various classification societies for demonstrating that autonomous ships have equivalent safety to conventional vessels. The complex nature of software is a challenge for traditional risk assessment, which is often focused on hardware failures and failure mechanisms. In this study, a framework is proposed that integrates Software FMEA, STPA and a BN for risk analysis of software systems in autonomous ships. To illustrate the framework, a case study was carried out to explore the risks associated with the autonomous navigation software system, with a specific focus on the obstacle detection module. By converting the results from Software FMEA and STPA, including failure effects (FE), unsafe control actions (UCAs), error causes (ECs), control flows (CFs), failure causes (FCs), etc., to a BN, an enhanced risk assessment model was developed. The results show that Software FMEA emphasized internal software reliability and potential failures, such as unstable algorithms and inadequate coverage, while STPA offered insights into interactions among modules such as inconsistent or incomplete data flows. The integration of these methods into the BN results in a comprehensive risk analysis framework, combining diverse hazard sources and allowing for the quantification of uncertainties and dependencies in complex software systems. The findings suggest the need for a standards-driven process for the development of software architecture and an enhanced understanding of AI-specific risks, along with the development of tailored risk assessment methodologies. However, the framework’s limitations, including the time-intensive analysis, reliance on expert judgment, and quantification challenges, indicate the need for improvement through further research.

Author Contributions

Conceptualization, X.Y., S.X. and W.Z.; methodology, X.Y. and Y.Z.; validation, X.Y., Y.Z. and X.Z.; formal analysis, X.Y. and T.Z.; investigation, S.X., W.Z. and X.M.; resources, X.Y.; data curation, Y.Z., T.Z. and X.M.; writing—original draft preparation, X.Y. and Y.Z.; writing—review and editing, X.Z. and S.X.; visualization, S.X. and W.Z.; project administration, X.Y.; funding acquisition, X.Y. All authors have read and agreed to the published version of the manuscript.

Funding

This study was supported by the National Natural Science Foundation of China (NSFC) (Grant No. 52201408, No. 52301416) and the Central Guidance on Local Science and Technology Development Fund of Liaoning Province (2023JH6/100100055).

Institutional Review Board Statement

Not applicable.

Informed Consent Statement

Not applicable.

Data Availability Statement

Data are contained within the article.

Acknowledgments

The authors would like to thank the three anonymous reviewers for their valuable input into this paper.

Conflicts of Interest

The authors declare no conflict of interest.

References

  1. Maritime-Executive. Yara Birkeland Begins Further Testing for Autonomous Operations. Available online: https://maritime-executive.com/ (accessed on 10 September 2023).
  2. Oceancrew. China Launches Its First Autonomous Container Ship Service. Available online: https://oceancrew.org/ (accessed on 10 September 2023).
  3. LNGPirme. Hyundai Samho Says H-Line’s New LNG Bulker Features “AI engineer”. Available online: https://lngprime.com (accessed on 10 September 2023).
  4. Jovanovic, I.; Percic, M.; Korican, M.; Vladimir, N.; Fan, A.L. Investigation of the Viability of Unmanned Autonomous Container Ships under Different Carbon Pricing Scenarios. J. Mar. Sci. Eng. 2022, 10, 1991. [Google Scholar] [CrossRef]
  5. Jovanovic, I.; Vladimir, N.; Percic, M.; Korican, M. The feasibility of autonomous low-emission ro-ro passenger shipping in the Adriatic Sea. Ocean Eng. 2022, 247, 110712. [Google Scholar] [CrossRef]
  6. Negenborn, R.R.; Goerlandt, F.; Johansen, T.A.; Slaets, P.; Valdez Banda, O.A.; Vanelslander, T.; Ventikos, N.P. Autonomous ships are on the horizon: Here’s what we need to know. Nature 2023, 615, 30–33. [Google Scholar] [CrossRef] [PubMed]
  7. China Classification Society. Rules for Intelligent Ships 2023; China Classification Society: Beijing, China, 2023. [Google Scholar]
  8. Det Norske Veritas. Autonomous and Remotely Operated Ships; Det Norske Veritas: Oslo, Norway, 2021. [Google Scholar]
  9. American Bureau of Shipping. Autonomous Vessels Whitepaper; American Bureau of Shipping: London, UK, 2022. [Google Scholar]
  10. Korean Register of Shipping. Guidance for Autonomous Ships; Korean Register of Shipping: Busan, Republic of Korea, 2022. [Google Scholar]
  11. Russian Maritime Register of Shipping. Regulations for Classification of Maritime Autonomous and Remotely Controlled Surface Ships; Russian Maritime Register of Shipping: St. Petersburg, Russia, 2020. [Google Scholar]
  12. ClassNK. Guidelines for Automated/Autonomous Operation on ships (Ver.1.0); Nippon Kaiji Kyokai: Tokyo, Japan, 2020. [Google Scholar]
  13. Wróbel, K.; Montewka, J.; Kujala, P. System-theoretic approach to safety of remotely-controlled merchant vessel. Ocean. Eng. 2018, 152, 334–345. [Google Scholar] [CrossRef]
  14. Wróbel, K.; Montewka, J.; Kujala, P. Towards the development of a system-theoretic model for safety assessment of autonomous merchant vessels. Reliab. Eng. Syst. Saf. 2018, 178, 209–224. [Google Scholar] [CrossRef]
  15. Valdez Banda, O.A.; Kannos, S.; Goerlandt, F.; van Gelder, P.H.A.J.M.; Bergström, M.; Kujala, P. A systemic hazard analysis and management process for the concept design phase of an autonomous vessel. Reliab. Eng. Syst. Saf. 2019, 191, 106584. [Google Scholar] [CrossRef]
  16. Johansen, T.; Blindheim, S.; Torben, T.R.; Utne, I.B.; Johansen, T.A.; Sørensen, A.J. Development and testing of a risk-based control system for autonomous ships. Reliab. Eng. Syst. Saf. 2023, 234, 109195. [Google Scholar] [CrossRef]
  17. Basnet, S.; BahooToroody, A.; Chaal, M.; Lahtinen, J.; Bolbot, V.; Banda, O.A.V. Risk analysis methodology using STPA-based Bayesian network- applied to remote pilotage operation. Ocean Eng. 2023, 270, 113569. [Google Scholar] [CrossRef]
  18. Carreras Guzman, N.H.; Zhang, J.; Xie, J.; Glomsrud, J.A. A comparative study of STPA-Extension and the UFoI-E method for safety and security co-analysis. Reliab. Eng. Syst. Saf. 2021, 211, 107633. [Google Scholar] [CrossRef]
  19. Zhang, D.; Han, Z.P.; Zhang, K.; Zhang, J.F.; Zhang, M.Y.; Zhang, F. Use of hybrid causal logic method for preliminary hazard analysis of maritime autonomous surface ships. J. Mar. Sci. Eng. 2022, 10, 725. [Google Scholar] [CrossRef]
  20. Tusher, H.M.; Munim, Z.H.; Notteboom, T.E.; Kim, T.-E.; Nazir, S. Cyber security risk assessment in autonomous shipping. Marit. Econ. Logist. 2022, 24, 208–227. [Google Scholar] [CrossRef]
  21. Zhang, W.J.; Zhang, Y.J. Navigation risk assessment of autonomous ships based on Entropy-TOPSIS-Coupling Coordination Model. J. Mar. Sci. Eng. 2023, 11, 422. [Google Scholar] [CrossRef]
  22. Kretschmann, L.; Rødseth, Ø.; Fuller, B.S.; Noble, H.; Horahan, J.; McDowell, H. D9.3: Quantitative Assessment Maritime Unmanned Navigation through Intelligence in Networks; European Commissions: Hamburg, Germany, 2015. [Google Scholar]
  23. Kretschmann, L.; Rødseth, Ø.; Tjora, Å.; Fuller, B.S.; Noble, H.; Horahan, J. D9.2: Qualitative Assessment Maritime Unmanned Navigation through Intelligence in Networks; European Commissions: Hamburg, Germany, 2015. [Google Scholar]
  24. Thieme, C.A.; Utne, I.B.; Haugen, S. Assessing ship risk model applicability to Marine Autonomous Surface Ships. Ocean Eng. 2018, 165, 140–154. [Google Scholar] [CrossRef]
  25. Zhou, X.Y.; Liu, Z.J.; Wang, F.W. Towards applicability evaluation of hazard analysis methods for autonomous ships. Ocean Eng. 2020, 214, 107773. [Google Scholar] [CrossRef]
  26. Thieme, C.A.; Mosleh, A.; Utne, I.B.; Hegde, J. Incorporating software failure in risk analysis––Part 2: Risk modeling process and case study. Reliab. Eng. Syst. Saf. 2020, 198, 106804. [Google Scholar] [CrossRef]
  27. Chang, C.-H.; Kontovas, C.; Yu, Q.; Yang, Z. Risk assessment of the operations of maritime autonomous surface ships. Reliab. Eng. Syst. Saf. 2021, 207, 107324. [Google Scholar] [CrossRef]
  28. Yang, R.C.; Utne, I.B. Towards an online risk model for autonomous marine systems (AMS). Ocean Eng. 2022, 251, 111100. [Google Scholar] [CrossRef]
  29. AIID. AI Incident Database. Available online: https://incidentdatabase.ai/ (accessed on 11 September 2023).
  30. National Transportation Safety Board. Accident Report-Collision Between Volvo XC90 and Pedestrian; National Transportation Safety Board: Washington, DC, USA, 2019. [Google Scholar]
  31. National Transportation Safety Board. Rear-End Collision Between a Car Operating with Advanced Driver Assistance Systems and a Stationary Fire Truck; National Transportation Safety Board: Washington, DC, USA, 2018. [Google Scholar]
  32. Chaal, M.; Ren, X.; BahooToroody, A.; Basnet, S.; Bolbot, V.; Banda, O.A.V.; Gelder, P.V. Research on risk, safety, and reliability of autonomous ships: A bibliometric review. Saf. Sci. 2023, 167, 106256. [Google Scholar] [CrossRef]
  33. IEC60812; Failure Modes and Effects Analysis (FMEA and FMECA). International Electrotechnical Commission: Geneva, Switzerland, 2018; p. 170.
  34. Leveson, N.; Thomas, J. STPA Handbook; The MIT Press: Cambridge, MA, USA, 2018. [Google Scholar]
  35. Pearl, J. Probabilistic Reasoning in Intelligent Systems: Networks of Plausible Inference; Morgan Kaufmann: Cambridge, MA, USA, 1988. [Google Scholar]
  36. Neapolitan, R.E. Learning Bayesian Networks; Pearson Prentice Hall: Upper Saddle River, NJ, USA, 2004; Volume 38. [Google Scholar]
  37. Heckerman, D. A Tutorial on Learning with Bayesian Networks. Available online: https://arxiv.org/ (accessed on 9 October 2023).
  38. Xu, S.; Kim, E.; Haugen, S.; Zhang, M. A Bayesian network risk model for predicting ship besetting in ice during convoy operations along the Northern Sea Route. Reliab. Eng. Syst. Saf. 2022, 223, 108475. [Google Scholar] [CrossRef]
  39. Kayiran, B.; Yazir, D.; Aslan, B. Data-driven Bayesian network approach to maritime accidents involved by dry bulk carriers in Turkish search and rescue areas. Reg. Stud. Mar. Sci. 2023, 67, 103193. [Google Scholar] [CrossRef]
  40. Khan, B.; Khan, F.; Veitch, B. A Dynamic Bayesian Network model for ship-ice collision risk in the Arctic waters. Saf. Sci. 2020, 130, 104858. [Google Scholar] [CrossRef]
  41. Kabir, S.; Papadopoulos, Y. Applications of Bayesian networks and Petri nets in safety, reliability, and risk assessments: A review. Saf. Sci. 2019, 115, 154–175. [Google Scholar] [CrossRef]
  42. Baksh, A.; Abbassi, R.; Garaniya, V.; Khan, F. Marine transportation risk assessment using Bayesian Network: Application to Arctic waters. Ocean. Eng. 2018, 159, 422–436. [Google Scholar] [CrossRef]
  43. Chen, C.; Liu, X.; Chen, H.H.; Li, M.; Zhao, L. A Rear-End Collision Risk Evaluation and Control Scheme Using a Bayesian Network Model. IEEE Trans. Intell. Transp. Syst. 2019, 20, 264–284. [Google Scholar] [CrossRef]
  44. Han, Z.; Zhang, D.; Fan, L.; Zhang, J.; Zhang, M. A Dynamic Bayesian Network model to evaluate the availability of machinery systems in Maritime Autonomous Surface Ships. Accid. Anal. Prev. 2024, 194, 107342. [Google Scholar] [CrossRef] [PubMed]
  45. BahooToroody, A.; Abaei, M.M.; Valdez Banda, O.; Montewka, J.; Kujala, P. On reliability assessment of ship machinery system in different autonomy degree; A Bayesian-based approach. Ocean. Eng. 2022, 254, 111252. [Google Scholar] [CrossRef]
  46. Guo, C.; Utne, I.B. Development of risk indicators for losing navigational control of autonomous ships. Ocean Eng. 2022, 266, 113204. [Google Scholar] [CrossRef]
  47. Fan, S.Q.; Zhang, J.F.; Blanco-Davis, E.; Yang, Z.L.; Yan, X.P. Maritime accident prevention strategy formulation from a human factor perspective using Bayesian Networks and TOPSIS. Ocean Eng. 2020, 210, 107544. [Google Scholar] [CrossRef]
  48. Zhang, J.F.; Teixeira, A.P.; Soares, C.G.; Yan, X.P.; Liu, K.Z. Maritime transportation risk assessment of Tianjin Port with Bayesian Belief networks. Risk Anal. 2016, 36, 1171–1187. [Google Scholar] [CrossRef]
  49. Qiao, W.; Huang, E.; Guo, H.; Lian, C.; Chen, H.; Ma, X. On the causation analysis for hazards involved in the engine room fire-fighting system by integrating STPA and BN. Ocean Eng. 2023, 288, 116073. [Google Scholar] [CrossRef]
  50. Jensen, F.V.; Jensen, F.V. Causal and Bayesian networks. In Bayesian Networks and Decision Graphs; Springer: New York, NY, USA, 2001; pp. 3–34. [Google Scholar]
  51. Khakzad, N.; Khan, F.; Amyotte, P. Safety analysis in process facilities: Comparison of fault tree and Bayesian network approaches. Reliab. Eng. Syst. Saf. 2011, 96, 925–932. [Google Scholar] [CrossRef]
  52. ISO 26262-2:2018(E); Road Vehicles—Functional Safety—Part 2: Management of Functional Safety. 2nd ed. ISO: Geneva, Switzerland, 2018.
  53. Sulaman, S.M.; Beer, A.; Felderer, M.; Höst, M. Comparison of the FMEA and STPA safety analysis methods–a case study. Softw. Qual. J. 2019, 27, 349–387. [Google Scholar] [CrossRef]
  54. Sullivan, K.J.; Griswold, W.G.; Cai, Y.; Hallen, B. The structure and value of modularity in software design. SIGSOFT Softw. Eng. Notes 2001, 26, 99–108. [Google Scholar] [CrossRef]
  55. Fossen, T.I. Handbook of Marine Craft Hydrodynamics and Motion Control; John Wiley & Sons: Hoboken, NJ, USA, 2011. [Google Scholar]
  56. Öztürk, Ü.; Akdağ, M.; Ayabakan, T. A review of path planning algorithms in maritime autonomous surface ships: Navigation safety perspective. Ocean. Eng. 2022, 251, 111010. [Google Scholar] [CrossRef]
  57. Lou, M.M.; Yang, X.F.; Xiang, Z.R.; Wang, Q.; Hu, J.B. Dynamic route planning method based on deep reinforcement learning and velocity obstacle. In Proceedings of the IEEE 12th DDCLS, Xiangtan, China, 12–14 May 2023; pp. 627–632. [Google Scholar]
  58. Yu, H.; Fang, Z.; Fu, X.; Liu, J.; Chen, J. Literature review on emission control-based ship voyage optimization. Transp. Res. Part D Transp. Environ. 2021, 93, 102768. [Google Scholar] [CrossRef]
  59. Hu, S.N.; Tian, S.P.; Zhao, J.S.; Shen, R.Q. Path planning of an unmanned surface vessel based on the improved A-Star and dynamic window method. J. Mar. Sci. Eng. 2023, 11, 1060. [Google Scholar] [CrossRef]
  60. Hinostroza, M.A.; Lekkas, A.M. A rudimentarymission planning system for marine autonomous surface ships. IFAC-Pap 2022, 55, 196–203. [Google Scholar]
  61. Hagen, I.B.; Kufoalor, D.K.M.; Brekke, E.F.; Johansen, T.A. MPC-based collision avoidance strategy for existing marine vessel guidance systems. In Proceedings of the ICRA, Brisbane, Australia, 21–25 May 2018; pp. 7618–7623. [Google Scholar]
  62. Sarhadi, P.; Naeem, W.; Athanasopoulos, N. A survey of recent machine learning solutions for ship collision avoidance and mission planning. In Proceedings of the 14th IFAC CAMS, Kongens Lyngby, Denmark, 14–16 September 2022; pp. 257–268. [Google Scholar]
  63. Thombre, S.; Zhao, Z.; Ramm-Schmidt, H.; García, J.M.V.; Malkamäki, T.; Nikolskiy, S.; Hammarberg, T.; Nuortie, H.; Bhuiyan, M.Z.H.; Särkkä, S.; et al. Sensors and AI techniques for situational awareness in autonomous ships: A review. IEEE Trans. Intell. Transp. Syst. 2022, 23, 64–83. [Google Scholar] [CrossRef]
  64. Zou, Z.X.; Chen, K.Y.; Shi, Z.W.; Guo, Y.H.; Ye, J.P. Object detection in 20 years: A survey. Proc. IEEE 2023, 111, 257–276. [Google Scholar] [CrossRef]
  65. Yoo, Y.; Lee, J.-S. Evaluation of ship collision risk assessments using environmental stress and collision risk models. Ocean. Eng. 2019, 191, 106527. [Google Scholar] [CrossRef]
  66. Elkins, L.; Sellers, D.; Monach, W.R. The Autonomous Maritime Navigation (AMN) project: Field tests, autonomous and cooperative behaviors, data fusion, sensors, and vehicles. J. Field Rob. 2010, 27, 790–818. [Google Scholar] [CrossRef]
  67. Lu, Y.; Xi, Z.; Lien, J.M. Conservative Collision Prediction among Polygons with Unknown Motion; Technical ReportG-MU-CS-TR-2013-4; George Mason University: Fairfax, VA, USA, 2013. [Google Scholar]
  68. Lin, J.F.; Han, Y.; Guo, C.Y.; Su, Y.M.; Zhong, R.F. Intelligent ship anti-rolling control system based on a deep deterministic policy gradient algorithm and the Magnus effect. Phys. Fluids 2022, 34, 057102. [Google Scholar] [CrossRef]
  69. Fang, W.; Ming, L.; Feng, X. Design and implementation of a triple-redundant dynamic positioning control system for deepwater drilling rigs. Appl. Ocean Res. 2016, 57, 140–151. [Google Scholar]
  70. Wang, L.; Wu, Q.; Liu, J.L.; Li, S.J.; Negenborn, R.R. State-of-the-art research on motion control of maritime autonomous surface ships. J. Mar. Sci. Eng. 2019, 7, 438. [Google Scholar] [CrossRef]
  71. Neufelder, A.M. Effective Application of Software Failure Modes Effects Analysis; Quanterion Solutions, Incorporated: Utica, NY, USA, 2017. [Google Scholar]
  72. Wang, B.; Ng, P.H.; Elhadidi, B.M.N.A.K.; Ang, H.S.; Moon, S.K. Failure analysis and finite element simulation for structural systems in an unmanned aerial vehicle. In Proceedings of the 2019 16th International Conference on Ubiquitous Robots (UR), Jeju, Republic of Korea, 24–27 June 2019; pp. 636–640. [Google Scholar]
  73. Ando, H. Development and Demonstration of Autonomous Ships in Japan; IMO: New York, NY, USA, 2022. [Google Scholar]
  74. Brekke, E.F.; Wilthil, E.F.; Eriksen, B.O.H.; Kufoalor, D.K.M.; Helgesen, Ø.K.; Hagen, I.B.; Breivik, M.; Johansen, T.A. The Autosea project: Developing closed-loop target tracking and collision avoidance systems. J. Phys. Conf. Ser. 2019, 1357, 012020. [Google Scholar] [CrossRef]
  75. Serban, A.C.; Poll, E.; Visser, J. A standard driven software architecture for fully autonomous vehicles. In Proceedings of the IEEE ICSA-C, Seattle, DC, USA, 30 April–4 May 2018; pp. 120–127. [Google Scholar]
  76. Veitch, E.; Andreas Alsos, O. A systematic review of human-AI interaction in autonomous ship systems. Saf. Sci. 2022, 152, 105778. [Google Scholar] [CrossRef]
  77. Chaal, M.; Bahootoroody, A.; Basnet, S.; Valdez Banda, O.A.; Goerlandt, F. Towards system-theoretic risk assessment for future ships: A framework for selecting risk control options. Ocean Eng. 2022, 259, 111797. [Google Scholar] [CrossRef]
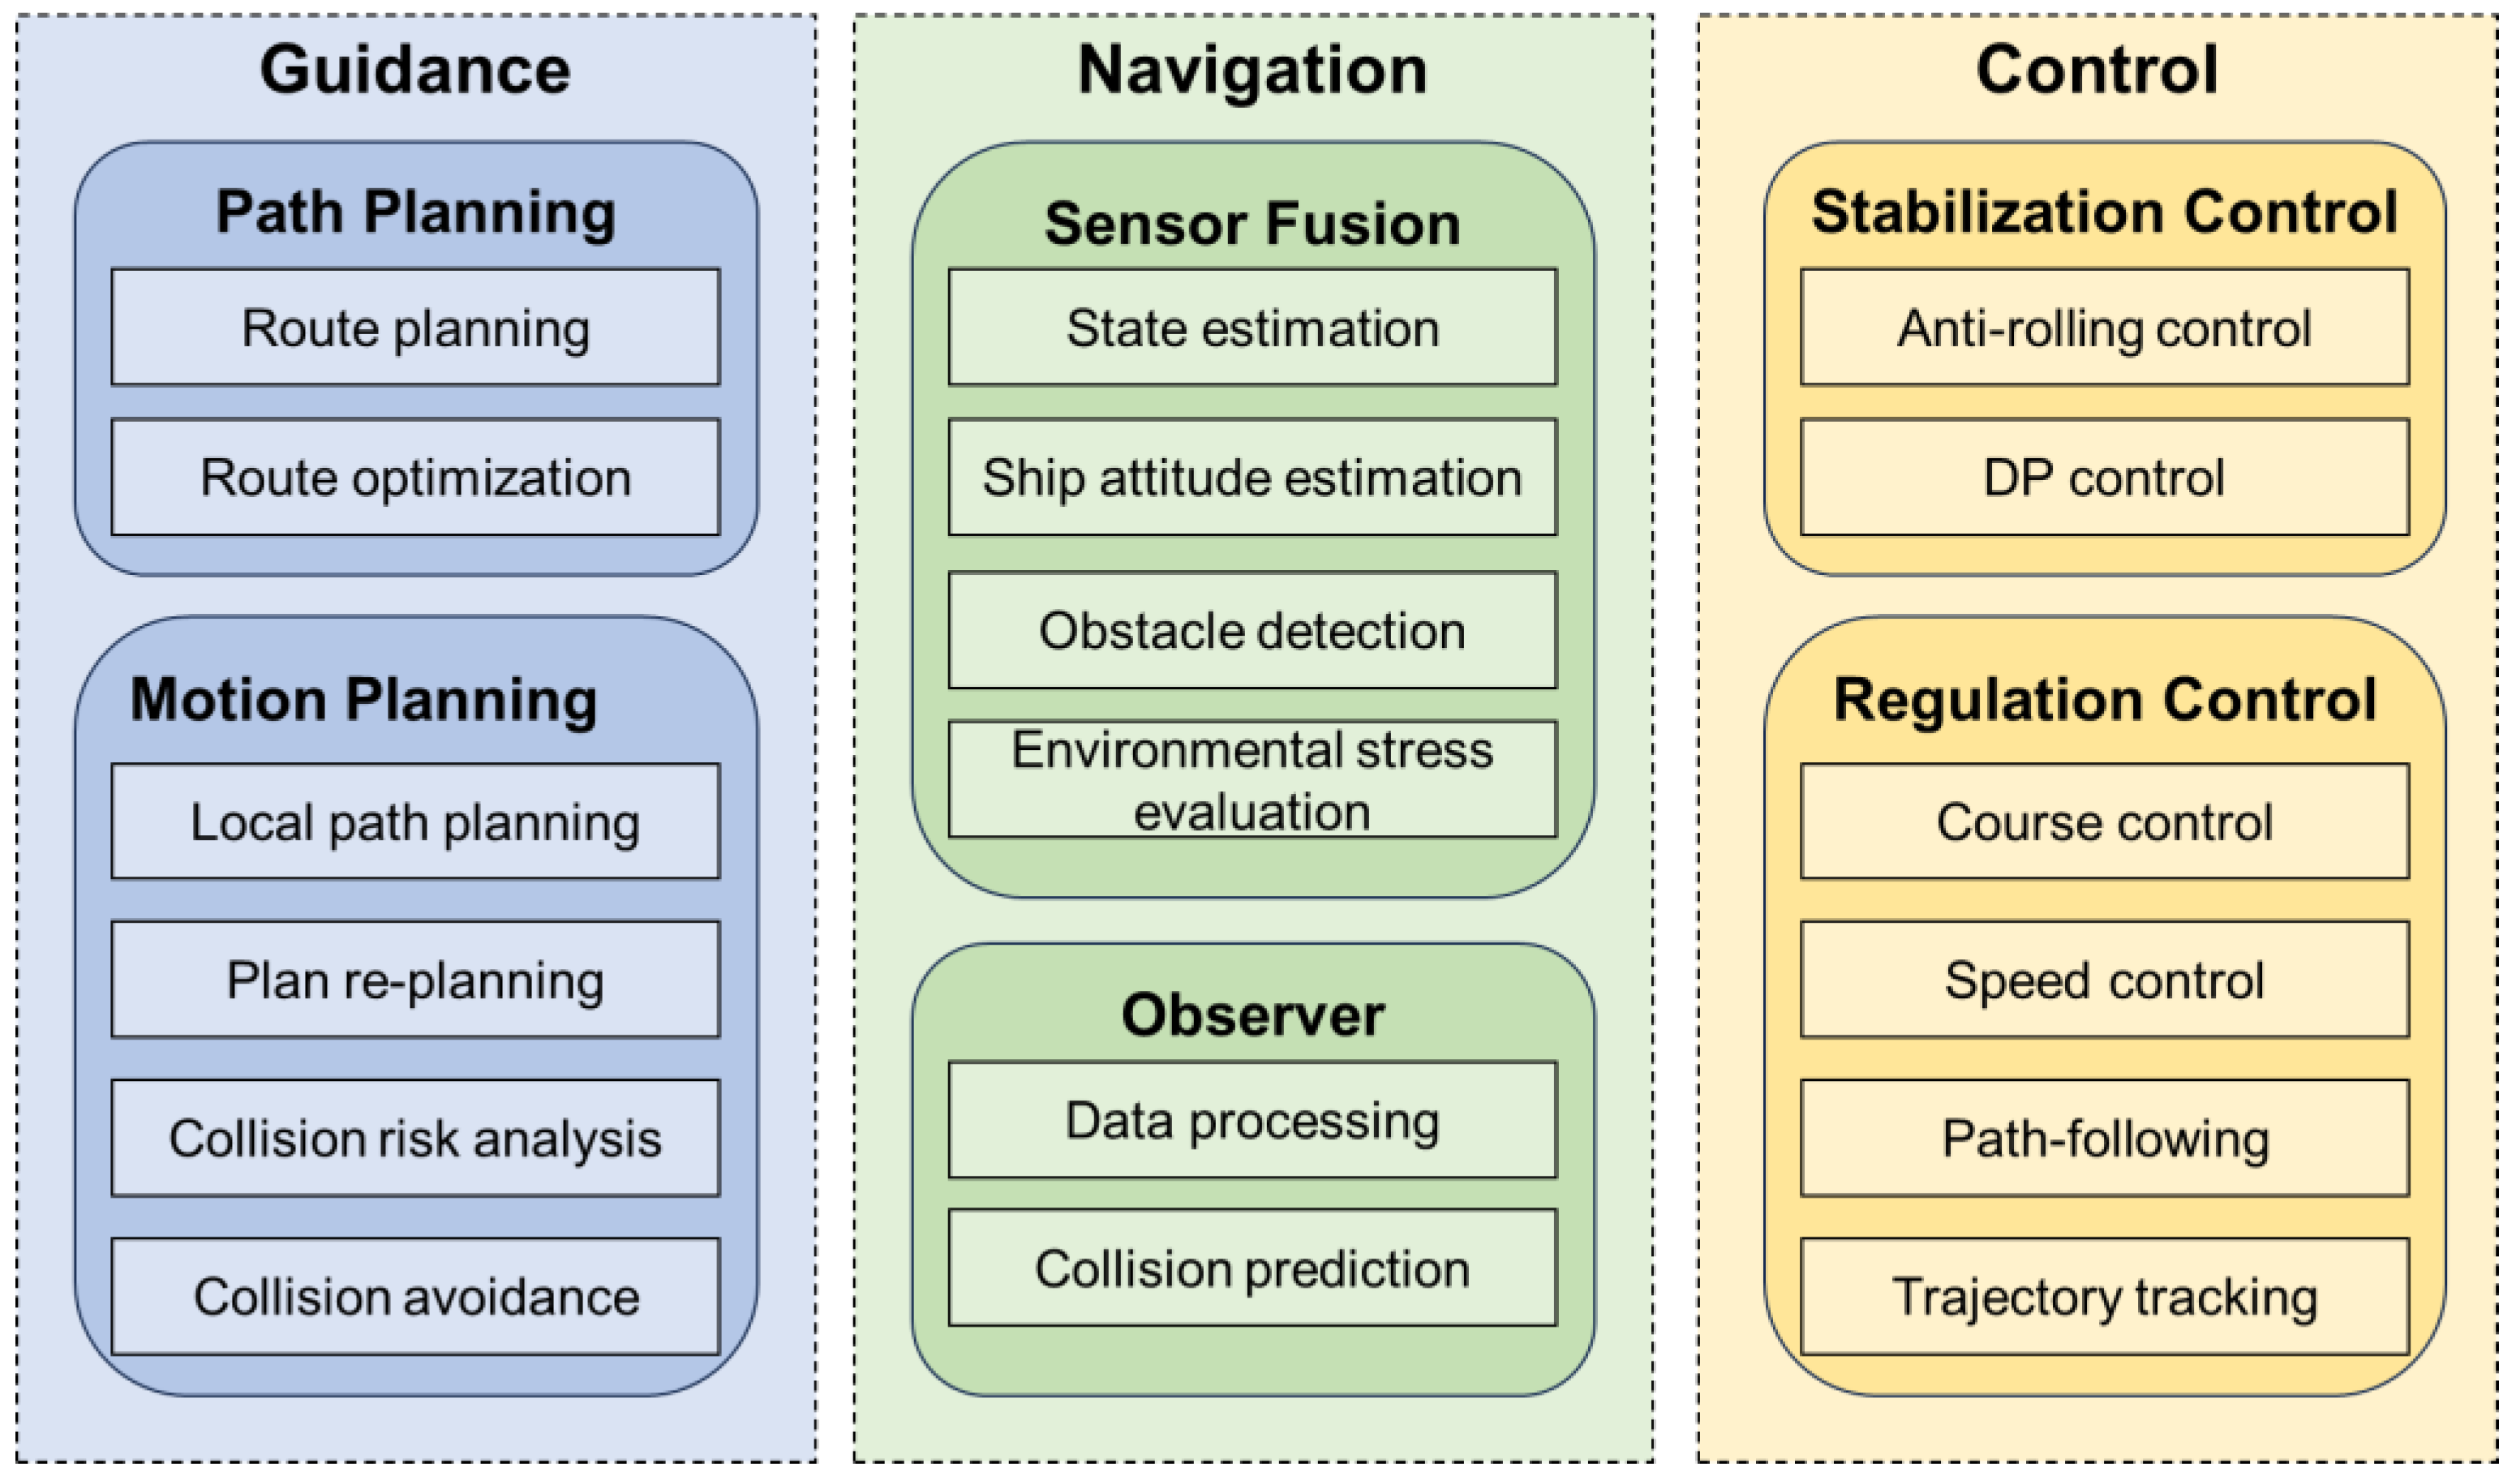
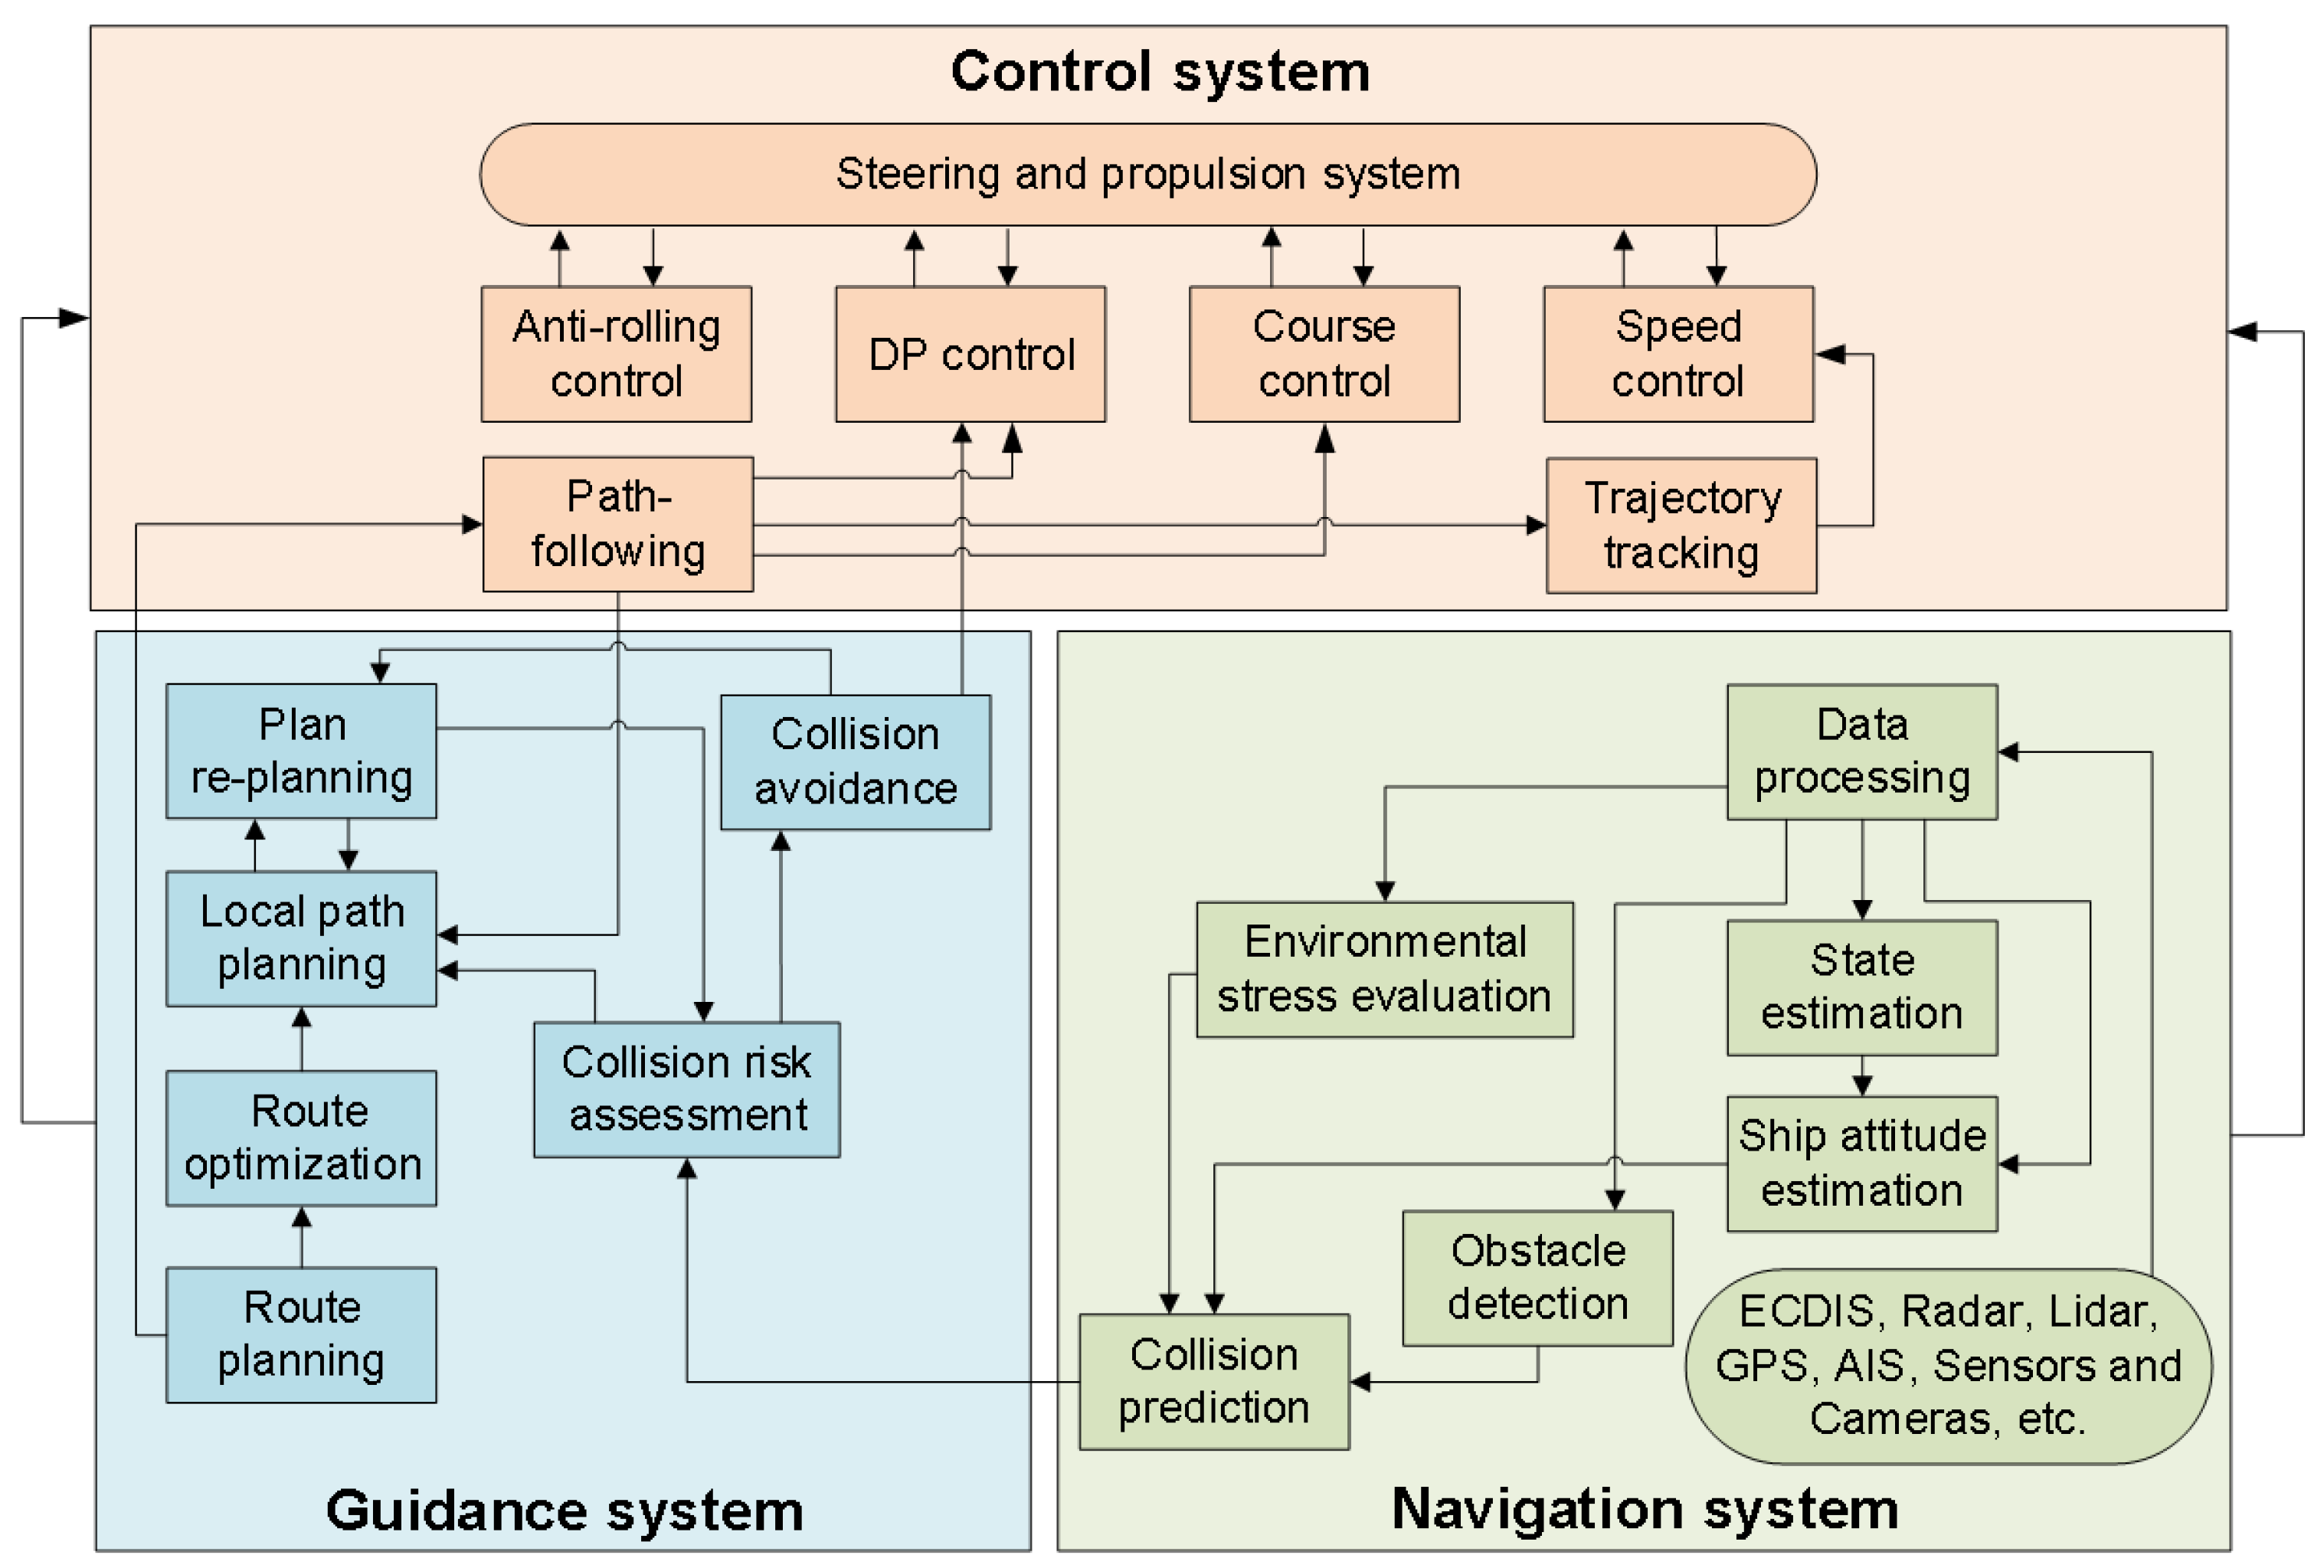
Figure 1. General software failure model for a component software unit [33].
Jmse 12 00004 g001
Figure 2. Overview of the STPA method [34].
Jmse 12 00004 g002
Figure 3. Overview of phases and steps in the proposed framework.
Jmse 12 00004 g003
Figure 4. The hierarchical structure of Software FEMA- and STPA-based BNs in this study.
Jmse 12 00004 g004
Figure 5. Guidance, navigation, and control modules and sub-modules for an ANSS.
Jmse 12 00004 g005
Figure 6. The control structure of the autonomous navigation system.
Jmse 12 00004 g006
Figure 7. Bayesian network model constructed based on the results from Software FMEA and STPA.
Jmse 12 00004 g007
Table 1. Decomposition of an autonomous navigation software system.
SystemModuleSub-ModuleDescriptionRef.
Guidance
Module
Path planningRoute planningThe task of route planning is to plan a collision-free route from the starting point to the target point.[57]
Route optimizationFor route optimization, different route alternatives are compared in the process of identifying the route that meets the optimization goals.[58]
Motion planningLocal path planning/re-planningDynamic (online) adjustment or re-planning of intermediate waypoints during path tracking of pre-planned routes.[59]
Collision risk analysisBy establishing an effective and systematic model to monitor parameter status, collision risk can be continuously evaluated, which can serve as the basis for collision prevention models and provide input for navigation safety and autonomous navigation.[60]
Collision avoidanceAbility to modify planned paths or trajectories to avoid dynamic obstacles and make safe and reliable decisions in dangerous situations.[61,62]
Navigation
Module
Sensor fusionState estimation
(position, speed, etc.)
Obtaining own ship’s state information, including position, speed, etc.[56]
Ship attitude estimationObtaining own ship’s attitude information.[56]
Obstacle detectionDetect and classify obstacles within the range of ship sensors and can be used in conjunction with cameras, AIS, LiDAR, and sound sensors in terms of type, position, speed, heading, etc.[63,64]
Environmental stress evaluationEvaluation based on the maneuvering environment and traffic environment, etc.[65]
ObserverData processing (data fusion)Process data obtained from cameras, AIS, radar, LiDAR, AIS, GPS, etc., and attempt to average the redundant and possibly conflicting data with their inherent errors to construct a best-perceived truth of the environment.[63,66]
Collision predictionPredicting obstacle collisions with unknown trajectories.[67]
Control
Module
Stabilization controlAnti-rolling controlShip anti-rolling control achieves a wide range of ship speeds and efficient anti-rolling capabilities. In particular, effectively reducing the rolling motions of ships to improve their seakeeping performance.[68]
Dynamic positioning (DP)
control
The DP system enables ships to maintain their position and advance solely through thrusters in the presence of wind, current, and wave interference.[69]
Regulation controlCourse controlWhen the ship needs to avoid other ships or obstacles while sailing on a predetermined route, or navigating within a limited channel, it is necessary to change the speed and course in time, which is the ship course mobility.[70]
Speed controlSpeed control is mainly to control the rotation speed of the propeller, which can be adjusted arbitrarily in a certain range.[70]
Path-followingPath-following is geometric position tracking without considering time.[70]
Trajectory trackingIn addition to following the path, trajectory tracking requires the system to arrive at a specified location at a specified time.[70]
Table 2. Likelihood of the existence of failure modes [71].
LevelLikelihood of OccurrenceAffected Software DesignPast HistoryDomain Expertise
3HighVery complex or problematicHas happened in every past system or is known to be presentNo experience with this feature or product
2ModerateAverage complexityHas happened at least once in the pastSome experience with this feature or product
1LowVery simple, not problematicHas not happened in the past and there is no reason to believe it will happen on this systemSignificant experience with this feature or product
Table 3. Severity of failure modes [72].
LevelSeveritySeverity Level Description
5Very highA failure that may cause system loss.
4HighA failure that may cause major system damage resulting in loss of the mission.
3ModerateA failure that may cause minor system damage resulting in a delay, loss of availability, or mission degradation.
2LowA failure that is not serious enough to cause system damage but will result in unscheduled maintenance.
1Very lowNo impact on the system.
Table 4. Detectability for each failure mode [71].
LevelLikelihoodDetection Level Description
5ImprobableThe failure mode cannot be reproduced in a development or test environment.
4Low probabilityThe failure model is visible and detectable only with fault injection.
3Moderate probabilityThe failure mode is visible and detectable with off-nominal testing.
2High probabilityThe failure mode is visible and detectable with requirements-based testing.
1Almost certainThe failure mode is visible and detectable under any set of conditions.
Table 5. Software FMEA analysis of an obstacle detection module.
No.Failure Mode Local EffectFailure EffectDetection Method/Existing ControlsFailure CauseSODRPN
1False negative
(Missed detection)
Missed obstacles in immediate vicinityObstacles enter safety domain unnoticedRegular calibration of sensors
Algorithm testing in varied conditions in the simulations
Sensitivity adjustment
Generation of sufficient test cases which reflect environmental characteristics
Sensor malfunction
Inadequate sensor range
Poor sensitivity of the algorithm
Low visibility due to fog or heavy rain, etc.
Confusion with textured background
42216
2False positive
(False detection)
Unnecessary navigational adjustmentsReduced operational efficiency
Increased risk of inappropriate manoeuvres
Enhance accuracy of data fusion algorithms to corroborate multiple sensors and data sources
Generation of sufficient test cases which reflect environmental characteristics
Sensor noises
Misinterpretation of environmental features (e.g., waves, reflections, birds, etc) as obstacles
Over-sensitive algorithm
Confusion with textured background
1224
3Incorrect
classification
Erroneous identification of the type or size of an obstacleIncreased probability of obstacles enters safety domain
Inappropriate navigational responses
Increase diversity of training dataset
Algorithm testing in varied conditions in the simulations
Generation of sufficient test cases which reflect environmental characteristics
Limited training data diversity
Inability of the algorithm to distinguish between different object types or judge sizes
43224
4Latency issuesDelayed response to detected obstaclesObstacles enter safety domain without notice
Reduced time for decision-making and action
Optimization of algorithms
Upgrading hardware if latency issue is too severe
Processing delays
Inefficient algorithm design
Hardware constraints
23212
5Instable algorithmInconsistent obstacle detectionUnpredictable system reliability
Increased need for manual intervention
Comprehensive software testing
Regular updates and maintenance of sensors
Software bugs
Fluctuating sensor performance
Fast-changing environmental conditions
2316
6Degraded performance in adverse conditionsReduced detection effectiveness in specific conditionsLowered system reliability in diverse environmentImplementation of adaptive algorithms
Simulation testing in various environmental conditions
Poor visibility
Extreme weather
High sea clutter
23212
7Inadequate coverageMissed detections in certain areasObstacles enter safety domain unnoticedStrategic placement of sensors, and regular adjustment in case of misplacement
Test for algorithm’s coverage
Sensor blind spots
Limited scope of algorithms
32318
Table 6. Lists of safety constraints for preventing system-level hazards.
IDSystem-Level Safety ConstraintsSystem-Level Hazards
SC1Ensure a safe distance is maintained from other vessels.H1
SC2In the event of another vessel entering the safety domain, predict its trajectory, replan the plan, and execute collision avoidance actions.H1
SC3Keep a safe distance from static obstacles like islands and oil platforms.H2
SC4Should a static obstacle enter the safety zone, replan the path, and undertake collision avoidance actions.H2
Table 7. The unsafe control actions.
Control
Action
Type of UCAUCAsLoss ScenariosCausal Factors
Obstacle informationNot providedUCA-1: ODM does not provide obstacle information when the obstacle is in the immediate vicinity.LS-1: ODM does not receive processed operational data.
  • Communication failures
  • DPM algorithm errors
  • Sensor failures or malfunctions
LS-2: ODM receives but does not handle the processed operational data.
  • The guard for misprocessing is wrongly on
LS-3: ODM receives the processed operational data, and ODM handled the data but does not provide output.
  • ODM algorithm errors
ProvideUCA-2: ODM provides information indicating there is an obstacle in immediate vicinity when there actually is not.LS-4: The processed operational data received from DPM are wrong.
  • Communication failures
  • Poor data quality from sensors (e.g., due to sensor malfunctions or environmental issues affecting sensor performance)
  • DPM algorithm errors (e.g., data fusion)
LS-5: The processed operational data are provided, but the ODM algorithm is wrong.
  • ODM algorithm design failure
  • Programming errors
LS-6: The obstacle detection and classification algorithm are implemented correctly, but the output is wrong.
  • Programming errors
UCA-3: ODM provides obstacle information, but the information is wrong after obstacle detection (e.g., wrong type of obstacles).LS-7: The processed operational data received from DPM are wrong.
  • Communication failures
  • Poor data quality from sensors (e.g., due to sensor malfunctions or environmental issues affecting sensor performance)
  • DPM algorithm errors (e.g., data fusion)
LS-8: The processed operational data are provided, but the classification algorithm is wrong.
  • Limited training data diversity
  • ODM algorithm design failure
  • Programming errors
LS-9: The obstacle detection and classification algorithm are implemented correctly, but the output is wrong.
  • Programming errors
UCA-4: ODM provides obstacle information, but the information is incomplete after an obstacle is detected.LS-10: The processed operational data received from DPM are incomplete.
  • Communication failures
  • Incomplete data received from sensors (e.g., due to sensor malfunctions or environmental issues affecting sensor performance
  • DPM algorithm errors
LS-11: The processed operational data received from DPM are complete, but the ODM algorithm is wrong.
  • ODM algorithm design failure
  • Programming errors
LS-12: The ODM algorithm is correct, but the provided output is incomplete.
  • Programming errors
Obstacle informationProvideUCA-5: ODM provides obstacle information, but the data are inconsistent, where an object might be detected in one instance and missed in another.LS-13: The processed operational data received from DPM are inconsistent.
  • Intermittent sensor connectivity
  • Degraded sensor performance due to varying environmental conditions
  • DPM algorithm inability to deal with navigational dynamics
LS-14: The operational data received from DPM are consistent, but the ODM algorithm is wrong.
  • ODM algorithm design failure
  • Programming errors
LS-15: The ODM algorithm is correct, but the provided output is inconsistent.
  • Programming errors
Too early, too late, out of orderUCA-6: ODM sends out obstacle information too late.LS-16: The processed operational data are received from DPM too late.
  • DPM algorithm processing time is too long
LS-17: The operational data received from DPM are timely, but the ODM algorithm processing time is too long.
  • ODM algorithm design failure
  • Programming errors
LS-18: The ODM algorithm is correct, but the output is provided too late.
  • Programming errors
Stop too soon, applied too longUCA-7: ODM provides obstacle information for too long a time without updating upon new obstacles entering into view.LS-19: The operational data received from DPM are not updated.
  • Sensor malfunction
  • Degraded sensor performance due to varying environmental conditions
  • DPM algorithm fails to respond to updates
LS-20: The operational data received form DPM are updated, but the buffer for ODM processing is not refreshed.
  • Programming errors
LS-21: The ODM algorithm provides updated obstacle information, but the buffer for output is not refreshed.
  • Programming errors
Table 8. The description of nodes in constructed BN.
TypeNodesStatesTypeNodesStates
LossL-1: Causality or injury of seafarers onboardYes/NoLossL-2: Loss or damage of the shipYes/No
LossL-3: Damage to environmentYes/NoFailure Effect /HazardFE-1/FE-4/FE-6/FE-11/H-1/H-2: Obstacles enter safety domainYes/No
Failure EffectFE-2: Reduced operational efficiencyYes/NoFailure EffectFE-3: Increased risk of inappropriate manoeuvresYes/No
Failure EffectFE-5: Inappropriate navigation-al responsesYes/NoFailure EffectFE-7: Reduced time for decision-making and actionYes/No
Failure EffectFE-8: Unpredictable system reliabilityYes/NoFailure EffectFE-9: Increased need for manual interventionYes/No
Failure EffectFE-10: Lowered system reliability in diverse environmentsYes/NoFailure Mode /UCAFM-1/UCA-1/UCA-5: ODM misses detections when obstacles are in the immediate vicinityYes/No
Failure Mode /UCAFM-2/FM-3/UCA-2/UCA-3: ODM falsely detects obstacles when they are in the immediate vicinityYes/NoFailure Mode /UCAFM-4/UCA-6: ODM provides required obstacle information too late while an obstacle has entered the safety domain alreadyYes/No
Failure ModeFM-5: Instable algorithmYes/NoFailure ModeFM-6: Degraded performance in adverse conditionsYes/No
Failure ModeFM-7: Inadequate coverageYes/NoUCAUCA-4: ODM provides obstacle information, but the information is incomplete after an obstacle is detectedIncomplete/Complete
UCAUCA-7: ODM provides obstacle information for too short a time before the updates such that DPM does not have enough time to recognize the obstacleToo short/NormalLoss ScenarioLS-16: The processed operational data are received from DPM too lateToo late/Normal
Loss ScenarioLS-17: The operational data received from DPM are timely, but ODM algorithm processing time is too longToo long/NormalLoss ScenarioLS-18: The ODM algorithm is correct, but the output is provided too lateToo late/Normal
Loss ScenarioLS-19: The operational data received from DPM are not updatedUpdated/Not updatedLoss ScenarioLS-20: The operational data received form DPM are updated, but the buffer for ODM processing is not refreshedNot refreshed/Refreshed
Loss ScenarioLS-21: The ODM algorithm provides updated obstacle information, but the buffer for output is not refreshedNot refreshed/RefreshedDetection MethodDM-1: Comprehensive software testingNot exist/ Exist
Detection MethodDM-2: Simulation testing in various environmental conditionsNot exist/ExistDetection MethodDM-3: Test for the algorithm’s coverageNot exist/ Exist
Existing ControlEC-1: Optimization of algorithmsNot exist/ExistExisting ControlEC-2: Upgrading hardware if latency issue is too severeNot exist/ Exist
Existing ControlEC-3: Regular updates and maintenance of sensorsNot exist/ExistExisting ControlEC-4: Implementation of adaptive algorithmsNot exist/ Exist
Existing ControlEC-5: Strategic placement of sensors, and regular adjustment in case of misplacementNot exist/ExistFailure Cause/ Causal factorFC/CF: Algorithm designInappropriate/Appropriate
Failure Cause& Causal FactorFC/CF: Sensor performanceBad/GoodFailure CauseFC: Software bugsBugs/No bugs
Failure CauseFC: Fast-changing environmental conditionsFast/NormalFailure CauseFC: Poor visibilityPoor/Normal
Failure CauseFC: High sea clutterHigh/NormalFailure CauseFC: Extreme weatherExtreme/Normal
Failure CauseFC: Processing delaysDelay/NormalFailure CauseFC: Hardware constraintsConstraints/No constraints
Failure CauseFC: Hardware constraintsConstraints/No constraintsCausal factorCF: Algorithm processing timeToo long/Normal
Causal factorCF: ProgrammingIncorrect/Correct
Disclaimer/Publisher’s Note: The statements, opinions and data contained in all publications are solely those of the individual author(s) and contributor(s) and not of MDPI and/or the editor(s). MDPI and/or the editor(s) disclaim responsibility for any injury to people or property resulting from any ideas, methods, instructions or products referred to in the content.

