
A Novel Data-Driven Prediction Framework for Ship Navigation Accidents in the Arctic Region


Abstract
:1. Introduction
- (1)
- Development of a specialized dataset for Arctic navigation accident prediction, encompassing detailed historical data on accident information, such as dates, locations, accident types, involved ship types, meteorological data, and sea ice conditions. This dataset enriches research with practical data. The dataset also incorporates non-accident information to mitigate potential data biases. It provides a holistic view of the variables affecting Arctic navigation, thereby deepening our comprehension of its complexities.
- (2)
- The construction of an optimized accident risk prediction model tailored for the Arctic designed to enhance precision and generalization capabilities. Through meticulous optimization and parameter adjustments, the model stands to improve accident risk prediction and assessment.
- (3)
- Provision of technical support for decision making in the realm of Arctic maritime safety management and risk mitigation. The insights offer substantial aid to ship operators and regulatory bodies, informing their strategies and actions.
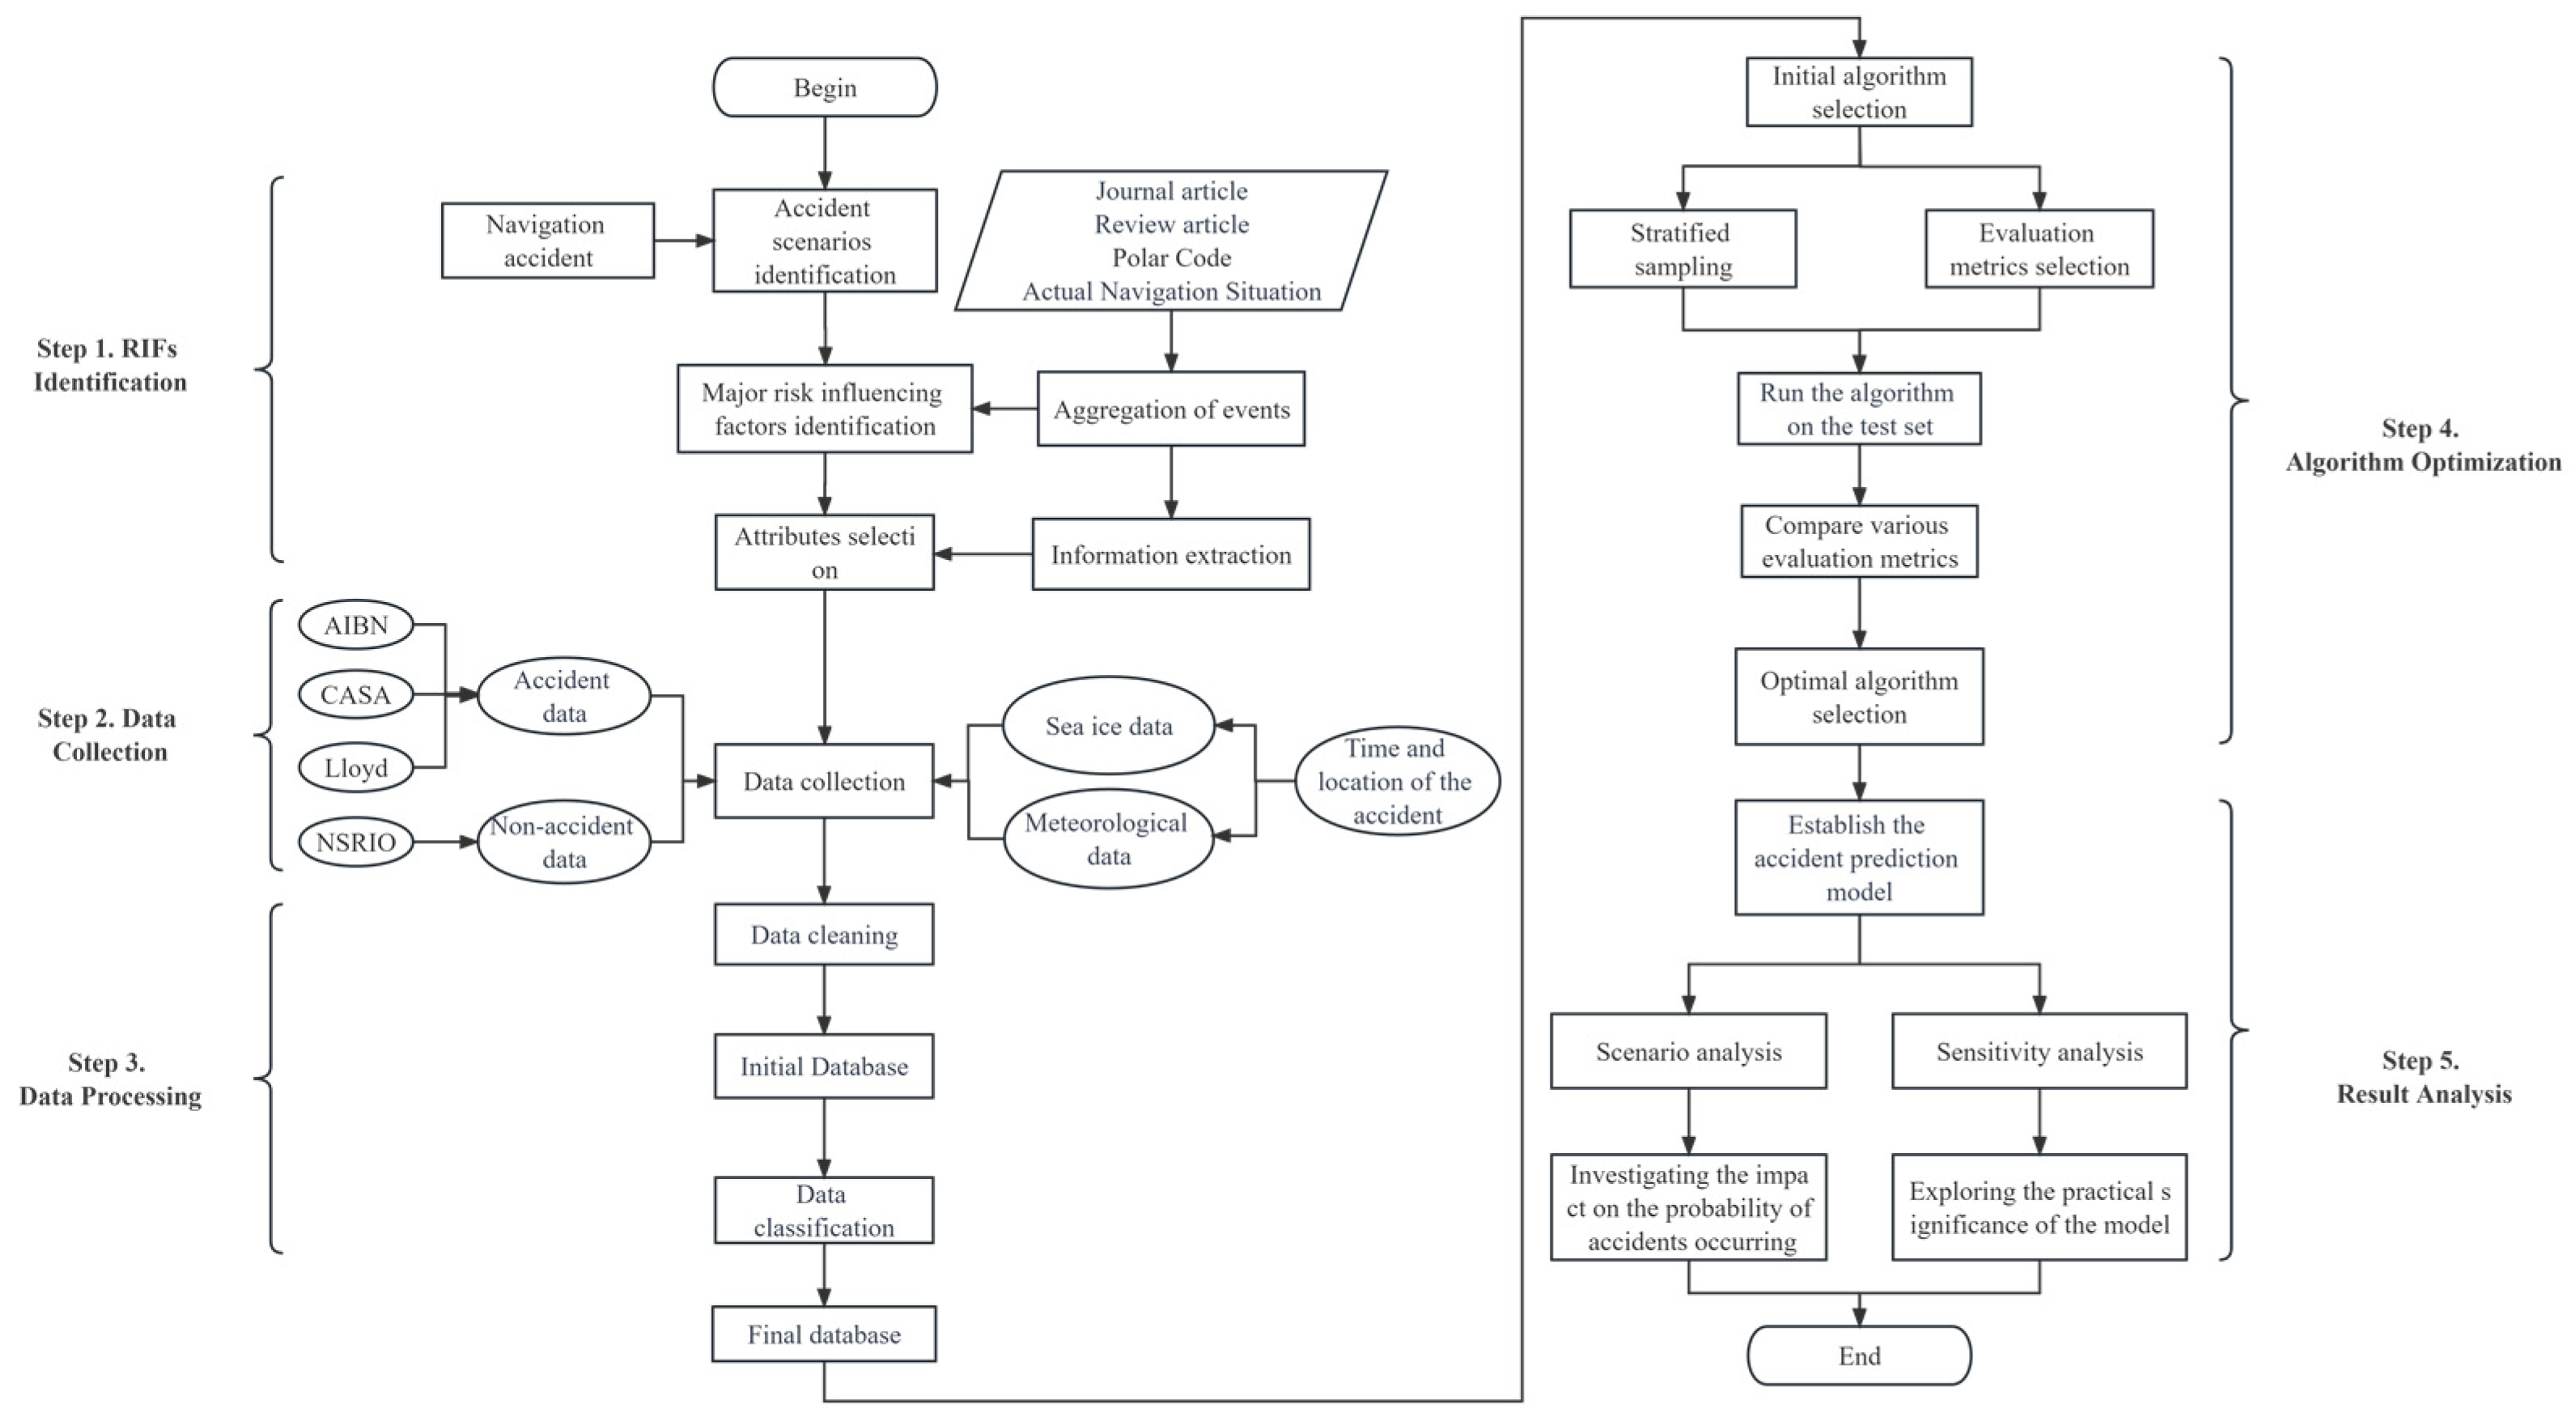
2. The Research Framework
- Step 1. RIFs identification
- Step 2. Data collection
- Step 3. Data processing
- Step 4. Selected algorithms and evaluation criteria
- (1)
- Tree-Augmented Naive (TAN) Bayesian Classification
- (2)
- K2 algorithm
- (3)
- Random Forest (RF)
- (4)
- Support Vector Machine (SVM)
- Step 5. Result analysis
3. Optimal Algorithm Selection
4. Results
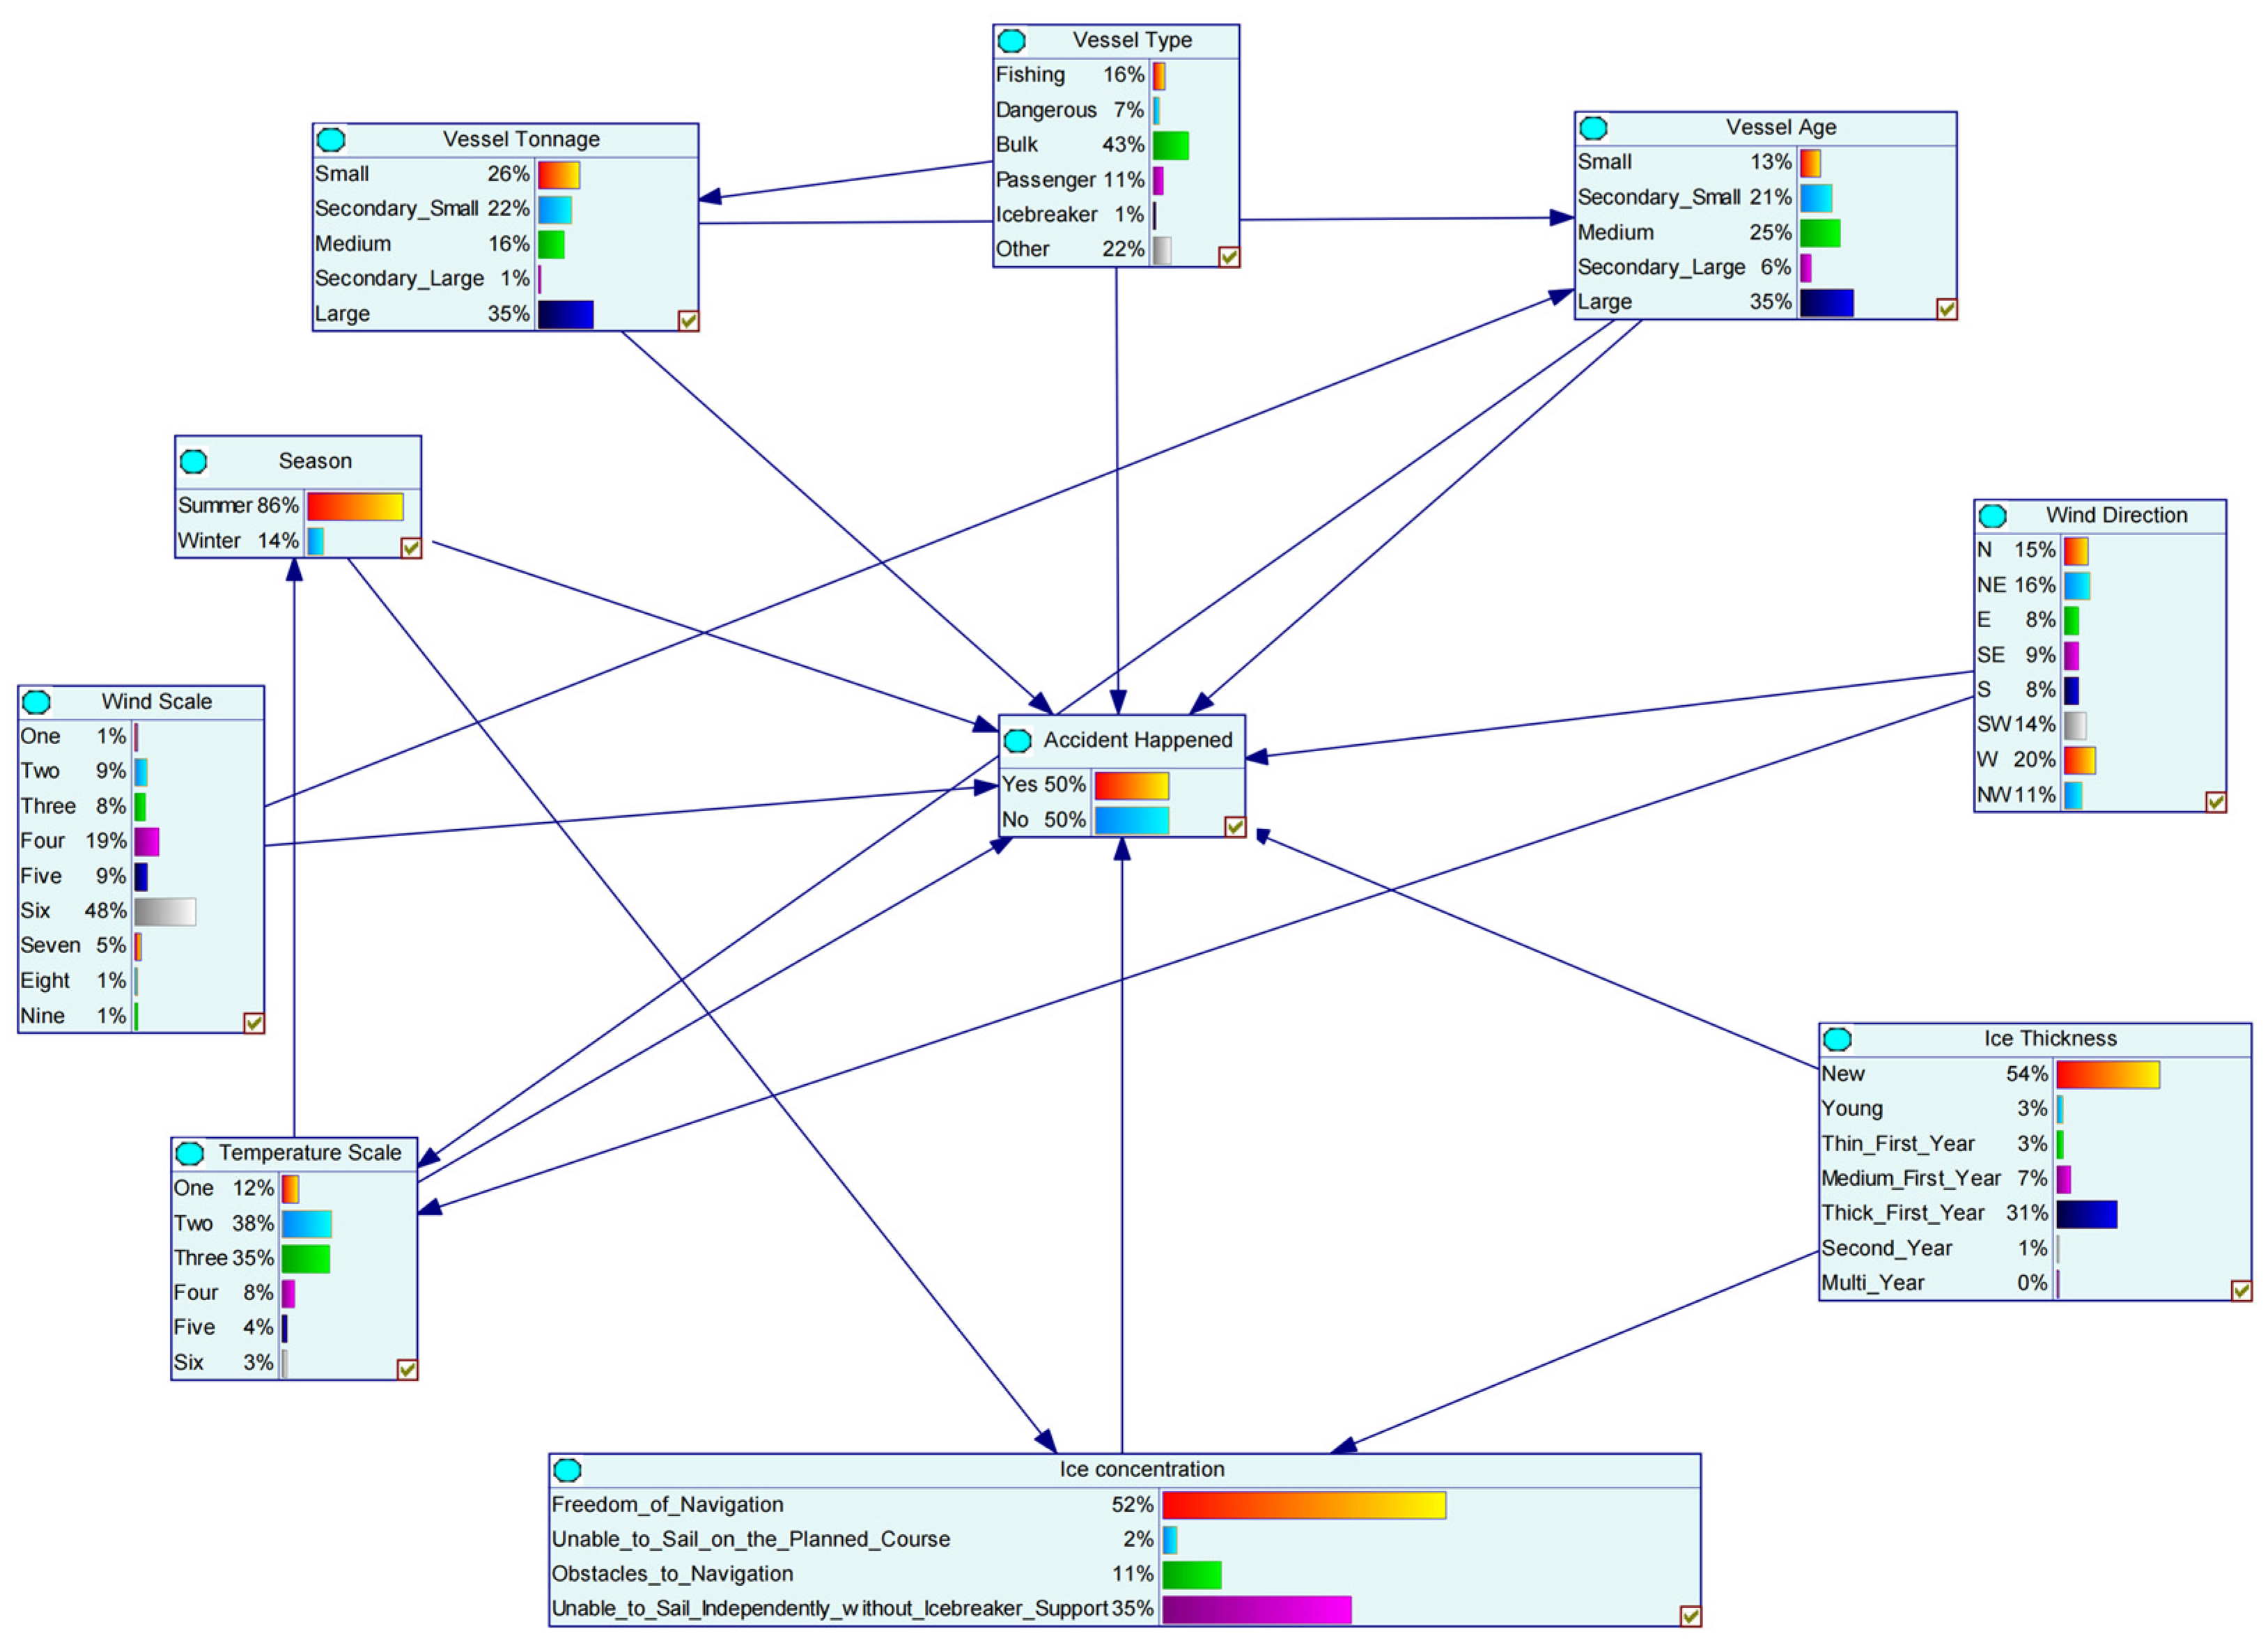
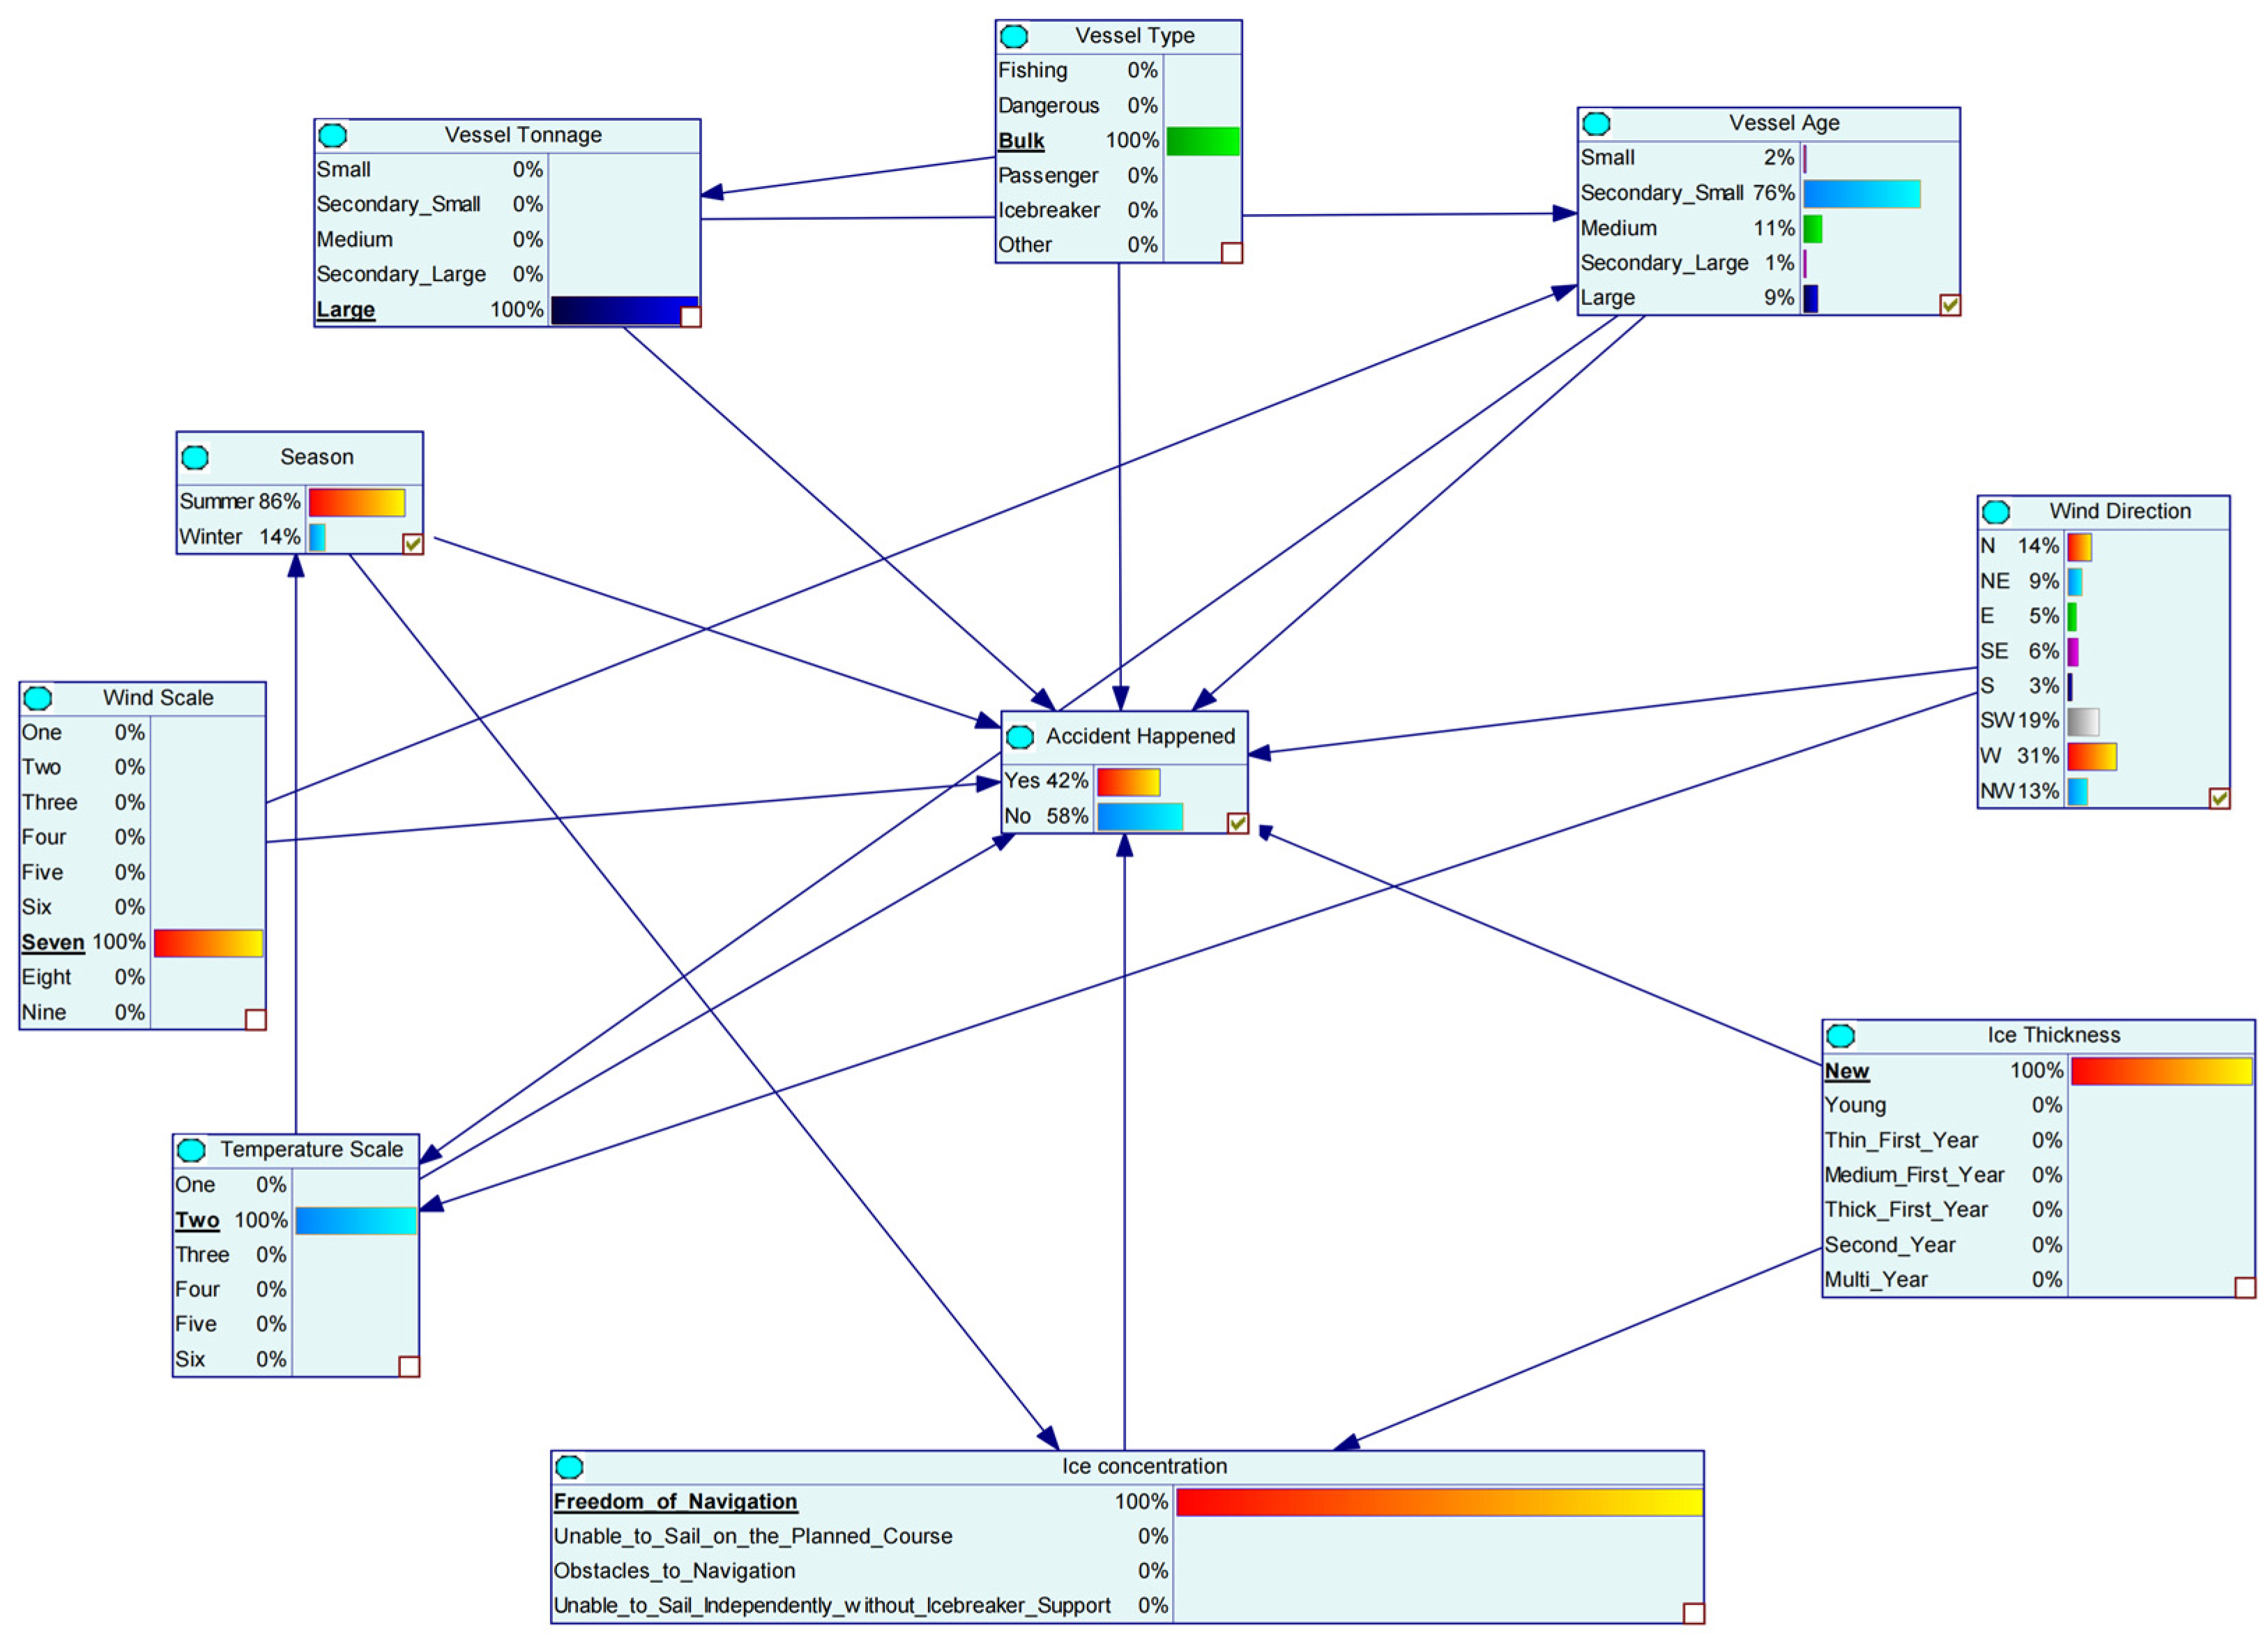
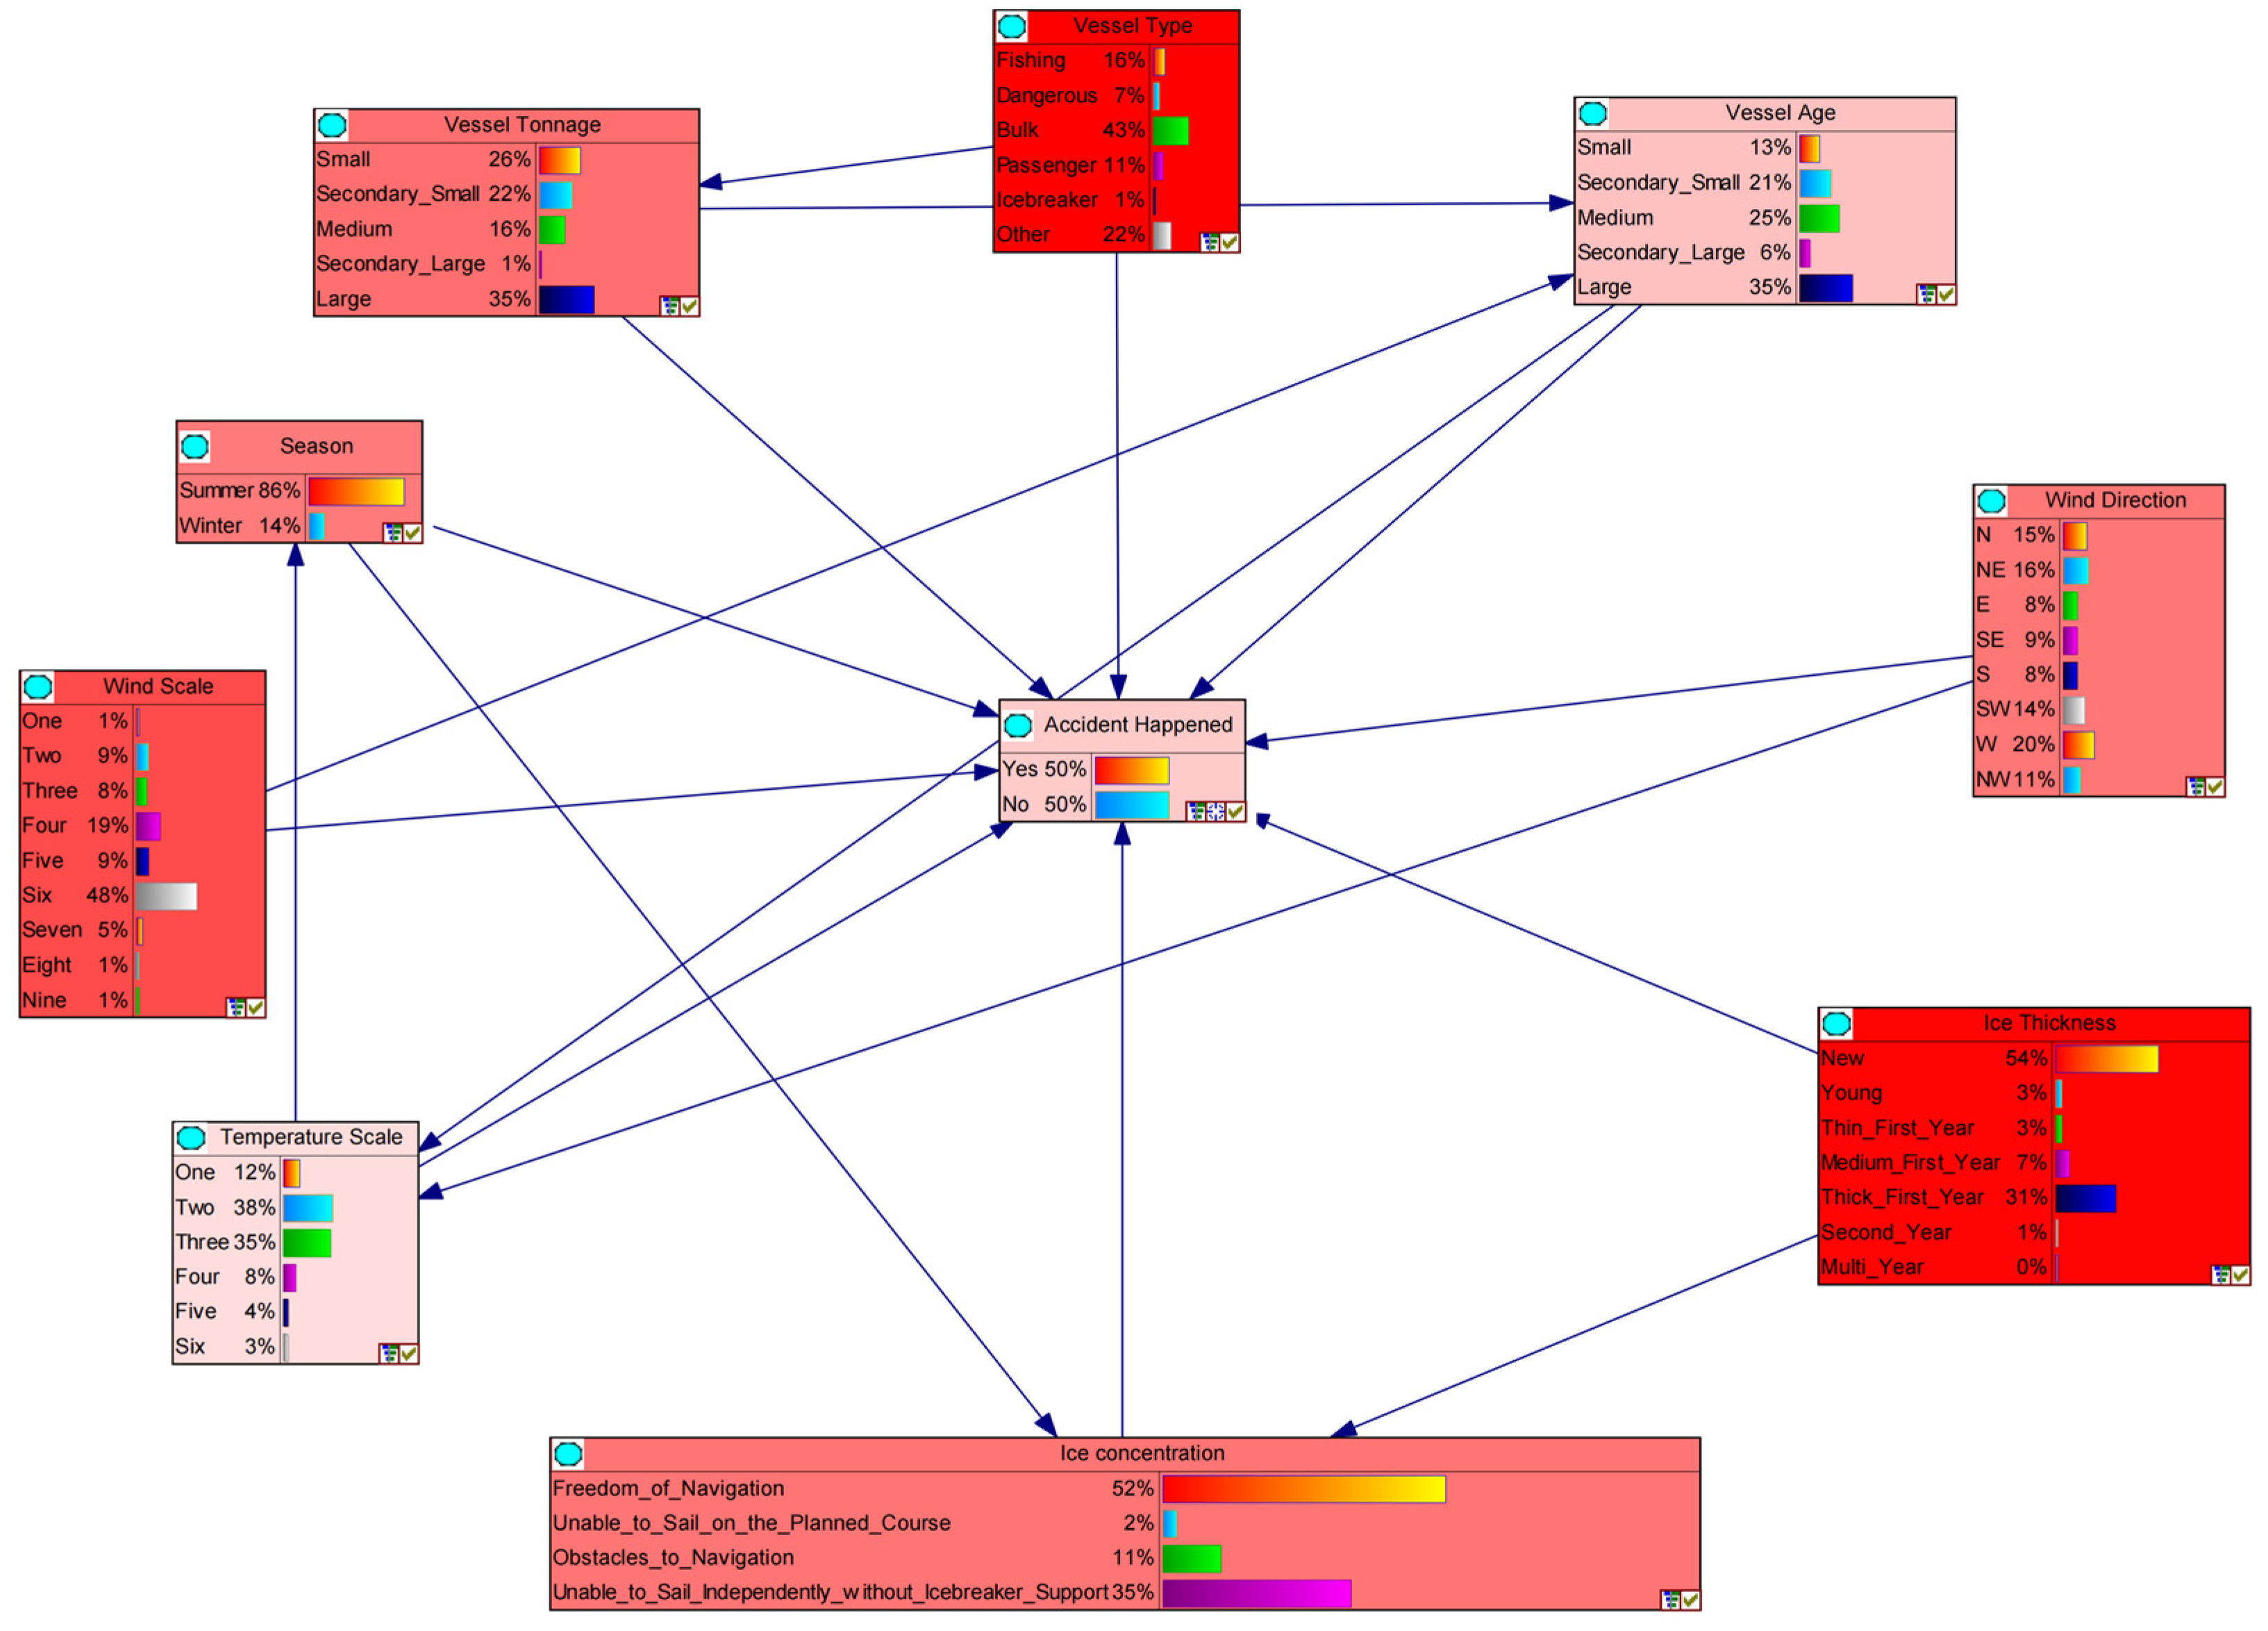
4.1. Scenario Analysis
4.1.1. Scenario One: Ice-Free Conditions
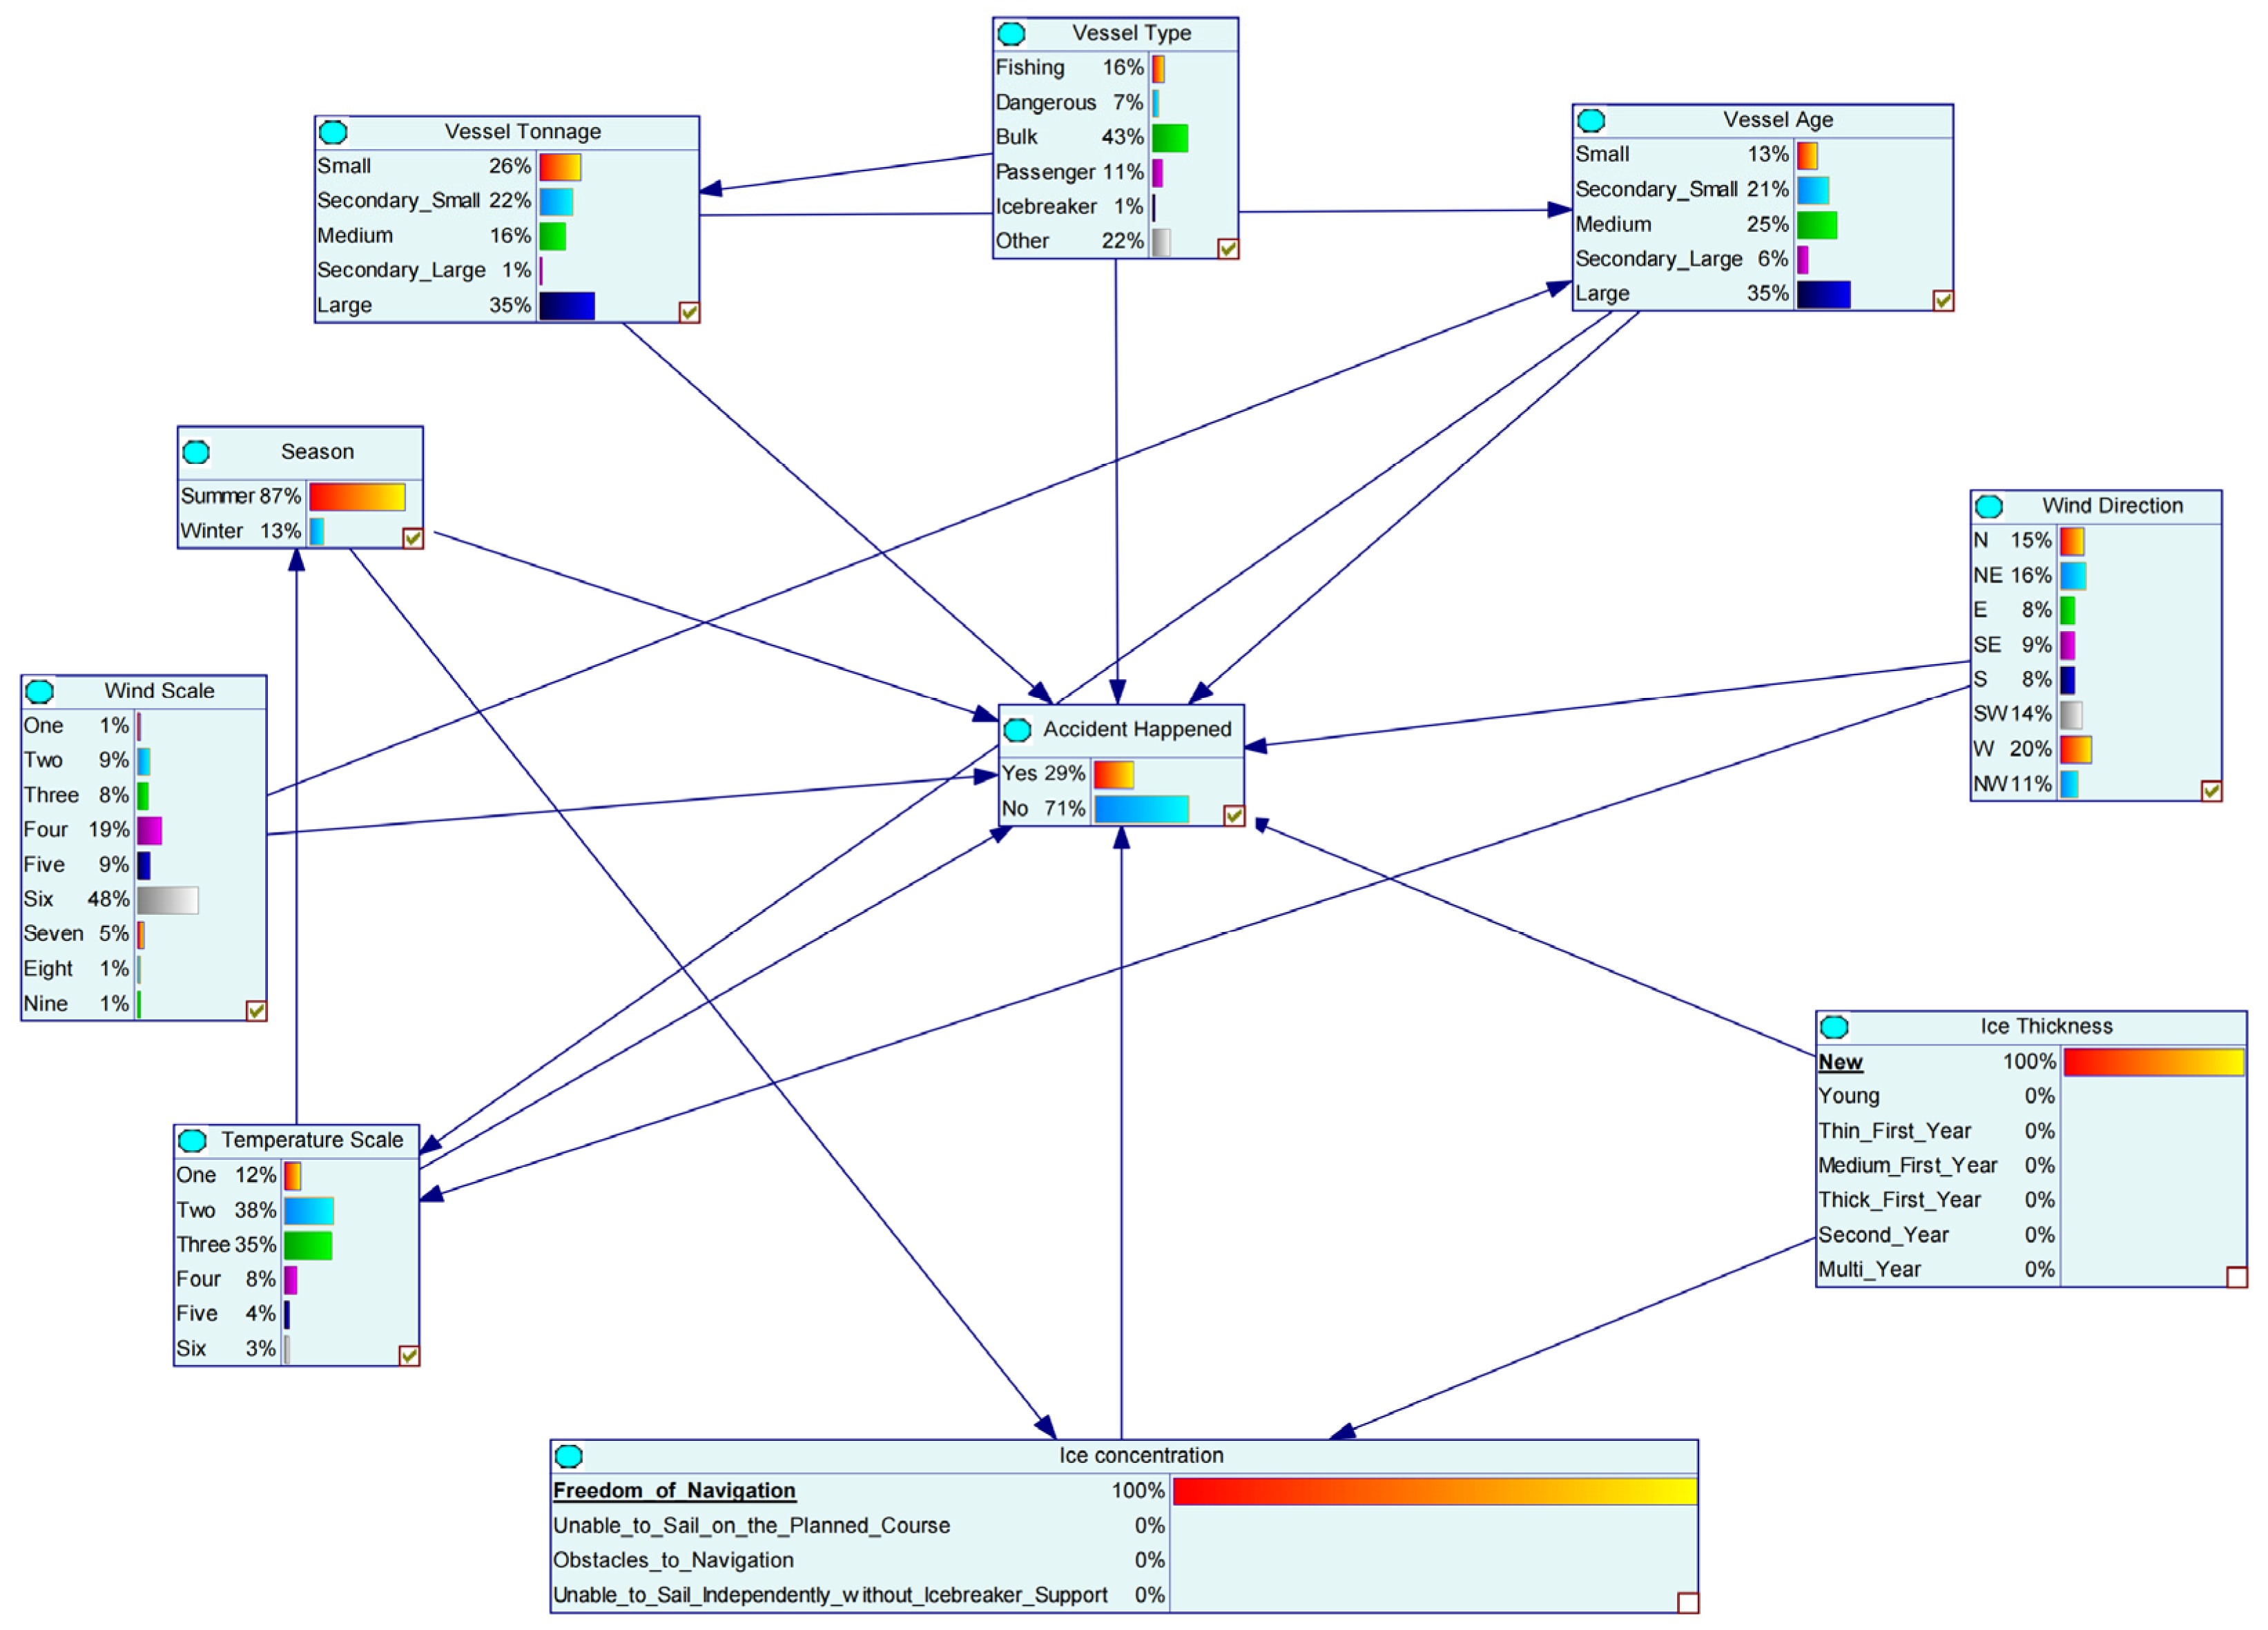
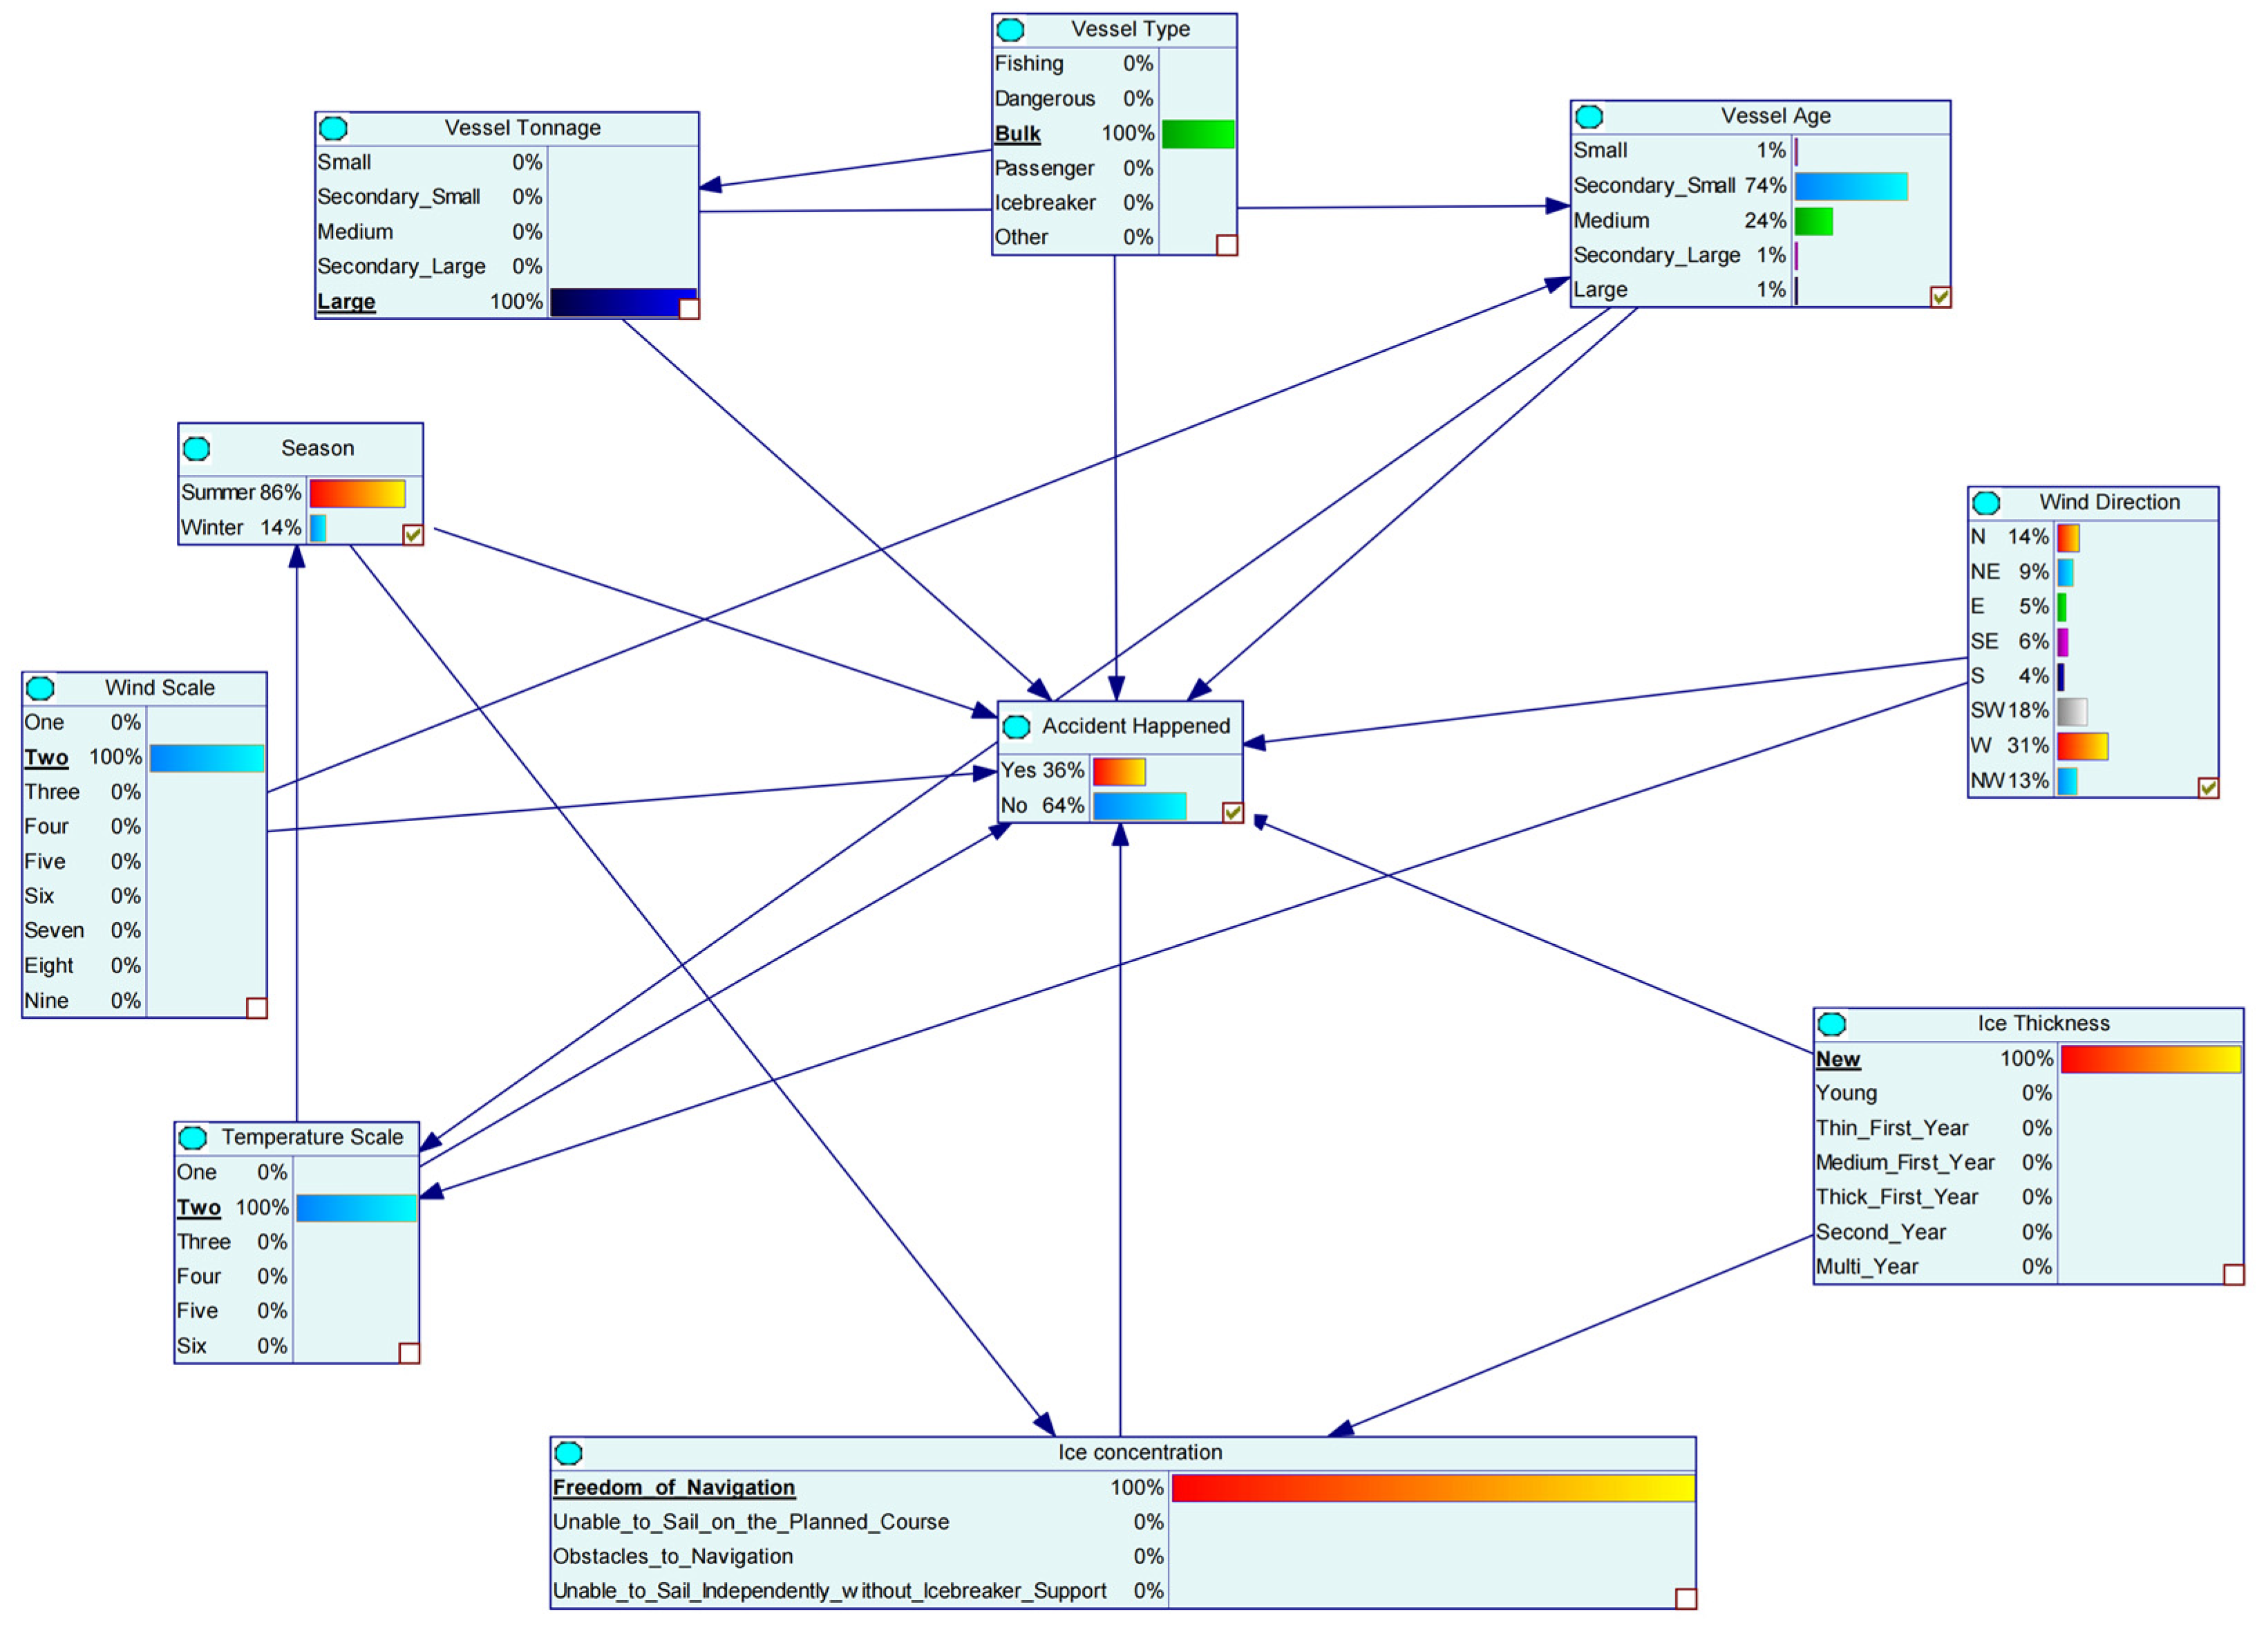
4.1.2. Scenario Two: Adverse Wind Conditions
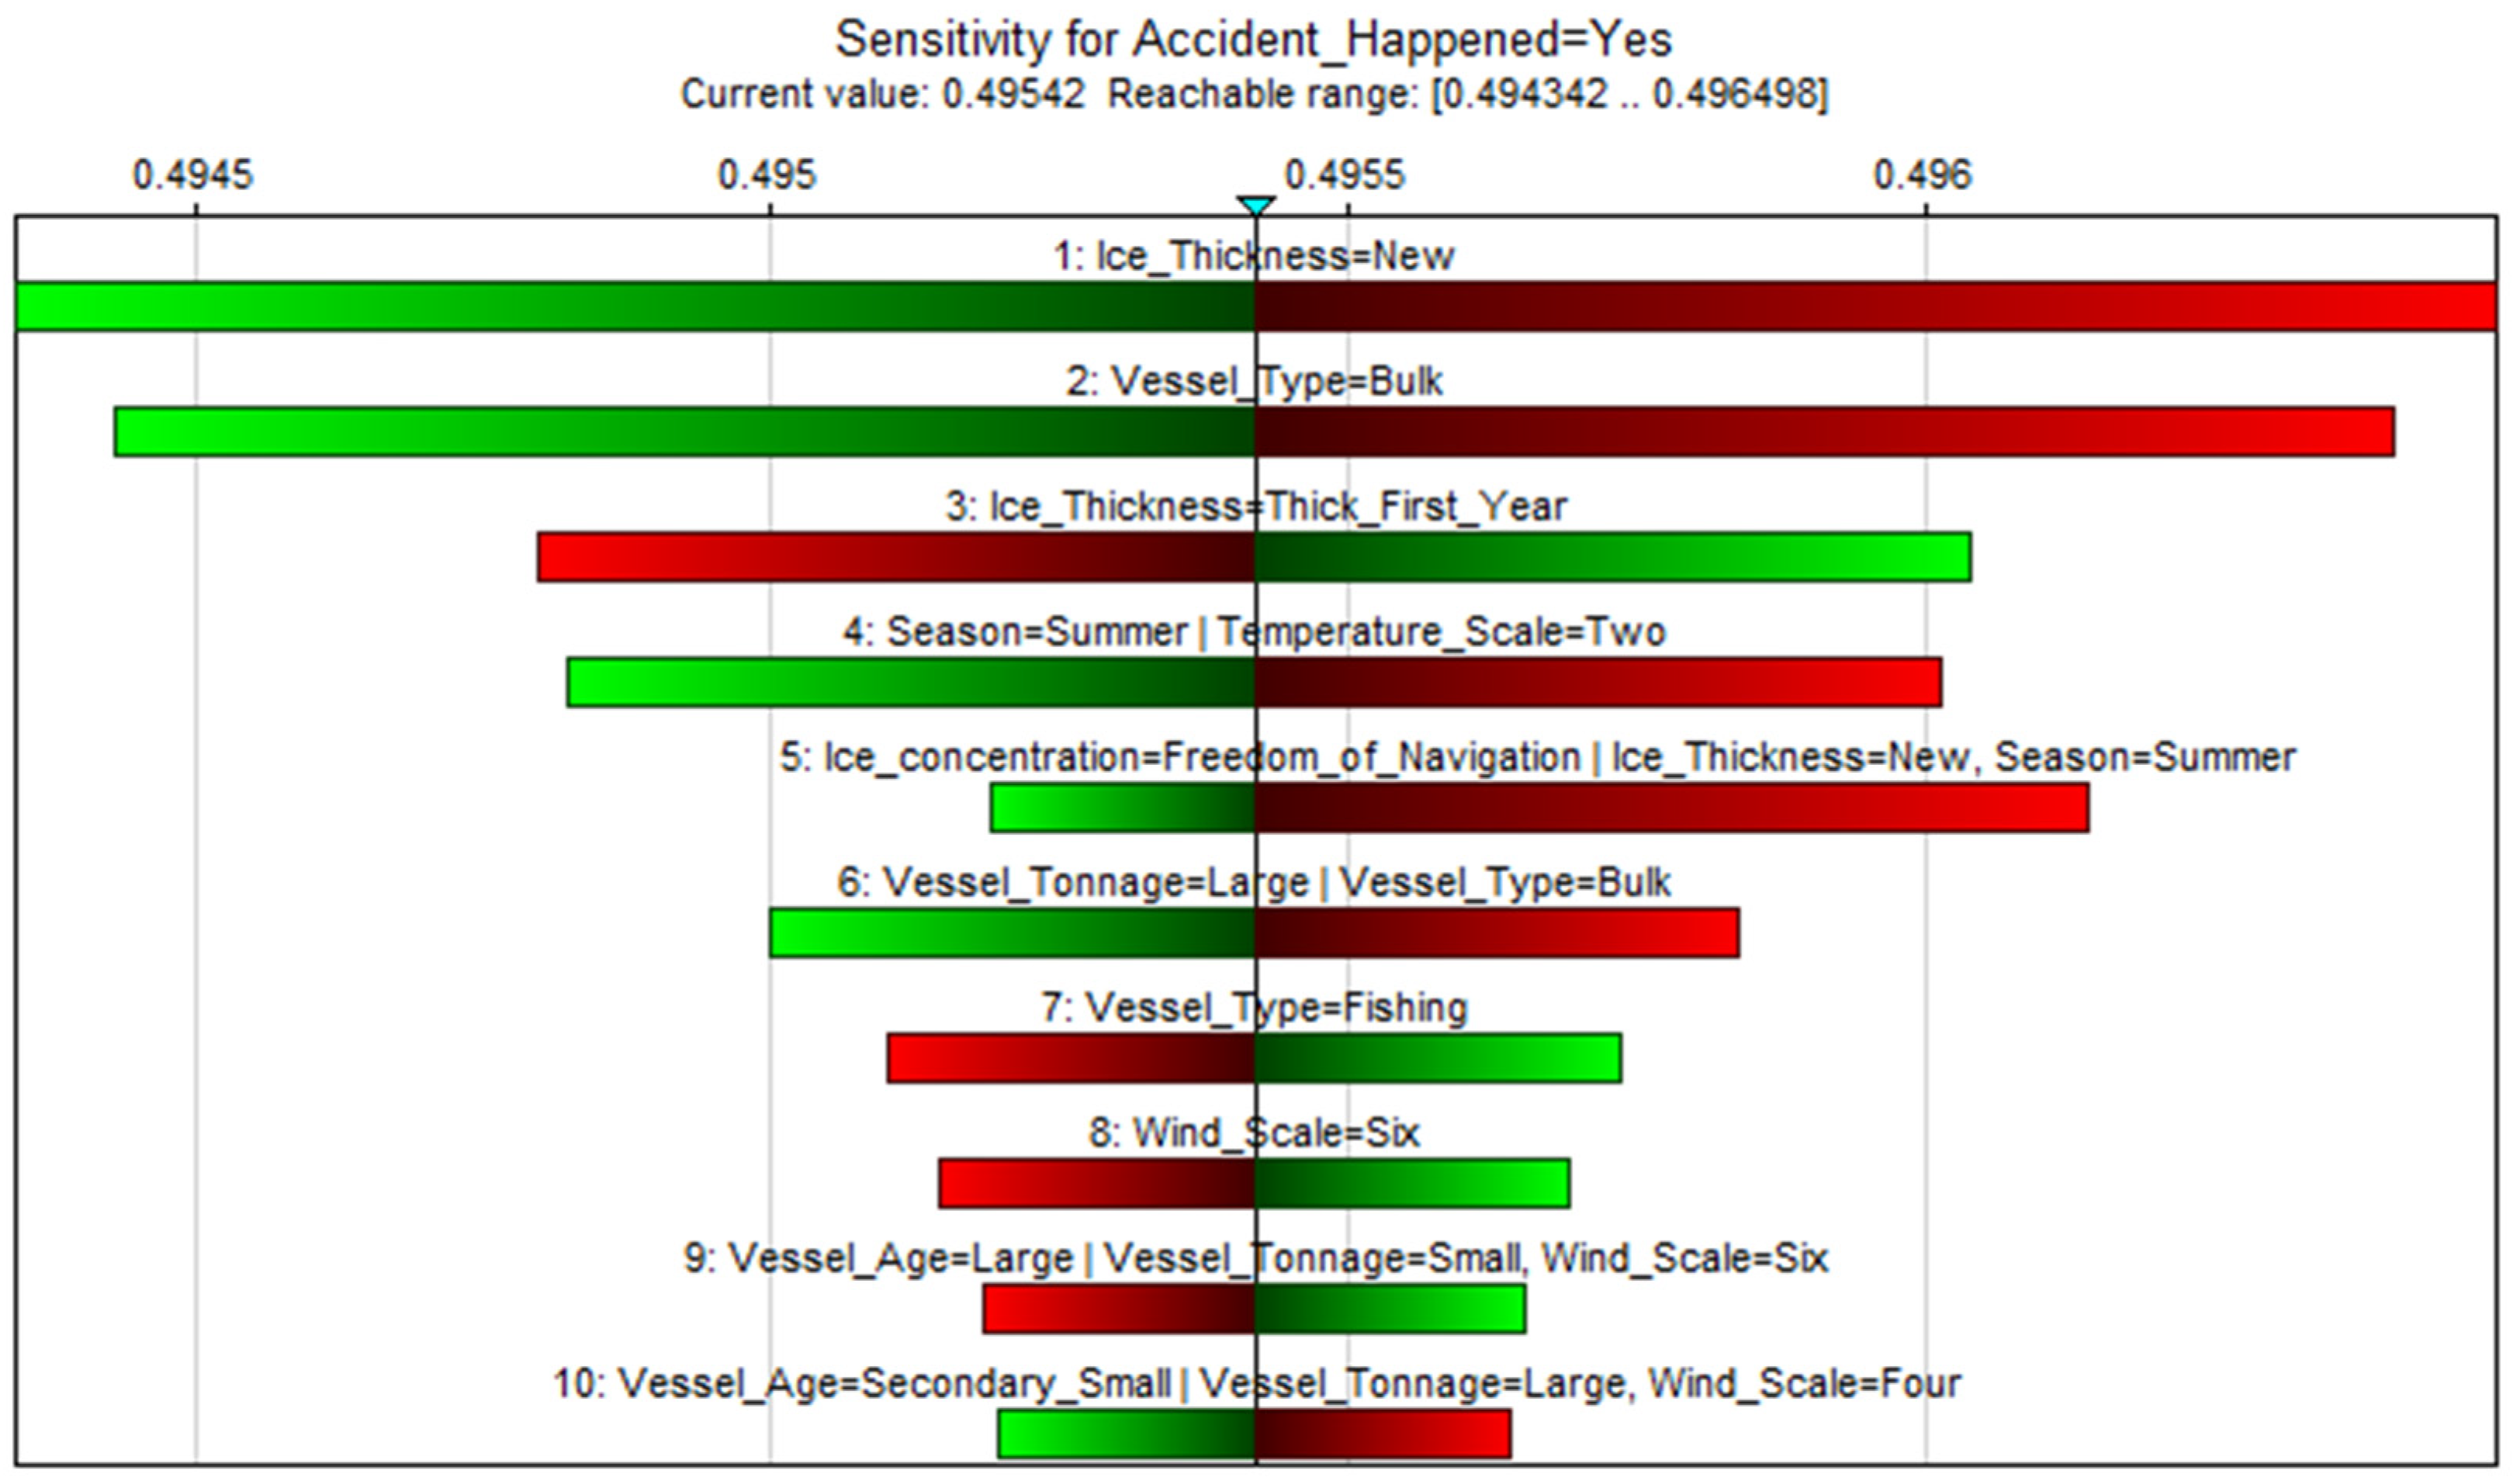
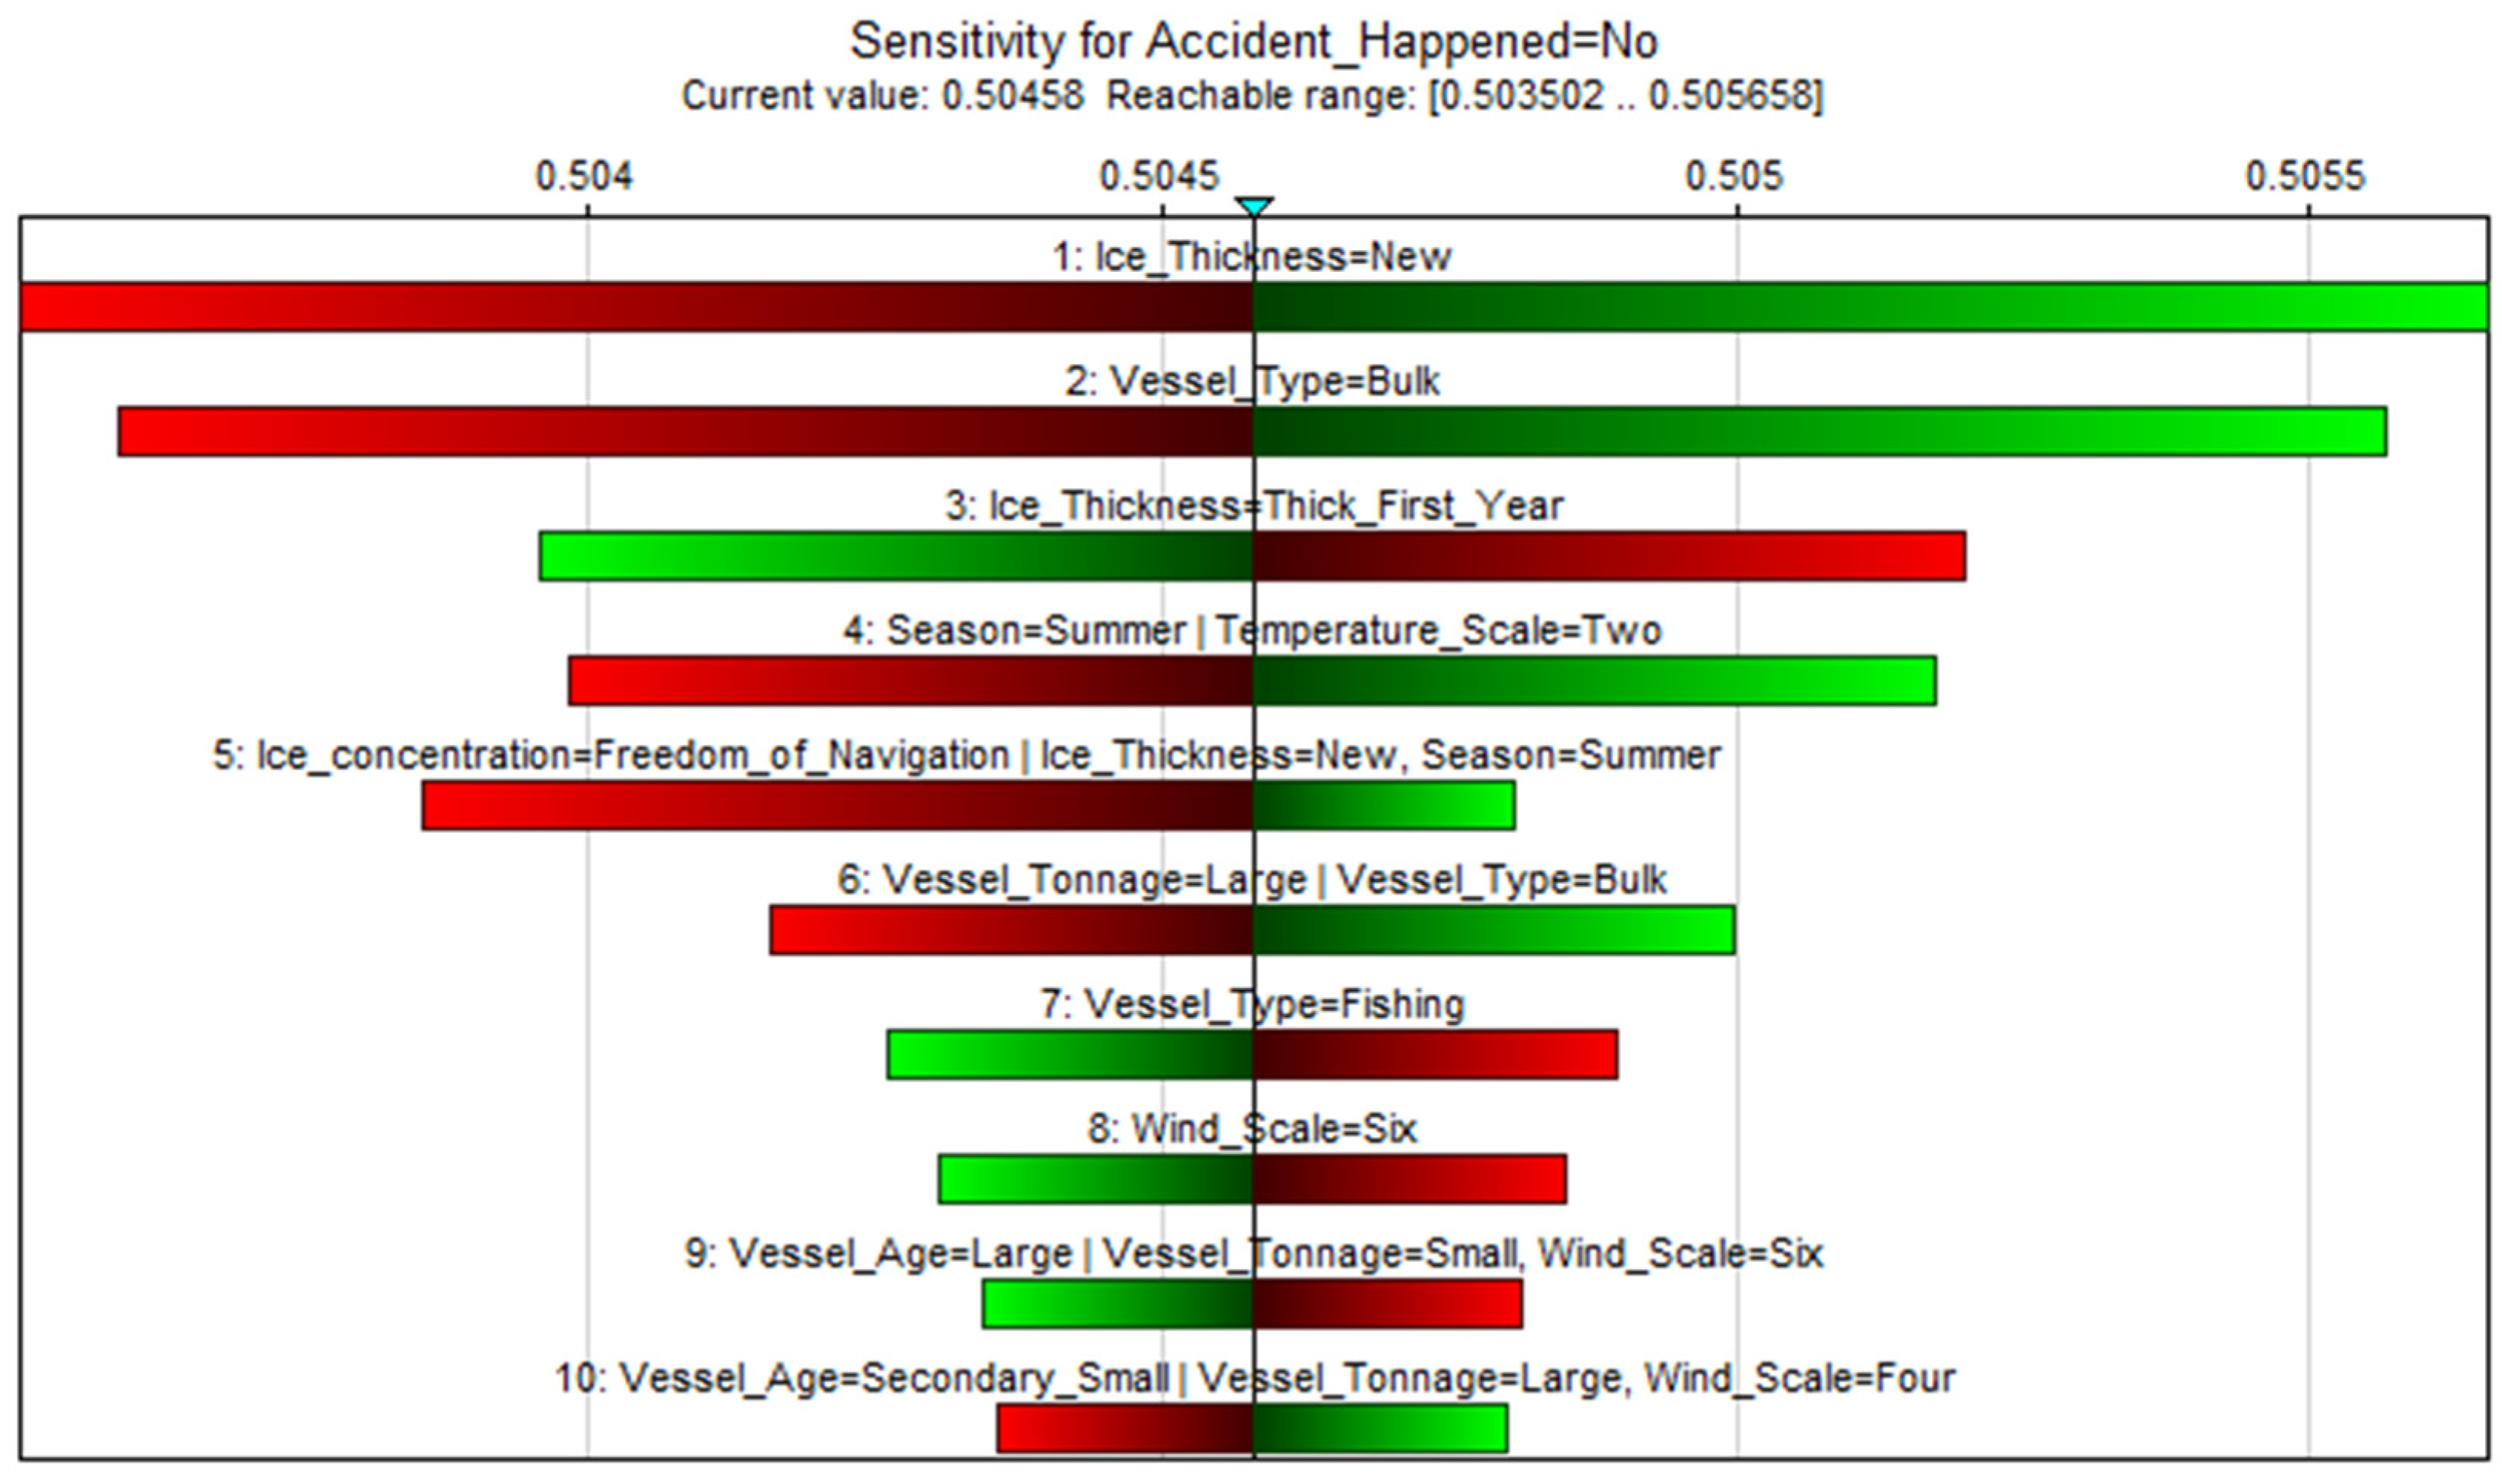
4.2. Sensitivity Analysis
5. Discussion
5.1. Algorithm Selection
5.2. Prediction Outcomes
5.3. Limitations of Research
6. Conclusions
Author Contributions
Funding
Institutional Review Board Statement
Informed Consent Statement
Data Availability Statement
Acknowledgments
Conflicts of Interest
References
- IMO. International Code for Ships Operating in Polar Waters (Polar Code). Available online: https://www.imo.org/en/OurWork/Safety/Pages/polar-code.aspx (accessed on 2 May 2023).
- Landy, J.C.; Dawson, G.J.; Tsamados, M.; Bushuk, M.; Stroeve, J.C.; Howell, S.E.L.; Krumpen, T.; Babb, D.G.; Komarov, A.S.; Heorton, H.D.B.S.; et al. A year-round satellite sea-ice thickness record from CryoSat-2. Nature 2022, 609, 517–522. [Google Scholar] [CrossRef] [PubMed]
- Zhang, C.; Zhang, D.; Zhang, M.Y.; Lang, X.; Mao, W.G. An integrated risk assessment model for safe Arctic navigation. Transp. Res. Part A Policy Pract. 2020, 142, 101–114. [Google Scholar] [CrossRef]
- Turnbull, I.D.; Bourbonnais, P.; Taylor, R.S. Investigation of two pack ice besetting events on the Umiak I and development of a probabilistic prediction model. Ocean Eng. 2019, 179, 76–91. [Google Scholar] [CrossRef]
- Fu, S.S.; Zhang, D.; Montewka, J.; Yan, X.P.; Zio, E. Towards a probabilistic model for predicting ship besetting in ice in Arctic waters. Reliab. Eng. Syst. Saf. 2016, 155, 124–136. [Google Scholar] [CrossRef]
- Khan, B.; Khan, F.; Veitch, B.; Yang, M. An operational risk analysis tool to analyze marine transportation in Arctic waters. Reliab. Eng. Syst. Saf. 2018, 169, 485–502. [Google Scholar] [CrossRef]
- Zhang, Y.; Hu, H.; Dai, L. Real-time assessment and prediction on maritime risk state on the Arctic Route. Marit. Policy Manag. 2020, 47, 352–370. [Google Scholar] [CrossRef]
- Mohammadiun, S.; Hu, G.J.; Gharahbagh, A.A.; Mirshahi, R.; Li, J.B.; Hewage, K.; Sadiq, R. Optimization of integrated fuzzy decision tree and regression models for selection of oil spill response method in the Arctic. Knowl. Based Syst. 2021, 213, 106676. [Google Scholar] [CrossRef]
- Franck, M.C.J.; Roos, M. Collisions in Ice: A Study of Collisions Involving Swedish Icebreakers in the Baltic Sea. Master’s Thesis, Linnaeus University, Kalmar, Sweden, 2013. [Google Scholar]
- Banda, O.A.V.; Goerlandt, F.; Montewka, J.; Kujala, P. A risk analysis of winter navigation in Finnish sea areas. Accid. Anal. Prev. 2015, 79, 100–116. [Google Scholar] [CrossRef]
- Liu, J.; Yang, J.B.; Wang, J.; Sii, H.S. Engineering system safety analysis and synthesis using the fuzzy rule-based evidential reasoning approach. Qual. Reliab. Eng. Int. 2005, 21, 387–411. [Google Scholar] [CrossRef]
- Gaonkar, R.S.P.; Xie, M.; Ng, M.M.; Habibullah, M.S. Subjective operational reliability assessment of maritime transportation system. Expert Syst. Appl. 2011, 38, 13835–13846. [Google Scholar] [CrossRef]
- Kara, E.G.E. Risk Assessment in the Istanbul Strait Using Black Sea MOU Port State Control Inspections. Sustainability 2016, 8, 390. [Google Scholar] [CrossRef]
- Zhu, J.S.; Huang, C.; Ma, Y. On the environmental risk assessment of ships navigating through channel waters at night. J. Saf. Environ. 2019, 19, 43–48. [Google Scholar] [CrossRef]
- Fan, Z.Z.; Guo, T.T.; Zheng, L.M. Assessment on the ship collision risk based on the improved set pair analysis method. J. Saf. Environ. 2021, 21, 470–474. [Google Scholar] [CrossRef]
- Jiao, Y.; Dulebenets, M.A.; Lau, Y.Y. Cruise Ship Safety Management in Asian Regions: Trends and Future Outlook. Sustainability 2020, 12, 5567. [Google Scholar] [CrossRef]
- Wang, S.Q.; Yin, J.B.; Khan, R.U. The Multi-State Maritime Transportation System Risk Assessment and Safety Analysis. Sustainability 2020, 12, 5728. [Google Scholar] [CrossRef]
- d’Afflisio, E.; Braca, P.; Millefiori, L.M.; Willett, P. Detecting Anomalous Deviations From Standard Maritime Routes Using the Ornstein–Uhlenbeck Process. IEEE Trans. Signal Process. 2018, 66, 6474–6487. [Google Scholar] [CrossRef]
- Iphar, C.; Zocholl, M.; Jousselme, A.L. Semantics of Maritime Routes: Conciliating complementary views. In Proceedings of the OCEANS Conference, Electr Network, Virtual, 20–23 September 2021. [Google Scholar]
- Andreassen, N.; Jarl Borch, O. Crisis and Emergency Management in the Arctic-Navigating Complex Environments; Routledge: London, UK, 2020. [Google Scholar]
- Dimitrios, D.; Baxevani, E.; Siousiouras, P. The Future of Arctic Shipping Business and the Positive Influence of the International Code for Ships Operating in Polar Waters. J. Ocean Technol. 2018, 13, 76–94. [Google Scholar]
- Makarova, I.; Buyvol, P.; Mukhametdinov, E.; Boyko, A. The Construction of Seaports in the Arctic: Prospects and Environmental Consequences. J. Mar. Sci. Eng. 2023, 11, 1902. [Google Scholar] [CrossRef]
- Cakir, E.; Sevgili, C.; Fiskin, R. An analysis of severity of oil spill caused by vessel accidents. Transp. Res. Part D Transp. Environ. 2021, 90, 102662. [Google Scholar] [CrossRef]
- Coraddu, A.; Oneto, L.; de Maya, B.N.; Kurt, R. Determining the most influential human factors in maritime accidents: A data-driven approach. Ocean Eng. 2020, 211, 107588. [Google Scholar] [CrossRef]
- Xiao, Y.; Li, X.C.; Yao, W.; Chen, J.; Hu, Y.P. Bidirectional Data-Driven Trajectory Prediction for Intelligent Maritime Traffic. IEEE Trans. Intell. Transp. Syst. 2023, 24, 1773–1785. [Google Scholar] [CrossRef]
- Yang, X.; Haugen, S.; Li, Y.D. Risk influence frameworks for activity-related risk analysis during operation: A literature review. Saf. Sci. 2017, 96, 102–116. [Google Scholar] [CrossRef]
- Hou, J.H.; Hu, Z.G. Review on the application of CiteSpace at home and abroad. J. Mod. Inf. 2013, 33, 99–103. [Google Scholar] [CrossRef]
- Li, J.; Chen, C.M. CiteSpace: Text Mining and Visualization in Scientific Literature, 2nd ed.; Capital Economic and Trade University Press: Beijing, China, 2017. [Google Scholar]
- Zhang, L.; Wen, J. Active learning strategy for high fidelity short-term data-driven building energy forecasting. Energy Build. 2021, 244, 111026. [Google Scholar] [CrossRef]
- Devasthale, A.; Sedlar, J.; Koenigk, T.; Fetzer, E.J. The thermodynamic state of the Arctic atmosphere observed by AIRS: Comparisons during the record minimum sea ice extents of 2007 and 2012. Atmos. Chem. Phys. 2013, 13, 7441–7450. [Google Scholar] [CrossRef]
- Ke, C.Q.; Wang, M.M. Seasonal and interannual variation of thinkness and volume of the Arctic sea ice based on CryoSat-2 during 2010–2017. Haiyang Xuebao 2018, 40, 1–13. [Google Scholar] [CrossRef]
- Zhang, X.; Yang, H.G.; Wang, L. Strategic thinking on China’ s involvement in the development of Arctic sea routes. Chin. J. Polar Res. 2016, 28, 267–276. [Google Scholar] [CrossRef]
- Wang, Y.; Shi, X. On the temporal-spatial distribution and the type characteristics of the global maritime accidents. J. Saf. Environ. 2018, 18, 1224–1230. [Google Scholar] [CrossRef]
- Triepels, R.; Feelders, A.; Daniels, H. Uncovering Document Fraud in Maritime Freight Transport Based on Probabilistic Classification. In Proceedings of the 14th IFIP TC 8 International Conference Computer Information Systems and Industrial Management (CISIM), Warsaw Univ Technol, Warsaw, Poland, 24–26 September 2015; pp. 282–293. [Google Scholar]
- Bouejla, A.; Chaze, X.; Guamieri, F.; Napoli, A. A Bayesian network to manage risks of maritime piracy against offshore oil fields. Saf. Sci. 2014, 68, 222–230. [Google Scholar] [CrossRef]
- Cooper, G.F.; Herskovits, E. A Bayesian method for the induction of probabilistic networks from data. Mach. Learn. 1992, 9, 309–347. [Google Scholar] [CrossRef]
- Babacan, E.K.; Karaduman, M.Ö. A study on Bayesian Network-K2 Algorithm. Karadeniz Fen Bilim. Derg. 2018, 8, 24–38. [Google Scholar] [CrossRef]
- Zou, X.; Yue, W.L. A Bayesian Network Approach to Causation Analysis of Road Accidents Using Netica. J. Adv. Transp. 2017, 2017, 2525481. [Google Scholar] [CrossRef]
- Dogru, N.; Subasi, A. Traffic Accident Detection Using Random Forest Classifier. In Proceedings of the 15th Learning and Technology Conference (L&T), Jeddah, Saudi Arabia, 25–26 February 2018; IEEE: Piscataway, NJ, USA; pp. 40–45.
- Harb, R.; Yan, X.D.; Radwan, E.; Su, X.G. Exploring precrash maneuvers using classification trees and random forests. Accid. Anal. Prev. 2009, 41, 98–107. [Google Scholar] [CrossRef] [PubMed]
- Breiman, L. Random Forests. Mach. Learn. 2001, 45, 5–32. [Google Scholar] [CrossRef]
- Ho, T.K. The random subspace method for constructing decision forests. IEEE Trans. Pattern Anal. Mach. Intell. 1998, 20, 832–844. [Google Scholar] [CrossRef]
- Ting, K.M.; Witten, I.H. Stacking Bagged and Dagged Models. In Proceedings of the International Conference on Machine Learning, Nashville, TN, USA, 8–12 July 1997. [Google Scholar]
- Cortes, C.; Vapnik, V. Support-vector networks. Mach. Learn. 1995, 20, 273–297. [Google Scholar] [CrossRef]
- Cui, H.; Chen, L. A Binary Classifier for the Prediction of EC Numbers of Enzymes. Curr. Proteom. 2019, 16, 383–391. [Google Scholar] [CrossRef]
- Chen, L.; Pan, X.Y.; Hu, X.H.; Zhang, Y.H.; Wang, S.P.; Huang, T.; Cai, Y.D. Gene expression differences among different MSI statuses in colorectal cancer. Int. J. Cancer 2018, 143, 1731–1740. [Google Scholar] [CrossRef]
- Chen, L.; Pan, X.Y.; Zeng, T.; Zhang, Y.H.; Huang, T.; Cai, Y.D. Identifying Essential Signature Genes and Expression Rules Associated With Distinctive Development Stages of Early Embryonic Cells. IEEE Access 2019, 7, 128570–128578. [Google Scholar] [CrossRef]
- Li, H.H.; Ren, X.J.; Yang, Z.L. Data-driven Bayesian network for risk analysis of global maritime accidents. Reliab. Eng. Syst. Saf. 2023, 230, 108938. [Google Scholar] [CrossRef]
- Shu, Y.Q.; Zhu, Y.J.; Xu, F.; Gan, L.X.; Lee, P.T.W.; Yin, J.C.; Chen, J.H. Path planning for ships assisted by the icebreaker in ice-covered waters in the Northern Sea Route based on optimal control. Ocean Eng. 2023, 267, 113182. [Google Scholar] [CrossRef]
- Xu, S.; Kim, E.; Haugen, S.; Zhang, M.Y. A Bayesian network risk model for predicting ship besetting in ice during convoy operations along the Northern Sea Route. Reliab. Eng. Syst. Saf. 2022, 223, 108475. [Google Scholar] [CrossRef]
- Intergovernmental Panel on Climate Change (IPCC). Climate Change 2022: Impacts, Adaptation and Vulnerability; Pörtner, H.-O., Tignor, M., Poloczanska, E.S., Mintenbeck, K., Alegría, A., Craig, M., Langsdorf, S., Löschke, S., Möller, V., Okem, A., et al., Eds.; Intergovernmental Panel on Climate Change (IPCC): Cambridge, UK; New York, NY, USA, 2022; p. 3056. [Google Scholar]
- Kjærulff, U.; Van Der Gaag, L.C. Making Sensitivity Analysis Computationally Efficient. In Proceedings of the 16th Conference on Uncertainty in Artificial Intelligence, New York, NY, USA, 30 June–3 July 2000; pp. 317–325. [Google Scholar]


| Search Criteria | Details |
|---|---|
| Data source | WoS Core Collection database |
| Keywords | Topic = “arctic OR polar OR ice-covered water”, AND topic = “navigation OR navigational”, AND topic = “safety OR risk”. |
| Year | 1 January 1950–31 December 2022 |
| Literature type | Article, review |
| Language | English |
| Citation Counts 1 | First Author | Year | Journal Title | Literature Title |
|---|---|---|---|---|
| 165 | Kum Serdar | 2015 | Safety Science | A root cause analysis for Arctic Marine accidents from 1993 to 2011 |
| 148 | Zhang Mingyang | 2019 | Safety Science | Use of HFACS and fault tree model for collision risk factors analysis of icebreaker assistance in ice-covered waters |
| 141 | Baksh Al-Amin | 2018 | Ocean Engineering | Marine transportation risk assessment using Bayesian Network: Application to Arctic waters |
| 78 | Khan Bushra | 2020 | Safety Science | A Dynamic Bayesian Network model for ship-ice collision risk in the Arctic waters |
| 31 | Zhang Chi | 2020 | Transportation Research Part A-Policy and Practice | An integrated risk assessment model for safe Arctic navigation |
| 30 | Aziz Abdul | 2019 | Reliability Engineering & System Safety | Operational risk assessment model for marine vessels |
| 29 | Lehtola Ville | 2019 | Cold Regions Science and Technology | Finding safe and efficient shipping routes in ice-covered waters: A framework and a model |
| 22 | Li Zhuang | 2021 | Journal of Loss Prevention in The Process Industries | Decision-making on process risk of Arctic route for LNG carrier via dynamic Bayesian network modeling |
| 20 | Wang Yangjun | 2018 | Symmetry-Basel | An Improved A * Algorithm Based on Hesitant Fuzzy Set Theory for Multi-Criteria Arctic Route Planning |
| 16 | Zhang Weibin | 2020 | Ocean Engineering | Multi-ship following operation in ice-covered waters with consideration of inter-ship communication |
| 16 | Zhang Ye | 2020 | Maritime Policy & Management | Real-time assessment and prediction on maritime risk state on the Arctic Route |
| 13 | Fu Shanshan | 2022 | Ocean Engineering | Towards a probabilistic approach for risk analysis of nuclear-powered icebreakers using FMEA and FRAM |
| 11 | Li Zhuang | 2022 | Ocean Engineering | A decision support model for ship navigation in Arctic waters based on dynamic risk assessment |
| 10 | Li Zhuang | 2021 | Sustainability | Risk Reasoning from Factor Correlation of Maritime Traffic under Arctic Sea Ice Status Association with a Bayesian Belief Network |
| 7 | Li Zhuang | 2022 | Process Safety and Environmental Protection | Using DBN and evidence-based reasoning to develop a risk performance model to interfere ship navigation process safety in Arctic waters |
| 7 | Shan Yulong | 2019 | Symmetry-Basel | Study on the Allocation of a Rescue Base in the Arctic |
| 5 | Browne Thomas | 2022 | Marine Policy | A method for evaluating operational implications of regulatory constraints on Arctic shipping |
| 3 | Judson Brad | 1997 | Journal of Navigation | A Tanker Navigation Safety System |
| 2 | Zhang Chi | 2022 | Ocean Engineering | A three-dimensional ant colony algorithm for multi-objective ice routing of a ship in the Arctic area |
| 2 | Wang Chuya | 2022 | Sustainability | Risk Assessment of Ship Navigation in the Northwest Passage: Historical and Projection |
| 0 | Zvyagina Tatiana | 2022 | Journal of Marine Science and Engineering | Finding Risk-Expenses Pareto-Optimal Routes in Ice-Covered Waters |
| 0 | Hsieh Tsung-Hsuan | 2022 | Journal of Marine Science and Engineering | Application of Radar Image Fusion Method to Near-Field Sea Ice Warning for Autonomous Ships in the Polar Region |
| Ranking | Journal Article | Review Article | Polar Code | Collection of RIFs |
|---|---|---|---|---|
| 1 | Ice concentration | Ice condition | Ice | Ice concentration Ice thickness Topside icing Low temperature Wind speed Alcohol/drug use Vessel speed Extended periods of darkness or daylight Wave height Sea temperature High latitude Remoteness Equipment failure Vessel size Lack of crew experience Human error Vessel type Lack of emergency response equipment Physical and mental conditions Severe weather conditions The environment |
| 2 | Ice thickness | Ice concentration | Topside icing | |
| 3 | Wind speed | Ice thickness | Low temperature | |
| 4 | Vessel speed | Alcohol/drug use | Extended periods of darkness or daylight | |
| 5 | Visibility | Vessel speed | High latitudes | |
| 6 | Wave height | Sea temperature | Remoteness | |
| 7 | Equipment failure | Vessel size (deadweight tonnage, draft, length) | Lack of crew experience | |
| 8 | Human error | Vessel type | Lack of emergency response equipment | |
| 9 | Physical and mental conditions | Air temperature | Severe weather conditions | |
| 10 | Air temperature | Climatic changes | The environment |
| Attributes | Name | Classification | Data Source | |
|---|---|---|---|---|
| Accident attributes | Year | 2005–2012 | AIBN | |
| CASA | ||||
| 2013–2023 | NSRIO | |||
| Lloyd’s | ||||
| Season | Summer (May–October) | AIBN | ||
| CASA | ||||
| Summer (May–October) | NSRIO | |||
| Lloyd’s | ||||
| Type of accident | Equipment failure | AIBN CASA NSRIO Lloyd | ||
| Grounding | ||||
| Collision | ||||
| Fire/explosion | ||||
| Loss of control | ||||
| Allision | ||||
| Other | ||||
| Vessel characteristics | Vessel type | Fishing vessel | AIBN CASA NSRIO Lloyd’s | |
| Dangerous cargo vessel | ||||
| Bulk carrier | ||||
| Ro-ro passenger ship | ||||
| Icebreaker | ||||
| Other | ||||
| Vessel tonnage (t) | Small: (0, 500] | AIBN CASA NSRIO Lloyd’s | ||
| Secondary small: (500, 3000] | ||||
| Medium: (3000, 10000] | ||||
| Secondary large: (10000, 30000] | ||||
| Large: (30000, +∞) | ||||
| Vessel age (years old) | Small: (0, 5] | AIBN CASA NSRIO Lloyd’s | ||
| Secondary small: (5, 10] | ||||
| Medium: (10, 20] | ||||
| Secondary large: (20, 30] | ||||
| Large: (30, +∞) | ||||
| Sea ice environment | Ice concentration | Freedom of navigation: [0, 10) | CMS | |
| Unable to sail on the planned course: [10, 30] | ||||
| Obstacles to navigation: [40, 80] | ||||
| Unable to sail independently without icebreaker support: [90, 100] | ||||
| Ice thickness (cm) | New ice: (0, 10] | CMS | ||
| Young ice: (10, 30] | ||||
| Thin first-year ice: (30, 70] | ||||
| Medium first-year ice: (70, 120) | ||||
| Thick first-year ice: [120, 250) | ||||
| Second-year ice: [250, 300) | ||||
| Multi-year ice: [300, +∞) | ||||
| Meteorological conditions | Wind scale (m/s) | One: [0.3, 1.5] | ECMWF | |
| Two: [1.6, 3.3] | ||||
| Three: [3.4, 5.4] | ||||
| Four: [5.5, 7.9] | ||||
| Five: [8.0, 10.7] | ||||
| Six: [10.8, 13.8] | ||||
| Seven: [13.9, 17.1] | ||||
| Eight: [17.2, 20.7] | ||||
| Nine: [20.8, 24.4] | ||||
| Wind direction | N | S | ECMWF | |
| NE | SW | |||
| E | W | |||
| SE | NW | |||
| Air temperature (°C) | One: [−20, 0) | ECMWF | ||
| Two: [0, 4.9] | ||||
| Three: [5, 9.9] | ||||
| Four: [10, 11.9] | ||||
| Five: [12, 13.9] | ||||
| Six: [14, 15.9] | ||||
| The Selected Indicators | The Evaluated Performance |
|---|---|
| Precision | Accuracy |
| Recall | Consistency |
| F1 score | The balance between precision and recall |
| ROC | Accuracy |
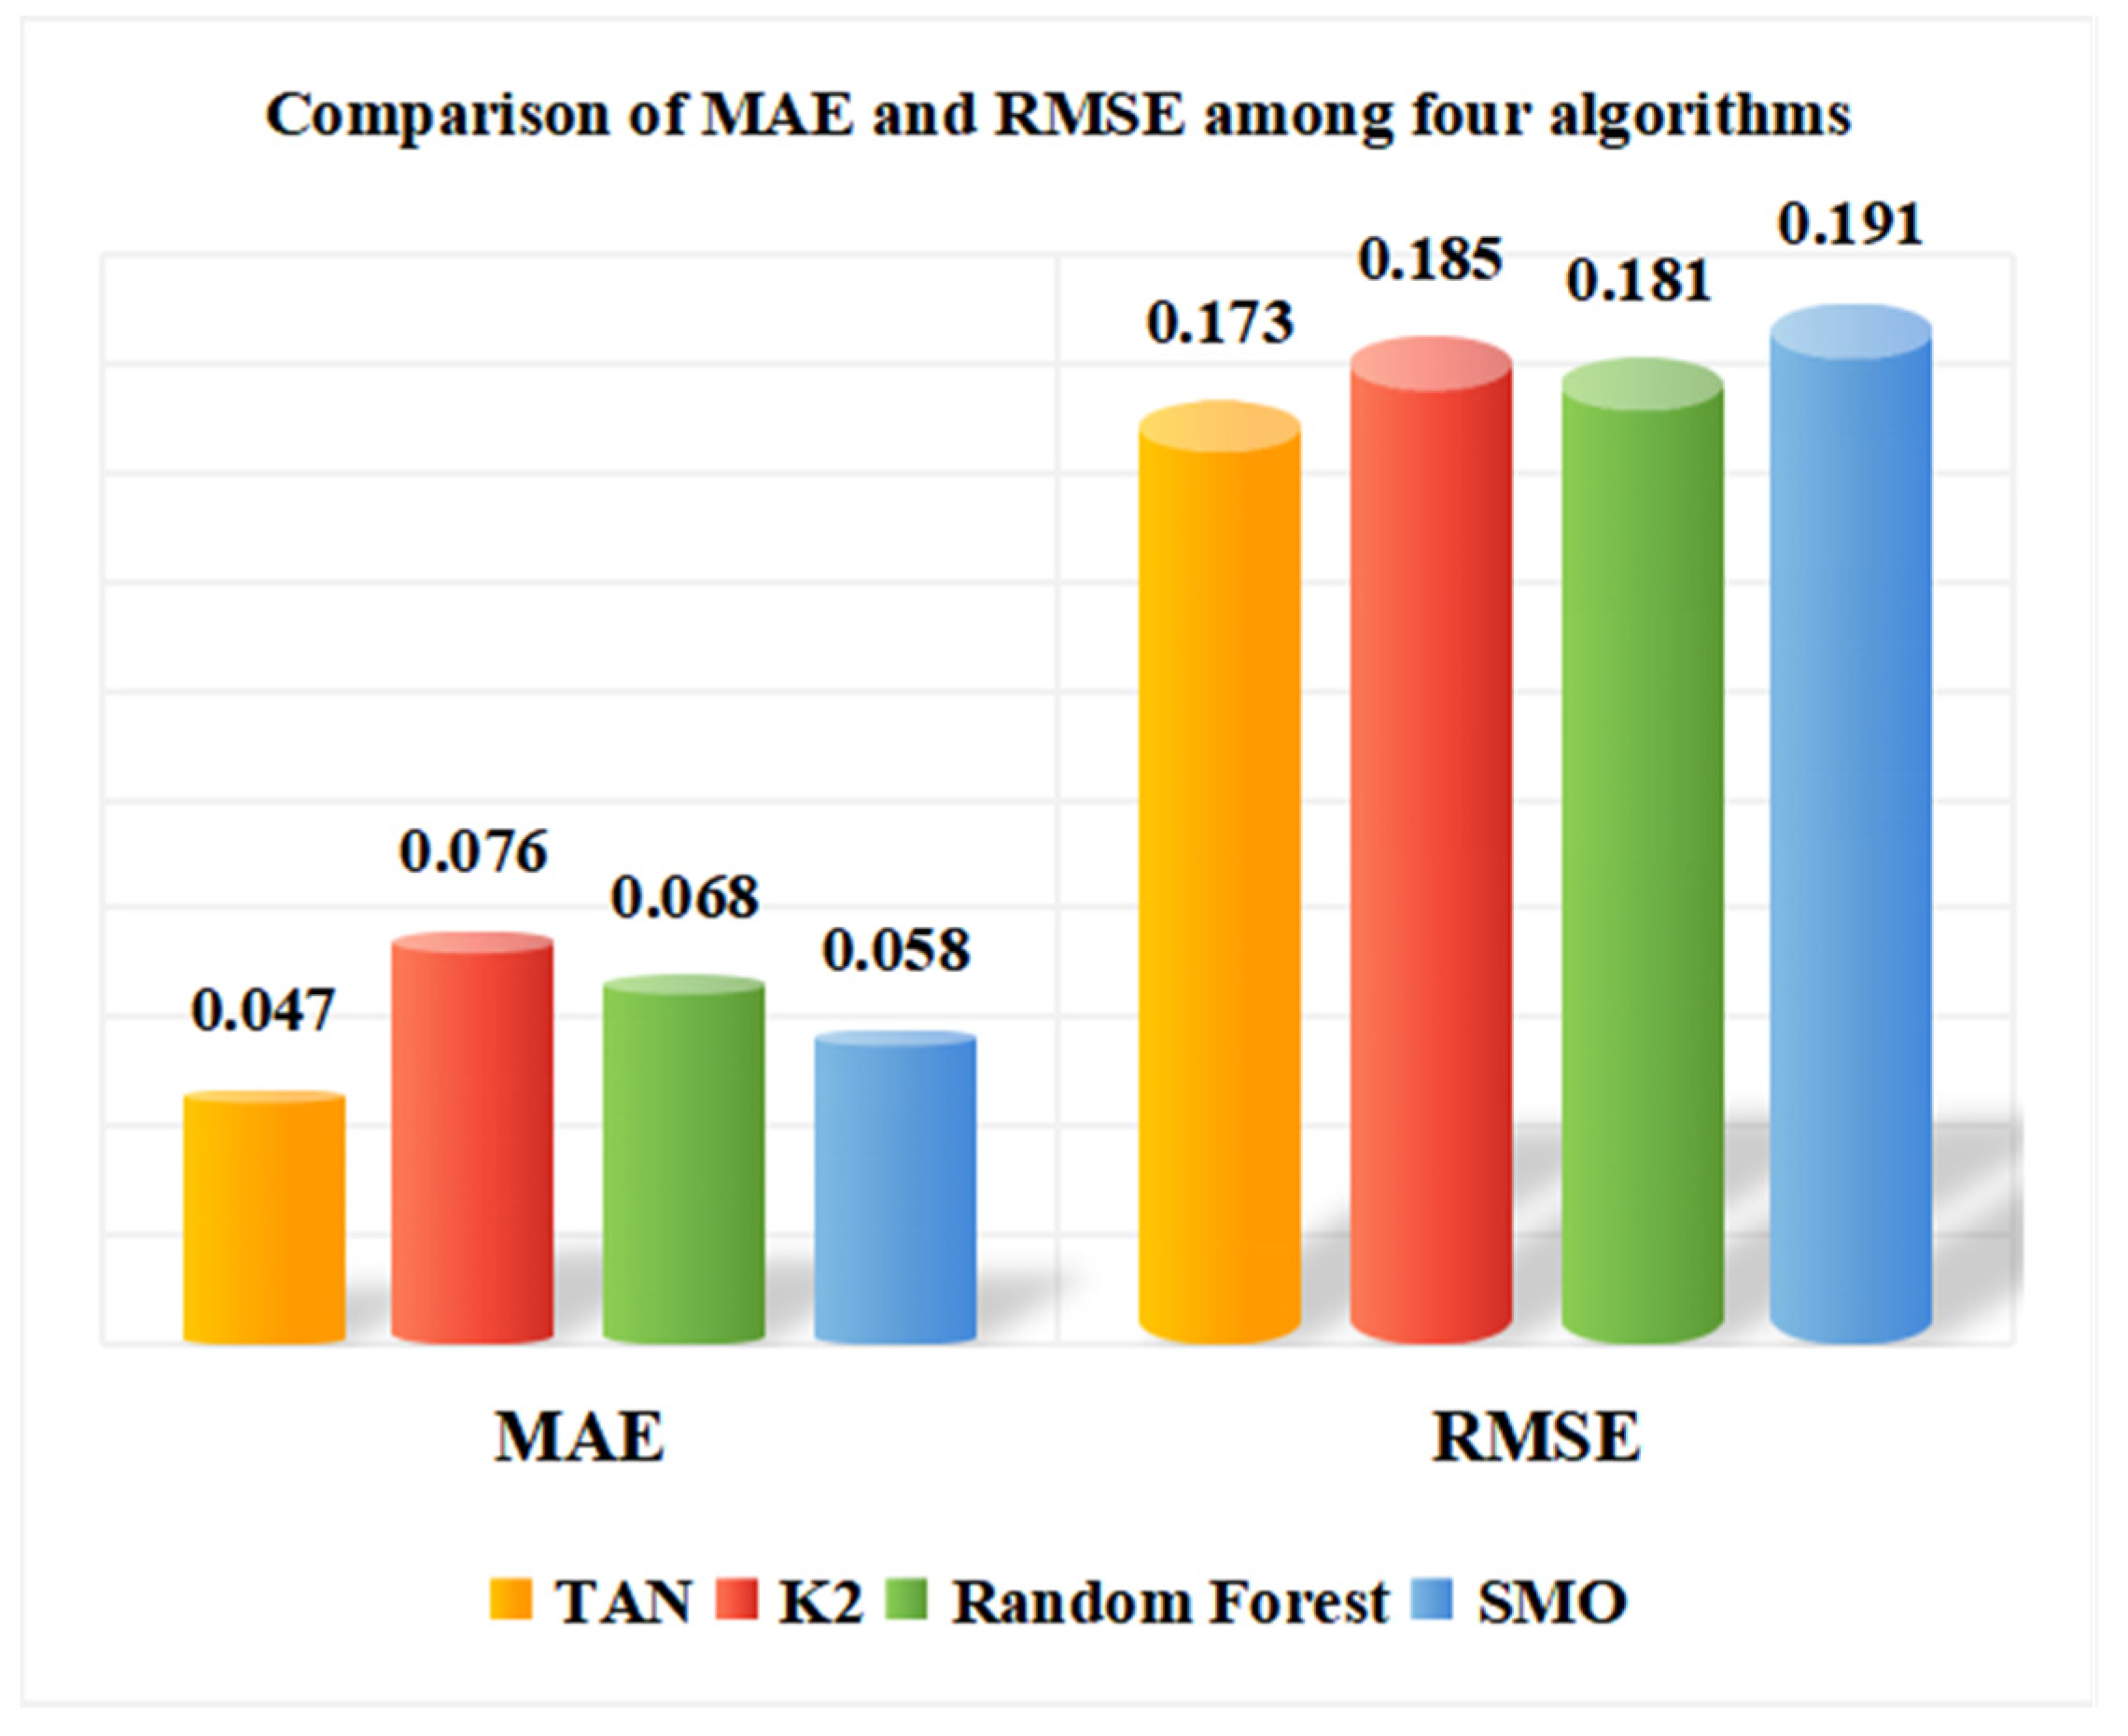
| Mean absolute error (MAE) | Prediction error |
| Root-mean-square error (RMSE) | Prediction error |
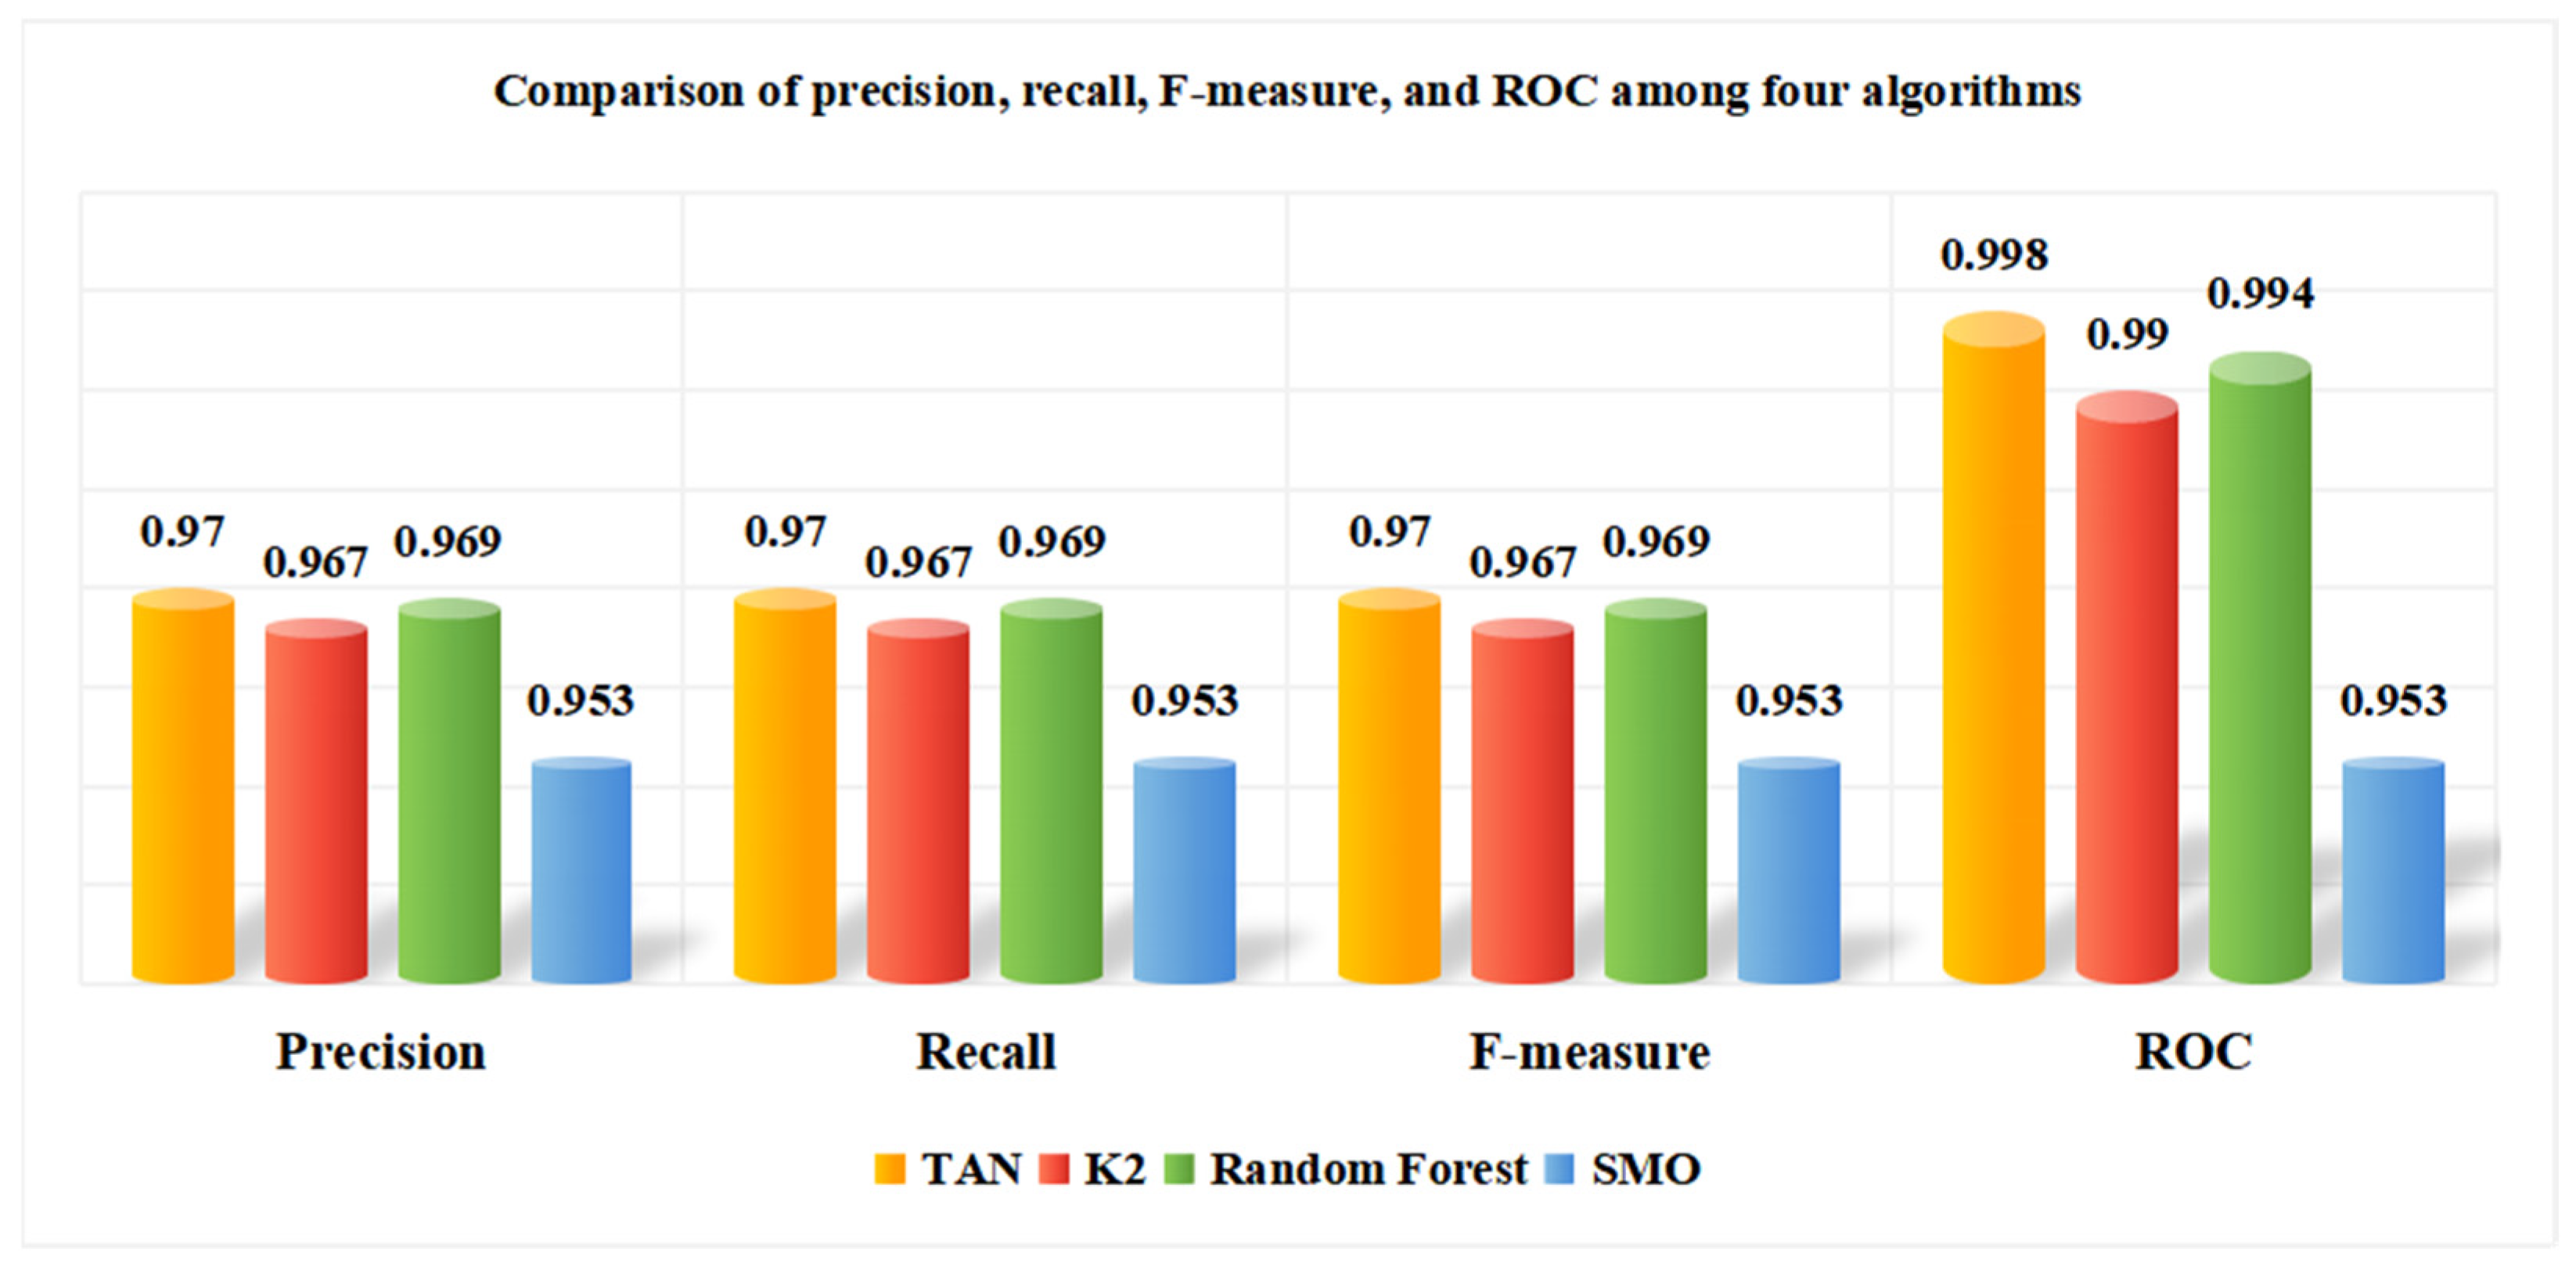
| Precision | Recall | F1 Score | ROC | MAE | RMSE | |
|---|---|---|---|---|---|---|
| TAN | 0.970 | 0.970 | 0.970 | 0.998 | 0.047 | 0.173 |
| K2 | 0.967 | 0.967 | 0.967 | 0.990 | 0.076 | 0.185 |
| Random forest | 0.969 | 0.969 | 0.969 | 0.994 | 0.068 | 0.181 |
| SMO | 0.953 | 0.953 | 0.953 | 0.953 | 0.058 | 0.191 |
Disclaimer/Publisher’s Note: The statements, opinions and data contained in all publications are solely those of the individual author(s) and contributor(s) and not of MDPI and/or the editor(s). MDPI and/or the editor(s) disclaim responsibility for any injury to people or property resulting from any ideas, methods, instructions or products referred to in the content. |
© 2023 by the authors. Licensee MDPI, Basel, Switzerland. This article is an open access article distributed under the terms and conditions of the Creative Commons Attribution (CC BY) license (https://creativecommons.org/licenses/by/4.0/).
Share and Cite
Yang, X.; Zhi, J.; Zhang, W.; Xu, S.; Meng, X. A Novel Data-Driven Prediction Framework for Ship Navigation Accidents in the Arctic Region. J. Mar. Sci. Eng. 2023, 11, 2300. https://doi.org/10.3390/jmse11122300
Yang X, Zhi J, Zhang W, Xu S, Meng X. A Novel Data-Driven Prediction Framework for Ship Navigation Accidents in the Arctic Region. Journal of Marine Science and Engineering. 2023; 11(12):2300. https://doi.org/10.3390/jmse11122300
Chicago/Turabian StyleYang, Xue, Jingkai Zhi, Wenjun Zhang, Sheng Xu, and Xiangkun Meng. 2023. "A Novel Data-Driven Prediction Framework for Ship Navigation Accidents in the Arctic Region" Journal of Marine Science and Engineering 11, no. 12: 2300. https://doi.org/10.3390/jmse11122300