1. Introduction
Uplink communication across the water–air interface holds immense significance in the field of deep-sea exploration and submarine communications, garnering considerable attention [
1,
2,
3]. A wide range of uplink communication methods exist, broadly classified into three categories [
4]: relay-based communication [
5,
6,
7], optical direct communication [
8,
9], and nonoptical direct communication [
10,
11,
12,
13,
14,
15]. Relay-based communication is susceptible to environmental and adverse weather conditions such as drift, currents, or surface waves [
16]. Both optical and nonoptical wireless communications are often severely compromised by channel complexity and wave problems [
17,
18,
19,
20], and transmission is also vulnerable to significant interference arising from seawater absorption [
21]. Overall, further research is needed to advance technologies pertaining to uplink communications across the water–air interface.
Fortunately, in 2018, Tonolini and Adib at MIT introduced translational acoustic-RF communication (TARF), a novel form of uplink wireless communication [
22]. TARF combines the utilization of acoustic waves and millimeter waves, offering a promising approach to overcome the limitations and challenges associated with conventional communication methods. TARF demonstrates the ability to achieve communication rates of up to 400 bps and maintain reliable communication even in the presence of the disturbances caused by water surface waves with amplitudes of up to 16 cm. Based on matching the frequency of surface waves to the acoustic signal of an underwater speaker, TARF exhibits resistance to water wave interference and ensures enhanced privacy. The system effectively addresses the challenges associated with underwater turbulence, air bubbles, and high absorption losses through the employment of hydroacoustic technology. Hence, TARF technology may become one of the preferred solutions in the field of cross-medium communication in the future. Further research is essential to delve into the intricacies of the TARF communication method, including system optimization and an in-depth understanding of its underlying physical processes.
In offshore oil exploration and military applications, translational acoustic-RF communication (TARF) technology exhibits significant application potential. For instance, in offshore oil exploration applications, by analyzing the water surface waves generated by acoustic signals sent from underwater robots to the water surface, TARF technology assists in more accurately locating oil well positions and the real-time monitoring of the seabed environment to ensure the safety of personnel and equipment. In military applications, submarines can emit modulated acoustic waves to the water surface, which are then decoded by aircraft, enabling cross-medium communication between submarines and aircraft, ensuring communication safety and concealment. However, we also acknowledge that there are some common limitations and challenges faced by TARF technology in real-world applications, including depth, multipath effects caused by environmental factors, wind and waves, hardware requirements, real-time performance, and the communication rate. These factors may affect the effectiveness and application range of TARF technology. Further research and technological optimization are needed to promote the application of TARF technology in these critical areas and overcome these limitations and challenges.
Model building is an effective approach for understanding physical processes and communication systems [
23,
24]. In the context of surface wave modeling in water, significant contributions were made by Lagrange, who derived a linear control equation for small amplitude wave theory. This was further explored by Cauchy and Poisson, who investigated the initial value problem associated with the general linear water wave equation. In 2020, the Ocean College of Zhejiang University developed an end-to-end channel theoretical model based on linear microamplitude wave theory, which was validated through low-frequency experiments [
25]. However, despite some progress being made in the investigation of this communication system, the physical processes of the system remain relatively understudied, and there is a notable absence of a corresponding channel model for assessing its communication performance metrics.
In this paper, a signal-to-noise ratio (SNR) channel model for evaluating the performance metrics of communication systems was successfully constructed, which was rigorously validated through experimental verification.
The main contributions of this paper can be summarized as follows:
- (1)
The SNR channel model of TARF was proposed for the first time, and the corrections for multipath effects, box vibrations, and a second-order nonlinear coefficient for amplitudes of the water surface wave were completed;
- (2)
The experimental validation of the SNR ratio channel model was conducted;
- (3)
A water-to-air cross-medium communication system was constructed, and a series of experiments were conducted.
The remainder of this paper is structured as follows:
Section 2 provides a comprehensive exposition of the physical process of bridging acoustic waves and millimeter waves. It elaborates on the construction of the SNR channel model and presents the experimental validation. In
Section 3, a series of communication experiments are described, along with the proposal of a stable and effective filtering algorithm. Furthermore, the utilization of a sliding Fourier transform approach to mitigate intercode errors is elucidated.
Section 4 concludes the paper by summarizing the key findings and discusses the scope for future work.
2. Model of Cross-Medium Communication Channel
In order to achieve water-to-air cross-medium communication, it is imperative to establish a comprehensive communication channel model as a foundational step. By leveraging the distinctive features of the constructed channel model, one can flexibly opt for appropriate carrier frequencies and modulation methods. By proactively assessing and predicting the communication metrics, a water-to-air cross-medium communication system can be constructed to precisely cater to the specified SNR and transmission distance requirements.
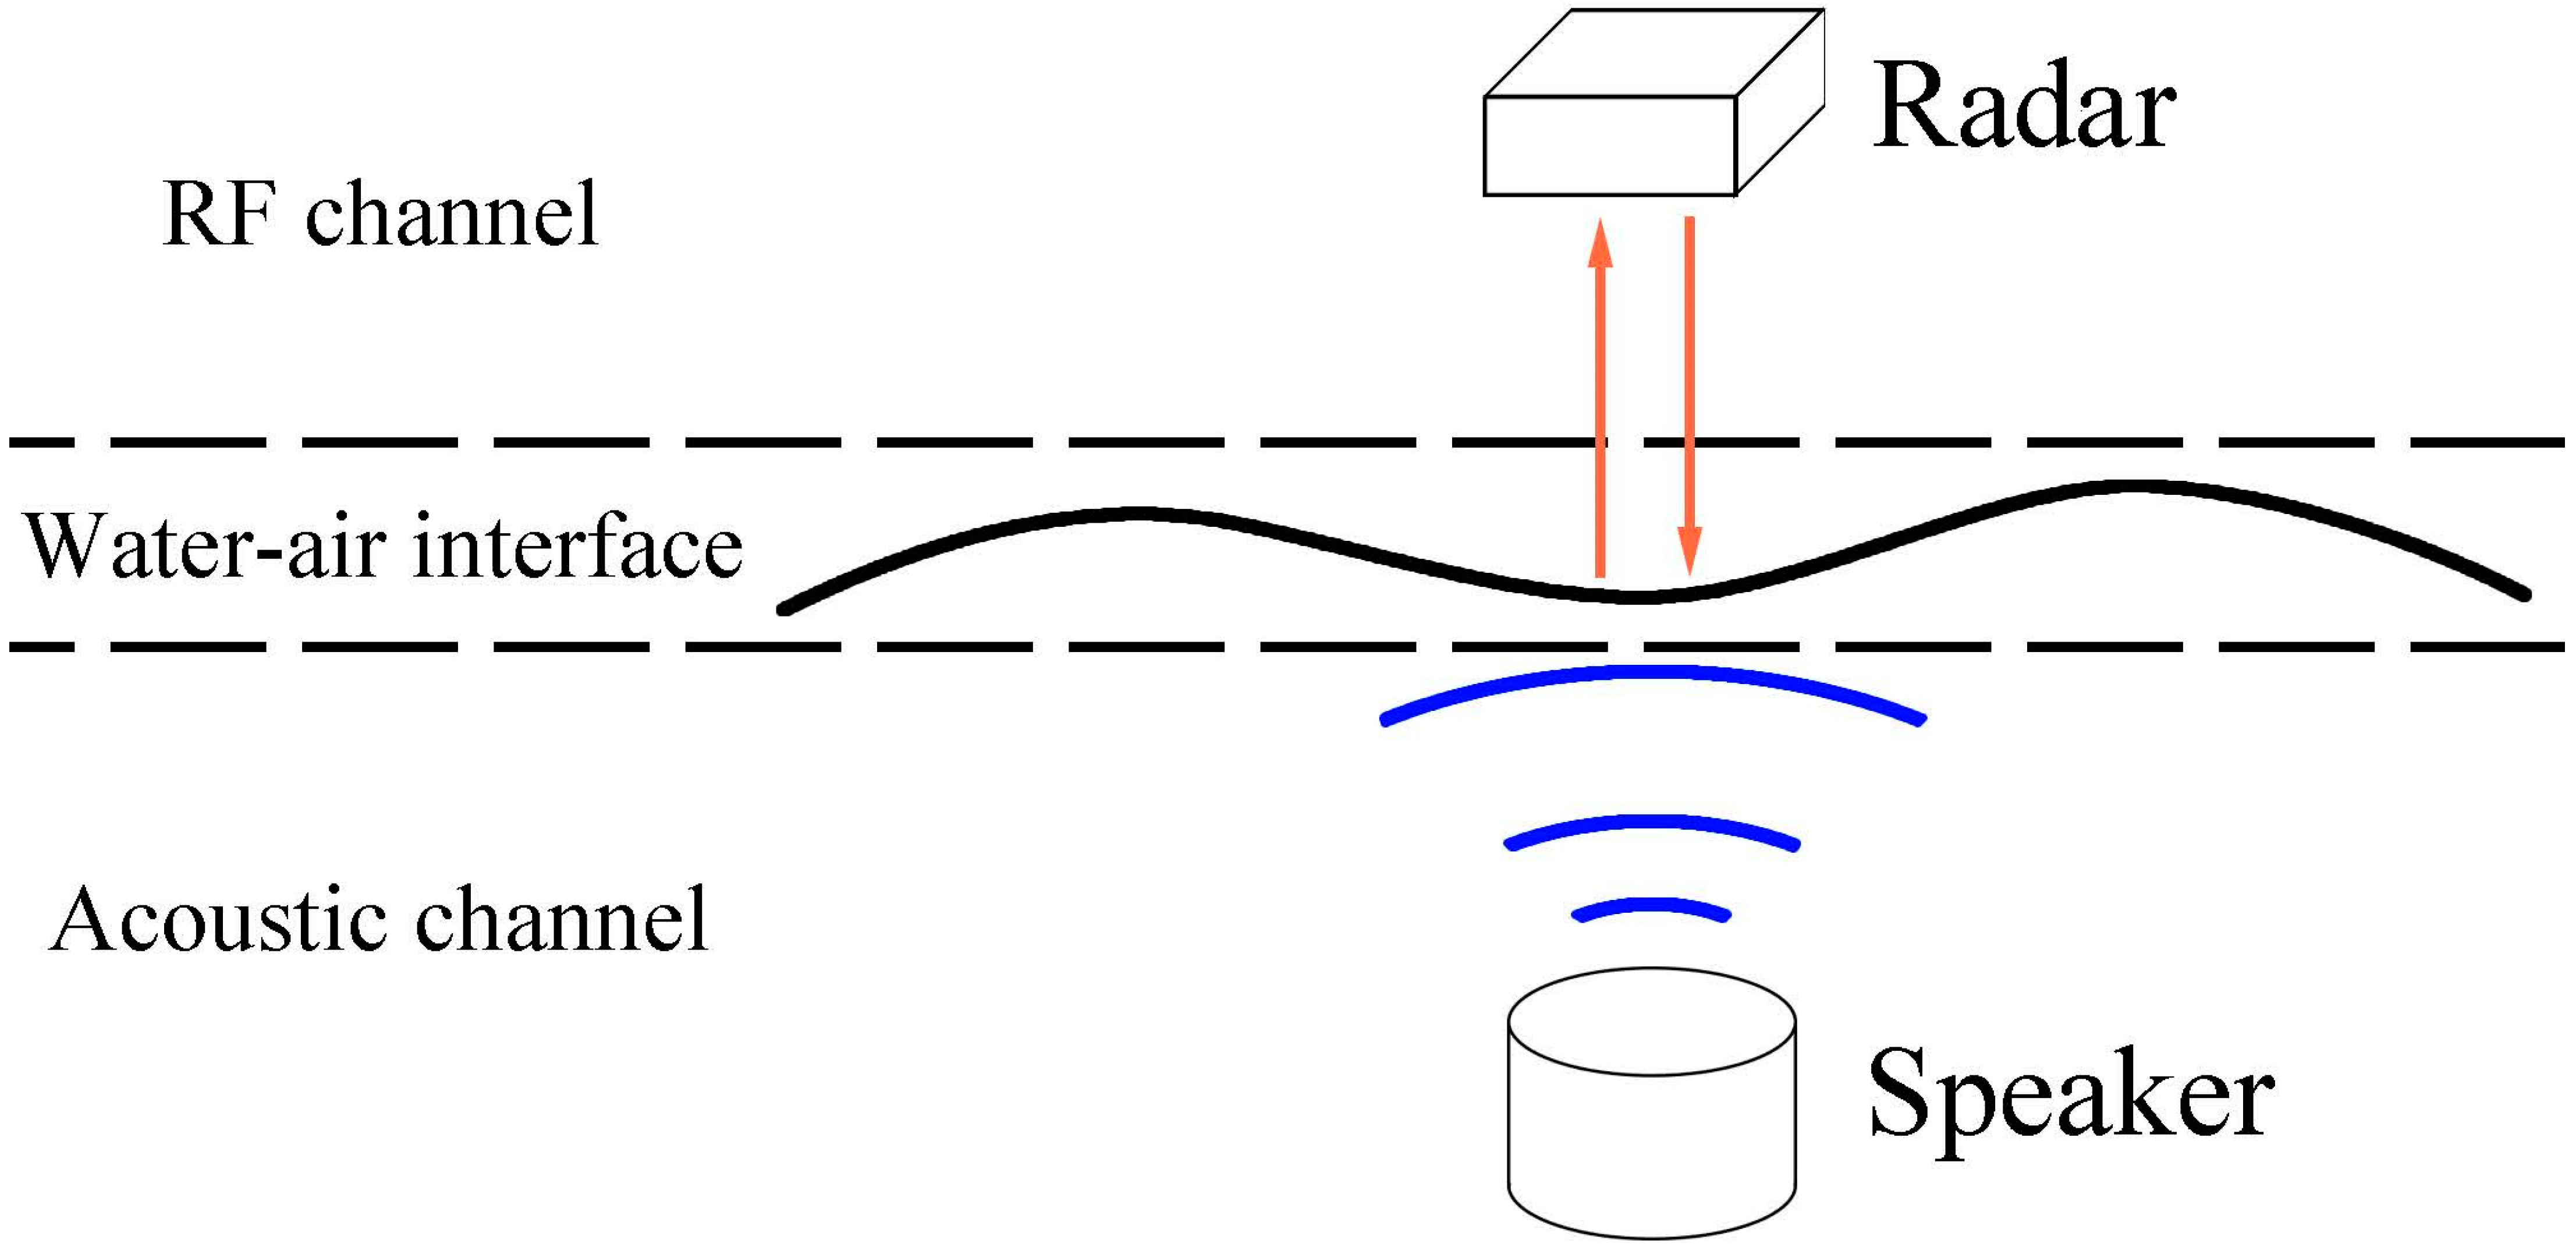
The analysis of physical processes is widely recognized as a crucial component in engineering modeling. As depicted in
Figure 1, water-to-air cross-medium communication entails three main parts: the underwater channel, the water–air interface, and the air channel. In the underwater channel, the speaker emits an acoustic signal, propagating as a pressure wave from the underwater environment towards the water surface. At the air–water interface, the acoustic signal propagating to the water surface induces the formation of water surface waves due to the mechanical characteristics of the pressure waves. By employing millimeter wave radar (MMWR) in the air channel, it becomes feasible to detect the surface waves and subsequently acquire the transmitted information from the speaker.
2.1. Physical Process
2.1.1. Underwater Propagation of Acoustic Signals
During transmission, the acoustic signal emitted by speaker under water undergoes gradual attenuation. Underwater acoustic waves experience two primary types of attenuation: diffusion attenuation and absorption attenuation. Diffusion attenuation arises from the expansion of the wavefront surface with distance, leading to propagation loss that follows the inverse square law 1/
r2. Absorption attenuation stems from seawater absorption and inhomogeneity scattering, resulting in propagation loss that adheres to the exponential law
e−αr. Combined, these laws can be summarized as follows [
22]:
where
A0 represents the initial peak value of the underwater acoustic source,
r denotes the underwater transmission distance of the acoustic source signal,
f corresponds to the frequency of the acoustic source signal,
A(
r,
f) indicates the amplitude of the acoustic source signal after traveling the underwater distance
r, and
α represents the attenuation coefficient of the acoustic source signal in the water. The definition of
α is presented below [
26]:
The underwater acoustic source signal propagates through water as a pressure wave. For calculation, the acoustic signal amplitude can be converted into sound pressure using the following equation [
27].
where
pi represents the incident sound pressure, and
v is the sound speed, which is affected by many underwater environmental parameters. The specific relationship is as follows [
26]:
where
TEM is the temperature,
S stands for salinity, and
Pw represents water pressure.
2.1.2. Acoustically Induced Surface Waves
The acoustic signal, when propagated to the water surface, induces water surface waves. This physical process can be mathematically modeled by linearizing the universal hydrodynamic equations based on the linear small amplitude wave theory. It describes the acoustic pressure-induced transverse microamplitude waves on the water surface, and the 3D mathematical model is represented by Equation (5) [
27]:
where
pi is the underwater sound source pressure,
ρ is the density of water,
v is the speed of sound, and
x and
y are the coordinates on the horizontal plane, respectively.
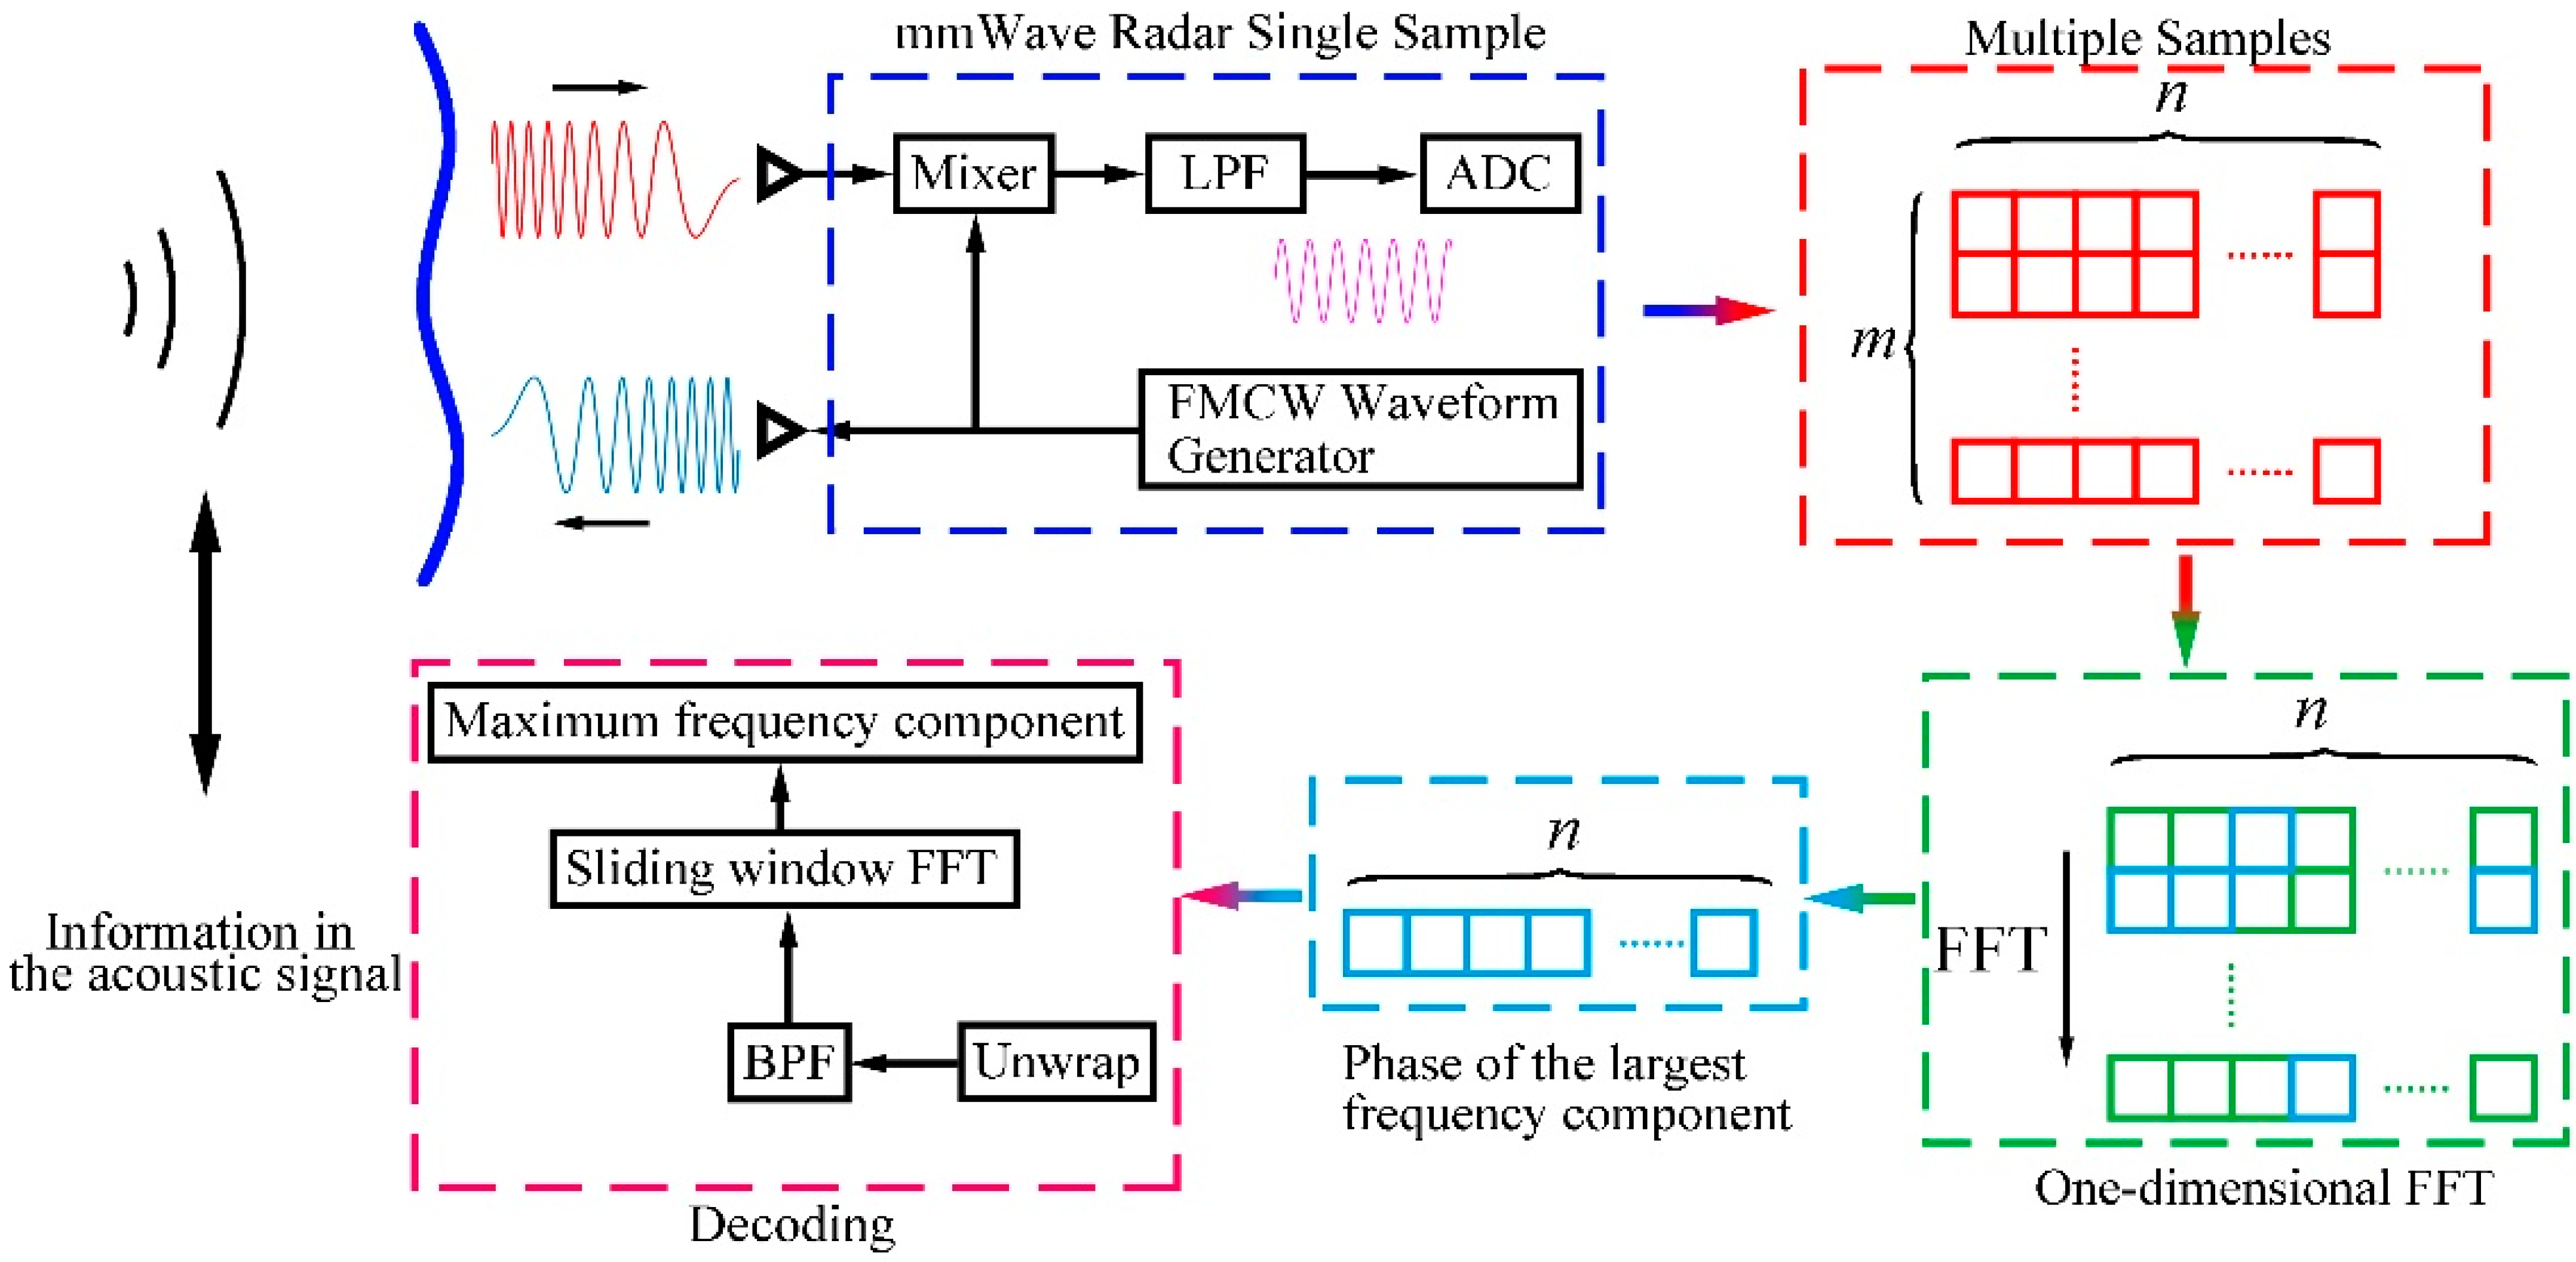
2.1.3. Detection of Water Surface Wave by MMWR
Above the water surface, a radar transmits frequency modulated continuous waves (FMCW) for measuring the amplitudes of the surface wave. The transmitted signal from the radar is mixed with the received signal to generate an intermediate frequency signal (IF Signal). The phase of the IF signal is utilized to reconstruct the vibration waveform of the surface wave. The relationship between the received phase of the radar and the amplitude of a surface wave is described by the following equation [
22]:
In this equation, δ(t) represents the microamplitude of a surface wave, and λ denotes the wavelength of the radar transmitted signal. By performing the unwrapping process, the waveform and the true amplitude of the water surface can be restored.
2.2. Model Adjustments and Analysis
2.2.1. Multipath Fading Correction
Multipath fading occurs when acoustic waves encounter various propagation paths in water, such as direct, reflected, and scattered paths, leading to signal interference at the receiving end. In our experimental condition, the short transmission distance and relatively small time delay expansion result in narrowband fading, where only a random process reflecting a random amplitude and phase is added during the merging of multipath signals.
Due to the close transmission distance, multipath fading caused by the reflection of acoustic waves cannot be ignored, leading to an interference effect on the sound pressure at the water–air interface.
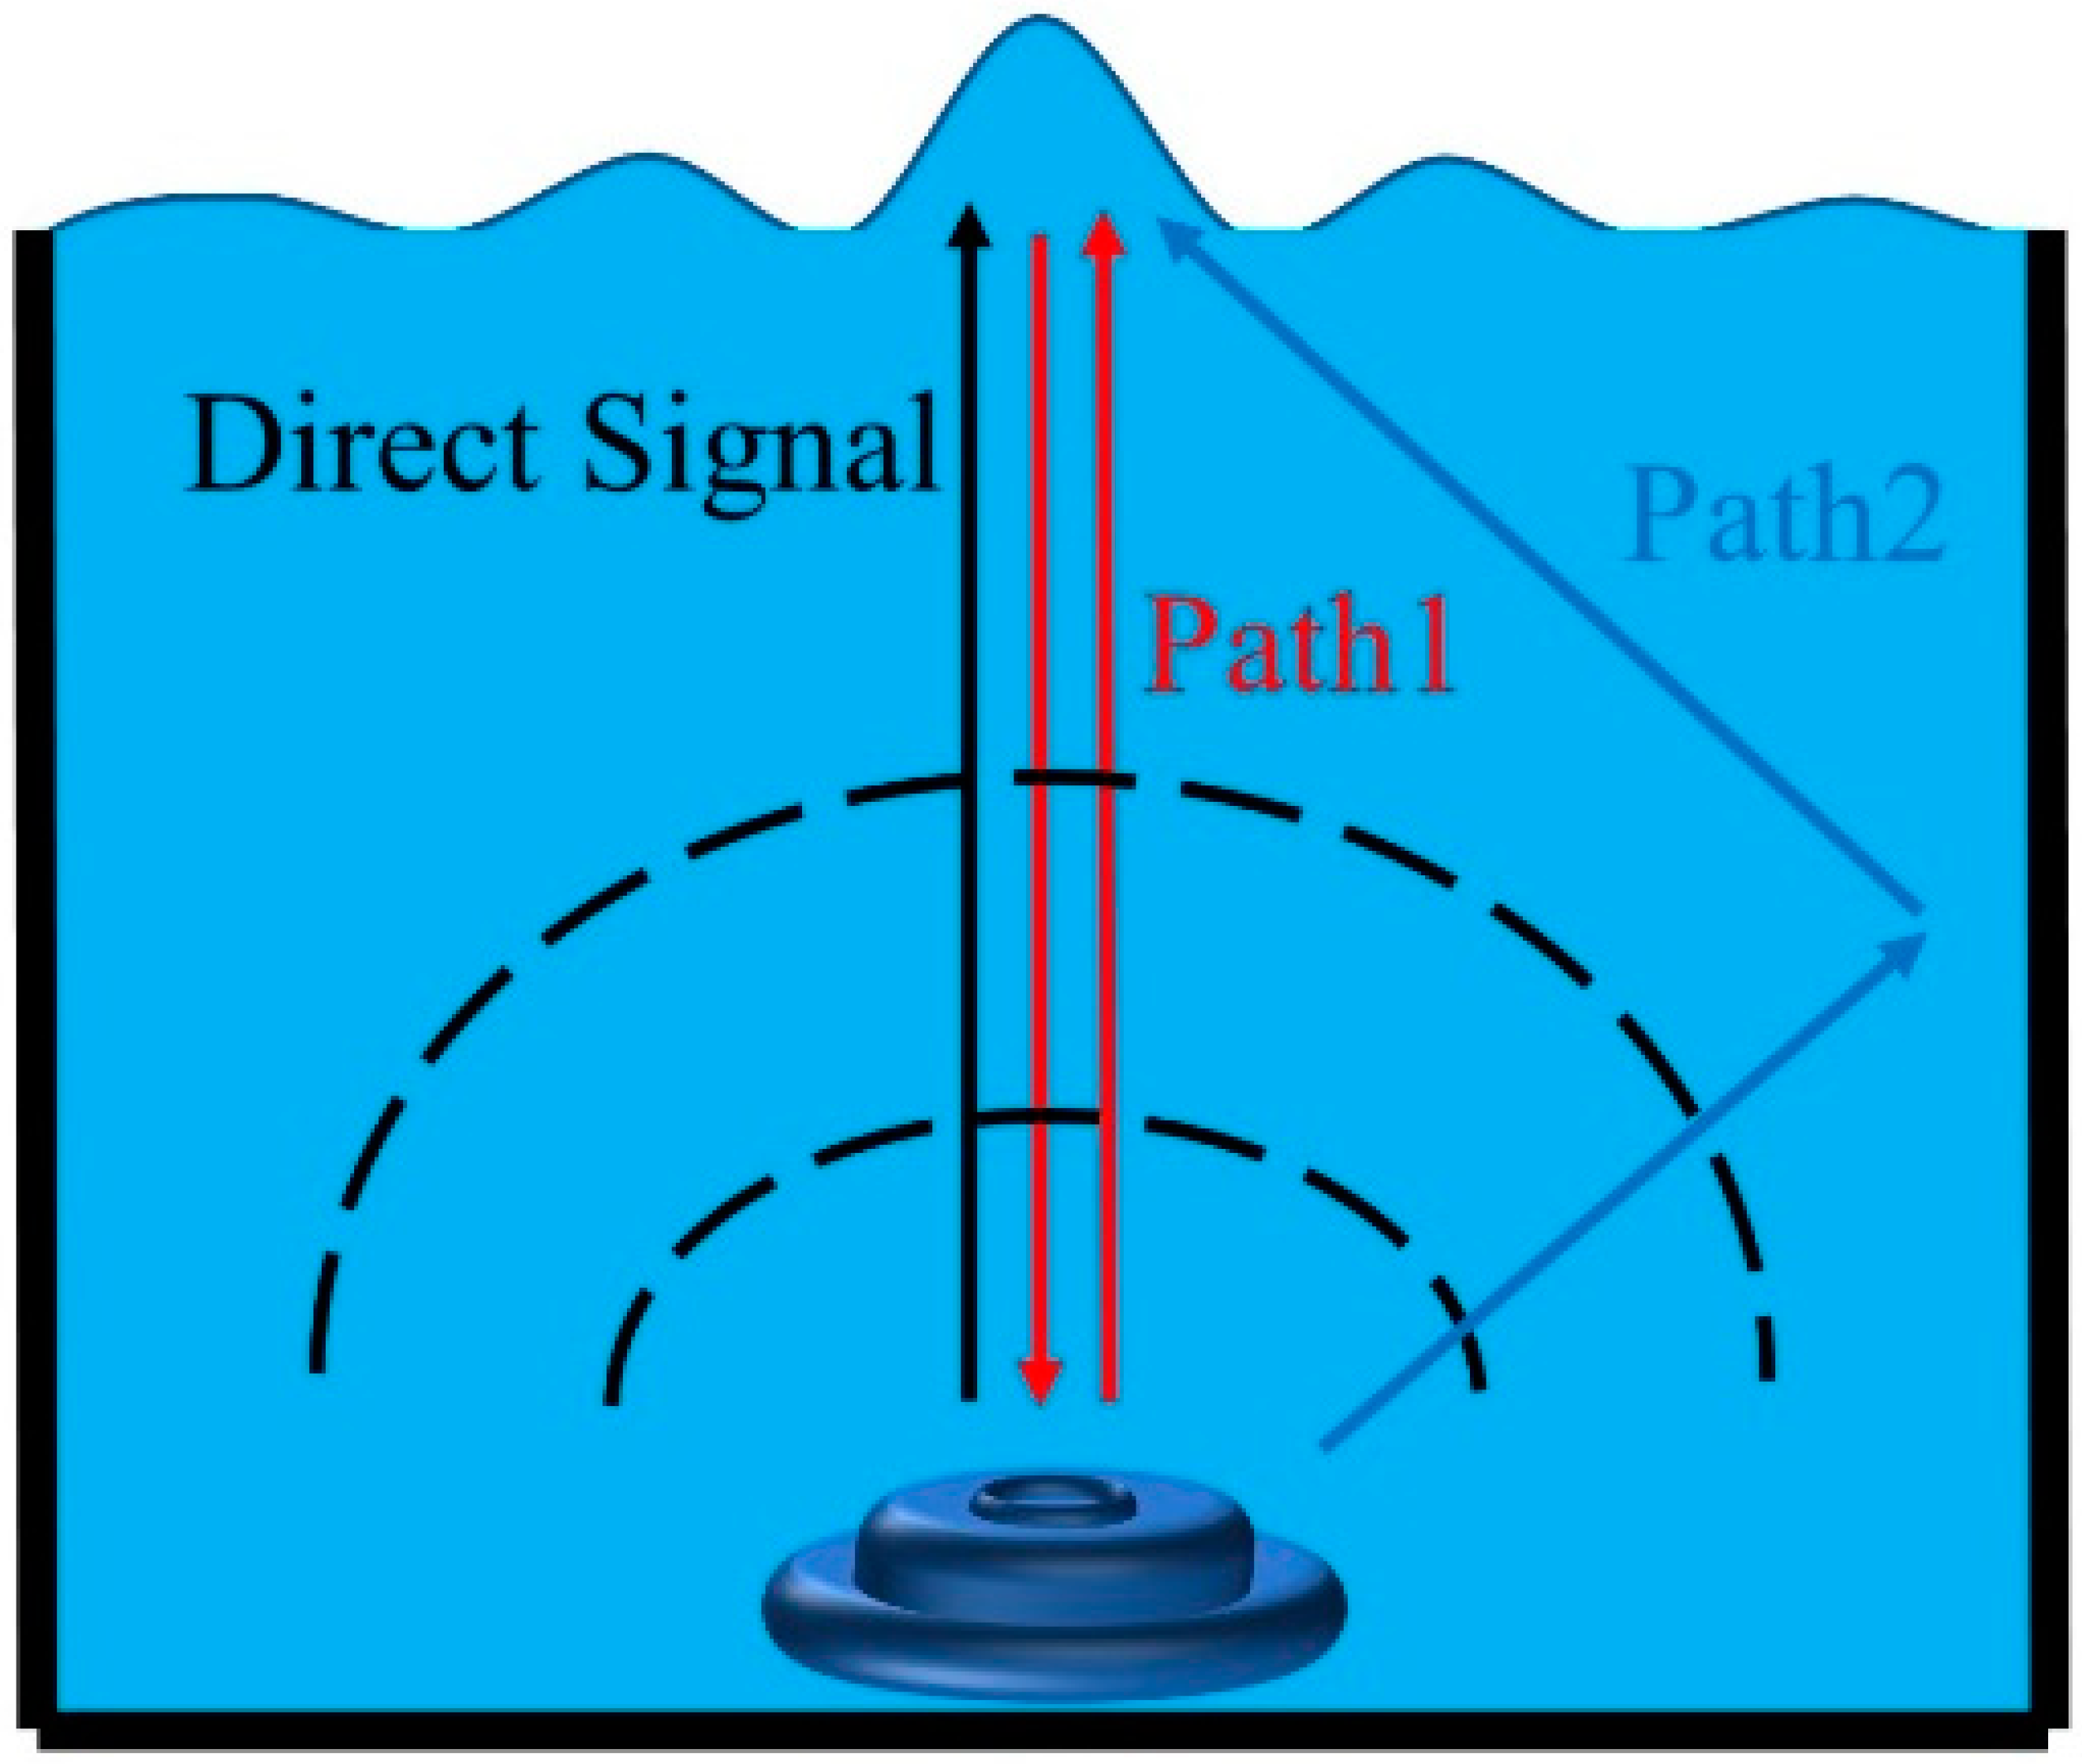
In the experimental conditions, multipath fading was observed along two main paths, as depicted in
Figure 2. One (Path 1) involved the vertical reflection of acoustic waves from the water surface to the speaker, followed by another vertical reflection from the speaker back to the water surface, resulting in multipath fading. The other (Path 2) was caused by the reflection of acoustic waves from the wall of the water tank covered with silencing cotton, resulting in multipath fading at the water–air interface.
Correcting for narrowband fading caused by multiple paths was not considered in the physical process; thus, a correction coefficient
ζ was added to the sound pressure at water surface. The correction equation is as follows:
2.2.2. Background Noise Target Component Correction
Despite the placement of the speaker at the bottom of the tank and the use of silencing cotton, the vibration remained unavoidable. This vibration at the water–air interface introduced a noise component at the target frequency, which affected the accurate calculation of the SNR. To address this, a correction coefficient
ε was introduced to the signal energy. The formal representation of this correction is as follows:
2.2.3. Second-Order Nonlinear Correction
The modeling of water surface waves involves fluctuation theory, which encompasses both linear and nonlinear approaches. In linear fluctuation theory, it is typically assumed that the fluctuations have a small amplitude, resulting in a negligible wave steepness. Higher-order terms in the wave equation can be disregarded, and only first-order terms are considered. Equation (5) represents a model of microamplitude waves at the water surface, derived using linear fluctuation theory. It is commonly accepted that fluctuations at the submicron level can be referred to as microamplitude waves.
However, in the current experimental setting, characterized by a shallow water depth and high sound pressure level, the amplitude of surface waves could reach several hundred micrometers, leading to a significant wave steepness. In this scenario, the microamplitude wave model derived from linear fluctuation theory was no longer suitable. To correct this, we introduced a quadratic correction coefficient
ηpi2 to the amplitude of the water surface, which can be expressed by the following correction formula:
2.3. SNR Model
The initial step was to capture background noise information. Since waves possess mechanical properties, they can be viewed as structural disturbances under similar conditions. As a result, the background noise could be collected in advance and incorporated into the model as additive noise
N(
t). To assess the total energy
EN of the background noise, a Fourier transform was applied to
N(
t) and a spectral analysis was conducted.
The acoustic signal emitted by the speaker was a single-frequency signal. As observed in [
28], a significant amplitude was only observed in water surface waves with the same frequency as the vibrating point source. The energy of the surface wave can be derived from the energy of a single-frequency signal using the following formula:
where
T is the time of acquisition, and the expression for
SNR is deduced as:
where
Ps stands for the power of the signal and
Pn is the power of the noise. By substituting the system parameters into the SNR calculation Formula (13), we can derive the SNR model as expressed in Formula (14). In addition,
ζ represents the correction coefficient for underwater acoustic interference caused by underwater multipath attenuation;
ε denotes the correction coefficient for the signal gain resulting from the energy component of the box vibration at the target frequency, which is very small;
η is the nonlinear correction coefficient for the linear fluctuation theory.
In constructing this model, some fundamental assumptions were made. We assumed that the water surface waves collected by the radar were accurate and unaffected by other interference factors. Moreover, we assumed that the underwater acoustic waves were transmitted in the form of spherical waves, aiding in simplifying the model and enhancing the accuracy of predictions. This channel model differs significantly from existing models in several key aspects. By introducing correction coefficients, our model optimized the influence of environmental factors to accurately reflect the actual communication environment. Unlike the linear waveforms commonly used in existing models, we carried out nonlinear optimization on the waveforms of the water surface waves, aiding in describing and predicting communication performance more accurately. Through these optimizations, our model is capable of providing more intuitive and practical communication performance metrics, offering valuable references for practical applications.
2.4. Verification of Cross-Medium Communication Channel Model
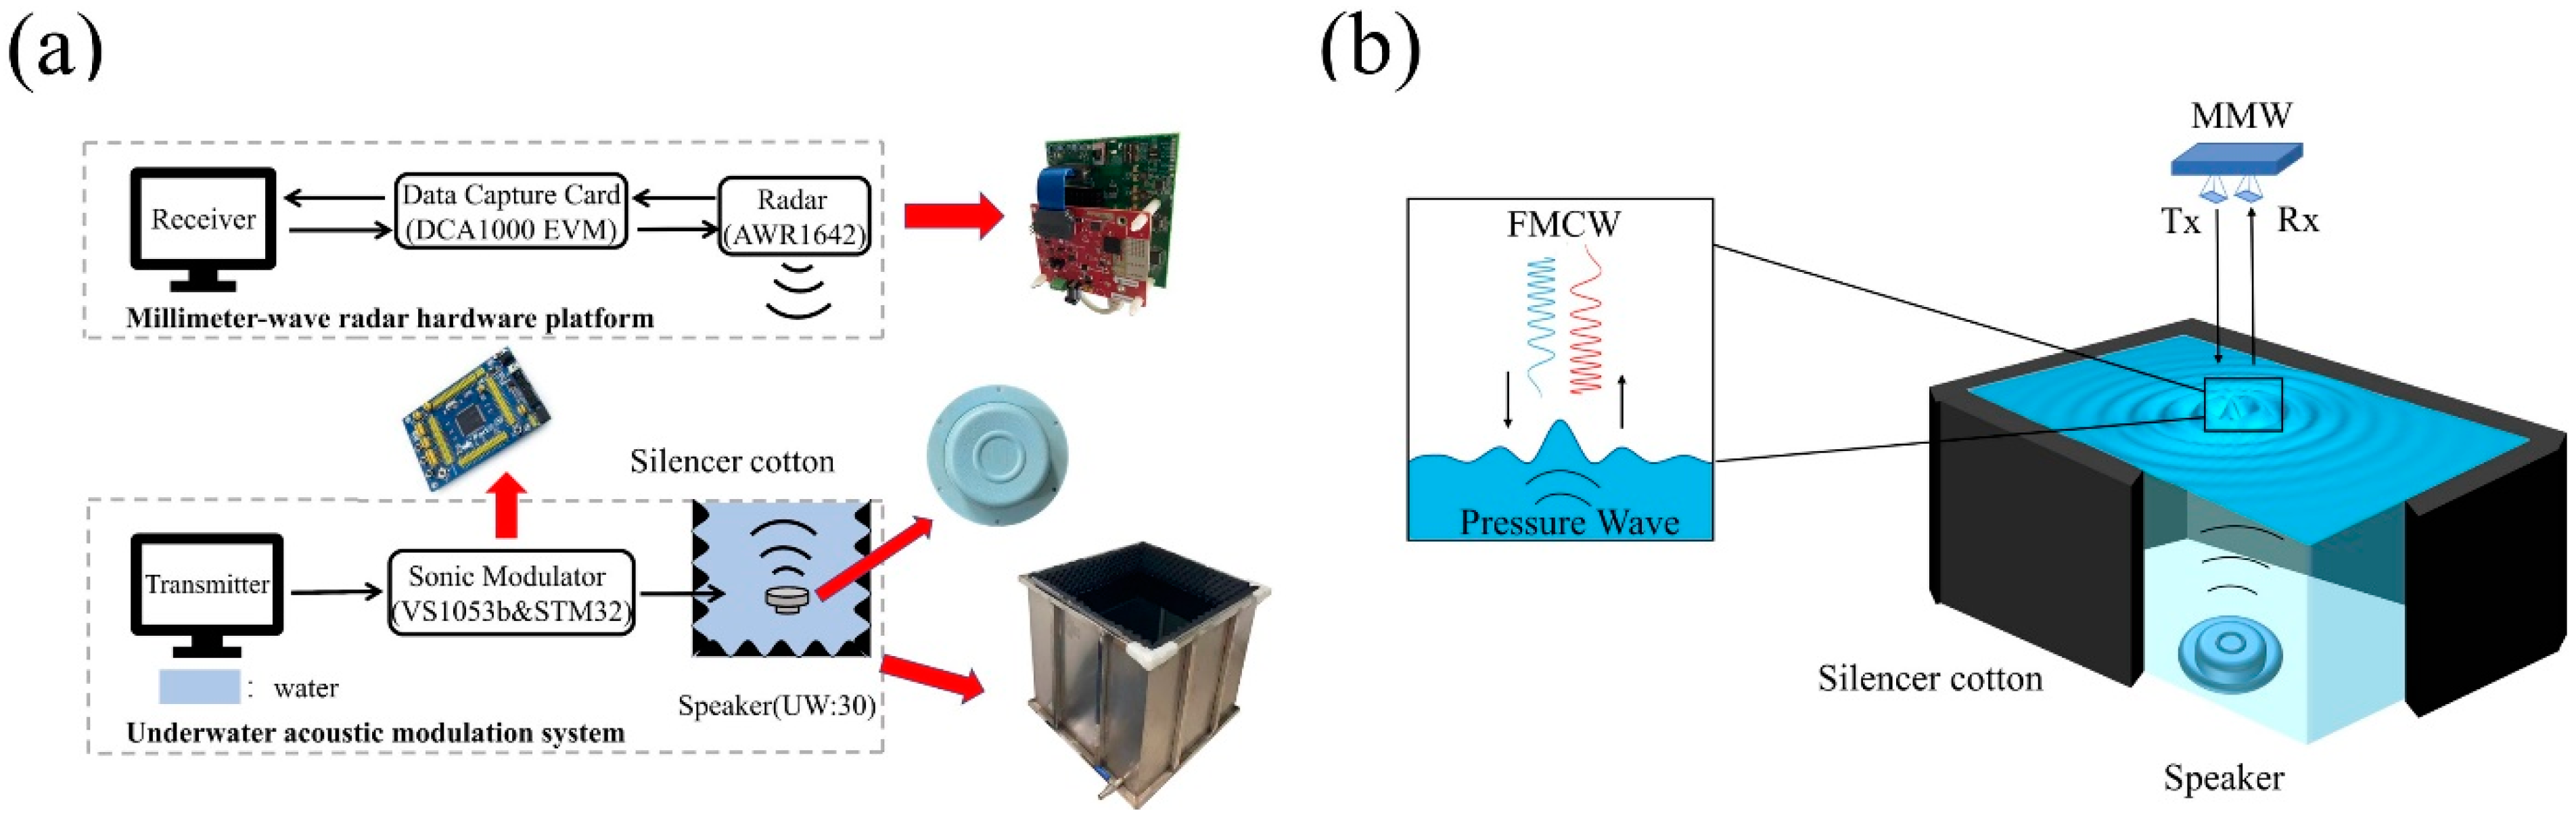
A water-to-air cross-medium communication system was constructed to validate the model’s accuracy. The equipment and system diagrams are depicted in
Figure 3. A single frequency acoustic signal was emitted underwater from a UW:30 speaker. The surface waves, triggered by the acoustic signal propagating to the water surface, were detected using the AWR1642 mm wave radar board provided by TI. The inside of the metal box containing the water and the power cable of the speaker were silenced using silencer cotton, which minimized the impact of external sound, the box, multipath interference, and the vibration of the power cable at the water surface.
2.4.1. Noise Test at Silent Source
Initially, the background noise
N(
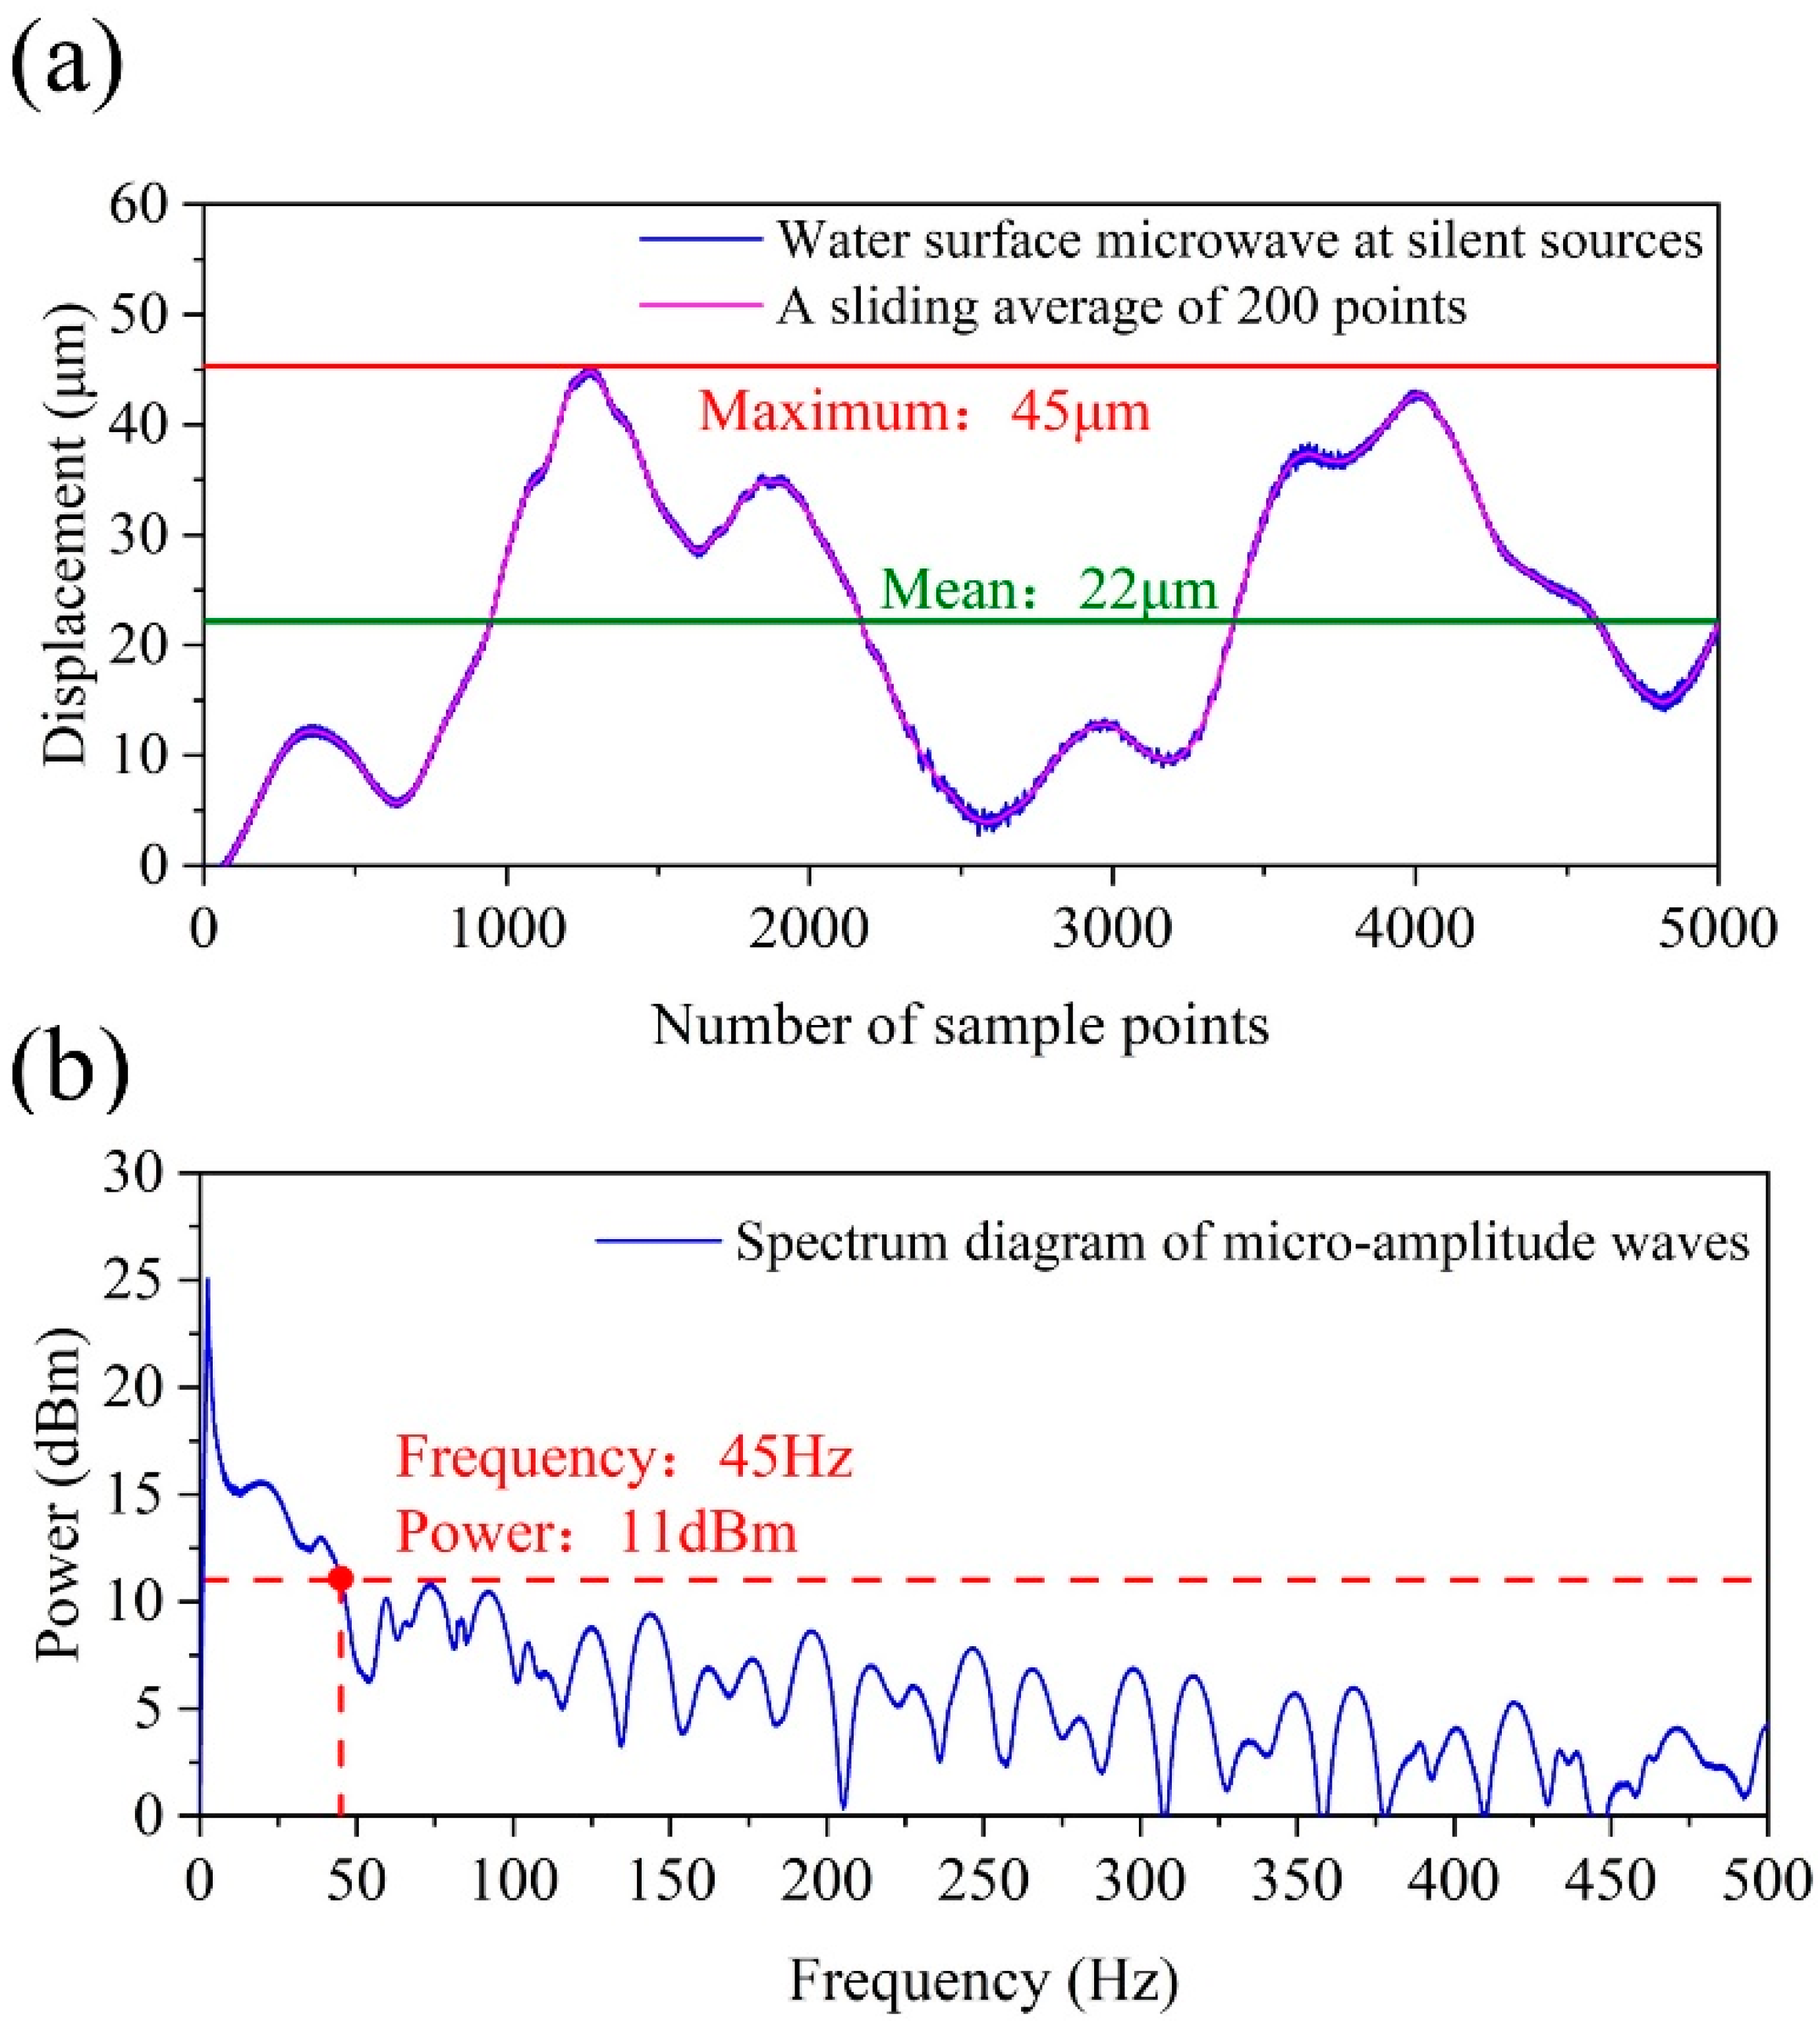
t) in the system needed to be measured as an additive component. This noise served as background noise for the model and its measurement was crucial for an accurate analysis. To capture the time-domain signal of the noise, the waveform of the water surface waves can be recorded using MMWR. This should be done with the speaker, which was energized but did not emit any acoustic signals. However, solely analyzing the time domain signal was insufficient for understanding the noise characteristics. A spectral analysis was necessary to gain further insights into its properties. The obtained test results are presented in
Figure 4.
Based on our measurements, the following conclusions can be drawn. In the time domain, the maximum value of the surface wave amplitude in 5 s is 45 μm. In the absence of an acoustic signal, the amplitude of the surface wave reaches the micron level. The influence of the environment on water–air cross-medium communication cannot be overlooked. In the frequency domain, noise energy predominantly resides in the low-frequency range from 0 Hz to 45 Hz. To minimize the impact of noise, it is advisable to avoid utilizing this frequency band for information transmission. Consequently, for effective communication, a carrier frequency of at least 100 Hz is necessary. To mitigate noise interference on the transmitted signal and enhance communication quality and stability, it is recommended to configure the filter with a low cut-off frequency of 100 Hz.
2.4.2. SNR under Different Water Depths with an Acoustic Signal
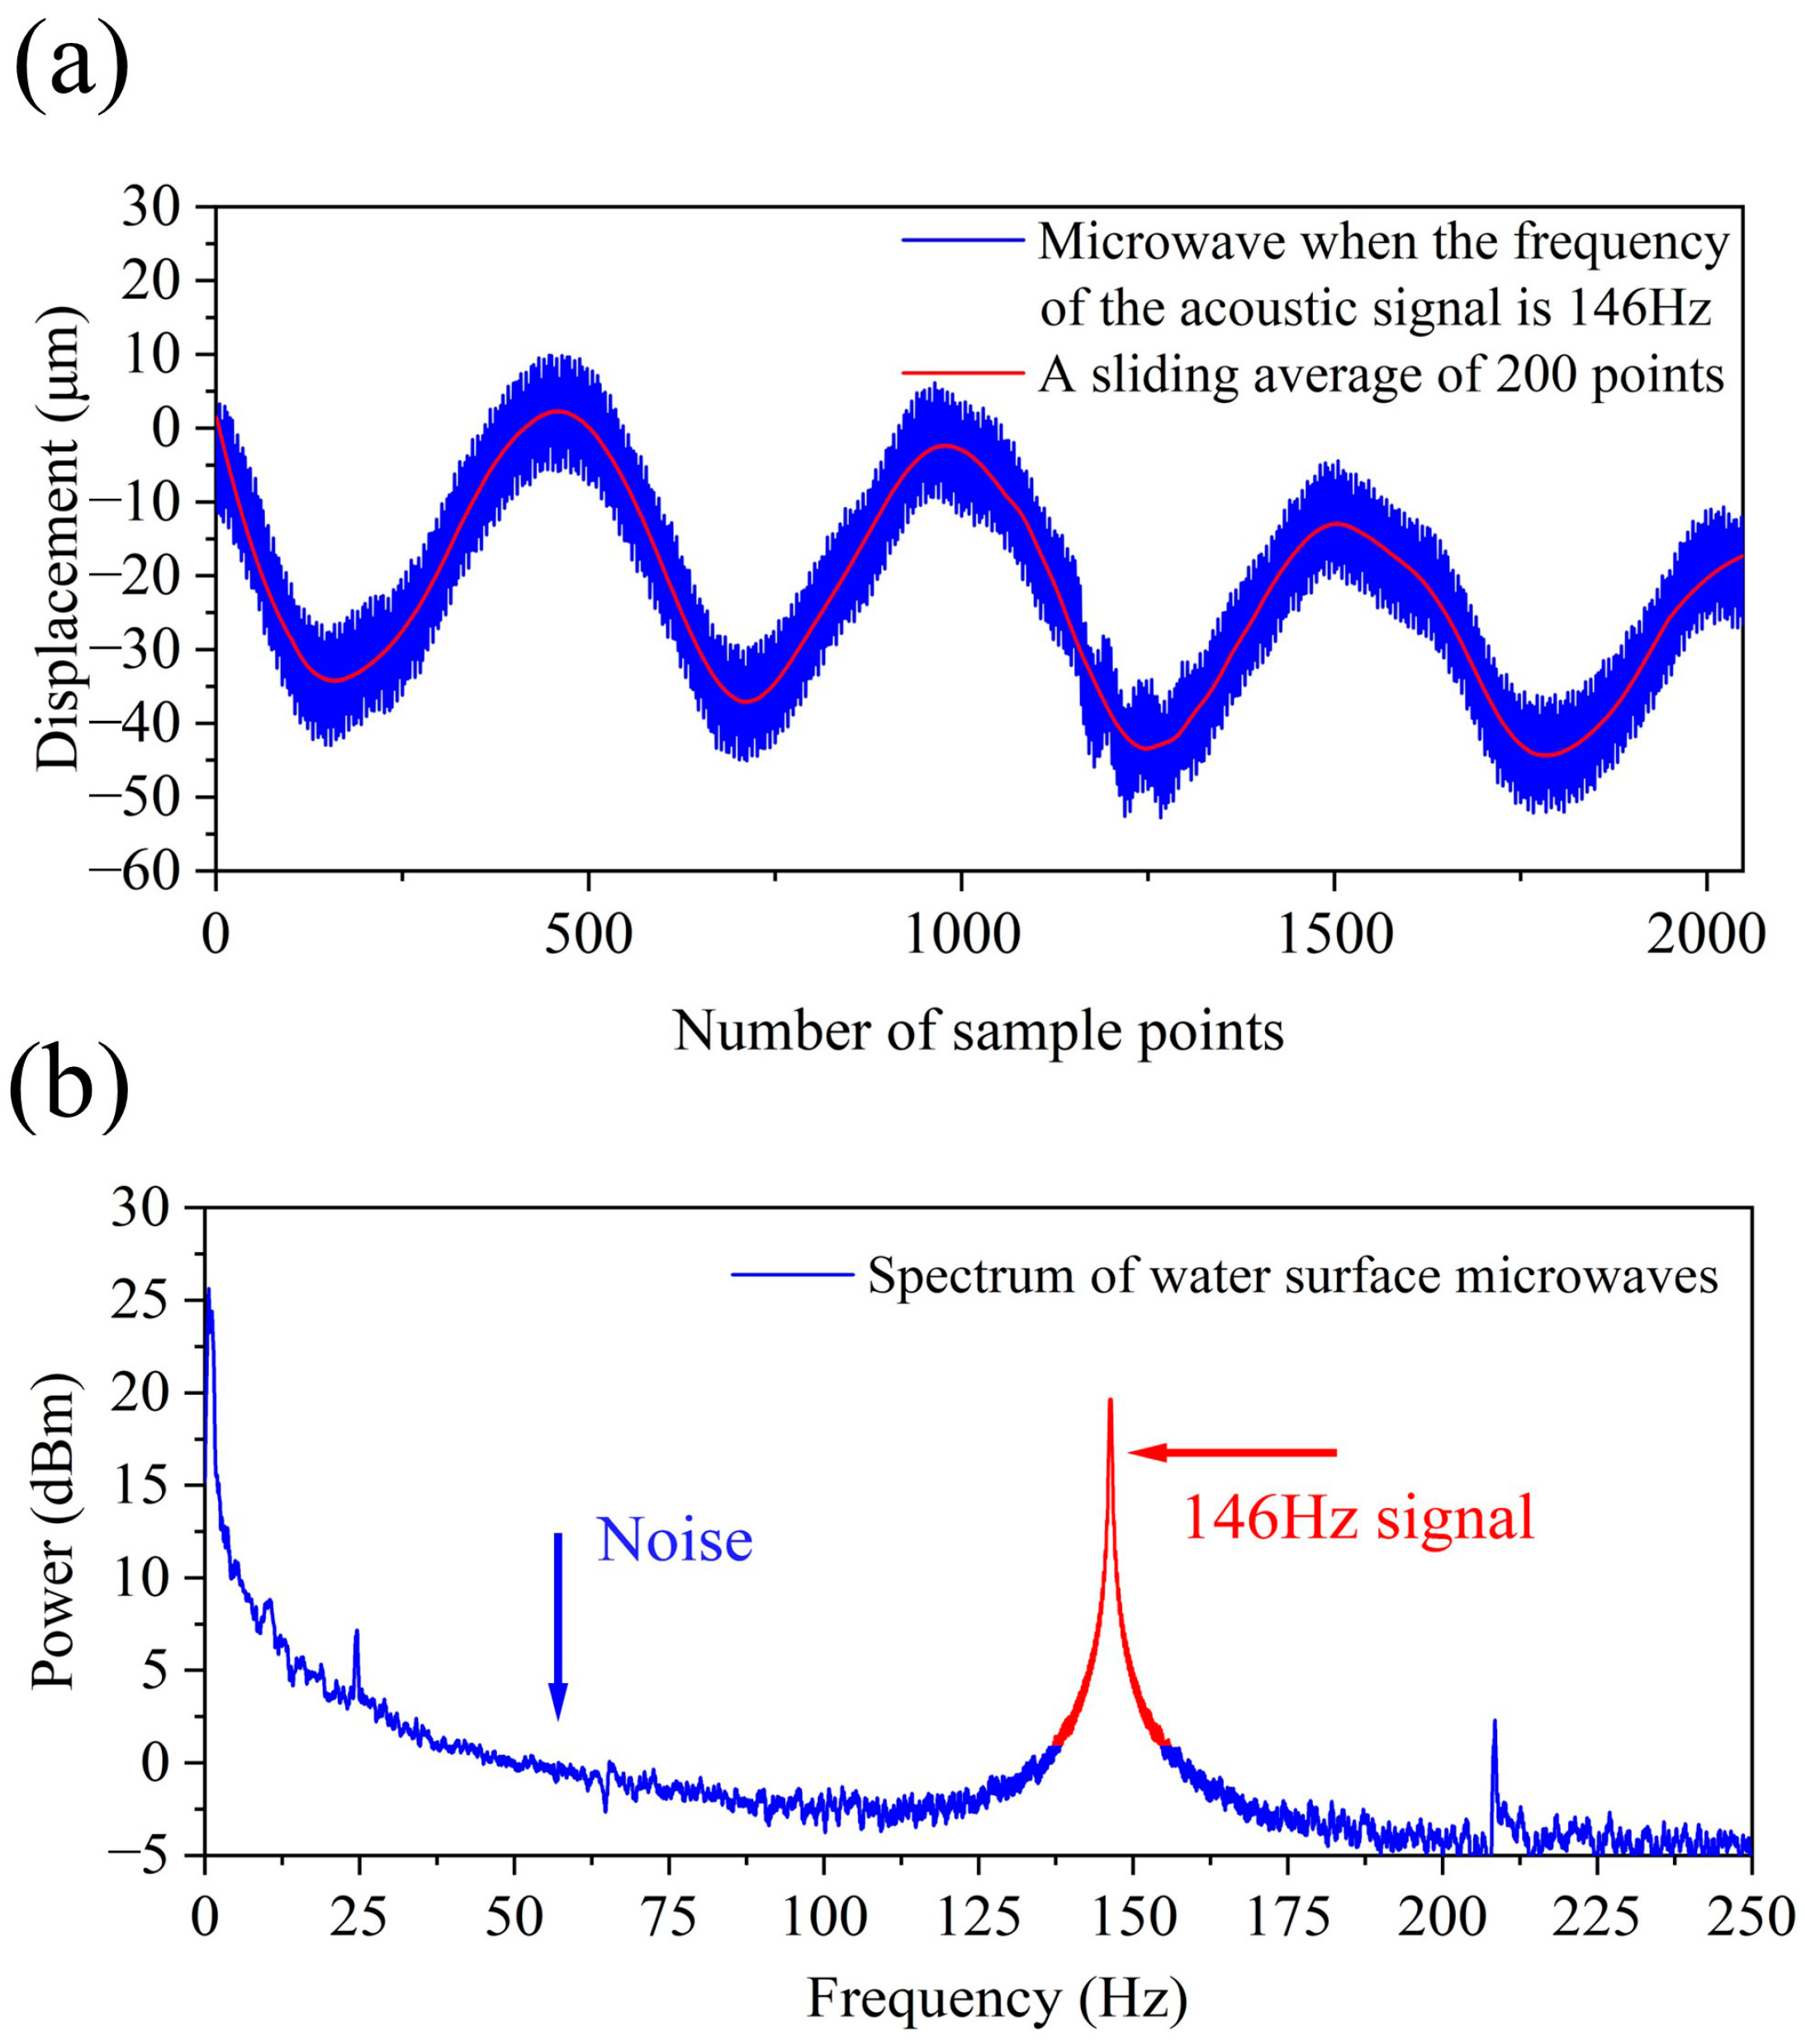
Water surface waves produced by an acoustic signal with a frequency of 146 Hz were detected within the depth range from 10 cm to 60 cm. The sampling interval was set at 5 cm, and the experiment needed to be repeated four times for each group.
Figure 5 displays the time domain and frequency domain plots of the surface waves when the water depth was 20 cm. The measured results indicate an SNR of 1.7 dB. Although the SNR value appears low, a distinct peak is clearly observable in
Figure 5 following the Fourier transformation. The utilization of peak extraction allowed for effective information decoding, thereby demonstrating the efficacy of the communication model even under lower SNR conditions.
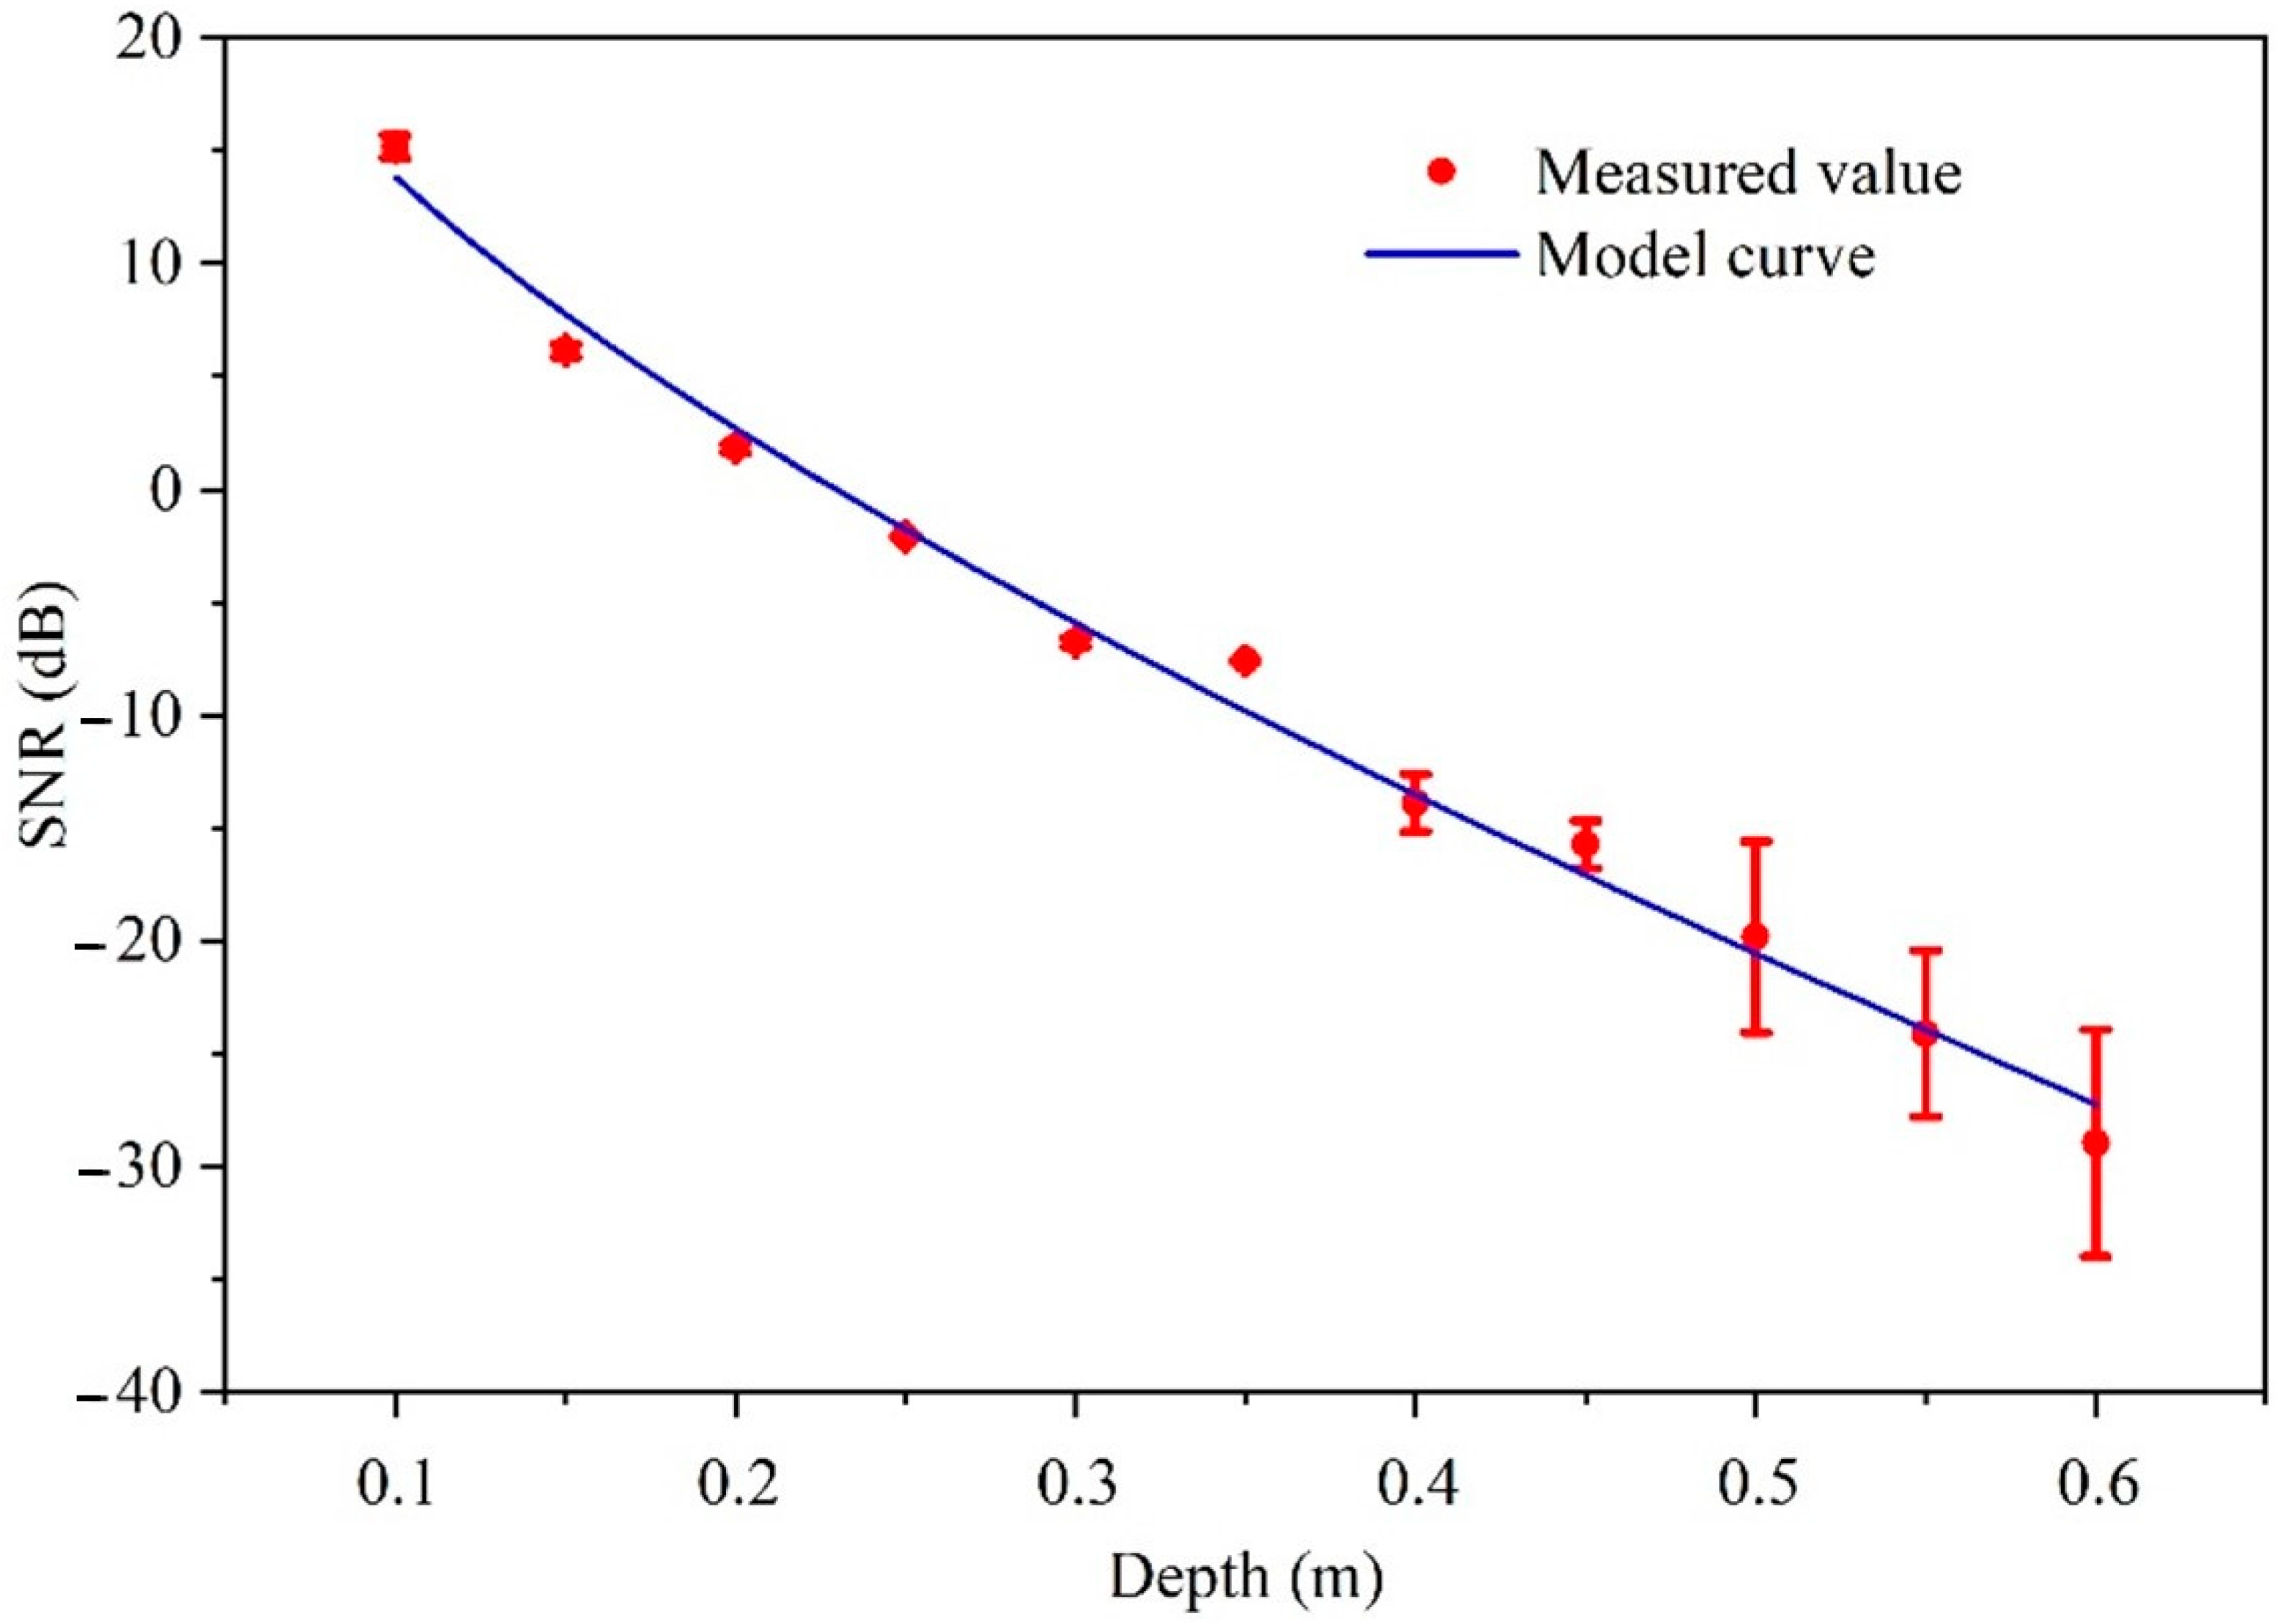
The SNR values were measured at different water depths in multiple experiments are shown in
Figure 6. Measured data are visualized as red dots, while the model solution is represented by blue lines. Under the premise of water surface waves at the hundred-micron level, applying the model from Equation (5) directly, the calculated amplitude value differs from the actual value by three orders of magnitude, as this model was established under linear microamplitude wave conditions. Through nonlinear correction and environmental factor adjustments, our model achieved a high degree of correlation with the experimental data. The coefficient of determination, which quantifies the agreement between the measured data and the model calculations, was 0.982. This high
R2 value significantly underscores the strong correlation between the observed data and the model predictions, showcasing the robustness and accuracy of our model in simulating the real-world scenario. In the results, the correction coefficient for multipath attenuation,
ζ, was determined to be 1.267 in the modeling equation. The energy correction coefficient for the box vibration,
ε, was determined to be 2.607 × 10
−14. The correction coefficient for second-order nonlinearity,
η, was determined to be 2.234 × 10
−10. This indicates that the measured results were in high agreement with the model, verifying that the model we built demonstrates high reliability and predictive capability.
In general scenarios, obtaining these coefficients necessitates model fitting. During model fitting, it is imperative to accurately constrain the range of correction coefficients based on the specific experimental conditions to ensure the authenticity and reliability of the coefficients. The range of correction factors based on our experimental conditions, hardware facilities, and identified sources of error is shown in
Table 1 below. This required multiple iterations of calculations to find the optimal correction coefficient values that suited the experimental conditions.
According to the experimental results cited in reference [
22], it is observed that the amplitude of the surface wave decreased significantly when the frequency exceeded 300 Hz. This reduction in amplitude can have a negative impact on communication quality and lead to an increase in the bit error rate (BER). In order to achieve higher quality cross-medium communication, it is recommended to use a carrier frequency below 300 Hz. Additionally, setting the high cut-off frequency of the filter to 300 Hz will help ensure a better communication performance.
4. Conclusions
In conclusion, we introduced a novel SNR channel model for evaluating the performance of the TARF communication system based on the amplitude characteristics observed in experimental conditions. We successfully corrected the original submicron level microamplitude wave model to a water surface amplitude model suitable for our experimental conditions through second-order nonlinear correction, and incorporated environmental factor corrections for box vibration and multipath effects. To obtain a more accurate and universal TARF channel model, there is an urgent need to develop a sound-induced water surface wave model that can accommodate a variety of nonlinear wave conditions, such as microamplitude and finite amplitude waves, which will be the foundation and key to constructing the TARF channel model. The proposed model was validated through experimental results, demonstrating a high correlation coefficient of 0.982. This high degree of correlation validates the effectiveness of the model and instills confidence in its applicability for analyzing and optimizing the communication performance in cross-medium uplink communication. Furthermore, a real-time water–air cross-medium communication system was developed, and communication experiments were conducted. Filtering and demodulation algorithms were designed to facilitate signal processing. The sliding Fourier transform method was applied to address issues such as speaker switching noise interference and intercode errors. Ultimately, the study achieved water–air cross-medium communication by combining acoustic and millimeter waves. The successful realization of water–air cross-medium communications merging acoustic and millimeter waves demonstrates the feasibility of the TARF communication system, unfurling promising horizons for ensuing research and progression. By thoroughly examining the amplitude characteristics and the corresponding SNR, the constructed model emerges as a pivotal tool for establishing the TARF uplink communication system. It aids in devising more robust and more efficient communication systems, propelling the advancement of water–air communication technology.
In upcoming sea trials, we aim to broaden the applicability of the TARF communication system in deep-water environments through several technical upgrades. Initially, addressing deep-water communication needs, we will replace existing loudspeakers with high-power acoustic transducers for clearer, more stable signal transmission in deeper waters, and employ higher resolution millimeter-wave radars to extend the maximum transmissible distance. Additionally, we plan to utilize efficient modulation techniques to enhance communication rates and system scalability. As the transmission distance and depth increase, we aim to develop more comprehensive channel models to accommodate varied application scenarios.
Subsequently, we will select suitable sea areas for trials, conducting them aboard vessels on the appointed day. We will place upgraded acoustic transducers at deeper locations, emitting preset acoustic signals, and use high-resolution radar systems on the water surface to monitor water surface fluctuations caused by acoustic signals in real time to decode the original information. The collected data will help assess the signal-to-noise ratio to measure the communication quality and stability and provide valuable insights for constructing and validating channel models for deeper waters. However, we recognize that TARF technology’s scalability is affected by inherent limitations like multipath effects due to environmental conditions, severe high-frequency signal attenuation underwater, and susceptibility to wind and waves. We anticipate that data from sea trials will offer insights into these limitations, aiding in identifying technical solutions to optimize TARF technology in future research.

 ,
, 


