Article

Vortex-Induced Vibration and Fatigue Damage Assessment for a Submarine Pipeline on a Sand Wave Seabed

1
CNOOC Research Institute Co., Ltd., Beijing 100028, China
2
State Key Laboratory of Hydraulic Engineering Simulation and Safety, Tianjin University, Tianjin 300350, China
3
Key Laboratory of Earthquake Engineering Simulation and Seismic Resilience of China Earthquake Administration, Tianjin University, Tianjin 300350, China
*
Author to whom correspondence should be addressed.
J. Mar. Sci. Eng. 2023, 11(10), 2031; https://doi.org/10.3390/jmse11102031
Submission received: 2 September 2023 / Revised: 7 October 2023 / Accepted: 21 October 2023 / Published: 23 October 2023
(This article belongs to the Special Issue CFD Analysis in Ocean Engineering)

Abstract

:
Sand waves are commonly formed on the sandy seabed of the continental shelf and characterized by their regular wave-like shape. When a submarine pipeline is laid on this type of seabed, it often experiences free spans due to the unevenness of the seabed. These free spans are particularly vulnerable to vortex-induced vibration (VIV) and the resulting fatigue damage, which have been identified as the primary causes of pipeline failures in offshore oil and gas exploration. This study examines the VIV and fatigue damage of free spans in a submarine pipeline in the Lufeng oilfield, which is located in a large area of sand waves. The assessment conditions encompass the as-laid empty state, the flooded state, and the operational state. Additionally, both the minimum and maximum lay tension are taken into account during the evaluation of VIV and fatigue. The VIV onset screening conducted revealed a considerable number of pipeline free spans exceeding the VIV onset span lengths under both temporary and operating conditions for the non-trench seabed. Furthermore, the analyses indicate that the pipeline does not meet the criteria for VIV fatigue on a non-trenched seabed. Consequently, a proposed solution of implementing a 1 m trench rectification measure for the seabed is recommended. The results demonstrate that this measure effectively mitigates the occurrence of VIV and subsequently reduces fatigue damage across all conditions.

1. Introduction

Submarine pipelines serve as a crucial means of transportation for offshore oil and gas resources. During the installation of a pipeline on the seabed, the presence of free spans may arise due to local scour or unevenness of the seabed, such as sand waves [1]. As fluid flow passes through a spanning pipeline, vortex shedding frequently occurs in the wake region, leading to periodic vibration known as vortex-induced vibration (VIV). These VIVs have been recognized as a significant factor contributing to fatigue damage in pipeline systems within practical engineering applications [2]. In the event of accidental damage to a pipeline, the subsequent consequences can be extensive and require prompt and effective remedial actions [3,4].
The study of free spans of offshore pipelines has been the subject of extensive research and engineering attention in previous decades, due to their significant engineering implications [5,6,7,8,9,10]. Free spans can arise along a pipeline as a result of local scour induced by the piping mechanism [5,6]. Once local scour is initiated beneath the pipeline, it propagates and results in the formation of free spans. Previous research has thoroughly examined the formation of free spans caused by local scour. The impact of important parameters on the propagation of free spans along the pipeline has been investigated [7,8,9].
Sand waves are also a significant factor contributing to the occurrence of free spans in submarine pipelines [10]. Sand waves are commonly found on continental shelves and display distinct wave-lengths, typically ranging from tens to hundreds of meters, with wave heights reaching several meters or more. As a result, they can cause unevenness of the seabed and the formation of free spans in pipelines after installation [11,12,13]. Notably, a considerable number of sand waves have been observed on the northeast continental slope in the South China Sea, specifically within the water depth range of 140 m to 350 m, where the Lufeng oil fields are located [14,15]. A long-distance gas pipeline is crossing the sand wave area. The sand waves exhibit dynamic behavior and are capable of moving several meters annually due to the strong subaqueous current. The movement of sand waves presents a potential hazard of burying or suspending the submarine pipelines. Figure 1a depicts the bathymetry along the pipeline route that traverses the sand wave area, while Figure 1b highlights the existence of multiple free spans on the pipeline [16].
The presence of free spans and the consequent VIV significantly impact the on-bottom stability and structural integrity of pipelines, necessitating their consideration in pipeline design [1,17]. Extensive research has been conducted on the VIV characteristics of pipelines located near a seabed [18,19,20,21,22]. In Choi [18], closed-form solutions of the beam–column equation, considering tension and compressive force, were derived for the various possible boundary conditions to analyze the free spans of a pipeline. Wang et al. [19] have emphasized the potential of VIV to cause fatigue-related issues in pipelines, leading to a compromise in their structural integrity and requiring expensive remediation and intervention measures. Sollund et al. [20] investigate the wave-induced fatigue damage on multi-span pipelines and proposed an analysis method, which accounts for non-linear hydrodynamic loading and dynamic interaction between adjacent spans. Zhu et al. [21] experimentally investigated the VIV and solid-structure impact of a near-bottom horizontal flexible pipeline in oblique shear flows. In Xu et al. [22], experimental tests were conducted to examine the VIV characteristics of multi-span pipelines and to investigate the mechanism of interaction between multiple spans. Currently, the evaluation of VIV primarily concentrates on pipelines laid on a flat seabed.
However, despite the recognition of sand waves as a primary contributor to the occurrence of free spans in submarine pipelines, limited research has been conducted on the specific association between sand waves and pipeline free spans. Morelissen et al. [10] presented a model that describes and predicts the dynamics of sand waves, offering crucial bed-level input for the pipeline–seabed interaction model. This model enables the prediction of the pipelines self-lowering in response to exposures caused by sand wave migration. Pu et al. [23] further highlighted the potential risks posed to pipelines by the migration of large-scale sand waves, as the free span on both sides of the sand wave continues to expand. Wang et al. [24] carried out simulations of plough dynamic performance for three distinct types of sand waves and revealed that sand waves exert considerable influence on the tow force.
To date, there has been a lack of scholarly investigation regarding the evaluation of free spans of pipelines situated on the sand wave seabed, particularly concerning the resultant impacts of VIV and fatigue damage. This insufficiency of investigation can be attributed to the lack of empirical data pertaining to the sand wave seabed and pipelines in real-world scenarios. Additionally, there exists a scarcity of suitable methodologies to alleviate the adverse impact of sand waves on pipeline integrity [17].
This study analyzes the measuring data of seabed profiles and pipeline positions obtained from a practical engineering project conducted in the Lufeng oil field. By utilizing real measured data and design codes, this study assesses the VIV and resultant fatigue damage. This study also obtains the general characteristics of pipelines situated on a sand wave seabed. Additionally, a preliminary assessment is conducted in accordance with DNVGL-RP-F105 [2] to calculate the VIV onset screening span lengths along the pipeline route. The fatigue induced by VIV on specific free spans is evaluated following the guidelines provided by DNV-OS-F101 [17] and DNVGL-RP-C203 [25]. The objective is to ascertain the necessity of any seabed intervention, either prior to or after the laying process. Subsequently, a viable solution is suggested to mitigate the occurrence of VIV and the resulting fatigue damage on the seabed affected by sand waves. This paper is structured into five sections. Section 1 provides an introduction to the research background and highlights the significance of the work. Section 2 outlines the assessment methodology employed for the identification of VIV onset and fatigue damage. In Section 3, a comprehensive VIV Onset Span Screening is conducted for both non-trench and 1 m trench seabed scenarios. Section 4 focuses on the evaluation of VIV fatigue damage for the spanning pipeline. Finally, the paper concludes with a section presenting several concluding remarks.

2. Methodology

2.1. VIV and Fatigue Assessment

The determination of the span lengths at which VIV initiates involves equating the structural natural frequency of the pipeline span with the frequency associated with the onset of VIV for the local flow, while incorporating the appropriate partial safety factors, as below:
f 1 > U e x t r e m e γ f V R , o n s e t D
where f1 is the structural natural frequency of the pipeline span; D is the outer diameter of the pipeline; VR,onset is the -reduced velocity for onset of VIV; Uextreme is the extreme local velocity; γf is the safety factors taken from DNVGL-RP-F105. In Equation (1), the natural frequency corresponding to the critical span length can be determined.
The span length corresponding to this frequency represents the minimum threshold for VIV occurrence. To ascertain the natural frequencies and corresponding eigen mode shapes of a specific span, a modal analysis is conducted. An empirical formula for the natural frequency can be expressed as below:
f 1 C 1 1 + C S F E I m e L e f f 4 1 + S e f f P c r + C 3 δ D 2
where Leff is the effective onset span length of the pipeline; EI is the bending stiffness; me is the effective mass; Seff is the effective axial force; Pcr is the critical buckling force; δ is the static deflection; CSF is the concrete stiffness enhancement factor; and C1 and C3 are the boundary condition coefficients. In Equation (2), the onset span length of the pipeline can be obtained.
The finite element model is employed to perform dynamic free span analysis on the pipeline, aiming to ascertain the accumulated VIV fatigue damage. This analysis is conducted for both a non-trenched seabed and a 1 m trench. The determination of VIV fatigue damage is carried out in accordance with the methodologies outlined in DNVGL-RP-F105 [2] and subsequently evaluated against the thresholds specified in DNV-OS-F101 [17]. The fatigue damage assessment is based on the accumulation law by Palmgren–Miner [2]:
D f a t = n i N i
where Dfat is the accumulated fatigue damage; Ni is the total number of stress cycles corresponding to the stress range Si; Ni is the number of cycles to failure at stress range Si; and Σ = implies summation over all stress fluctuations in the design life.
The number of cycles to failure at stress range S is defined by the S-N curve of the form:
N = a ¯ 1 S m 1 S > S s w a ¯ 2 S m 2 S S s w
where m1 and m2 are the fatigue exponents (the inverse slope of the bi-linear S-N curve); and a ¯ 1 , a ¯ 2 are the characteristic fatigue strength constant defined as the mean-minus-two-standard-deviation. Ssw is the stress at the intersection of the two S-N curves given by:
S s w = 10 l o g a ¯ 1 l o g N s w m 1
where Nsw is the number of cycles for which a change in the slope appears; and Log Nsw is typically 6 or 7.
The fatigue life capacity, Tlife, is formally expressed as:
T l i f e = 1 f c y c , i S i m P i a ¯
where Pi is the probability of occurrence for the “i”th stress cycle; and fcyc,I is the cycle counting frequency corresponding to the i-th stress cycle.
The presentation of fatigue damage solely focuses on the casing (outer) pipe, as it experiences greater stress ranges compared to the carrier pipe. The aforementioned methodology has been validated in several projects. The evaluation of fatigue damage is conducted under the subsequent pipeline conditions: (1) as-laid with no contents; (2) fully flooded; and (3) during operation (Design Condition—with average content density).
The assessment of fatigue damage is performed by employing the mode shapes and natural frequencies acquired from the finite element (FE) model. By integrating the extracted mode shapes and natural frequencies with the projected vibration amplitude resulting from each distinct combination of long-term environmental conditions, the fatigue damage of the spans can be determined. This is achieved through the utilization of the response and force models within the DNVGL-RP-F105 [2] framework. The numerical model has undergone rigorous verification through comparison with several engineering reports [16]. It is important to mention that the assessment does not include hydrotest, as its duration in this state is brief and fatigue during hydrotesting can be sufficiently estimated by the flooded condition.
In temporary conditions, a low safety class can be applied to all pipe locations. For operating conditions beyond the 500 m zone, a medium safety class is considered, while design life calculations are conducted in accordance with DNVGL-RP-F105 [2]:
η x T l i f e T exp o s u r e
where η is 0.5 for operating conditions outside of the 500 m high safety class zone and 0.25 within the high safety class zone. Temporary conditions are based off fatigue allowances during operation.

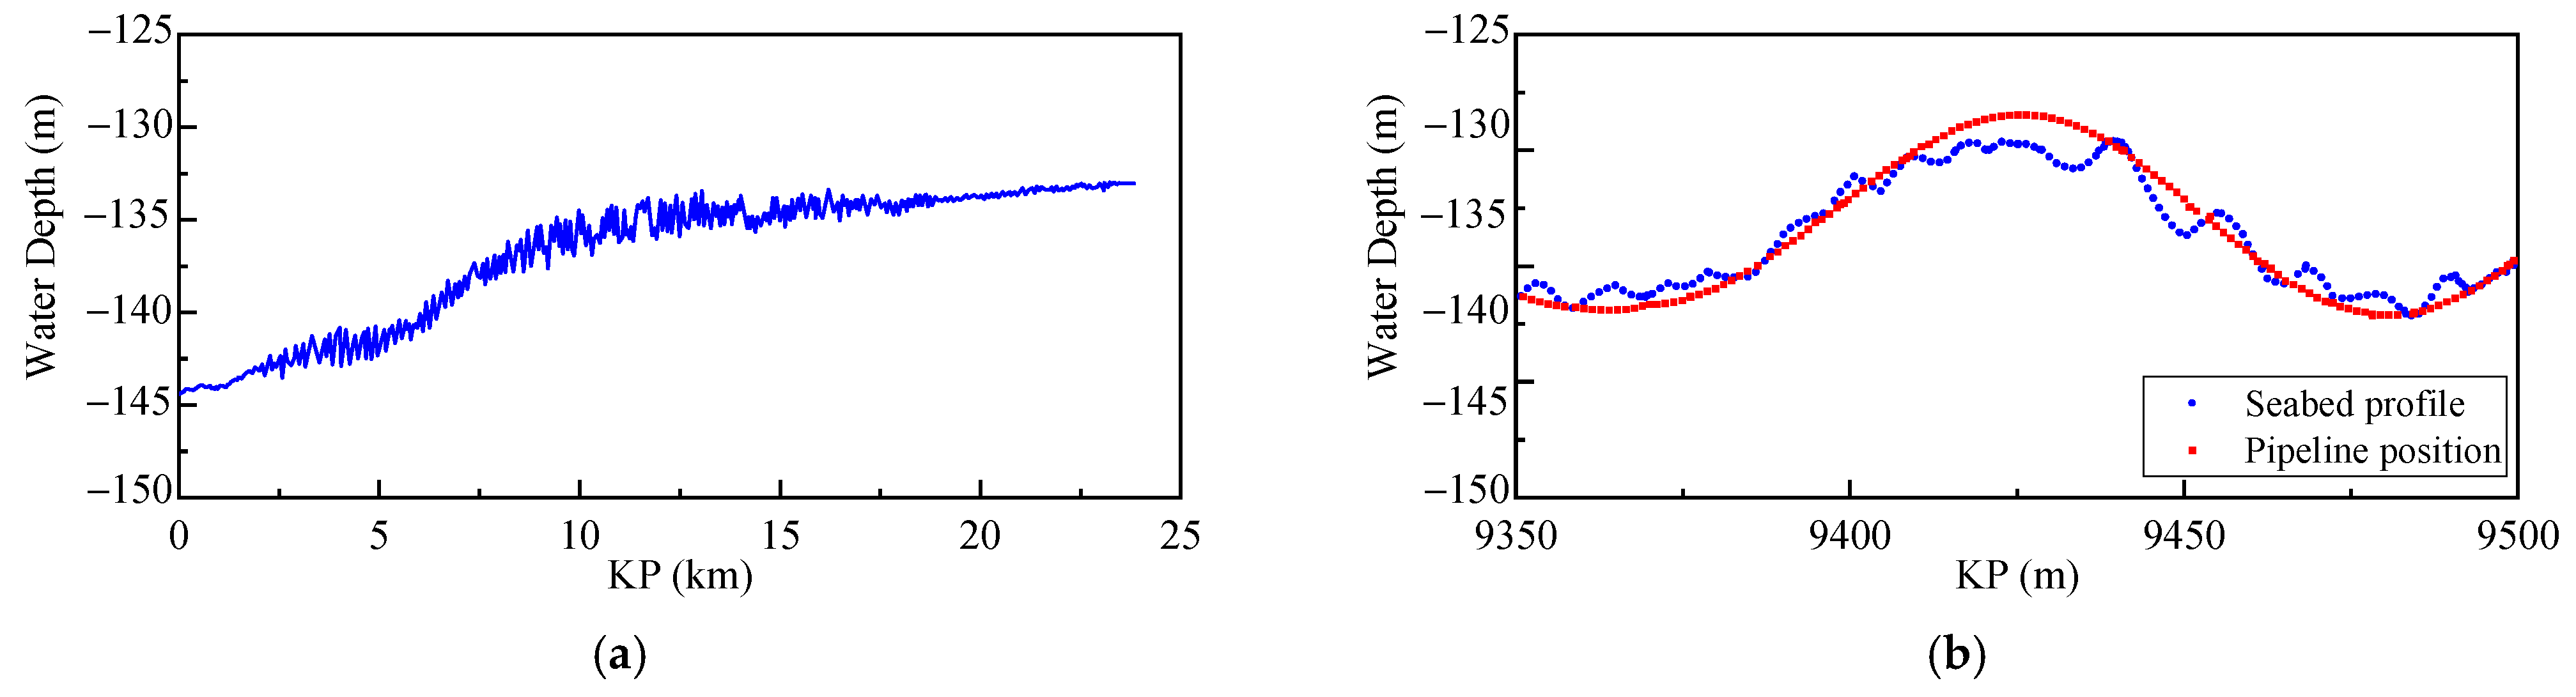
2.2. Model Description

The lengths of the vortex-induced vibration (VIV) onset spans are employed as an initial screening measure to ascertain the vulnerability of any spans to VIV fatigue throughout the design lifespan. The calculations for determining the VIV onset span lengths adhere to the stipulations outlined in DNVGL-RP-F105. In cases where the spans surpass the VIV onset conditions, a comprehensive analysis is conducted to quantify the extent of fatigue damage and to validate its acceptability. This analysis is also conducted in accordance with DNVGL-RP-F105.
The assessment of the free span is conducted using a finite element model solved by the commercial software ABAQUS (v6.13). The finite element models accurately replicate the pipeline’s behavior throughout its lifecycle, including installation on the seabed and various operational conditions. The 2D seabed profile is derived from the measured 3D seabed bathymetry data and is further extrapolated laterally to create an “approximated 3D” profile, as shown in Figure 2. One advantage of this approach is that it incorporates a 3D dimension in the analysis, allowing for the capture of pipeline lateral displacement effects, including global lateral buckling. Additionally, this method is more computationally efficient compared to a complete 3D analysis profile. The finite element model is capable of considering various non-linear parameters, such as large deflection with stress-stiffening effects (geometric non-linearity) and non-linear pipe material behavior, which involves appropriate plasticization effects and modeling based on a Ramberg–Osgood curve fitting approach. The loading conditions encompass self-weight, residual lay tension, distributed loads, internal pressure, and temperature. Additionally, the model incorporates fully decoupled axial/lateral frictional resistance through the utilization of contact pairs.
The pipeline is divided into segments and modeled using the 3D beam element PIPE31H, which accounts for distributed loading, temperature loading, internal and external pressure loading, and end cap effects. Rigid analytical surfaces are employed to represent the seabed, utilizing node-to-surface contact relationships. The entire pipeline is included in the model, with both the KP 0 and KP End defined as free end constraints. For the free span analysis, 2 m elements are used to model the pipeline. Both the carrier (inner) pipe and casing (outer) pipe are explicitly incorporated in the finite element analysis. Multi-point constraints are incorporated in the model to precisely represent the positions of the bulkheads and to confine the inner pipe within the outer casing, while still permitting axial expansion of the inner pipe. The seabed is represented in the model by an analytical surface situated in a local plane along the pipeline route. This surface is assigned suitable properties to accurately simulate the anticipated interaction between the pipe and the soil.
During every phase of the pipeline loading history, the model is employed to forecast the profile of the pipeline along the seabed. The on-bottom geometry of the pipeline undergoes significant alterations throughout the different stages of the project’s lifespan. To evaluate the pipeline, the subsequent load sequence is implemented: (1) laydown: application of residual lay tension, empty submerged weight and external pressure; (2) flooding: application of water contents and associated hydrostatic internal pressure; (3) hydrotest: application of hydrotest pressure; (4) dewatering: removal of water contents and hydrotest pressure; (5) operating/design pressure: application of operational contents, associated internal pressure, and operating or design pressure; (6) operating/design temperature: application of operating or design temperature.

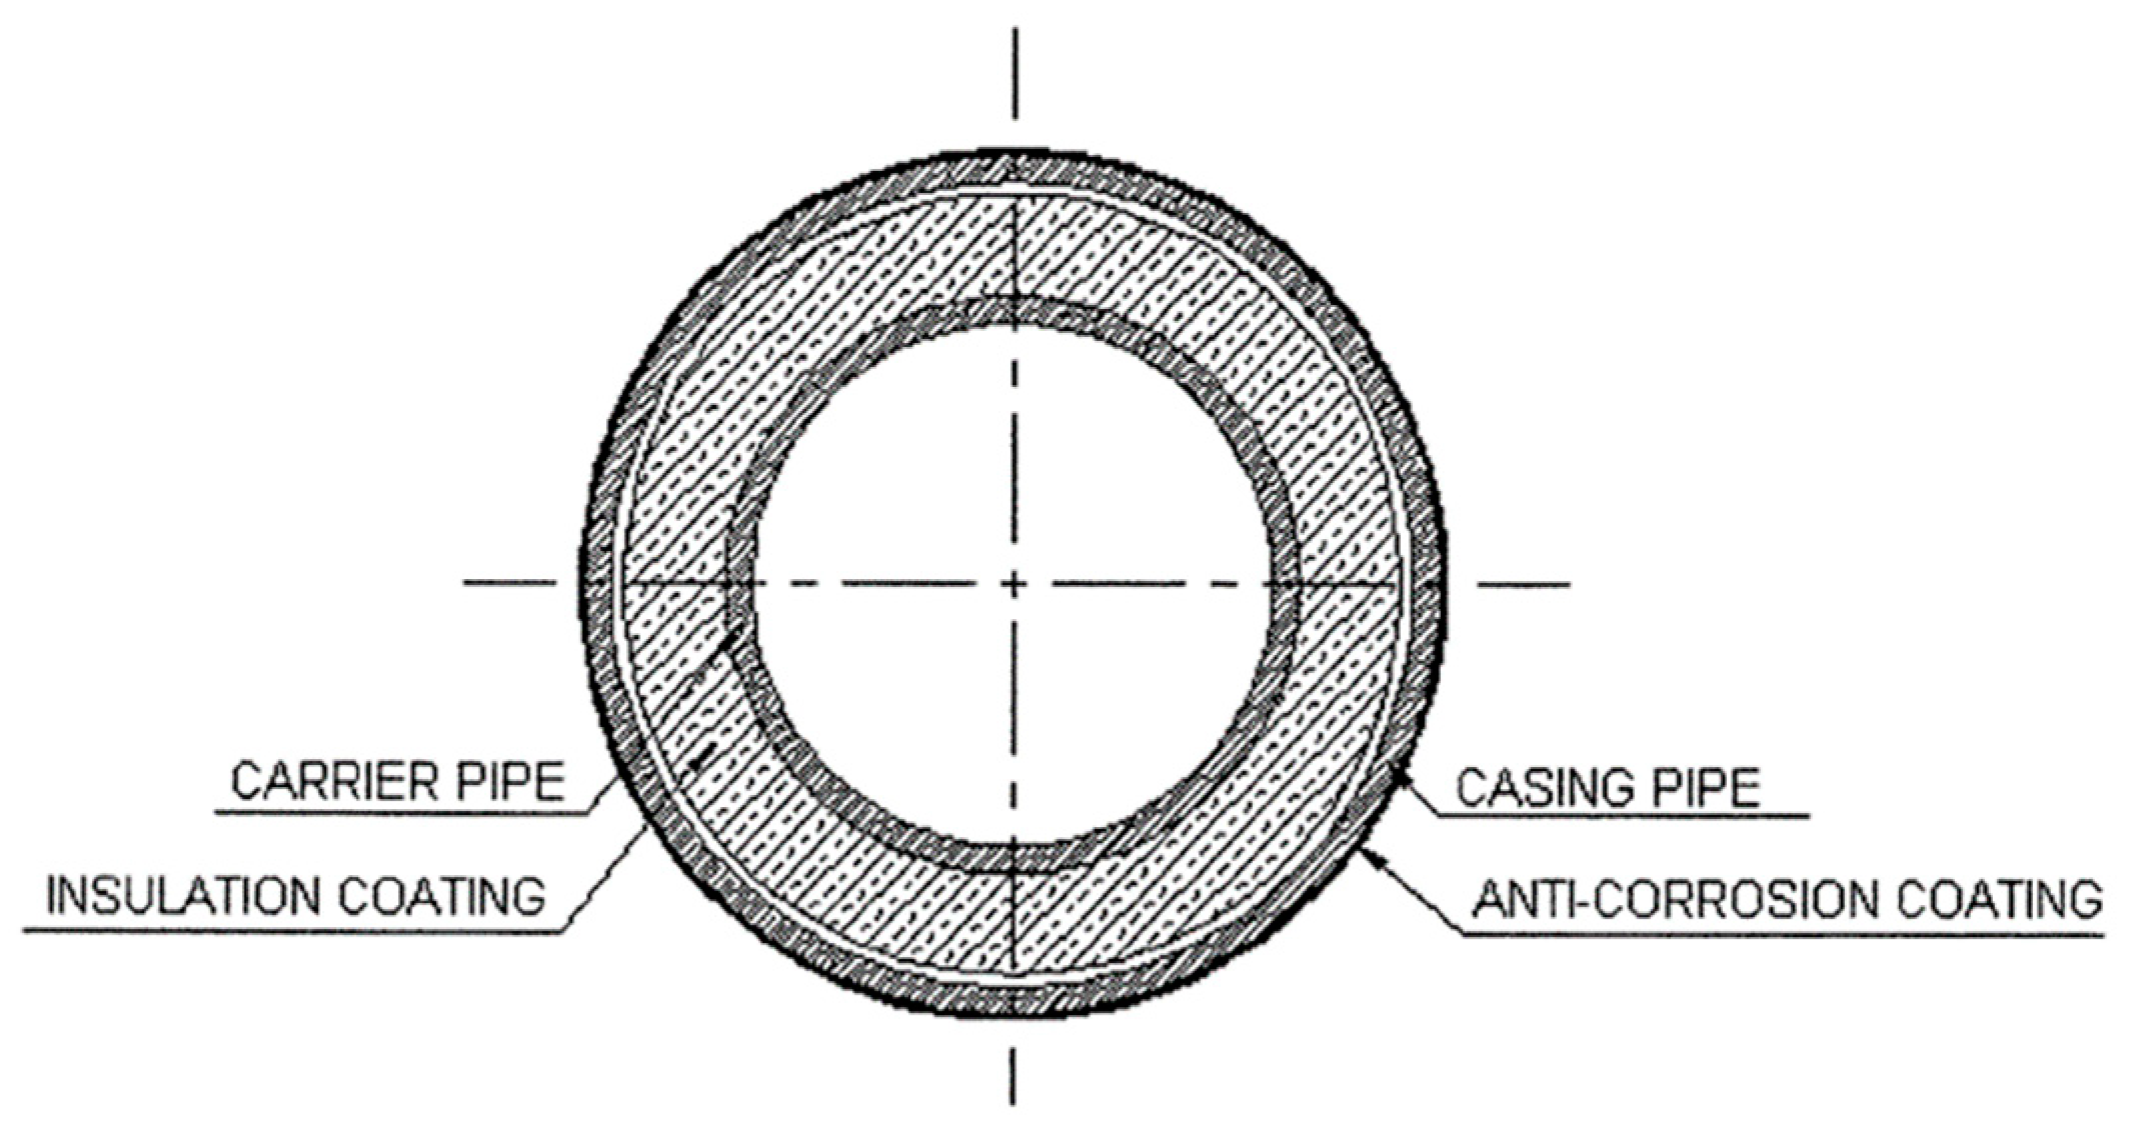
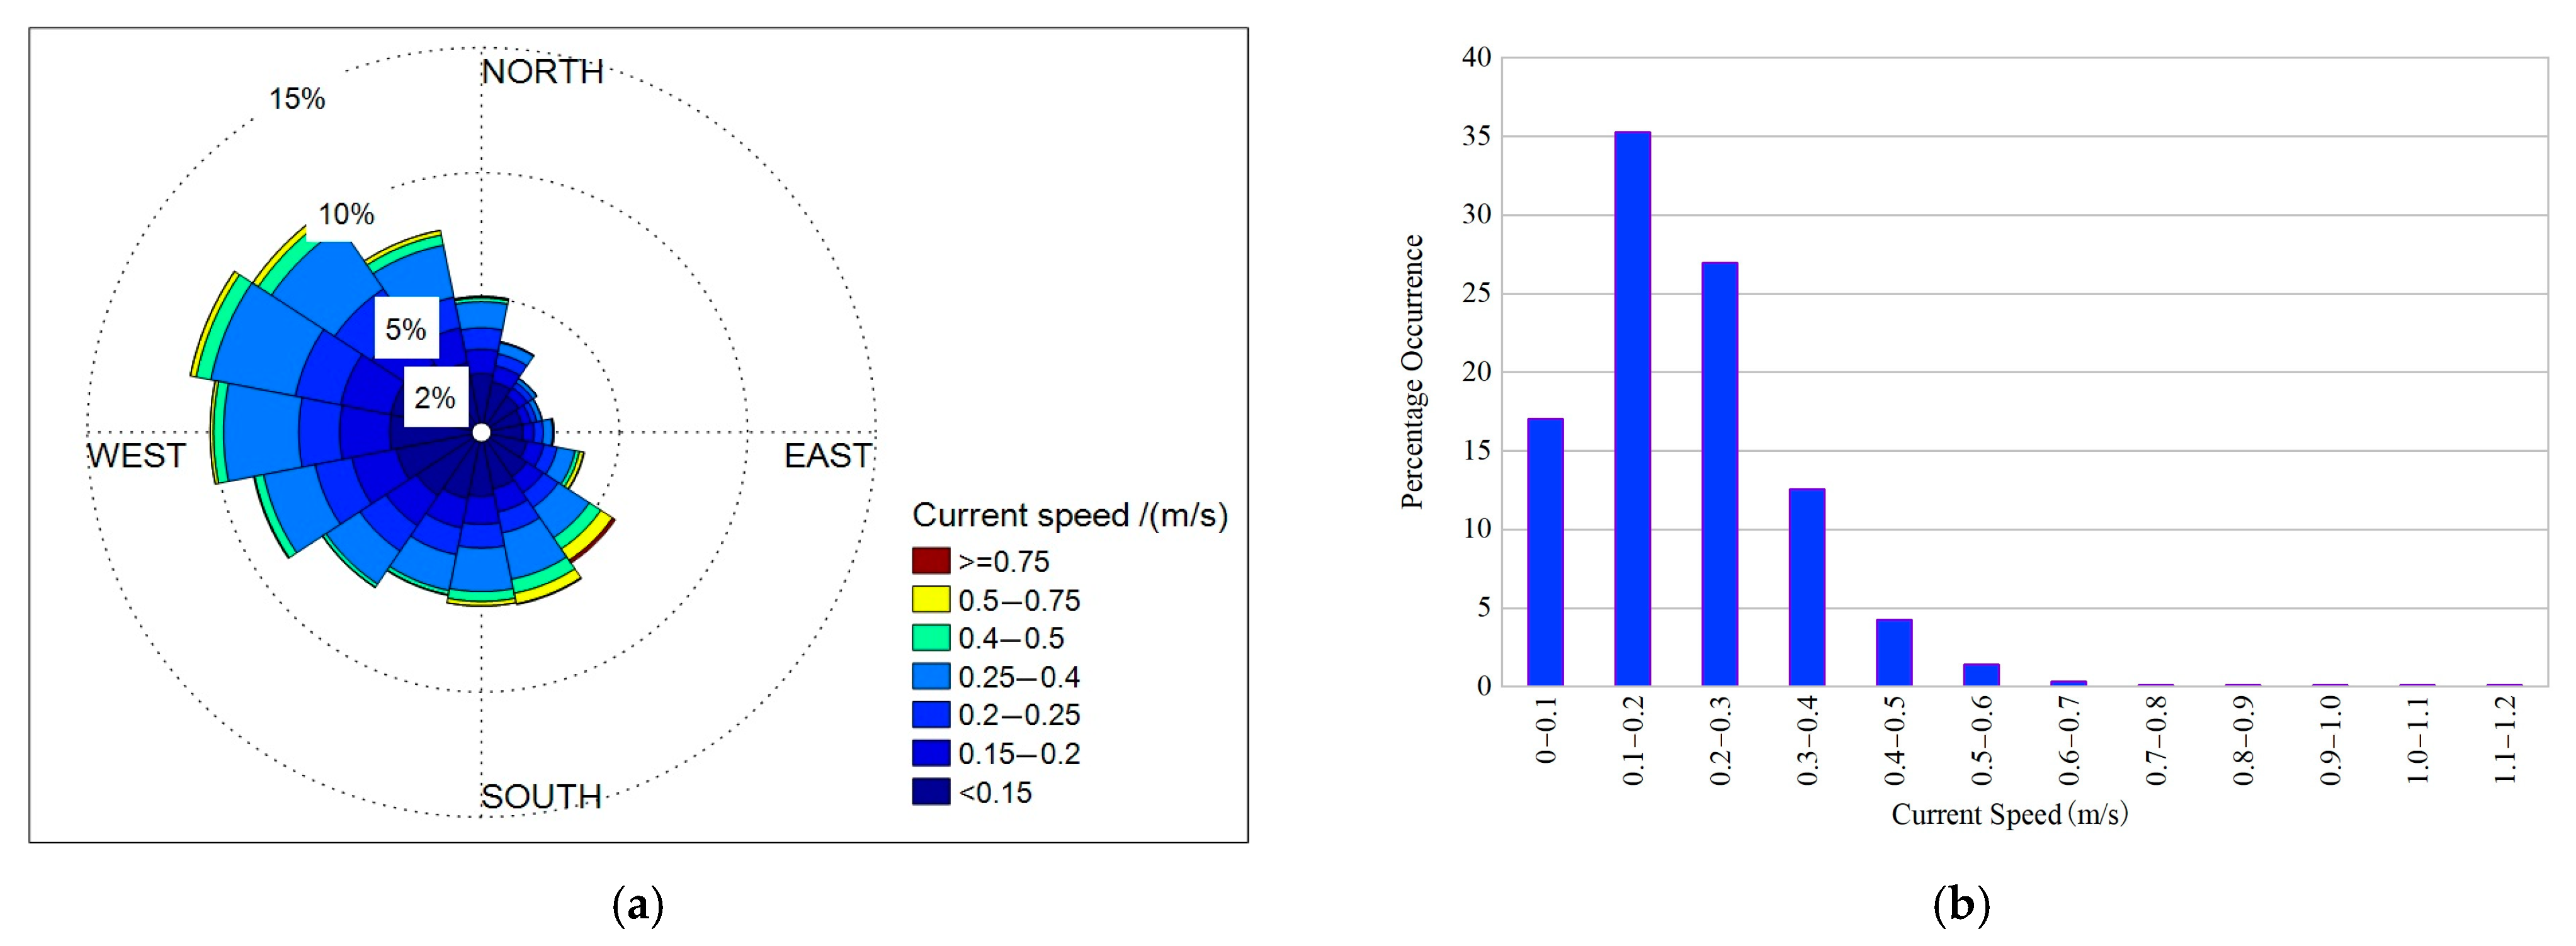
2.3. Input Parameters

Table 1 presents the key mechanical properties and design conditions for the selected pipe-in-pipe (PIP) multiphase pipeline. The pipeline configuration consists of an inner pipe with an outer diameter of 323.9 mm and a wall thickness of 14.3 mm, made of API 5L PSL2 X65 material. The outer pipe, serving as the casing, has an outer diameter of 457.0 mm and a wall thickness of 14.3 mm, also made of API 5L PSL2 X65 material. Figure 3 illustrates the cross-section of the pipeline. The carrier pipe has a content density ranging from 821 to 953 kg/m3. The operating pressure and hydrotest pressure for the pipeline are 4.401 Mpa and 7.161 Mpa, respectively.
The following average soil properties have been applied to calculations within this study. The particle sizes are d10 = 0.1 mm ~ 0.5 mm and d50 = 0.4 mm; the density is ρ = 2650 kg/m3; the porosity is n = 0.5; the submerged weight is W = 8.63 kN/m3; and the friction angle α = 25°. For the purposes of calculating velocities within the current boundary layer, a seabed roughness of 4 × 10⁻⁵ m is used, corresponding to medium sand.
The wave and current velocities attributed to cyclonic storms are sourced from the design basis documents. For cyclonic storms, the 10-year maximum wave velocity is recorded as 0.6 m/s, while the 10-year maximum current velocity is noted as 0.58 m/s. Correspondingly, the 100-year values for wave and current velocities are 1.0 m/s and 0.71 m/s, respectively. In the studied area, which is characterized by a water depth of approximately 145 m, the tidal regime is classified as an irregular diurnal pattern. Over a 45-day period, the highest recorded tidal current speed was 0.17 m/s, with a direction towards 124 degrees. The near seabed current rosette for the region is depicted in Figure 4a, with the current expressed in degrees clockwise from True North, indicating the direction of flow. The current data are referenced to a height of +1 m ASB. Analysis of the measured current data yields plots in Figure 4b illustrating the percentage occurrence in relation to the current speed. The prevailing ambient currents, ranging from 0.1 to 0.4 m/s, predominantly flow in the W–NW directions. Conversely, the less frequent but larger currents, ranging from 0.4 to 0.8 m/s, primarily flow in the NW and SE directions. Soliton currents (>0.8 m/s) are found to be exclusively in the SE direction.
The expression of wave direction is given in degrees clockwise from True North, indicating the direction from which the waves originate. The distribution of wave directionality is displayed in Table 2. Table 3 presents the maximum probability (Pmax) of significant wave height (Hs) and spectral peak period (Tp) for each direction.
Both the minimum and maximum residual lay tensions are utilized in the analysis of free spans. The desired range for bottom tension spans from 0 kN (minimum) to 453.47 kN (maximum). In the assessment of operational circumstances, the presence of marine growth with a thickness of 2 cm and a density of 1400 kg/m3 is taken into account along the pipeline’s length. The pipeline is simulated as being installed under conditions of minimum ambient temperature to optimize the compressive loads experienced by the pipeline.
The fatigue assessments are conducted for the subsequent pipeline load conditions: as-laid empty, flooded, and operation with average content density. The design parameters and partial safety factors utilized in the VIV onset and VIV fatigue assessments in Equations (1) and (2) adhere to the guidelines provided by DNV-OS-F101 [17] and DNVGL-RP-F105 [2], and their summarized details can be found in Table 4.
The selection of S-N curves, stress concentration factors, and allowable fatigue damage for the pipelines is provided. It should be noted that only the casing (outer) pipe’s fatigue damage is presented, as this pipe experiences larger stress ranges compared to the carrier (inner) pipe, making it the governing factor. For the casing (outer) pipe, an assessment is made using a D-curve in seawater with cathodic protection for the weld cap, while an F1-curve in air is used for the weld root. Stress concentration factors of 1.305 and 1.095 are considered for the weld cap and weld root, respectively. According to DNV-OS-F101 [17], the pipeline is classified as “medium” safety class, and a Design Fatigue Factor (DFF) of 6.0 is applied. However, for spans located within 500 m of a platform, a DFF of 10.0 is utilized, indicating a “high” safety class. The distribution of the total allowable fatigue damage is allocated as 10% for installation, 10% for as-laid, and 80% for operation, as per the recommendations outlined in DNV-OS-F101 [17].

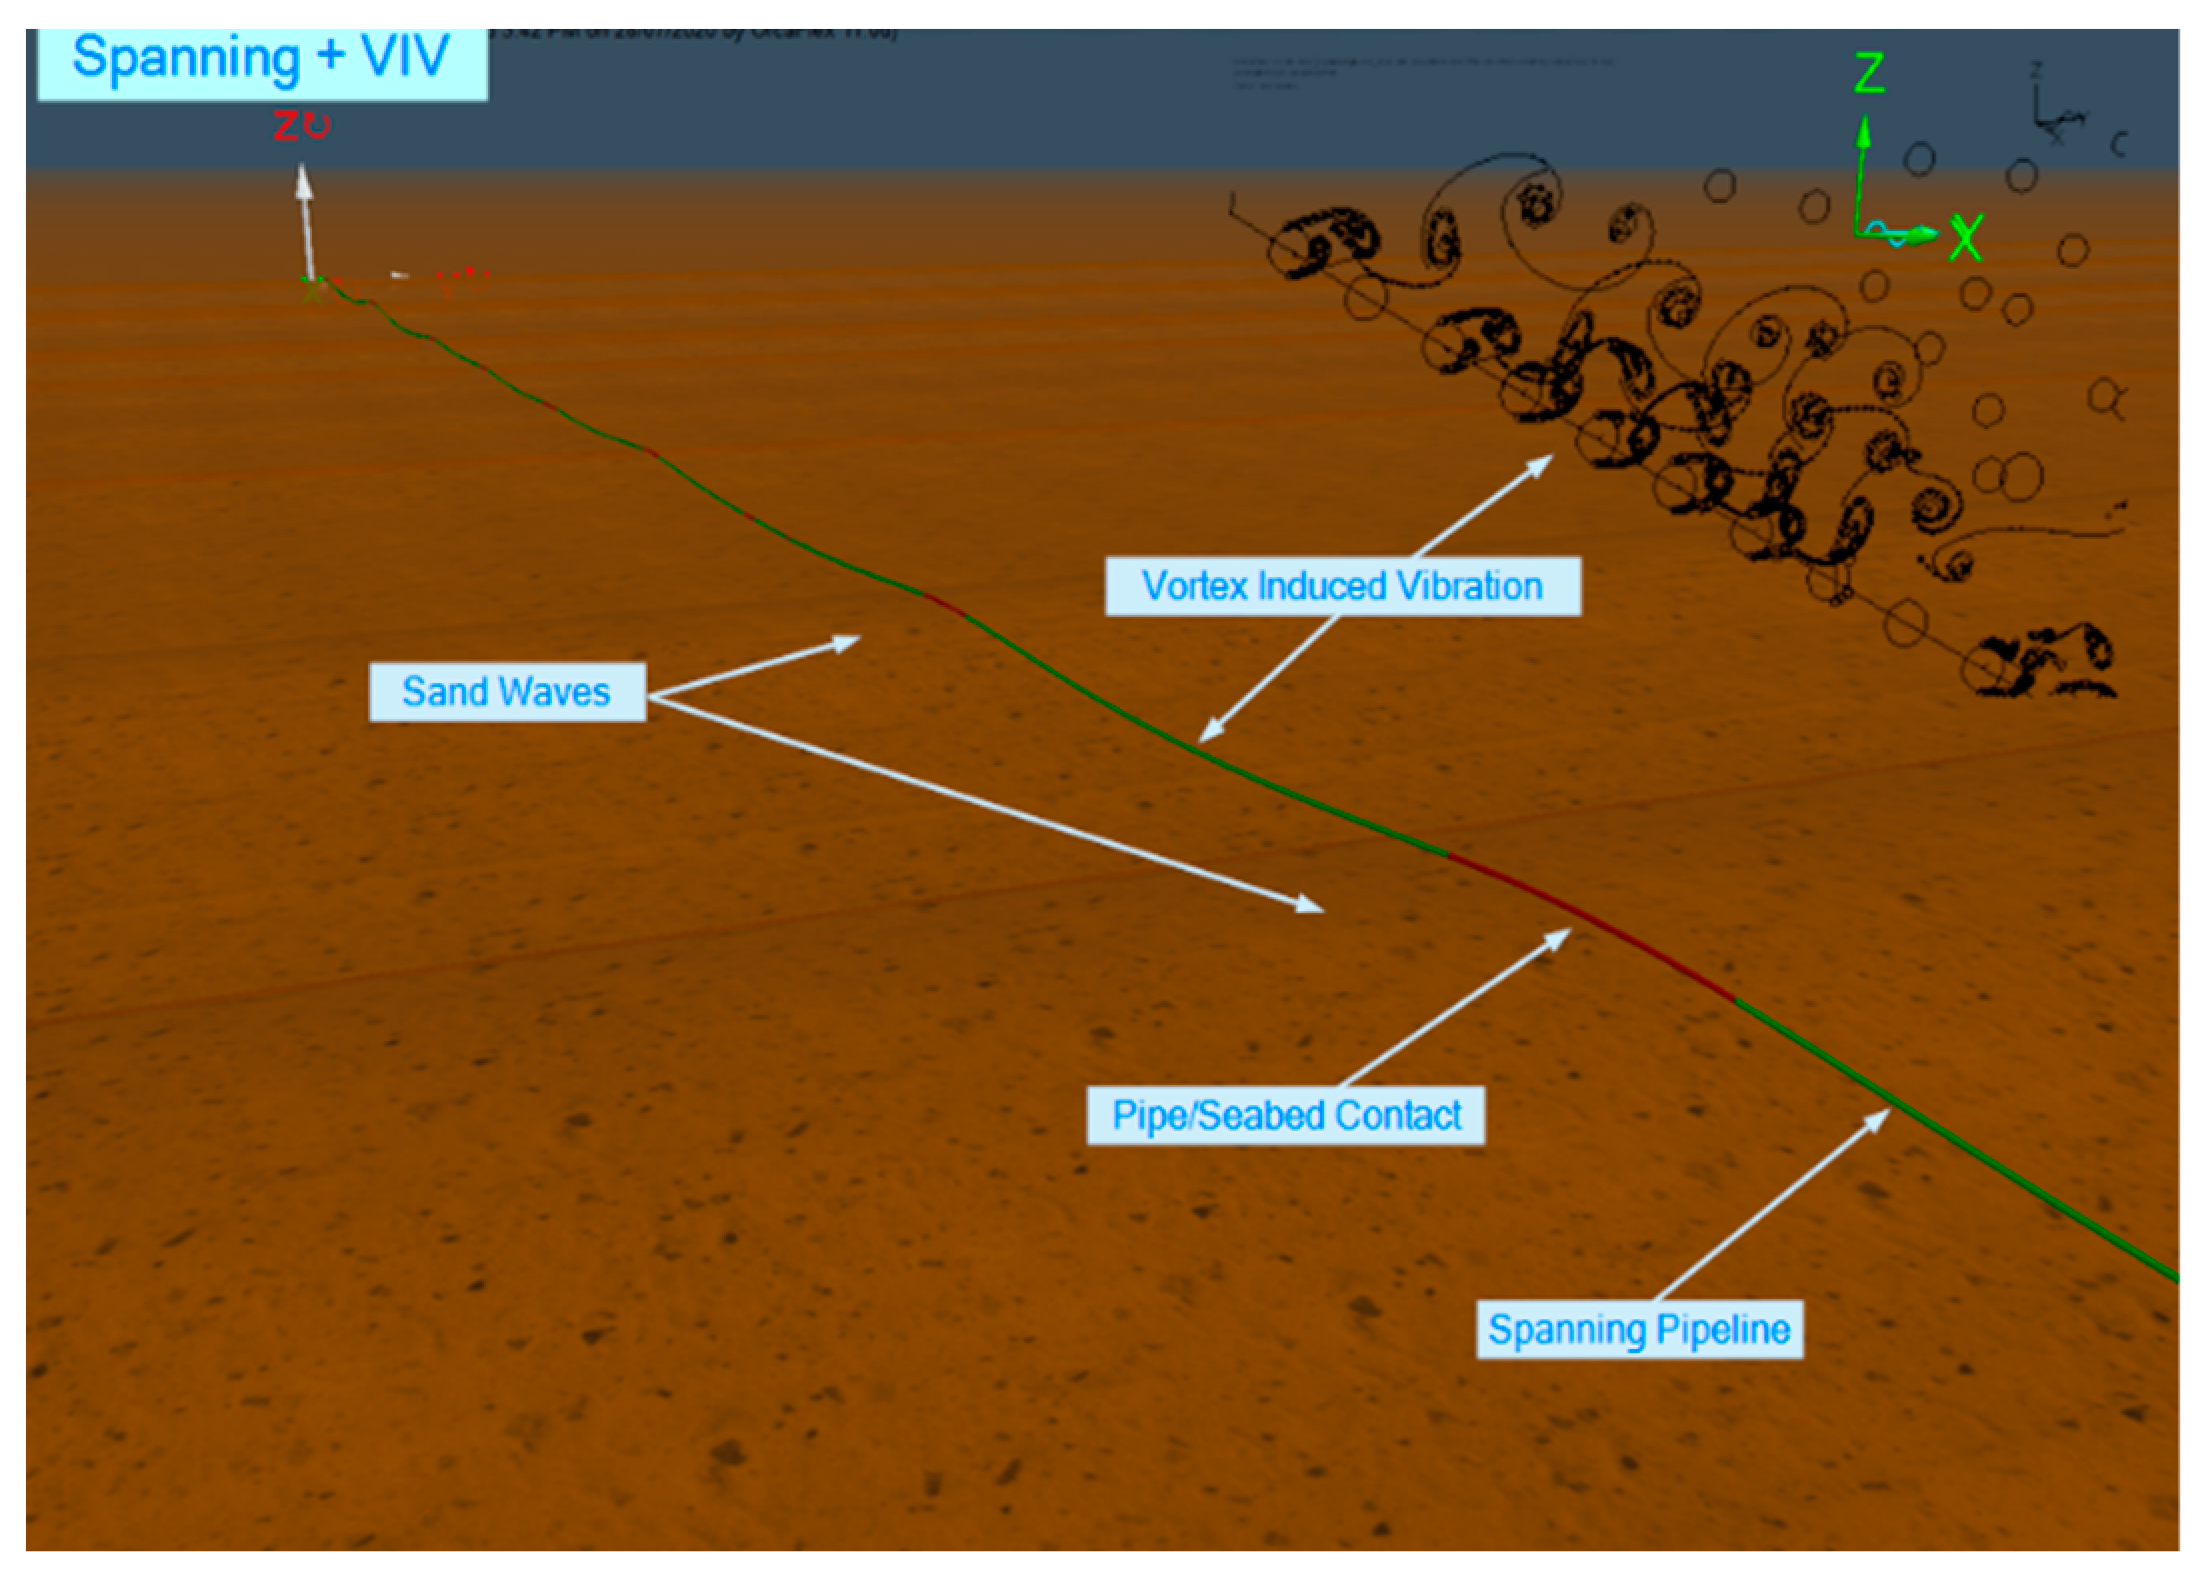
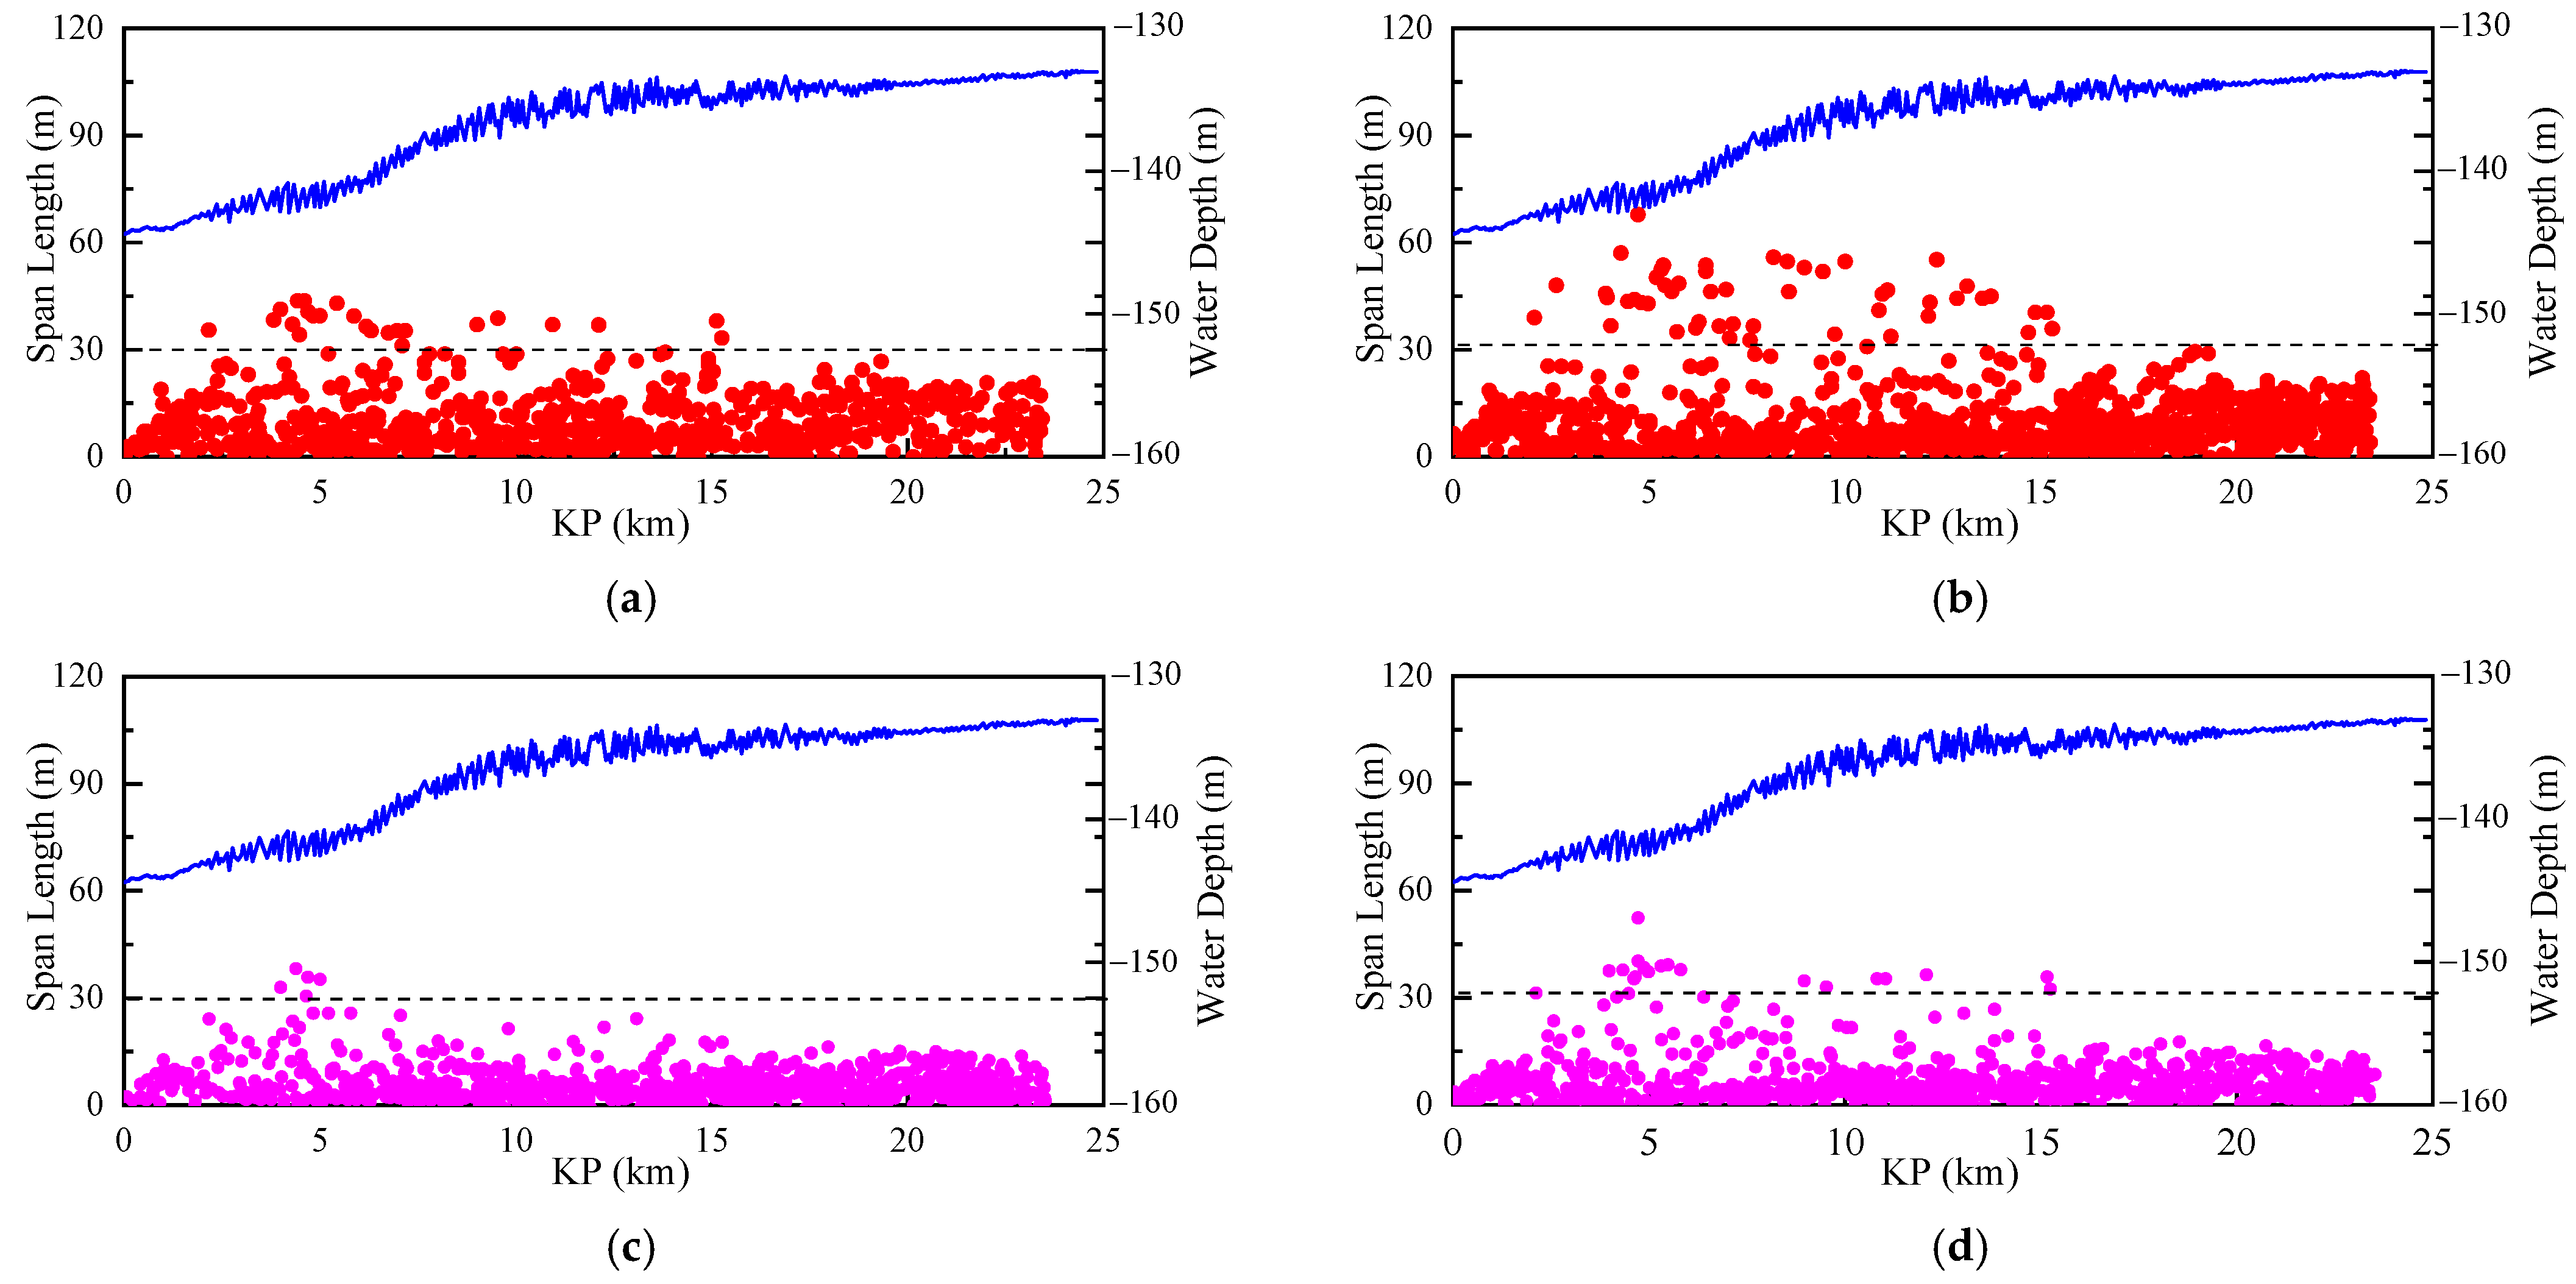
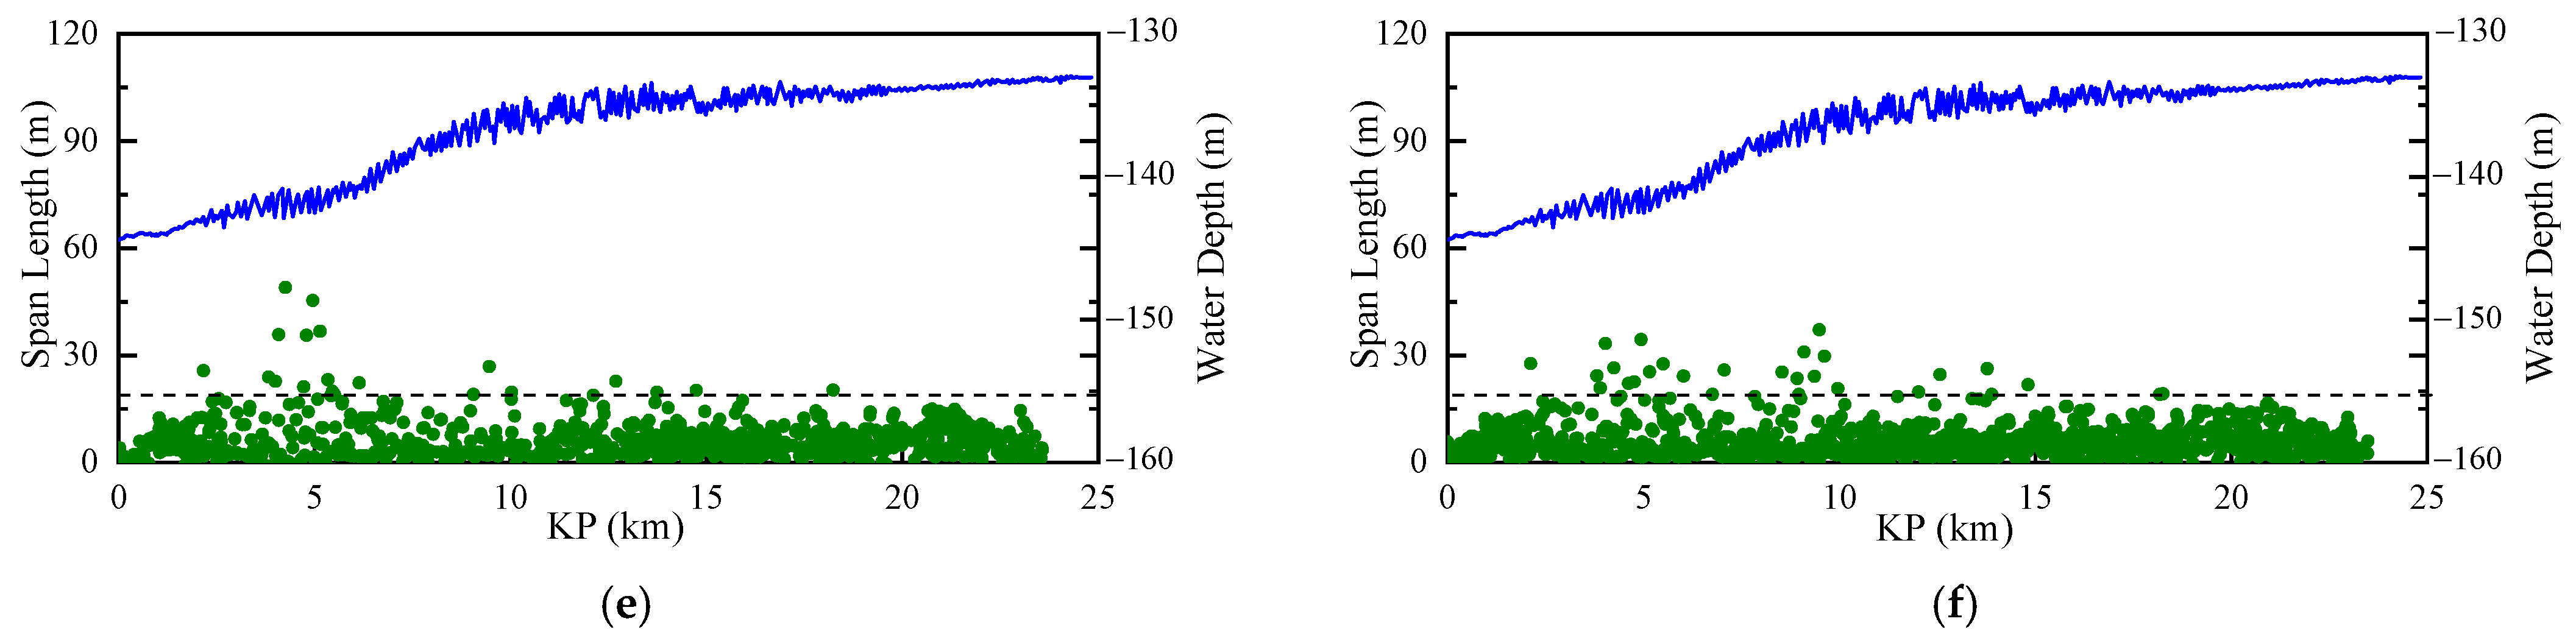
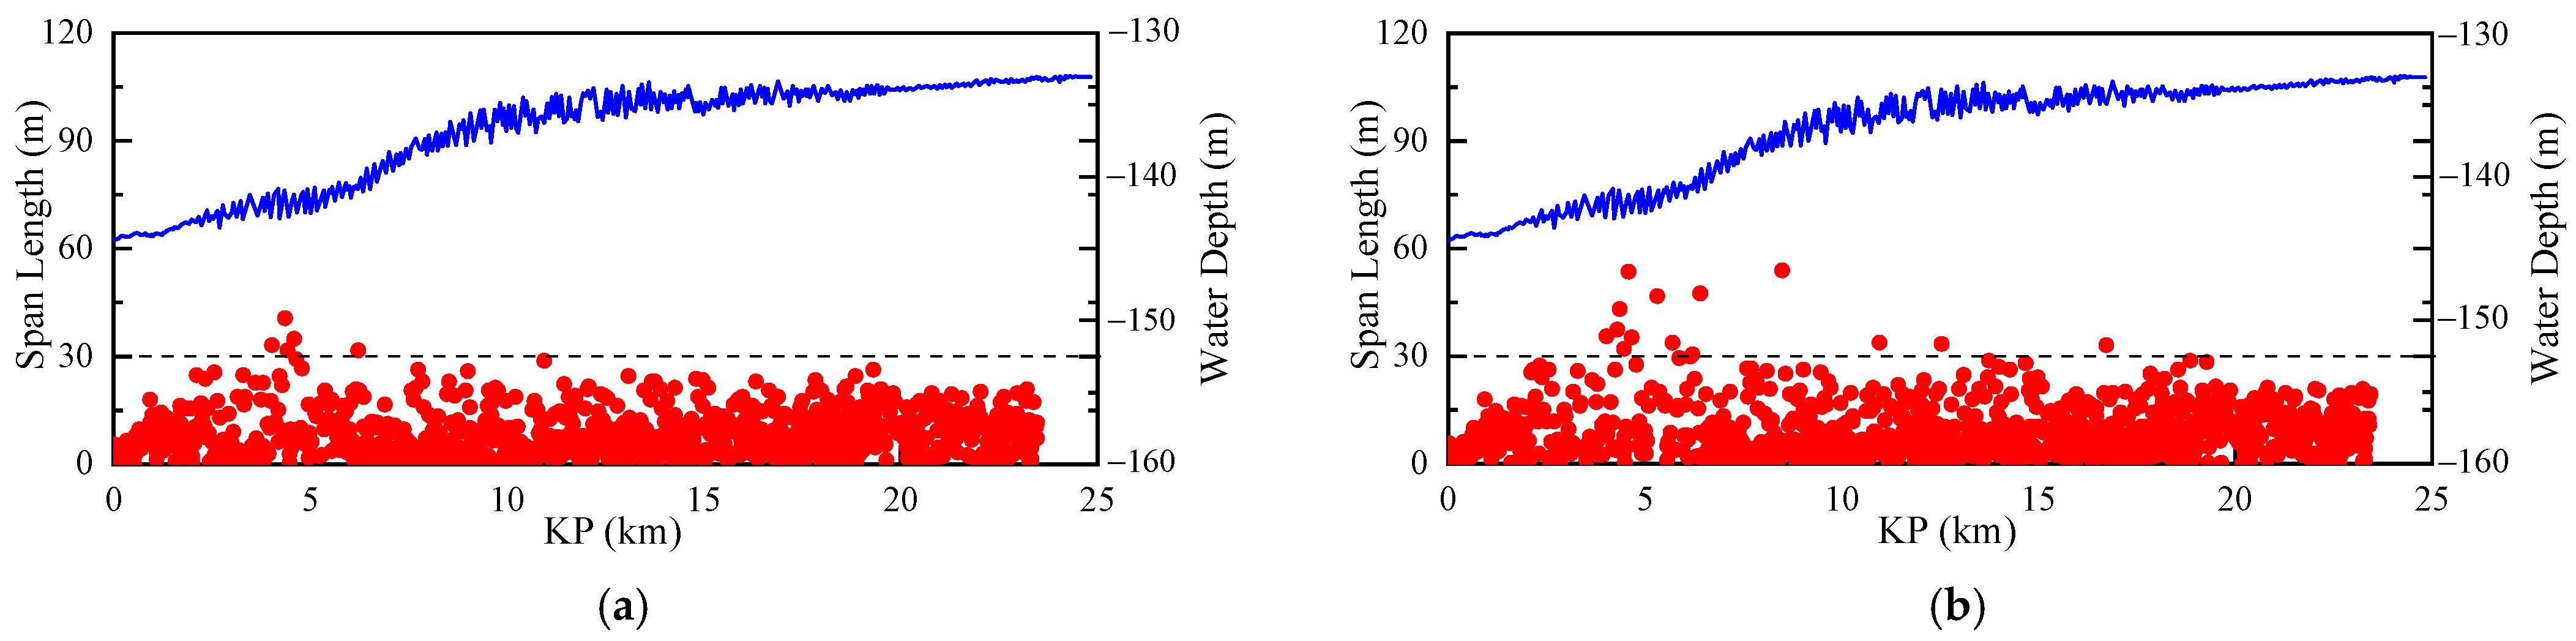
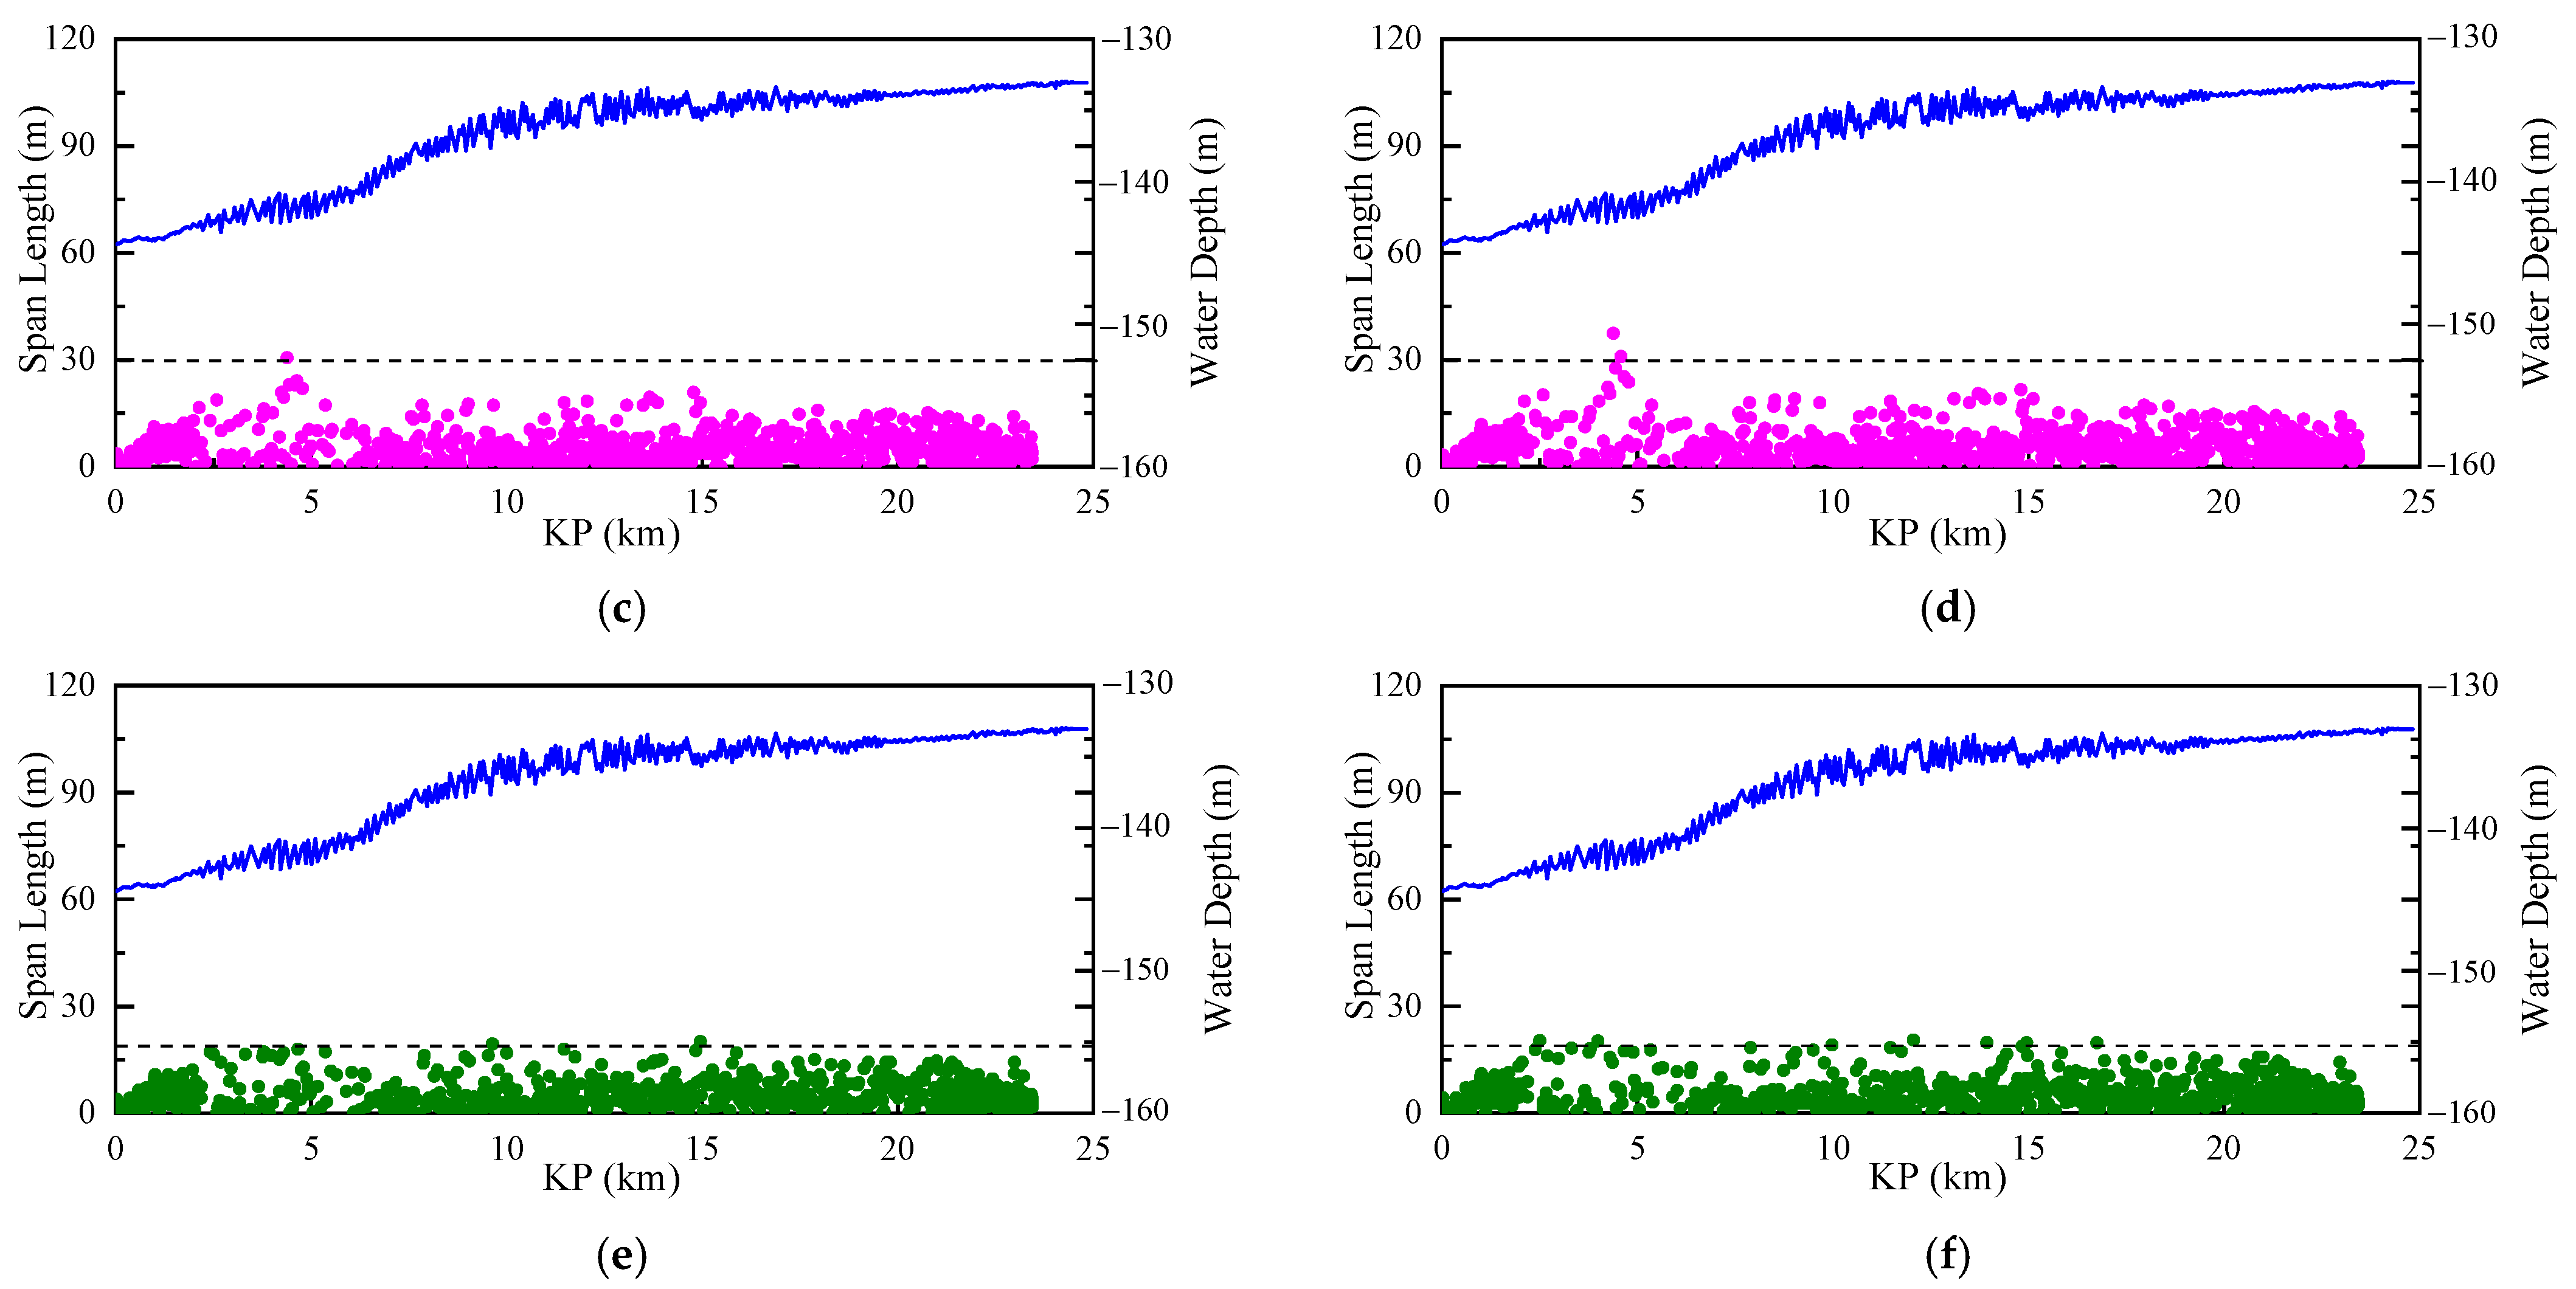
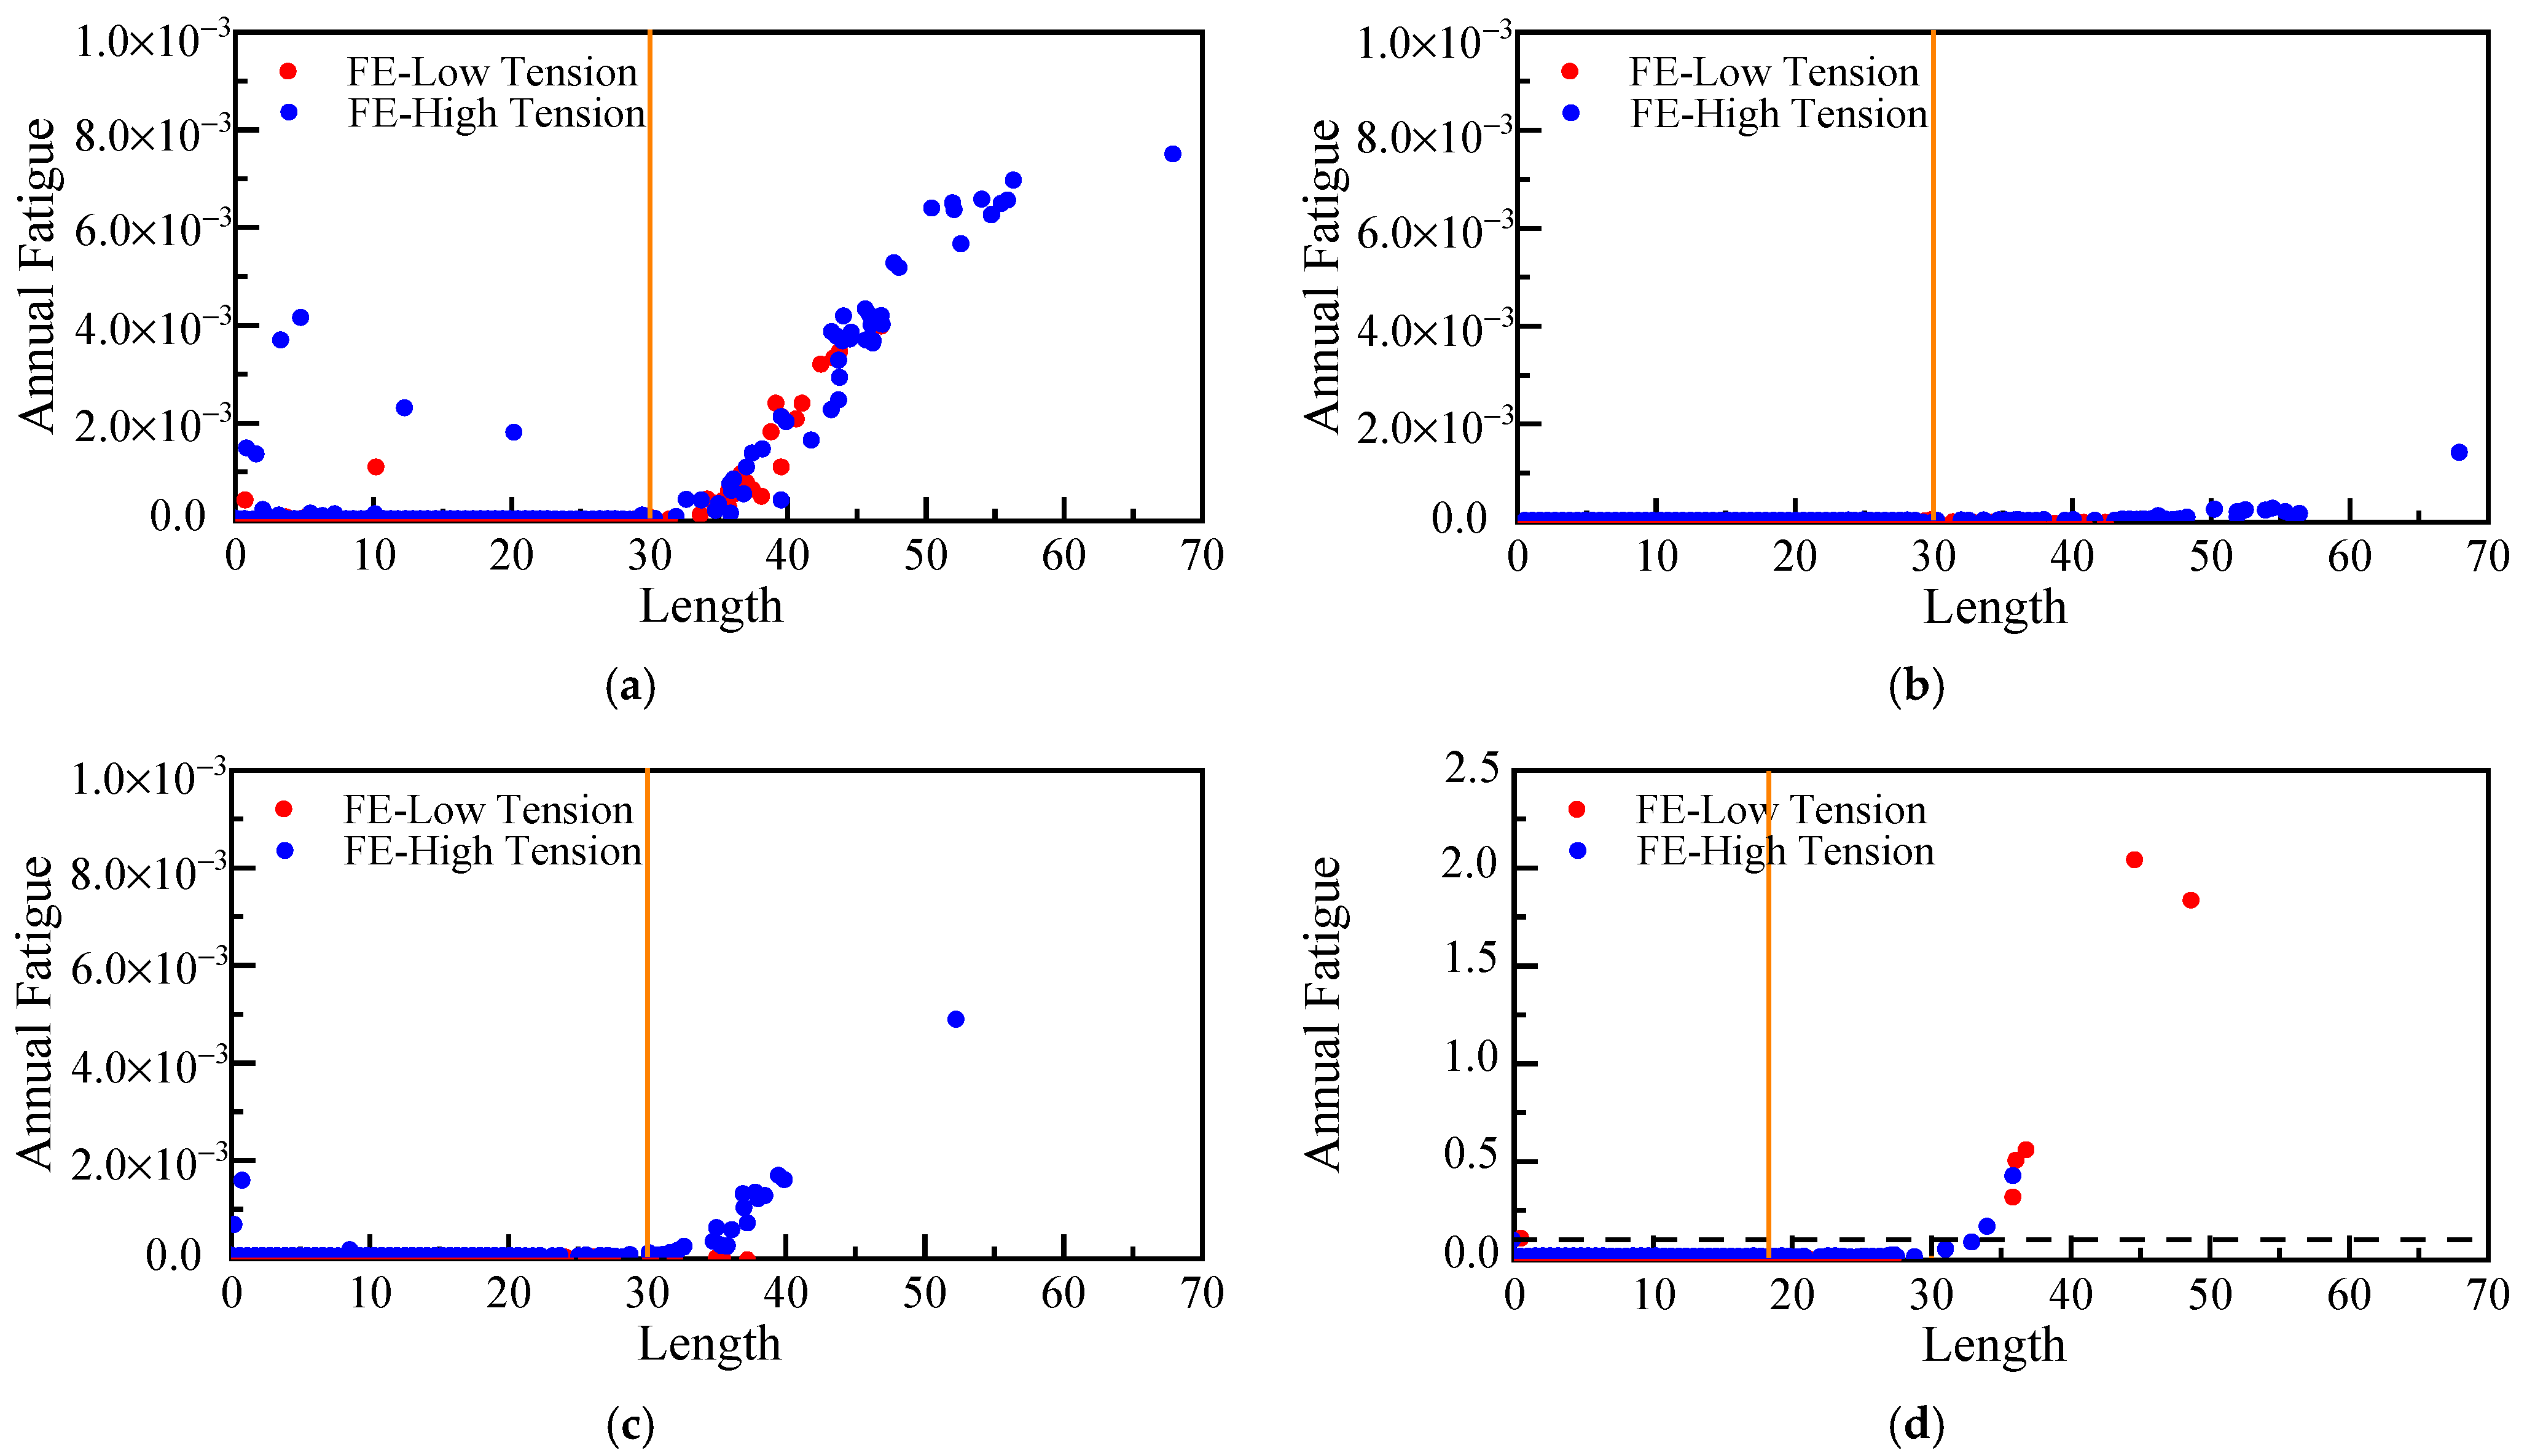
3. VIV Onset Span Screening

The determination of VIV onset involves the utilization of an equivalent pipe, which is derived by combining the characteristics of the outer casing and the inner carrier pipes. This approach enables the calculation of the onset length using a standard worksheet that has been validated internally. Consequently, the properties of the equivalent pipe differ from those of the individual pipes listed in Table 1. The outcomes of the VIV onset screening assessment are displayed in Table 5. The values provided are derived from the minimum calculations of both in-line and crossflow vortex-induced vibration (VIV) onsets, as specified in Equation (2). For empty conditions, the VIV onset span lengths are 30.8 m and 29.9 m for the maximum and minimum residual lay tensions, respectively. These onset span lengths remain unchanged under flooded conditions. However, under operational conditions, the onset span lengths decrease to 18.1 m and 17.7 m for the maximum and minimum residual lay tensions, respectively. The evidence suggests that VIVs are more prone to occur during operational conditions compared to other conditions.

3.1. On Non-Trench Seabed

The comparisons between the onset span lengths on a non-trench seabed and the span screening results are illustrated in Figure 5. Both the minimum and maximum lay tension are considered. In each subplot in Figure 5, the blue line represents the water depth and the scattering dots denote the span length along the pipeline route. The dashed straight line denotes the onset span length. The left three subplots, i.e., Figure 5a,c,e, are for the minimum lay tension, while the right three subplots, i.e., Figure 5b,d,f, are for the maximum lay tension. Meanwhile, three pipeline states, i.e., as-laid empty, flooded, and operation, are considered. For the minimum lay tension, it is observed that a few spans, specifically those between KP 2 and KP 15, have the potential to experience VIV under the empty condition, with the most likely occurrence being between KP 4 and KP 6, as shown in Figure 5a. The length of the free span is generally contingent upon the wavelength of the sand waves specific to a particular pipeline. As depicted in Figure 1a, the sand waves exhibit a greater wavelength between KP4 and KP6. Consequently, there is a higher prevalence of free spans surpassing the onset value in this particular area. Conversely, in the flooded condition, only five spans slightly exceed the onset span length, specifically between KP 4 and KP 5, as shown in Figure 5c. When a pipeline traverses sand waves, this leads to the formation of free spans between the crests of adjacent sand waves. The application of high lay tension induces a significant bending stiffness in the pipeline, causing it to behave akin to a beam. Conversely, when low lay tension is employed, the pipeline becomes more flexible, resulting in increased deflection and prolonged contact with the seabed, particularly at the sand wave crests. Consequently, the length of the free span is typically shorter compared to that observed under maximum lay tension. Under the specified operational conditions, the predominant occurrence of spans exceeding the onset value is observed within the KP 4 to KP 6 range, while only a limited number of spans are dispersed across between KP 9 and KP 18, as shown in Figure 5e.
For the maximum lay tension, several spans ranging from KP 2 to KP 15 exceed the onset span length under the empty conditions, as shown in Figure 5b. Conversely, in the presence of flooding, the spans surpassing the onset values are primarily concentrated between KP 4 and KP 6, with a limited number of occurrences between KP 9 and KP 15, as shown in Figure 5d. During operation, a small number of spans exceeding the onset value are situated between KP 4 and KP 15, as shown in Figure 5f. Based on the aforementioned analyses, it is evident that there exist several free span lengths that exceed the span screening results, indicating their susceptibility to VIV. In general, a greater number of spans are prone to VIV under maximum residual lay tension compared to minimum lay tension. Consequently, it is imperative to thoroughly evaluate the feasibility of implementing a 1 m trench design on the seabed.

3.2. On 1 m Trench Seabed

In the context of pipeline protection, the creation of a trench on the seabed is a frequently employed remedial measure. In practical applications, a 1 m trench of the pipeline on the seabed is commonly utilized due to its balance between effectiveness and cost efficiency. In this study, we compare the lengths of onset spans on a 1 m trench seabed with the span screening results for both the minimum and maximum residual lay tensions, as shown in Figure 6. In each subplot in Figure 6, the blue line represents the water depth and the scattering dots denote the span length along the pipeline route. The dashed straight line denotes the onset span length. Similarly, the left column is for the minimum lay tension under three pipeline states, while the right column is for the maximum lay tension under three pipeline states. Under the empty condition, we observe that there are a few spans that have the potential to experience VIV. Conversely, under the flooded condition, only one or two spans exceed the onset span length between KP 4 and KP 5. During the operational state, there exist several spans that are merely close to the onset value.
Similar to the non-trench seabed, the spans are susceptible to VIV when subjected to the maximum residual lay tension compared to the minimum lay tension. Nevertheless, the overall count of spans surpassing the onset value on a 1 m trench seabed is considerably lower than that observed on a non-trench seabed. This observation suggests that the presence of a pipeline trench on the seabed can effectively mitigate VIV. This approach can be attributed to two primary factors: firstly, the presence of a trench, particularly on the crest of sand waves, can effectively decrease the length of the free span; secondly, the trench acts as a shield, resulting in a reduction in the current velocity passing through the pipeline. Both of these factors contribute to a decrease in the occurrence of VIV.

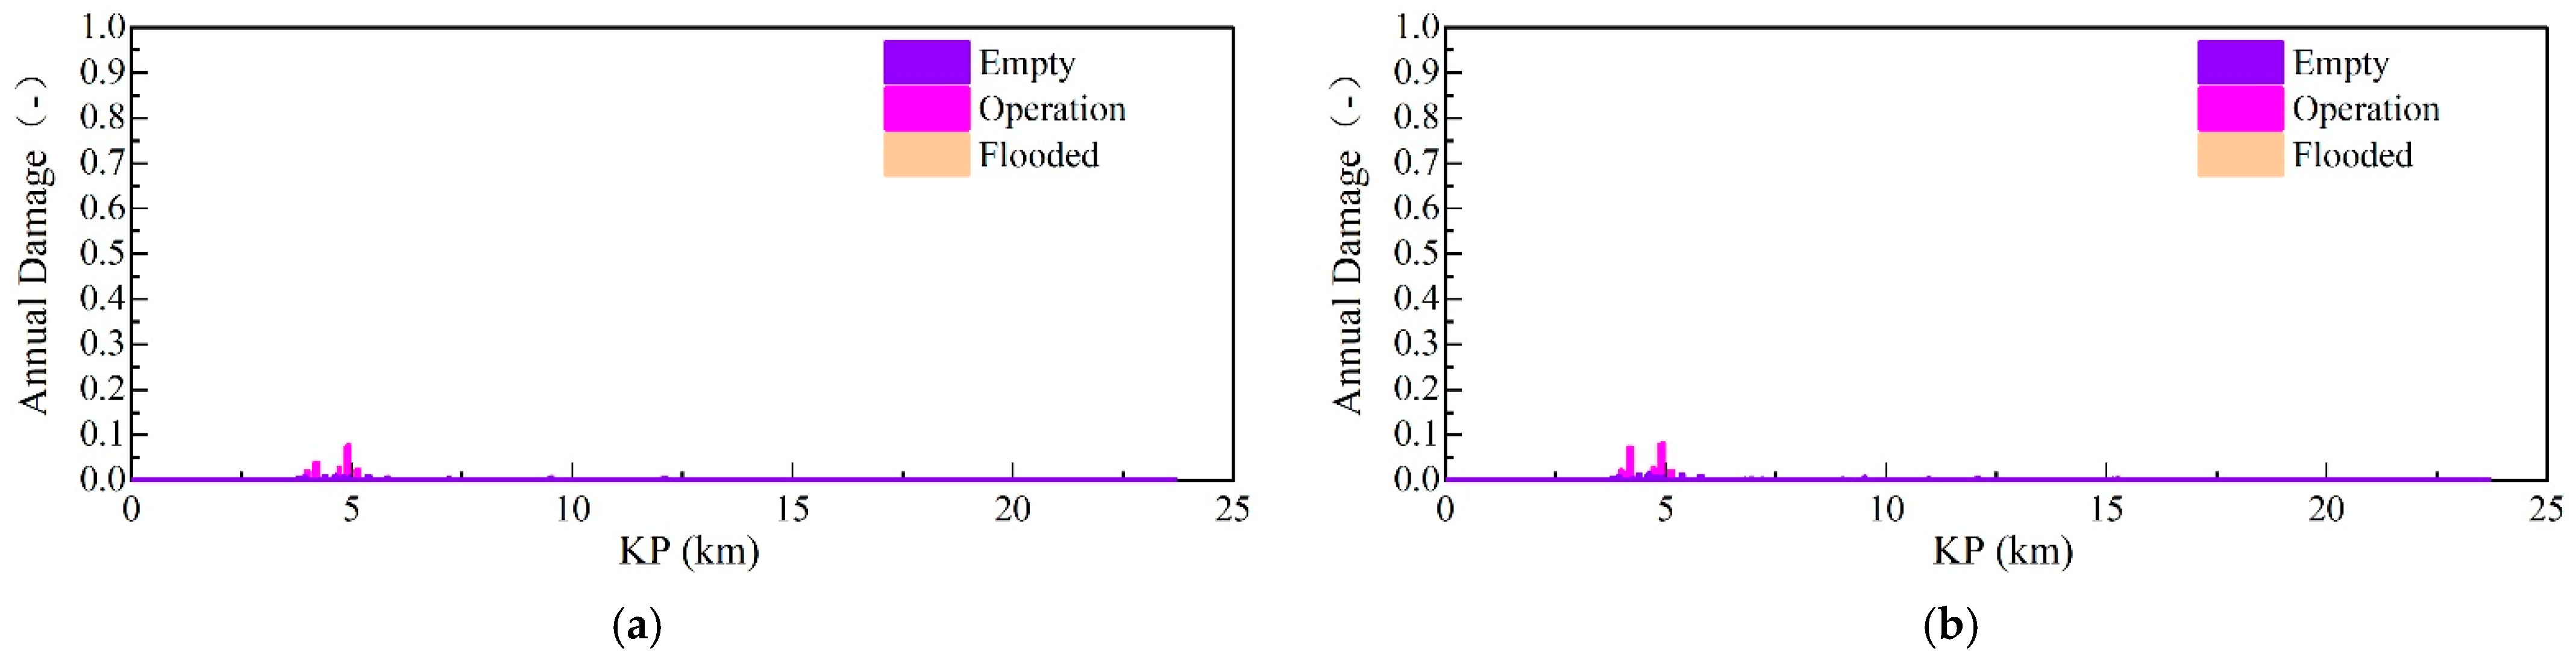
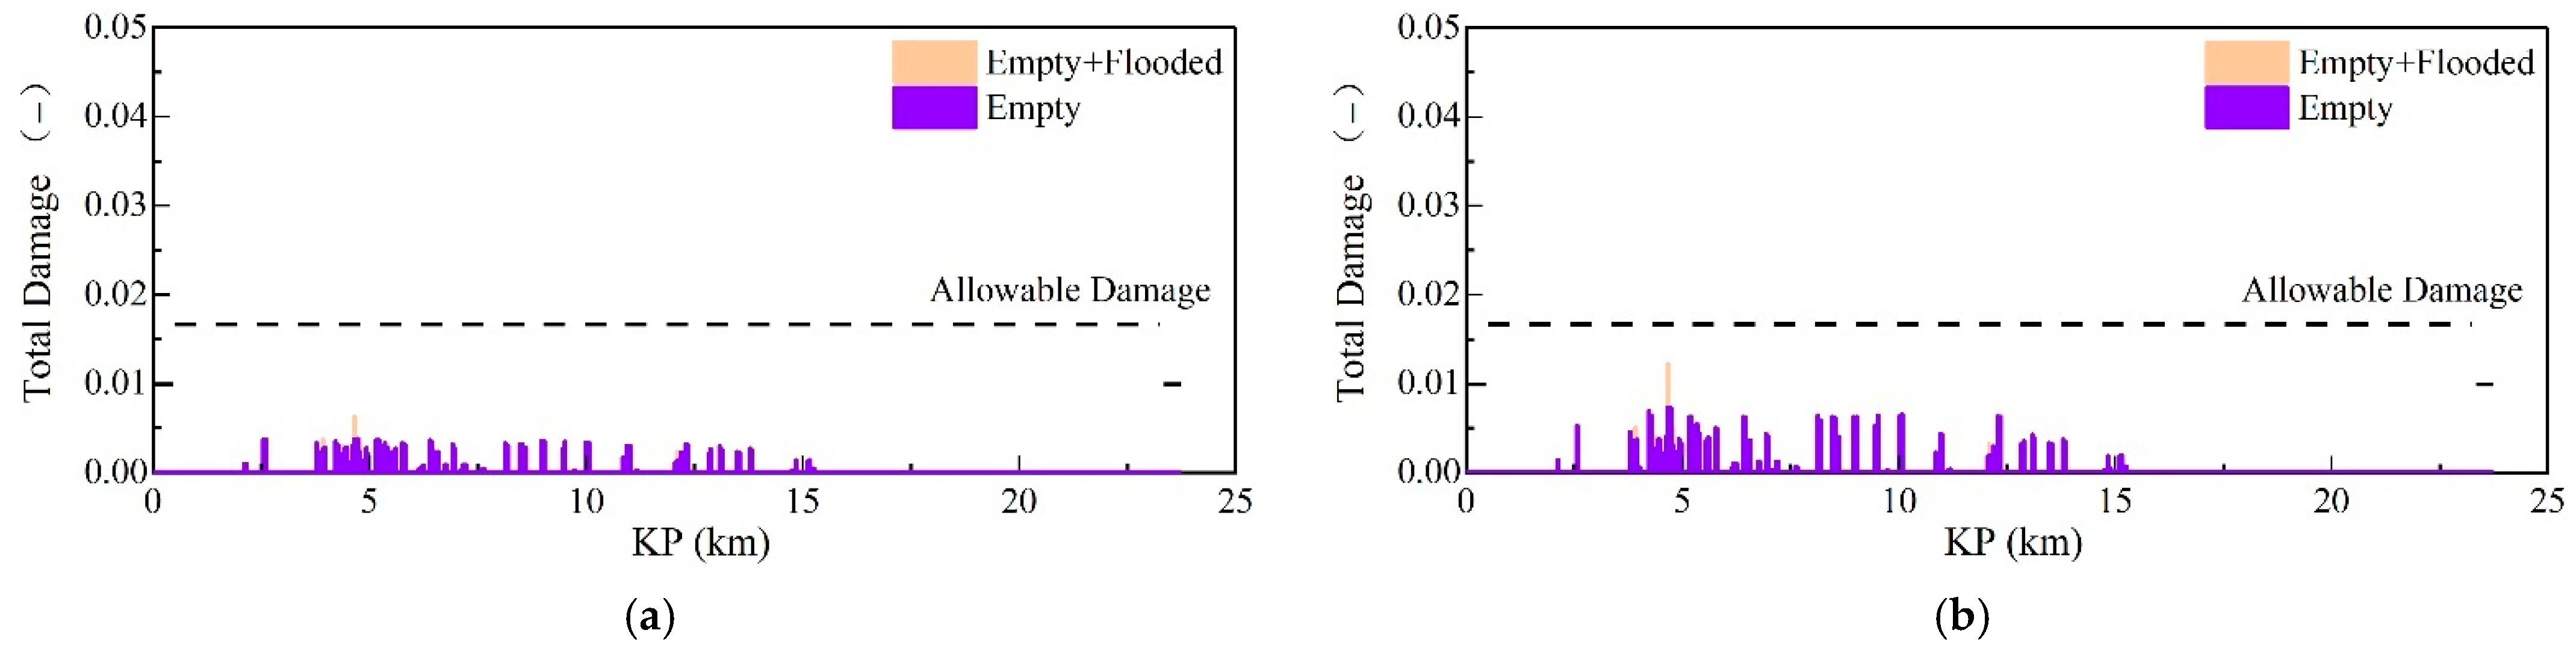
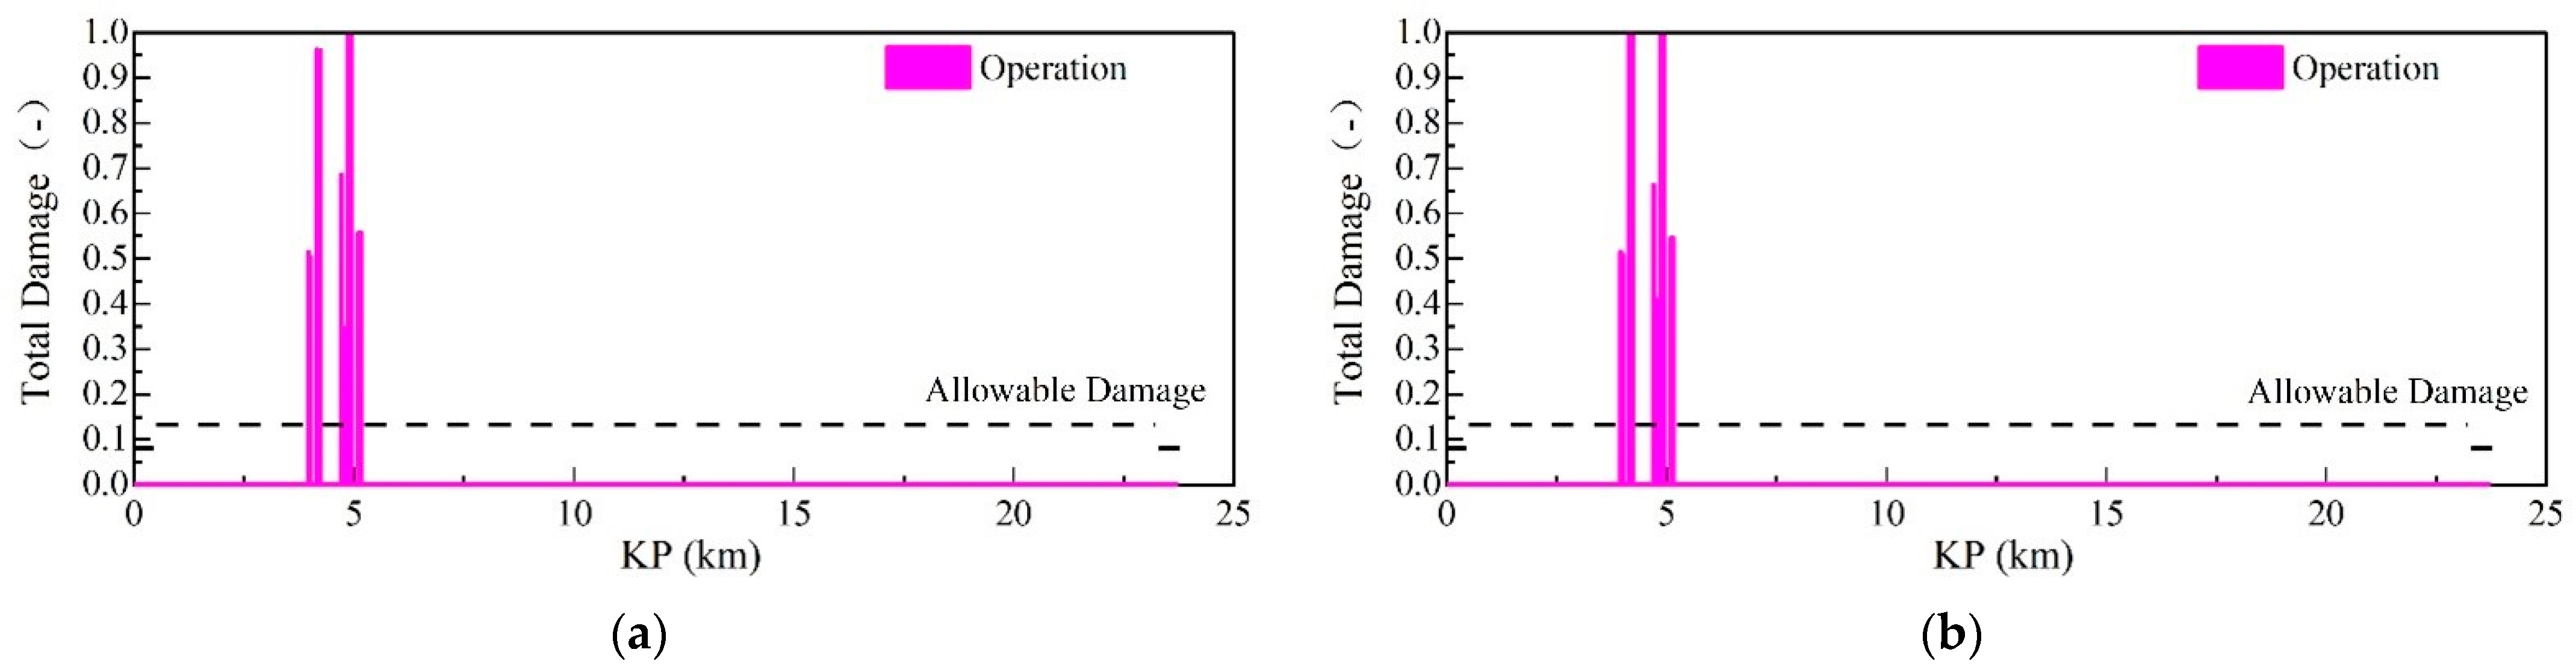
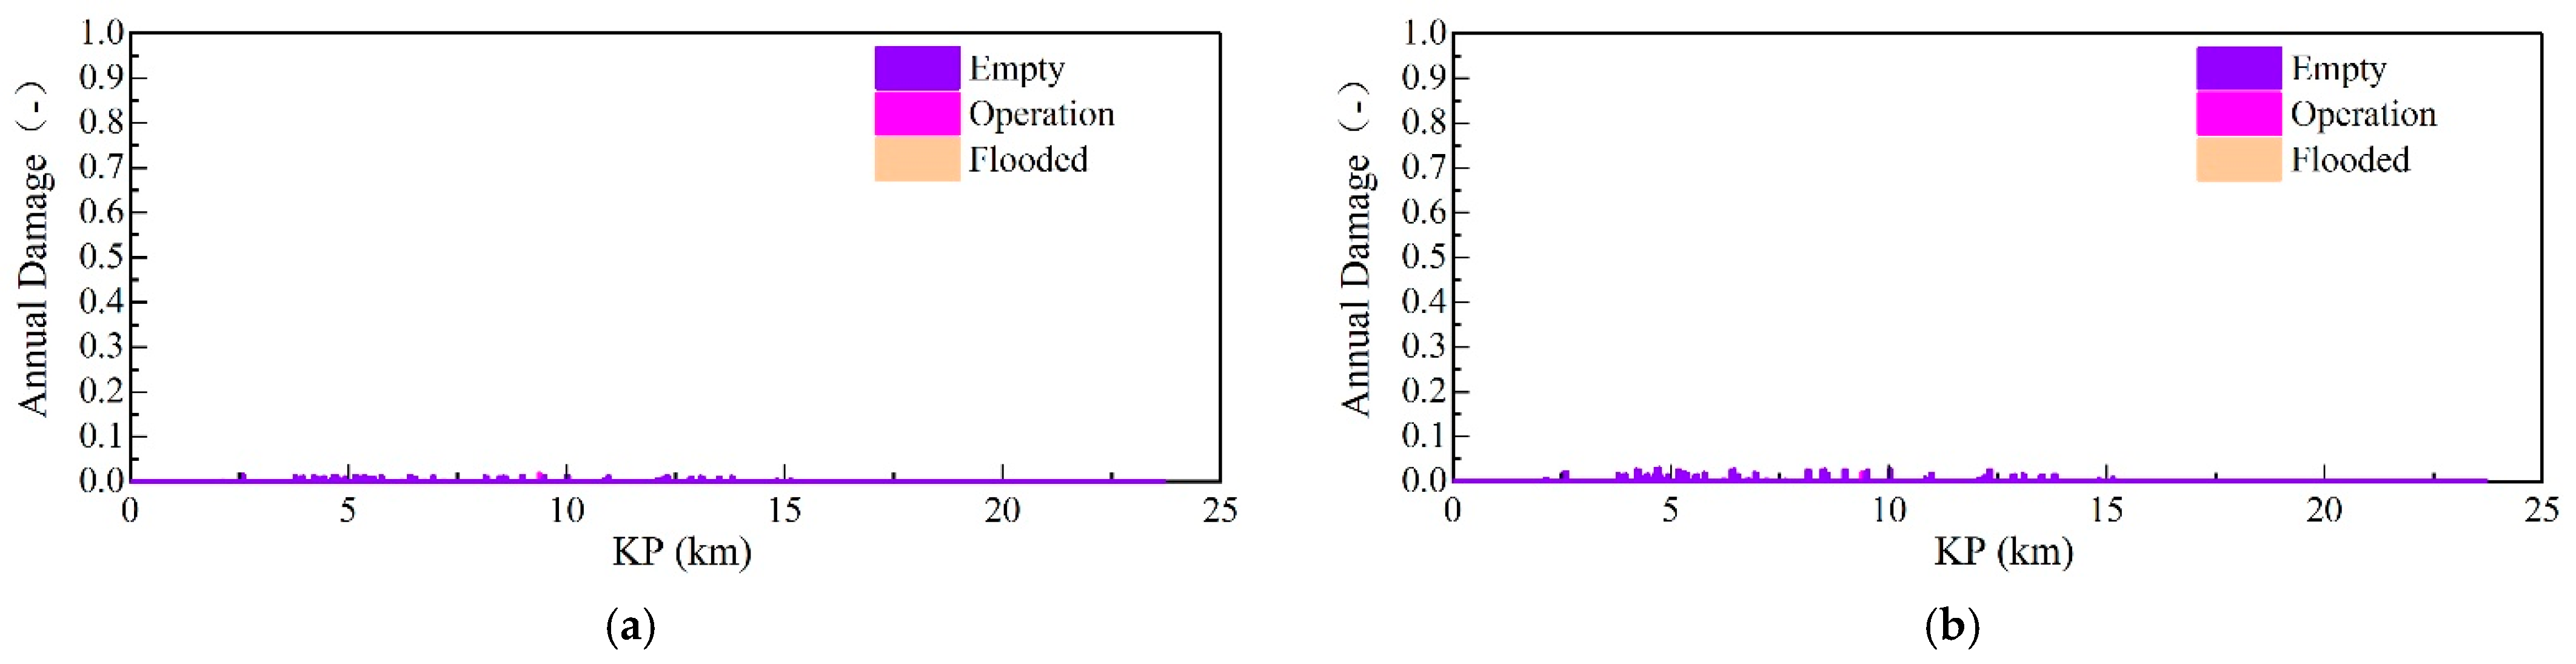
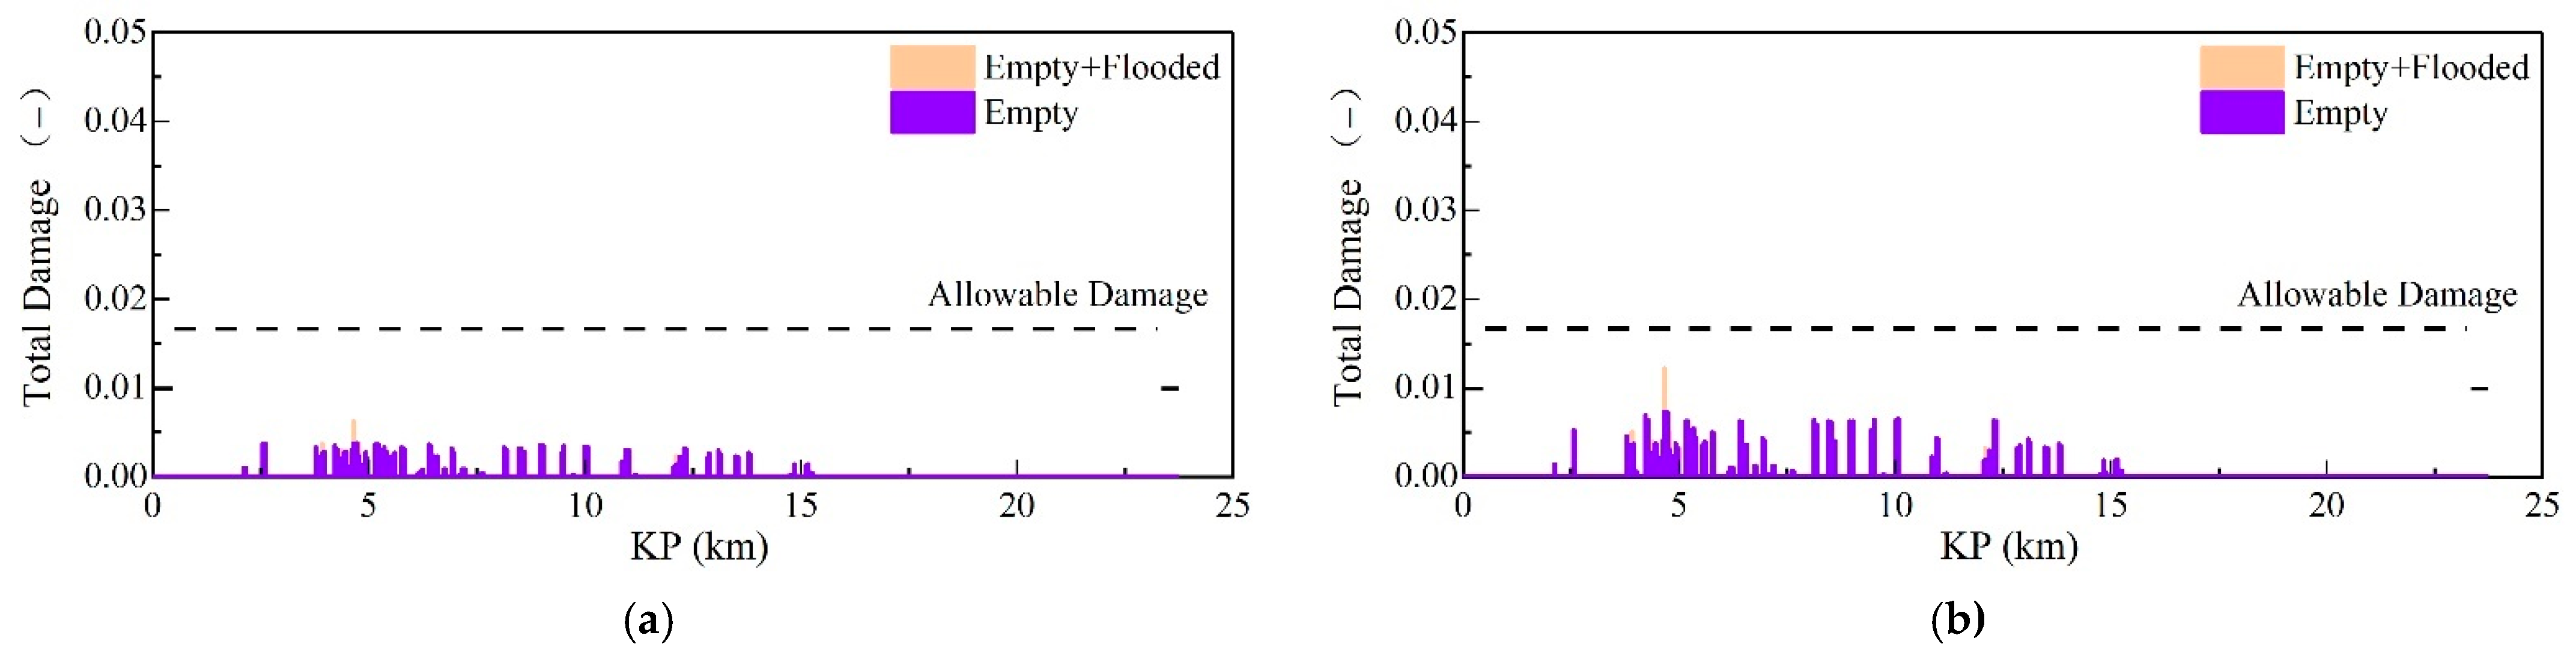
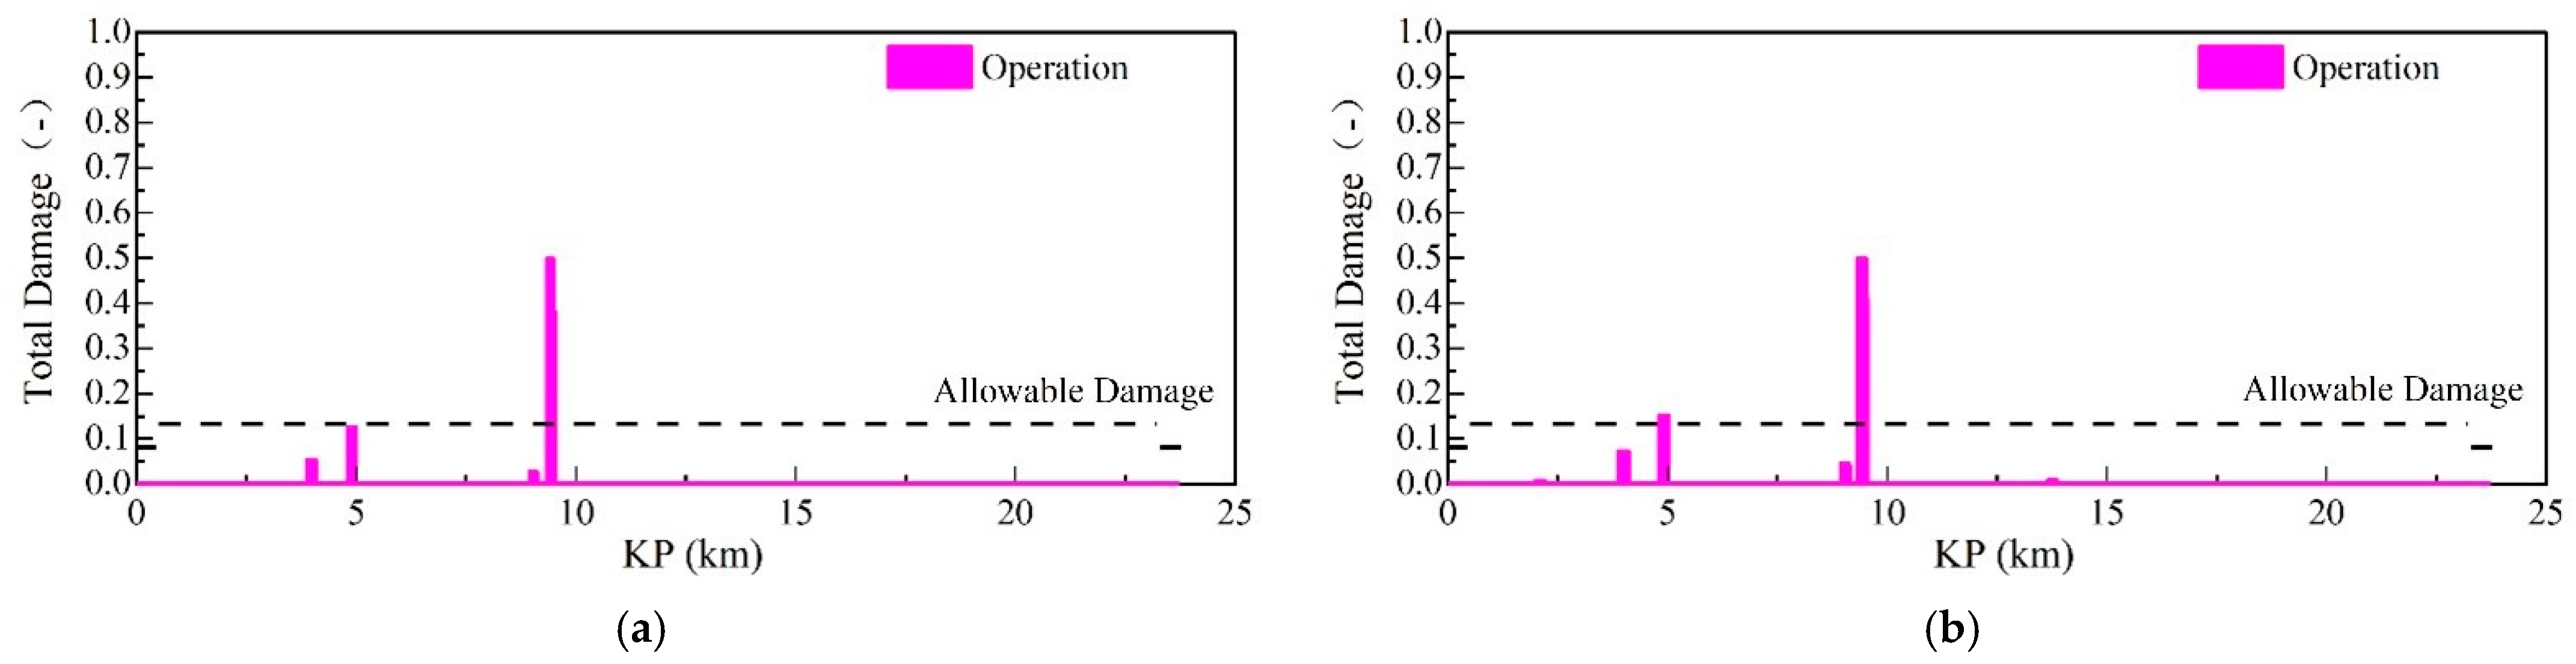
4. VIV Fatigue Analysis

A comprehensive examination of span screening analyses reveals the presence of numerous free spans that exceed the calculated onset span lengths, particularly in non-trench seabed conditions. Consequently, a thorough evaluation of VIV fatigue is conducted as a subsequent step [16].
In this study, an analysis of fatigue damage is conducted at both the weld cap and weld root locations. The results are presented in two formats: (1) annual damage, which represents the accumulated damage over a year according to the DNV-OS-F101 [17] guidelines; and (2) total damage, which is appropriately scaled to reflect the duration of the intended phase. Specifically, three months are allocated to both the “Empty” and “Flooded” phases, resulting in a total of six months. The design life for the “Operation” phase is set at 25 years. The allowable damage, as defined by the DNV-OS-F101 [17] guidelines, is determined based on the allocated fatigue damage allowance and a non-trenched design fatigue factor of 6.0.

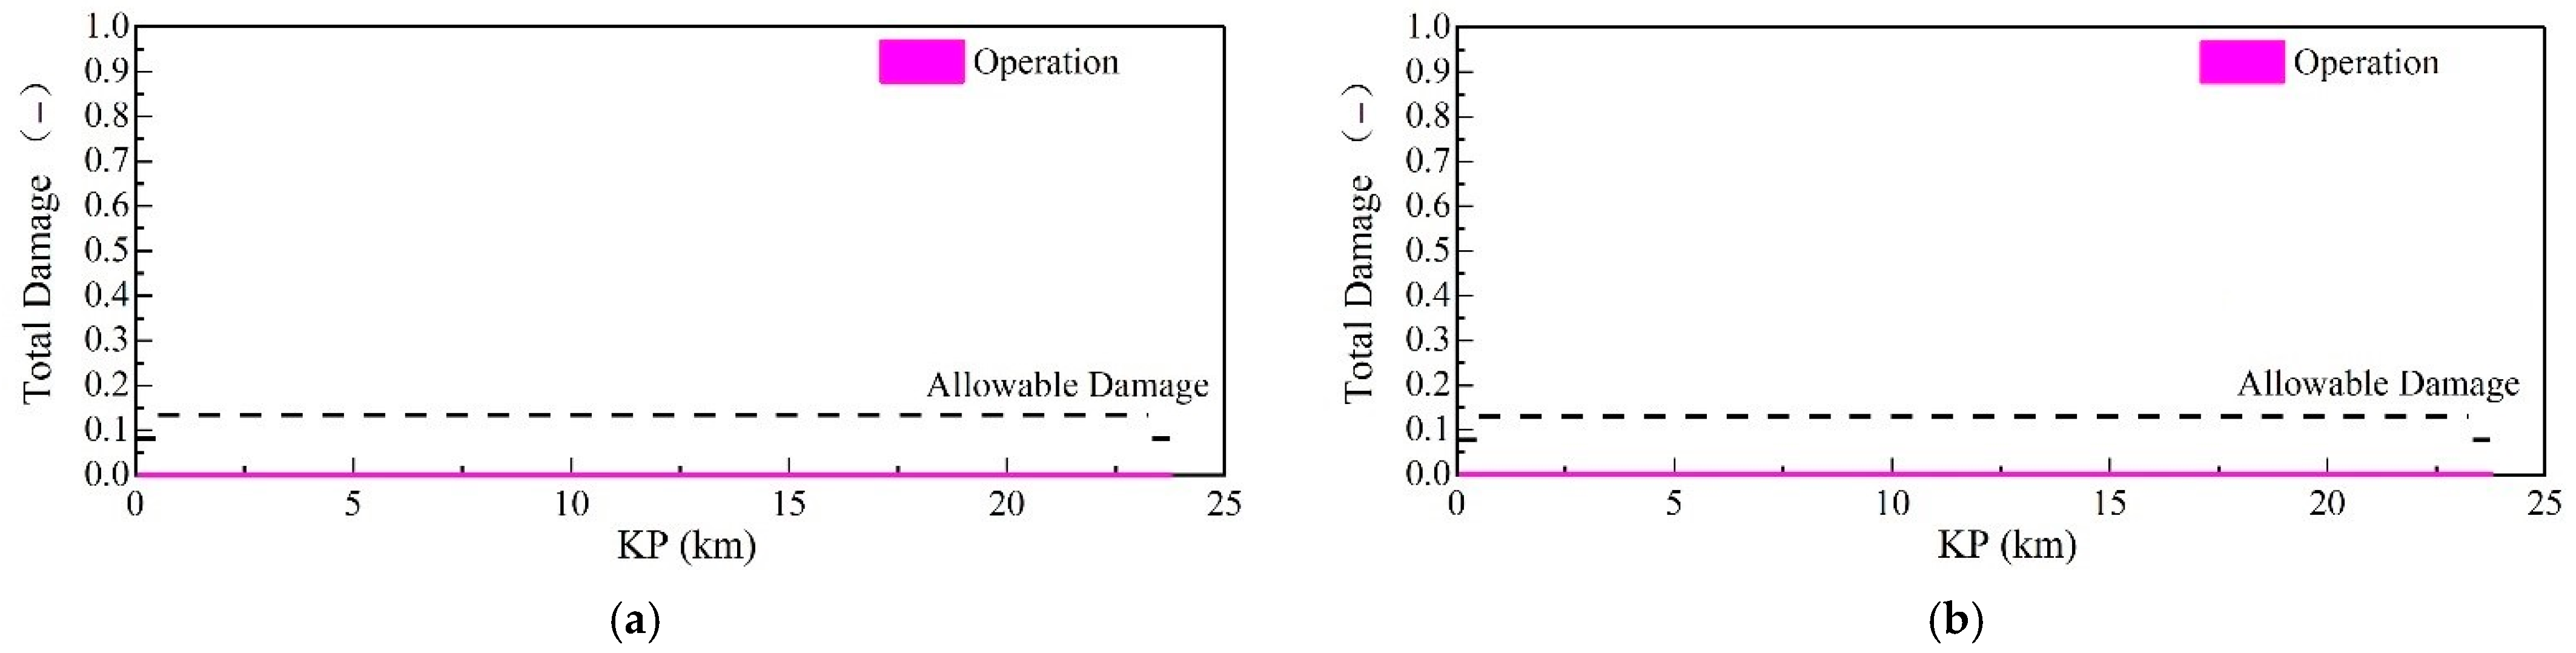
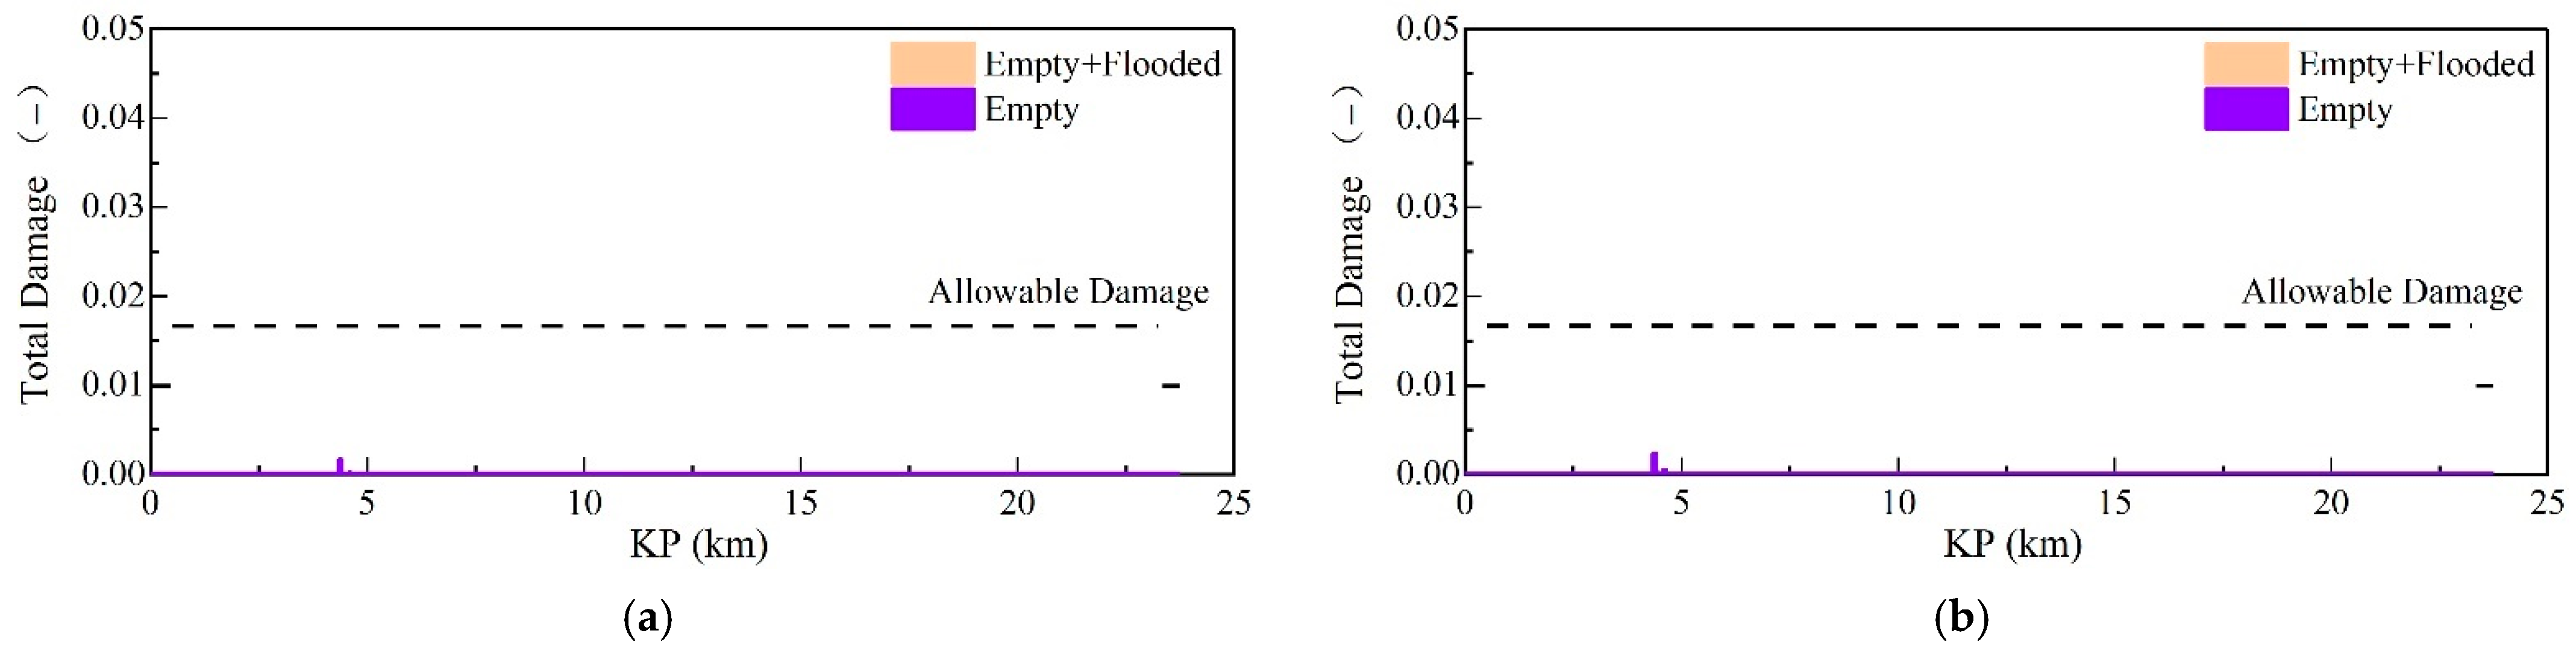
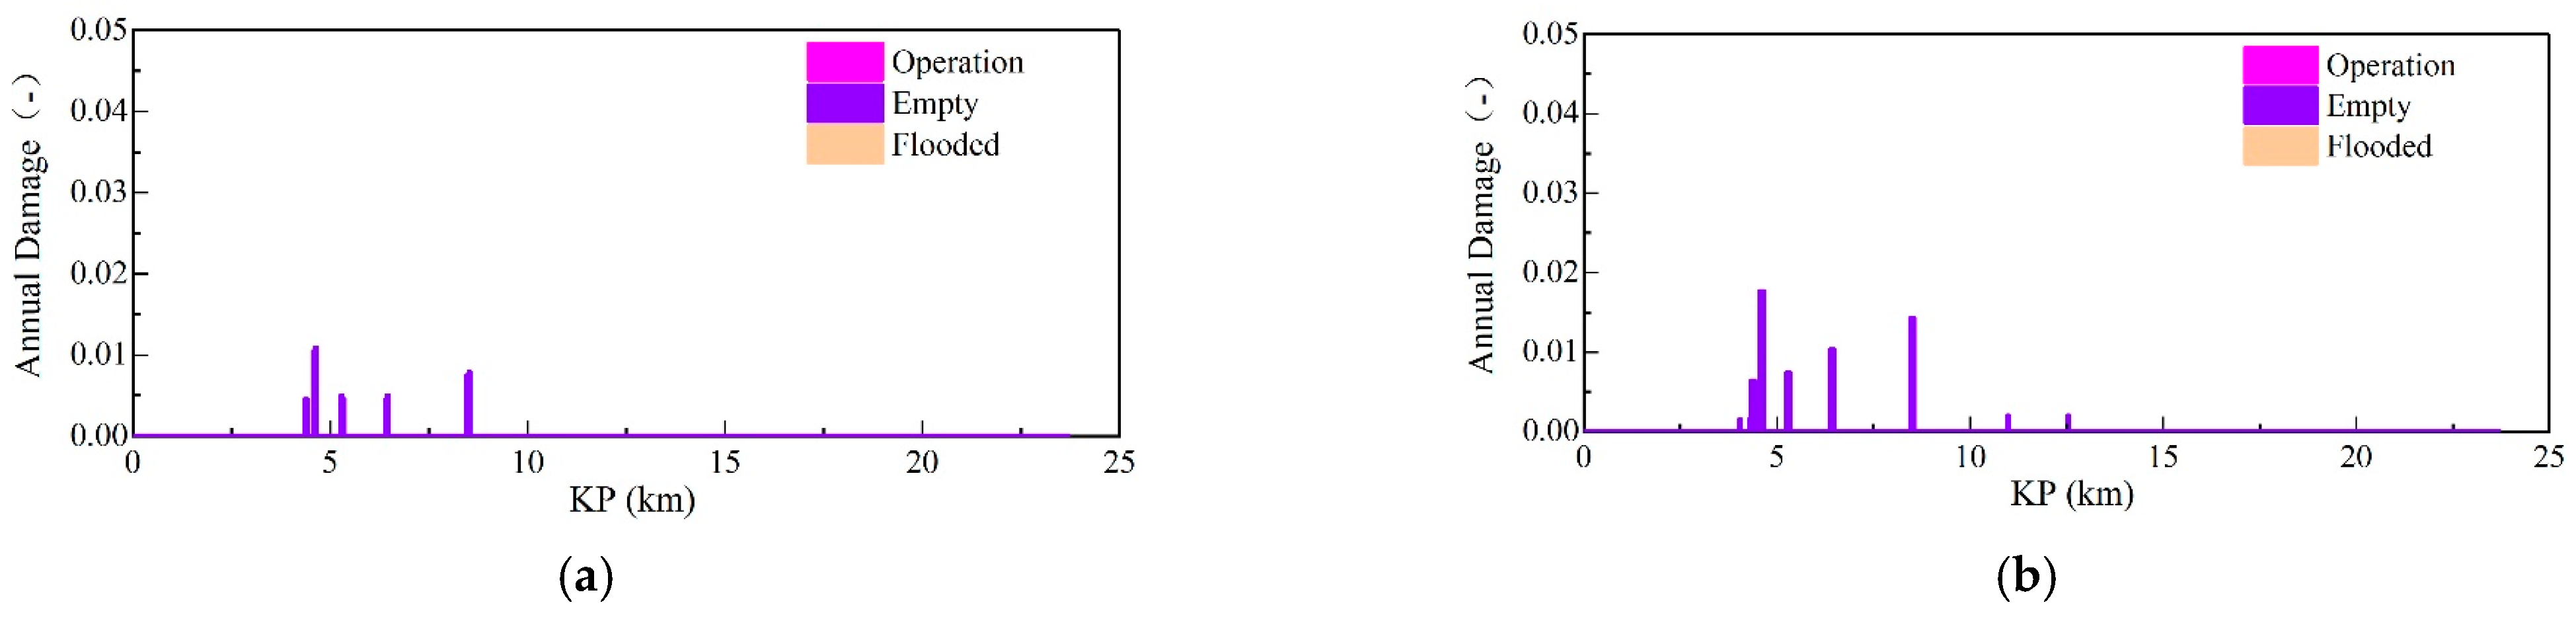
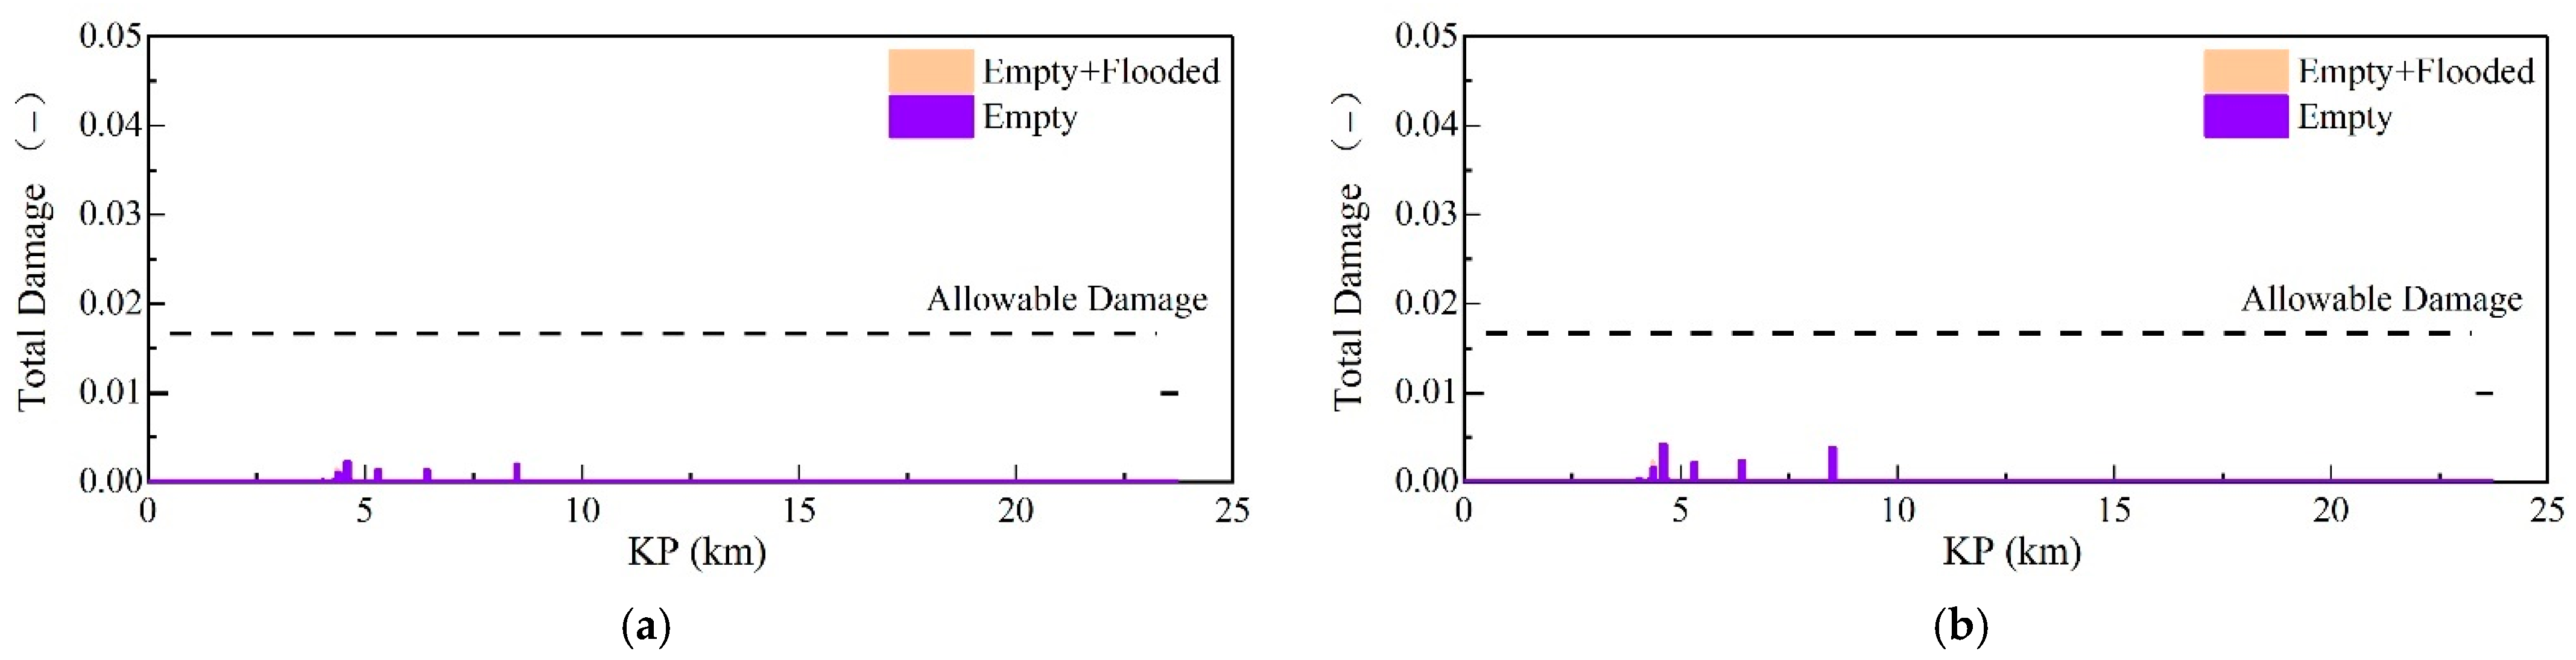
4.1. On Non-Trench Seabed

Figure 7 presents a visual representation of the annual damage resulting from VIV in the weld cap and weld root, considering three distinct conditions, while maintaining the minimum lay tension. The majority of annual damages are concentrated within the KP range of 3.5 to 5.5, with the highest recorded value being below 0.1. Conversely, Figure 8 provides graphical depictions of the total VIV damage in the weld cap and weld root, considering the same three conditions. In Figure 8, the total damage for the temporary condition (i.e., empty and flooded) is observed at a few specific points between KP 3.5 and 15.5, and their values remain below the allowable threshold (indicated by the dashed line), while for the operation condition in Figure 9, significant total damage occurs at several locations between KP 3.5 and 5.5, with the maximum value up to 2.5, which greatly exceeds the allowable value for both weld cap and weld root (0.017).
Figure 10 illustrates the annual damage caused by VIV on both the weld cap and weld root, considering three different conditions for the maximum lay tension. Within the range of KP 2.0 to 15.5, numerous locations experience minor annual damages; however, the maximum value remains consistently below 0.03. On the other hand, Figure 11 and Figure 12 present the cumulative VIV damage for both the weld cap and weld root across the same three conditions. In Figure 10, the cumulative damage for the temporary condition, characterized by empty and flooded states, is observed at various locations ranging from KP 2.0 to 15.5. The recorded damage values at these locations are found to be smaller than the predetermined allowable value, represented by the dashed line. Conversely, in Figure 11, significant cumulative damage is observed for the operational condition at multiple locations spanning KP 4.0 to 10.0. The maximum damage value recorded is 0.5, surpassing the allowable value of 0.017 for both the weld cap and weld root.
Table 6 presents a summary of the maximum annual damage values and total damage values corresponding to the maximum lay tension. It is observed that the total damage for empty and flooding conditions is 0.003, which is significantly below the permissible threshold of 0.017. Consequently, it can be inferred that the pipeline remains consistently secure under these two conditions, primarily due to their short duration of 6 months. However, during operation, the total damage reaches 1.946 and 2.039 for the weld cap and weld root, respectively, surpassing the allowable threshold of 0.133 by a substantial margin. Table 7 presents a summary of the maximum values of the annual damage and total damage corresponding to the maximum lay tension. Similar to the minimum lay tension, the total damage for the temporary conditions (0.006 and 0.012) is found to be below the permissible threshold (0.017). Conversely, the total damage during the operation period (0.496 and 0.501) significantly exceeds the allowable value (0.133).
The establishment of fatigue screening involves the correlation between span lengths and fatigue results, as depicted in Figure 13. According to the conducted fatigue analyses, the fatigue onset span length is determined to be 56 m for both the empty and flooded conditions, while for the operational condition, it is found to be 32 m.
By establishing a correlation between the span length derived from Finite Element Analysis (FEA) and the corresponding fatigue damage, a nearly linear association can be observed for the evaluated span lengths. Consequently, this facilitates the determination of fatigue span lengths through analytical means, as described above. However, caution must be exercised when extrapolating data beyond the provided sample set, as the response spectrum transitions from predominantly inline to crossflow as the spans increase in length, resulting in a non-linear trend. Figure 13b illustrates that the crossflow response at a span length of 56 m is nearly negligible, indicating that stability will not be affected by crossflow at this specific length. Moreover, the crossflow response for both flooded and operating conditions is consistently zero for the span lengths observed in this pipeline. Additionally, it is important to note that the trend should not be extrapolated linearly due to the emergence of a combined beam and cable behavior, rather than solely beam dominance, as the spans increase in size. This transition occurs within a range of L/D values between 100 and 200, corresponding to span lengths ranging from 45.7 m to 91.4 m for this pipeline.
The aforementioned findings indicate that the pipe does not meet the VIV fatigue criteria for a non-trenched seabed, necessitating the implementation of trenching measures to fulfill VIV fatigue requirements during operation. It should be noted that this assessment assumes the occurrence of all unstable upheaval buckles collapsing, thus necessitating a post-operation inspection to verify the absence of any upheavals.

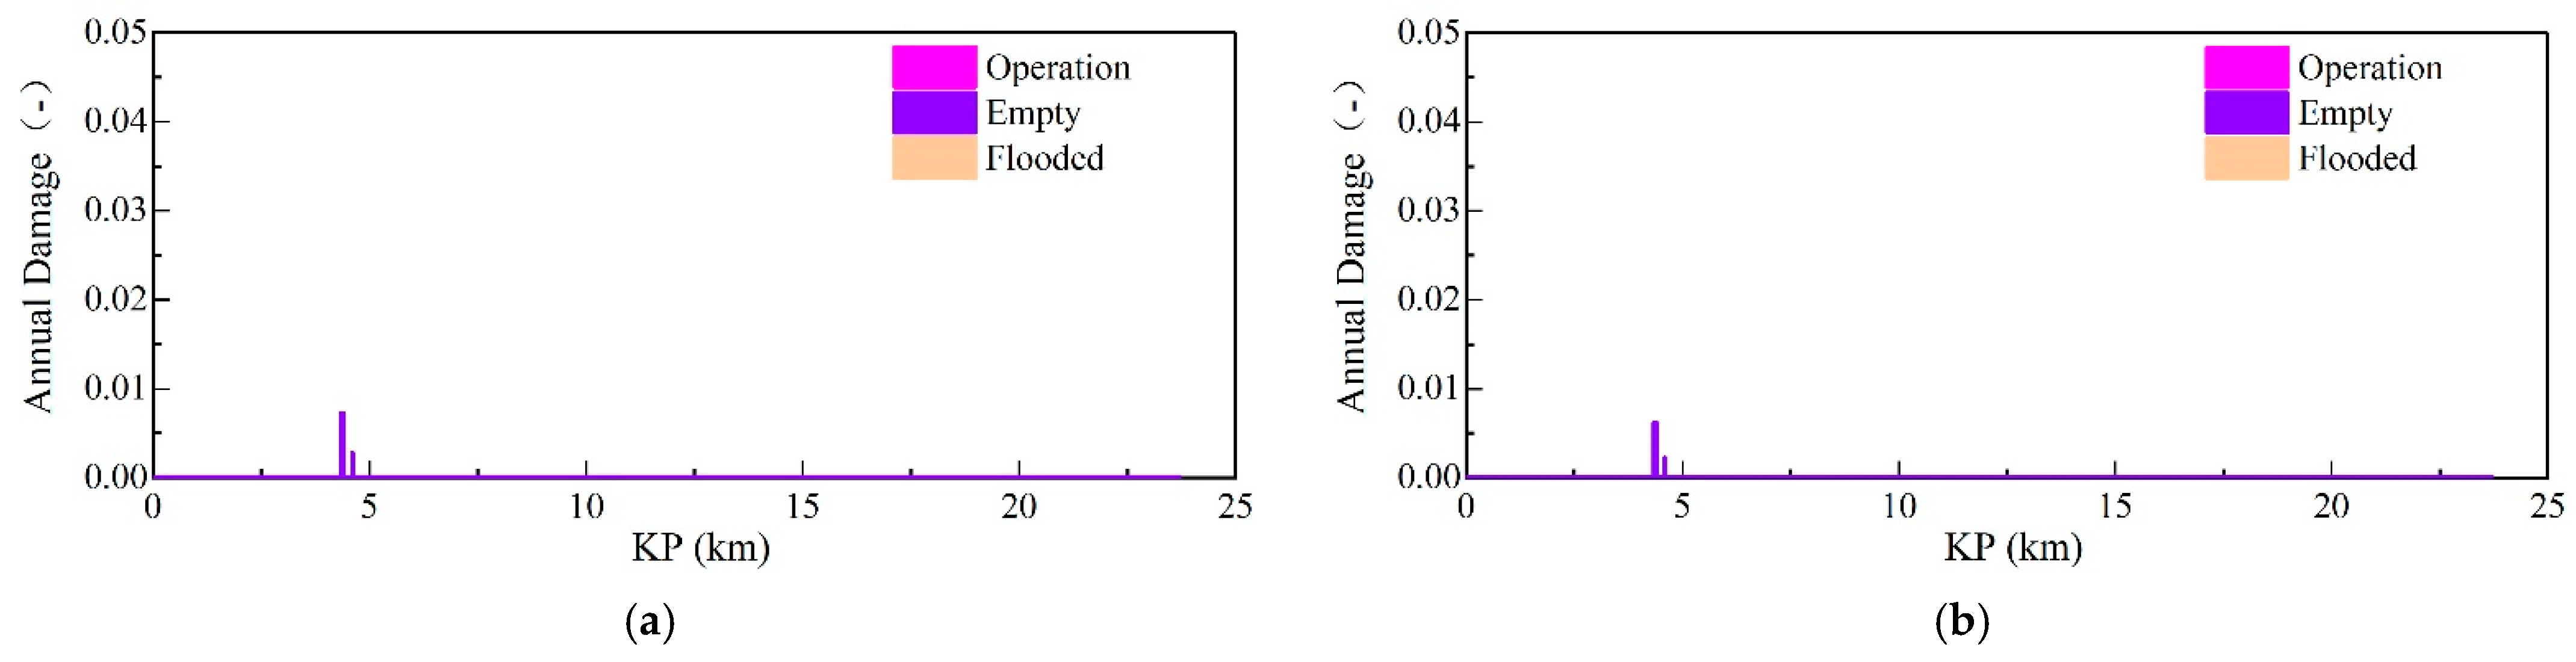
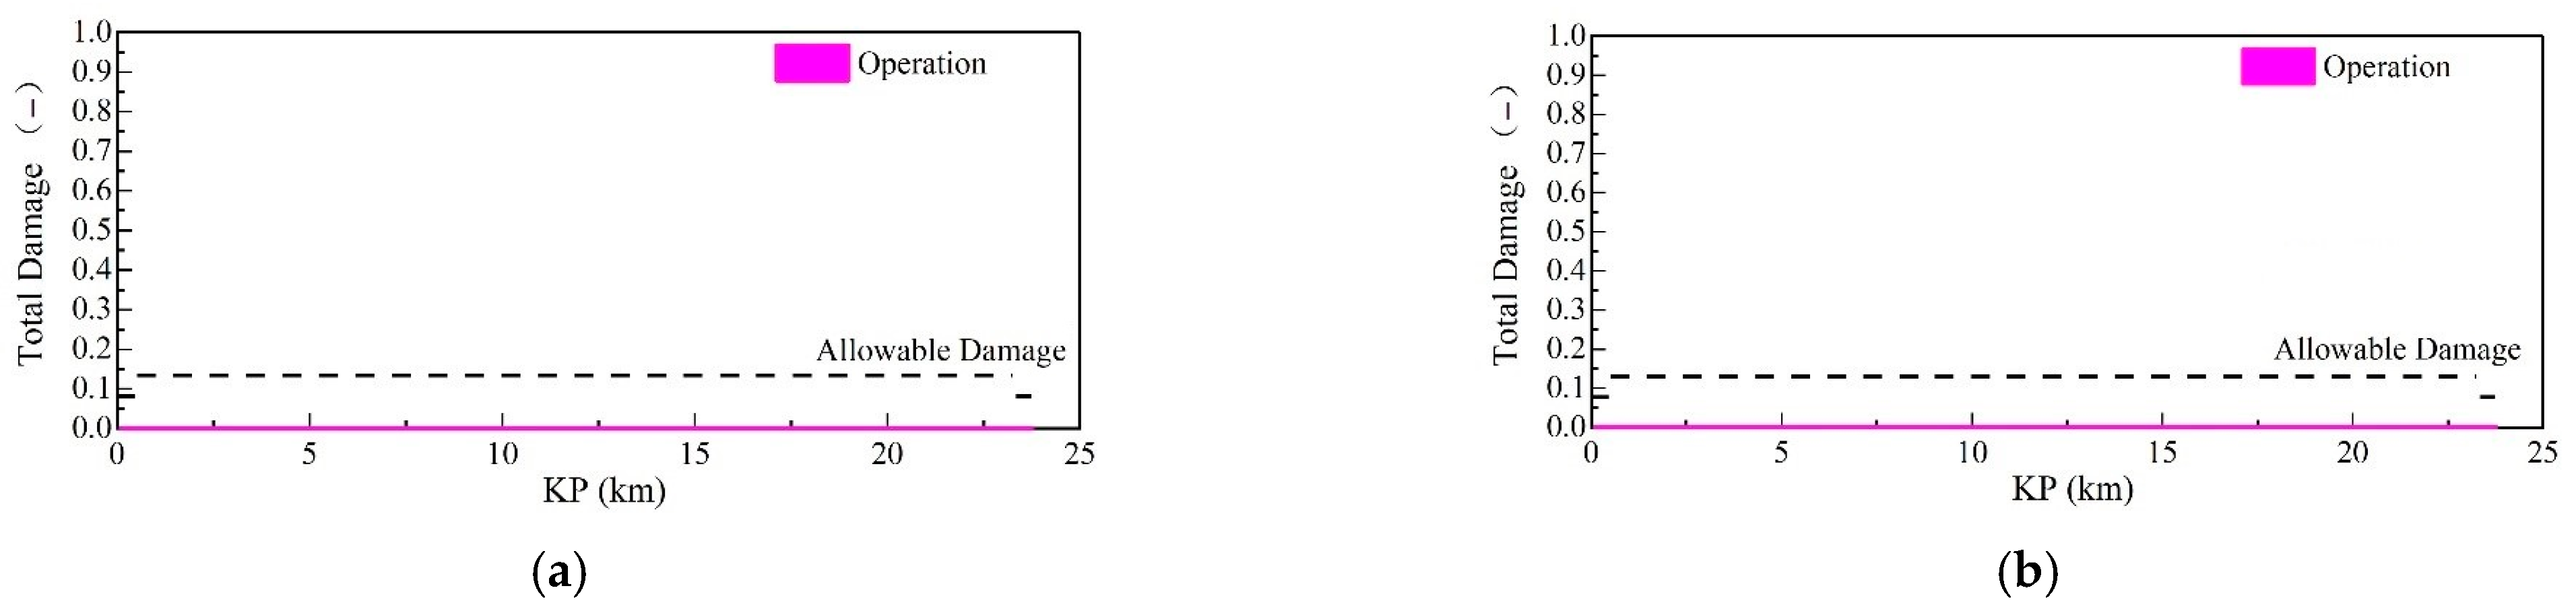
4.2. On 1 m Trench Seabed

Figure 14, Figure 15 and Figure 16 depict the annual and total damage resulting from VIV on a 1 m trench seabed for the minimum lay tension. The pipeline experiences negligible annual damages. Furthermore, the total damage during operation can be disregarded, with only minor total damage observed under temporary conditions at a specific location between KP 4.0 and 4.5.
Figure 17, Figure 18 and Figure 19 depict the annual and total damage resulting from vortex-induced vibrations (VIV) on a 1 m trench seabed for the maximum lay tension. The pipeline exhibits negligible annual damage, and the total damage incurred during operation can be disregarded. However, minimal total damage is observed at various locations between KP 4.0 and 9.0, with a maximum value of 0.05, which remains below the permissible threshold.
Table 8 and Table 9 present a summary of the maximum values of annual damage and total damage for both minimum and maximum lay tensions. In the temporary phase, the maximum total fatigue damage remains below the allowable value (specifically, 0.004 compared to 0.017). Similarly, in the operation phase, the maximum total fatigue damage remains below the allowable value (specifically, 0.000 compared to 0.133). The analysis of damage indicates that post-lay rectification to a 1 m trench at the necessary locations is appropriate for the pipeline.

5. Conclusions

This study conducts a finite element analysis of a PIP (pipe-in-pipe) pipeline located in the Lufeng oil field, which is situated on a sea bottom characterized by large-scale sand waves. The objective is to evaluate the fatigue damage caused by VIV. The determination of VIV fatigue damage is carried out following the guidelines provided in DNVGL-RP-F105 [2], and the results are compared against the limits specified in DNV-OS-F101 [17]. The assessments are conducted for three different conditions: as-laid empty, flooded, and operational.
The VIV onset screening assessment successfully identified a considerable quantity of free spans on the seabed that has not been trenched. These free spans surpass the VIV onset span lengths observed during temporary and operating conditions, rendering them vulnerable to VIV fatigue. Subsequently, the efficacy of a 1 m trench rectification measure is evaluated. It is observed that the number of free spans susceptible to VIV fatigue is significantly reduced in the 1 m trench seabed compared to the non-trenched condition under all circumstances. According to the VIV analysis, the occurrence of VIV in a pipeline is more pronounced in empty conditions compared to flooded and operational conditions. Additionally, a greater number of spans experience VIV when subjected to maximum residual lay tension as opposed to minimum lay tension.
The VIV fatigue assessment is conducted on the free spans of the pipeline. In the absence of a trench on the seabed, substantial overall damage is observed at multiple locations during operational activities. The maximum total damage can reach 2.5 for the minimum lay tension and 0.5 for the maximum lay tension, significantly surpassing the permissible threshold for both the weld cap and weld root (0.017). However, when implementing a 1 m trench rectification measure, the maximum total damage remains below the allowable value for the empty, flooded, and operational conditions.
The findings suggest that sand waves have a notable impact on both the length of pipeline spans and the fatigue damage caused by VIV. In the absence of a trench on the seabed, the pipeline is deemed unsuitable for VIV fatigue. Therefore, it is necessary to implement additional measures, such as a 1 m trench rectification, in areas with extensive sand waves on the seabed. The results demonstrate that the implementation of a 1 m trench rectification measure effectively mitigates the occurrence of VIV and subsequently reduces fatigue damage.
It should be noted that this assessment is predicated on the assumption that all unstable upheaval buckles will collapse, thus necessitating a post-operation inspection to verify the absence of any upheavals.

Author Contributions

Conceptualization, X.Z. and Z.Z.; data curation, X.Z. and B.X.; methodology, X.Z. and Z.Z.; investigation, X.Z., B.X. and E.C.; resources, X.Z. and Z.Z.; writing—original draft preparation, X.Z. and B.X.; writing—review and editing, Z.Z. and J.H.; visualization, E.C.; supervision, Z.Z. and J.H.; funding acquisition, X.Z. and Z.Z. All authors have read and agreed to the published version of the manuscript.

Funding

This research was funded by the National Natural Science Foundation of China (52371289, 51979192) and the China National Offshore Oil Corporation (Major science and technology project during the 14th Five-year plan).

Institutional Review Board Statement

Not applicable.

Informed Consent Statement

Not applicable.

Data Availability Statement

Data from the present experiment appear in the submitted manuscript.

Conflicts of Interest

The authors declare no conflict of interest.

References

  1. Palmer, A.C.; King, R.A. Subsea Pipeline Engineering; PennWell Corporation: Tulsa, OK, USA, 2008. [Google Scholar]
  2. DNVGL-RP- F105; Free Spanning Pipelines. Det Norske Veritas: Bærum, Norway, 2017.
  3. Brunone, B. A transient test-based technique for leak detection in outfall pipes. J. Water Res. Plan. Man. ASCE 1999, 125, 302–306. [Google Scholar] [CrossRef]
  4. Meniconi, S.; Rubin, A.; Tirello, L.; Capponi, C.; Cifrodelli, M.; Lucato, P.; Brunone, B. Checking procedure of the Trieste (Italy) subsea pipeline by transient tests. Preliminary results. Proceedings 2019, 48, 2. [Google Scholar]
  5. Zang, Z.; Cheng, L.; Zhao, M.; Liang, D.; Teng, B. A numerical model for onset of scour below offshore pipelines. Coast. Eng. 2009, 56, 458–466. [Google Scholar] [CrossRef]
  6. Sumer, B.M.; Truelsen, C.; Sichmann, T.; Fredsøe, J. Onset of scour below pipelines and self-burial. Coast. Eng. 2001, 42, 313–335. [Google Scholar] [CrossRef]
  7. Cheng, L.; Yeow, K.; Zang, Z.; Li, F. 3D scour below pipelines under waves and combined waves and currents. Coast. Eng. 2014, 83, 137–149. [Google Scholar] [CrossRef]
  8. Wu, Y.S.; Chiew, Y.M. Mechanics of pipeline scour propagation in the spanwise direction. J. Waterw. Port Coast. 2015, 141, 04014045. [Google Scholar] [CrossRef]
  9. Sui, T.; Staunstrup, L.H.; Carstensen, S.; Fuhrman, D.R. Span shoulder migration in three-dimensional current-induced scour beneath submerged pipelines. Coast. Eng. 2021, 164, 103776. [Google Scholar] [CrossRef]
  10. Morelissen, R.; Hulscher, S.J.M.H.; Knaapen, M.A.F.; Németh, A.A.; Bijker, R. Mathematical modelling of sand wave migration and the interaction with pipelines. Coast. Eng. 2003, 48, 197–209. [Google Scholar] [CrossRef]
  11. Németh, A.A.; Hulscher, S.J.M.H.; Van Damme, R.M.J. Simulating offshore sand waves. Coast. Eng. 2006, 53, 265–275. [Google Scholar] [CrossRef]
  12. Sterlini, F.; Hulscher, S.J.M.H.; Hanes, D.M. Simulating and understanding sand wave variation: A case study of the Golden Gate sand waves. J. Geophy. Res. 2009, 114, F02007. [Google Scholar] [CrossRef]
  13. Zang, Z.; Xie, B.; Cheng, L.; He, F.; Zou, X. Numerical investigations on the transient behavior of sand waves in Beibu Gulf under normal and extreme sea conditions. China Ocean Eng. 2023, 37, 1–15. [Google Scholar] [CrossRef]
  14. Zhang, H.; Ma, X.; Zhuang, L.; Yan, J. Sand waves near the shelf break of the northern South China Sea: Morphology and recent mobility. Geo-Mar. Lett. 2019, 39, 19–36. [Google Scholar] [CrossRef]
  15. Zang, Z.; Zhang, Y.; Chen, T.; Xie, B.; Zou, X.; Li, Z. A numerical simulation of internal wave propagation on a continental slope and its influence on sediment transport. J. Mar. Sci. Eng. 2023, 11, 517. [Google Scholar] [CrossRef]
  16. Free Span Analysis of the Pipeline in Lufeng Oilfield; CNOOC Research Institute Co., Ltd.: Beijing, China, 2020.
  17. DNV-OS-F101; Submarine Pipeline Systems. Det Norske Veritas: Bærum, Norway, 2013.
  18. Choi, H.S. Free spanning analysis of offshore pipelines. Ocean Eng. 2001, 28, 1325–1338. [Google Scholar] [CrossRef]
  19. Wang, J.; Wang, F.; Duan, G.; Jukes, P. VIV analysis of pipelines under complex span conditions. J. Marine. Sci. Appl. 2009, 8, 105–109. [Google Scholar] [CrossRef]
  20. Sollund, H.A.; Vedeld, K.; Fyrileiv, O.; Hellesland, J. Improved assessments of wave-induced fatigue for free spanning pipelines. Appl. Ocean Res. 2016, 61, 130–147. [Google Scholar] [CrossRef]
  21. Zhu, H.; Zhao, H.; Srinil, N. Experimental investigation on vortex-induced vibration and solid-structure impact of a near-bottom horizontal flexible pipeline in oblique shear flow. J. Fluids Struct. 2021, 106, 103356. [Google Scholar] [CrossRef]
  22. Xu, W.; Jia, K.; Ma, Y.; Song, Z. Vortex-induced vibration response features of a submarine multi-Span pipeline via towing tank experimental tests. China Ocean Eng. 2023, 37, 175–189. [Google Scholar] [CrossRef]
  23. Pu, J.; Xu, J.; Li, G. Self-burial and potential hazards of a submarine pipeline in the sand wave area in the South China Sea. J. Pipeline Syst Eng. 2013, 4, 124–130. [Google Scholar] [CrossRef]
  24. Wang, L.; Gong, H.; Xing, X.; Yuan, J. Rigid dynamic performance simulation of an offshore pipeline plough. Ocean Eng. 2015, 94, 51–66. [Google Scholar] [CrossRef]
  25. DNVGL-RP-C203; Fatigue Design of Offshore Steel Structures. Det Norske Veritas: Bærum, Norway, 2019.
Figure 1. (a) Bathymetry along the pipeline route, (b) multiple free spans on the pipeline.
Jmse 11 02031 g001
Figure 2. Sketch of the model for the assessment of pipeline spans.
Jmse 11 02031 g002
Figure 3. Typical pipe-in-pipe cross-section configuration.
Jmse 11 02031 g003
Figure 4. Current conditions, (a) near seabed current rosette, (b) percentage occurrence versus current speed.
Jmse 11 02031 g004
Figure 5. The VIV span screening results for the non-trench seabed with the minimum and maximum lay tension. Specifically, (a,b) pertain to empty conditions, (c,d) relate to flooded conditions, and (e,f) correspond to operational conditions. The left column represents the minimum lay tension, while the right column represents the maximum tension. The water depth is indicated by the blue line, and the span length along the pipeline route is denoted by scattering dots. The onset span length is visually represented by the dashed straight line.
Jmse 11 02031 g005aJmse 11 02031 g005b
Figure 6. The VIV span screening results for the 1 m trench seabed with the minimum and maximum lay tension. Specifically, (a,b) pertain to empty conditions, (c,d) relate to flooded conditions, and (e,f) correspond to operational conditions. The left column represents the minimum lay tension, while the right column represents the maximum tension. The water depth is indicated by the blue line, and the span length along the pipeline route is denoted by scattering dots. The onset span length is visually represented by the dashed straight line.
Jmse 11 02031 g006aJmse 11 02031 g006b
Figure 7. VIV annual damage of casing pipe on non-trench seabed for minimum lay tension: (a) weld cap, (b) weld root.
Jmse 11 02031 g007
Figure 8. VIV total damage of casing pipe on non-trench seabed for the minimum lay tension under temporary condition: (a) weld cap, (b) weld root.
Jmse 11 02031 g008
Figure 9. VIV total damage of casing pipe on non-trench seabed for the minimum lay tension during operation: (a) weld cap, (b) weld root.
Jmse 11 02031 g009
Figure 10. VIV annual damage of casing pipe on non-trench seabed for the maximum lay tension: (a) weld cap, (b) weld root.
Jmse 11 02031 g010
Figure 11. VIV total damage of casing pipe on non-trench seabed for the maximum lay tension under temporary operation: (a) weld cap, (b) weld root.
Jmse 11 02031 g011
Figure 12. VIV total damage of casing pipe on non-trench seabed for the maximum lay tension during operation: (a) weld cap, (b) weld root.
Jmse 11 02031 g012
Figure 13. Cumulative fatigue: (a) empty conditions; (b) empty condition x-flow only; (c) flooded conditions; (d) operation condition.
Jmse 11 02031 g013
Figure 14. VIV annual damage of casing pipe on 1 m trench seabed for minimum lay tension: (a) weld cap, (b) weld root.
Jmse 11 02031 g014
Figure 15. VIV total damage of casing pipe on 1 m trench seabed for the minimum lay tension during operation: (a) weld cap, (b) weld root.
Jmse 11 02031 g015
Figure 16. VIV total damage of casing pipe on 1 m trench seabed for the minimum lay tension under temporary conditions: (a) weld cap, (b) weld root.
Jmse 11 02031 g016
Figure 17. VIV annual damage of casing pipe on 1 m trench seabed for the maximum lay tension: (a) weld cap, (b) weld root.
Jmse 11 02031 g017
Figure 18. VIV total damage of casing pipe on 1 m trench seabed for the maximum lay tension during operation: (a) weld cap, (b) weld root.
Jmse 11 02031 g018
Figure 19. VIV total damage of casing pipe on 1 m trench seabed for the maximum lay tension under temporary conditions: (a) weld cap, (b) weld root.
Jmse 11 02031 g019
Table 1. Pipeline mechanical properties and design conditions.
ParameterUnitsCarrier PipeCasing Pipe
Design LifeYears2525
Pipe Grade-API 5L PSL2 X65API 5L PSL2 X65
SMYSMPa450450
Outside Diametermm323.9457.0
Wall Thicknessmm14.314.3
Corrosion Allowancemm3.0-
Insulation Coatingmm(kg/m3)45.0(50)-
Anti-Corro. Coatingmm(kg/m3)-3.5(920)
Content Densitykg/m3821–953-
Operating PressureMpa4.401-
Hydrotest PressureMpa7.161-
Table 2. Wave directionality distribution.
NNEESESSWWNWTotal (%)
0.4940.6427.765.8310.4813.920.660.23100
Table 3. Parameters for the highest probability occurrence waves in each direction.
DirectionNNEESESSWWNW
Pmax (%)10.6314.978.7416.7615.8220.8821.1311.89
Hs (m)1.0–1.53.0–3.50.5–1.00.5–1.00.5–1.00.5–1.00.5–1.00.5–1.0
Tp (s)5.0–6.08.0–9.06.0–7.06.0–7.06.0–7.06.0–7.04.0–5.05.0–6.0
Table 4. Design parameters and partial safety factors.
ParameterSymbolValue
Safety Factor for Fatigueη0.5/0.25
For Natural Frequenciesγf1.00
For Onset of VIV (IL)γon,IL1.10
For Onset of VIV (CF)γon,CF1.20
On Stability Parameterγk1.15
On Stress Amplitudeγs1.30
Table 5. Onset screening results.
ConditionUnitVIV Onset Span
Max. TensionMin. Tension
Emptym30.829.9
Floodedm30.829.9
Operationm18.117.7
Table 6. VIV damage summary for the minimum lay tension on non-trench seabed.
CasesAnnual DamageLife
(yr)
Total Damage
CapRootCapRootAllow
Empty0.0110.0140.60.0030.0030.017
Flooded0.0000.000N/A0.0030.0030.017
Operation0.0780.0821.61.9462.0390.133
Table 7. VIV damage summary for the maximum lay tension on non-trench seabed.
CasesAnnual DamageLife
(yr)
Total Damage
CapRootCapRootAllow
Empty0.0150.0300.30.0060.0120.017
Flooded0.0100.0190.40.0060.0120.017
Operation0.0200.0206.60.4960.5010.133
Table 8. VIV damage summary for the minimum lay tension on 1 m trench seabed.
CasesAnnual DamageLife
(yr)
Total Damage
CapRootCapRootAllow
Empty0.0070.0090.60.0020.0020.017
Flooded0.0000.000N/A0.0030.0030.017
Operation0.0000.0001.60.0000.0000.133
Table 9. VIV damage summary for the maximum lay tension on 1 m trench seabed.
CasesAnnual DamageLife
(yr)
Total Damage
CapRootCapRootAllow
Empty0.0090.0170.30.0020.0040.017
Flooded0.0020.0030.40.0060.0120.017
Operation0.0000.0006.60.0000.0000.133
Disclaimer/Publisher’s Note: The statements, opinions and data contained in all publications are solely those of the individual author(s) and contributor(s) and not of MDPI and/or the editor(s). MDPI and/or the editor(s) disclaim responsibility for any injury to people or property resulting from any ideas, methods, instructions or products referred to in the content.

