
Performance of Prefabricated Hollow Concrete-Filled Steel Tube Bracings on Transverse Bending: Experimental and Numerical Analyses

Abstract
:1. Introduction
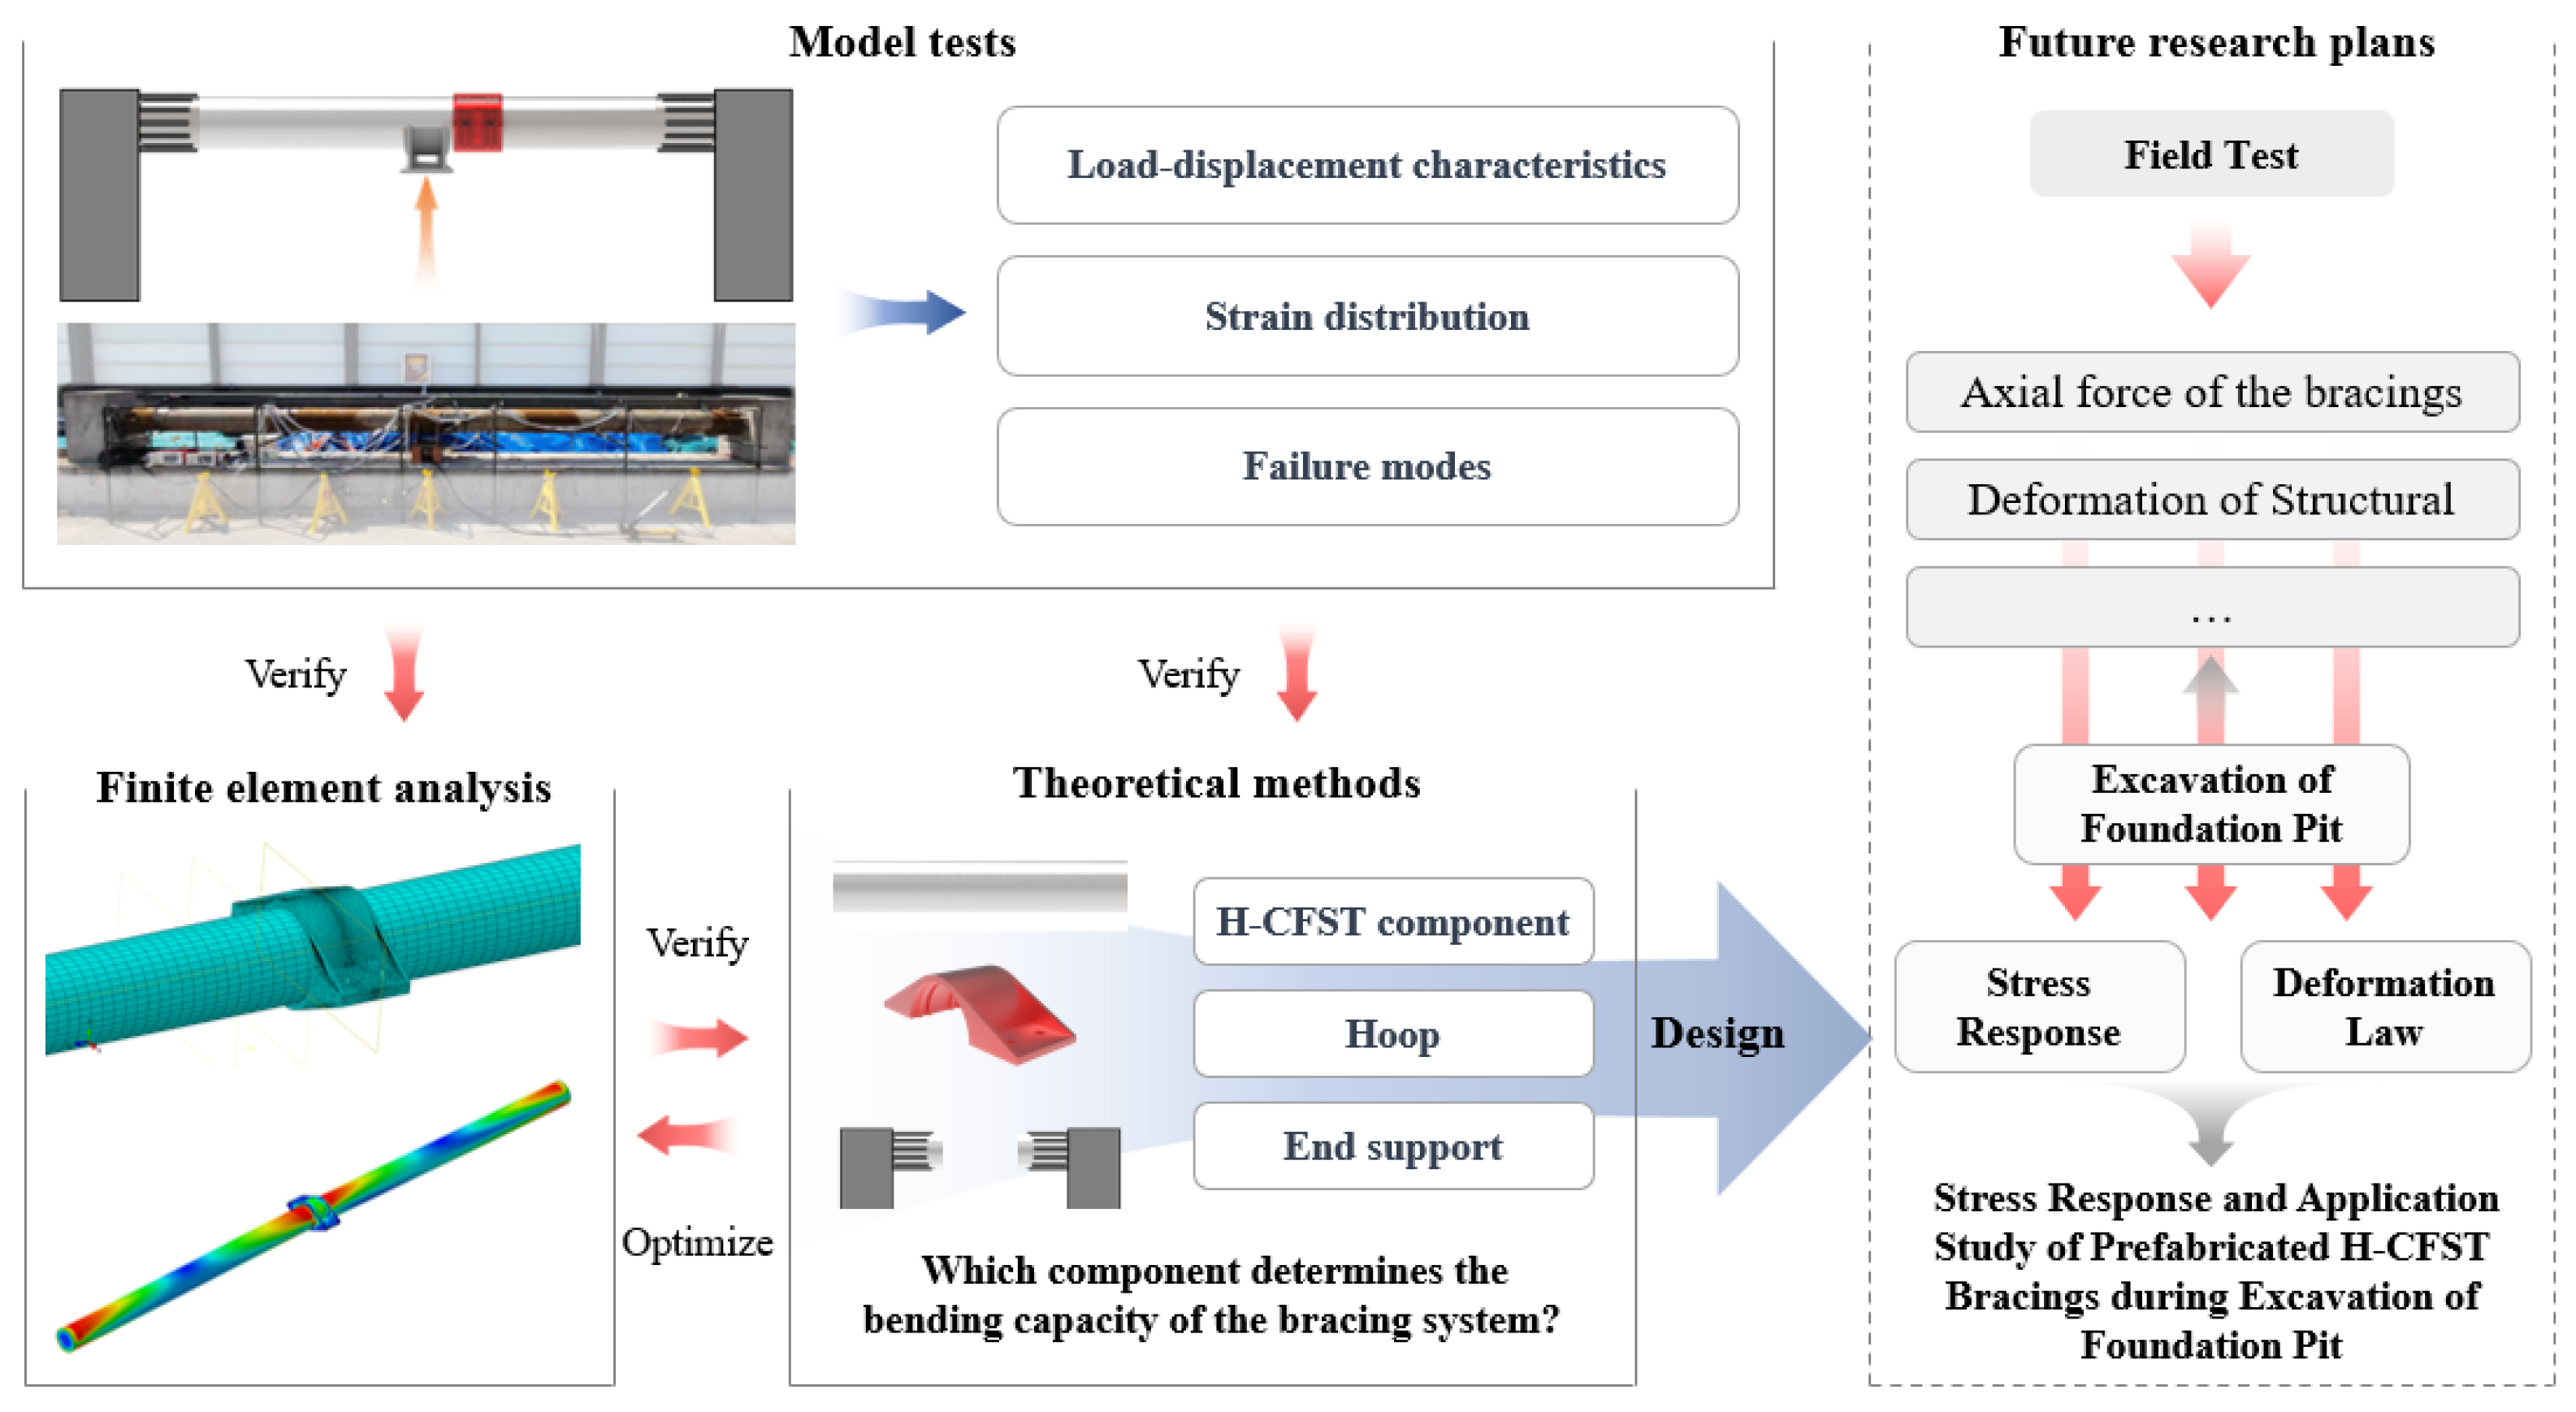
2. The Model Test
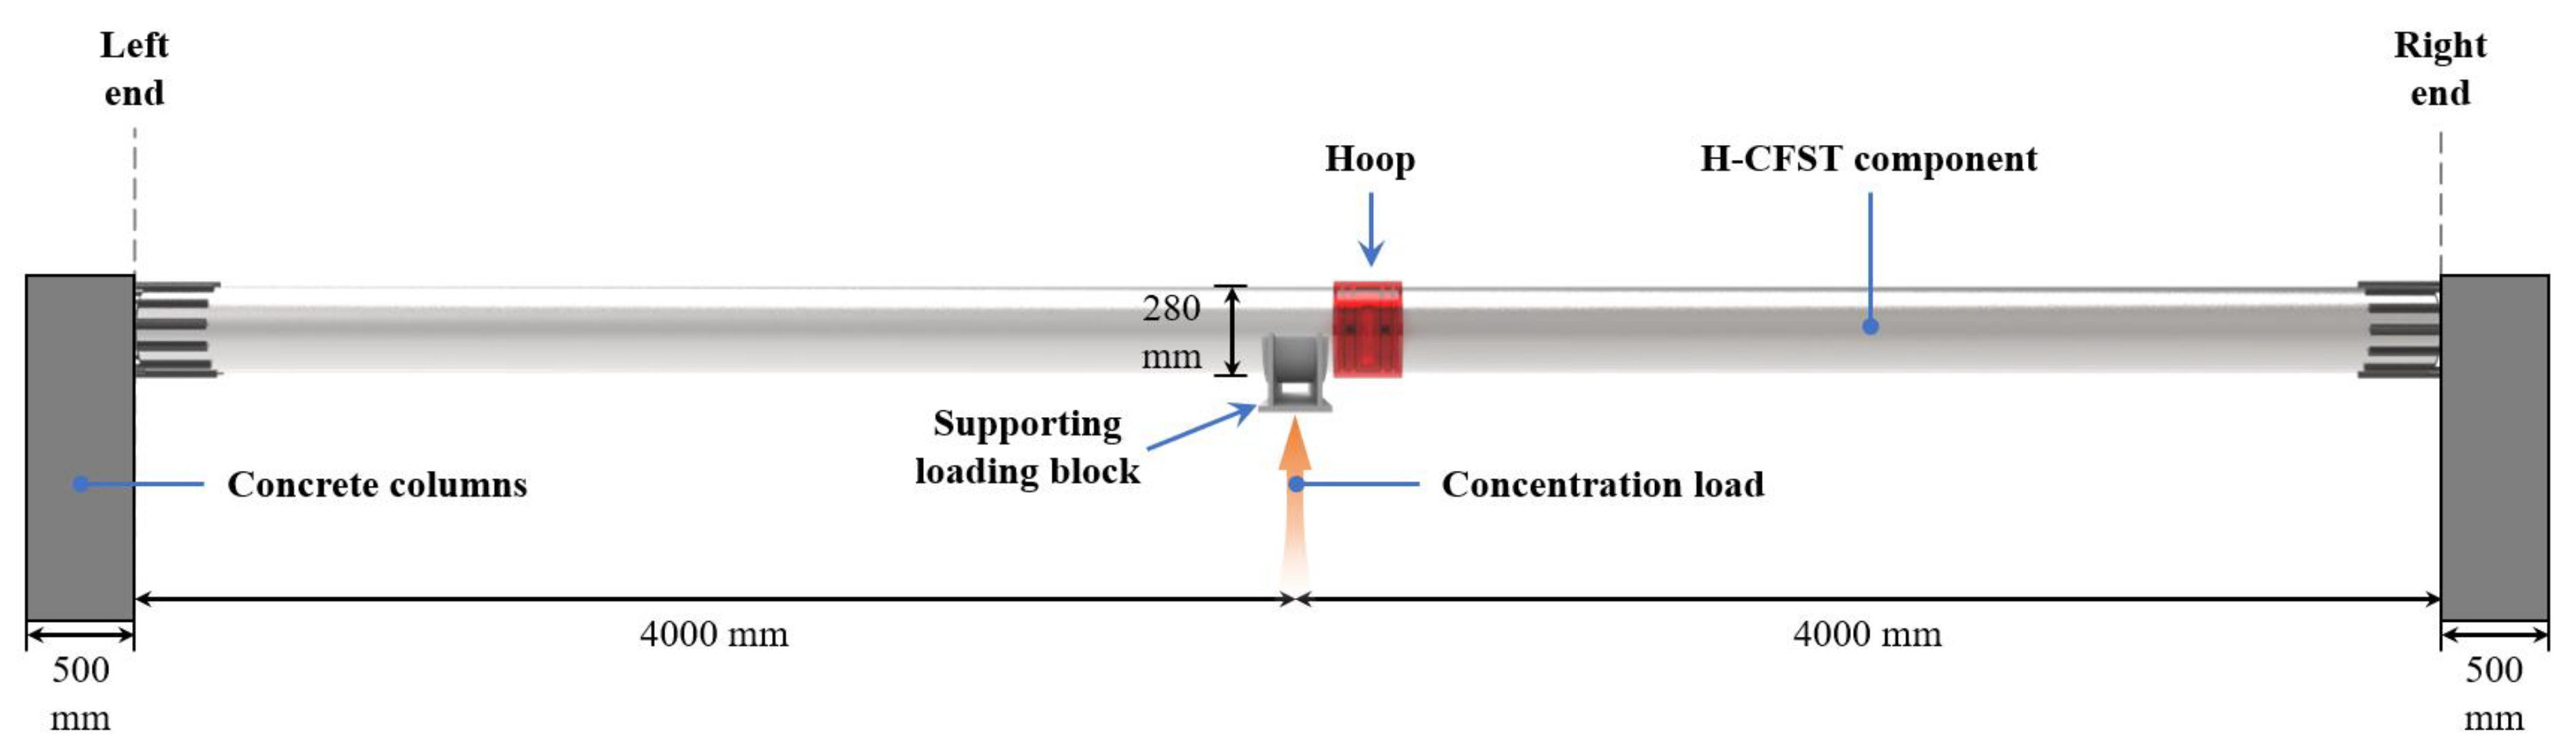
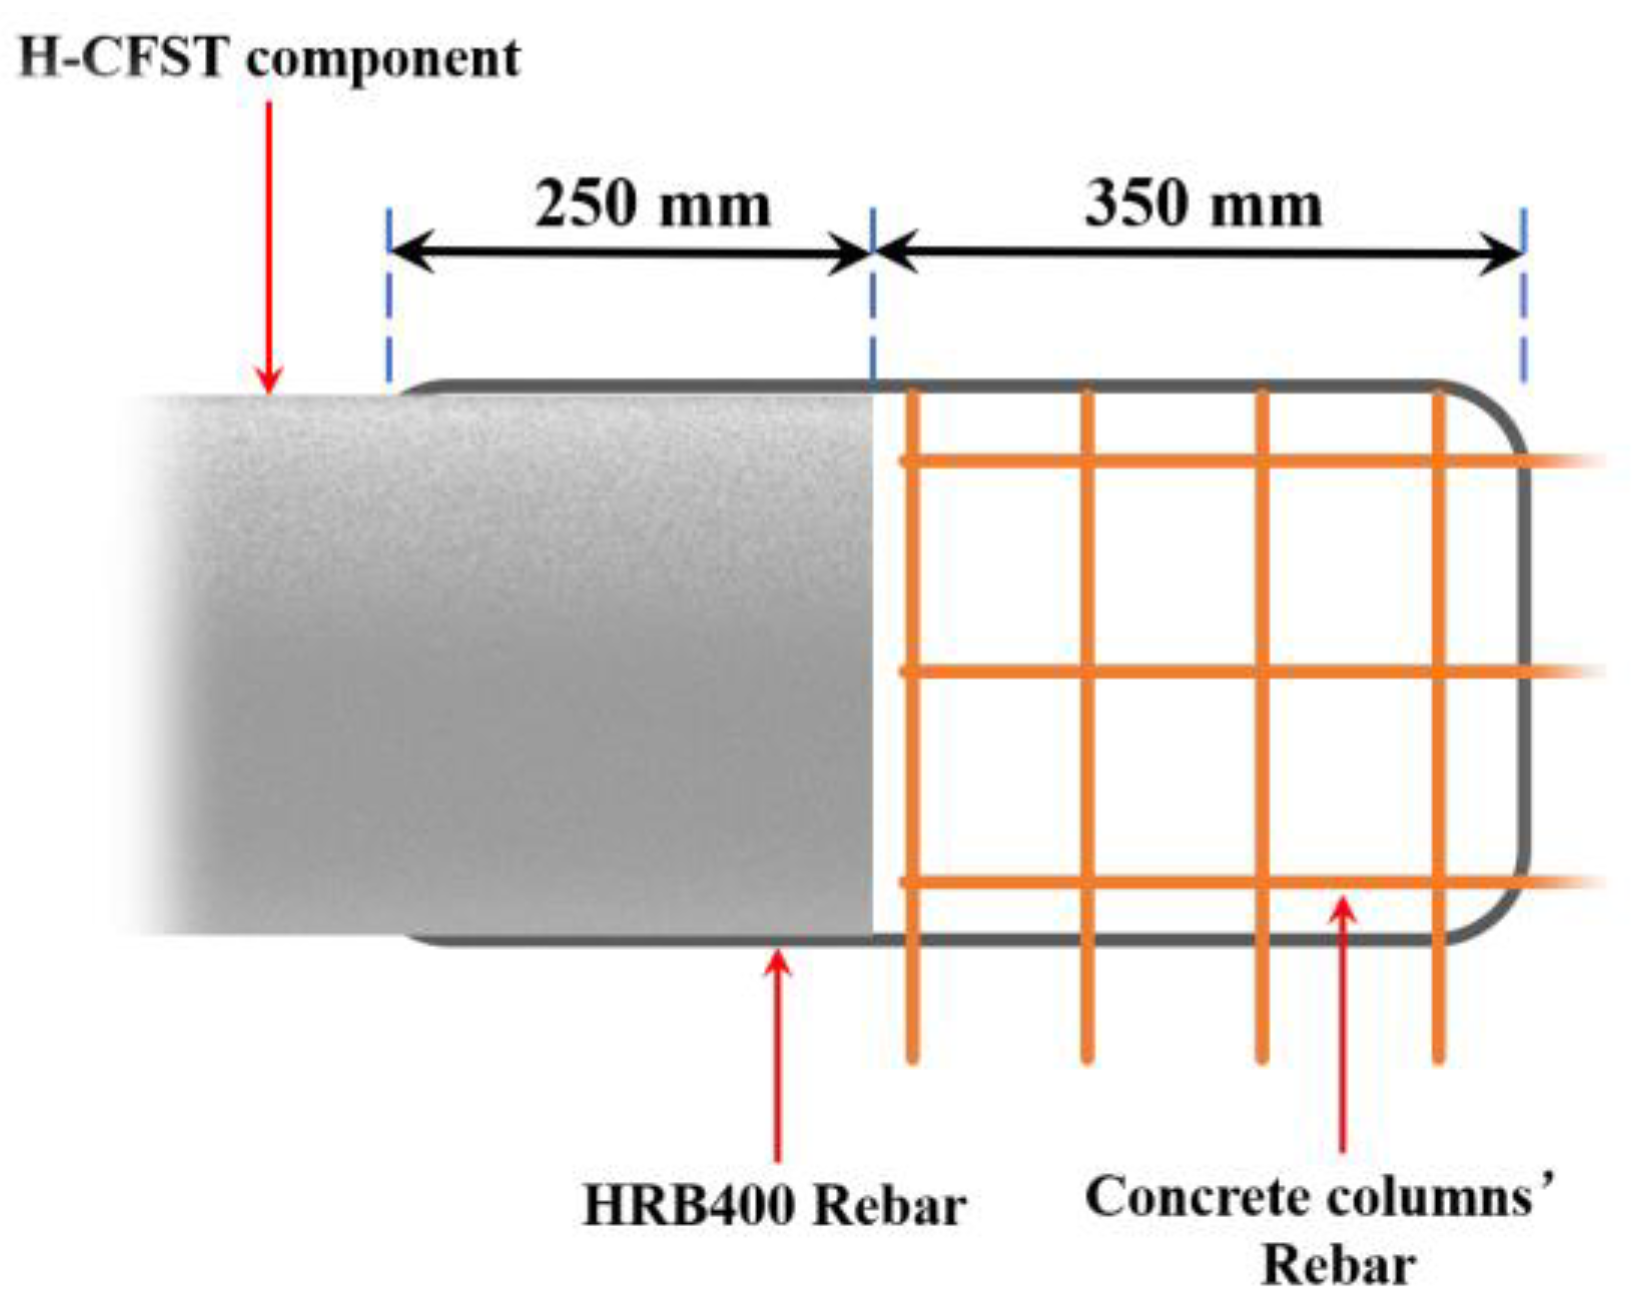
2.1. Design and Fabrication of the Experimental Model Specimen
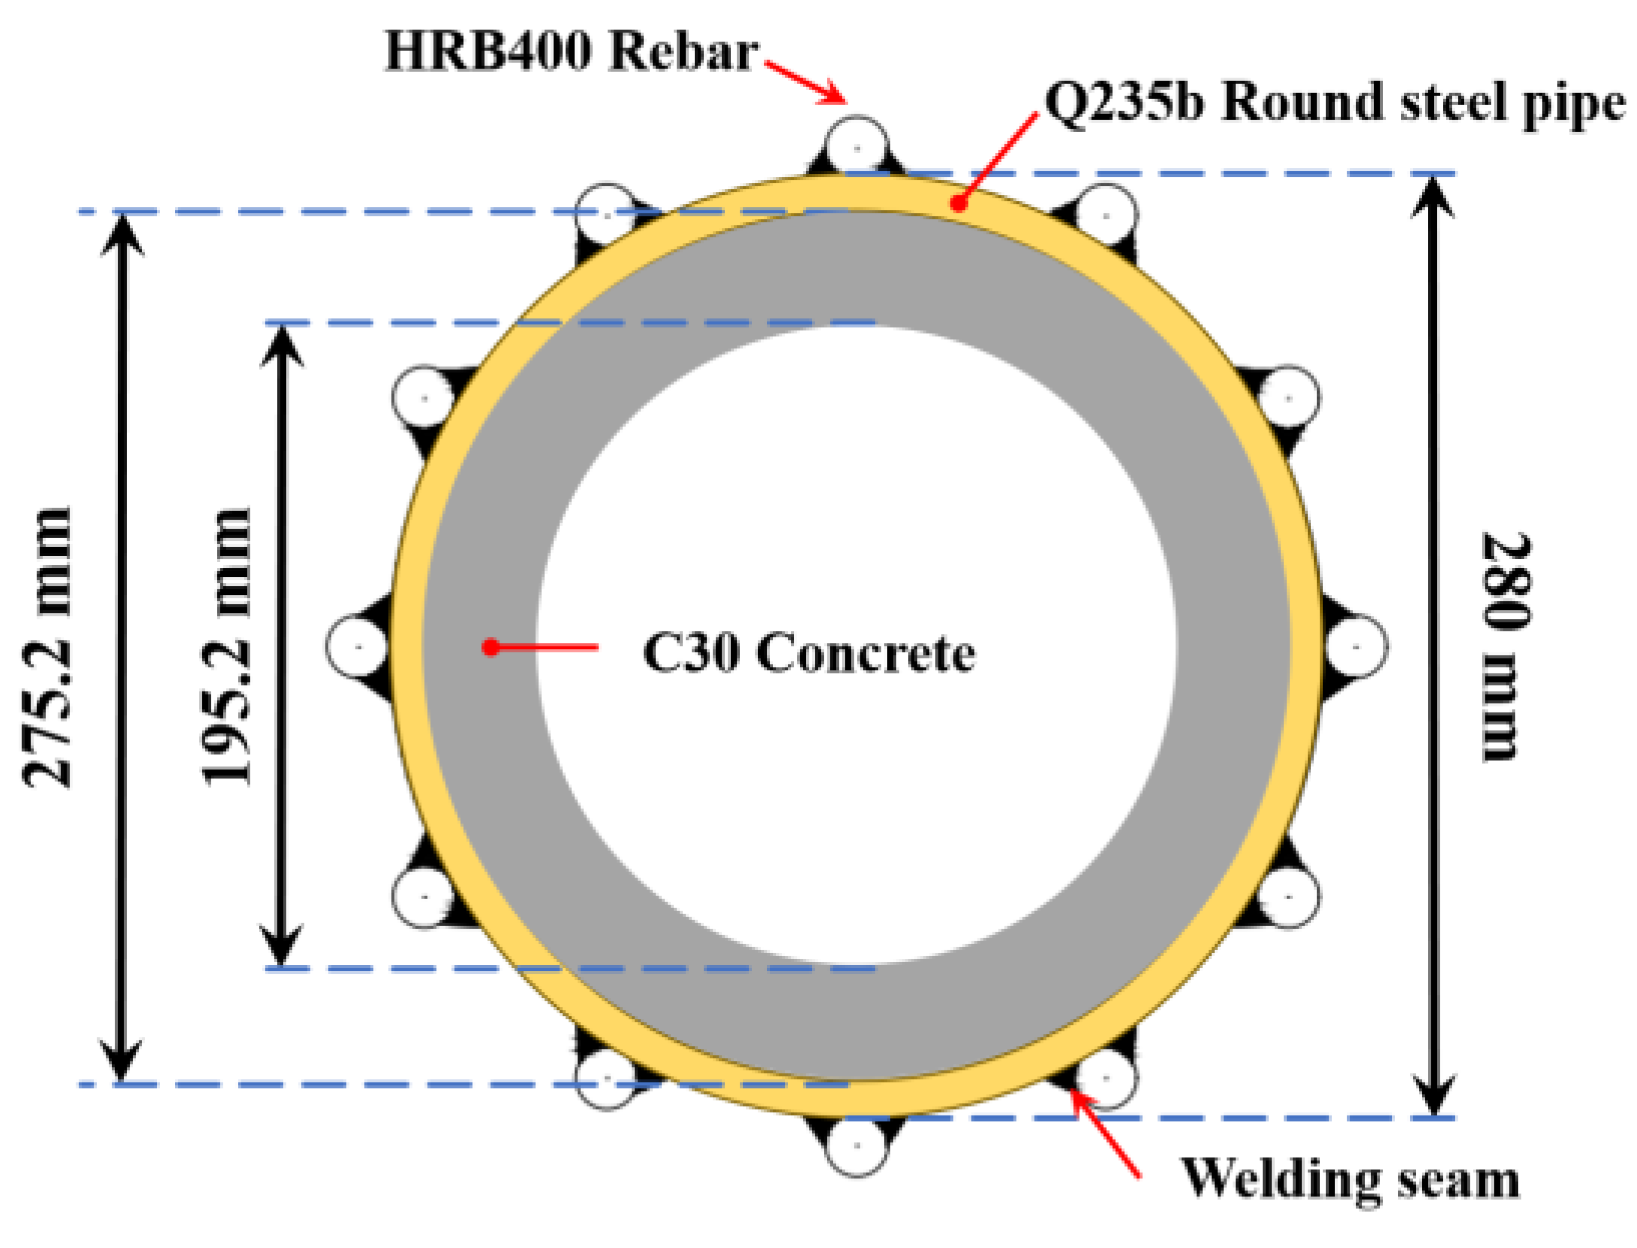
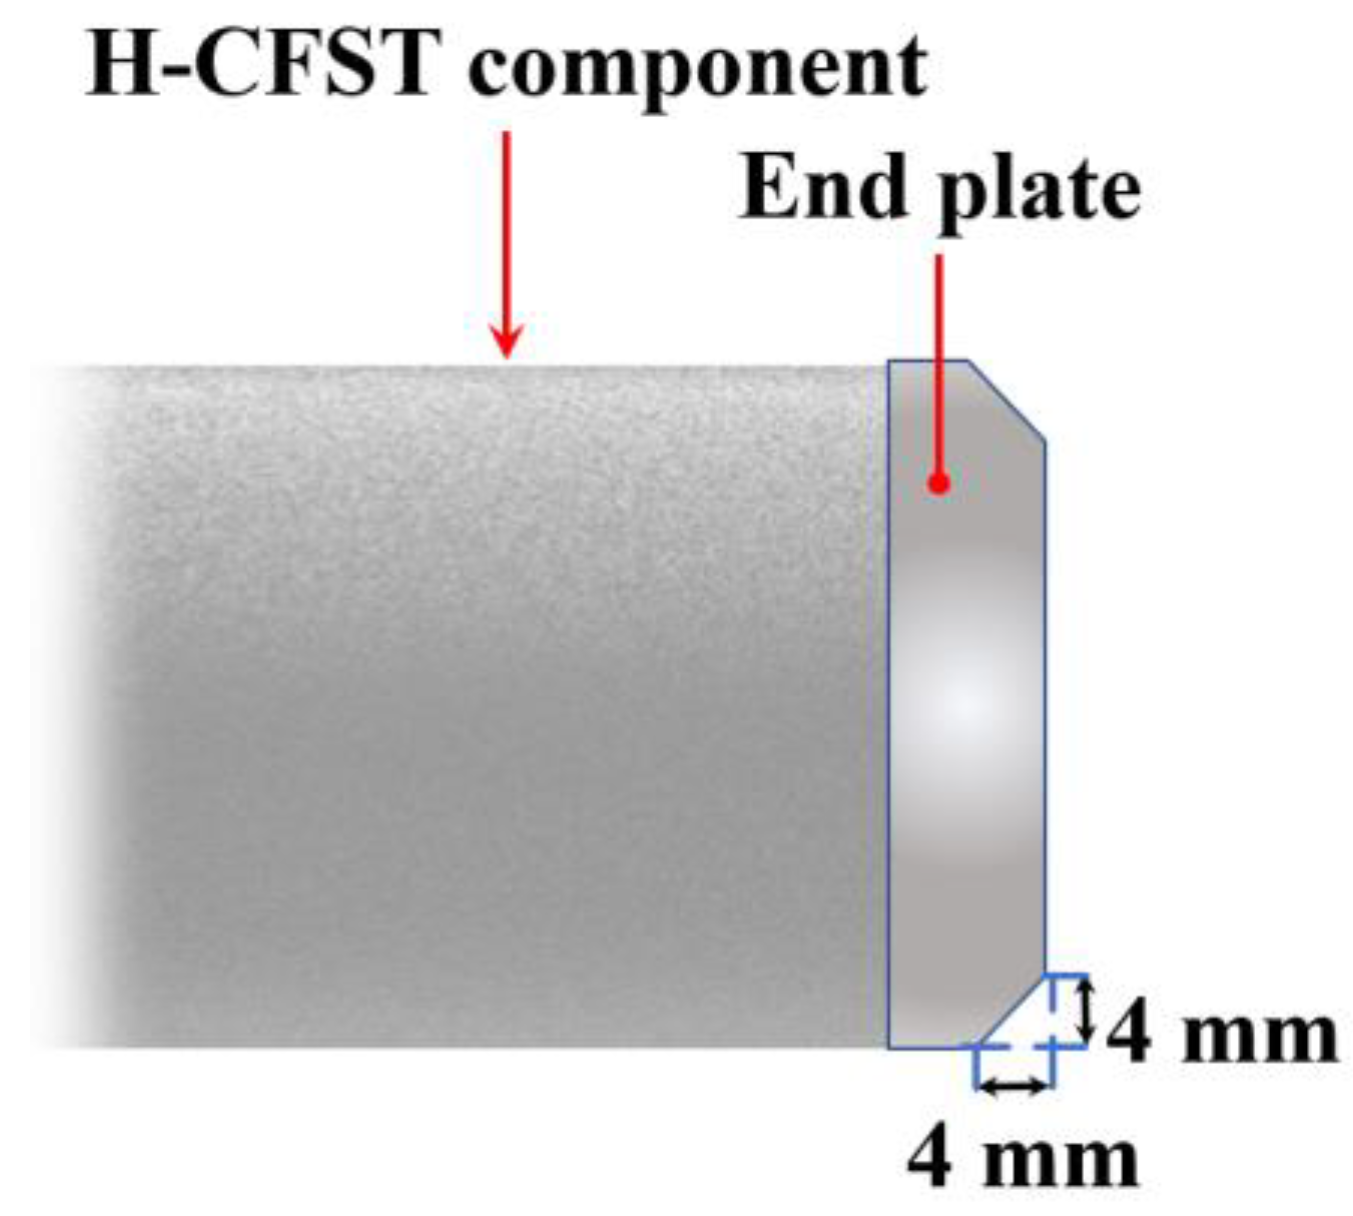
2.1.1. H-CFST Component Model
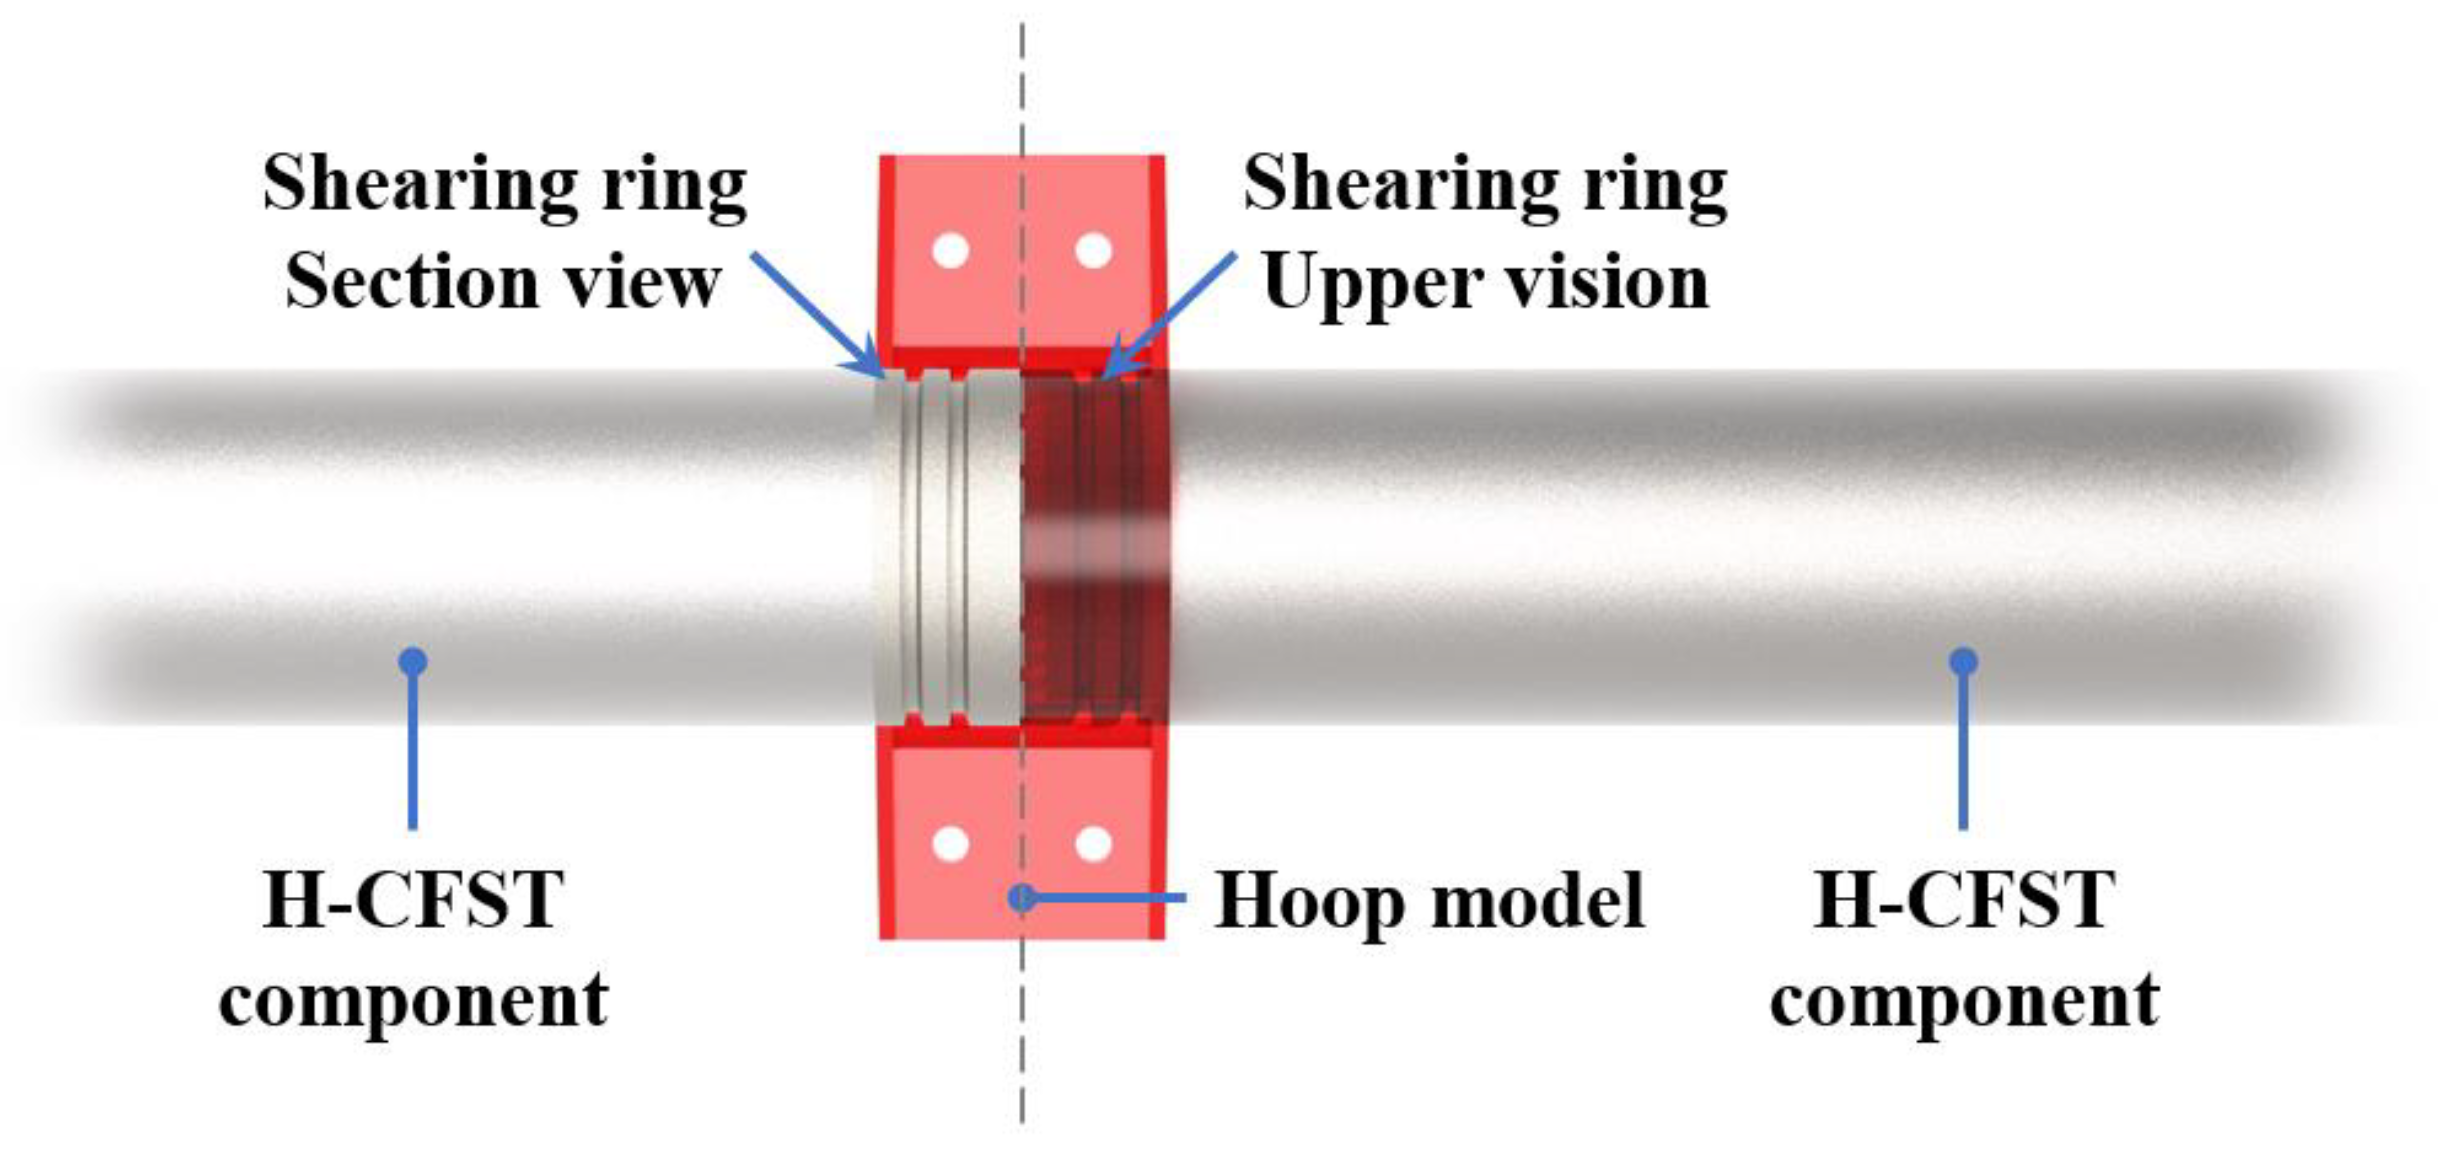
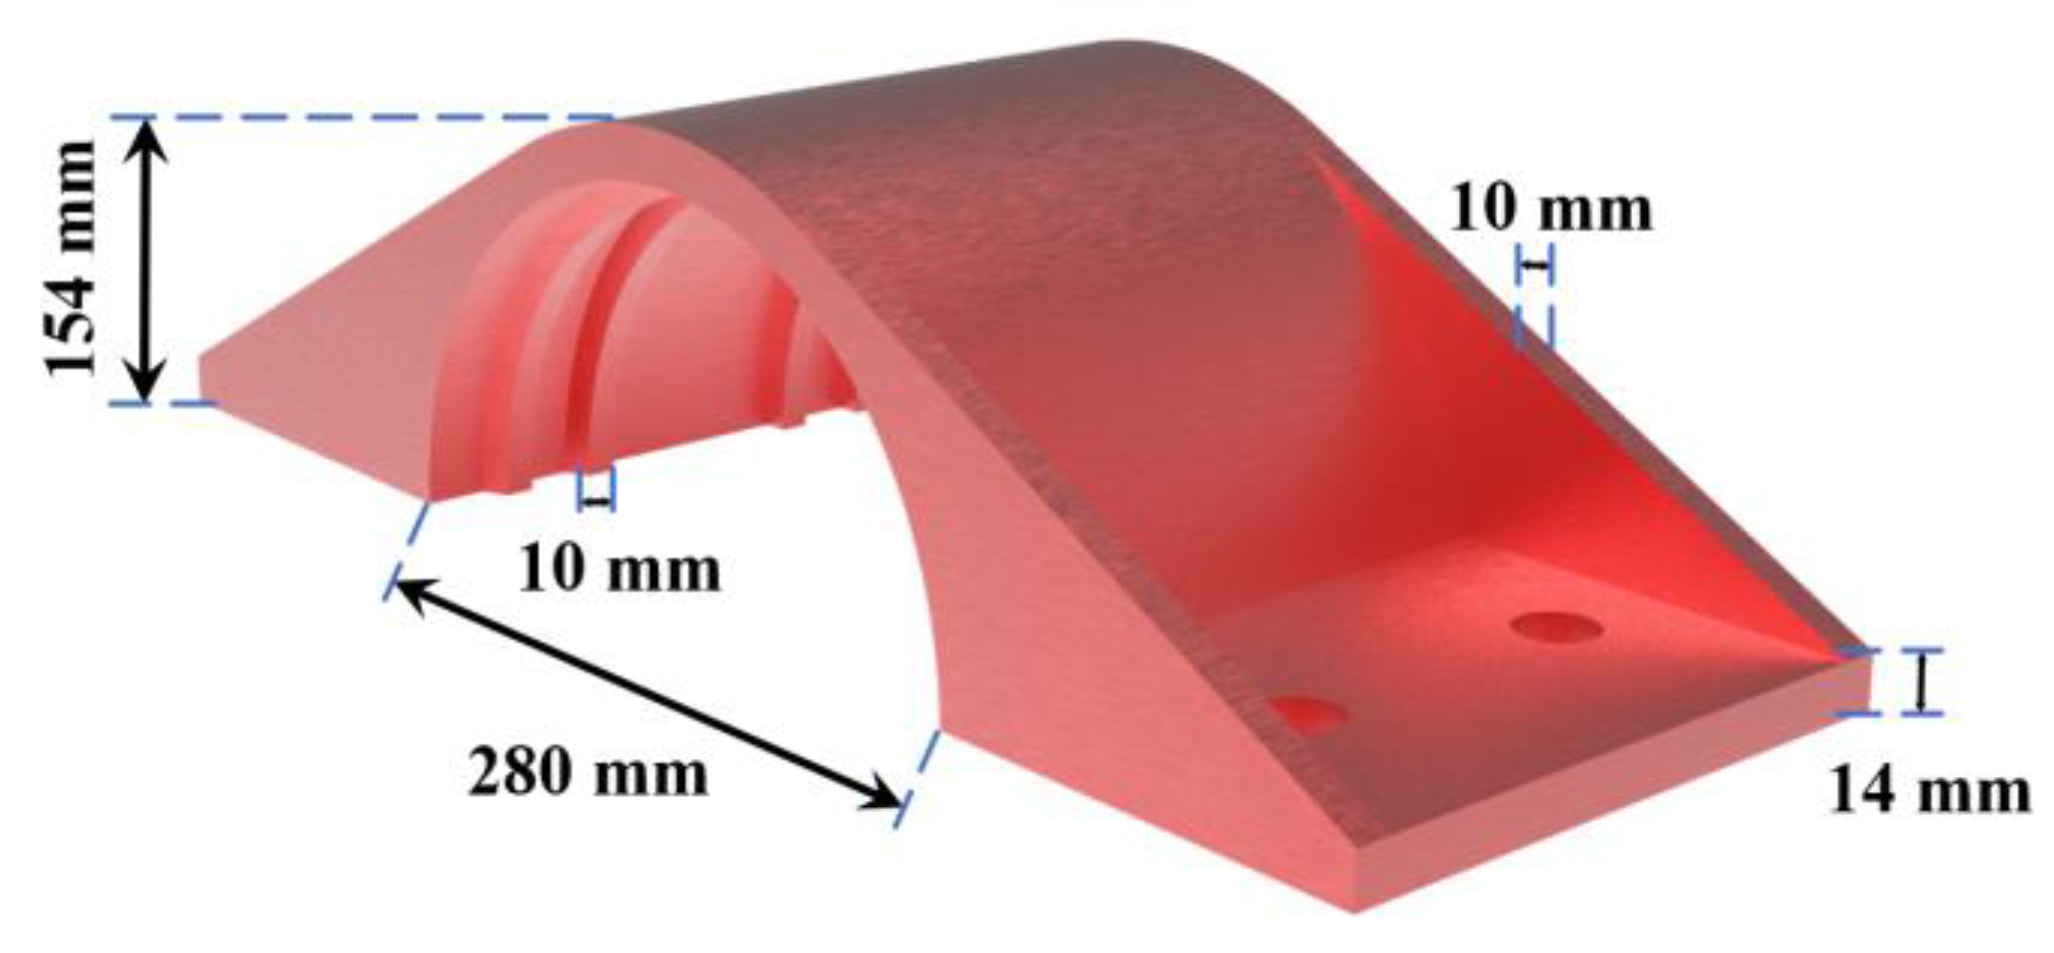
2.1.2. Hoop Model
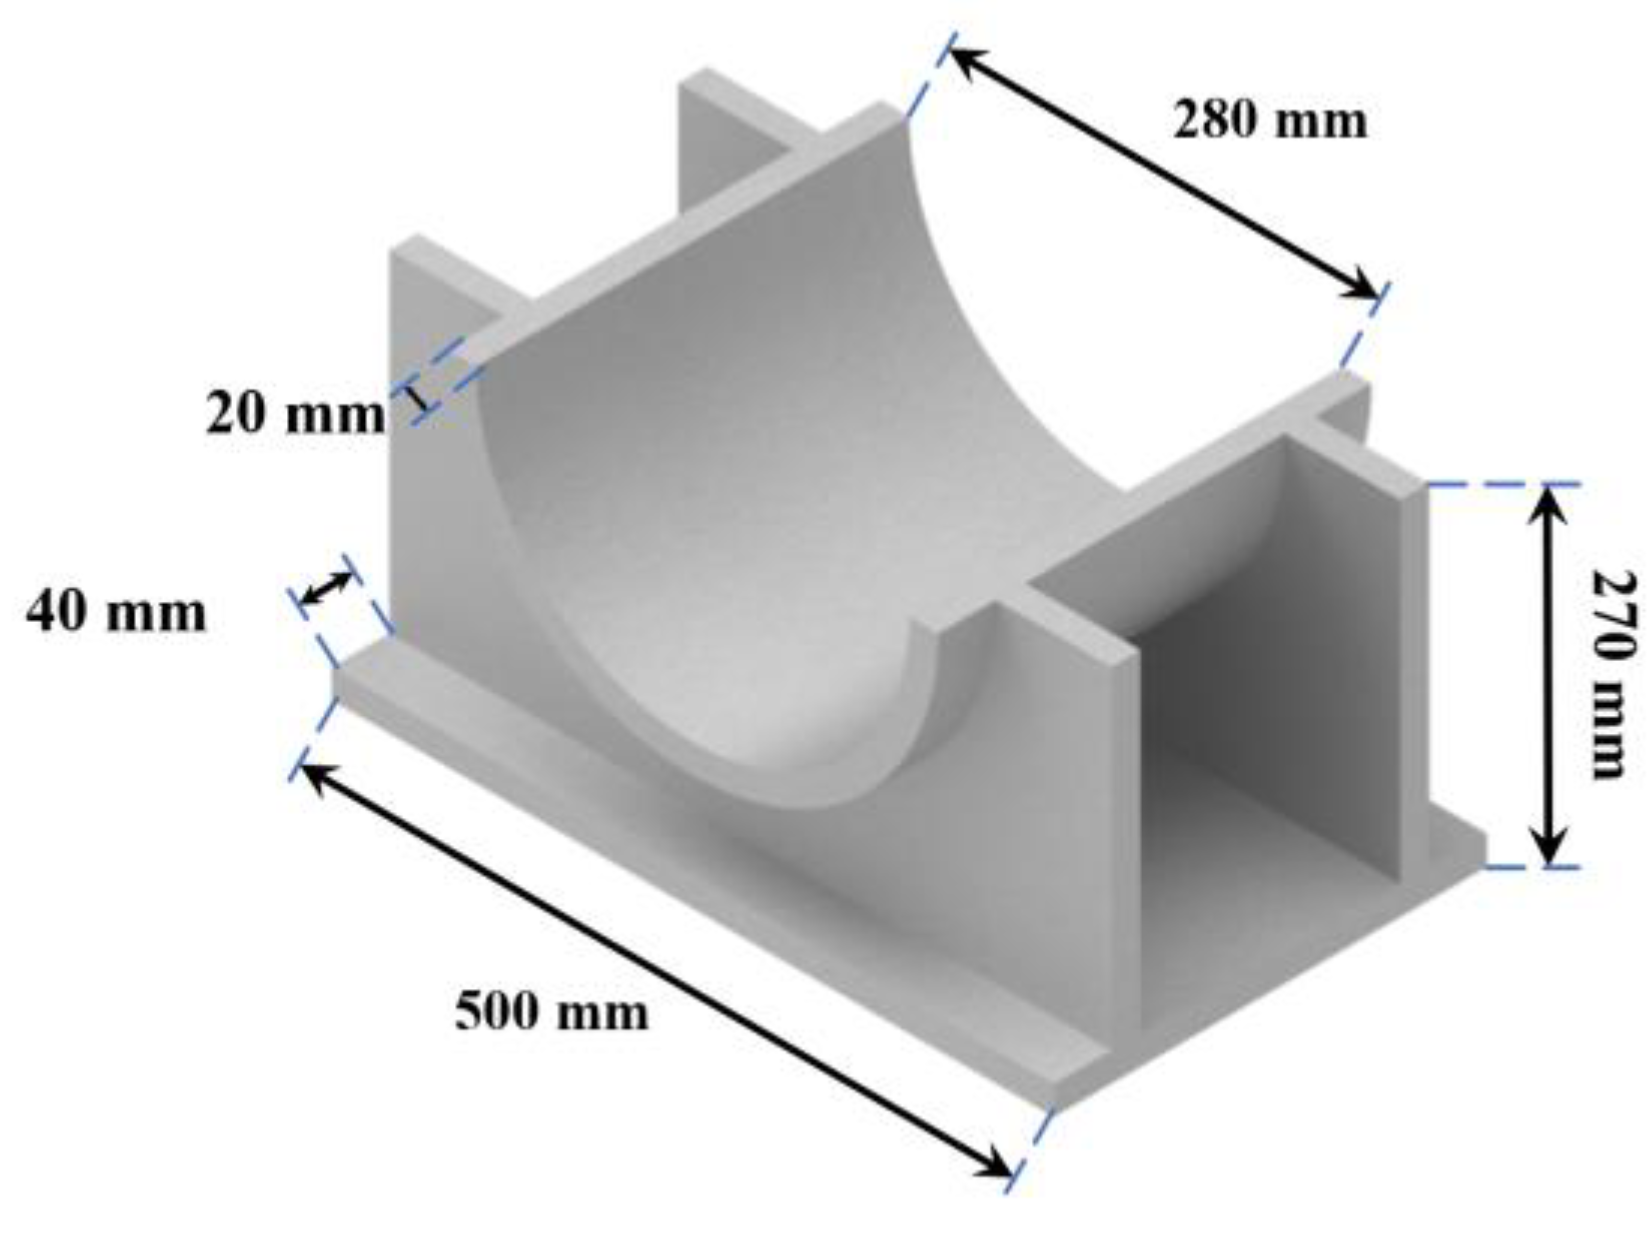
2.1.3. Counterforce Structure and Supporting Loading Block
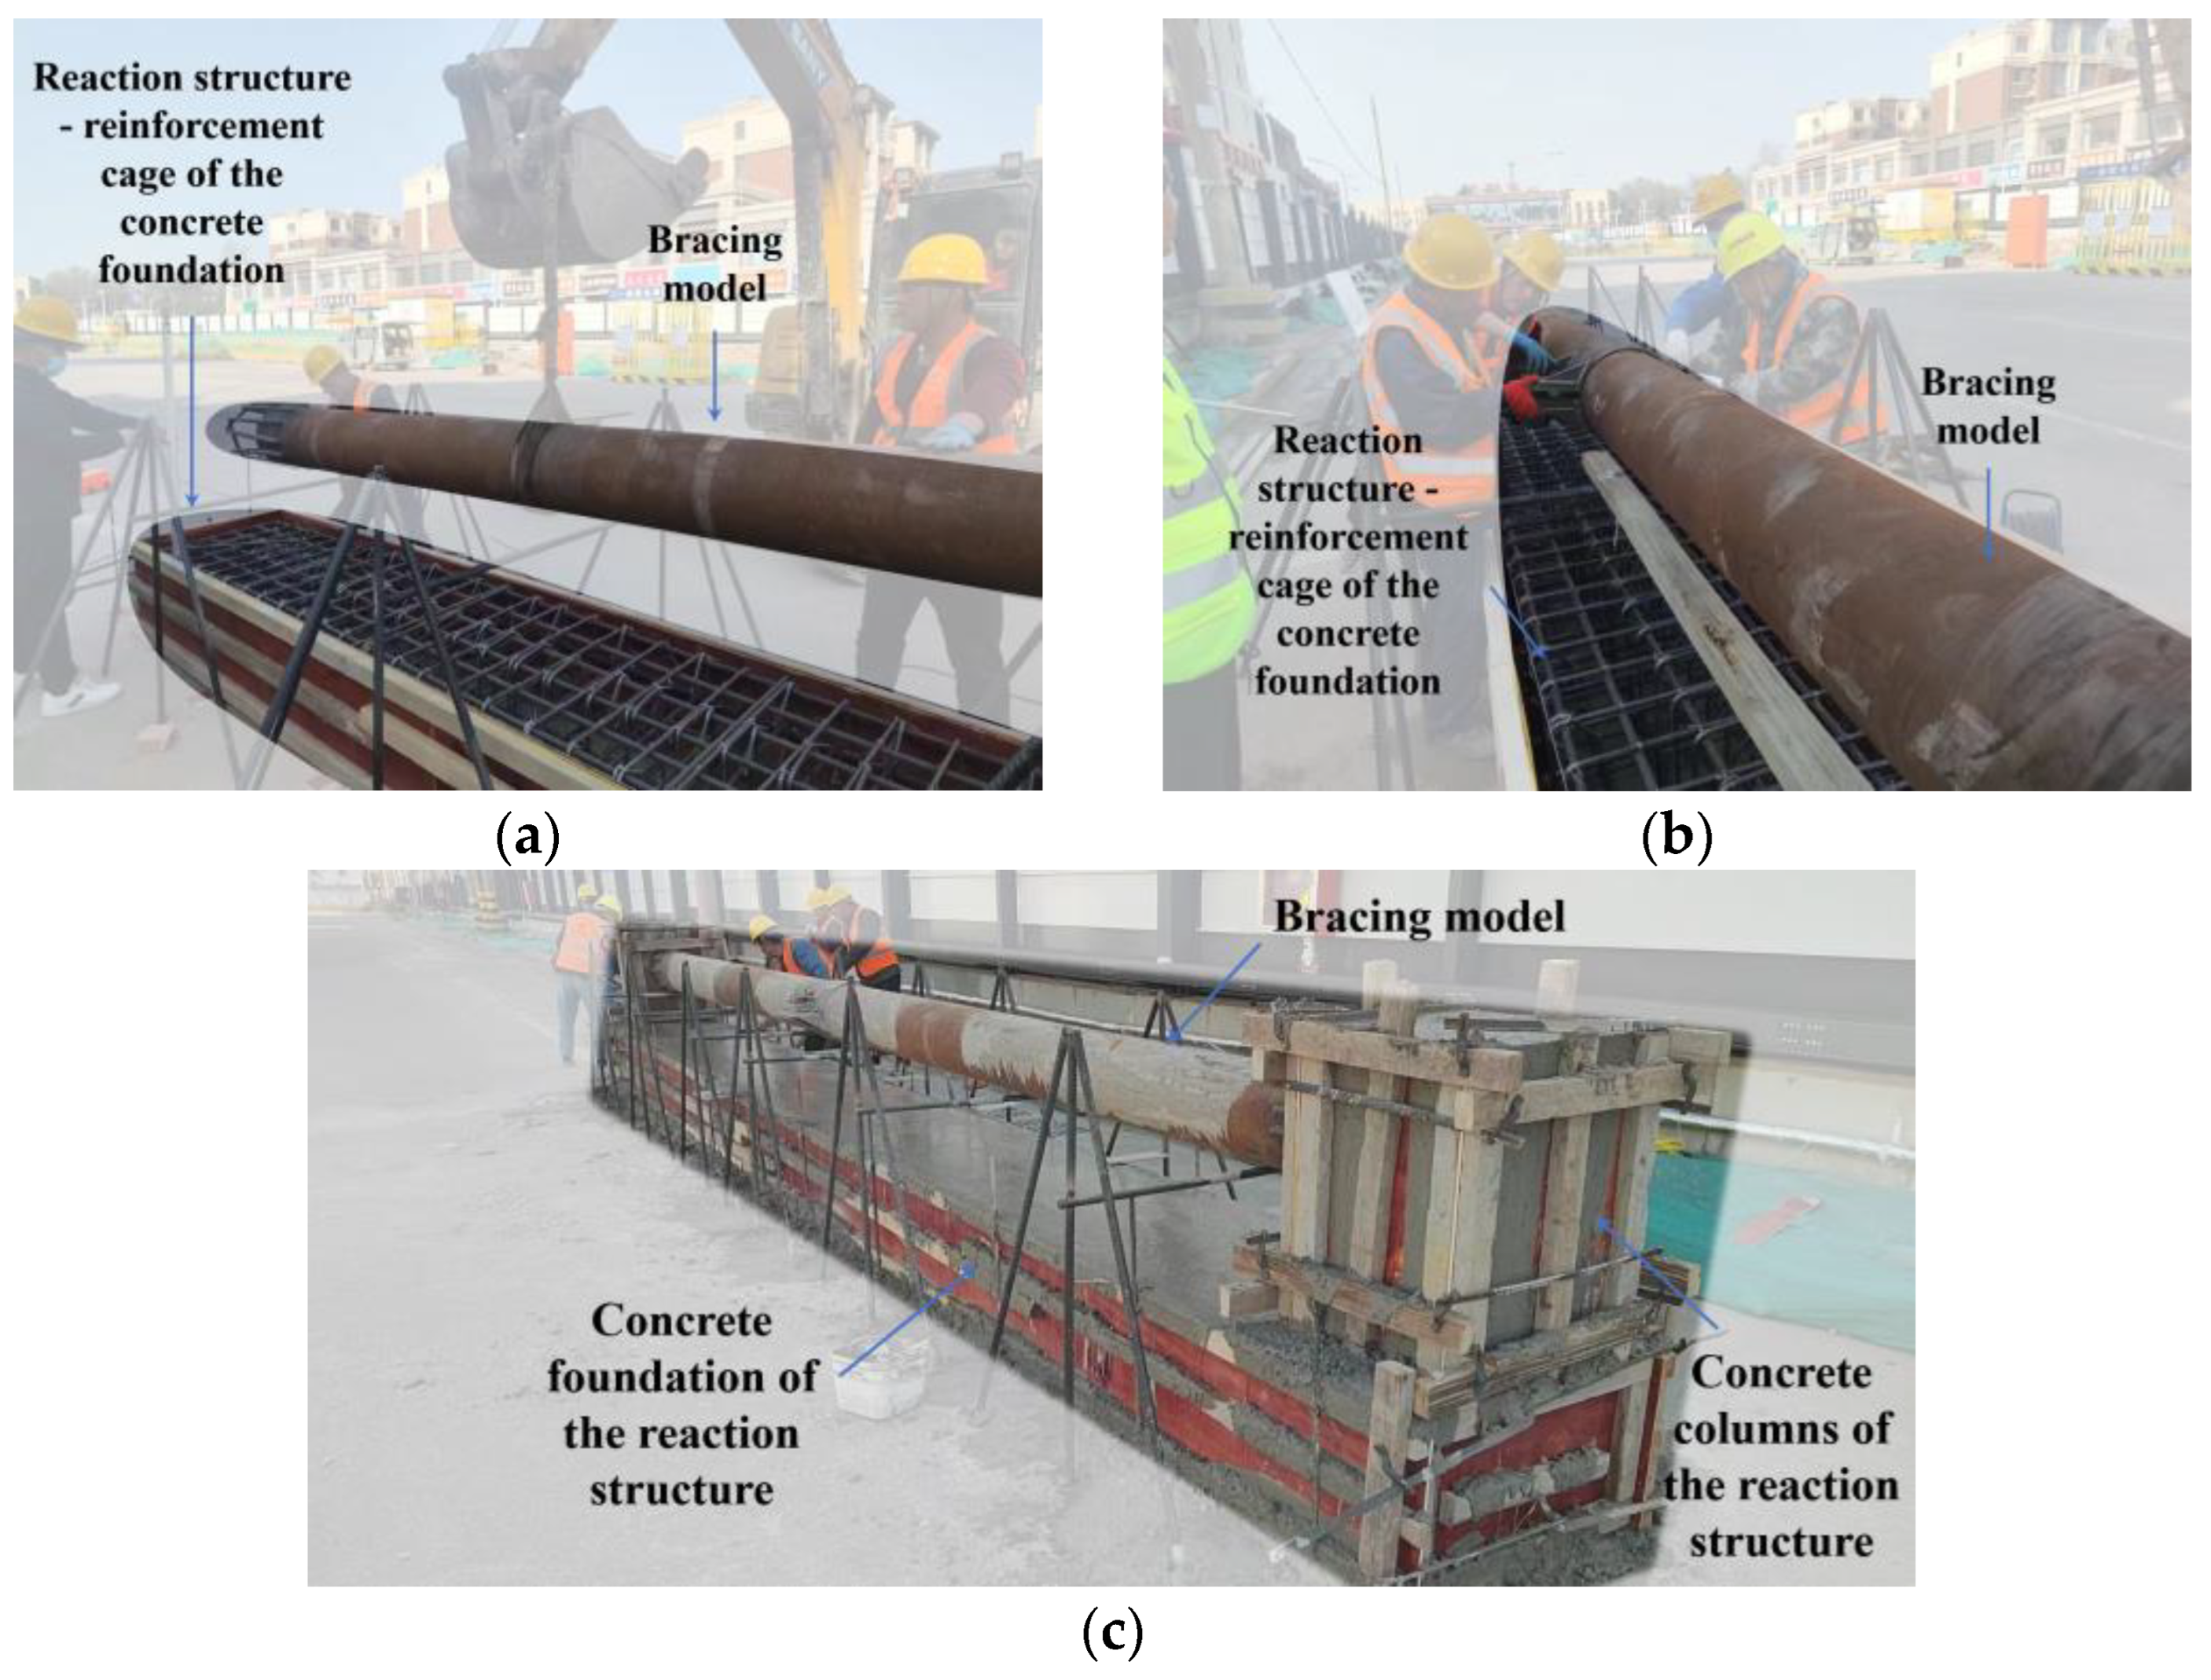
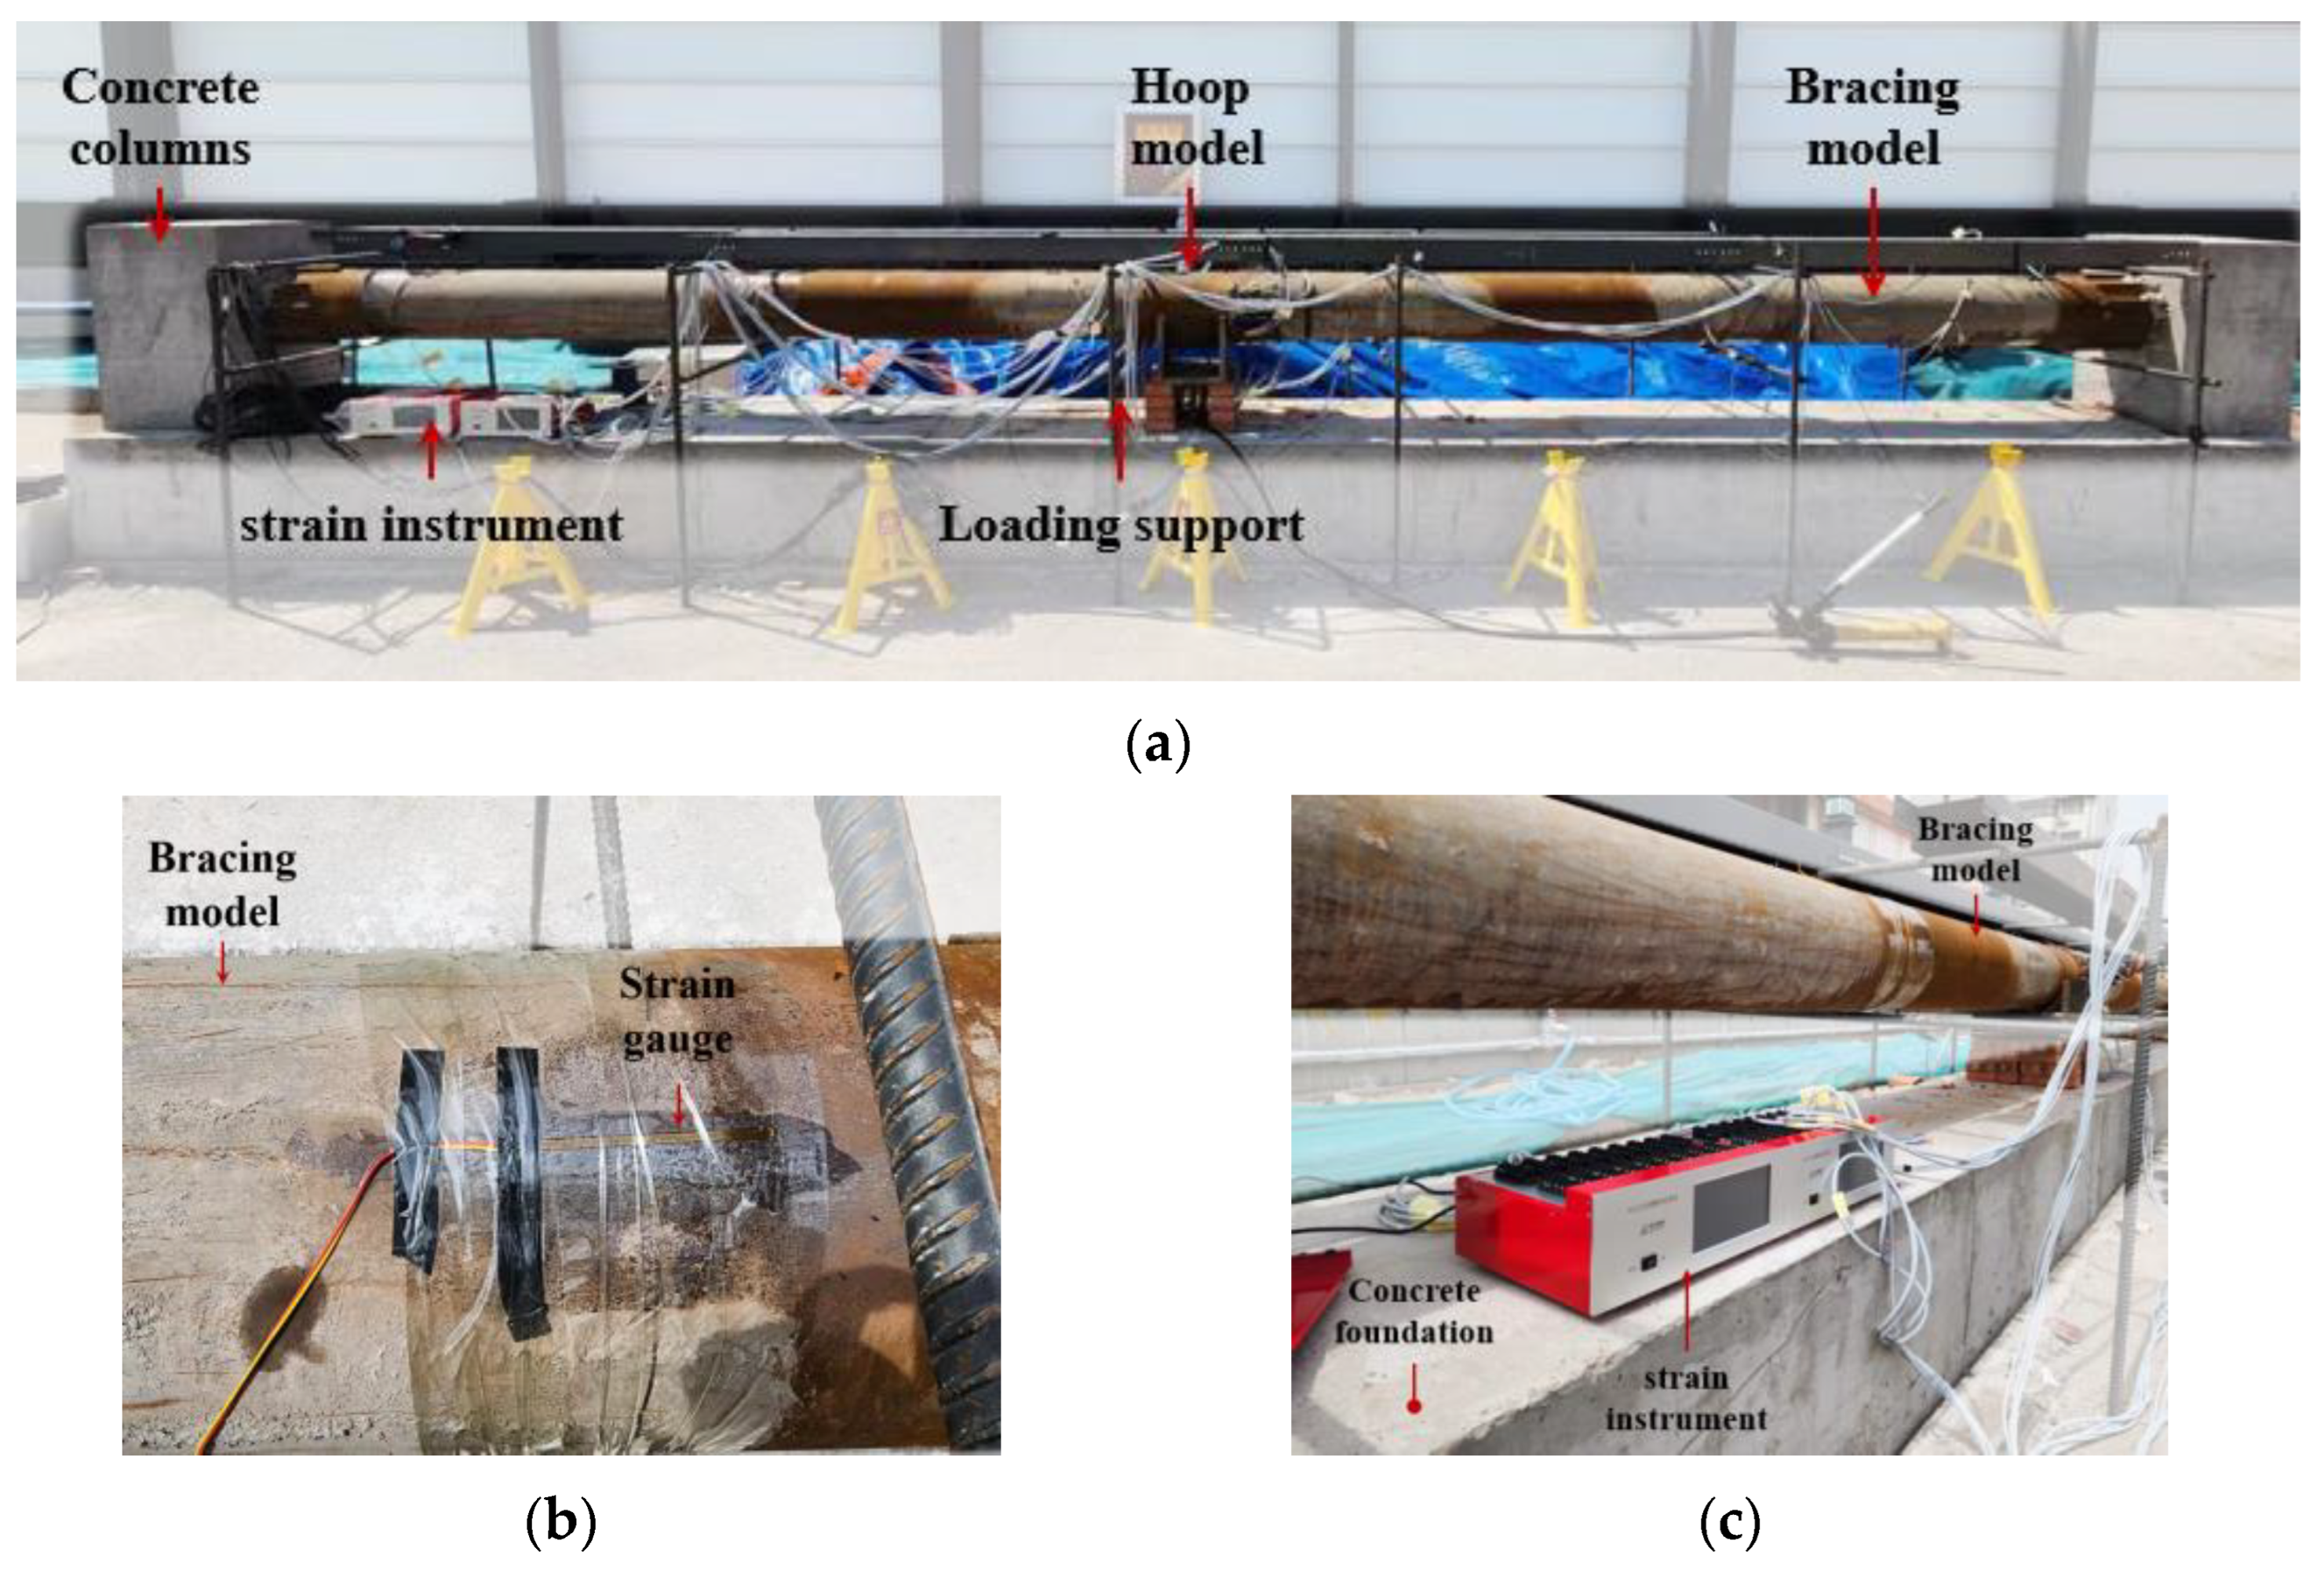
2.1.4. Fabrication of the Experimental Model
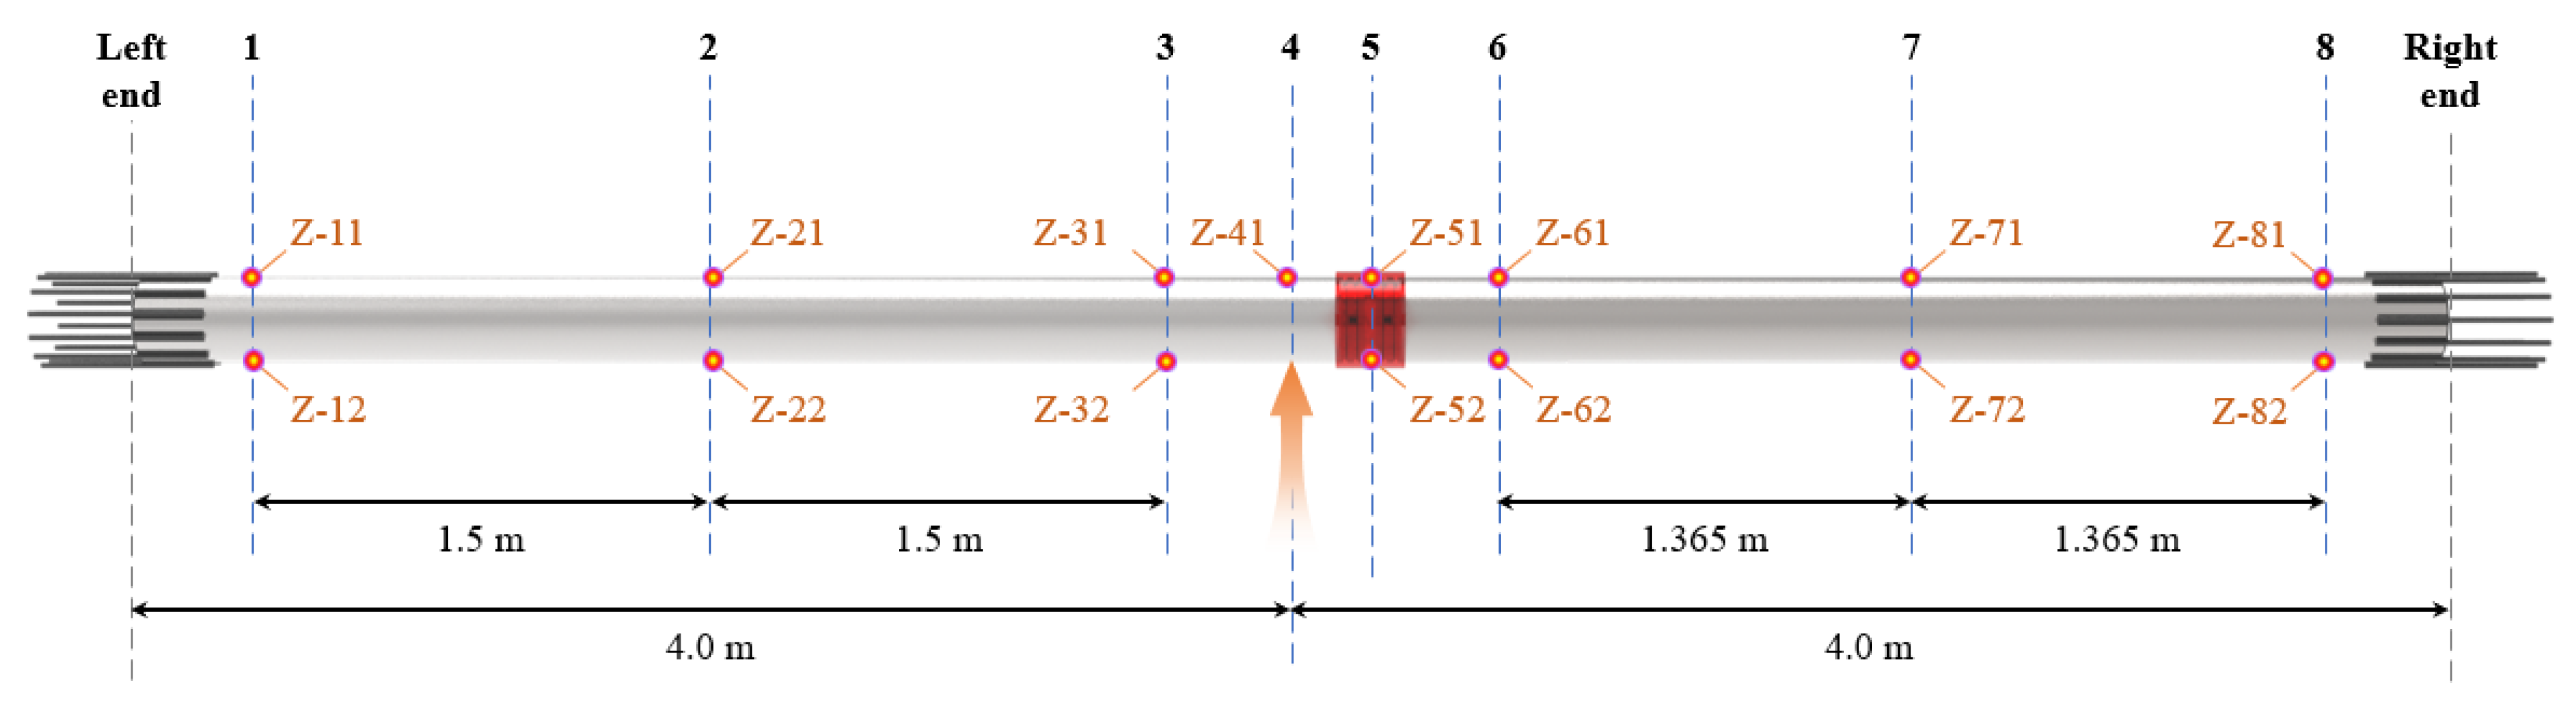
2.2. Arrangement of Measuring Points
2.2.1. Arrangement of Strain Measuring Points
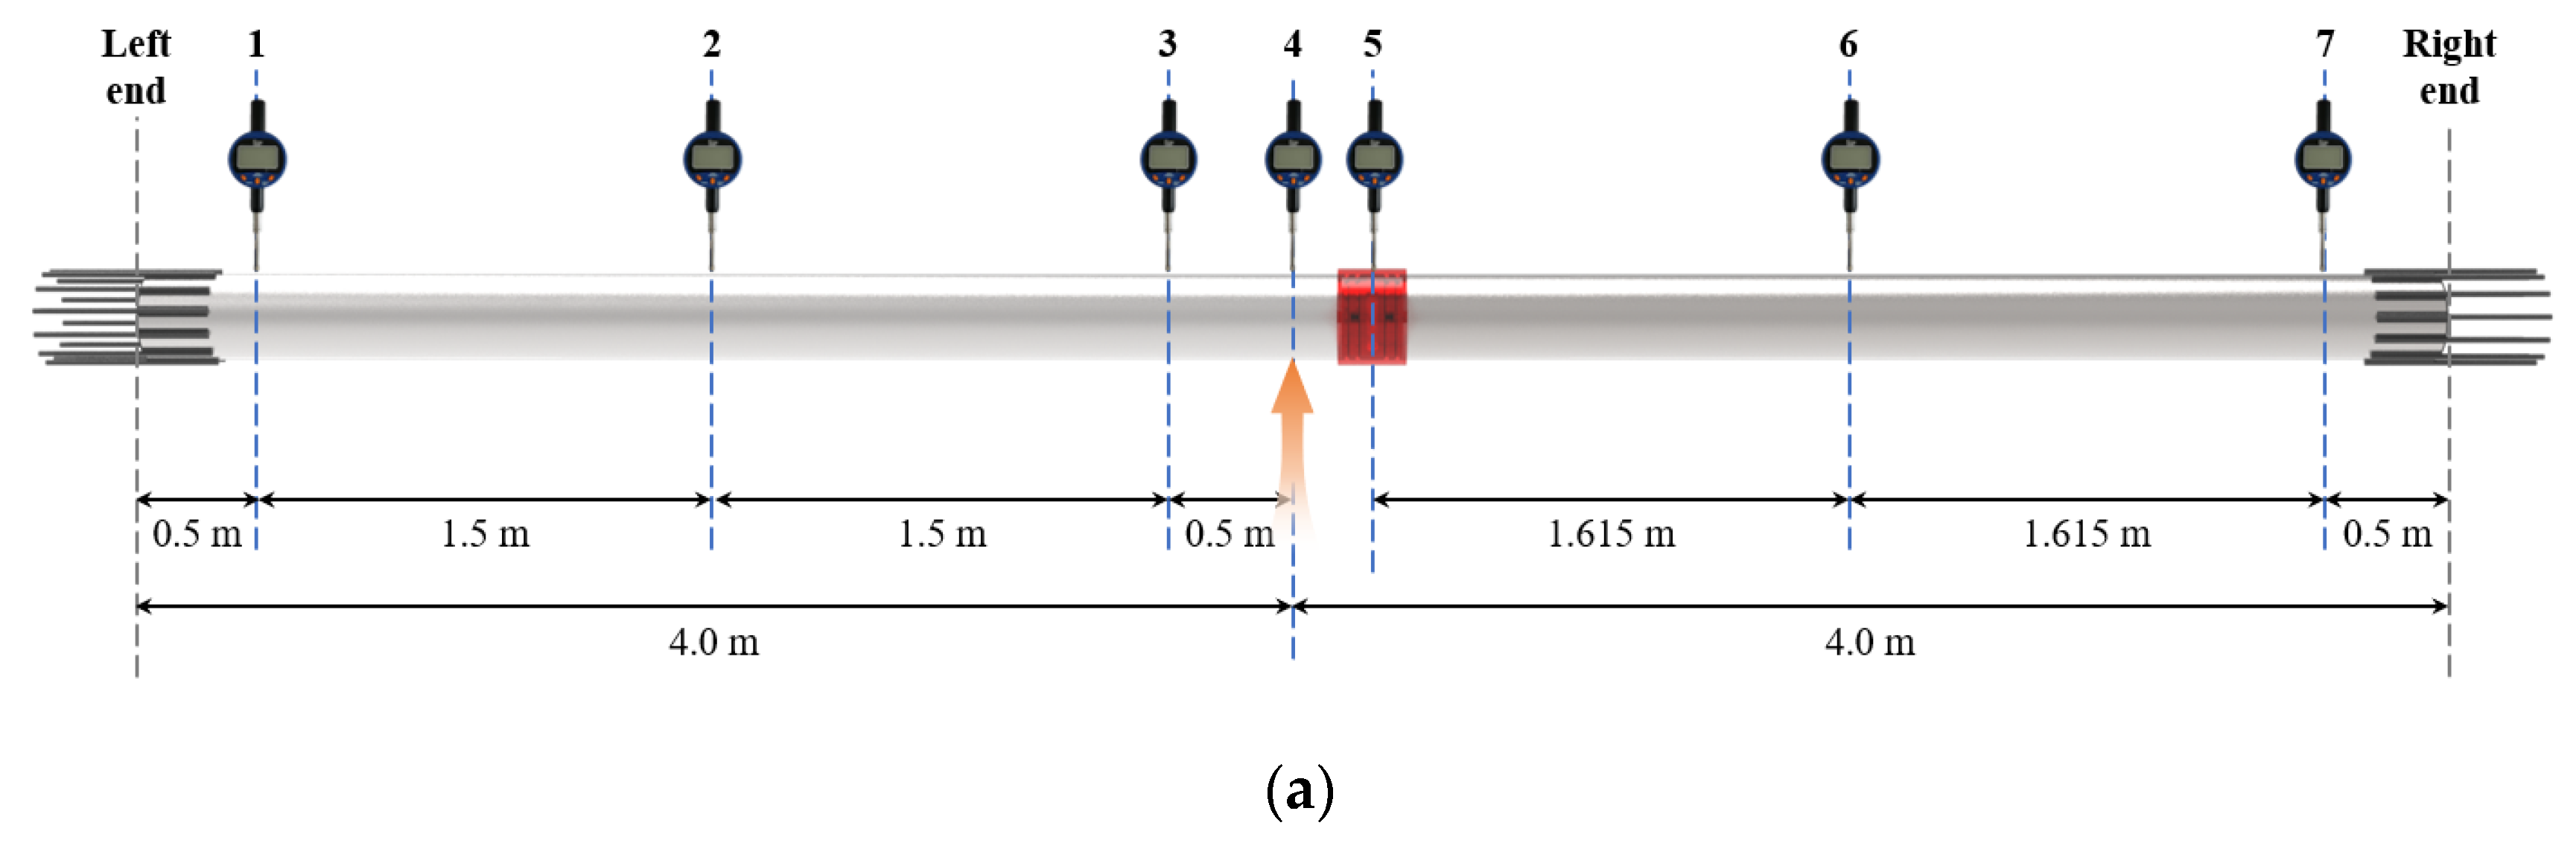
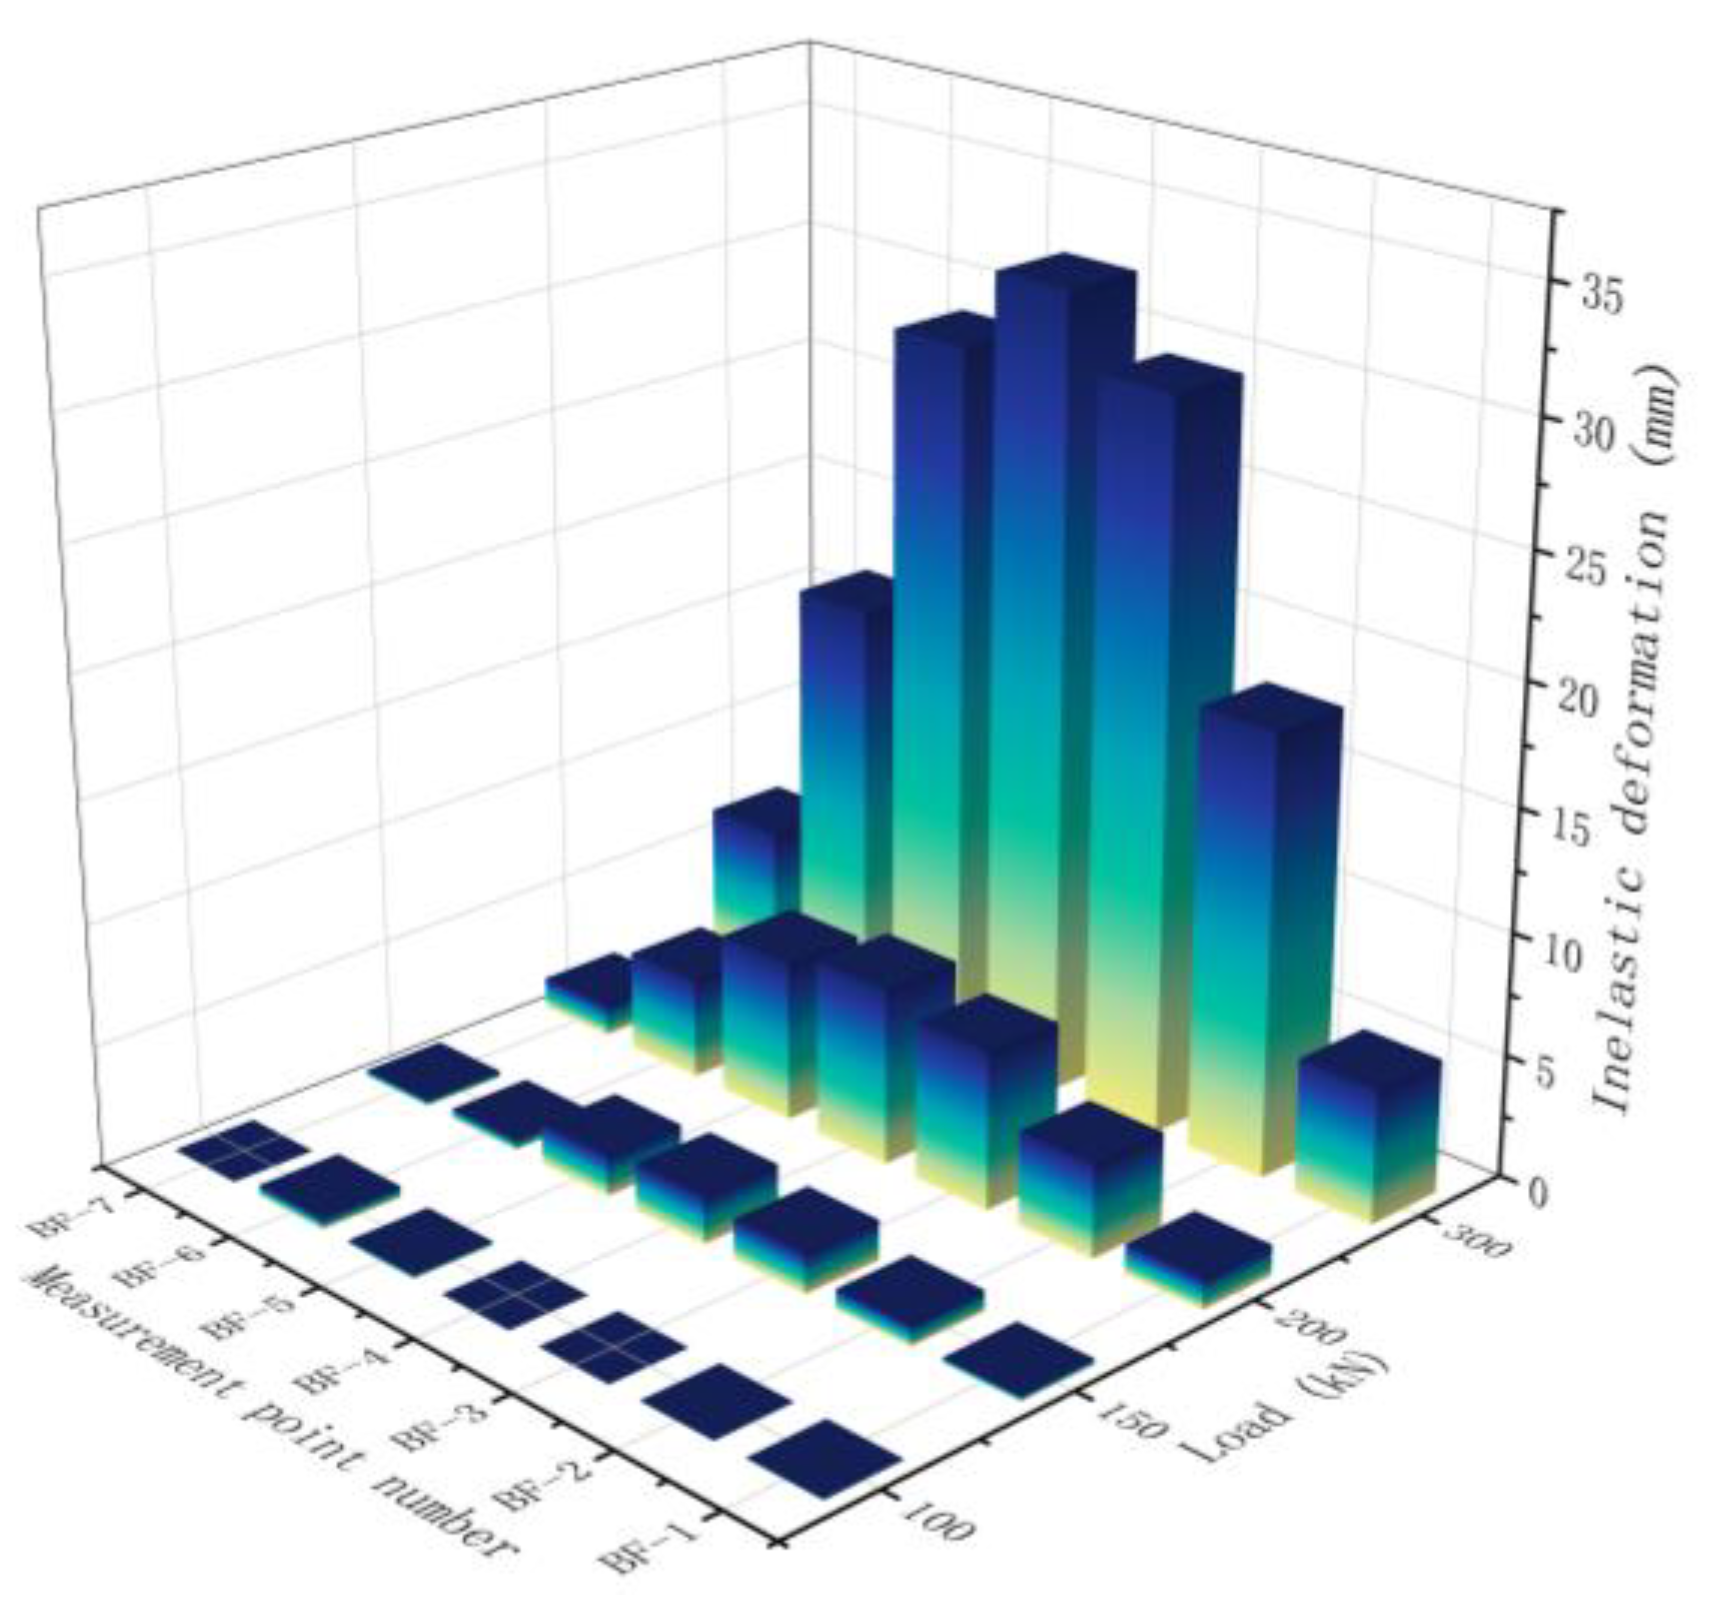
2.2.2. Arrangement of Displacement Measuring Points
2.3. Loading Method of the Experimental Model
2.4. Model Test Results and Analysis
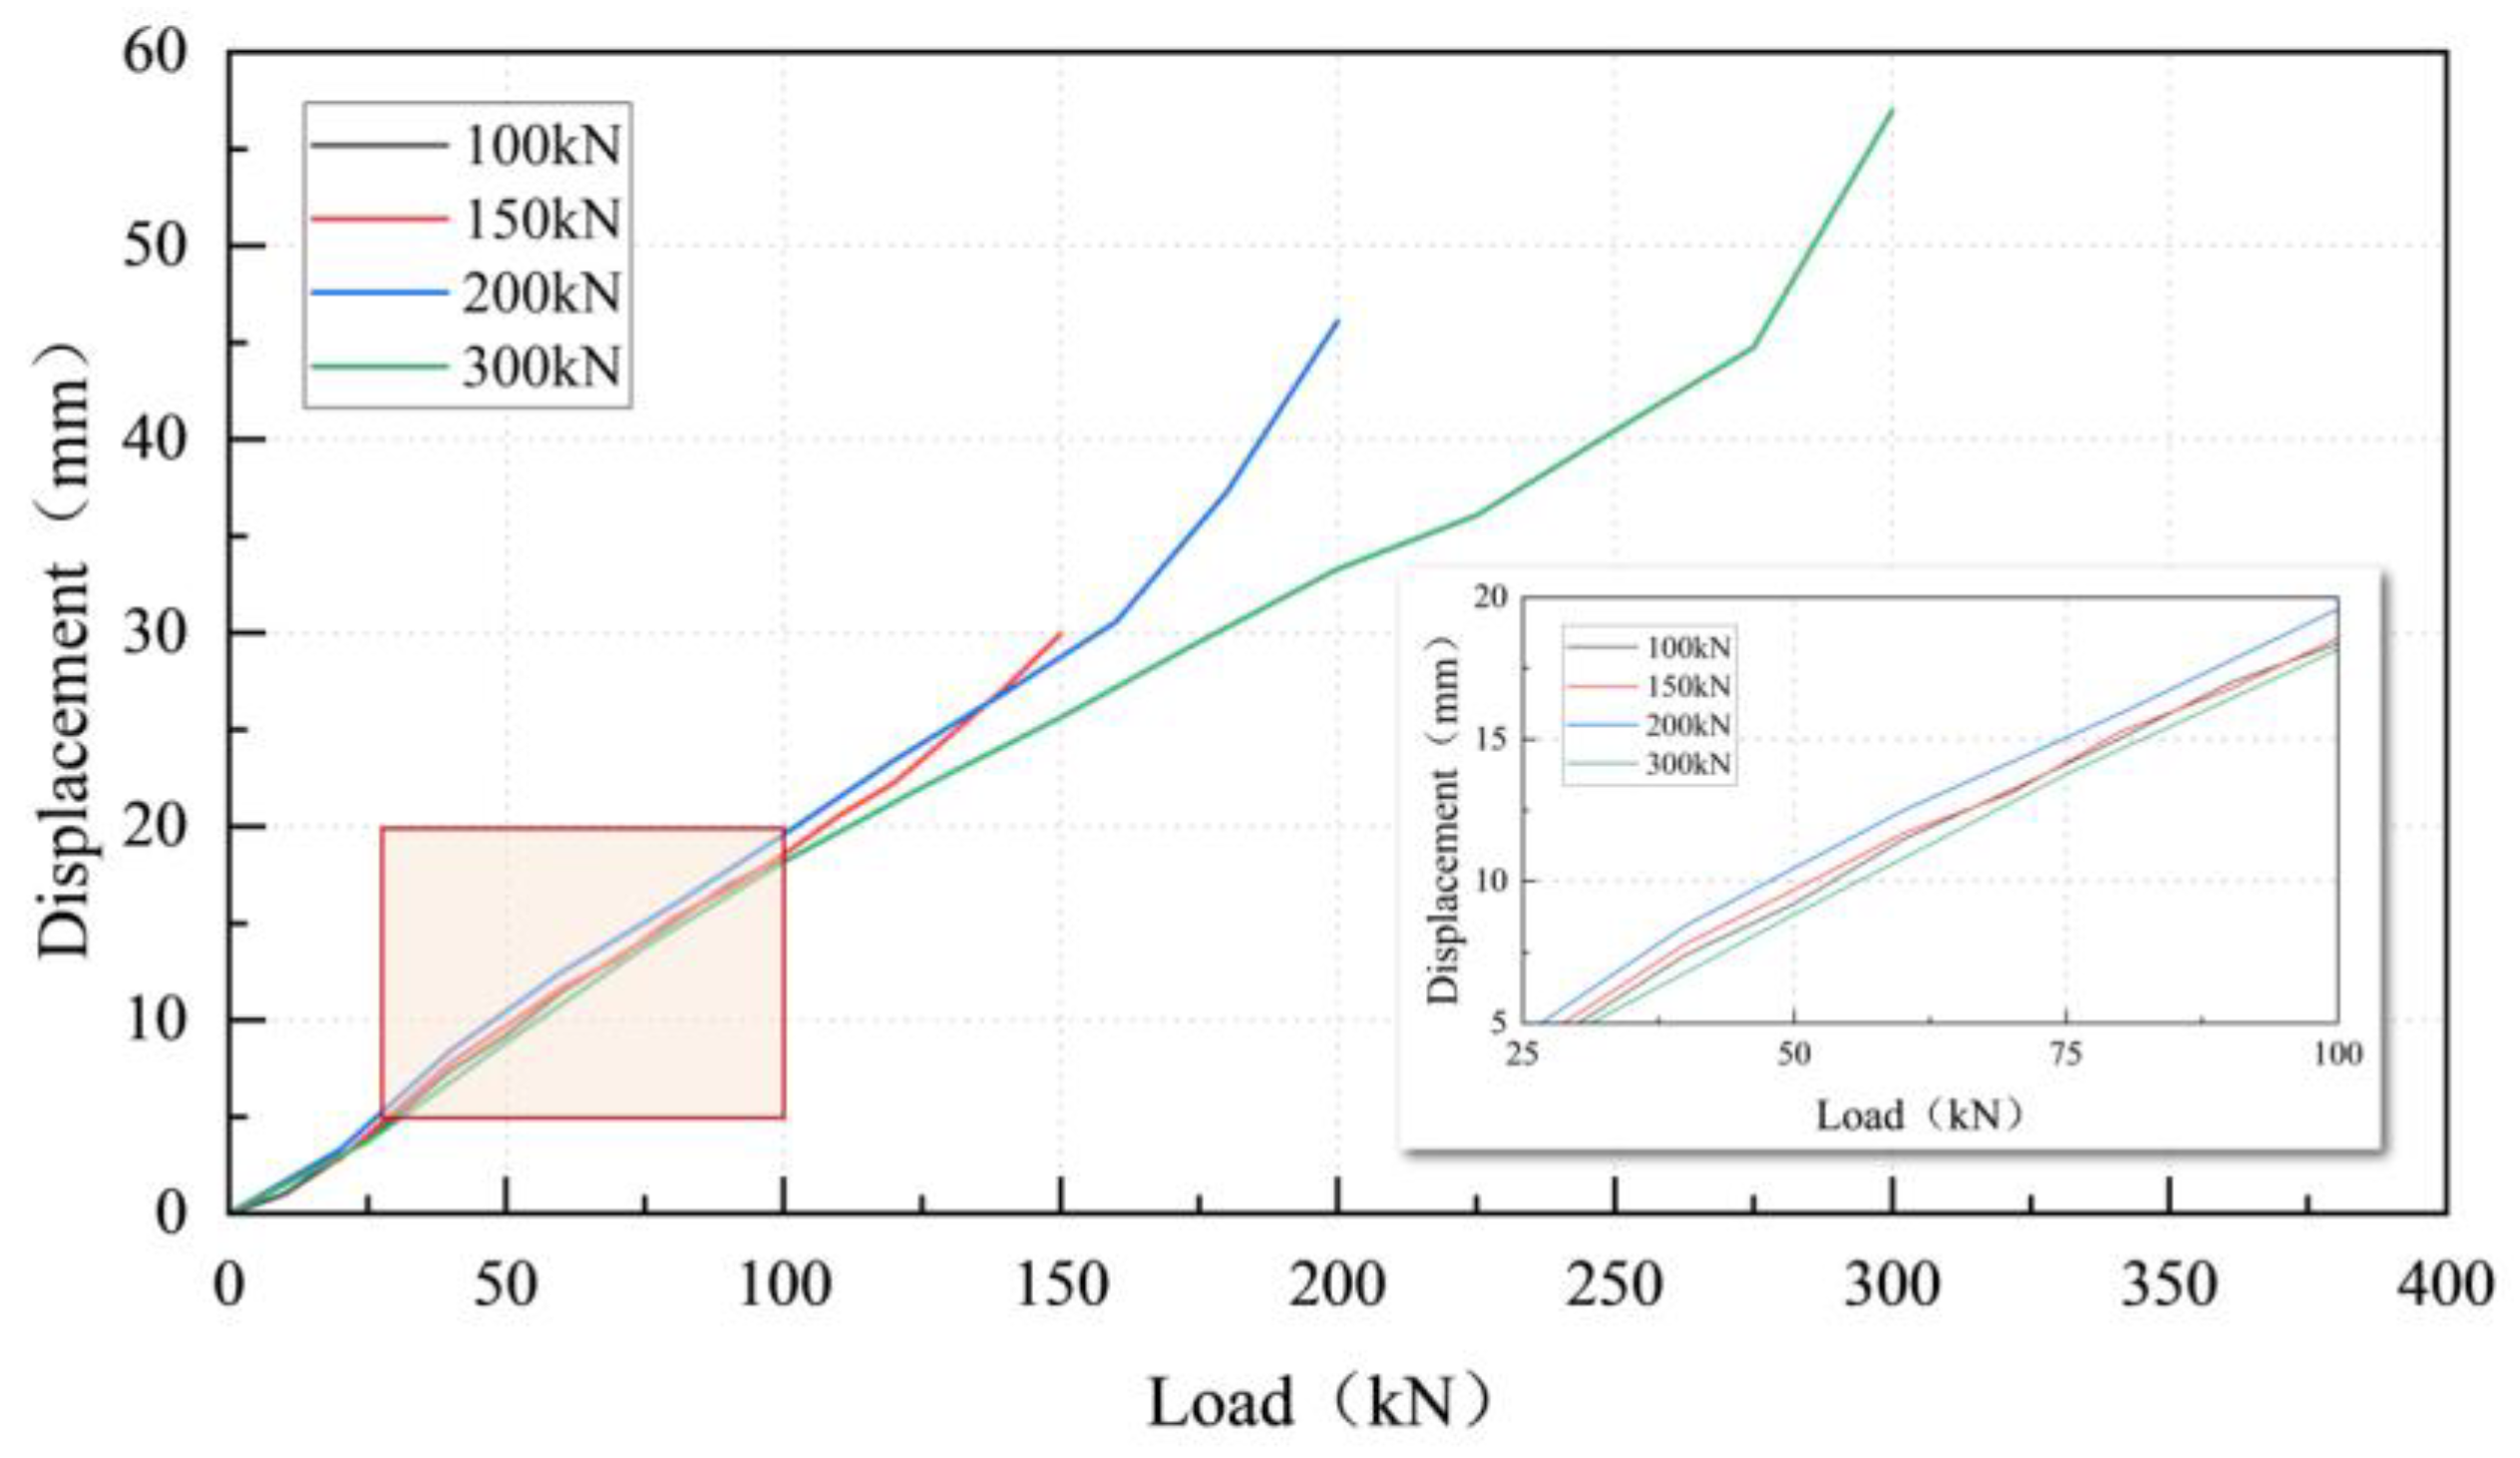
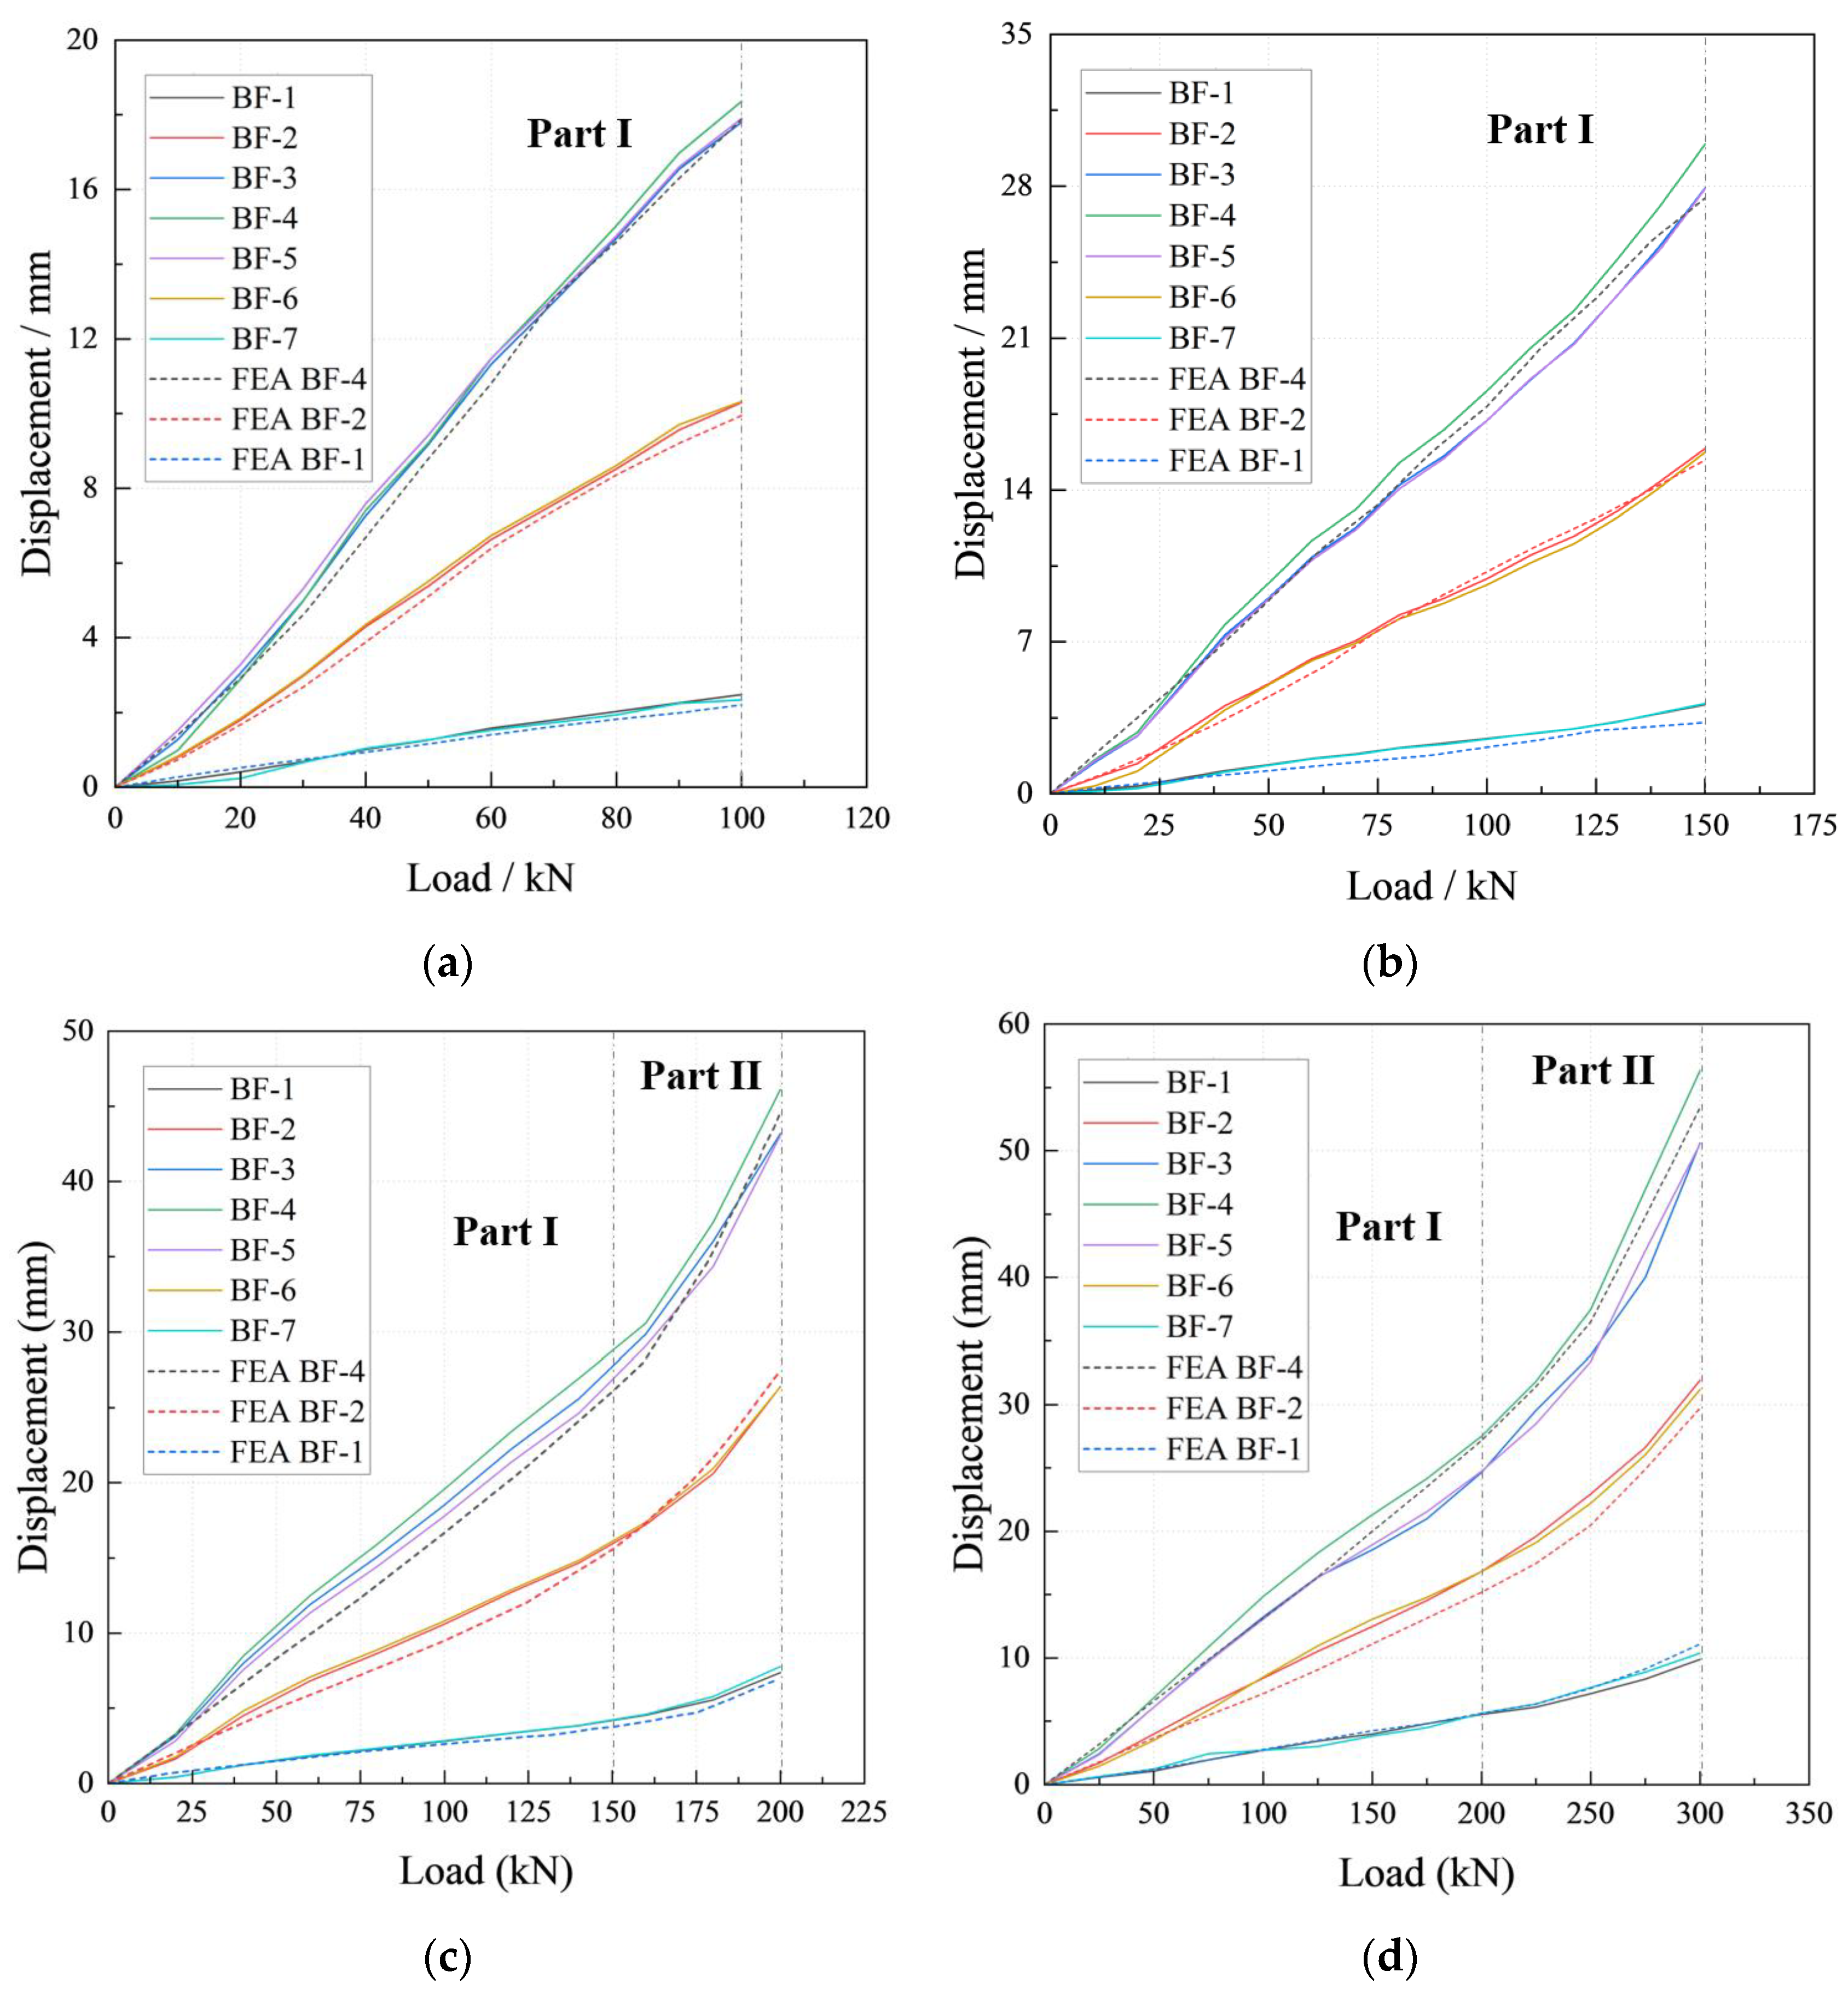
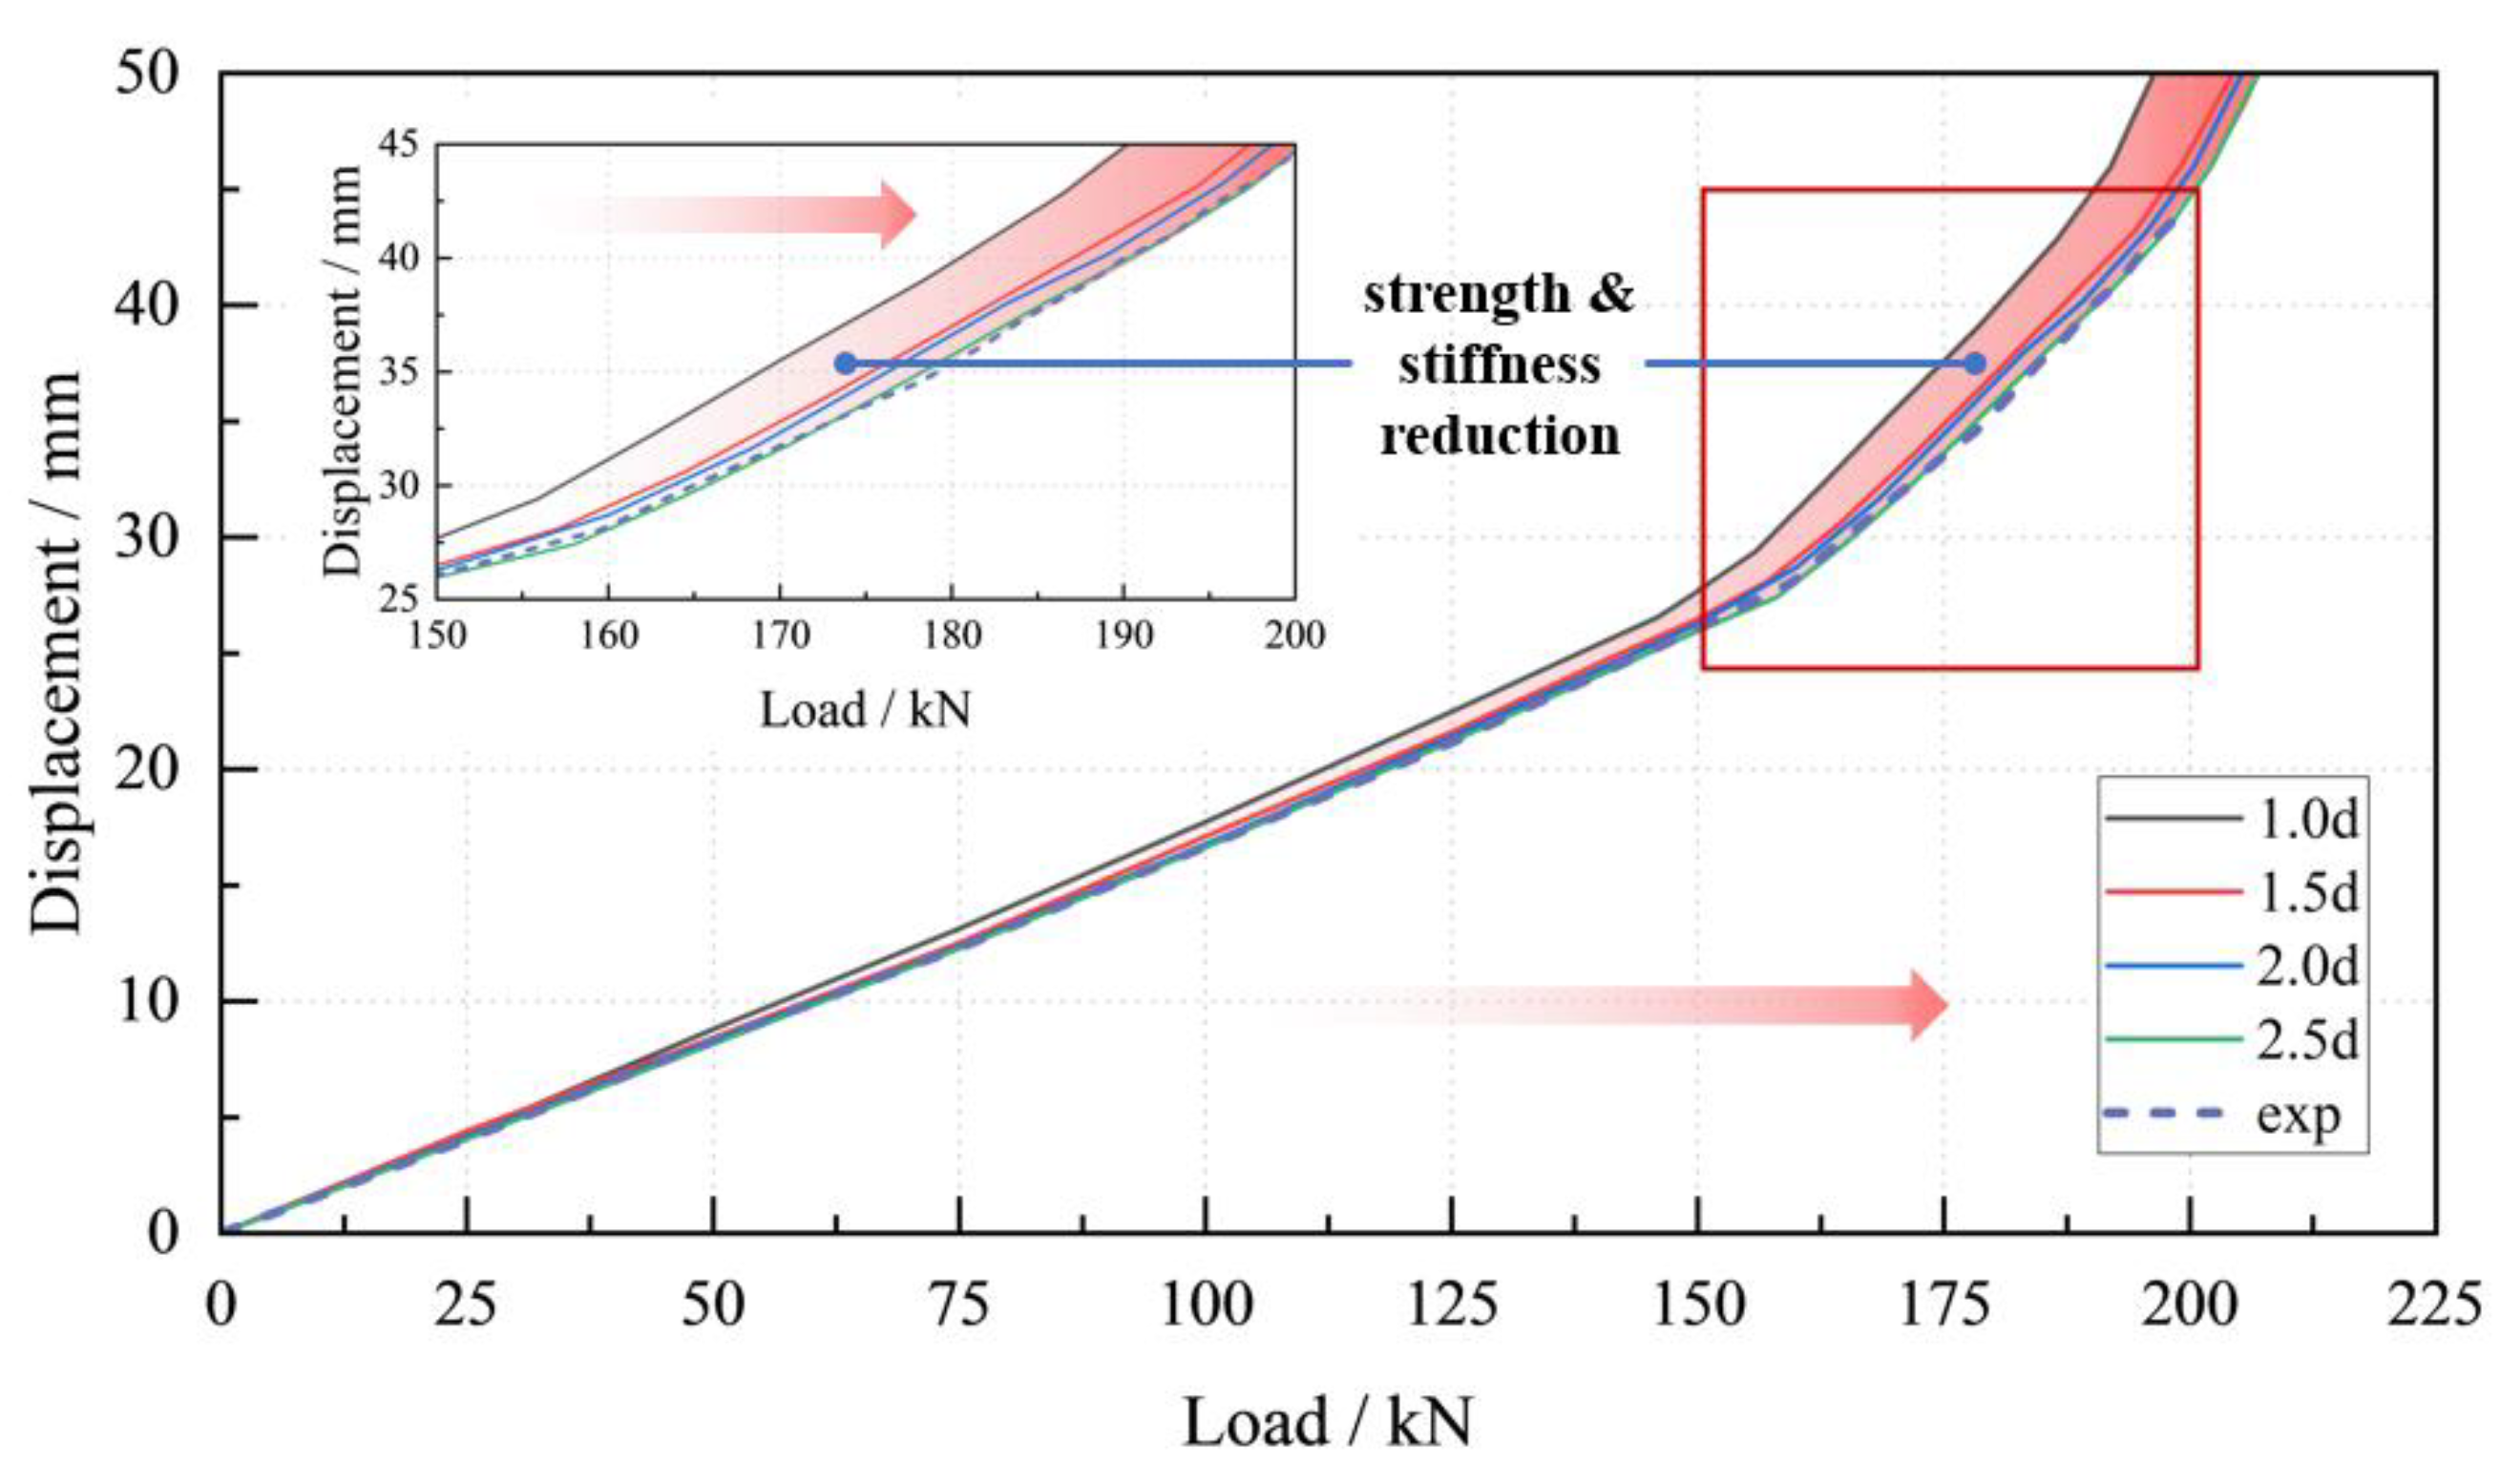
2.4.1. Load-Displacement Diagrams of the Experimental Model
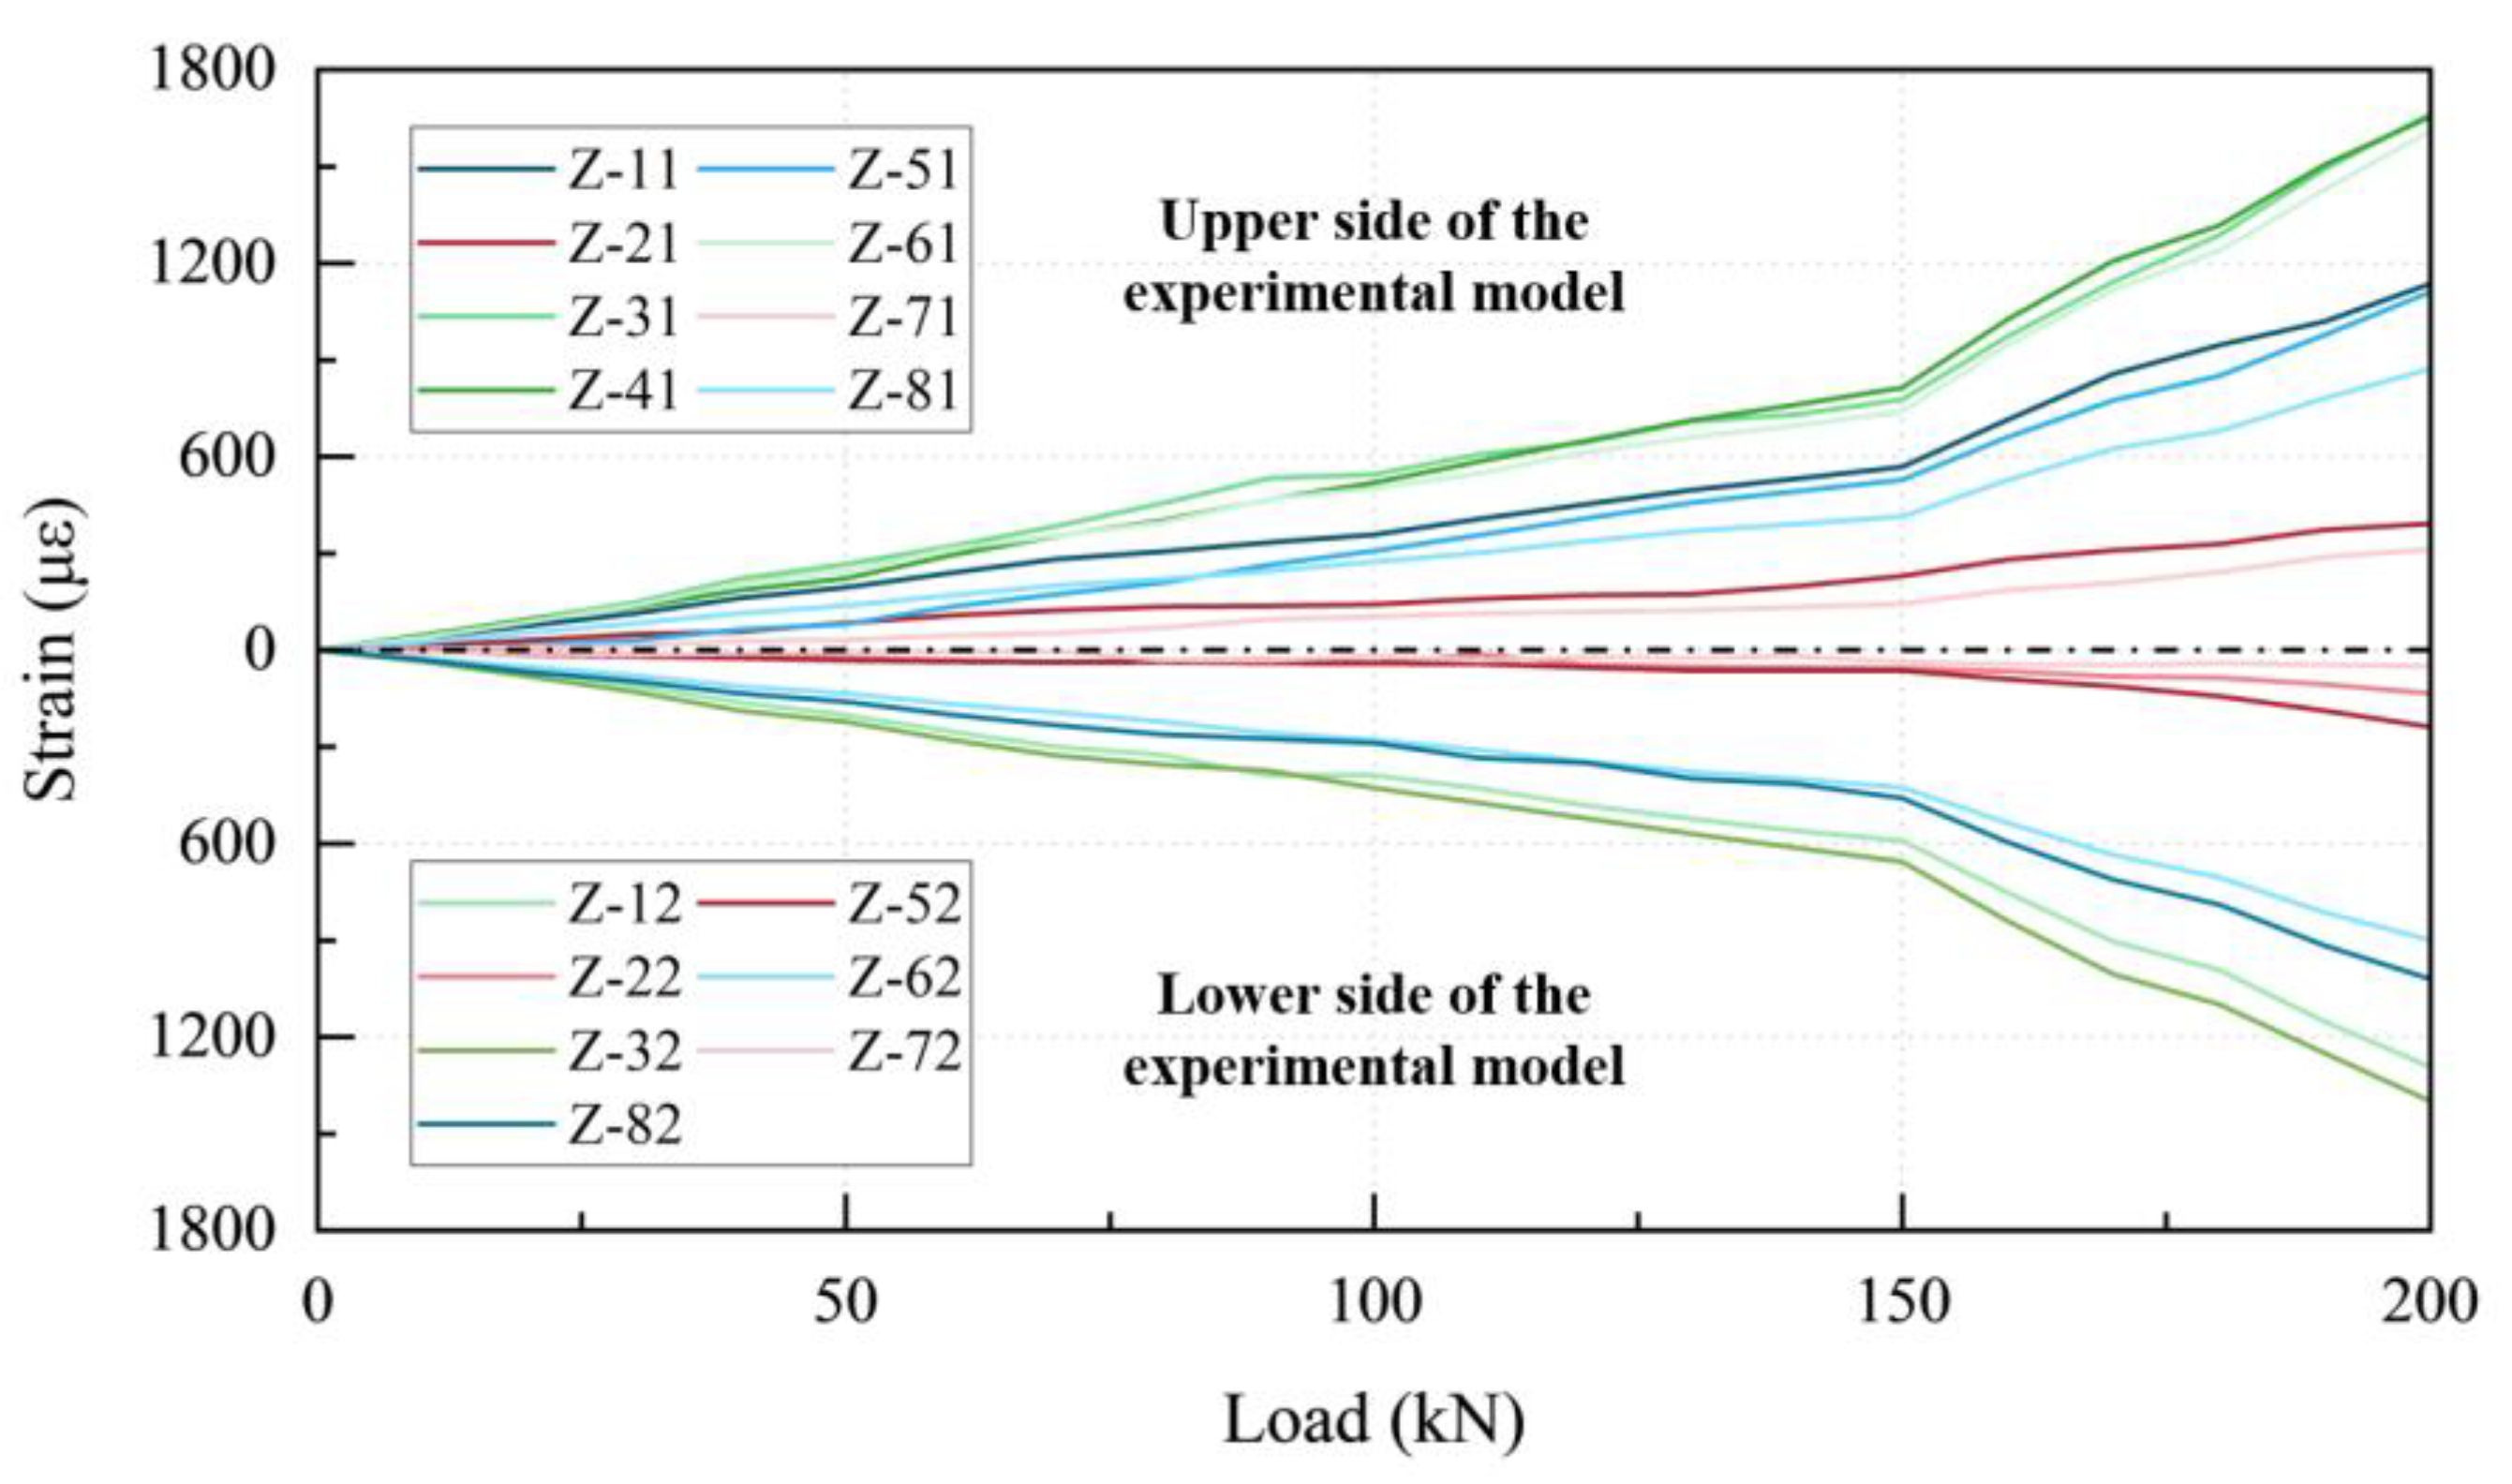
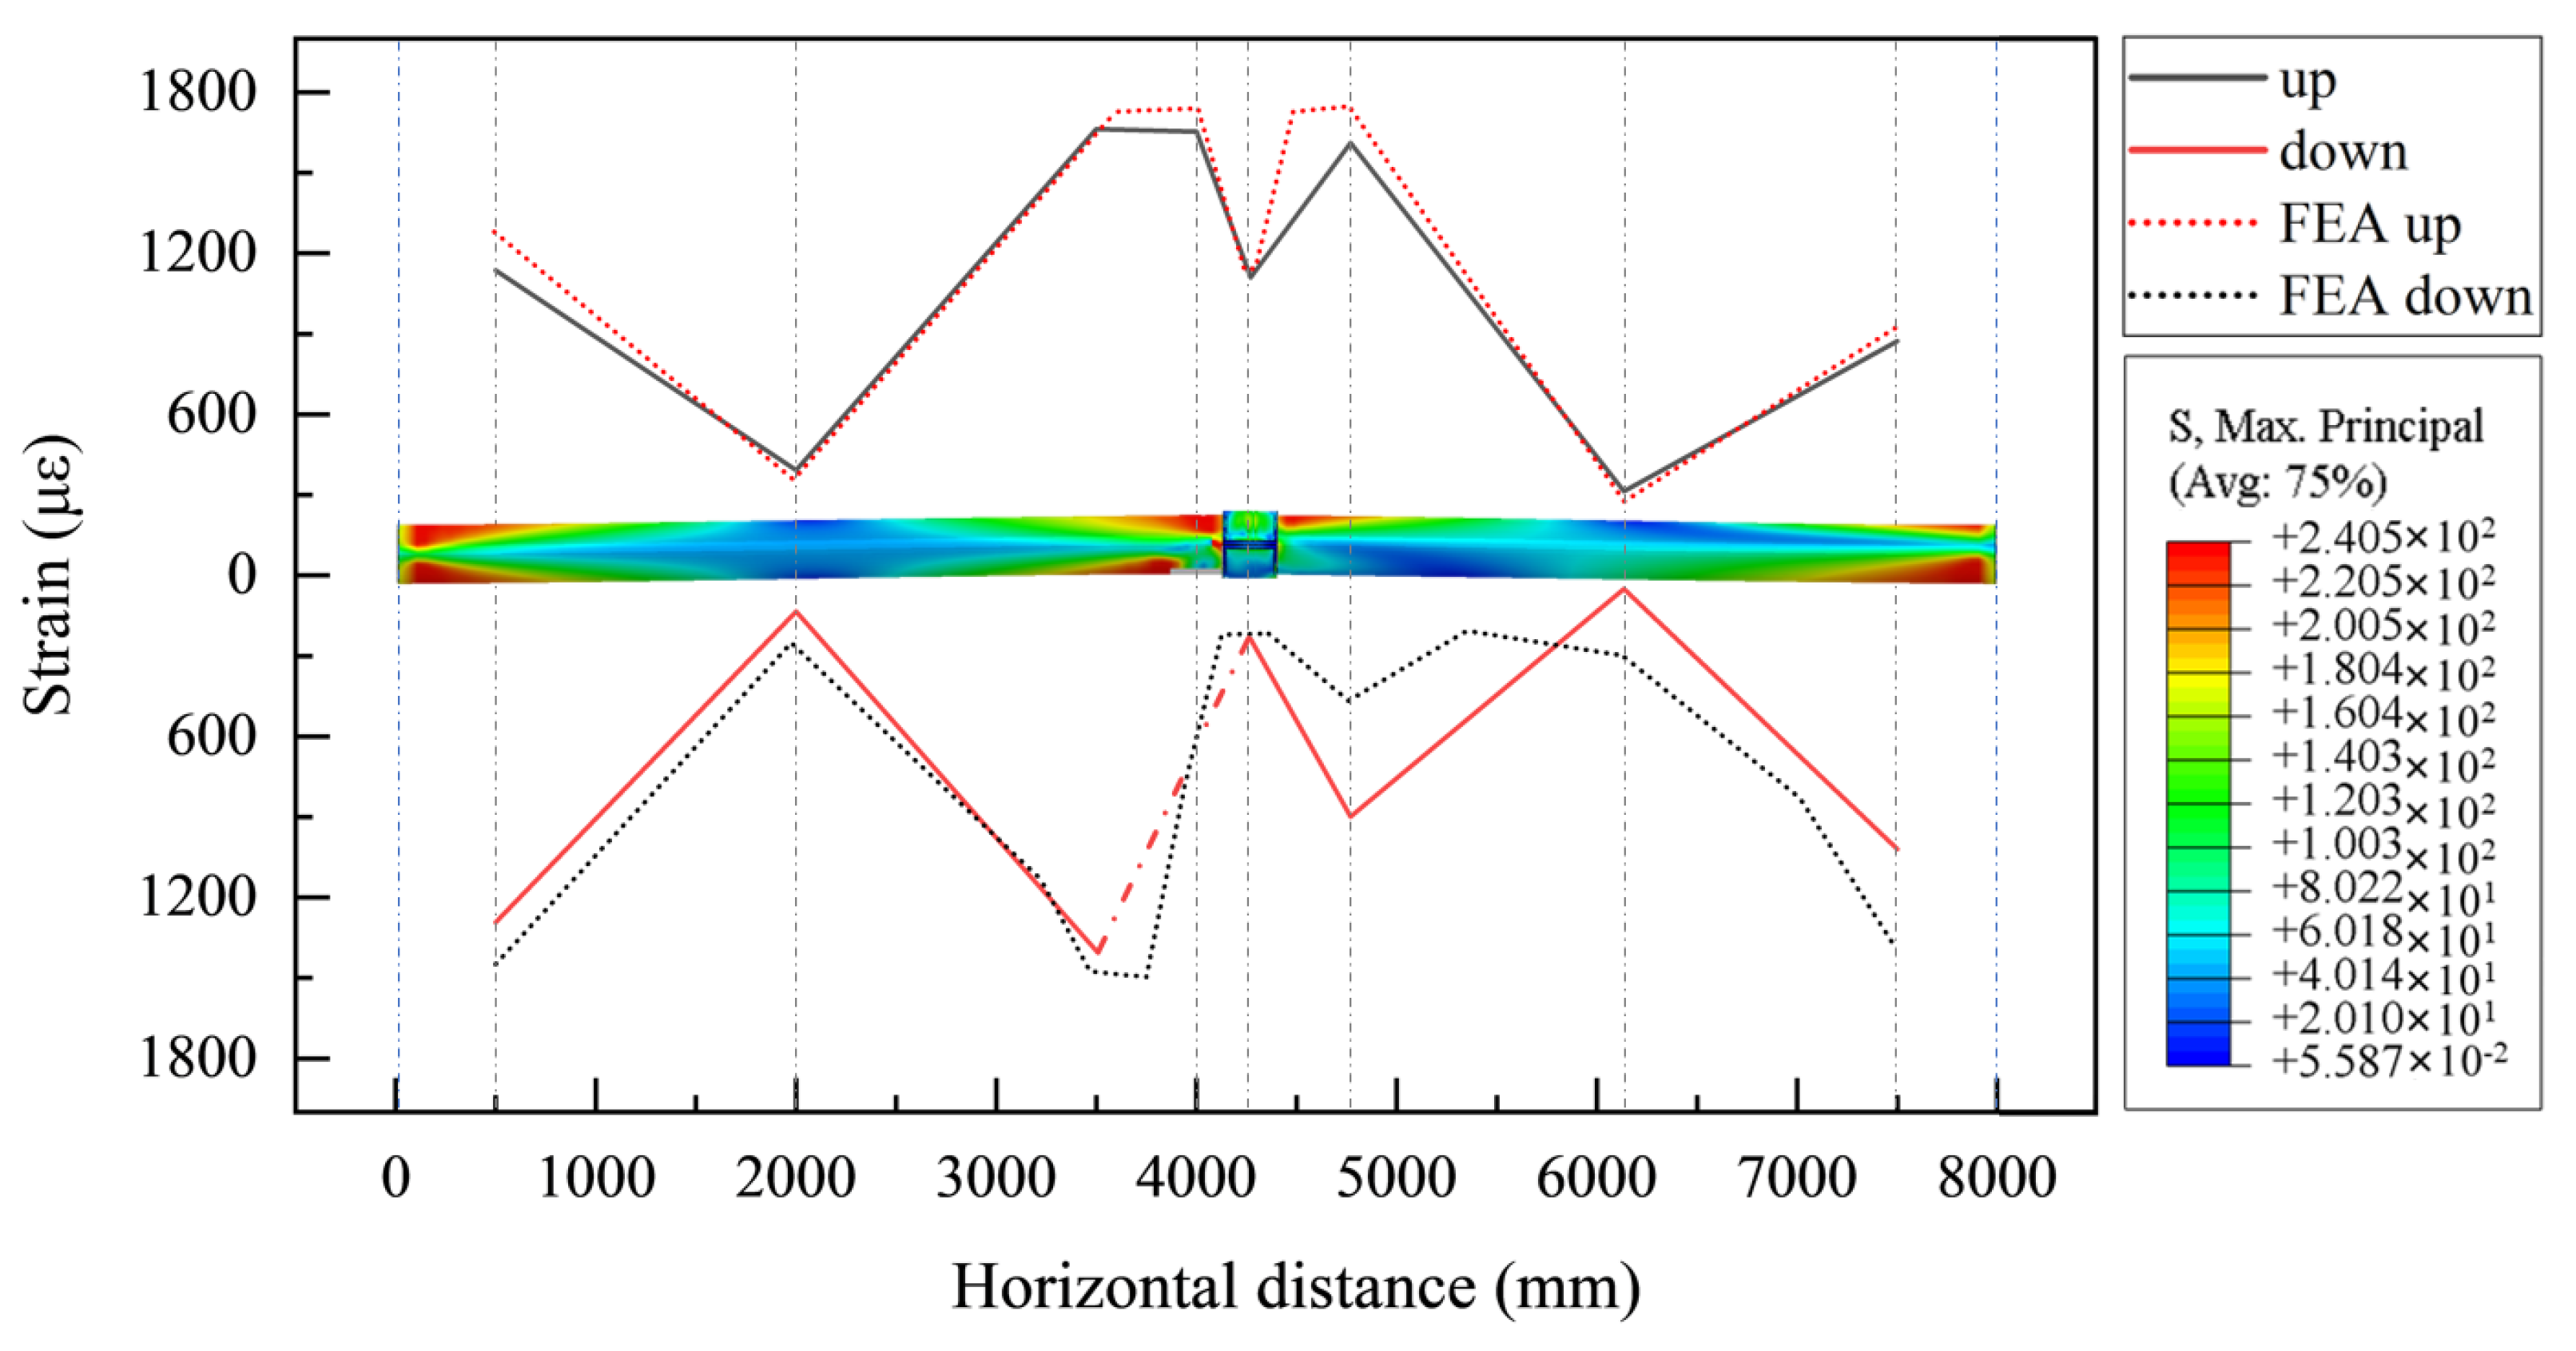
2.4.2. Variation of Strains with the Load in the Experimental Model
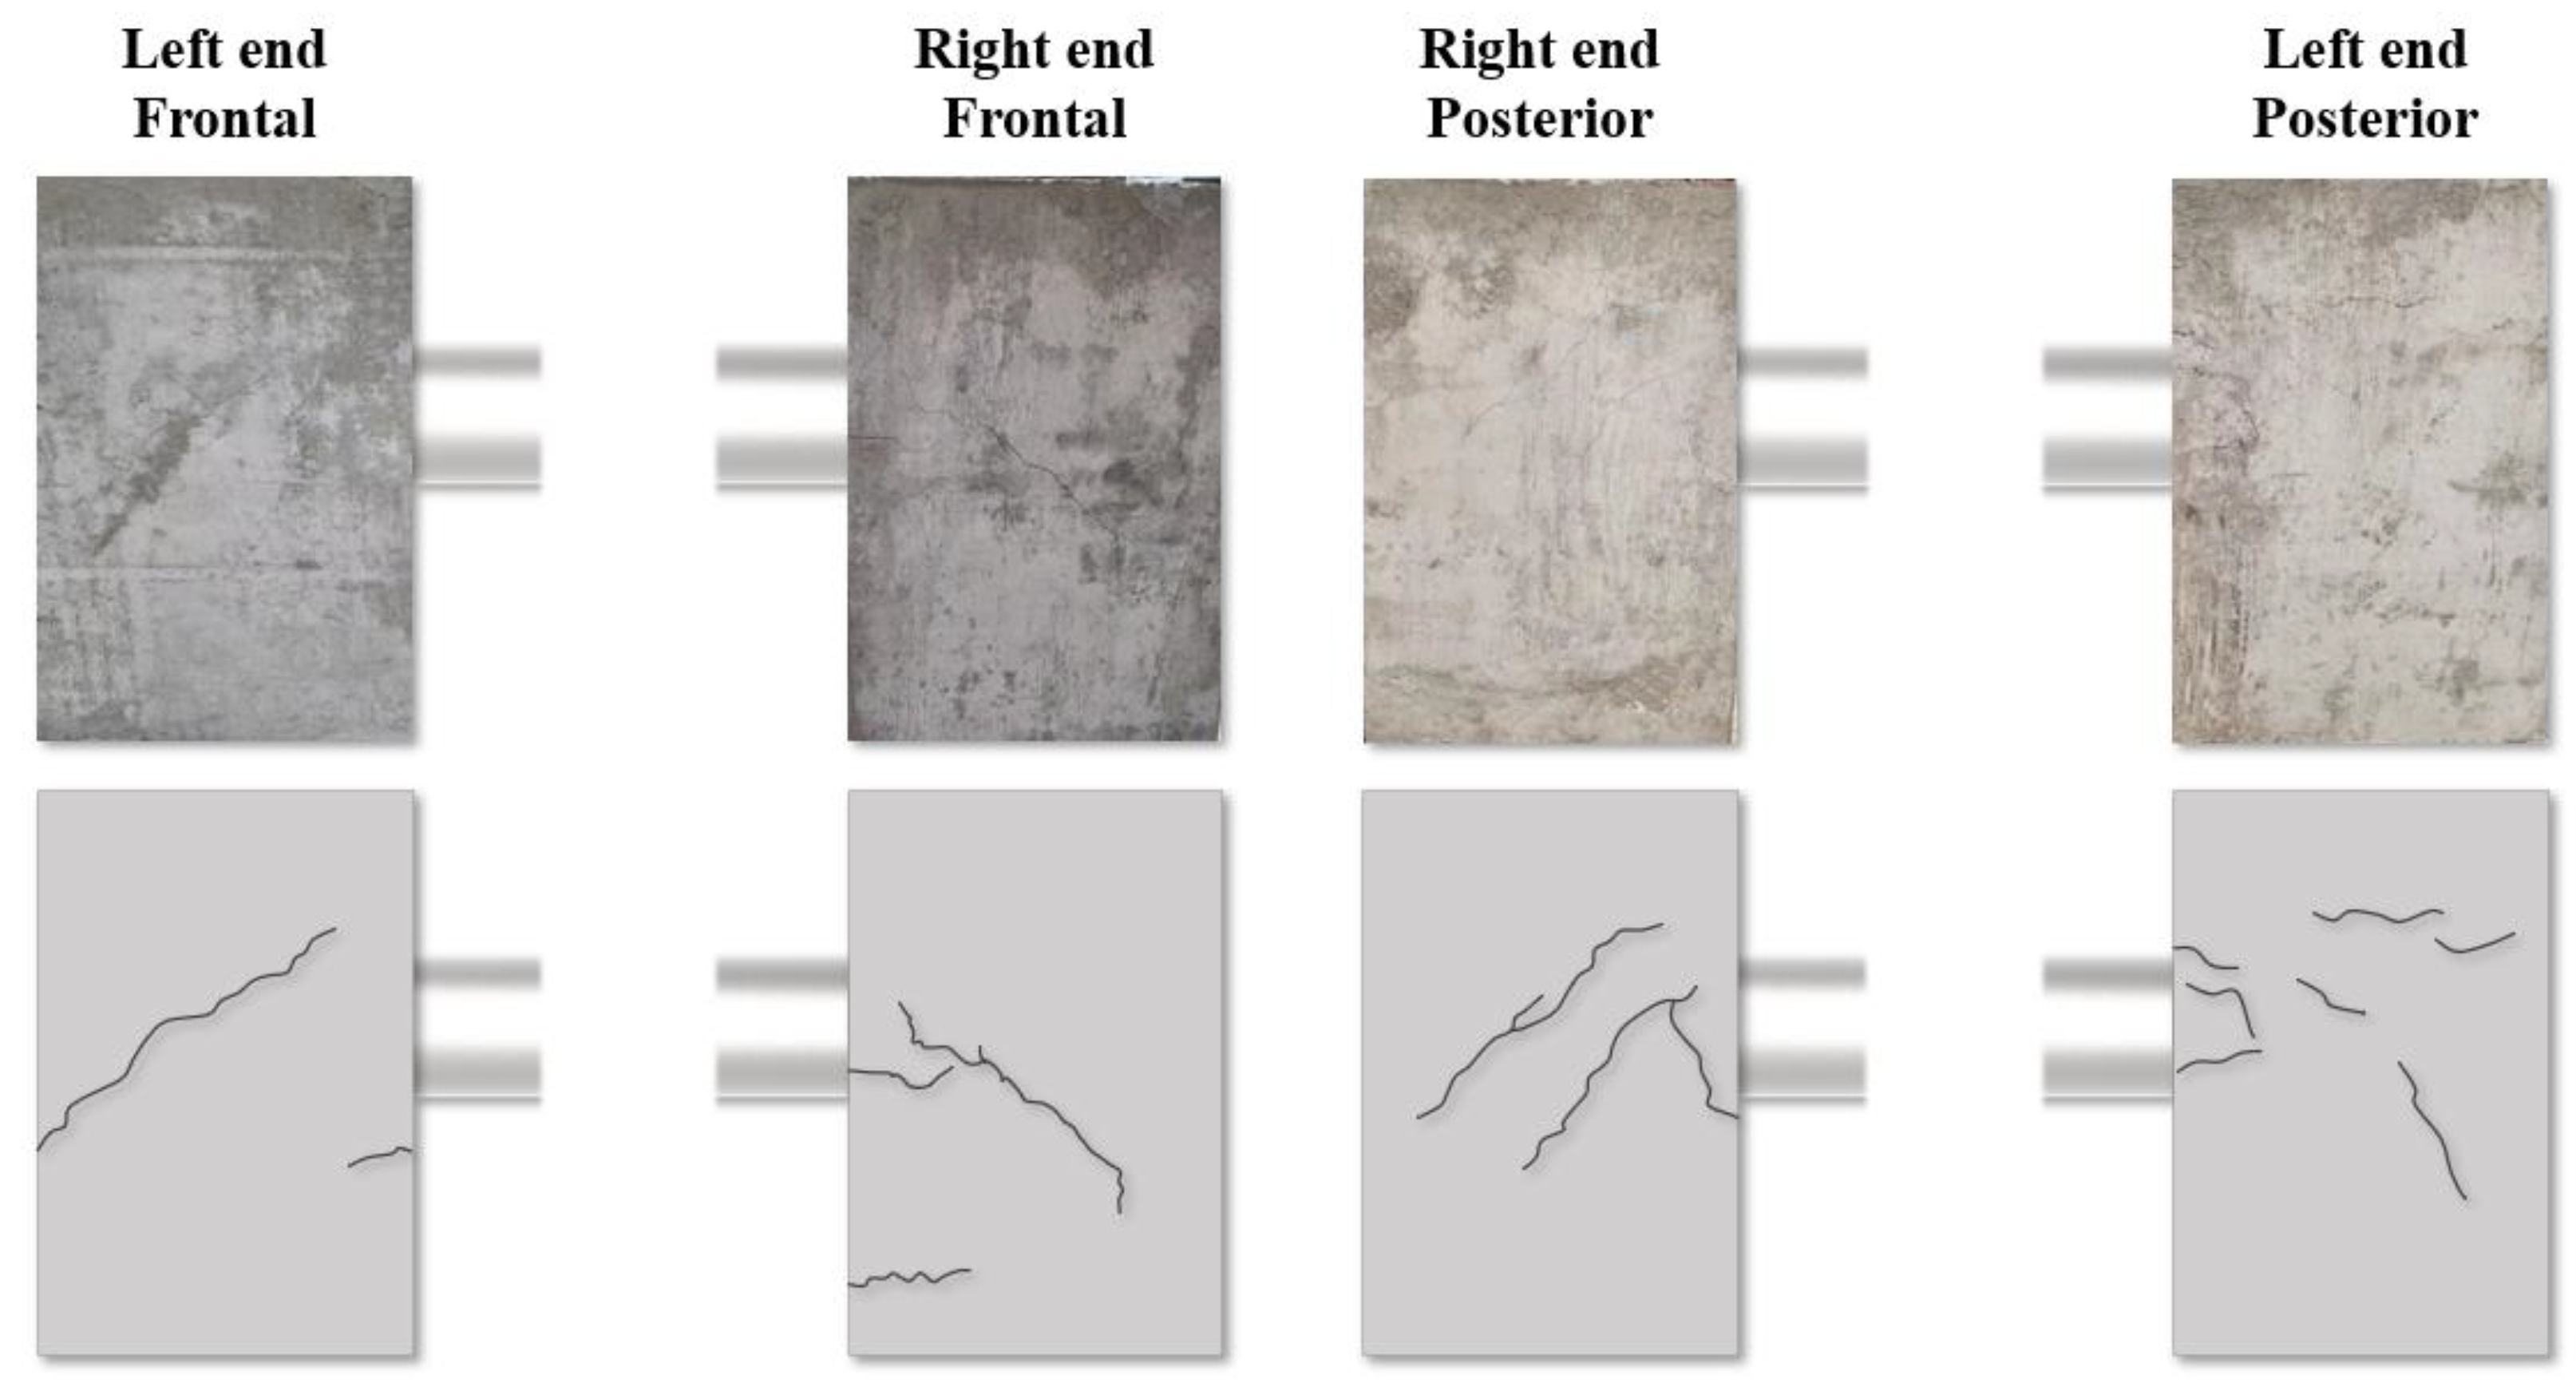
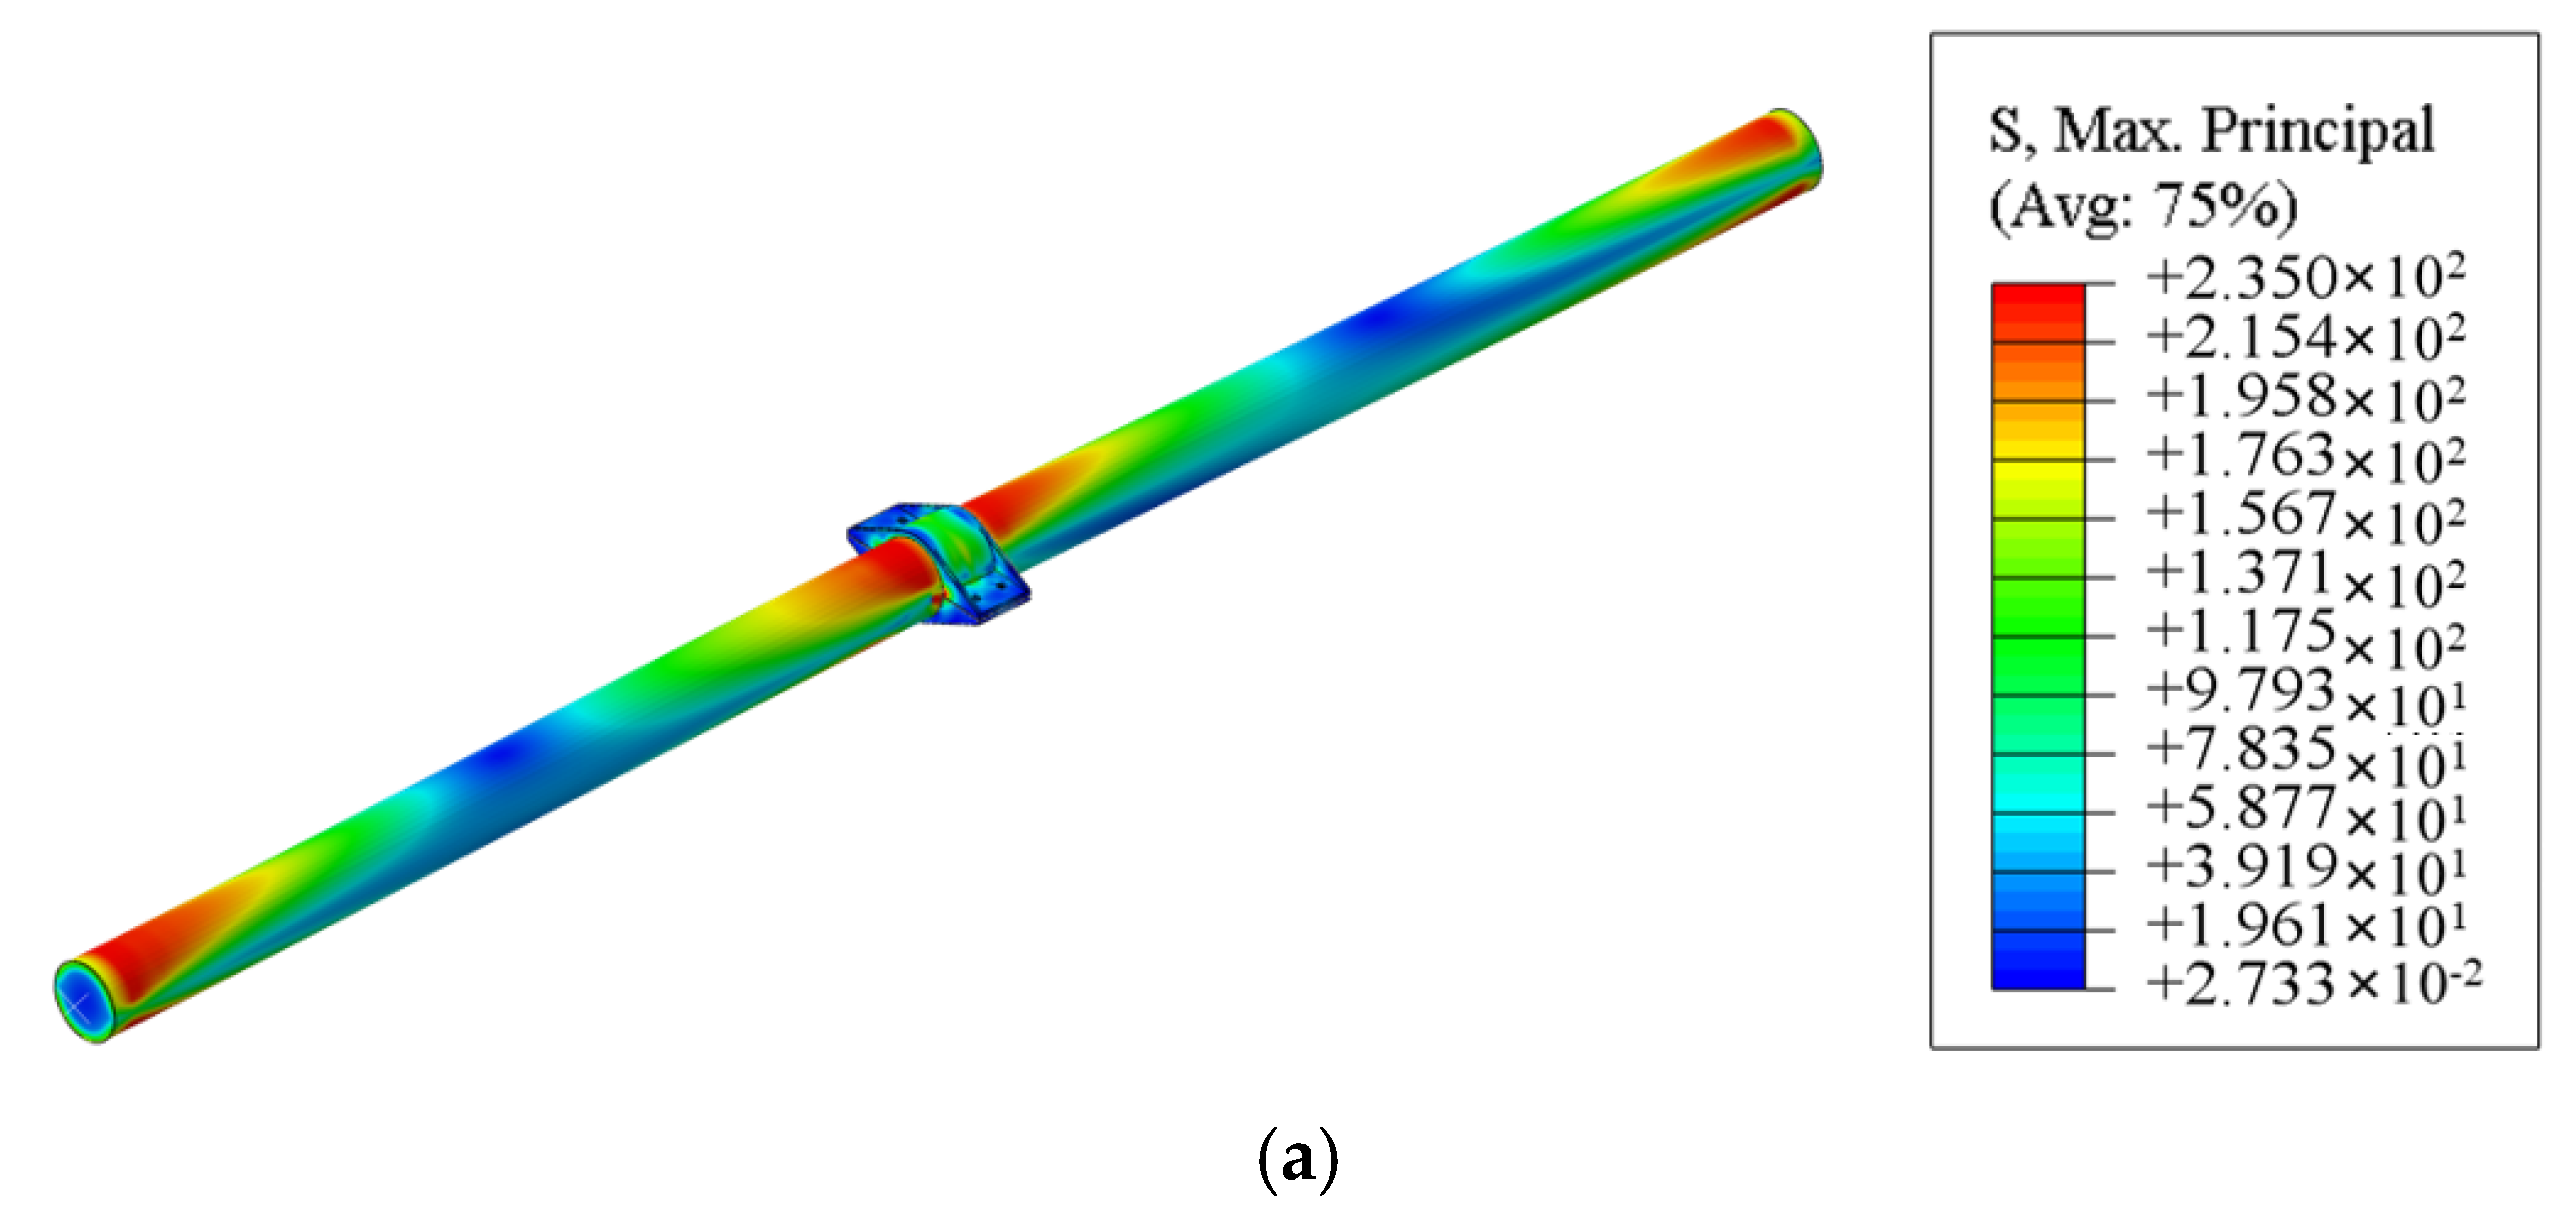
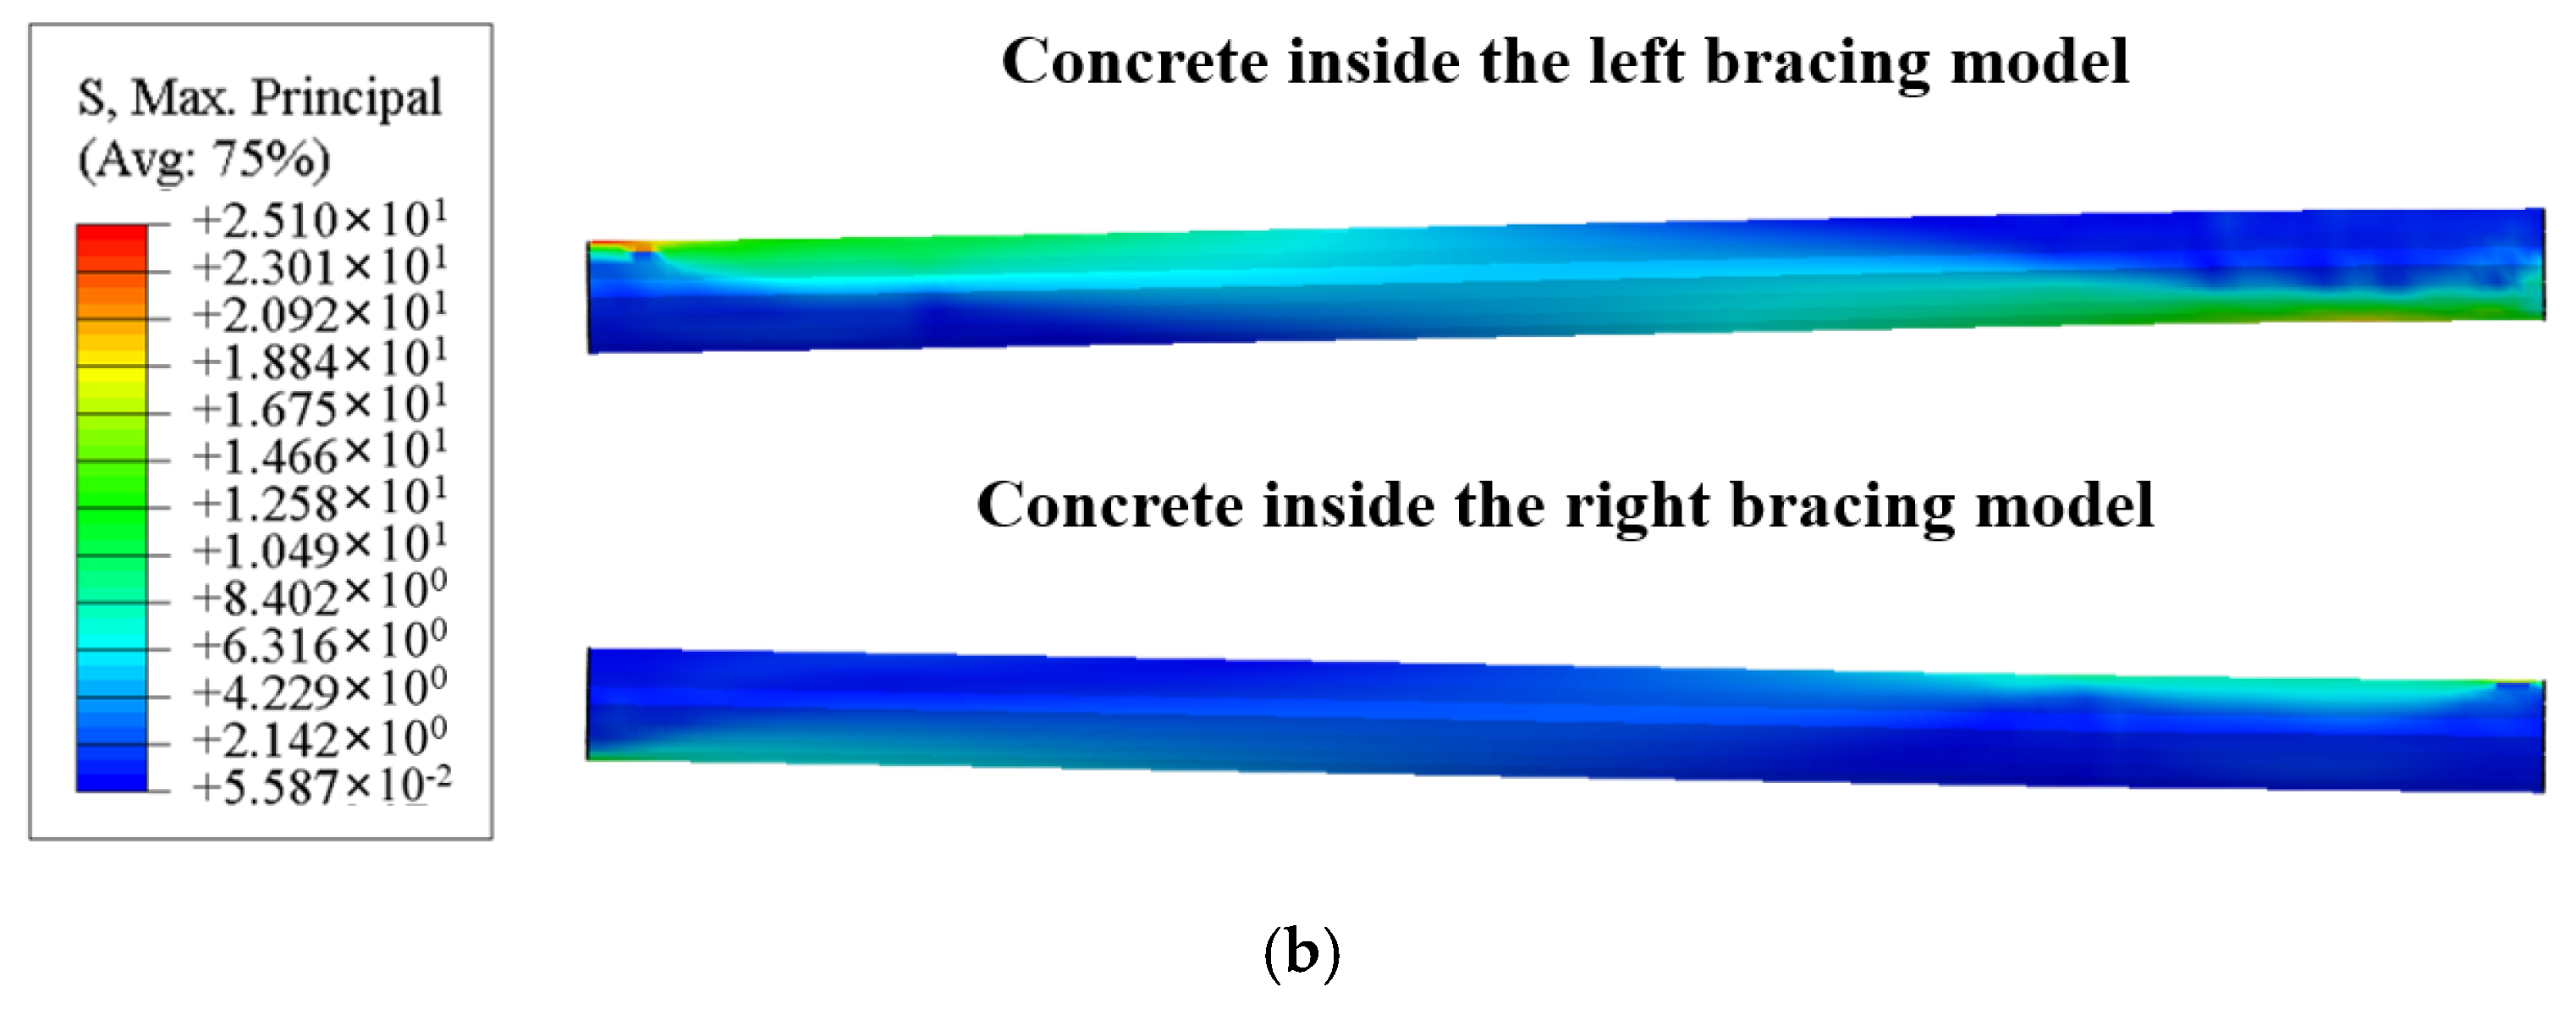
2.4.3. Failure Mode of the Experimental Model
3. Finite Element Simulations
3.1. Material Data of the FEA Models
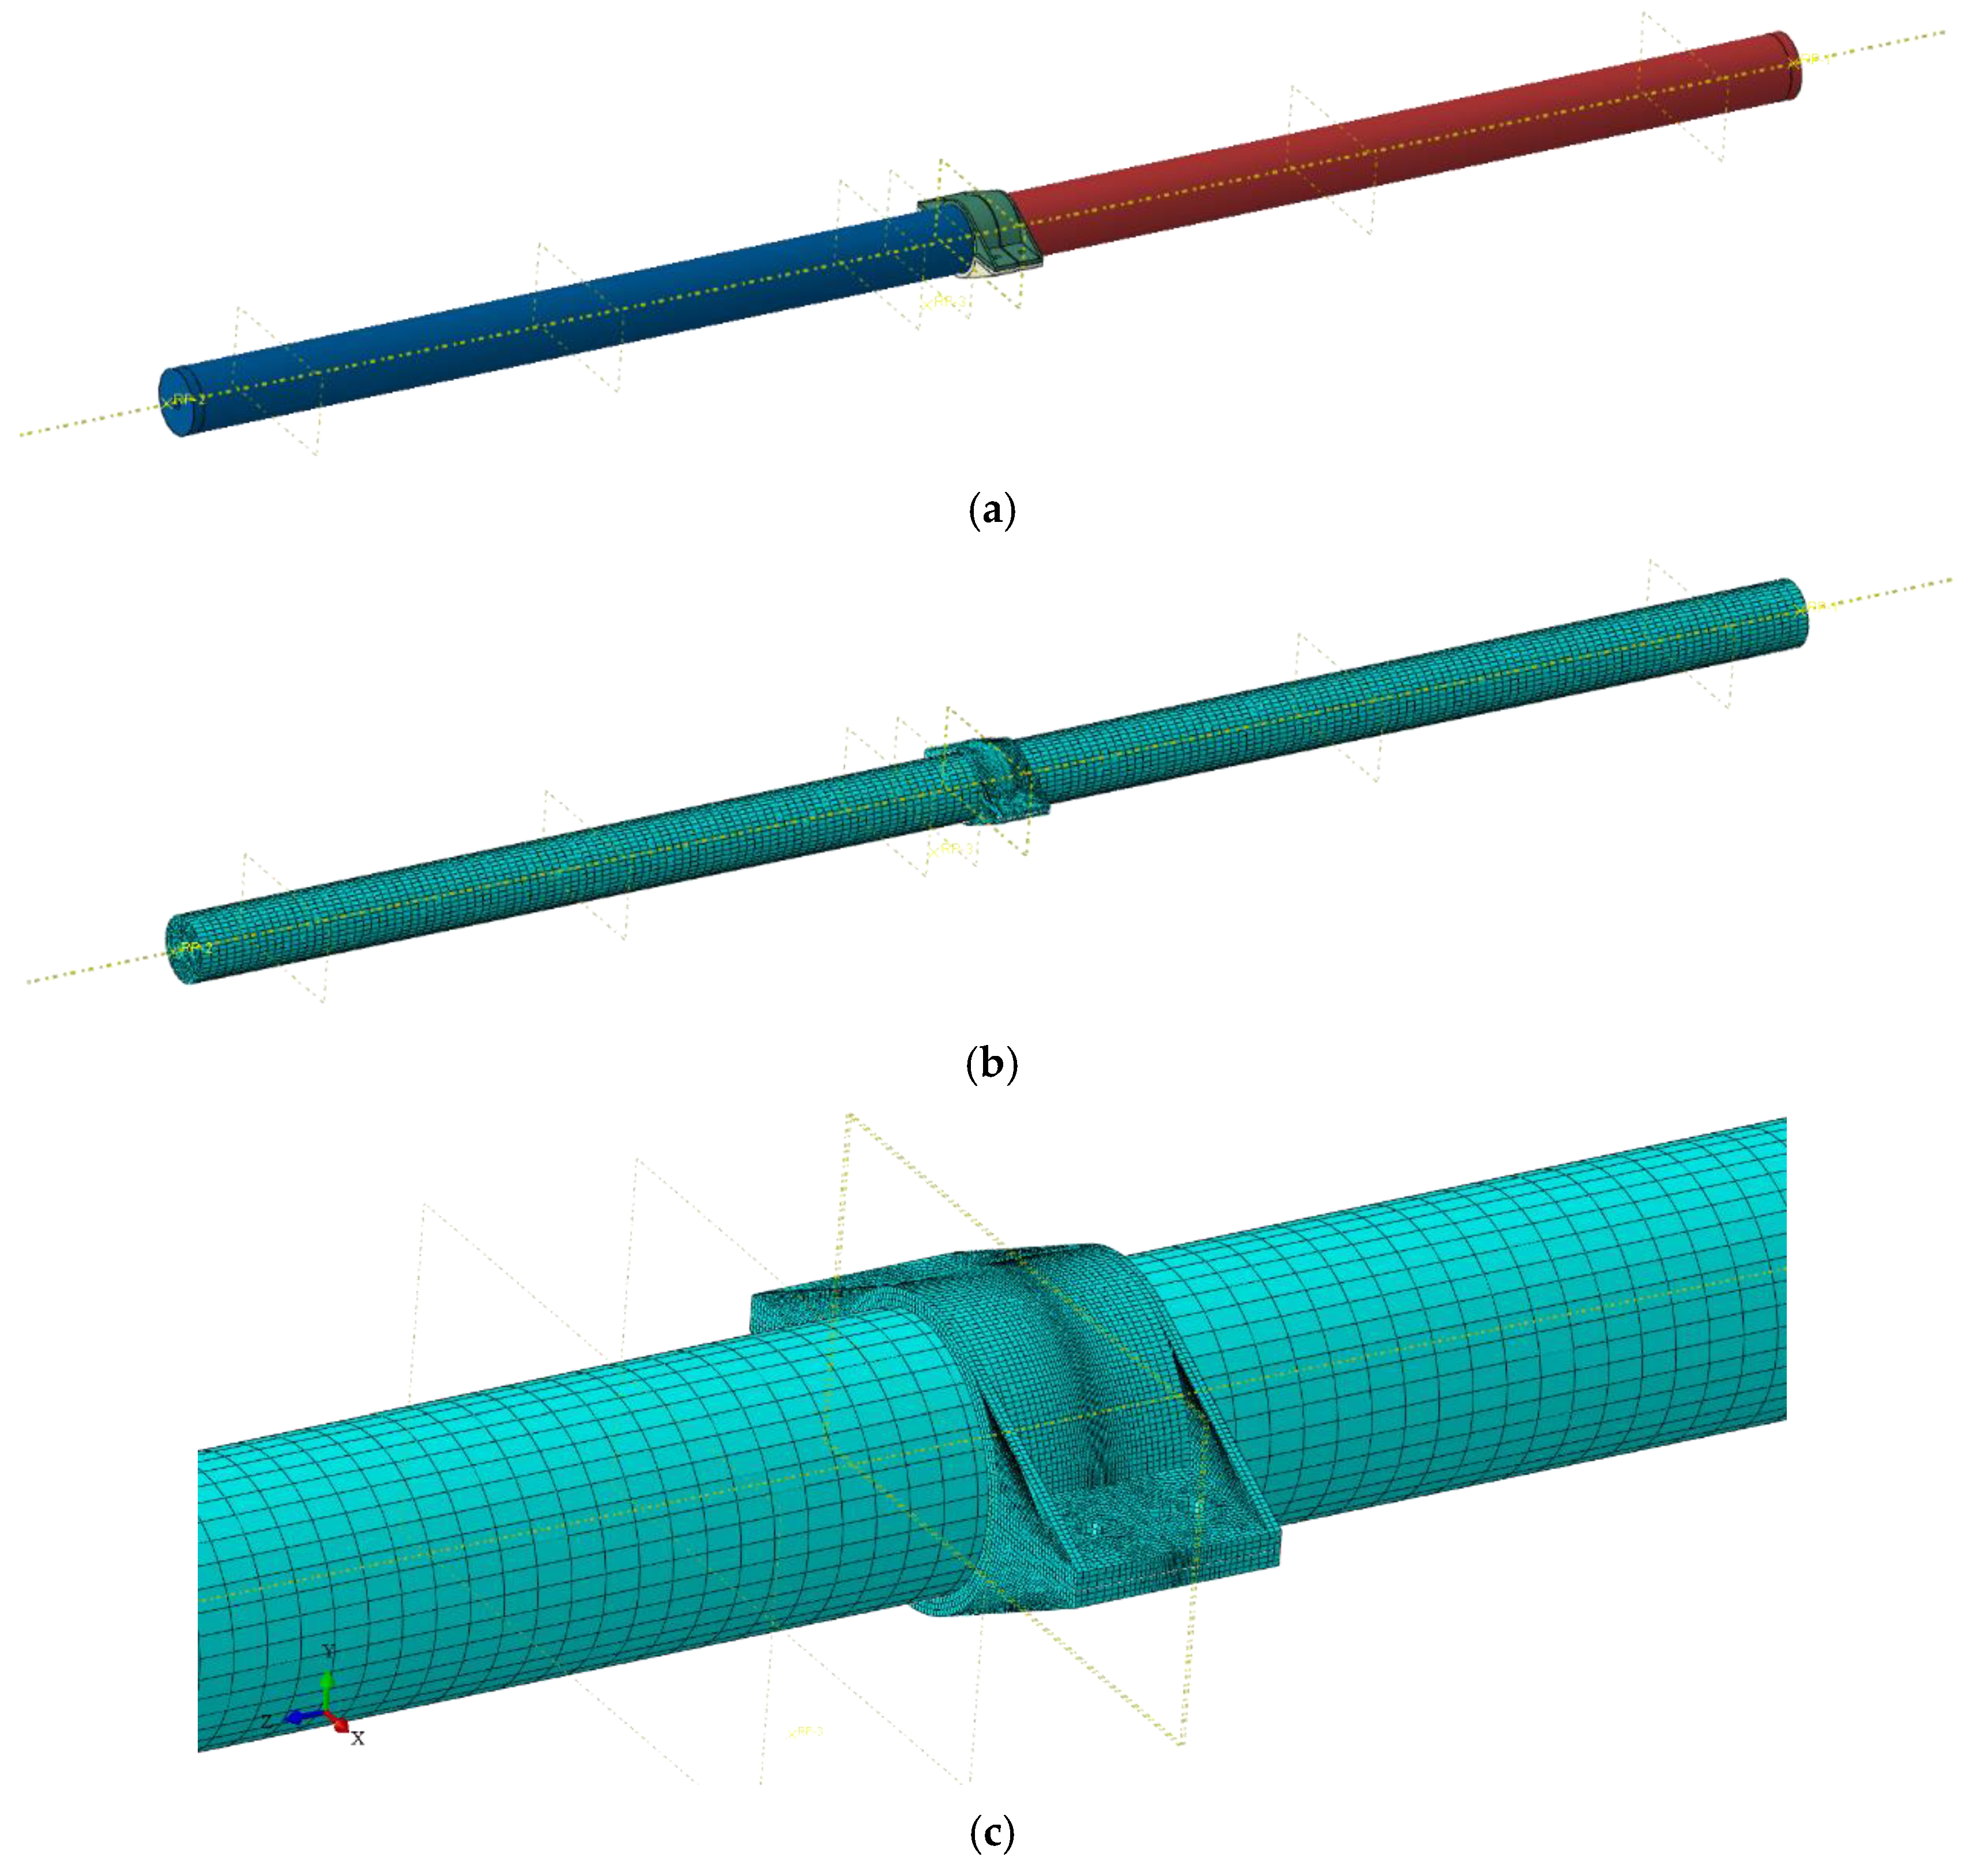
3.2. Element Type, Element Mesh, and Boundary Condition
3.3. Constitutive Models
3.3.1. Core Concrete
3.3.2. Outer Steel
3.4. Steel Tube–Concrete Interface
3.5. FEM Results and Analysis
3.5.1. Load-Displacement Diagrams of the Experimental Model
3.5.2. Variation of Strains with Load in the Experimental Model
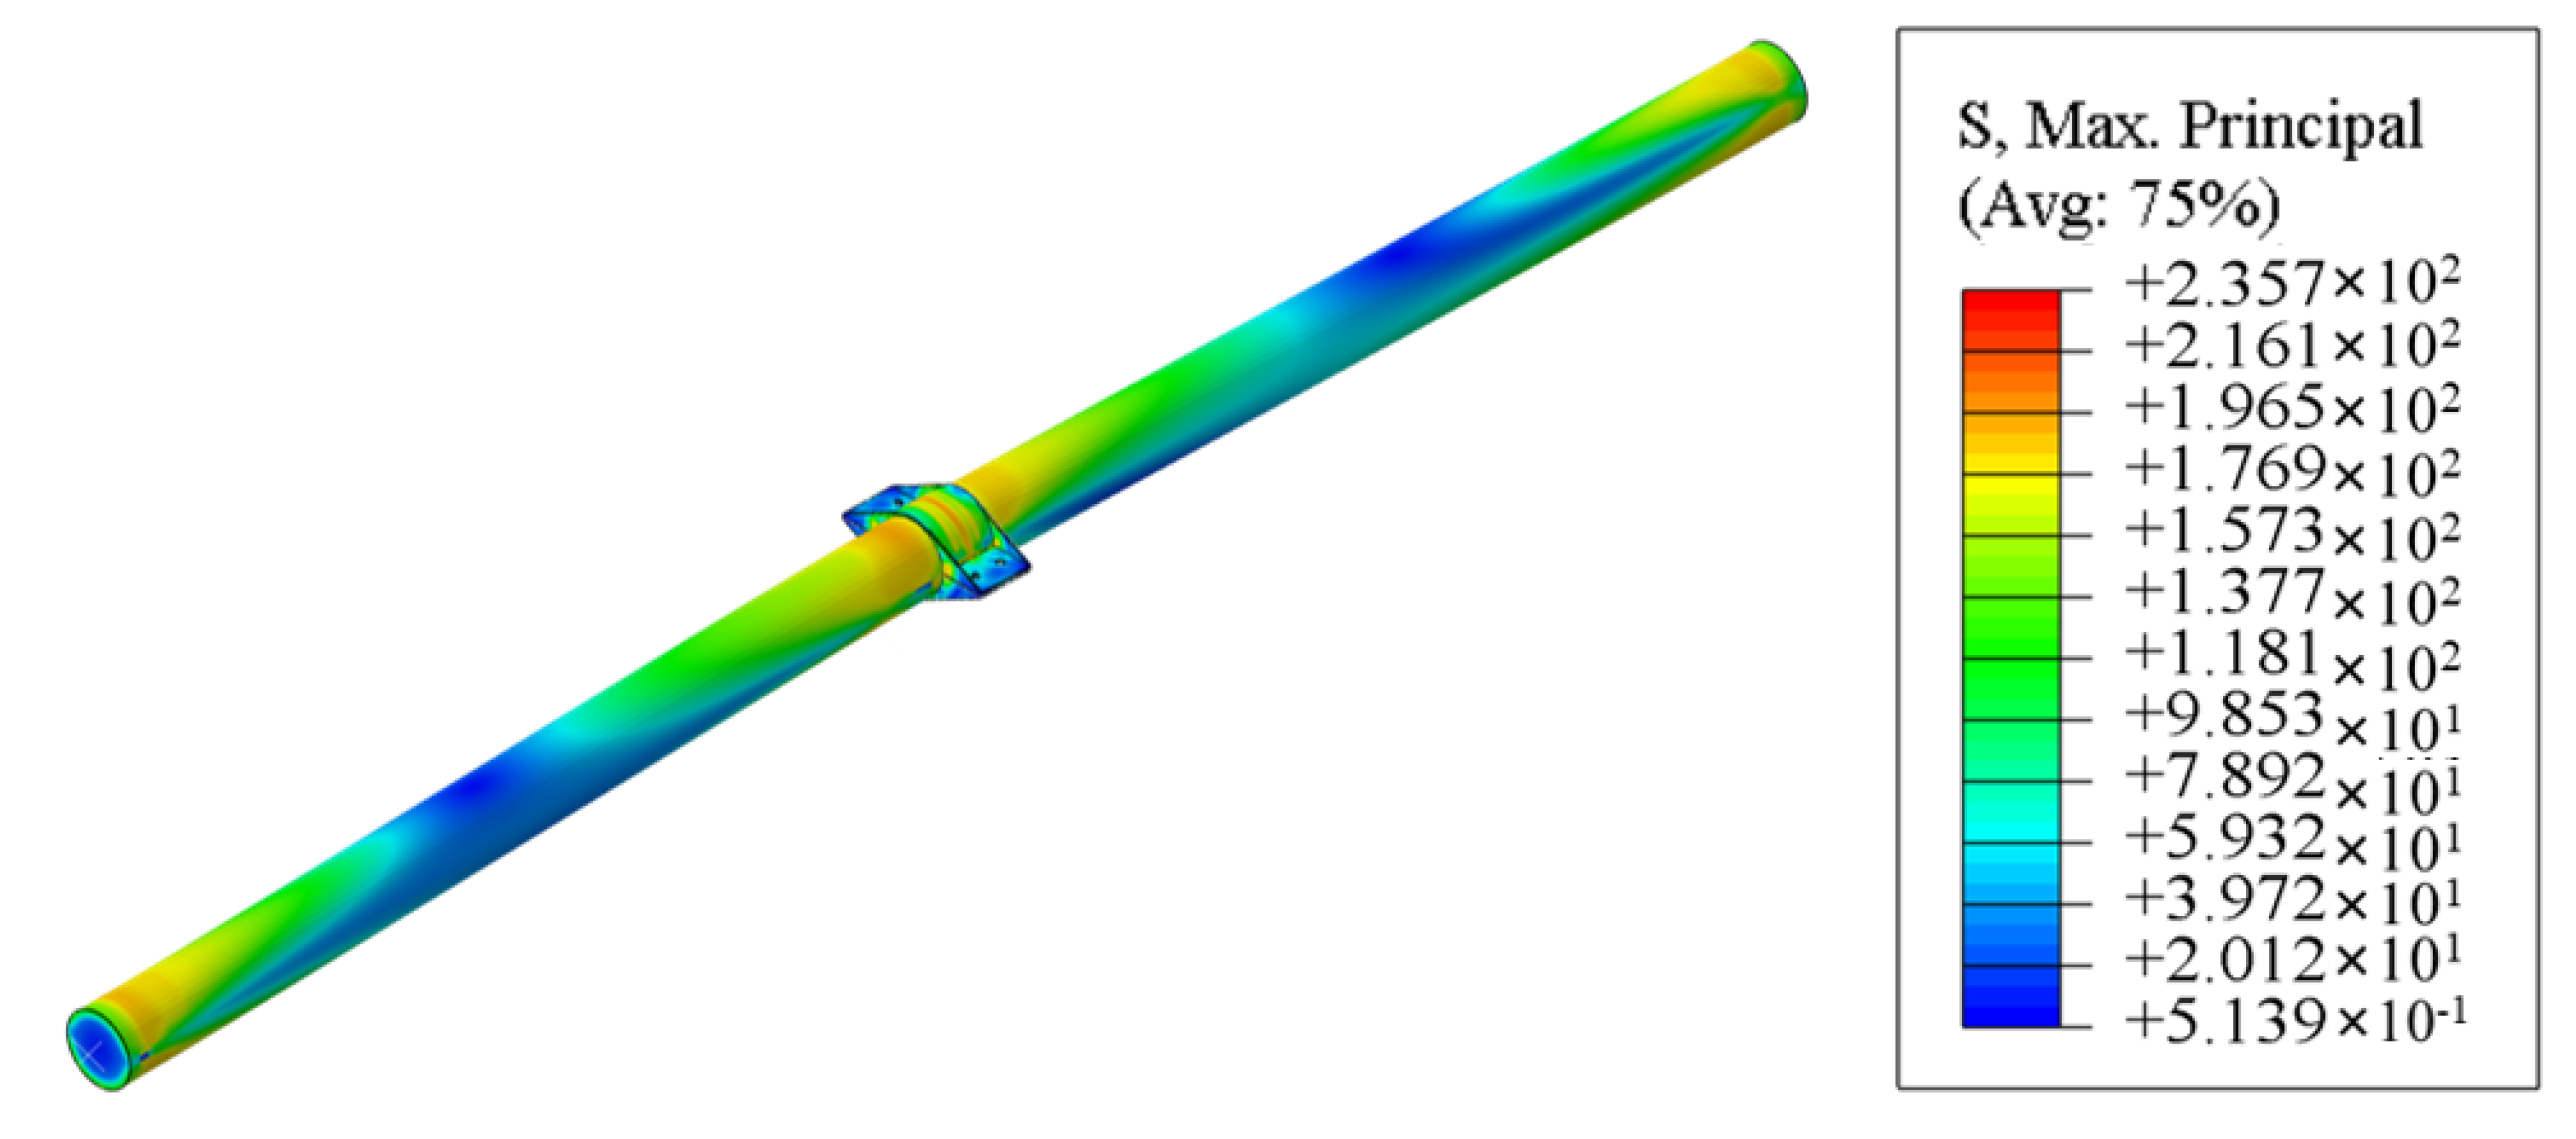
3.5.3. Failure Mode of the Experimental Model
4. Evaluation of Bearing Capacity
4.1. Bending Capacity of the H-CFST Component
4.2. Bending Capacity of the Hoop
4.3. Bending Capacity of the End Supports
4.4. Bending Capacity of the Experimental Model
4.5. Optimization Design of the H-CFST Bracing
5. Conclusions
- The self-designed hoop component significantly mitigated the strength and stiffness reduction phenomenon at the joint of H-CFST components, ensuring that the prefabricated H-CFST bracing system provides safety comparable to traditional concrete bracing in supporting coastal foundation pits;
- Under transverse bending conditions, the prefabricated H-CFST bracing system exhibited two typical failure modes, i.e., local tensile yielding of the steel tube and tensile cracking of end supports;
- Finite element modeling accurately predicted the failure modes of the bracings and provided a reference for the optimized design;
- The theoretical calculation methods using plane section assumption for the bending capacity of bracing components accurately predicted the bending capacity of each component.
Author Contributions
Funding
Institutional Review Board Statement
Informed Consent Statement
Data Availability Statement
Acknowledgments
Conflicts of Interest
References
- Tian, P.; Wang, Z.; Li, J.; Cao, L.; Liu, Y.; Zhang, H.; Ai, S. Spatiotemporal characteristics and driving mechanism of high-intensity development of continental coastal zones in the East China Sea. Geogr. Res. 2023, 42, 156–171. [Google Scholar]
- Lee, H.S.; Choi, Y.-J.; Woo, S.-B. Numerical Models in Coastal Hazards and Coastal Environment. J. Mar. Sci. Eng. 2021, 9, 494. [Google Scholar] [CrossRef]
- Huang, Z.; Mao, C.; Guan, S.; Tang, H.; Chen, G.; Liu, Z. Simulation research on the deformation safety monitoring and evaluation algorithm of coastal soft foundation pit based on big data. Soft Comput. 2023, 27, 1205. [Google Scholar] [CrossRef]
- Armenio, E.; Mossa, M. On the Need for an Integrated Large-Scale Methodology of Coastal Management: A Methodological Proposal. J. Mar. Sci. Eng. 2020, 8, 385. [Google Scholar] [CrossRef]
- Bai, X.-Y.; Chen, X.-Y.; Zhang, M.-Y. “Pile-Steel Support-Anchor” System for Foundation in Rock-Soil Layer. Soil Mech. Found. Eng. 2019, 55, 425–432. [Google Scholar] [CrossRef]
- Zhang, X.-D.; Zhang, S. Simulation of Deep Excavation and Shoring with FEM Based on ADINA. In Proceedings of the International Conference on Civil Engineering and Building Materials (CEBM), Kunming, China, 29–31 July 2011; pp. 3802–3806. [Google Scholar]
- Wang, J.; Yang, T.; Wang, G.; Liu, X.; Xu, N.; Stouthamer, E.; Yin, Y.; Wang, H.; Yan, X.; Huang, X. Control and prevent land subsidence caused by foundation pit dewatering in a coastal lowland megacity: Indicator definition, numerical simulation, and regression analysis. Environ. Earth Sci. 2023, 82, 1–26. [Google Scholar] [CrossRef]
- Liu, N.W.; Peng, C.X.; Li, M.G.; Chen, J.J. Hydro-mechanical behavior of a deep excavation with dewatering and recharge in soft deposits. Eng. Geol. 2022, 307, 106780. [Google Scholar] [CrossRef]
- Cui, J.; Yang, Z.; Azzam, R. Field Measurement and Numerical Study on the Effects of Under-Excavation and Over-Excavation on Ultra-Deep Foundation Pit in Coastal Area. J. Mar. Sci. Eng. 2023, 11, 219. [Google Scholar] [CrossRef]
- Li, J.; Li, M.-G.; Zhang, L.-L.; Chen, H.; Xia, X.-H.; Chen, J.-J. Experimental Study and Estimation of Groundwater Fluctuation and Ground Settlement due to Dewatering in a Coastal Shallow Confined Aquifer. J. Mar. Sci. Eng. 2019, 7, 58. [Google Scholar] [CrossRef]
- Bai, X.; Zhang, M.; Yan, N.; Wang, Y.; Yuan, H. Deformation properties of combined support system of pile-steel support-anchor cable for deep foundation pit in rock-soil combination. J. Cent. South Univ. Sci. Technol. 2018, 49, 454–463. [Google Scholar]
- Cao, P.; Wu, J.; Zhong, D.; Meng, Y.; Cheng, D. Application of Explosive Demolition Technology of Foundation Pit Support Beam based on Axial Hole Layout. Blasting 2017, 34, 96–99, 119. [Google Scholar]
- Hu, J.; Xie, J.; Li, W.; Li, C. Research on the United Supporting Structure of Piled Anchor and Reinforced Concrete Internal Bracing for City Deep Foundation Pit under Complex Surroundings. In Proceedings of the International Conference on Civil Engineering and Building Materials (CEBM), Kunming, China, 29–31 July 2011; p. 1270. [Google Scholar]
- Uenaka, K.; Mizukoshi, M. Lightweight concrete filled steel tubular beam under bending-shear. Structures 2021, 30, 659–666. [Google Scholar] [CrossRef]
- Niyirora, R.; Niyonyungu, F.; Hakuzweyezu, T.; Masengesho, E.; Nyirandayisabye, R.; Munyaneza, J. Behavior of concrete-encased concrete-filled steel tube columns under diverse loading conditions: A review of current trends and future prospects. Cogent Eng. 2023, 10, 2156056. [Google Scholar] [CrossRef]
- Zhong, S.; Xu, G. Behaviors of centrifugal hollow concrete filled steel tube (H-CFST) stub columns under axial compression. J. Harbin Inst. Technol. 2006, 38, 1479–1482,1503. [Google Scholar]
- Wang, H.; Lu, D.; Zhou, Y. Experimental study on seismic behavior of hollow concrete-filled steel tubes(H-CFST) under low cyclic loading. J. Earthq. Eng. Eng. Vib. 2014, 34, 129–136. [Google Scholar]
- Kuranovas, A.; Kvedaras, A.K. Behaviour of hollow concrete filled steel tubular composite elements. J. Civ. Eng. Manag. 2007, 13, 131–141. [Google Scholar] [CrossRef]
- Han, L.; Yao, G.; Zhao, X. Tests and calculations for hollow structural steel (HSS) stub columns filled with self-consolidating concrete (SCC). J. Constr. Steel Res. 2005, 61, 1241–1269. [Google Scholar]
- Ritchie, C.B.; Packer, J.A.; Seica, M.V.; Zhao, X.-L. Behaviour and analysis of concrete-filled rectangular hollow sections subject to blast loading. J. Constr. Steel Res. 2018, 147, 340–359. [Google Scholar] [CrossRef]
- Wang, H.; Zha, X.; Ye, F. Impact resistance of hollow concrete filled-steel tubular members subjected to lateral impact loading. J. Huazhong Univ. Sci. Technol. Nat. Sci. 2010, 38, 107–110. [Google Scholar]
- Yu, M.; Zha, X.; Ye, J.; She, C. A unified formulation for hollow and solid concrete-filled steel tube columns under axial compression. Eng. Struct. 2010, 32, 1046–1053. [Google Scholar]
- Ouyang, Y.; Kwan, A.K.H. Finite element analysis of square concrete-filled steel tube (CFST) columns under axial compressive load. Eng. Struct. 2018, 156, 443–459. [Google Scholar] [CrossRef]
- Ekmekyapar, T.; Al-Eliwi, B.J.M. Experimental behaviour of circular concrete filled steel tube columns and design specifications. Thin Walled Struct. 2016, 105, 220–230. [Google Scholar] [CrossRef]
- Han, L.; Yao, G.; Tao, Z. Performance of concrete-filled thin-walled steel tubes under pure torsion. Thin-Walled Struct. 2007, 45, 24–36. [Google Scholar] [CrossRef]
- Zhang, M.; Guo, X.; Ma, D.; Huang, L.; Wang, W. Design Methods of the Concrete-filled Steel Tube Inner-bracing System for Deep Excavation. J. Beijing Univ. Technol. 2016, 42, 1848–1856. [Google Scholar]
- Guo, X.; Zhang, M.; Ma, D.; Huang, L.; Wang, W.; Wang, C.; Yang, S.; Qiao, J. Case study on braced excavation with P-CFST for top internal support. J. Zhejiang Univ. Eng. Sci. 2019, 53, 51–60. [Google Scholar]
- Mizan, A.; Quan, L.Q.; Ishvarbhai, P.V.; Hadi, M.N.S. Nonlinear analysis of rectangular concrete-filled double steel tubular short columns incorporating local buckling. Eng. Struct. 2018, 175, 13–26. [Google Scholar]
- Wang, Y.-H.; Lu, G.-B.; Zhou, X.-H. Experimental study of the cyclic behavior of concrete-filled double skin steel tube columns subjected to pure torsion. Thin-Walled Struct. 2018, 122, 425–438. [Google Scholar] [CrossRef]
- Yang, H.; Yu, Y.; Kang, L.; Chen, J.; Luo, Y. Study on mechanical behavior of flange-connected CFST column-steel beam joint with external stiffening ring plate. J. Build. Struct. 2022, 43, 157–172. [Google Scholar]
- Chen, X.; Xue, J.; Li, H.; Tu, G.; Lu, X. Performance-based Analysis of Elastoplastic Rotational Behavior of Multi-cell Shaped Concrete-filled Steel Tubular Connection. KSCE J. Civ. Eng. 2023, 27, 4300–4322. [Google Scholar] [CrossRef]
- Yang, Y.; Liu, X.; Zhang, J.; Liu, J.; Cheng, W. Behavior of large-scale connections between circular concrete-filled steel tubular columns and H-section steel beams. Adv. Struct. Eng. 2020, 23, 307–319. [Google Scholar] [CrossRef]
- Yang, M.; Tian, L.J.; Yuan, Y.; Yang, Z.Y. The study on composite trough beam with corrugated steel web wrapped with steel plate: Experiment and bending properties. J. Constr. Steel Res. 2021, 185, 106853. [Google Scholar] [CrossRef]
- Mo, Z.; Qiu, J.; Xu, H.; Xu, L.; Hu, Y. Flexural and longitudinal shear performance of precast lightweight steel-ultra-high performance concrete composite beam. Front. Struct. Civ. Eng. 2023, 17, 704–721. [Google Scholar] [CrossRef]
- Wang, H.; Liu, X.-G.; Yue, Q.-R.; Zheng, M.-Z. Effects of different design factors on the shear performance of assembled steel-concrete composite beam with local laminated joint. Structures 2022, 46, 1881–1895. [Google Scholar] [CrossRef]
- Du, Y.; Gao, D.; Chen, Z.; Deng, X.-F.; Qian, K. Experimental study on the flexural behavior of square high-strength concrete-filled steel tube beams with different CFRP wrapping schemes. Compos. Struct. 2023, 304, 116325. [Google Scholar] [CrossRef]
- Feng, R.; Chen, Y.; Wei, J.; Huang, J.; Huang, J.; He, K. Experimental and numerical investigations on flexural behaviour of CFRP reinforced concrete-filled stainless steel CHS tubes. Eng. Struct. 2018, 156, 305–321. [Google Scholar] [CrossRef]
- Han, L.H. Flexural behaviour of concrete-filled steel tubes. J. Constr. Steel Res. 2004, 60, 313–337. [Google Scholar] [CrossRef]
- GB 50017-2017; Standard for Design of Steel Structures. Ministry of Housing and Urban Rural Development of the People’s Republic of China: Beijing, China, 2017.
- Chen, J.-Y.; Wang, F.-C.; Han, L.-H.; Mu, T.-M. Flexural performance of concrete-encased CFST box members. Structures 2020, 27, 2034–2047. [Google Scholar] [CrossRef]
- Hibbitt, Karlsson, and Sorensen Inc. ABAQUS/Standard User’s Manual; Hibbitt, Karlsson, and Sorensen Inc.: Pawtucket, RI, USA, 2016. [Google Scholar]
- ACI 318-02; Building Code Requirements for Reinforced Concrete and Commentary. American Concrete Institute: Farmington Hills, MI, USA, 2002.
- Shen, J.; Wang, C.; Jiang, J. Finite Element Analysis of Reinforced Concrete and Limit Analysis of Plates and Shells; Tsinghua University Press: Beijing, China, 1993; Volume 7. [Google Scholar]
- Han, L. Steel Tube Concrete Structure—Theory and Practice; Science Press: Beijing, China, 2004; Volume 3. [Google Scholar]
- Roeder, C.W.; Cameron, B.; Brown, C.B. Composite Action in Concrete Filled Tubes. J. Struct. Eng. 1999, 125, 477–484. [Google Scholar] [CrossRef]
- Hanoon, A.N.; Al Zand, A.W.; Yaseen, Z.M. Designing new hybrid artificial intelligence model for CFST beam flexural performance prediction. Eng. Comput. 2022, 38, 3109–3135. [Google Scholar] [CrossRef]
- Al Zand, A.W.; Badaruzzaman, W.H.W.; Al-Shaikhli, M.S.; Ali, M.M. Flexural performance of square concrete-filled steel tube beams stiffened with V-shaped grooves. J. Constr. Steel Res. 2020, 166, 105930. [Google Scholar] [CrossRef]
- Al Zand, A.W.; Badaruzzaman, W.H.W.; Ali, M.M.; Hasan, Q.A.; Al-Shaikhli, M.S. Flexural performance of cold-formed square CFST beams strengthened with internal stiffeners. Steel Compos. Struct. 2020, 34, 123–139. [Google Scholar] [CrossRef]
- Xu, Z.; Gardner, L.; Sadowski, A.J. Nonlinear stability of elastic elliptical cylindrical shells under uniform bending. Int. J. Mech. Sci. 2017, 128, 593–606. [Google Scholar] [CrossRef]
- Fajuyitan, O.K.; Sadowski, A.J.; Wadee, M.A.; Rotter, J.M. Nonlinear behaviour of short elastic cylindrical shells under global bending. Thin-Walled Struct. 2018, 124, 574–587. [Google Scholar] [CrossRef]
- Wang, J.; Sadowski, A.J. Elastic imperfect tip-loaded cantilever cylinders of varying length. Int. J. Mech. Sci. 2018, 140, 200–210. [Google Scholar] [CrossRef]


| Researchers | Component Form | Stress State | Researchers | Component Form | Stress State |
|---|---|---|---|---|---|
| Kuranovas and Kvedaras [18] | H-CFST columns | Axial load | Zhong and Xu [16] | H-CFST columns | Axial load |
| Han et al. [19] | H-CFST columns | Axial load | Ritchie et al. [20] | H-CFST columns | Blast loading |
| Wang et al. [21] | H-CFST columns | Lateral impact | Yu et al. [22] | (H)CFST columns | Axial |
| Ouyang et al. [23] | CFST columns | Axial load | Ekmekyapar et al. [24] | CFST columns | Axial load |
| Han et al. [25] | CFST columns | Pure torsion | Uenaka and Mizukoshi [14] | CFST beams | Bending-shear |
| Zhang et al. [26] | CFST beams | Axial load | Guo et al. [27] | CFST beams | Axial load |
| Mizan et al. [28] | CFDST columns | Axial load | Wang et al. [29] | CFDST columns | Pure torsion |
| Material | Elastic Modulus/GPa | Tensile Strength/MPa | Compressive Strength/MPa | Density/ (kN/m3) |
|---|---|---|---|---|
| Q235B circular steel tube | 200.0 | 235.0 | 235.0 | 78.5 |
| C80 concrete | 38.0 | 2.2 | 50.2 | 24.5 |
| HRB400 rebar | 200.0 | 400.0 | / | 78.5 |
| H-CFST Component | Hoop | Column | FEA Model | EXP | |
|---|---|---|---|---|---|
| The load determining the bending capacity, kN | 130.62 | 477.05 | 293.56 | 147.18 | 150.00 |
Disclaimer/Publisher’s Note: The statements, opinions and data contained in all publications are solely those of the individual author(s) and contributor(s) and not of MDPI and/or the editor(s). MDPI and/or the editor(s) disclaim responsibility for any injury to people or property resulting from any ideas, methods, instructions or products referred to in the content. |
© 2023 by the authors. Licensee MDPI, Basel, Switzerland. This article is an open access article distributed under the terms and conditions of the Creative Commons Attribution (CC BY) license (https://creativecommons.org/licenses/by/4.0/).
Share and Cite
Dong, Z.; Peng, H.; Wang, K.; Liu, T. Performance of Prefabricated Hollow Concrete-Filled Steel Tube Bracings on Transverse Bending: Experimental and Numerical Analyses. J. Mar. Sci. Eng. 2023, 11, 2009. https://doi.org/10.3390/jmse11102009
Dong Z, Peng H, Wang K, Liu T. Performance of Prefabricated Hollow Concrete-Filled Steel Tube Bracings on Transverse Bending: Experimental and Numerical Analyses. Journal of Marine Science and Engineering. 2023; 11(10):2009. https://doi.org/10.3390/jmse11102009
Chicago/Turabian StyleDong, Zizhang, Huadong Peng, Kun Wang, and Tao Liu. 2023. "Performance of Prefabricated Hollow Concrete-Filled Steel Tube Bracings on Transverse Bending: Experimental and Numerical Analyses" Journal of Marine Science and Engineering 11, no. 10: 2009. https://doi.org/10.3390/jmse11102009