Article

Effect of Relative Stiffness of Pile and Soil on Pile Group Effect

1
Key Laboratory of Earthquake Engineering and Engineering Vibration, Institute of Engineering Mechanics, China Earthquake Administration, Key Laboratory of Earthquake Disaster Mitigation, Ministry of Emergency Management, Harbin 150080, China
2
School of Civil Engineering, Yantai University, Yantai 264005, China
3
Department of Civil and Environmental Engineering, University of Alberta, Edmonton, AB T6G 2R3, Canada
*
Authors to whom correspondence should be addressed.
J. Mar. Sci. Eng. 2023, 11(1), 192; https://doi.org/10.3390/jmse11010192
Submission received: 16 December 2022 / Revised: 4 January 2023 / Accepted: 10 January 2023 / Published: 12 January 2023
(This article belongs to the Special Issue Advances in Offshore Geotechnics)

Abstract

:
Pile groups are designed to sustain complex loads in various engineering. During the design of a pile group, the obvious pile group effect should be considered for closely spaced pile groups. However, the group effect considered by different scholars varies, which makes it hard for engineers to consider the pile group effect for the design of a pile group. In this study, the finite element (FE) method is proposed to advance our understanding of the variations of pile group effects developed by different researchers, based on the concept of soil–pile relative stiffness. The relationship between soil–pile relative stiffness and normalized lateral load–displacement curves and bending moment profile response of the pile group is investigated. The results show that the pile group effect increases with the increase in soil–pile relative stiffness; the pile group effect increases with the decrease in pile spacing, increases with the increase in of number of piles in the group, and is significantly affected by pile group arrangement as well.

1. Introduction

Pile foundations are designed to support wharfs due to the advantage of transmitting the load from deck to deep stable soils. In addition to the vertical load, the piles of wharf also bear the lateral loads caused by wind, waves, and earthquakes during the serviceability [1,2]. In practical engineering, a group of piles instead of a single pile is widely used to resist the aforementioned lateral loads [3,4,5,6,7,8]. Past studies have illustrated that the piles in a group interact in such a way that their performance under loading is altered. This phenomenon is defined as pile group effect, which is caused by the overlapping of stress and strain zones of neighboring piles in the group. The pile group effect could cause a reduction in the lateral resistance of piles in a group compared to a single pile.
There are two methods to account for pile group effect, i.e., pile group efficiency and p-multipliers method. Pile group efficiency is defined as the average lateral load capacity per pile in a group divided by the lateral capacity of a single pile. By this approach, the group load is scaled down, relative to what would be expected for independent single piles by the efficiency factor, while the p-multiplier is an empirical reduction factor for p-y curves used to account for the loss of soil resistance, which is developed by Brown et al. [9]. It should be noted that the essence of these two methods is the same, both of which use reduction factors to scale down the response of a single pile to mimic the individual pile response in a group.
Since the concept of p-multiplier is simple and easy to be used, this method was quickly accepted by the engineering industry and is widely used in North America. The research indicates the p-multiplier varies at the row position in the pile group [10,11,12]. In particular, the p-multipliers of the leading row have a higher value than that of the trailing row. However, the direction of seismic and cyclic load is a potential reason that causes changes in p-multipliers, since the leading row will become the trailing row when the direction of lateral load reverses. Therefore, the p-multiplier developed based on the row in a pile group has its own bottleneck in considering the cyclic load.
Recently, the average p-multiplier for pile group, rather than that of row by row, is proposed to solve that issue. Fayyazi et al. [13] summarized group reduction factors obtained from the previous field tests and centrifuge tests, which are listed in Table 1. According to Table 1, the main factors affecting the pile group effect include soil type, pile spacing, number of piles in the group, and pile arrangement; although eight 3 × 3 pile group full scale field tests are equal to three times the pile diameter, the group reduction factors resulted from these tests are not equal (ranging from 0.34 to 0.87), which still confuses the engineer when choosing reasonable group reduction factors for the pile group design. Therefore, there is still an urgent need to further understand the factors that influence the pile group effect, which should be beneficial to the pile group design.
In this study, the variation in group reduction factors, based on the conception of relative soil–pile stiffness, is addressed. Firstly, several finite element (FE) models of single pile and pile group are created and verified. Secondly, the load–displacement curves and bending moment profile for pile group are normalized by that of the maximum response of a single pile. Lastly, pile group efficiency was calculated; the relationship between soil–pile relative stiffness and the normalized response of the pile group for various spacing, number of piles, and pile group arrangement are used to analyze the relationship between soil–pile relative stiffness and group effect.

2. Description of the Numerical Model

In this section, the FE models of one single pile and one pile group are created for two full scale field tests using OpenSees, which is an object-oriented, open-source FE analysis framework [26], and has been widely used in geotechnical earthquake engineering [27,28,29,30]. To validate the FE model, the results of FE models are compared to data available from the full scale field tests. We are using the data from a field test provided by Walsh [3] to validate the model [22]. The field tests and FE models are briefly introduced as follows.

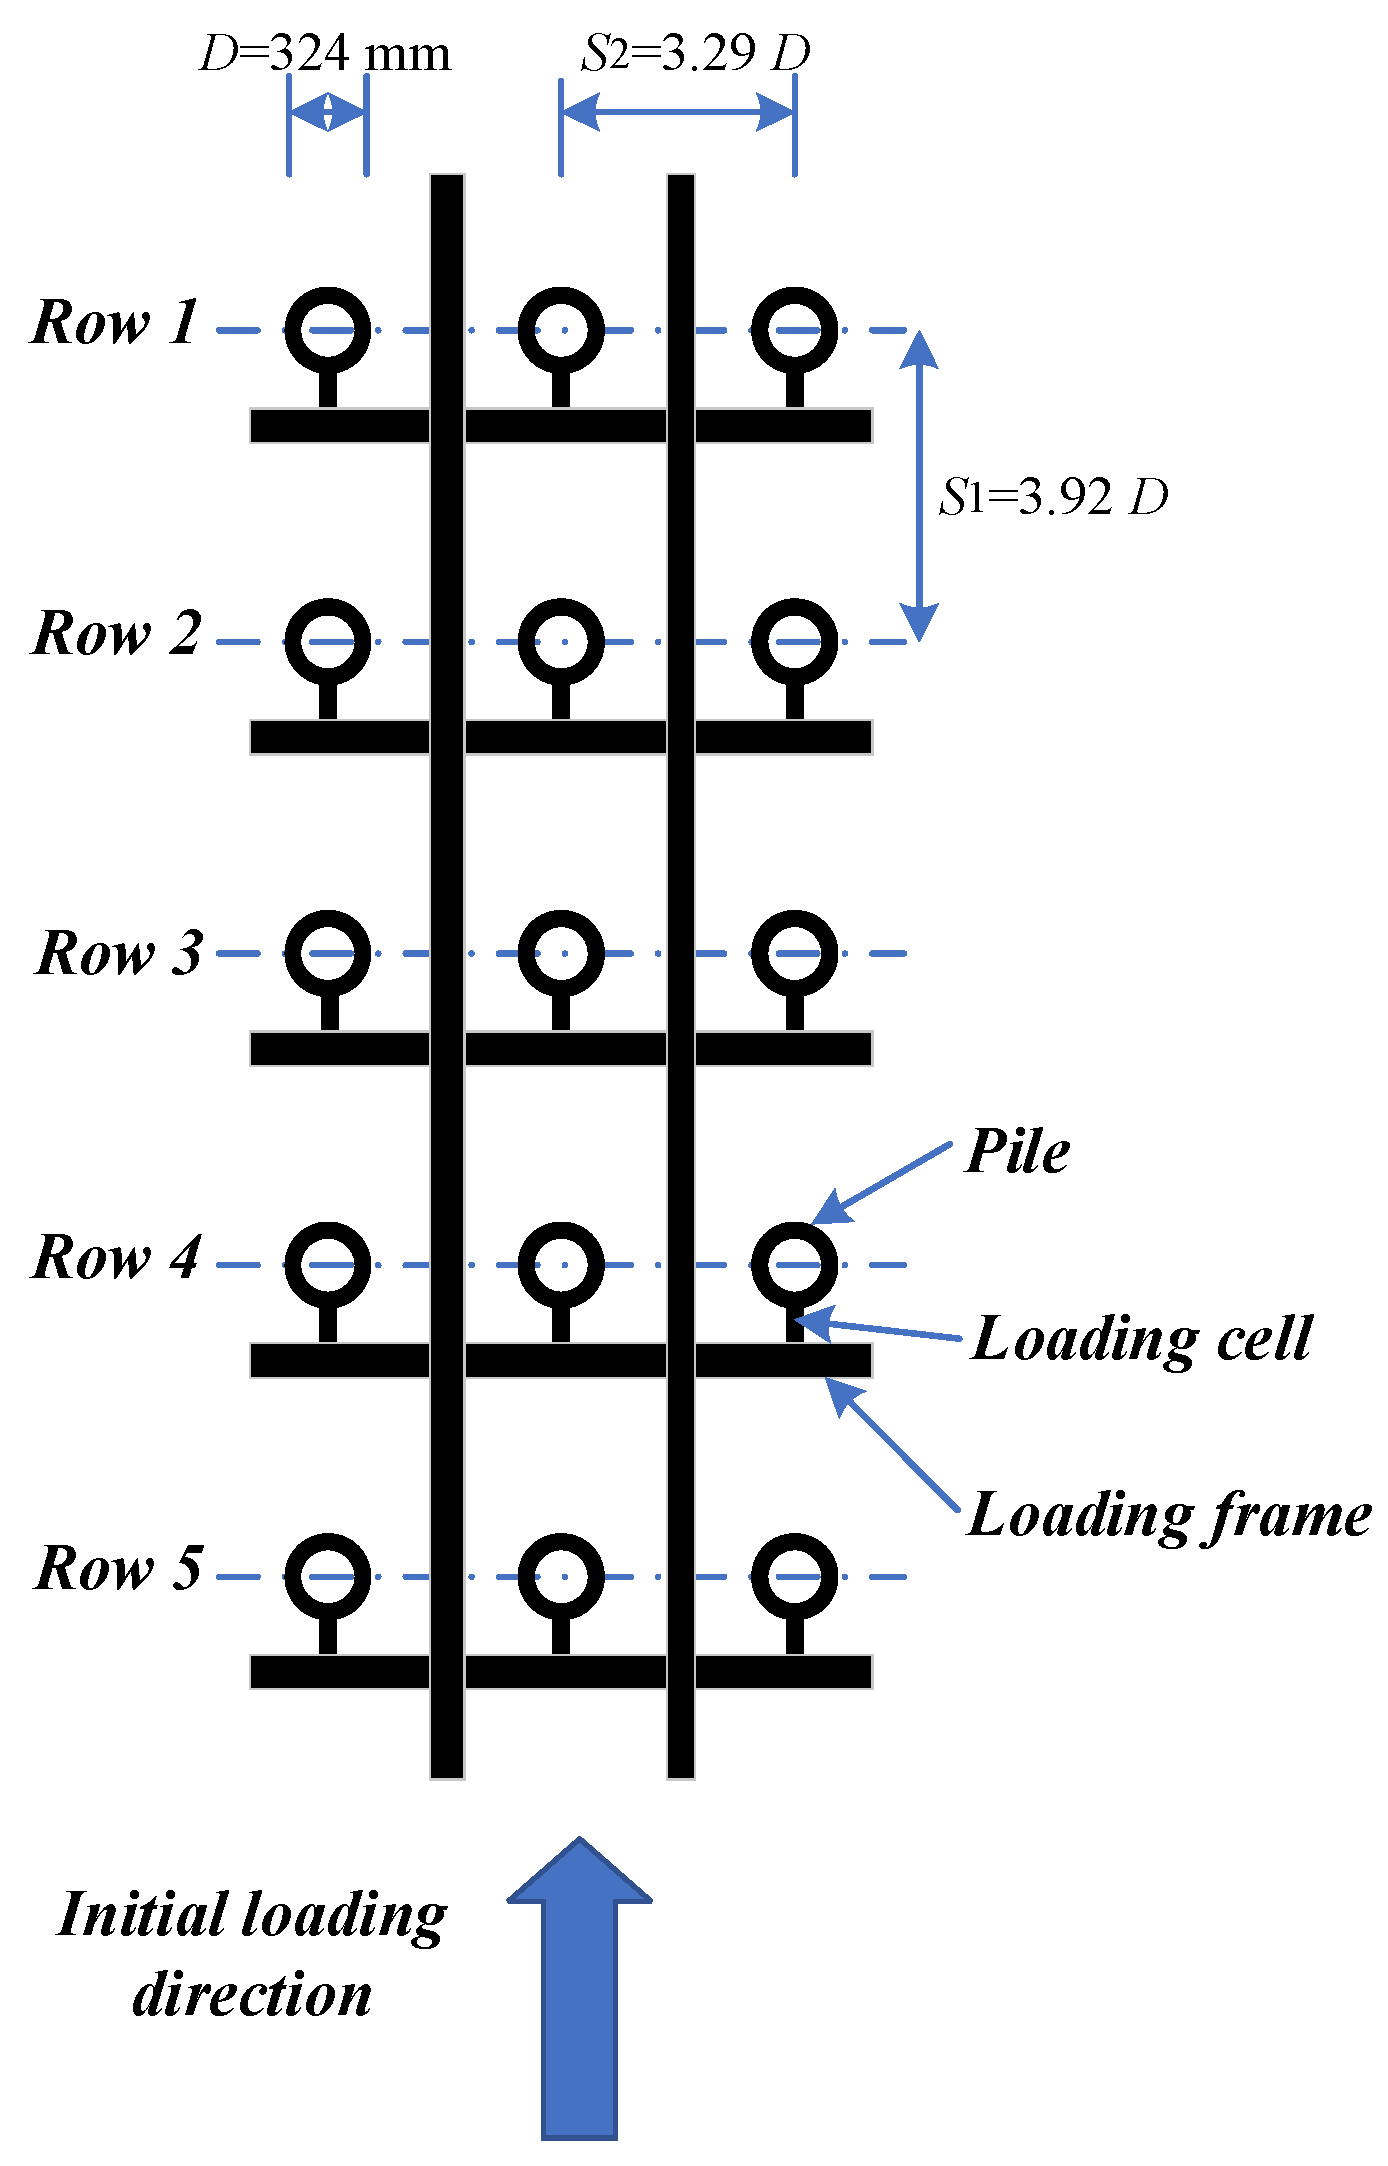
2.1. Brief Description of Field Test

The 5 × 3 pile group experimental setup conducted by Walsh [22] is shown in Figure 1. All the piles are made of steel tubes whose outer diameter, D, is 324 mm; the moment of inertia of the tested pile (including pipe and angle iron) is 1.43 × 108 mm4. The length of piles used in the field test was 13.683 m, including 13.2 m of the buried parts and 0.483 m of the above-ground surface parts. The pile spacing along the loading direction is 3.92 × D, where D is the pile diameter and the pile spacing perpendicular to the loading direction is 3.29 × D. No pile cap is adopted in the pile group test, the pile head can be considered as free; no bending moment is produced during the loading process. Displacement-based loading method is used in the field test for both the single pile and pile group. Multi-stage target displacements are applied on the pile head, and the target displacements at each stage are repeated ten times. According to the cone penetrometer test, the idealized subsurface profile is refilled sand (0–2.4 m), soft clay (2.4–4.6 m), sand (4.6–6.3 m), soft clay (6.3–8 m), and sand. The water level has a depth of 2.1 m.

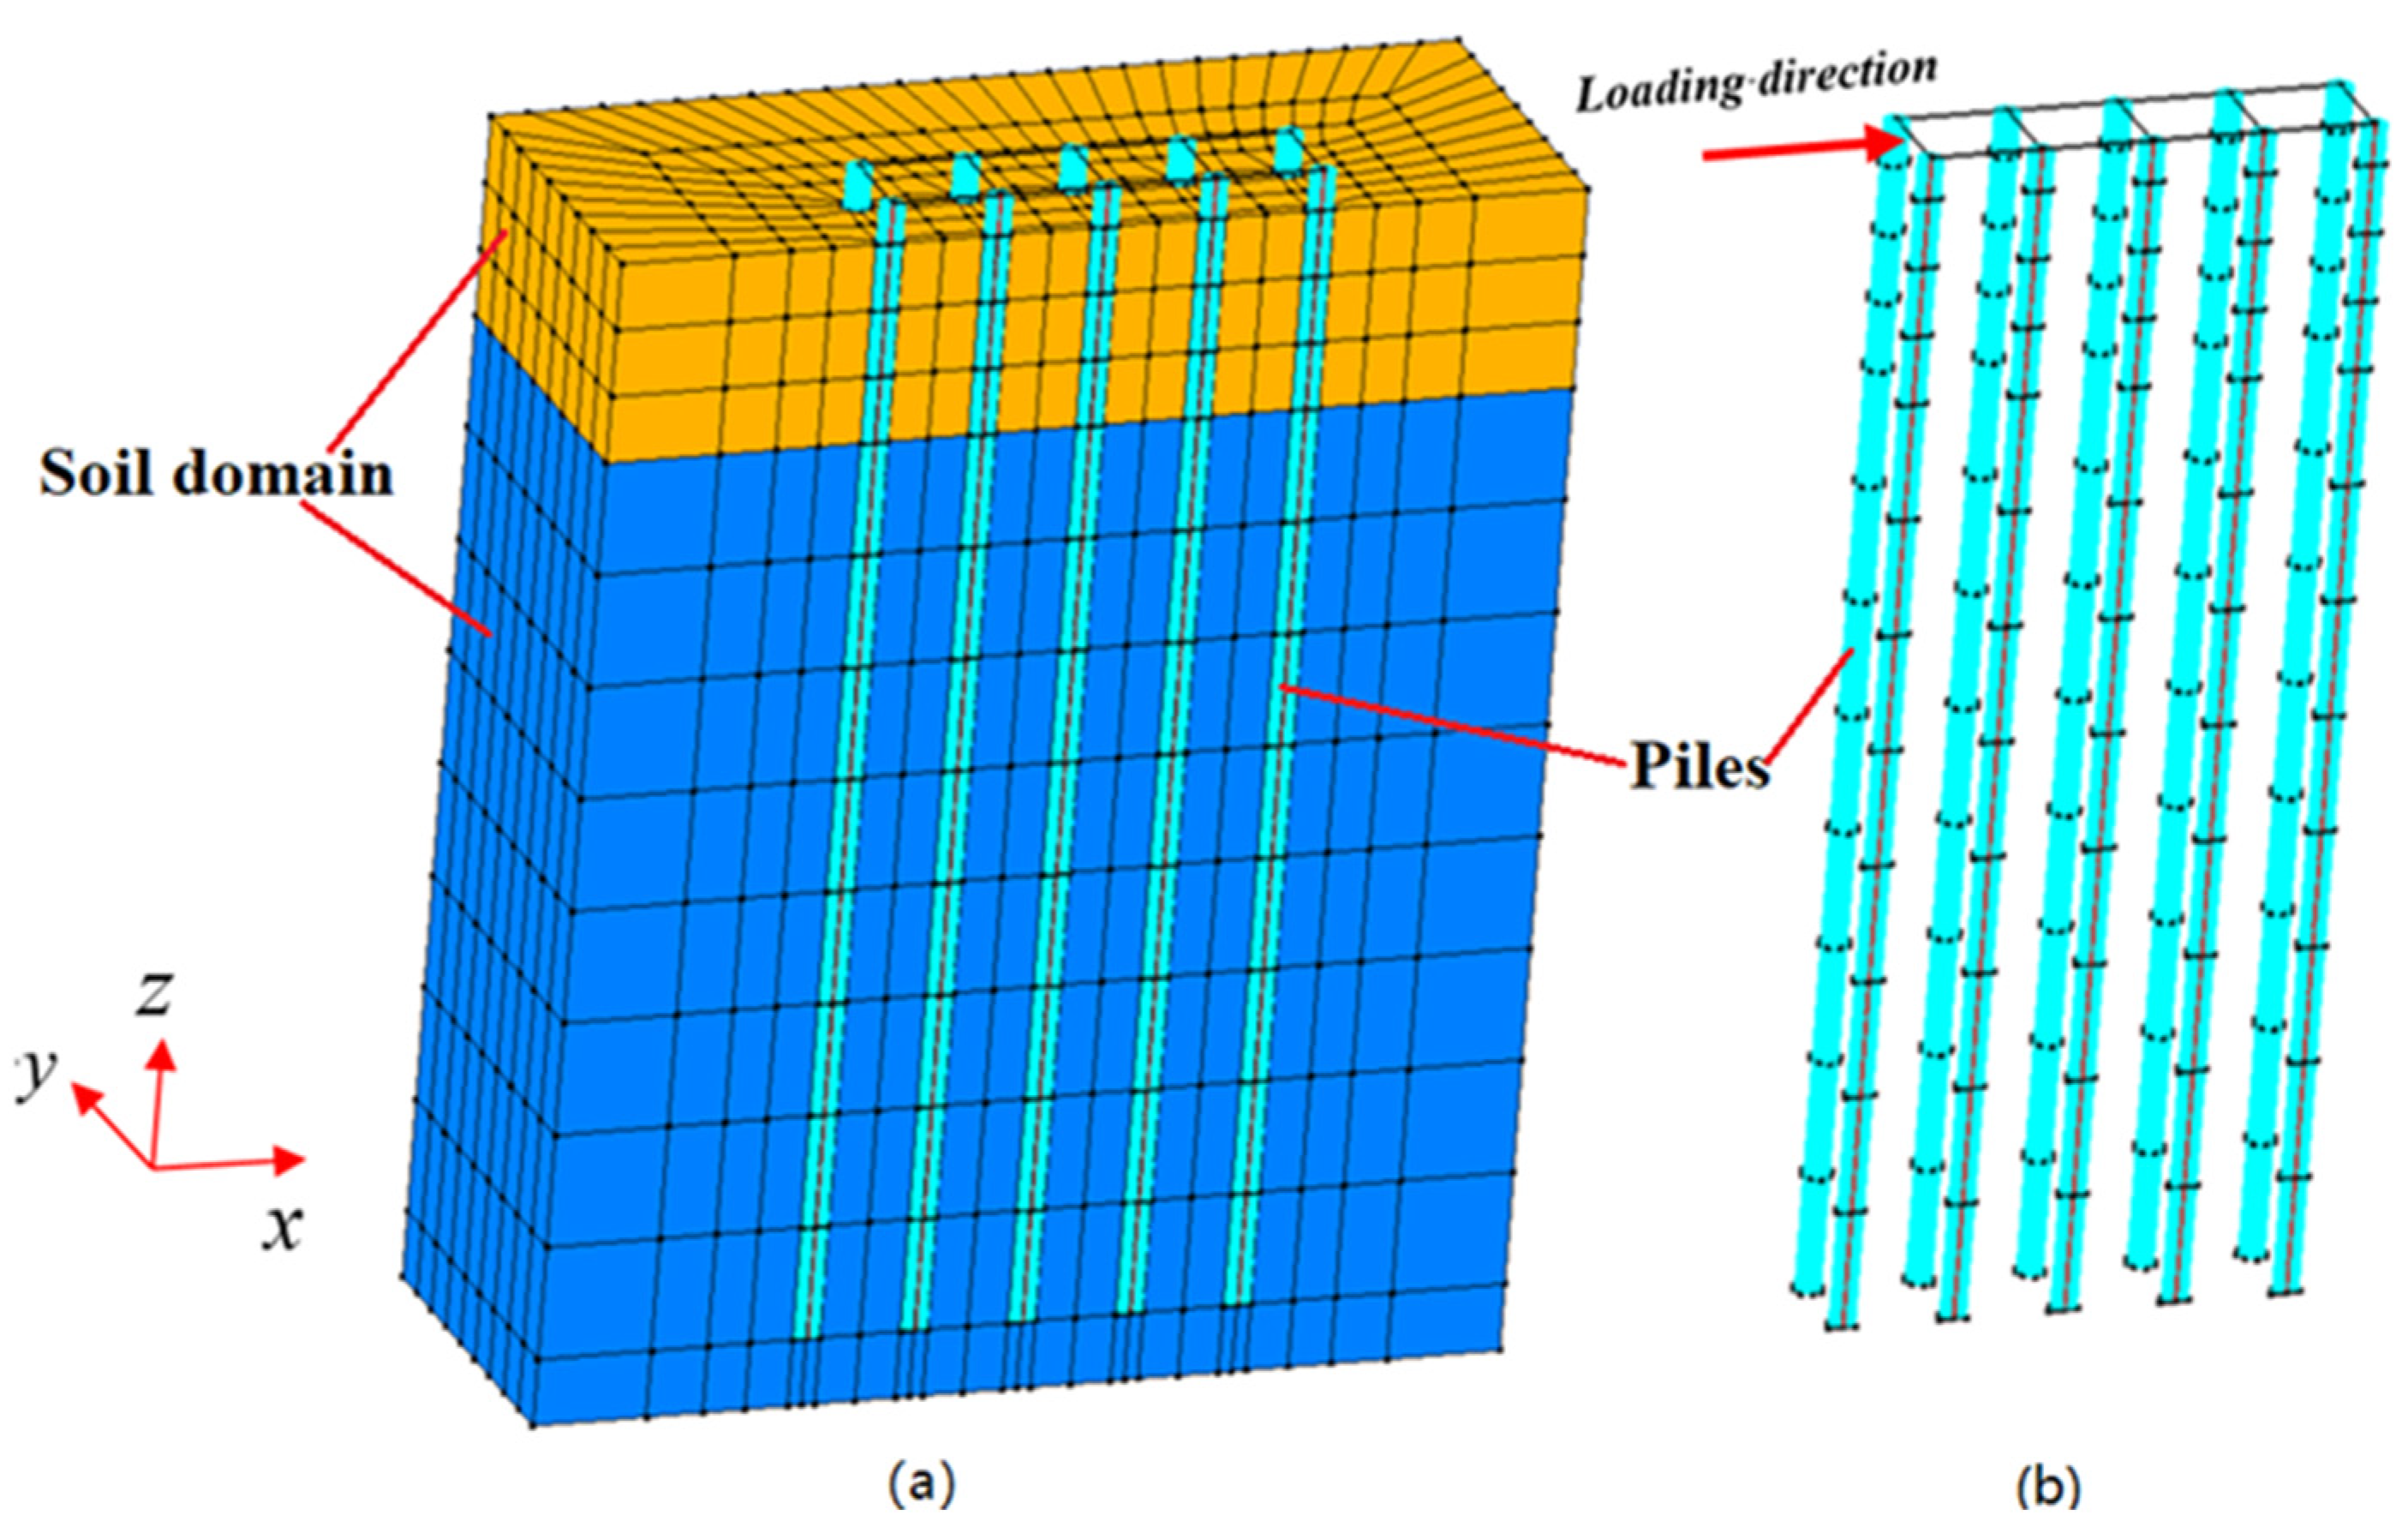
2.2. Introduction of FE Model

In the FE model, each pile is assumed to be linearly elastic, while the soil exhibits plastic behavior during the lateral loading. Considering the symmetry, only half of the FE model is created and meshed to reduce the computational time. The soil (including sand and clay) is simulated using eight-node brick elements, and the piles in single pile and pile group models are all formulated using beam–column elements (see Figure 2, it should be noted the size of this model is smaller than that used for analysis, this model is just used for showing the process of model building). Due to the dimensionless of the beam–column, the rigid links (beam–column elements, 104 stiffer than that of pile) perpendicular to the pile are used to consider the size effect of the pile in the FE model. The length of rigid link is the same with pile radius (162 mm), and eight links were set around each pile node [31,32]. Due to the piles in the group being pinned connected (no bending moments), the lateral load is applied on the pile head using a displacement-based method. In the numerical model, the pile head of the group is free, and the lateral load is imposed on the pile head of each pile in the group equally using a displacement-based method, which can mimic the tested condition approximately. It should be noted that, in the numerical model, the lateral load is also applied in a static way; thus, no inertial force is produced when the lateral load is applied.
The length, width, and height of the numerical models used in the analysis are 120 m, 60 m (half-mesh), and 20 m, respectively, and it is made sure the piles are far away from the side boundary (farther than 7 diameters) to avoid interaction. In addition, the distance from the pile tip to the bottom boundary is 6.8 m (larger than 8 diameters). According to Brown et al., the depth of the soil layer affected by the lateral load can be estimated as 10 D (3.24 m in this study). As addressed above, the boundary effect of the FE model can be ignored. The mesh around the pile is refined (40 m) to capture accurate stress distribution. A sensitivity analysis was performed to make sure the element size of the numerical model was small enough, until no significant difference was observed after further refining the mesh. During the field test, the sand collapsed and flowed with the pile when the sand reached its active state. Thus, no gap was formed in the test and no interface elements were adopted in the numerical analysis.
As the soil layer down to a depth of about 10 D (3.24 m) dominates the pile response under lateral load [9], the top two layers (sand and clay, the thickness is 4.6 m in total) are considered to govern the lateral response of piles; in contrast, the soil layers below 4.6 m have no significant effect on pile behavior. For simplicity, it is assumed that a soil layer below 2.4 m has equal material property with the second layer (clay) for simplicity.

2.3. Constitutive Models and Soil Properties

The nonlinear behavior of sand is modeled using a pressure-dependent multi-yield constitutive model (PDMY)) [33,34]. The PDMY material is an elastic–plastic material for simulating the essential response characteristics of pressure-sensitive soil materials under general loading conditions. The pressure-independent multi-yield constitutive model (PIMY) [33,34] is used to simulate the nonlinear response of the clay subject to the lateral load. The PIMY material is an elastic–plastic material, the plasticity is only exhibited in the deviatoric stress–strain response, the volumetric stress–strain response is linear-elastic and independent of deviatoric response. These two constitutive models were validated by Elgamal et al. [22]. The soil properties used in PIMY and PDMY are listed in Table 2.

2.4. Boundary Condition

Based on the fact that the piles were in the center of the FE model, the lateral load was applied on pile head, and the soil domain was large enough; thus, the fixed boundary was used in the numerical model, i.e., the base surface was fixed in all directions, the left, right and back boundaries were fixed in x and y directions, which means the soil domains could only freely deform in the z (vertical) direction. In addition, the front plane was also fixed in the y direction according to the symmetry, which indicates the nodes of soil and piles in the symmetry plane could deform in both longitudinal and vertical directions.

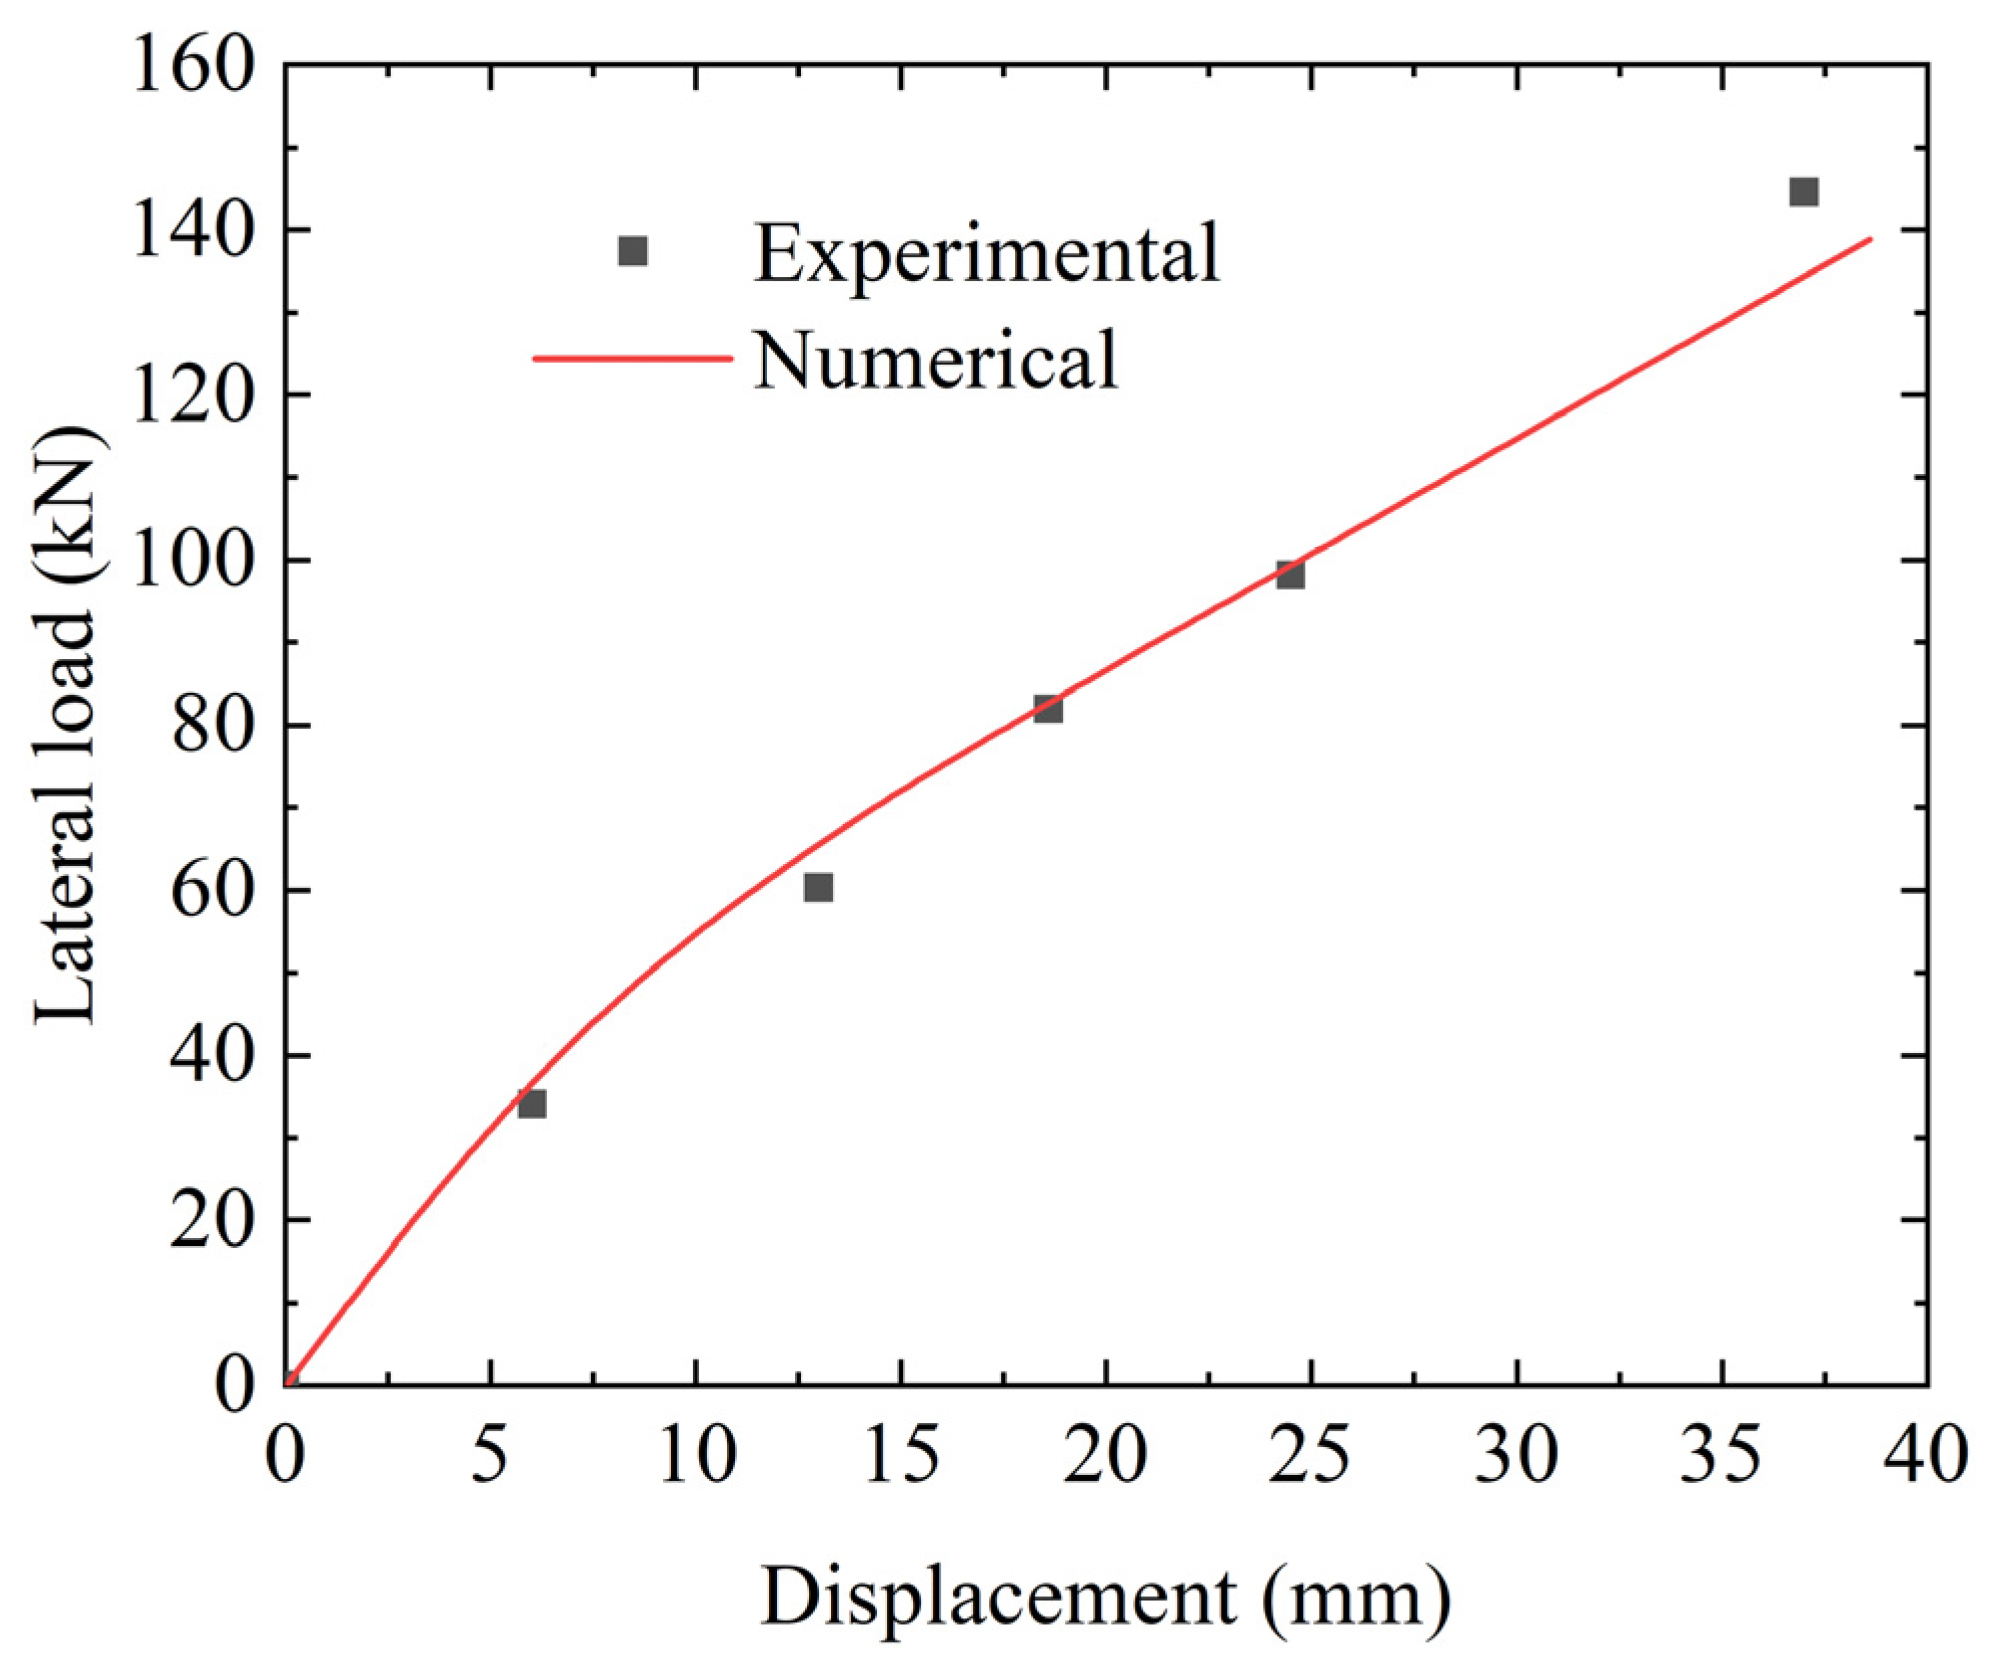
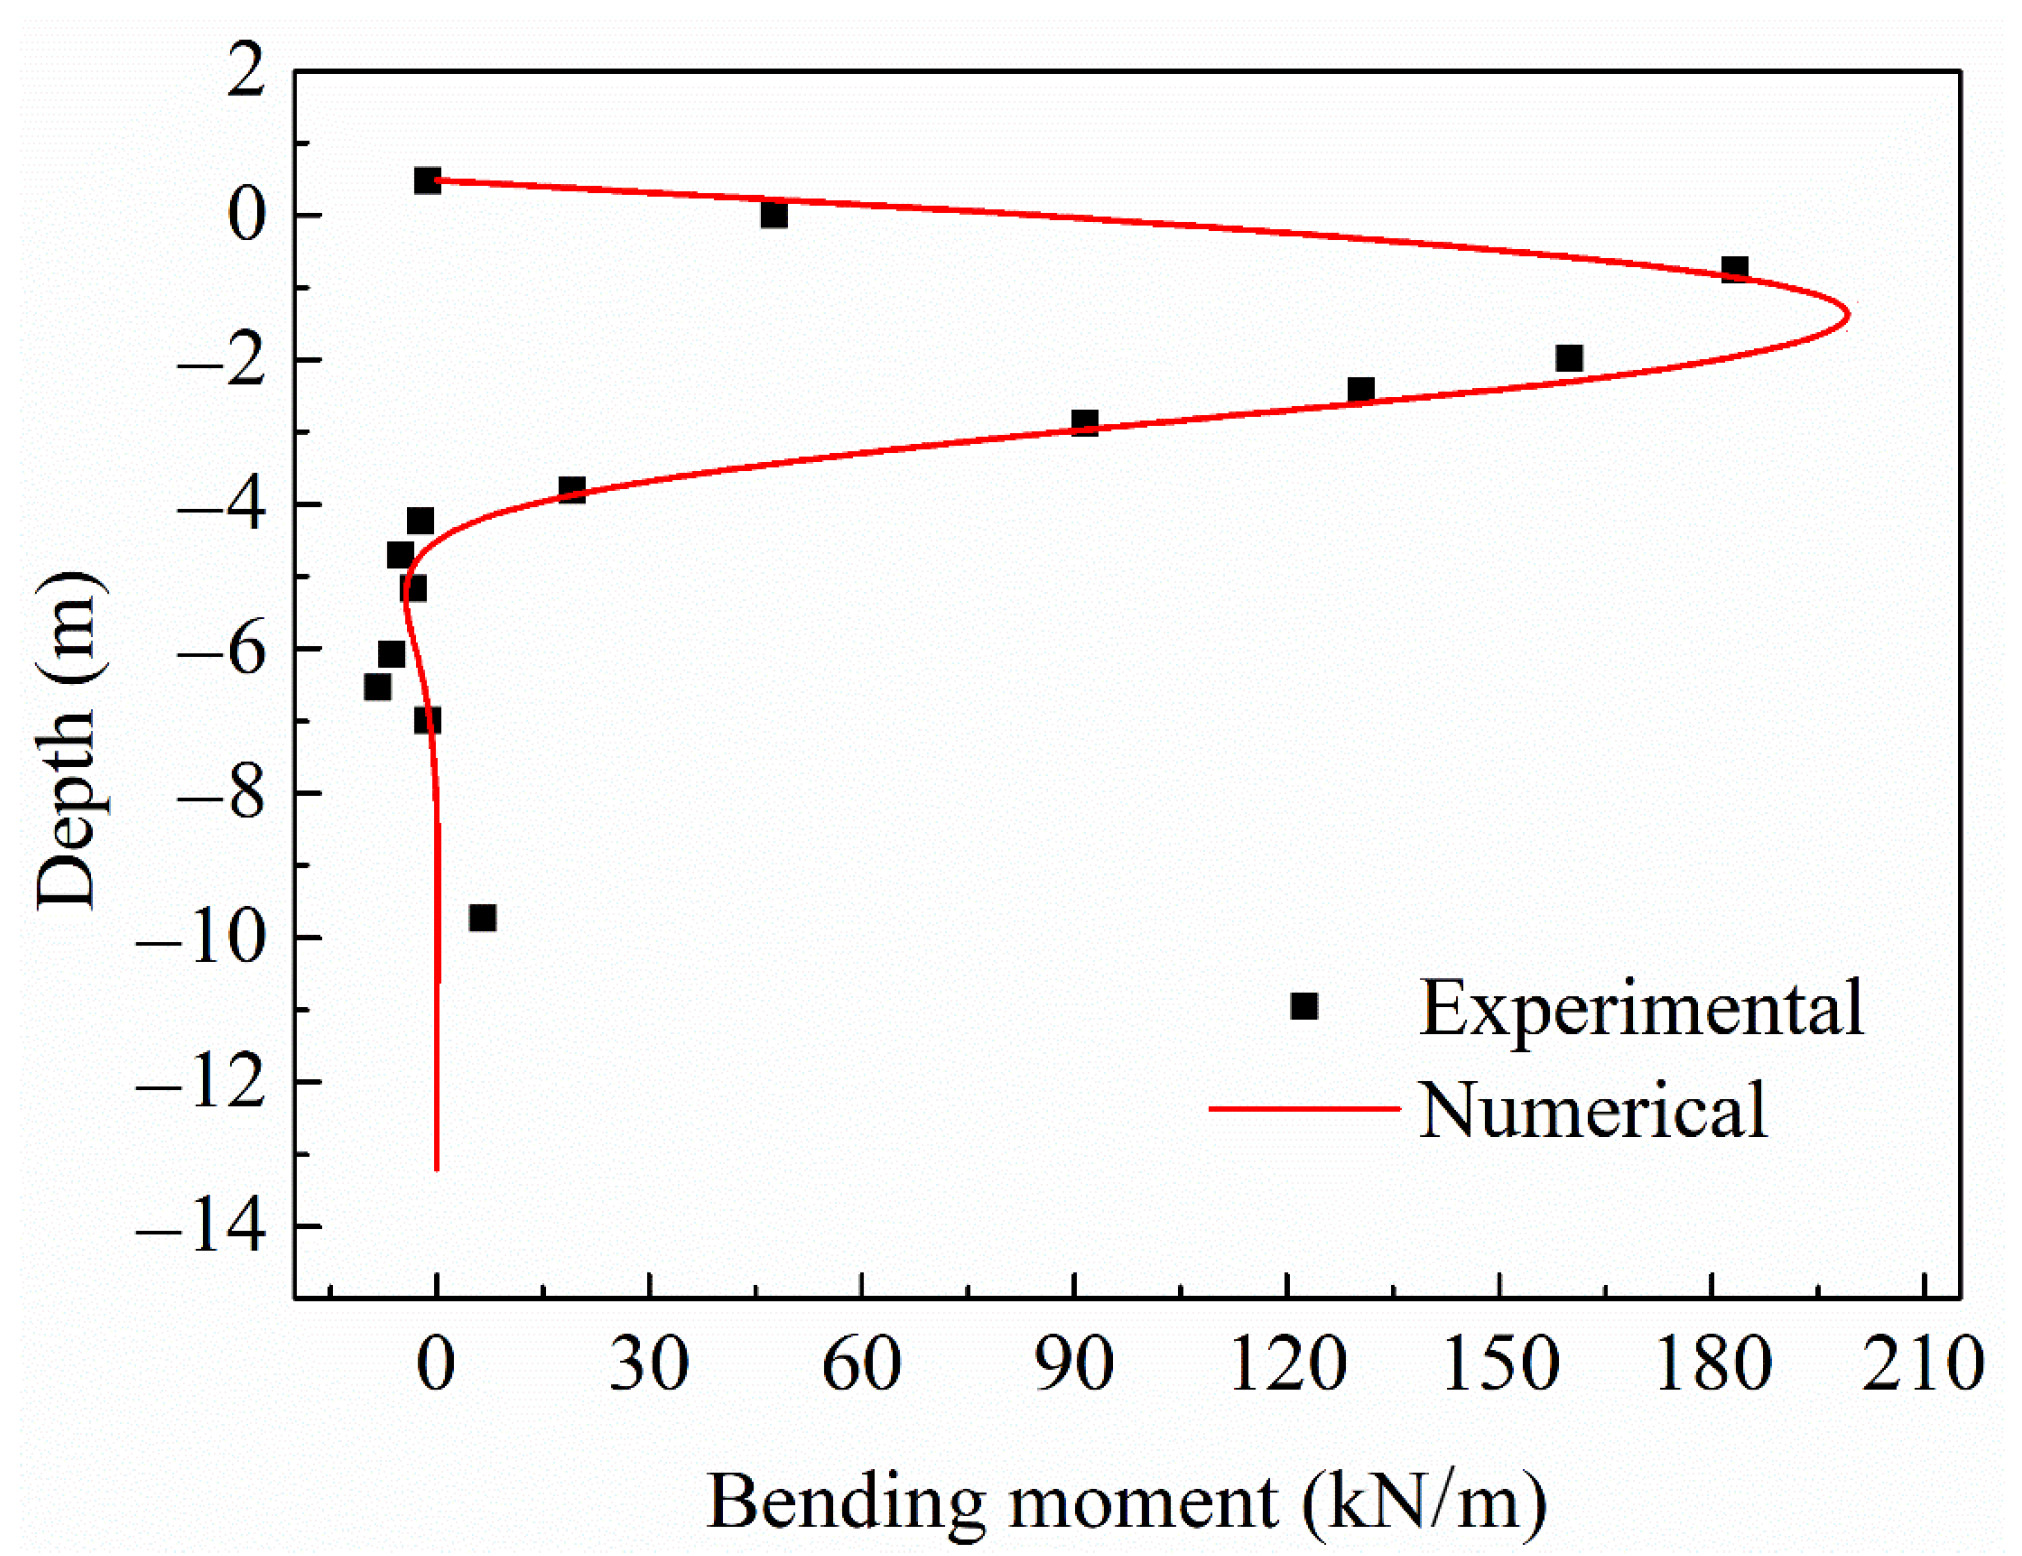
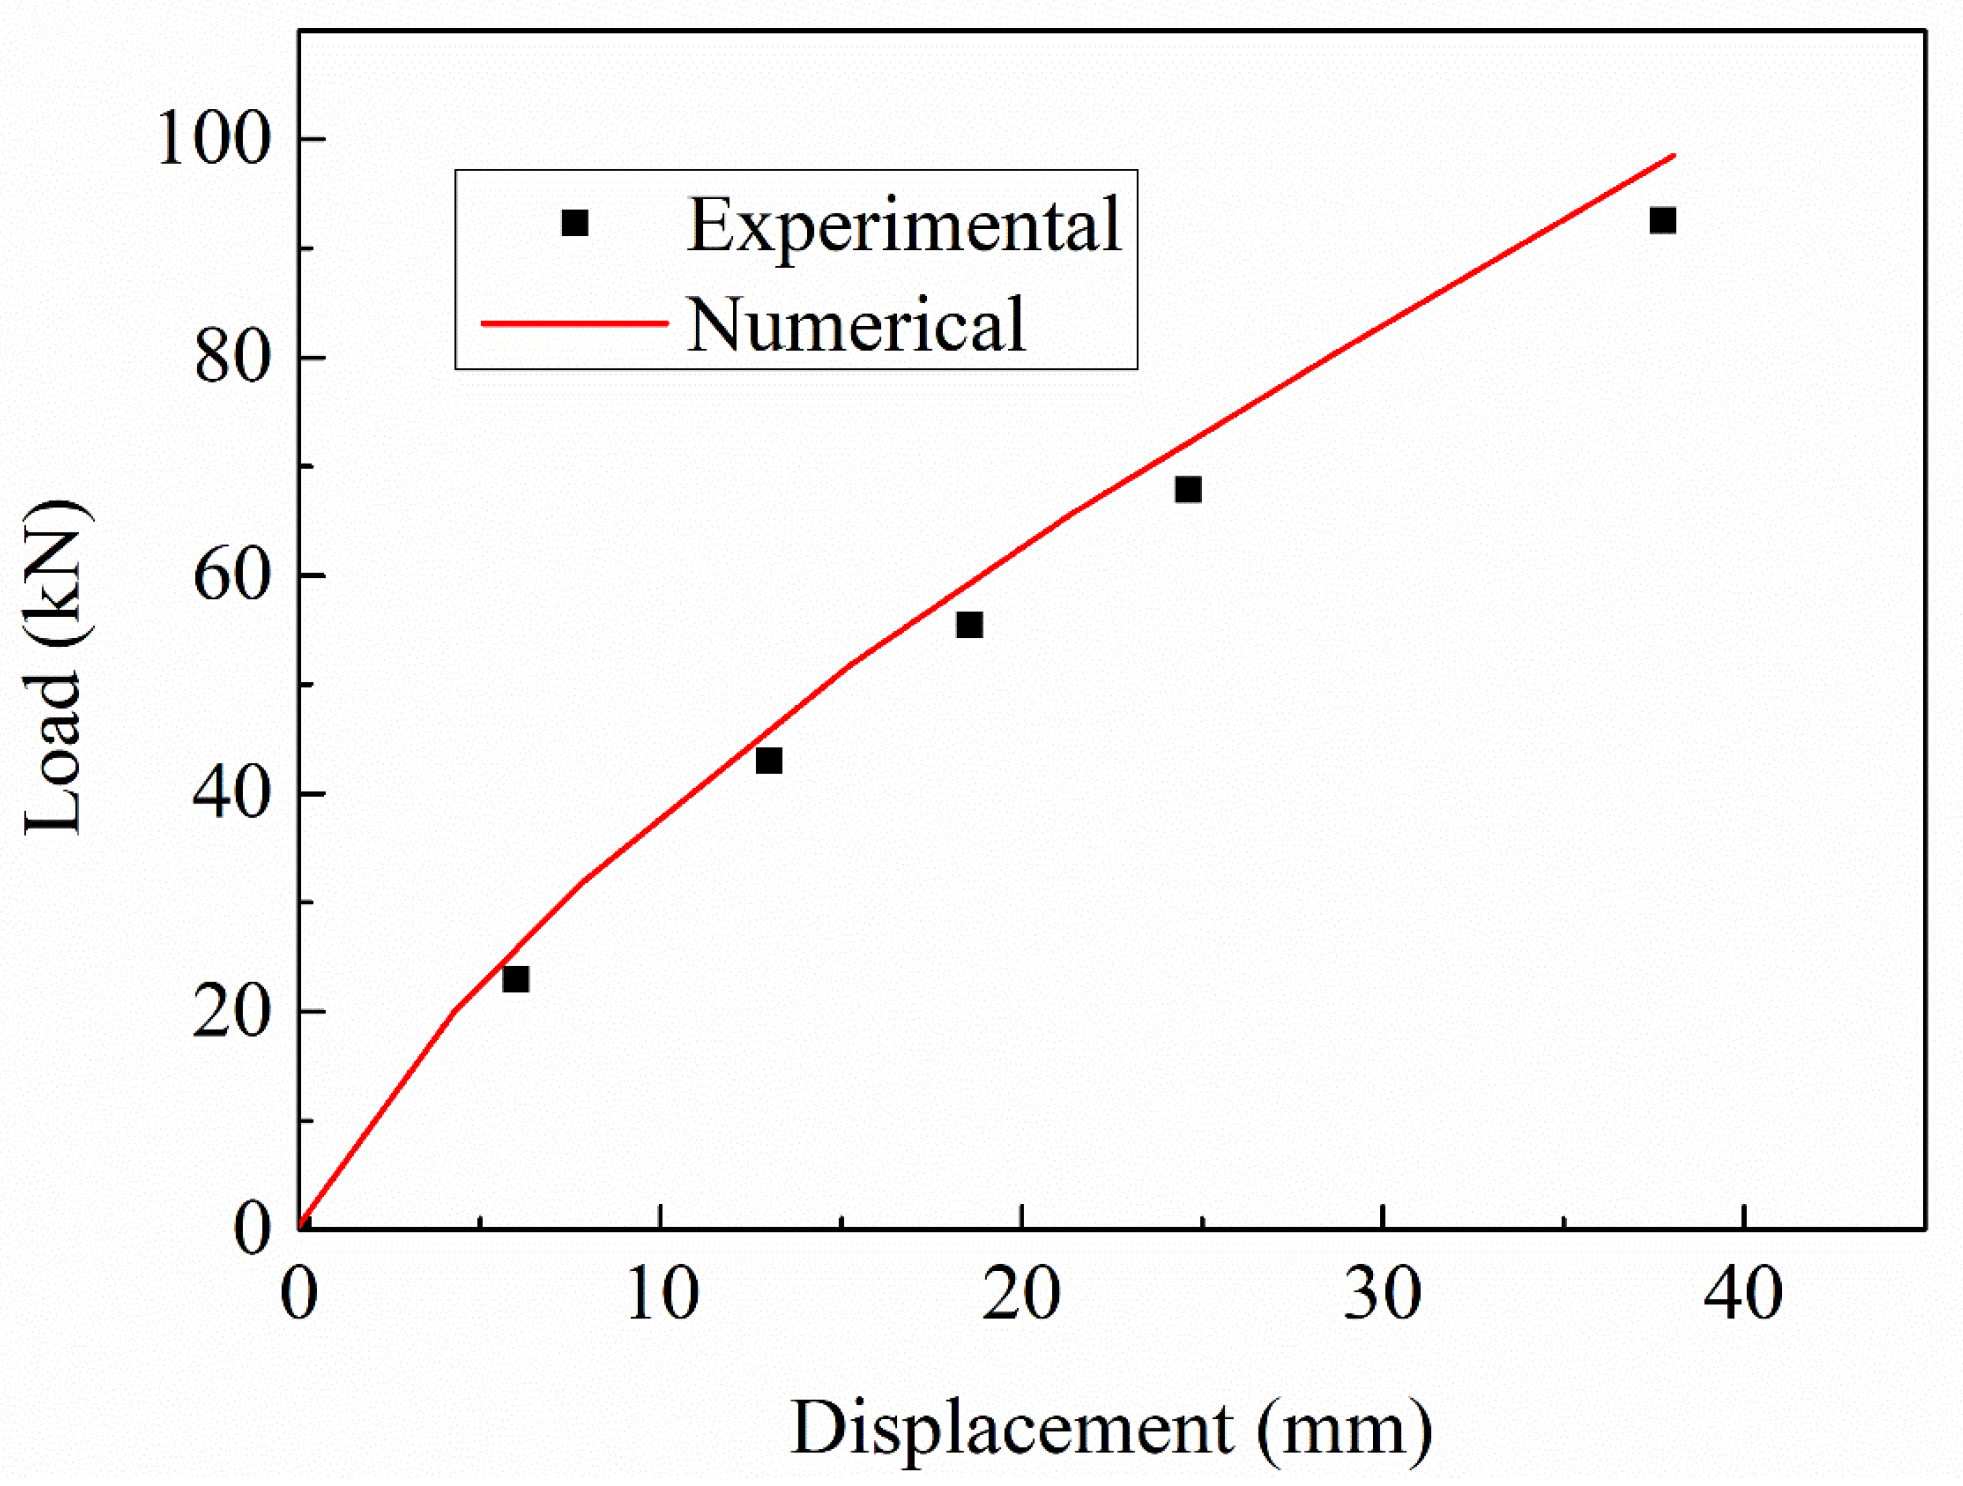
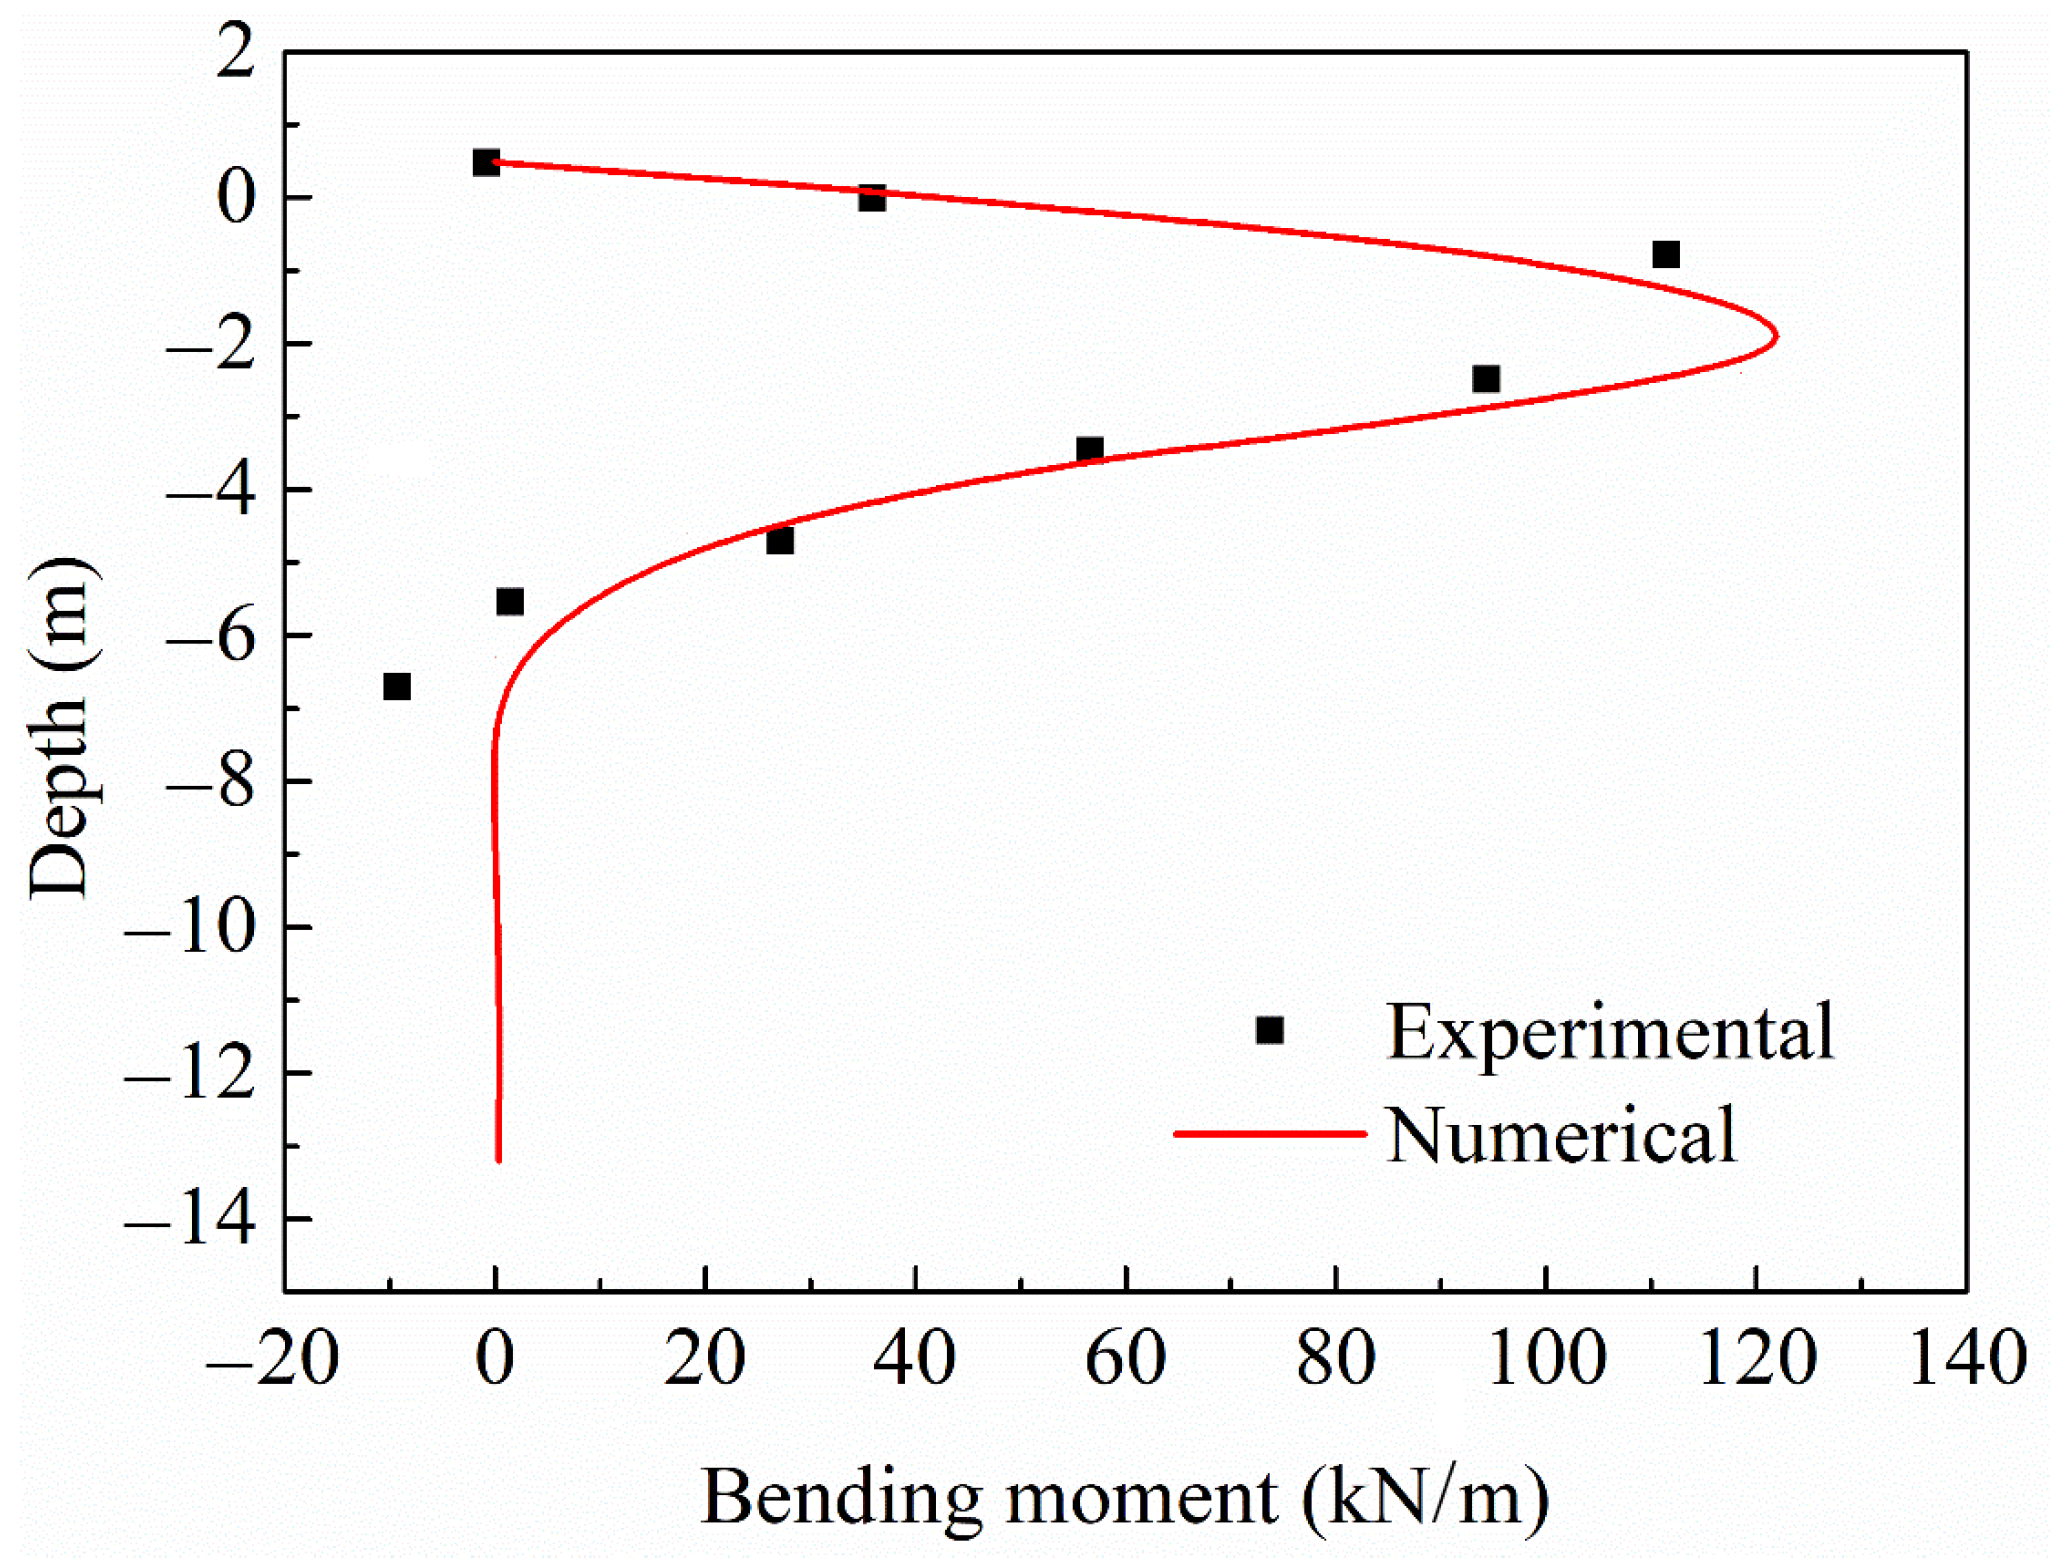
3. Validation of the Numerical Model

The comparisons between the numerical results and the measured data for single piles are shown in Figure 3 and Figure 4. Figure 3 gives the numerical and experimental lateral load versus displacement curves at the pile head. It can be seen that the value of the numerical simulation has a very good agreement with that of the field test. Even at the larger target displacements, the maximum difference between the measured and the numerical results is less than 8%, which is within a reasonable limit in view of the variability of soil properties.
Figure 4 demonstrates the experimental and numerical bending moments profile for the single pile. The numerical maximum bending moment is quite close to the experimental results. Furthermore, the depths of the maximum bending moment and reverse point (the depth of moment from positive to negative) are also quite close for numerical and experimental results. It can be concluded that the numerical results agree well with the measured results, in other words, the numerical model can capture the soil–pile interaction of a single pile under the cyclic lateral load.
In Figure 5, the numerical and experimental average load–displacement curves at the pile head for the 5 × 3 pile group are presented. As can be seen, the numerical calculations achieve good agreements with the experimental results. The maximum error between the numerical and experimental results of average load–displacement response is less than 5%, which is acceptable for the simulation in the geotechnical engineering community. Average bending moment profiles for the pile group at the applied target displacement of 38 mm are depicted in Figure 6. It shows that numerical and experimental results agree well with each other. The gap between numerical and experimental results can be contributed to by the absence of the soil–pile interface in the FE model, which results in the stiffness between the soil and pile being higher than the real value.
In general, the numerical results for both single pile and 5 × 3 pile group matched reasonably well with the experimental data. Hence, the numerical model proposed in this study should be reliable to capture the pile–soil interaction subjected to lateral load. Therefore, it can be used to further investigate the reason for the variations in group reduction factor.

4. Results and Discussion
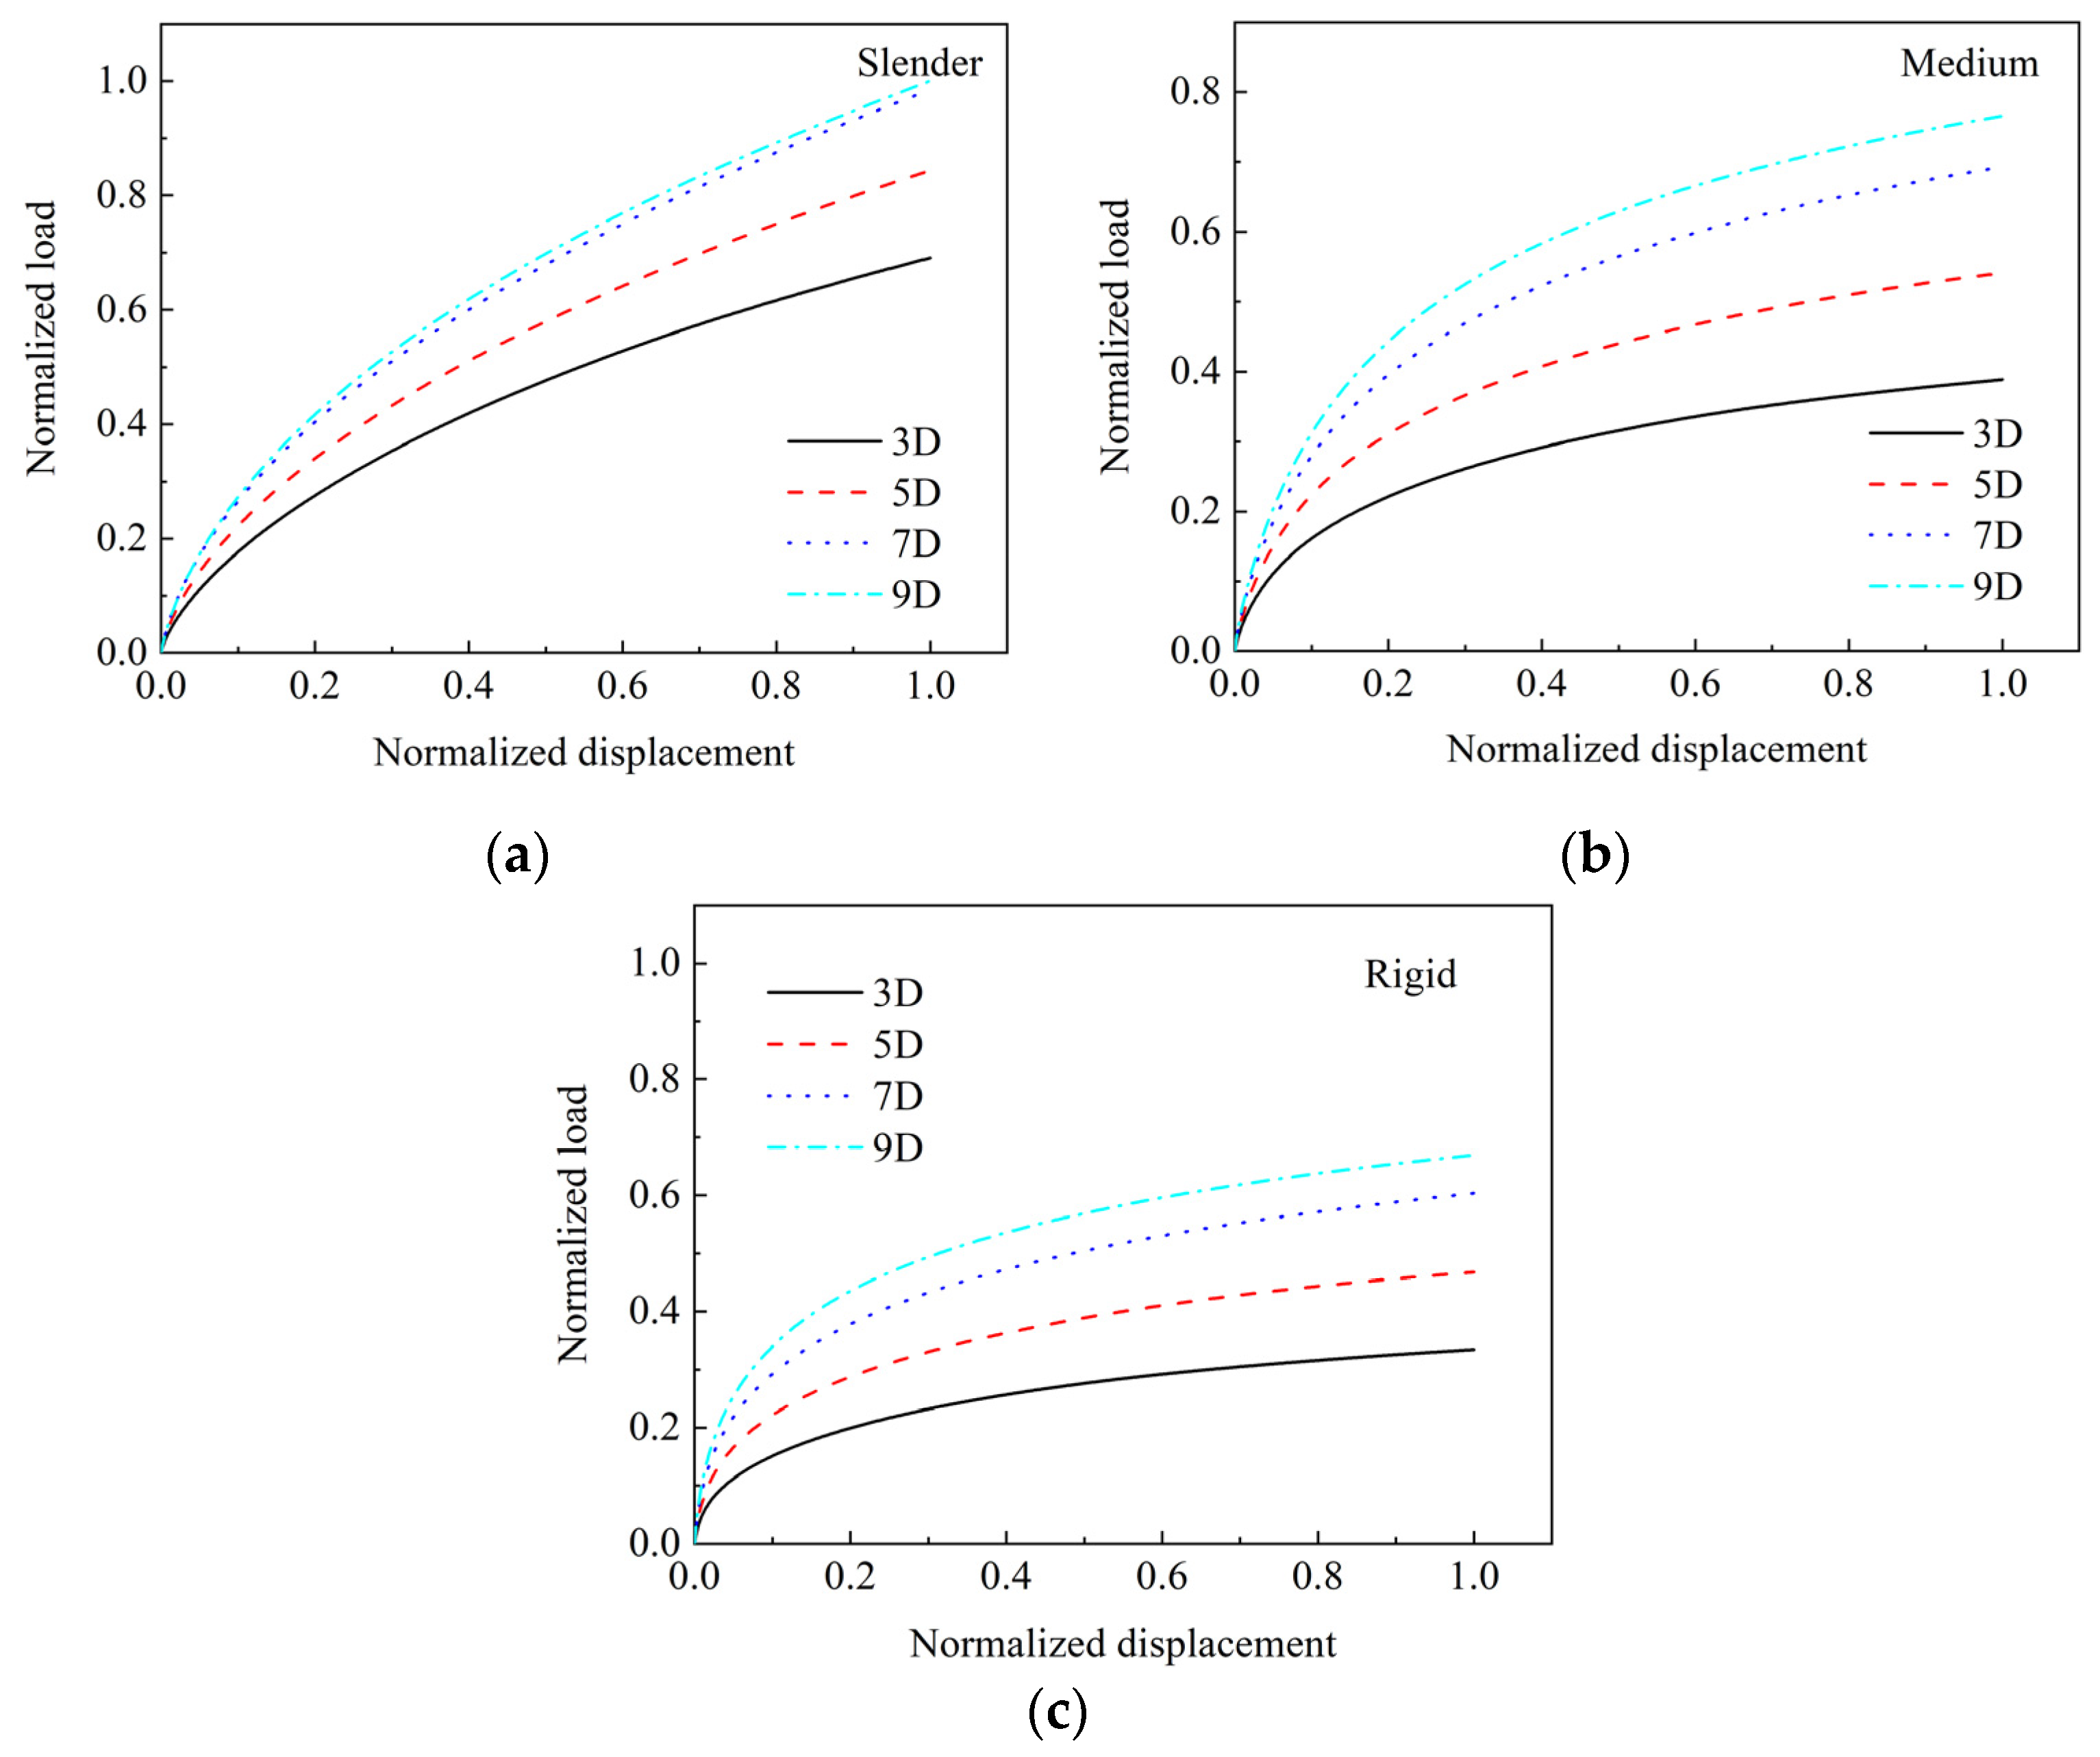
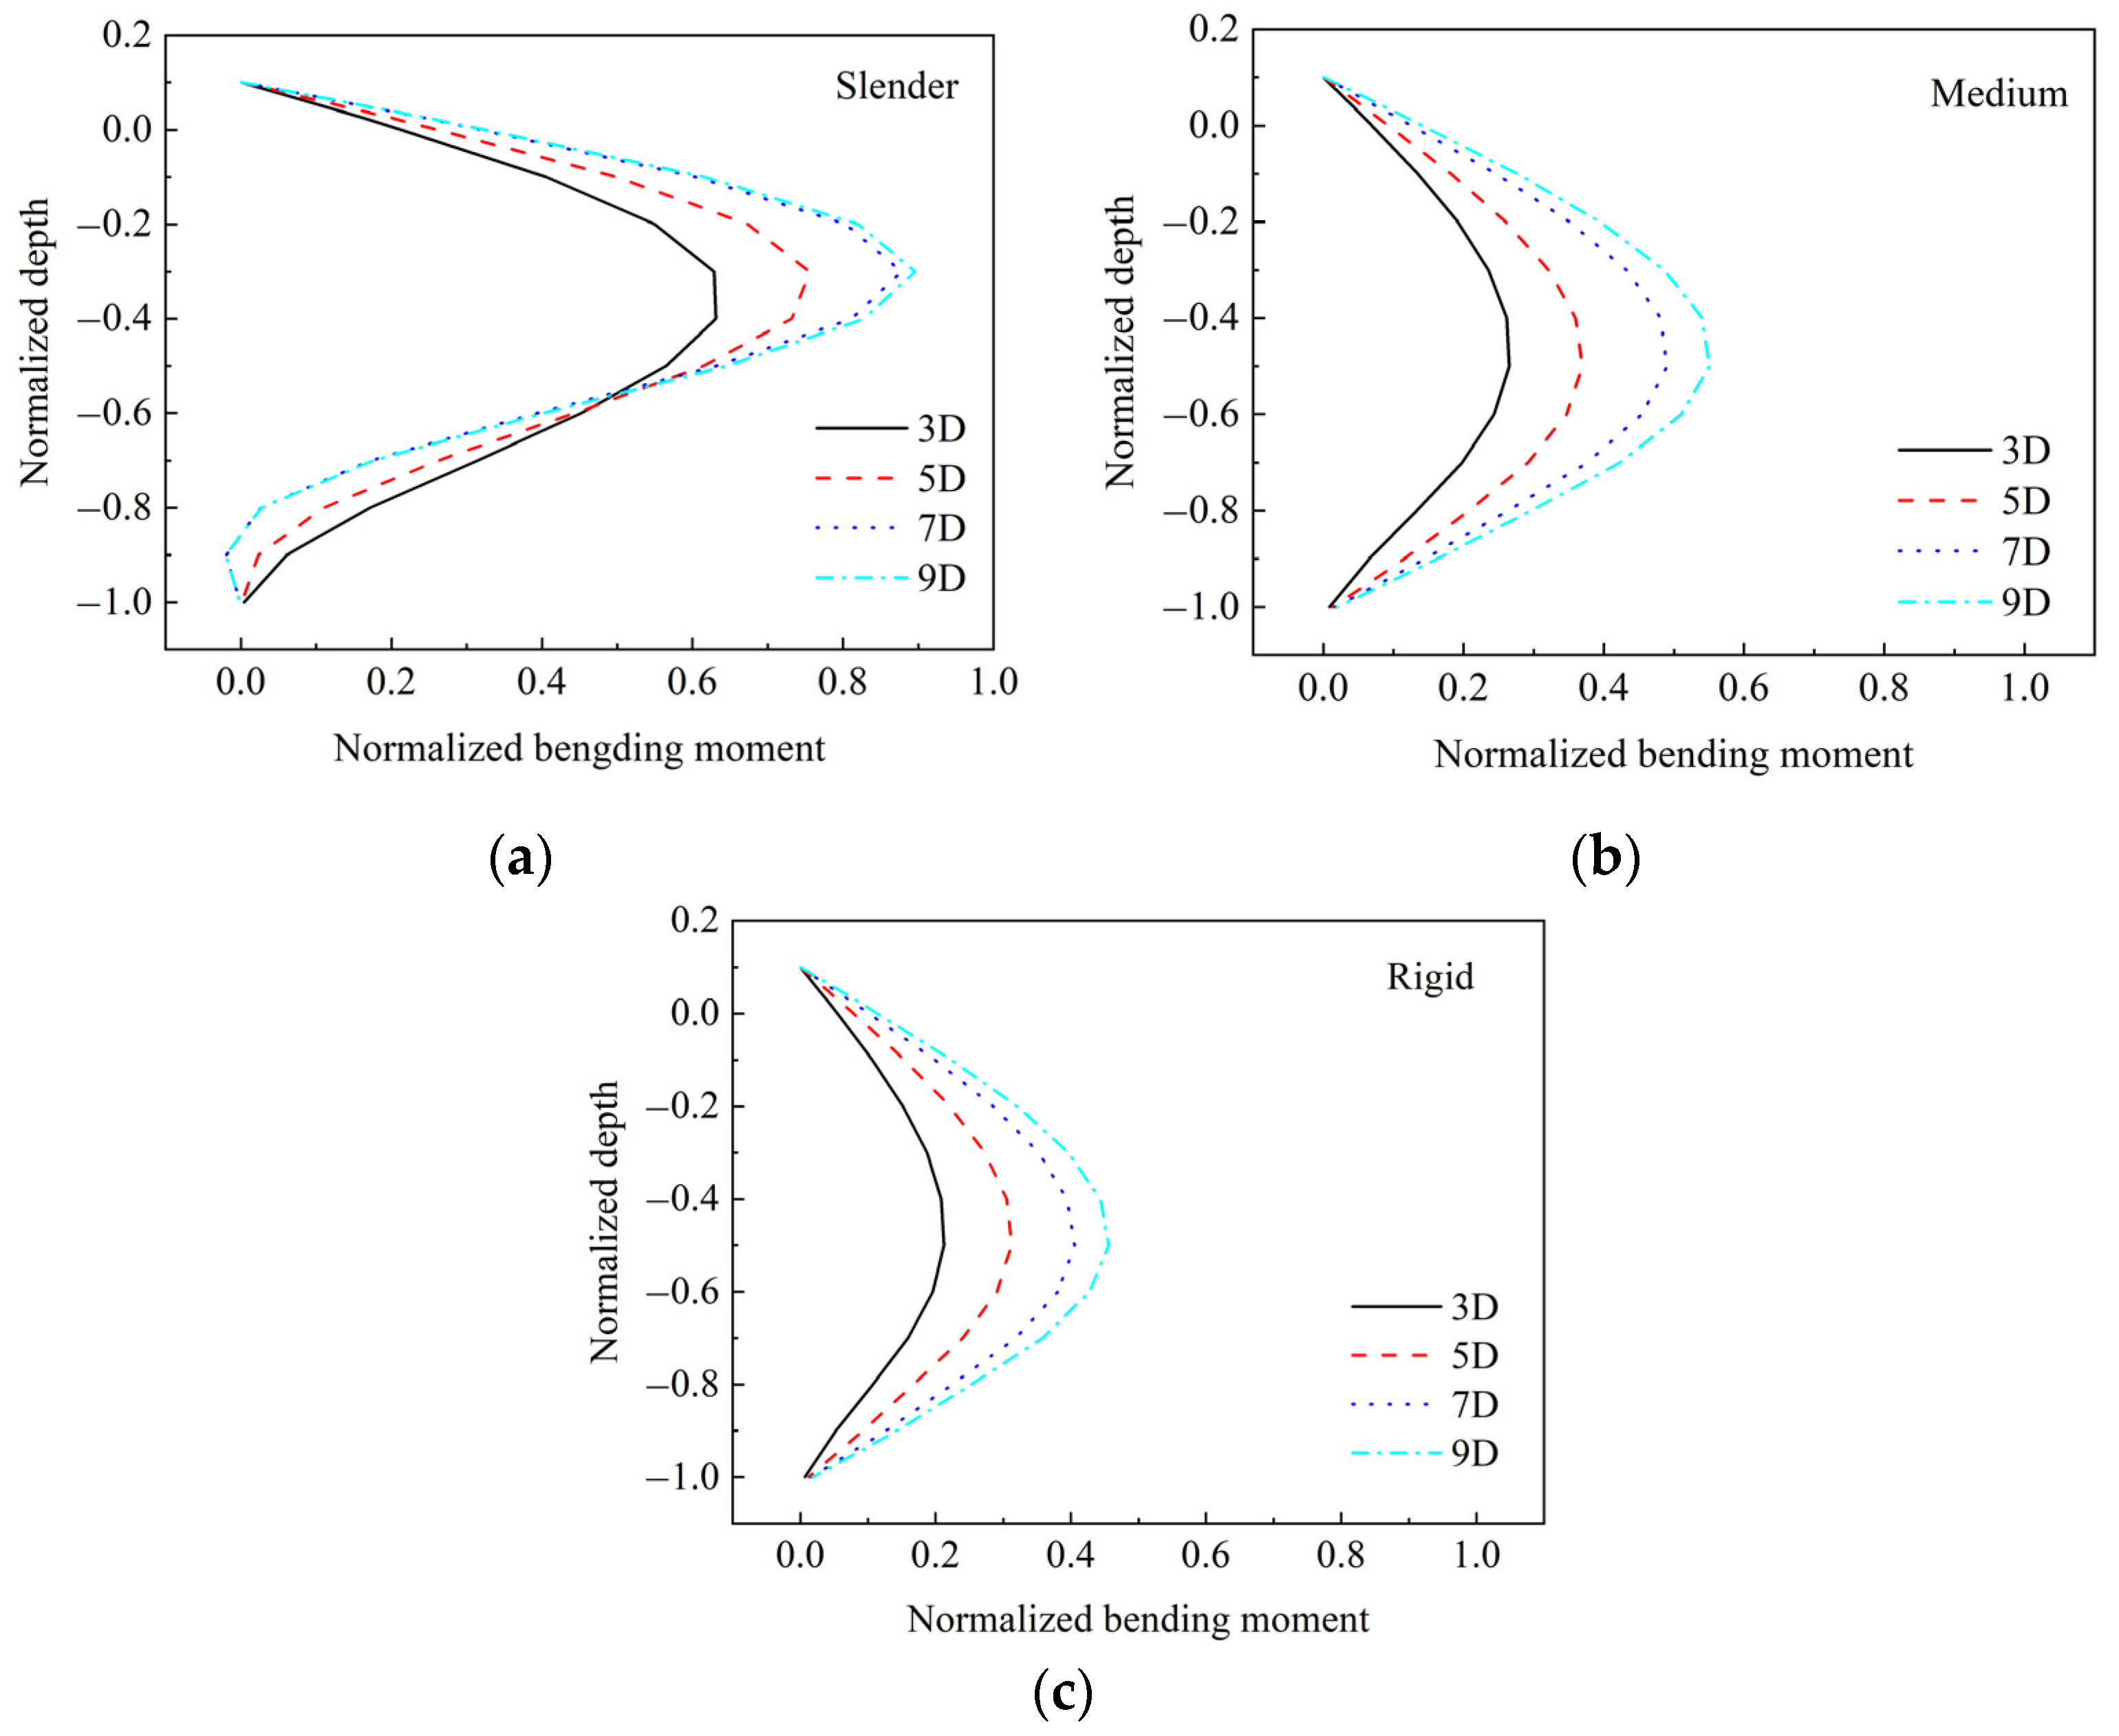
In this section, we will discuss the reasons why different scholars suggest different group reduction factors and why these p-multipliers vary so much, based on the conception of soil–pile relative stiffness.
The pile relative stiffness recommended by Poulos’s [35] is used to define the soil–pile relative stiffness; the formula is as follows:
K R = E P I P E S L L 4       { > 0.208                     R i g i d   p i l e < 0.0025         S l e n d e r   p i l e
in which E P I P is the pile bending moment, and E S L is the soil Young’s modulus. In this study, three K R 0.00015, 0.005, and 1.53, corresponding to a slender pile, medium pile and rigid pile are considered to study the effect of soil–pile relative stiffness on the pile group effect.
As addressed in Table 2, the parameters inputted into the numerical model are shear modulus G and bulk modulus K, which can be estimated as follows:
G = E S L 2 ( 1 + ν )
K = E S L 3 ( 1 2 ν )
Using the model validated above, a comprehensive parametric study is conducted to analyse the relationship between normalized pile group response and soil–pile relative stiffness. The parameters include different pile spacings (from 3 D to 9 D), different number of piles in the group (from 2 × 2 to 5 × 5), and different pile arrangements (1 × 3, 1 × 4, 1 × 5, 3 × 1, 4 × 1, and 5 × 1).

4.1. Pile Spacing

In order to get a dimensionless pile group response, the load versus displacement curves and bending moment profile are normalized as follows: for the lateral load, the average lateral load at the pile head of pile group is obtained by dividing the sum of a lateral load of the pile group by the number of piles, and then the average lateral load of pile group is normalized by the maximum lateral load of a single pile; the displacement at pile head is normalized by the pile diameter. For the bending moment, the average bending moment of the pile group is obtained from the sum of the bending moment of the pile group and the number of piles, and the pile length is normalized by the length of pile buried in soil.
The normalized lateral load versus the normalized displacement curves of the 3 × 3 pile group with various pile spacings are shown in Figure 7. Figure 7a is the normalized lateral load growth curves of the slender pile group (defined by Formula 1), and the normalized lateral load of the pile group with 3 D of pile spacing is 0.691, which means the lateral load of the pile group with 3 D of pile spacing is 0.691 of single pile value, and an obvious pile group effect was observed. As the pile spacing increased, the normalized lateral load increases, i.e., the pile group effect becomes insignificant. The pile with 7 D pile spacing is close to 1, which means that the pile group effect can be neglected when the pile spacing is larger than 7 D for the slender pile (with small soil–pile relative stiffness). From Figure 7b,c, it can also be concluded that the lateral load of the pile group increases. However, the normalized lateral loads are less than 1, which means the pile group effect should be considered even when the pile spacing reaches 9 D for the medium rigid and rigid pile group.
As addressed above, p-multiplier and pile group efficiency can both be used to describe the pile group. The pile group efficiency can be calculated as below:
G e = ( Q u ) g n ( Q u ) s
where (Qu)g is the ultimate lateral load capacity of the group, n is the number of piles in the group, and (Qu)s is the ultimate lateral load capacity of a single pile.
The pile group efficiencies for pile groups with various pile spacing and soil–pile relative stiffness are listed in Table 3. It can be noted that the pile group efficiency increases as the pile spacing increases, which means the pile group effect becomes insignificant as the pile spacing increases. This conclusion is consistent with reference [15]. By comparing the results with identical pile spacing, it can be found that the pile group efficiency varies with the variation in soil–pile relative stiffness; specifically, the pile group efficiencies decrease as the soil–pile relative stiffness increases, i.e., the pile groups with larger stiffness have a more significant pile group effect. This conclusion can be used to interpret the variation in the pile group reduction factors listed in Table 1. The pile group effect can be neglected for pile group with spacing larger than 5 D, while when the pile spacing less than 5 D, the pile group effect must be considered. For the pile group with 3 D pile spacing, the slender pile group’s group efficiencies are about 2 times that of the rigid pile group.
Figure 8 shows the normalized bending moment profiles of the pile group with various pile spacing. It can be seen that the bending moments of the pile group with 9 D of pile spacing is larger than that of other pile groups; meanwhile, the relative flexible pile with close pile spacing sustains less bending moment, which shows a more significant pile group effect. Furthermore, it is observed that the normalized bending moment of the slender pile group is higher than that of the medium and rigid pile group. In addition, normalized depth for the pile group with close pile spacing is larger than that with larger pile spacing, which means the deeper soil is disturbed, caused by a strong pile group effect.
By the comparison of normalized bending moments with equal pile spacing for different relative stiffnesses, it can be observed that the normalized bending moment of the slender pile group is higher than that of the rigid pile group, which means the pile group effect of the slender pile group is less obvious than that of the rigid pile group. This result can also reflect that the variation in the pile group effect is dependent on the soil–pile relative stiffness.

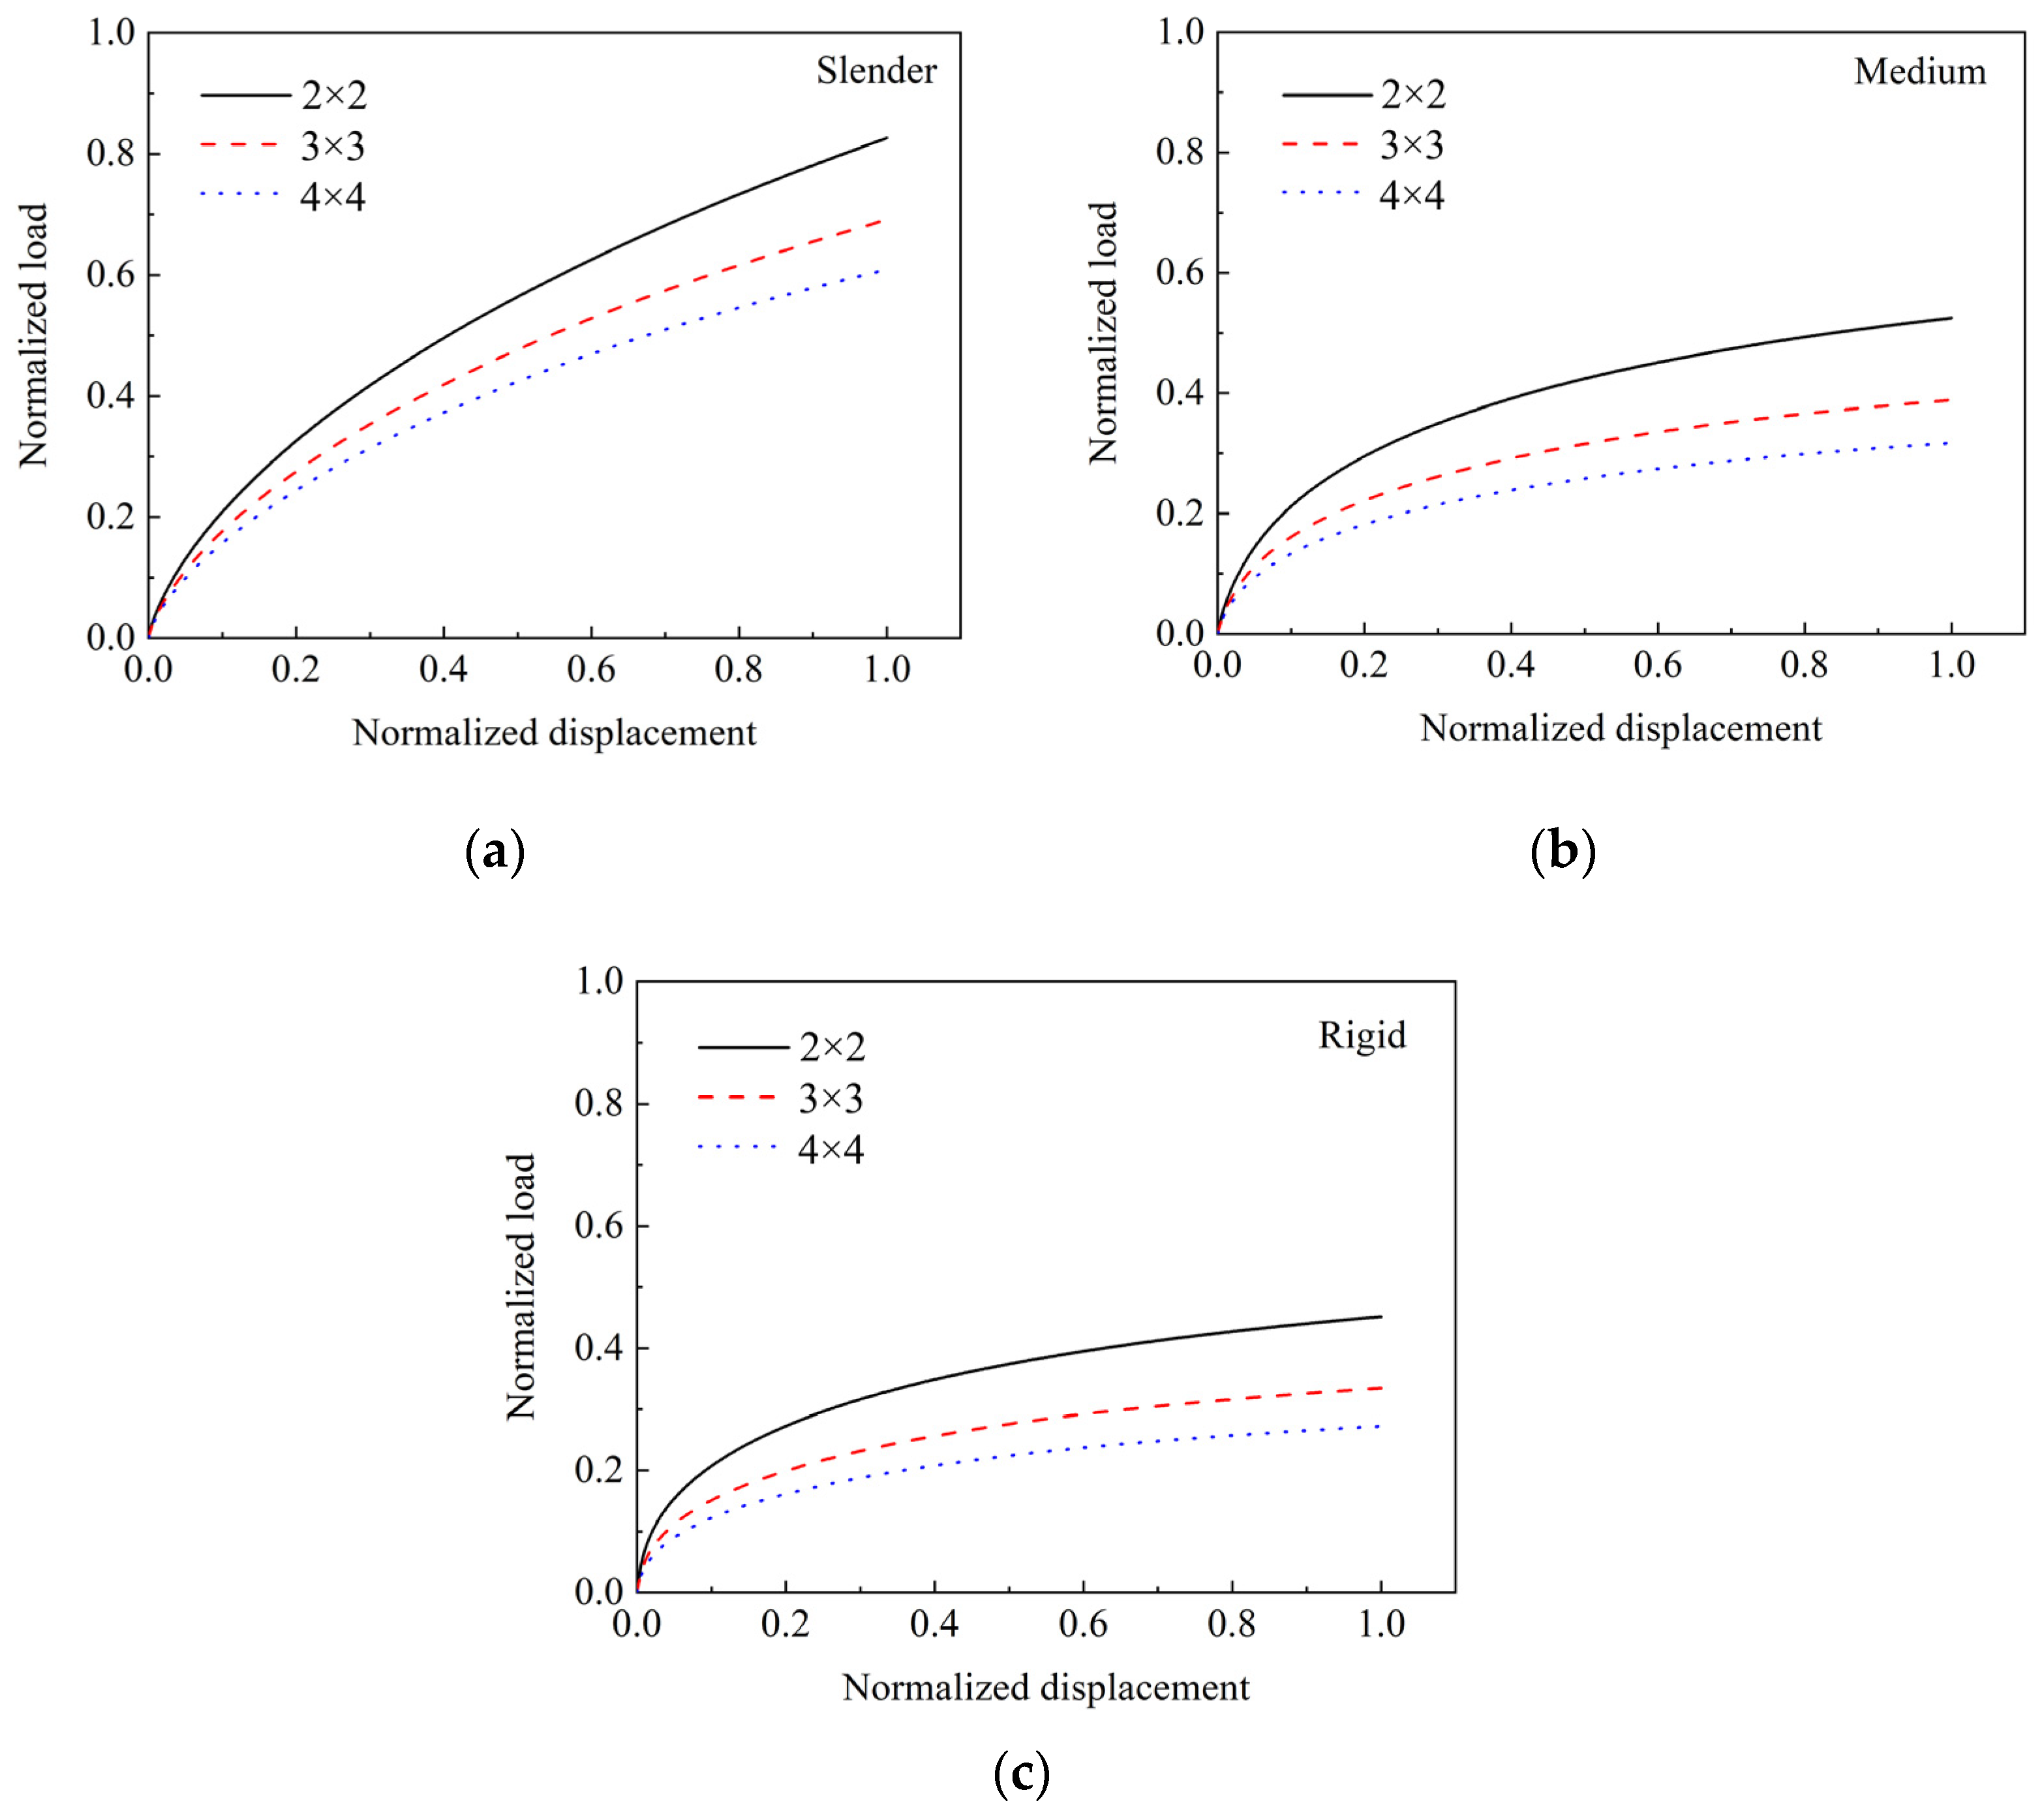
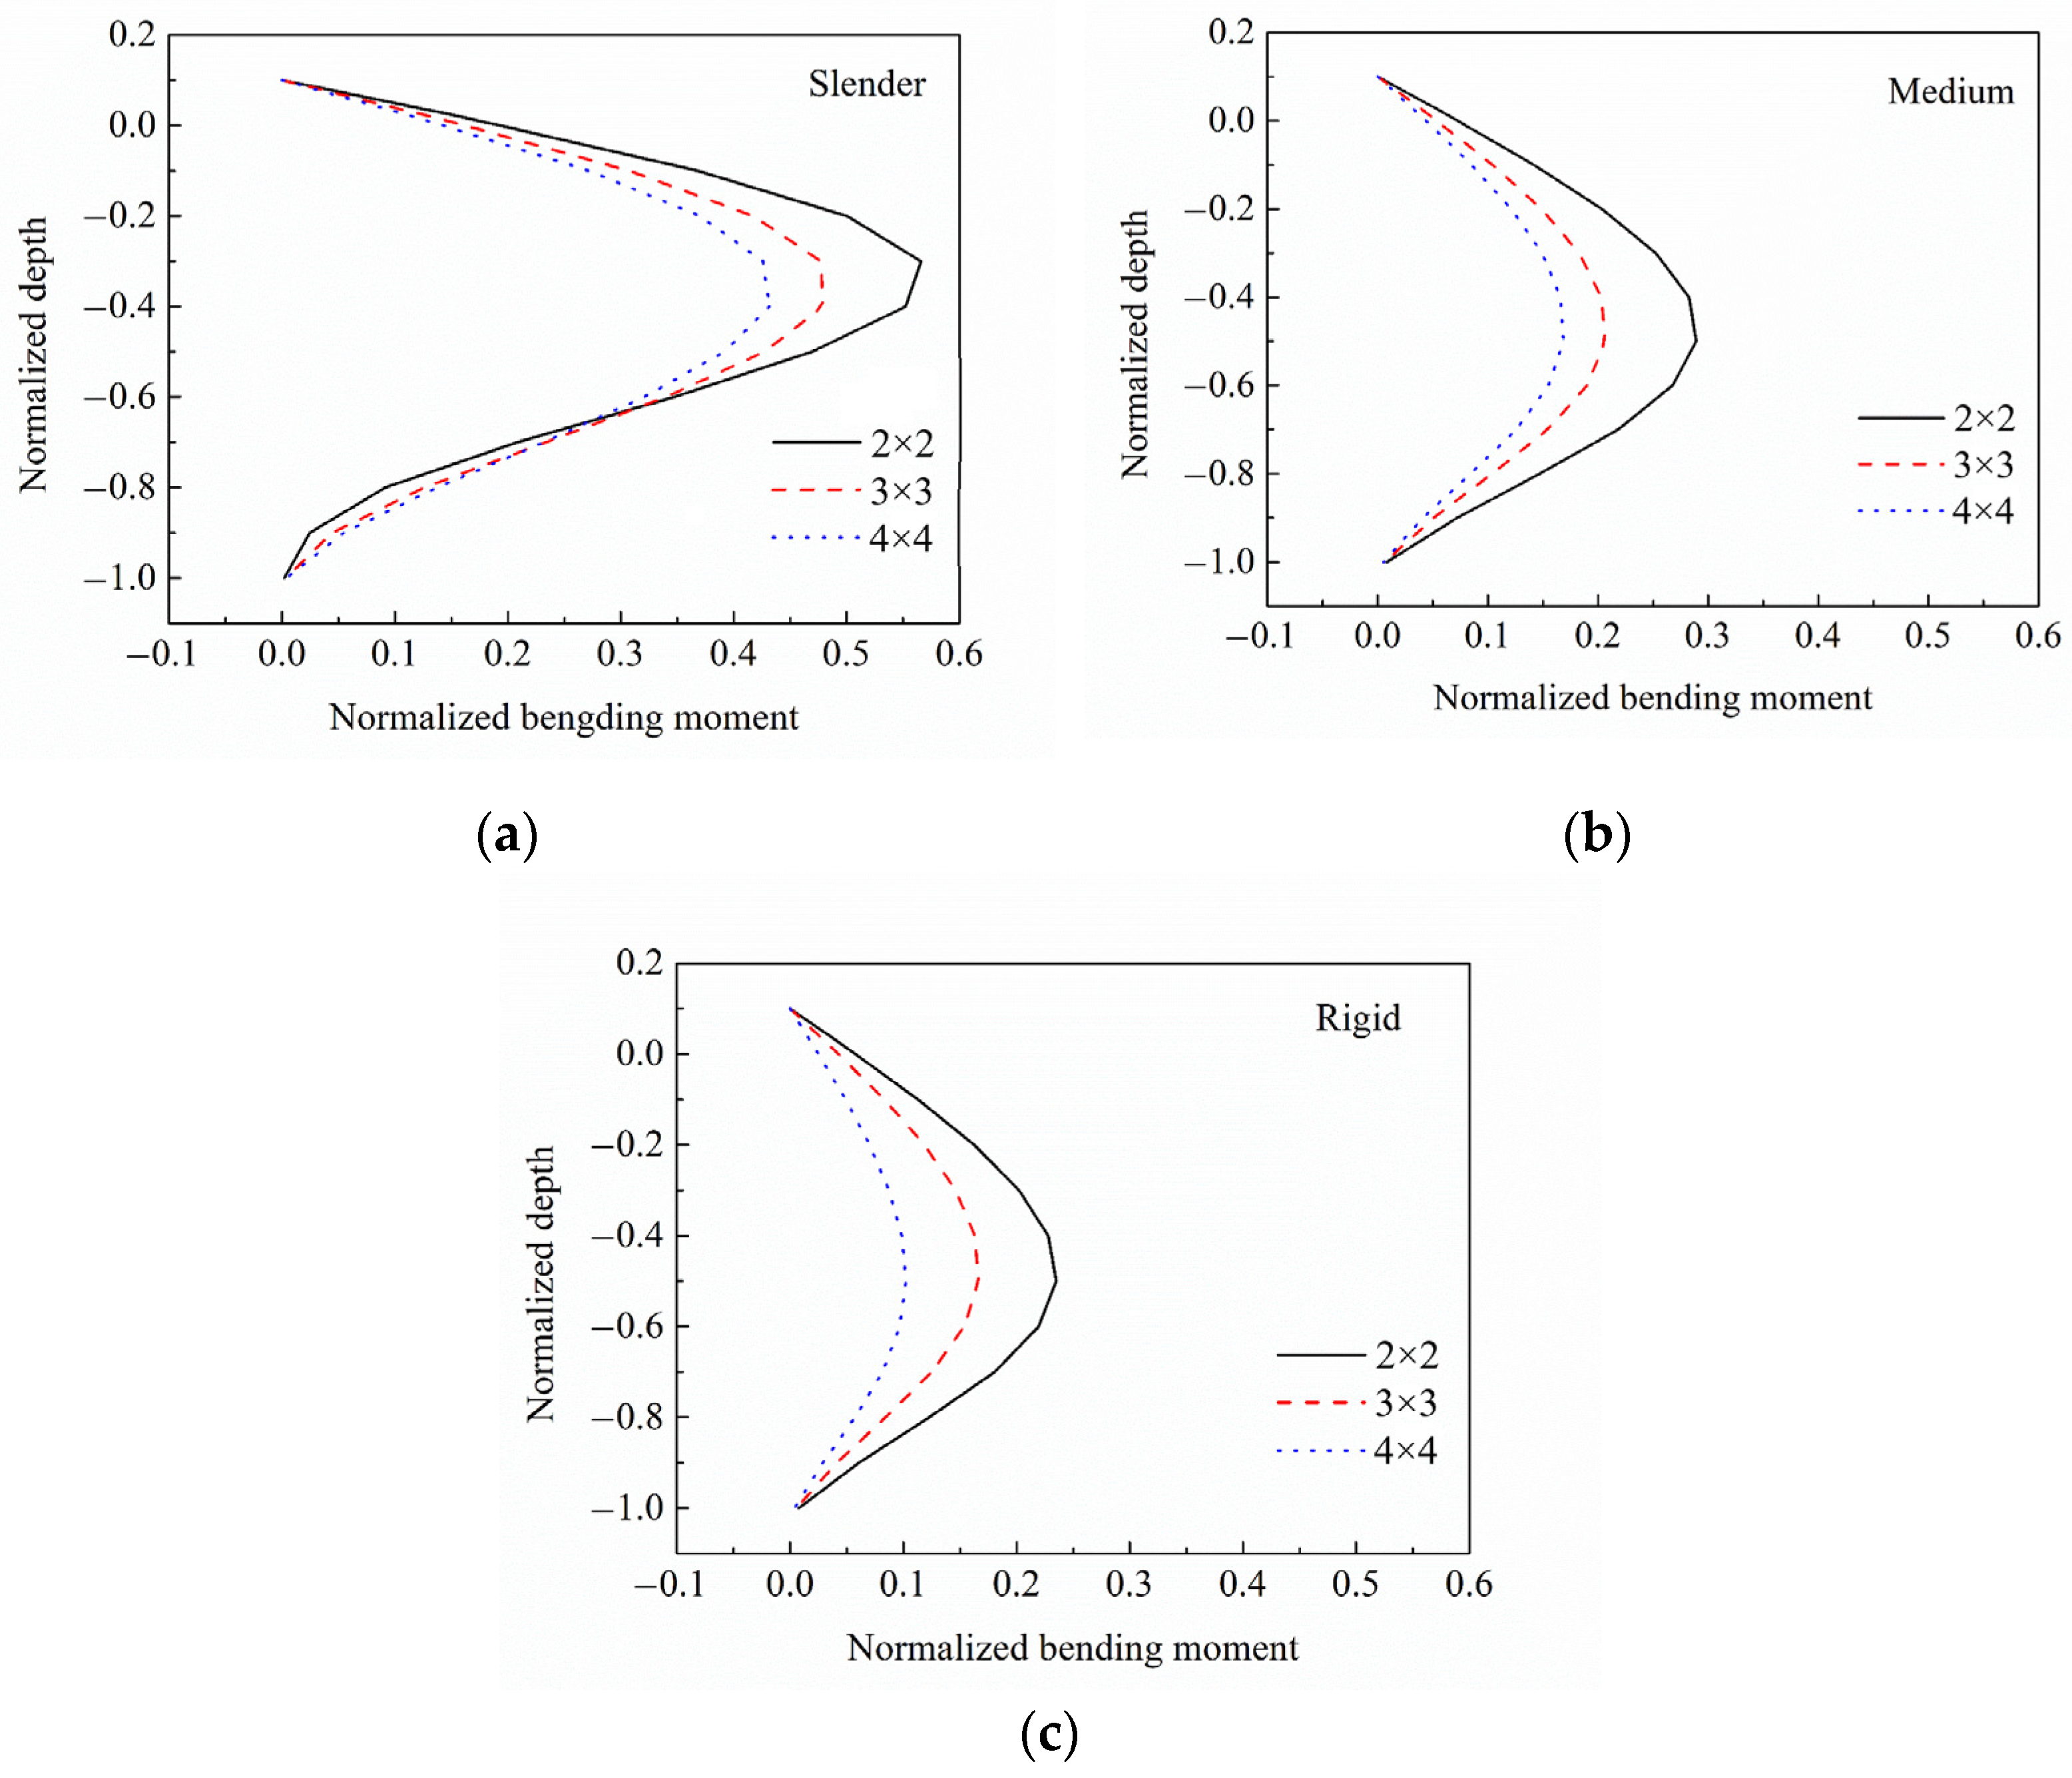
4.2. Number of Piles

In this section, the normalized response of 2 × 2, 3 × 3, and 4 ×4 pile groups with three kinds of pile relative stiffnesses is analysed. The spacing of these pile group are all equal to 3 D. Figure 9 is the normalized load–displacement curves of pile group with various numbers of piles. The maximum normalized lateral load for 2 × 2, 3 × 3, and 4 × 4 pile groups are all less than 1, which means an obvious pile group effect is observed for the pile groups studied in this analysis. The maximum normalized lateral load of 2 × 2 is the highest, and normalized lateral load of the 4 × 4 pile group is the least, i.e., the pile group effect increases as the pile numbers increase.
Table 4 summarizes the pile group efficiencies of the pile group with various numbers of piles. From Table 4 and the comparison of Figure 9a–c, it can be found that the normalized lateral load of the slender pile group is larger than that of medium and rigid pile groups when the applied target normalized displacements are equal, which means the pile group effect becomes significant as the pile number increases. By comparing the results with an identical number of piles, it can be found that the pile group efficiency varies as the soil–pile relative stiffness varies; specifically, the pile group efficiencies decrease as the soil–pile relative stiffness increases, i.e., the pile groups with larger stiffness have a more significant pile group effect.
By comparing the pile group efficiencies listed in Table 4, the slender pile group’s group efficiencies are about 1.5 times that of the medium rigid pile group and 2 times that of the rigid pile group. This conclusion can also be used to interpret the variation in pile group reduction factor listed in Table 1.
Figure 10 shows the normalized bending moment profiles of pile groups with various numbers of piles. Some conclusions similar to that in Figure 9 are observed. The maximum normalized bending moment of 2 × 2 pile group is the largest, followed by that of 3 × 3 and the 4 × 4 pile group, and all of which are less than 1. It shows an obvious pile group effect occurred for all the pile groups, and the pile group effect increases as the number of piles increases. The normalized depth of the large number of the pile group (for example 4 × 4 pile group) is larger than that of small pile group, which means the deeper soil is disturbed for a large number of pile groups and a more significant pile group effect has occurred.

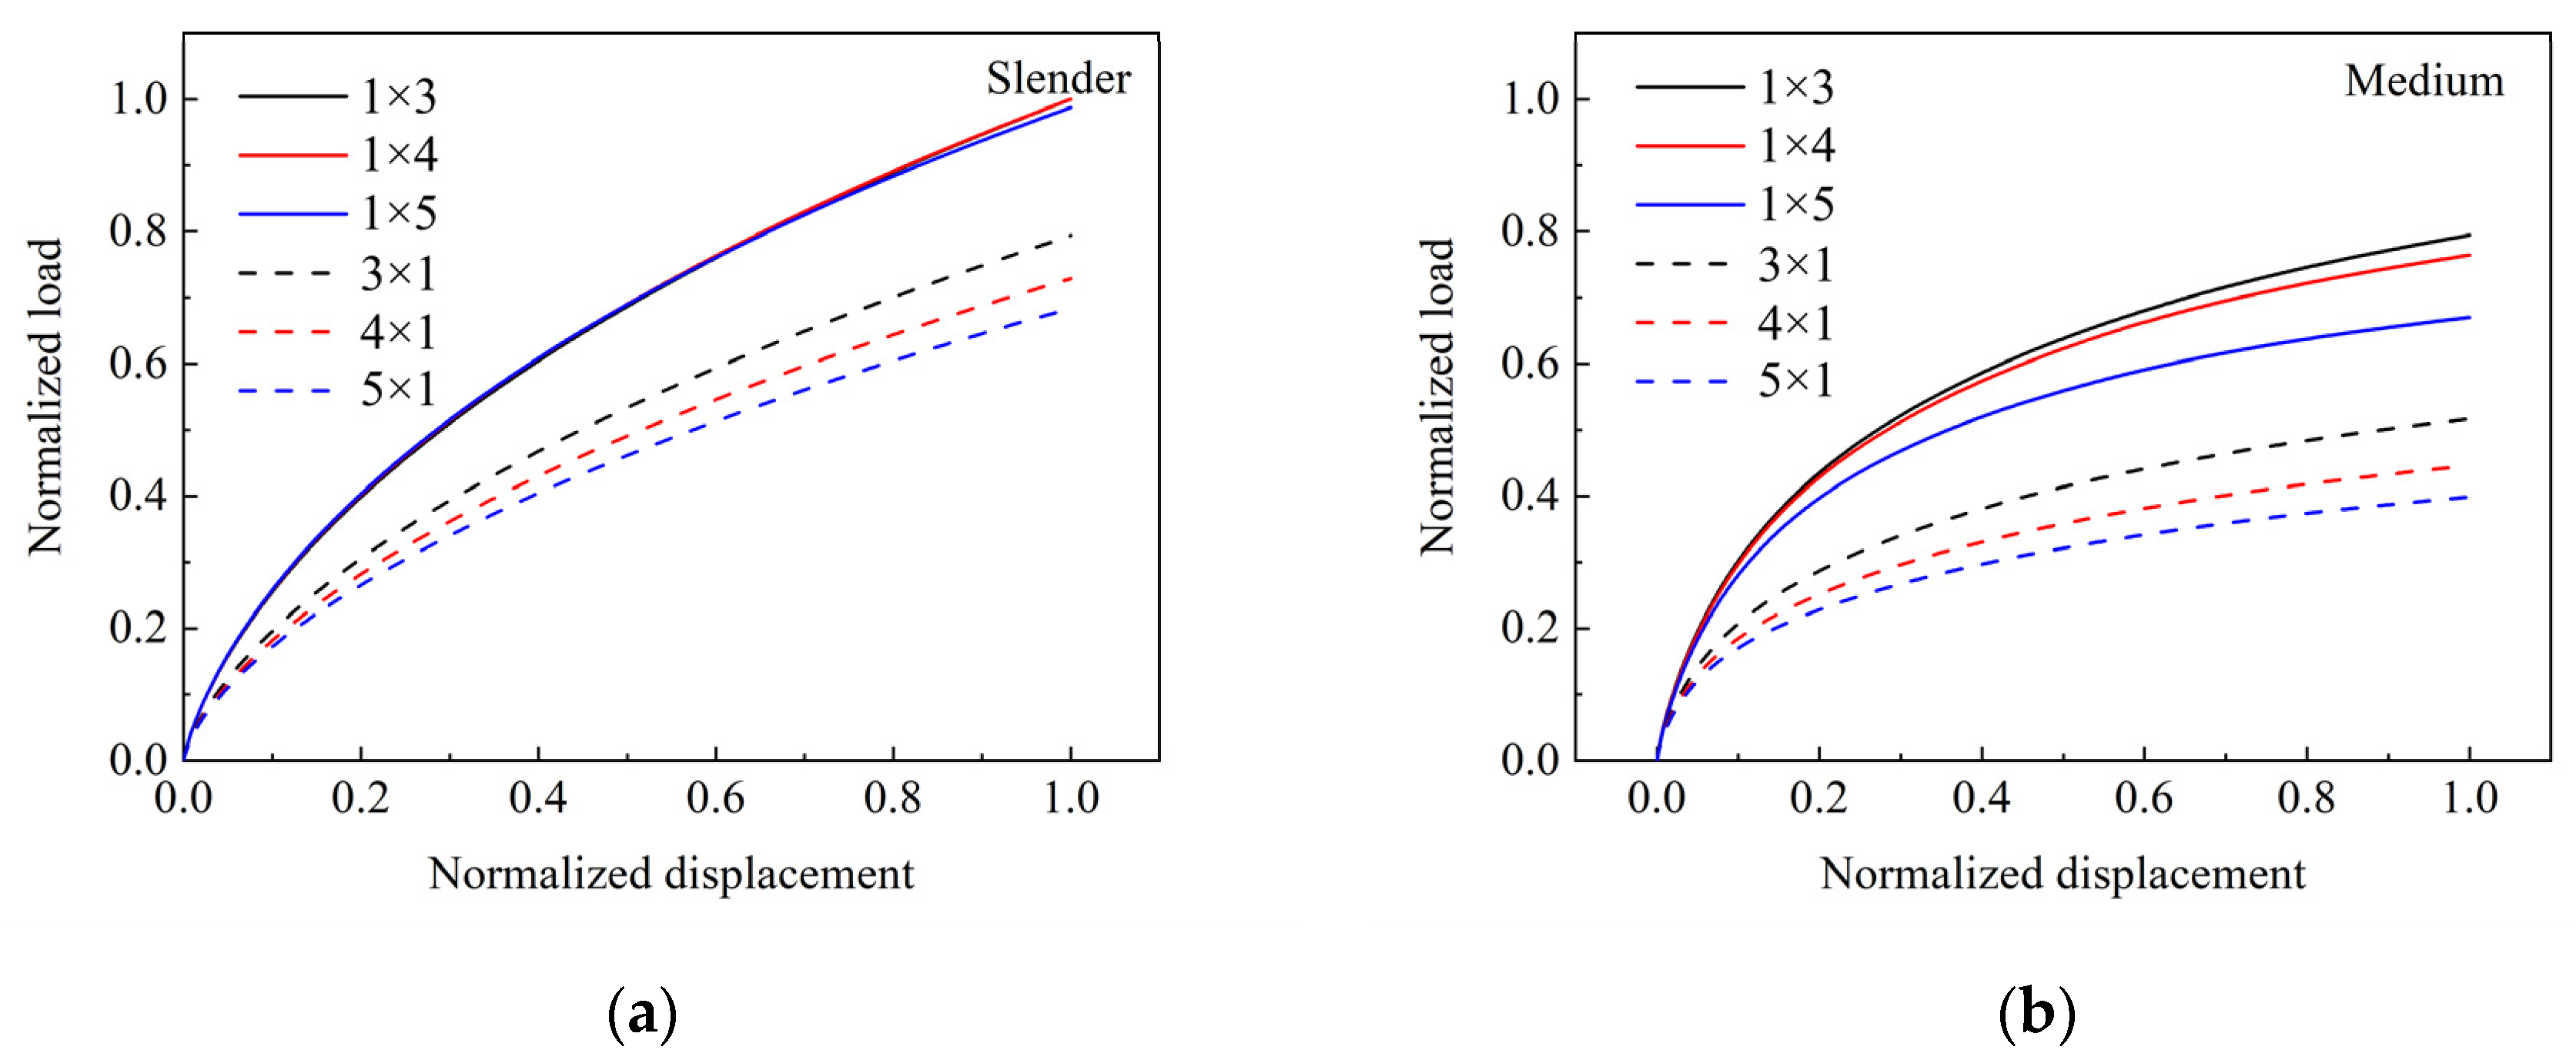
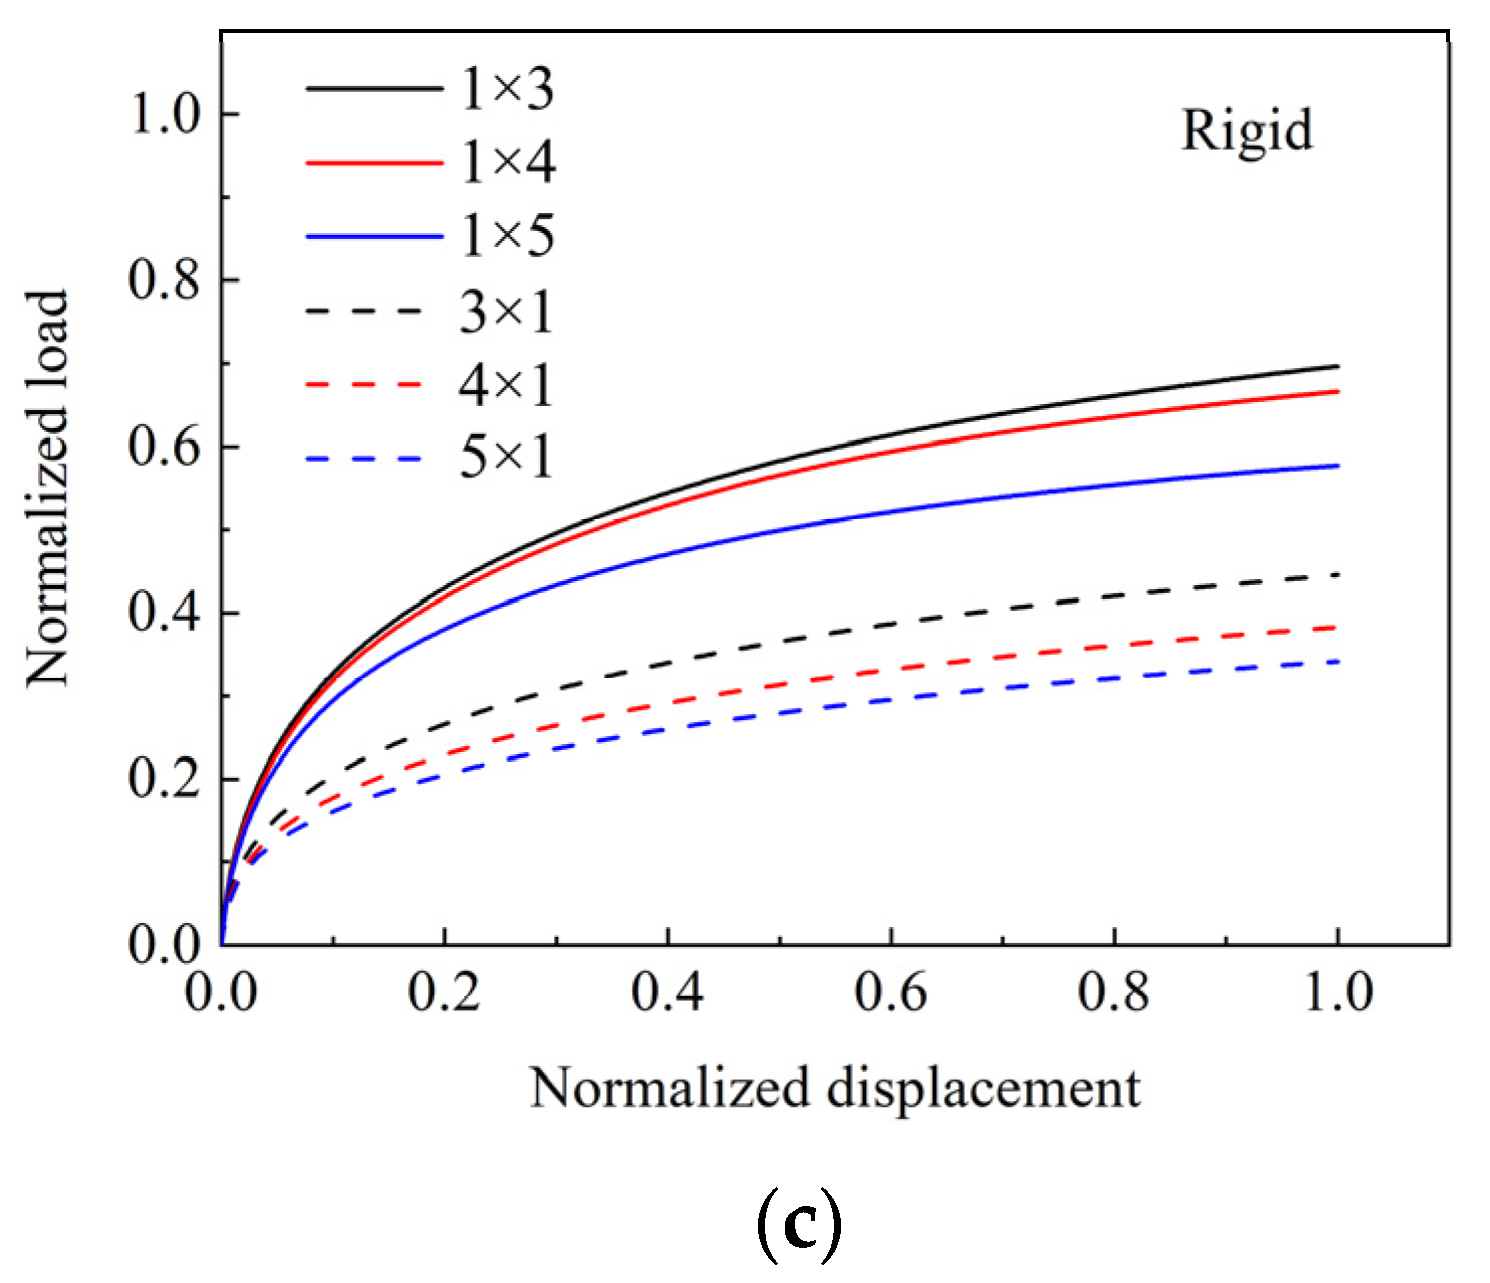
4.3. Pile Group Arrangement

In this section, the pile groups are divided into two sets: the first set contains 1 × 3, 1 × 4, and 1 × 5 pile groups (with the pile spacing equal to 3 D, the pile numbers are all 1 in the loading direction, and the pile numbers perpendicular to the loading direction are 3, 4, and 5), which reflects the pile group having edge effect only; the second set contains 3 × 1, 4 × 1, and 5 × 1 pile groups (with the pile spacing equal to 3 D, the pile numbers in the loading direction are 3, 4, and 5, respectively, and the pile numbers are all perpendicular to the loading direction), which represents the pile group having shadow effect only.
The normalized lateral load versus normalized displacement curves for different pile group arrangements are shown in Figure 10. It can be found that the normalized lateral loads for the first set are higher than that for the second set, indicating that the shadow effect is more significant than the edge effect. Moreover, the maximum normalized lateral loads for two sets of the pile group are all less than 1, which means an obvious pile group effect is observed. The maximum normalized lateral load of 1 × 3 pile group is the highest compared to that of 1 × 4 and 1 × 5 pile groups (Figure 10b,c), which shows that the edge effect increases as the pile numbers increase. Similarly, the maximum normalized lateral load of 3 × 1 pile group is larger than that of the 4 × 1 and 5 × 1 pile group, which exhibits that the shadow effect is also increasing with the increase in pile numbers.
Table 5 is the pile group efficiencies of the pile group with various arrangements. Table 4 and the comparisons between Figure 11a–c show that the normalized lateral load of the slender pile group is larger than that of the medium pile group, and the lowest is the load of the rigid group when the applied target normalized displacements are equal, which means the group effect increases with the increase in soil–pile relative stiffness. For the slender pile group (meaning the soil–pile relative stiffness is small), the “edge effect” can be neglected, while the “shadow effect” is significant for the medium rigid and rigid pile group; the “shadow effect” is about 1.7 times larger than “edge effect”. From the discussion above, it can be noted that the pile spacing, number of piles, and pile group arrangement have significant effects on the pile group, this conclusion is consistent with the previous study. In addition to that, the soil–pile relative stiffness also has a significant effect on the pile group effect, i.e., the pile group effect increases with the increase in soil–pile relative stiffness, which has not been considered by previous research, and can be used to explain the variation in group reduction factors developed by different researchers.

5. Conclusions

The relationship between the normalized pile group response (normalized lateral load versus displacement curve and bending moment profile) and the pile relative stiffness is investigated. On this basis, the relationship between the group reduction factor and the pile relative stiffness is indirectly studied, and the possible reasons for the difference between the group reduction factors obtained from the analysis and that from the full field and centrifuge tests are explained. Based on the results of these analyses, the following conclusions are obtained:
(1)
The group reduction factors are closely related to pile relative stiffness, i.e., the group reduction factor decreases as the the pile relative stiffness increase.
(2)
The pile group effect of group with close spacing is more significant than that with the large spacing; the pile group effect decreases as the pile spacing increase. The pile group effect can be ignored for the pile group with pile spacing larger than 5 D.
(3)
For the pile group with 3 D pile spacing, the slender pile group’s group efficiencies are about two times that of the rigid pile group.
(4)
The pile group effect increases with the increase in the number of piles in the group; the pile group efficiency of the 2 × 2 pile group is about 1.5 times larger than that of the 4 × 4 pile group.
(5)
For the slender pile group (meaning the soil–pile relative stiffness is small), the “edge effect” can be neglected, while the “shadow effect” is significant for the medium rigid and rigid pile group, and the “shadow effect” is about 1.7 times larger than “edge effect”.

Author Contributions

Conceptualization, B.L. and C.L.; methodology, X.W., C.L. and J.K.; software, B.L. and J.K.; validation, B.L., X.W. and C.L.; formal analysis, B.L.; investigation, J.K.; resources, C.L., X.W. and J.K.; data curation, C.L.; writing—original draft preparation, B.L., C.L. and X.W.; writing—review and editing, B.L., X.W. and J.K.; visualization, B.L. and C.L.; supervision, J.K.; project administration, X.W.; funding acquisition, C.L. and X.W. All authors have read and agreed to the published version of the manuscript.

Funding

This research was funded by the Scientific Research Fund of Institute of Engineering Mechanics, China Earthquake Administration (No. 2019D09 and No. 2018B07) and the Natural Science Foundation of Heilongjiang Province (No. LH2022E122). This support is greatly appreciated.

Institutional Review Board Statement

Not applicable.

Informed Consent Statement

Not applicable.

Data Availability Statement

The data presented in this study are available on request from the corresponding author.

Acknowledgments

Grateful acknowledgment is given to Maosheng Gong and Baofeng Zhou at the Institute of Engineering Mechanics, China Earthquake Administration for the guidance and suggestions on theoretical analyses.

Conflicts of Interest

The authors declare no conflict of interest.

References

  1. Liu, C.; Tang, L.; Ling, X.; Deng, L.; Su, L.; Zhang, X. Investigation of liquefaction-induced lateral load on pile group behind quay wall. Soil Dyn. Earthq. Eng. 2017, 102, 56–64. [Google Scholar] [CrossRef]
  2. Yu, Y.; Bao, X.; Liu, Z.; Chen, X. Dynamic Response of a Four-Pile Group Foundation in Liquefiable Soil Considering Nonlinear Soil-Pile Interaction. J. Mar. Sci. Eng. 2022, 10, 1026. [Google Scholar] [CrossRef]
  3. Nimbalkar, S.; Basack, S. Pile group in clay subjected to cyclic lateral load: Numerical modelling and design recommendation. Mar. Georesour. Geotechnol. 2022, 1–21. [Google Scholar] [CrossRef]
  4. Chen, L.; Chong, J.; Pang, L.; Zhang, C. Lateral capacity of a two-pile group foundation model located near slope in sand. Ocean Eng. 2022, 266, 112847. [Google Scholar] [CrossRef]
  5. Lemnitzer, A.; Khalili-Tehrani, P.; Ahlberg, E.R.; Rha, C.; Taciroglu, E.; Wallace, J.W.; Stewart, J.P. Nonlinear Efficiency of Bored Pile Group under Lateral Loading. J. Geotech. Geoenviron. Eng. 2010, 136, 1673–1685. [Google Scholar] [CrossRef]
  6. Liu, C.; Wang, C.; Fang, Q.; Ling, X. Soil-pile-quay wall interaction in liquefaction-induced lateral spreading ground. Ocean Eng. 2022, 264, 112592. [Google Scholar] [CrossRef]
  7. Huang, Y.; Wang, P.; Lai, Y.; Xu, Z. A small-strain soil constitutive model for initial stiffness evaluation of laterally loaded piles in drained marine sand. Ocean Eng. 2023, 268, 113417. [Google Scholar] [CrossRef]
  8. Wang, H.; Fu, D.; Yan, T.; Pan, D.; Liu, W.; Ma, L. Bearing Characteristics of Multi-Wing Pile Foundations under Lateral Loads in Dapeng Bay Silty Clay. J. Mar. Sci. Eng. 2022, 10, 1391. [Google Scholar] [CrossRef]
  9. Brown, D.A.; Morrison, C.; Reese, L.C. Lateral Load Behavior of Pile Group in Sand. J. Geotech. Eng. 1988, 114, 1261–1276. [Google Scholar] [CrossRef]
  10. Adeel, M.B.; Jan, M.A.; Aaqib, M.; Park, D. Development of Simulation Based p-Multipliers for Laterally Loaded Pile Groups in Granular Soil Using 3D Nonlinear Finite Element Model. Appl. Sci. 2021, 11, 26. [Google Scholar] [CrossRef]
  11. Ashour, M.; Ardalan, H. Employment of the P-Multiplier in Pile-Group Analysis. J. Bridg. Eng. 2011, 16, 612–623. [Google Scholar] [CrossRef]
  12. Su, D.; Yan, W.M. Relationship between p-multiplier and force ratio at pile head considering non-linear soil–pile interaction. Géotechnique 2019, 69, 1019–1025. [Google Scholar] [CrossRef]
  13. Fayyazi, M.S.; Taiebat, M.; Finn, W.D.L. Group reduction factors for analysis of laterally loaded pile groups. Can. Geotech. J. 2014, 51, 758–769. [Google Scholar] [CrossRef]
  14. Brown, D.A.; Reese, L.C.; O’Neill, M.W. Cyclic Lateral Loading of a Large-Scale Pile Group. J. Geotech. Eng. 1987, 113, 1326–1343. [Google Scholar] [CrossRef]
  15. Morrison, C.; Reese, L.C. Lateral-Load Test of a Full-Scale Pile Group in Sand; U.S. Army Engineer Waterway Experiment Station: Vicksburg, MS, USA, 1988. [Google Scholar]
  16. McVay, M.; Casper, R.; Shang, T.-I. Lateral Response of Three-Row Groups in Loose to Dense Sands at 3D and 5D Pile Spacing. J. Geotech. Eng. 1995, 121, 436–441. [Google Scholar] [CrossRef]
  17. Ruesta, P.F.; Townsend, F.C. Evaluation of Laterally Loaded Pile Group at Roosevelt Bridge. J. Geotech. Geoenviron. Eng. 1997, 123, 1153–1161. [Google Scholar] [CrossRef]
  18. McVay, M.; Zhang, L.; Molnit, T.; Lai, P. Centrifuge Testing of Large Laterally Loaded Pile Groups in Sands. J. Geotech. Geoenviron. Eng. 1998, 124, 1016–1026. [Google Scholar] [CrossRef]
  19. Huang, A.-B.; Hsueh, C.-K.; O’Neill, M.W.; Chern, S.; Chen, C. Effects of Construction on Laterally Loaded Pile Groups. J. Geotech. Geoenviron. Eng. 2001, 127, 385–397. [Google Scholar] [CrossRef]
  20. Rollins, K.M.; Sparks, A. Lateral Resistance of Full-Scale Pile Cap with Gravel Backfill. J. Geotech. Geoenviron. Eng. 2002, 128, 711–723. [Google Scholar] [CrossRef]
  21. Snyder, J.L. Full-Scale Lateral-Load Tests of a 3 × 5 Pile Group in Soft Clays and Silts. Master’s Thesis, Brigham Young University, Provo, UT, USA, 2004. [Google Scholar]
  22. Walsh, J.M. Full-Scale Lateral Load Tests of a 5 × 3 Pile Group in Sand. Master’s Thesis, Brigham Young University, Provo, UT, USA, 2005. [Google Scholar]
  23. Rollins, K.M.; Lane, J.D.; Gerber, T.M. Measured and Computed Lateral Response of a Pile Group in Sand. J. Geotech. Geoenviron. Eng. 2005, 131, 103–114. [Google Scholar] [CrossRef]
  24. Christensen, D.S. Full Scale Static Lateral Load Test of a 9 Pile Group in Sand. Master’s Thesis, Brigham Young University, Provo, UT, USA, 2006. [Google Scholar]
  25. Rollins, K.M.; Olsen, R.J.; Egbert, J.J.; Jensen, D.H.; Olsen, K.G.; Garrett, B.H. Pile Spacing Effects on Lateral Pile Group Behavior: Load Tests. J. Geotech. Geoenviron. Eng. 2006, 132, 1262–1271. [Google Scholar] [CrossRef]
  26. Mazzoni, S.; McKenna, F.; Scott, M.H.; Fenves, G.L. OpenSees Command Language Manual; Pacific Earthquake Engineering Research (PEER) Center: Berkeley, CA, USA, 2006; Volume 264. [Google Scholar]
  27. Zhang, W.; Esmaeilzadeh Seylabi, E.; Taciroglu, E. Validation of a three-dimensional constitutive model for nonlinear site response and soil-structure interaction analyses using centrifuge test data. Int. J. Numer. Anal. Methods Géoméch. 2017, 41, 1828–1847. [Google Scholar] [CrossRef]
  28. Ilankatharan, M.; Kutter, B. Modeling Input Motion Boundary Conditions for Simulations of Geotechnical Shaking Table Tests. Earthq. Spectra 2010, 26, 349–369. [Google Scholar] [CrossRef]
  29. Gorini, D.N.; Callisto, L. A macro-element approach to analyse bridge abutments accounting for the dynamic behaviour of the superstructure. Géotechnique 2020, 70, 711–719. [Google Scholar] [CrossRef]
  30. Su, L.; Zhou, L.; Zhang, X.; Ling, X. Experimental and numerical modeling on liquefaction resistance of geotextile reinforced sand. Soil Dyn. Earthq. Eng. 2022, 159, 107345. [Google Scholar] [CrossRef]
  31. Rollins, K.M.; Brown, D.A. Design Guidelines for Increasing the Lateral Resistance of Highway-Bridge Pile Foundations by Improving Weak Soils; Transportation Research Board: Washington, DC, USA, 2011; Volume 697. [Google Scholar]
  32. Elgamal, A.; Yan, L.; Yang, Z.; Conte, J.P. Three-Dimensional Seismic Response of Humboldt Bay Bridge-Foundation-Ground System. Eng. Struct. 2008, 134, 1165–1176. [Google Scholar] [CrossRef] [Green Version]
  33. Elgamal, A.; Yang, Z.; Parra, E.; Ragheb, A. Modeling of cyclic mobility in saturated cohesionless soils. Int. J. Plast. 2003, 19, 883–905. [Google Scholar] [CrossRef]
  34. Yang, Z.; Elgamal, A.; Parra, E. Computational Model for Cyclic Mobility and Associated Shear Deformation. J. Geotech. Geoenviron. Eng. 2003, 129, 1119–1127. [Google Scholar] [CrossRef]
  35. Poulos, H.G. Single Pile Response to Cyclic Lateral Load. J. Geotech. Eng. Div. 1982, 108, 355–375. [Google Scholar] [CrossRef]
Figure 1. The setup of 5 × 3 pile group full field test (after Walsh).
Jmse 11 00192 g001
Figure 2. FE model: (a) 3D model of soil and pile; (b) pile group only.
Jmse 11 00192 g002
Figure 3. Numerical and experimental load–displacement curves at pile head.
Jmse 11 00192 g003
Figure 4. Numerical and experimental bending moments profile for single pile.
Jmse 11 00192 g004
Figure 5. Numerical and experimental average load–displacement curves at pile head for pile group.
Jmse 11 00192 g005
Figure 6. Numerical and experimental average bending moments profile for pile group.
Jmse 11 00192 g006
Figure 7. Normalized displacement versus normalized load of pile group with various pile spacing: (a) slender pile group; (b) medium pile group; (c) rigid pile group.
Jmse 11 00192 g007
Figure 8. Normalized bending moment profile of pile group with various pile spacing: (a) slender pile group; (b) medium pile group; and (c) rigid pile group.
Jmse 11 00192 g008
Figure 9. Normalized displacement load curves of pile group with various number of piles: (a) slender pile group; (b) medium pile group; (c) rigid pile group.
Jmse 11 00192 g009
Figure 10. Normalized bending moment profile of pile group with various number of piles: (a) slender pile group; (b) medium pile group; and (c) rigid pile group.
Jmse 11 00192 g010
Figure 11. Normalized displacement load curves of pile groups with various pile group arrangements: (a) slender pile; (b) medium pile; (c) rigid pile.
Jmse 11 00192 g011aJmse 11 00192 g011b
Table 1. Group reduction factors from previous tests [13].
ResearchersPile Group ArrangementTest TypeSoil TypeInternal Friction Angle (°)D (mm)Pile SpacingGroup Reduction Factor
Brown et al. [14]3 × 3Full scaleStiff clay 2733D0.6
3 × 3Full scaleStiff clay 2733D0.53
Brown et al. [9]3 × 3Full scaleMedium dense sand38.52733D0.5
Morrison and Reese [15]3 × 3Full scaleMedium dense sand38.52733D0.5
McVay et al. [16]3 × 3CentrifugeMedium loose sand304305D0.85
3 × 3CentrifugeMedium dense sand334305D0.85
3 × 3CentrifugeMedium loose sand304303D0.48
3 × 3CentrifugeMedium dense sand334303D0.5
Ruesta and Townsend [17]4 × 4Full scaleLoose sand32760 (square)3D0.52
McVay et al. [18]3 × 3CentrifugeSand30, 33429 (square)3D0.5
3 × 4CentrifugeSand30, 33429 (square)3D0.45
3 × 5CentrifugeSand30, 33429 (square)3D0.4
3 × 6CentrifugeSand30, 33429 (square)3D0.37
3 × 7CentrifugeSand30, 33429 (square)3D0.34
Rollins et al.3 × 3Full scaleClay and silt 4003D0.47
Huang et al. [19]2 × 3Full scaleSilty clay 15003D0.79
3 × 4Full scaleSilty clay 8003D0.69
Rollins and Sparks [20]3 × 3Full scaleSilt and clay 3243D0.47
Snyder [21]3 × 5Full scaleSoft clay 3243.92D0.74
Walsh [22]3 × 5Full scaleSand403243.92D0.51
Rollins et al. [23]3 × 3Full scaleSand383243.3D0.53
Christensen [24]3 × 3Full scaleSand383245.65D0.78
Rollins et al. [25]3 × 5Full scaleStiff clay 6103D0.62
3 × 3Full scaleStiff clay 3245.65D0.87
3 × 4Full scaleStiff clay 3244.4D0.78
3 × 5Full scaleStiff clay 3243.3D0.57
Table 2. Soil material properties used in the FE model.
ParametersClaySand
Density of sand (ton/m3)1.911.67
Cohesion (kPa)300
Internal friction angle (°)040
Shear modulus (kPa)87,00050,000
Bulk modulus (kPa)420,000150,000
Poisson’s ratio0.30.3
Table 3. Pile group efficiencies of pile group with various pile spacing.
GeSlender PileMedium Rigid PileRigid Pile
3 D0.6910.3890.334
5 D0.8440.5410.468
7 D0.9850.6930.603
9 D1.0000.7660.670
Table 4. Pile group efficiencies of pile group with various numbers of piles.
GeSlender PileMedium Rigid PileRigid Pile
2 × 20.8260.5250.452
3 × 30.6910.3890.334
4 × 40.6090.3170.273
Table 5. Pile group efficiencies of pile groups with various arrangements.
GeSlender PileMedium Rigid PileRigid Pile
1 × 310.7940.697
1 × 410.7640.666
1 × 50.9880.6700.577
3 × 10.7940.5170.445
4 × 10.7270.4460.383
5 × 10.6840.3990.341
Disclaimer/Publisher’s Note: The statements, opinions and data contained in all publications are solely those of the individual author(s) and contributor(s) and not of MDPI and/or the editor(s). MDPI and/or the editor(s) disclaim responsibility for any injury to people or property resulting from any ideas, methods, instructions or products referred to in the content.

