Article

Numerical Investigation on Behavior of Compressive Piles in Coastal Tidal Flat with Fill

1
PowerChina Huadong Engineering Corporation Limited, Hangzhou 310058, China
2
Department of Geotechnical Engineering, Tongji University, Shanghai 200092, China
*
Author to whom correspondence should be addressed.
J. Mar. Sci. Eng. 2022, 10(11), 1742; https://doi.org/10.3390/jmse10111742
Submission received: 11 October 2022 / Revised: 8 November 2022 / Accepted: 9 November 2022 / Published: 13 November 2022
(This article belongs to the Special Issue Advances in Offshore Geotechnics)

Abstract

:
The control centers of wind power plants are usually located in coastal tidal flat areas. A thick fill should be placed at the original ground level to ensure that the design elevation of the control centers is maintained above the water table. However, the filling would cause a long-term ground settlement and further lead to the development of the negative skin friction (NSF) of the pile foundations for the control centers. The CPTU tests were conducted to calibrate the soil properties, of which the rationalities were verified by comparisons of the pile-bearing capacities between the full-scale axial compressive tests and β-method. The numerical analysis method was then established to investigate the influence of additional ground pressures on the pile axial bearing behavior over time and the influence of NSF caused by consolidation on pile-bearing capacity. Finally, a simple procedure was further employed to investigate the evolution of the long-term pile-bearing behavior.

1. Introduction

Coastal regions generally have a highly developed economic structure and dense population. With the rapid development of coastal areas, land resources are increasingly scarce. Fortunately, there are abundant tidal flats in coastal areas which can be improved by placing fills. This method has become important to develop the city in coastal areas.
Consolidation duration is an essential index in the engineering construction process. On the one hand, many engineering projects and engineering tests revealed that under the influence of overburden pressure, pore water in the foundation is gradually discharged, thereby increasing the effective vertical stress in soil. That means soil shear strength increases, and the bearing capacity of the foundation is improved. On the other hand, pile foundations are widely used in filling sites to avoid potential risks caused by the lousy engineering characteristics of soft coastal soils. The negative skin friction (NSF) will develop on the pile foundation if the consolidation process caused by newly filling sand is not completed. Axial force and pile foundation displacement would increase due to the drag load produced by negative skin friction (NSF). In summary, the pile-bearing capacity in the filling site changes with the soil consolidation. To this end, considering the consolidation effect and driving piles appropriately can improve the pile-bearing capacity.
Numerous investigations have shown that throughout the consolidation phase, soil strength changes. Henkel [1] conducted numerous experiments on the shear strength of soft clay, and the results revealed a single relationship between the water content, effective stress, and shear strength of cohesive soil under equal and unequal consolidation pressure. Peck et al. [2] deduced a formula for undrained strength growth due to consolidation in engineering applications. Shen [3] also proposed a formula to consider the strength increase of structured clay caused by consolidation, which was further used to predict the increase of pile-bearing capacities without considering the soil–pipe interaction during soil consolidation.
However, the relative displacement of the pile and the soil is an important factor in the NSF of pile foundations. The neutral point is the position where the relative displacement of the pile and soil is zero, and the axial force of the pile is maximum. The friction of piles changes from negative to positive through the neutral point. Felenius [4], who analyzed the neutral point of the pile based on the limit analysis method, concluded that the neutral point shifted downward due to the larger axial force. Numerical simulation is crucial for dealing with the NSF effect on piles in complex geological conditions. Lee et al. [5] used the elastic pile–soil interface method to calculate the distribution of drag load in pile groups. Liu et al. [6] investigated the distribution of NSF along the pile length of various influencing factors by considering the soil consolidation effect on pile-bearing behavior. However, studies of the effect of NSF on pile foundations under consolidation often lack engineering data and comparative experiments. Moreover, few studies analyzed how to reduce the influence of NSF in engineering.
In this study, the CPTU tests were first conducted to calibrate the soil properties, of which the rationalities were verified by comparisons of the pile-bearing capacities between the full-scale axial compressive tests and β-method. Numerical simulations were further adopted for a wind power plant engineering project in a coastal tidal flat with filling to investigate how the soil strength changes with consolidation progress. In order to take into account the influence of NSF on the pile-bearing capacity, an approach was proposed to determine the neutral point position of the pile foundation. The method of planning the pile driving date to achieve a balance between the engineering time limit and pile-bearing capacity is proposed based on the test and the findings of the finite element analysis.

2. Project Description and Engineering Test

The wind power plant project studied in this study is located in a coastal area. To raise the ground level for structural construction, 1–1.5 m of sand was filled in the large area of the tidal flat. Experimental investigations are widely used to assess the capacity of the foundations for offshore wind farm [7,8]. The geotechnical characterization and the pile-bearing capacity evaluation of the wind power plant project are reported below. The engineering tests serve two purposes. The first one is obtaining soil unit parameters for calculating theoretical and finite element methods. The second one is to calculate the ultimate bearing capacity of the pile foundation by static axial load test.

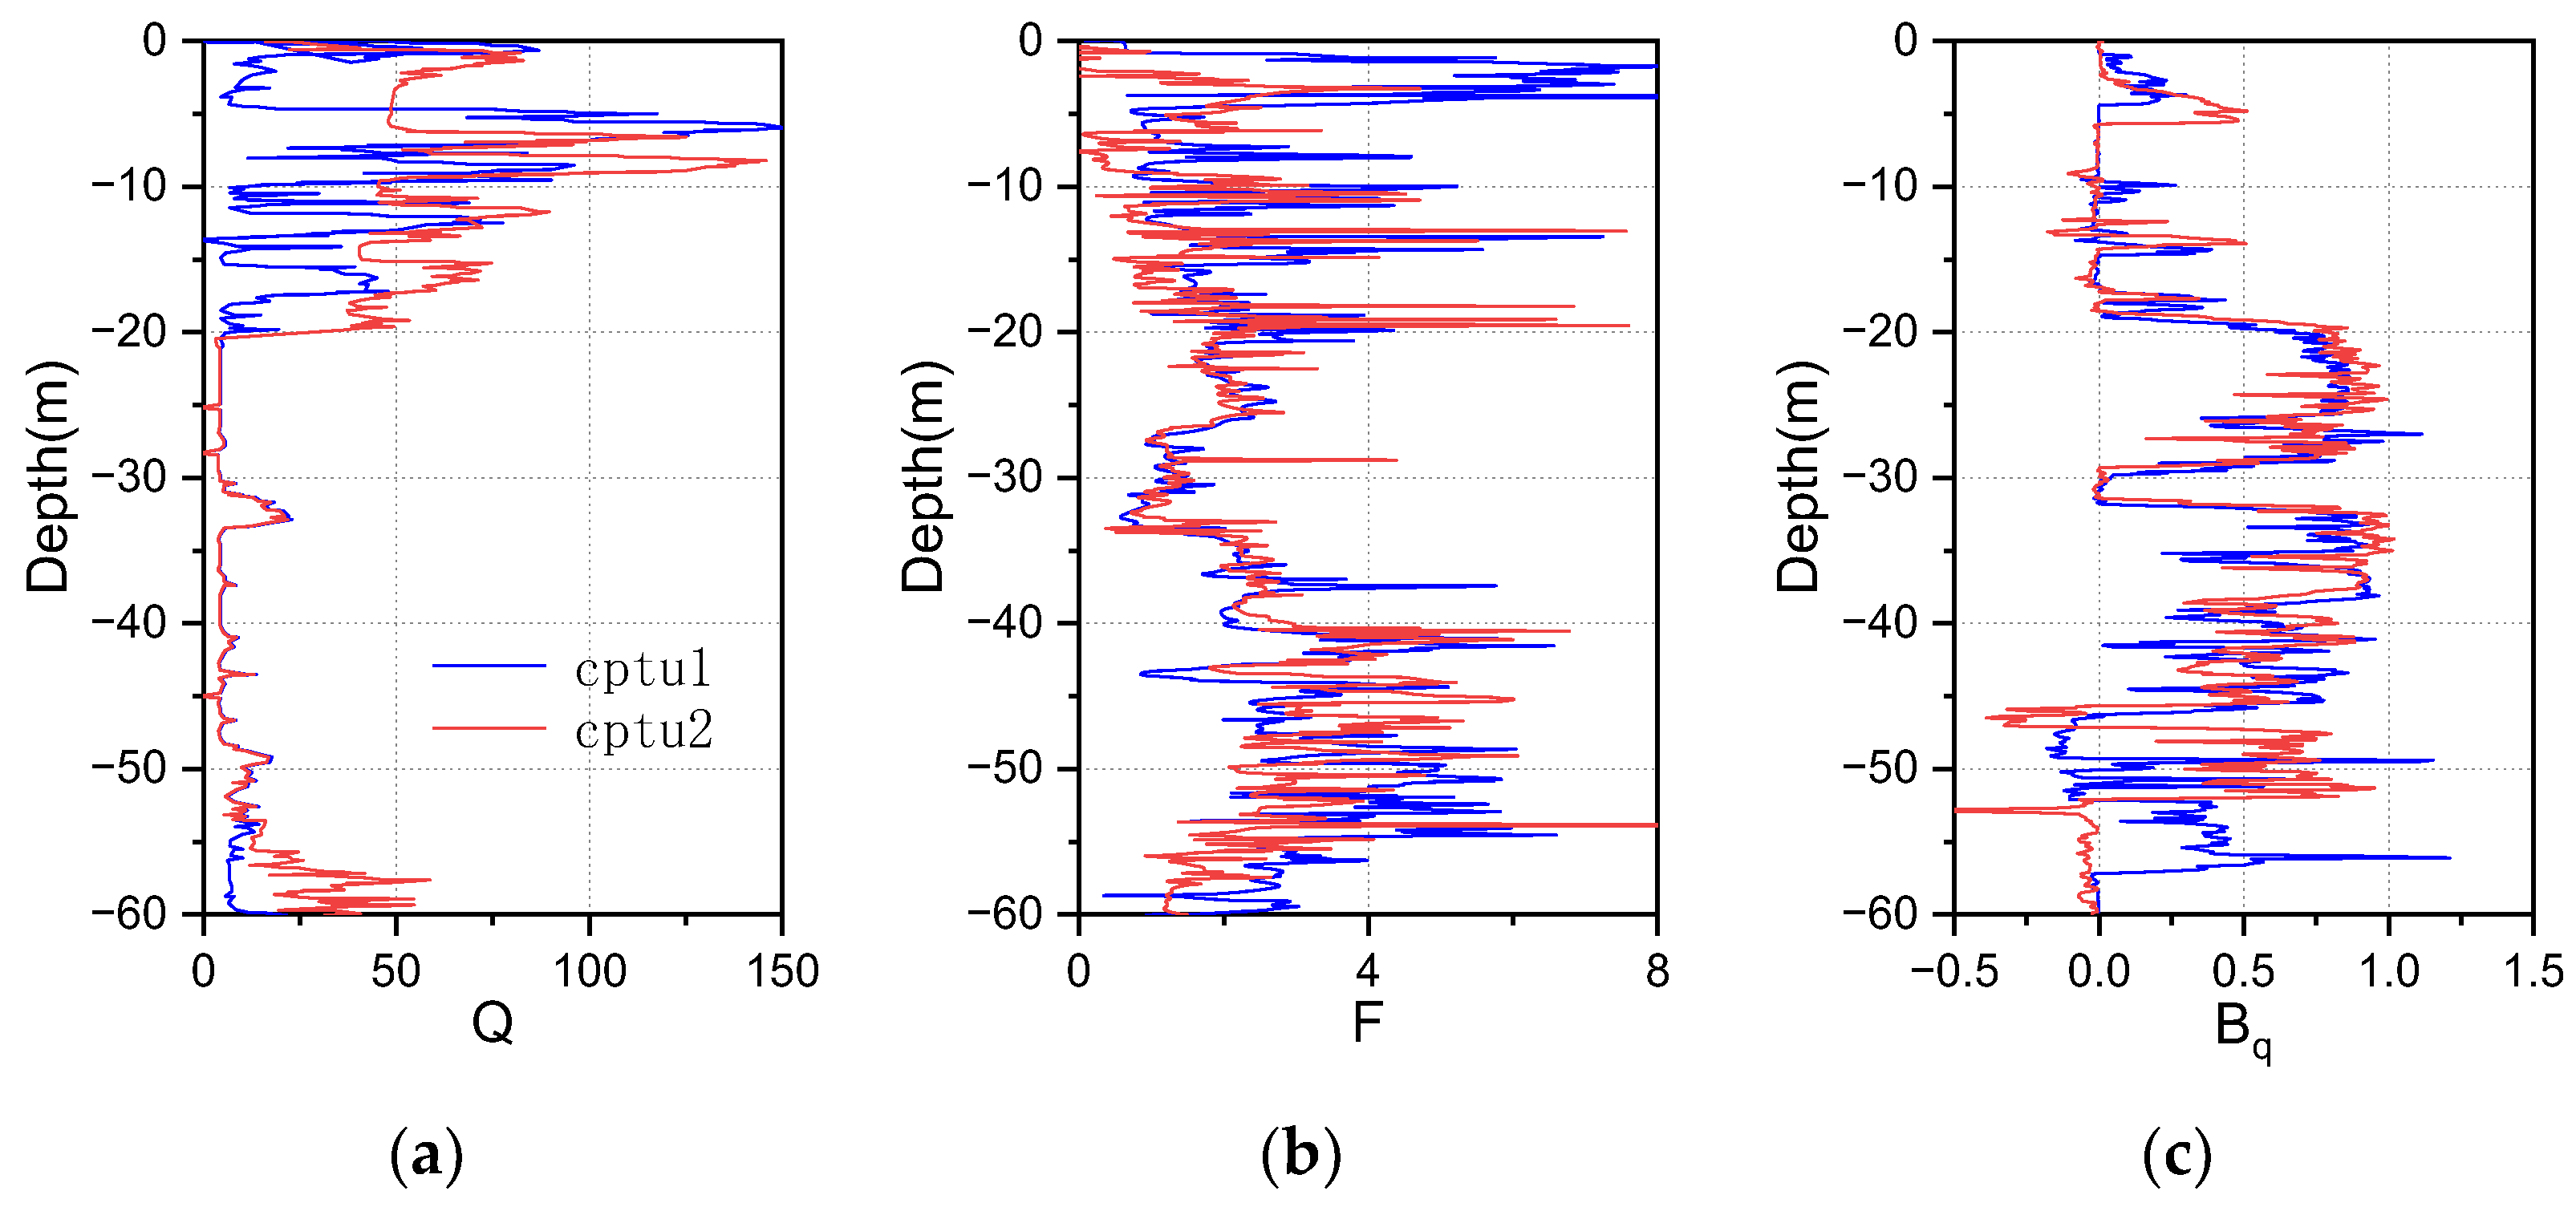
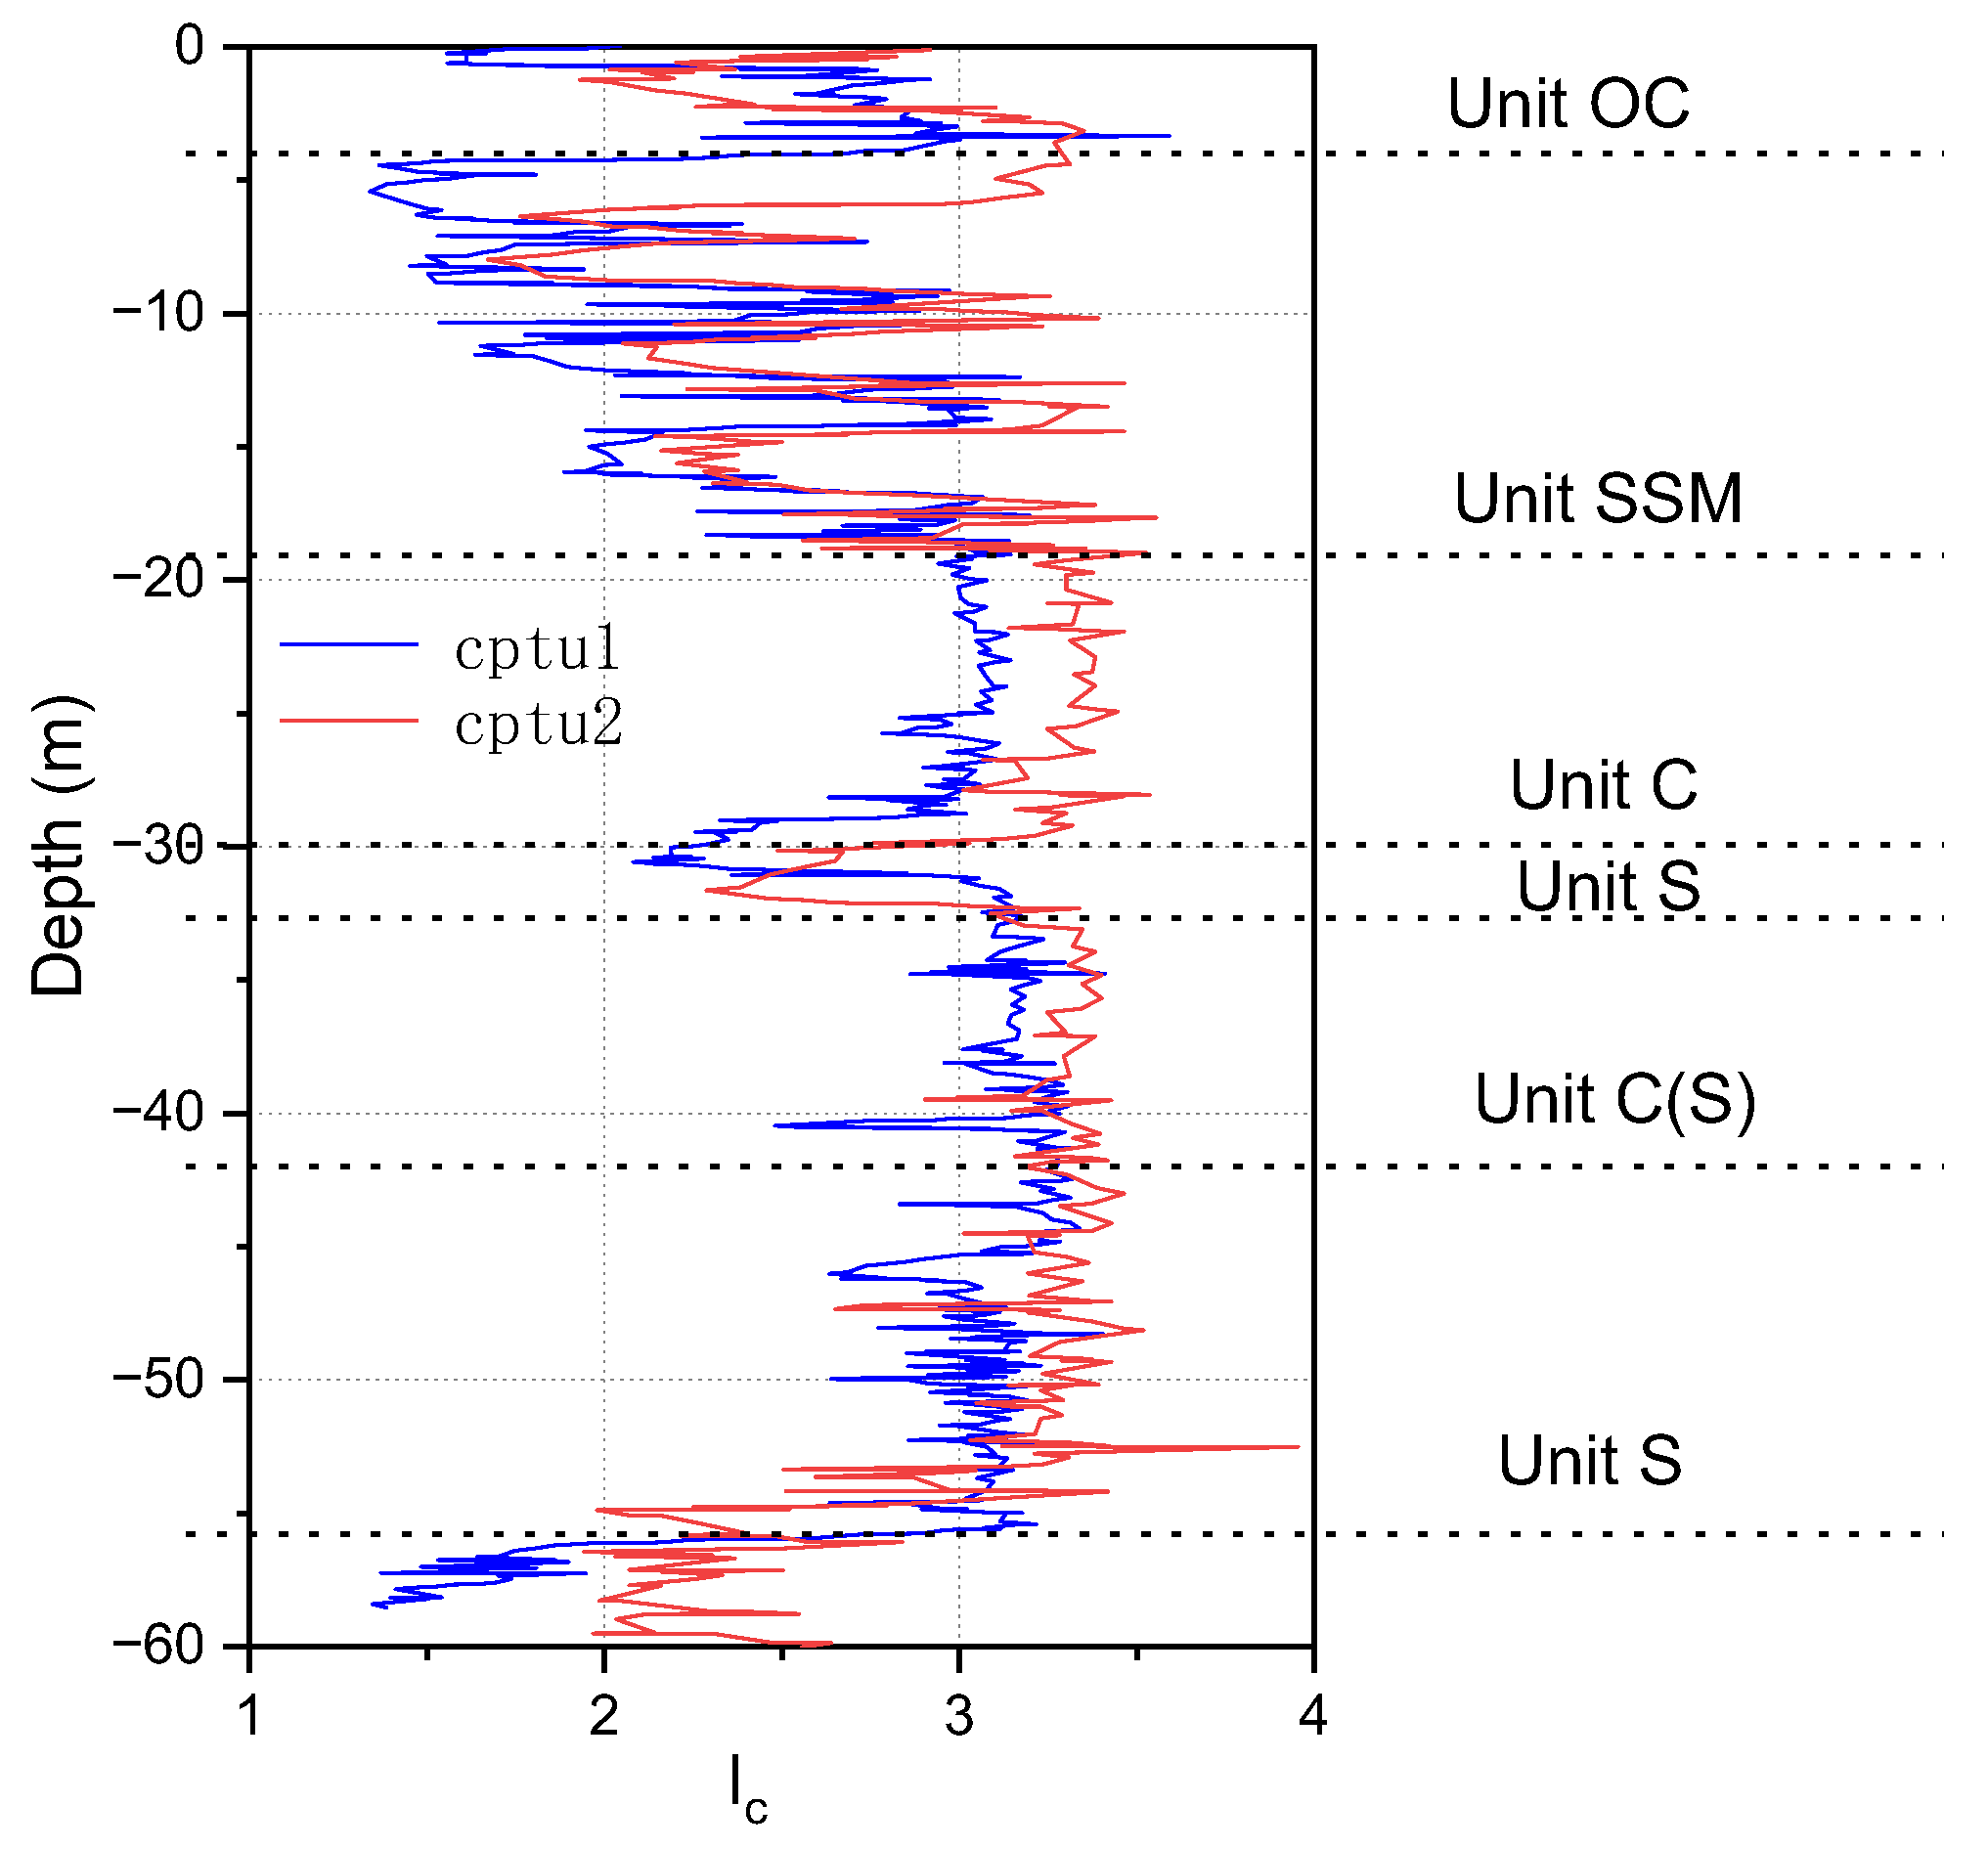
2.1. Geotechnical Characterization Methodology

The soil geotechnical characterization was obtained through 2 CPTU cone penetration tests, 22 boreholes, and laboratory test results. The basic engineering parameters, which are stated below, can be obtained using the empirical formula of the CPTU test [9]:
Q = q t σ v 0 σ v 0
F = 100 f S q t σ v 0
B q = u 2 u 0 q t σ v 0
where Q defines the normalized tip resistance, F is the normalized sleeve friction, Bq represents the normalized porewater pressure, σ v 0 is the total vertical overburden stress, σ v 0 is the effective vertical overburden stress, and u0 depicts the hydrostatic porewater pressure.
The soil behavior type Index (Ic), which can be used to describe soil type, is summarized as [10]:
I c = [ ( 3.47 log Q ) 2 + ( 1.22 + log F ) 2 ] 0.5
The normalized basic data of the CPTU experiment are presented in Figure 1. Based on these parameters of soil properties, the empirical formulas can be used to define different soil units and calculate the soil engineering parameters [11,12,13,14]. Even though the two CPTU test places were far from each other, the profile distribution was similar, overlapping almost perfectly. Findings reflected an excellent indication of homogeneity, not only in terms of stratigraphy but also in terms of mechanical properties. According to Ic parameters, the soil layers in the engineering site can be classified into six units, as shown in Figure 2. These similar-property soil layers can be combined and separated into five parts for subsequent calculation. According to the CPTU test and laboratory test result, the basic soil units are listed in Table 1.

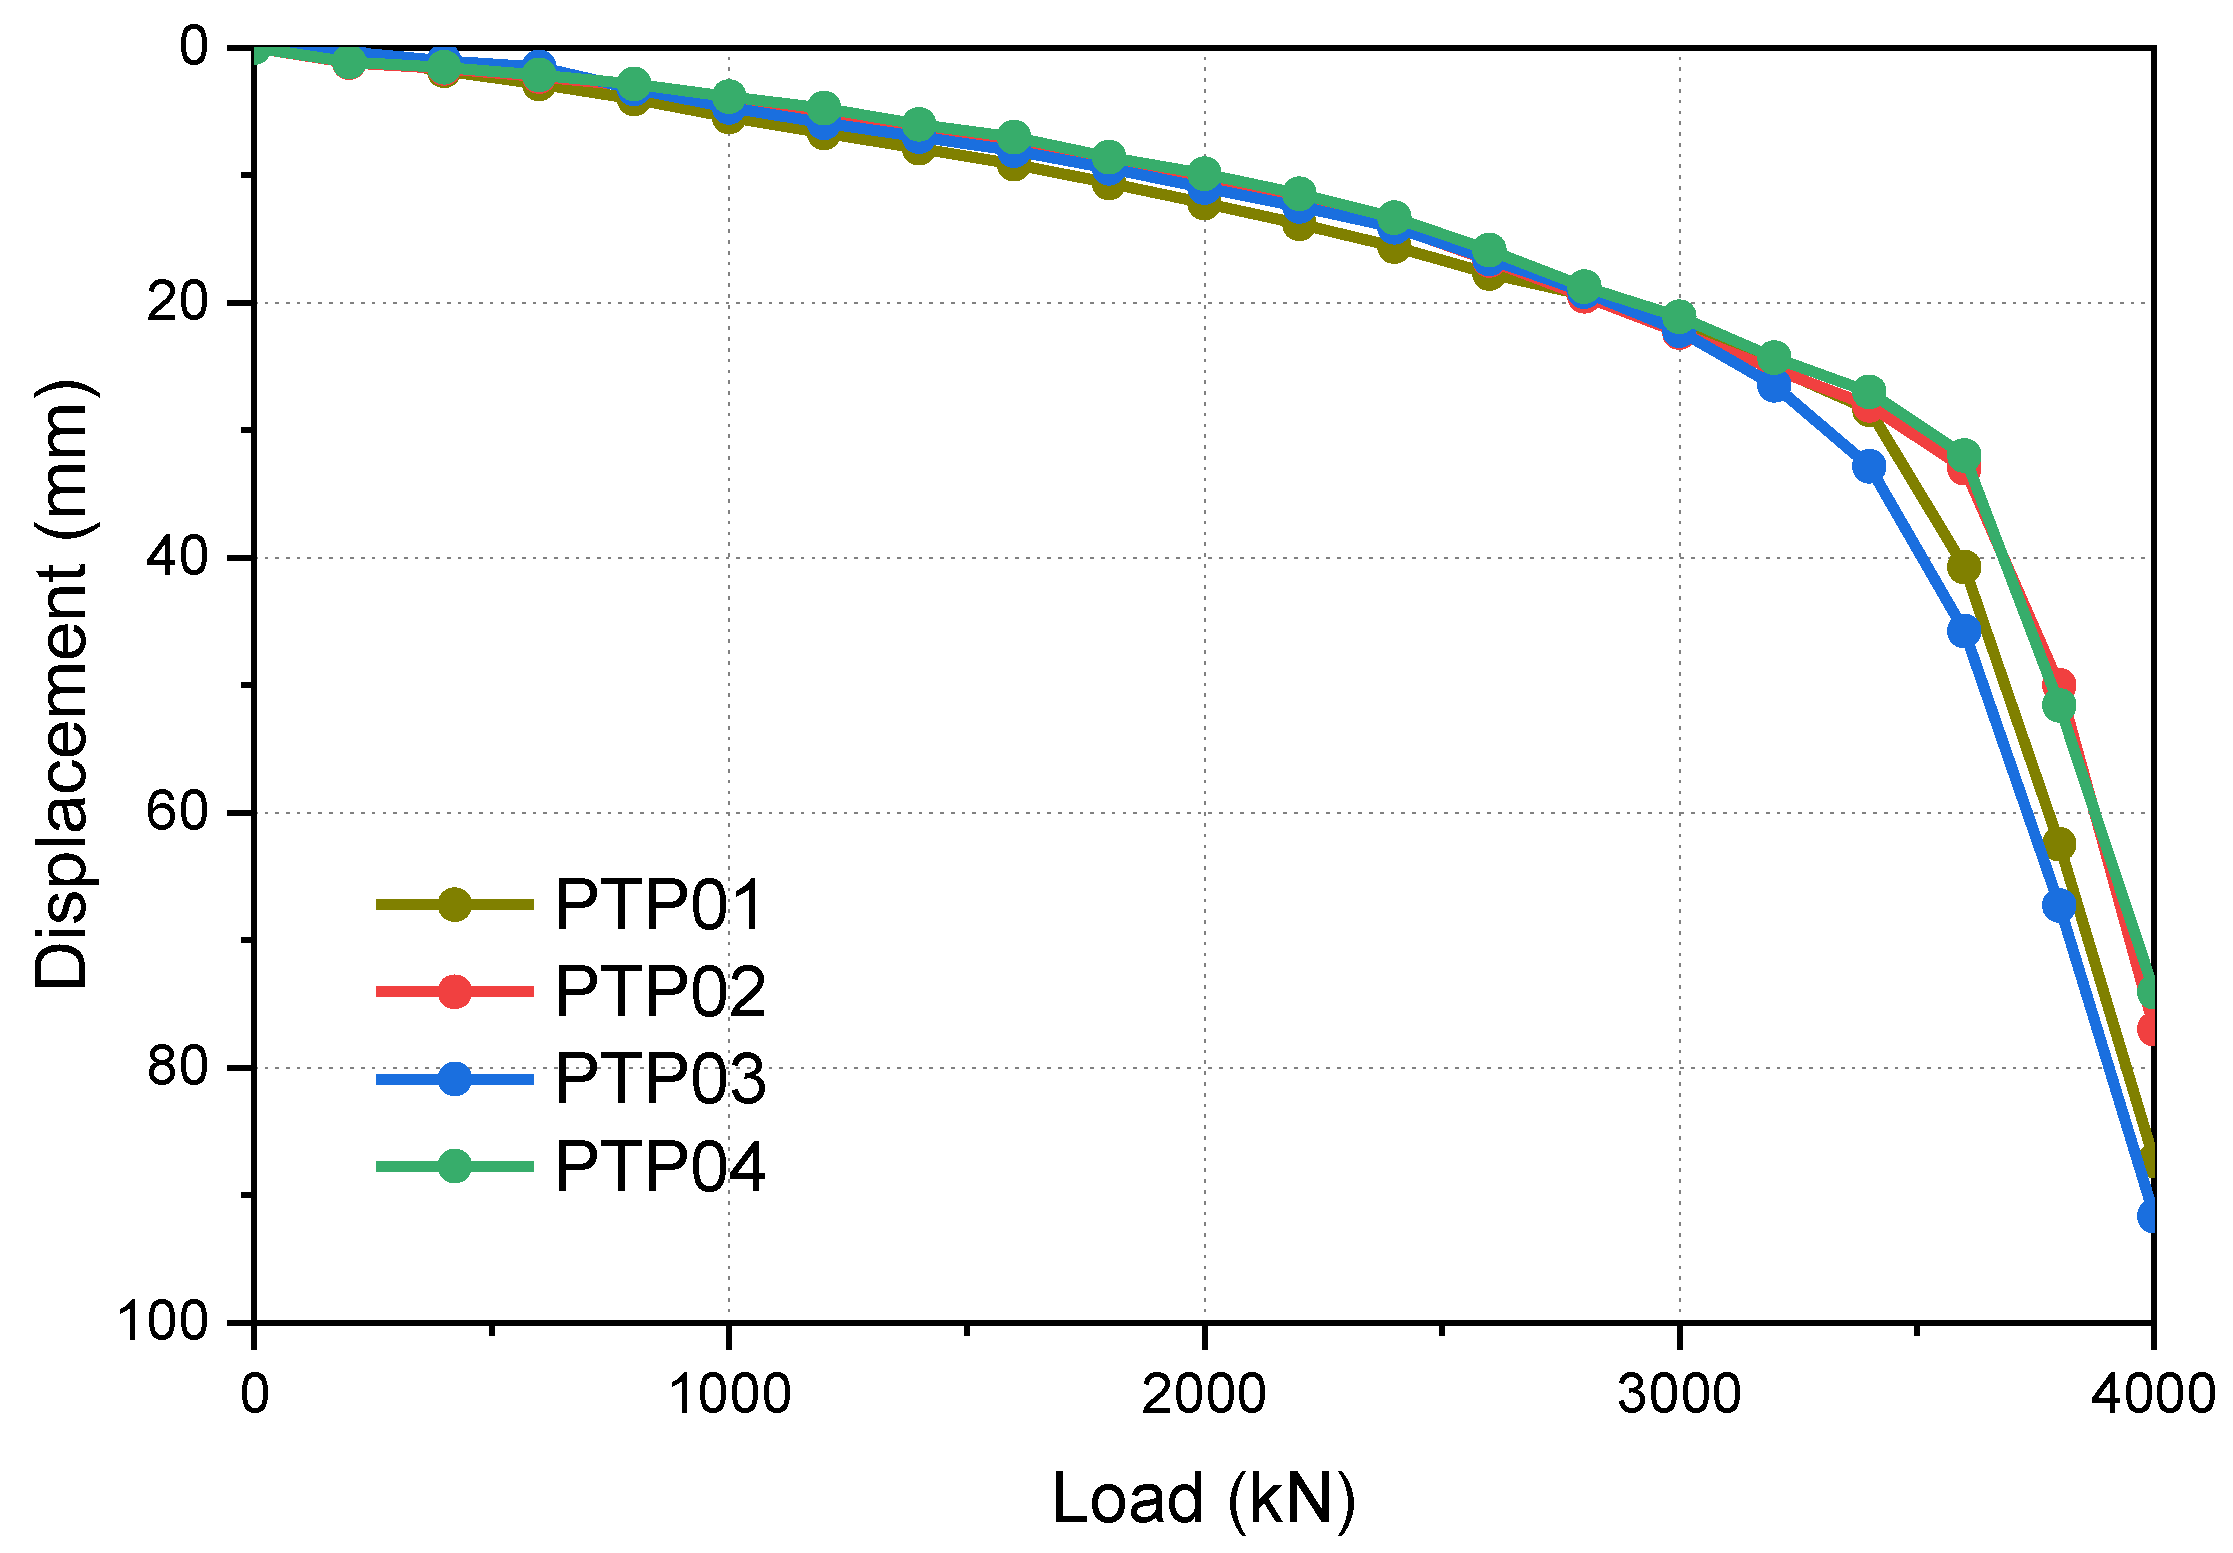
2.2. Pile Load Tests Interpretation

The design of the engineering project was based on the AASHTO LRFD (American Association of State Highway and Transportation Officials LRFD Bridge Design Specification [15]). The axial compressive load tests were carried out to determine pile-bearing capacity of the driven pile. The test pile diameter was 400 mm in diameter and 41.5 m in length.
The β-method has been found to work best for piles in normally consolidated and lightly over consolidated clays. Esrig and Kirby [16] also suggest controlling the value of β to not exceed two and can use this method to calculate the pile in heavily over consolidated clays. Therefore, the AASHTO LRFD recommends the β-method to predict the pile-bearing capacity. In terms of AASHTO LRFD, for a driven pile in cohesive soil or granular soil, the limit skin friction (qs or τs) is evaluated by Equation (5) or Equation (6) as follows, respectively:
q s = β σ v
q s = K δ C F σ v sin ( δ + ω ) cos ω
where σ v is effective vertical stress, K δ is coefficient of lateral earth pressure, C F is correction factor for K δ , δ is friction angle between pile and soil and ω is angle of pile taper from vertical. The value for the parameter β for driven pile can be determined using AASHTO LRFD in terms of OCR and PI, and the values for the parameters δ , C F , K 0 and ω can also be determined by AASHTO LRFD. The lower limit value of β-parameters is applied in theoretical calculation with conservative consideration. Their detailed values for pile-bearing capacity assessment are summarized in Table 2. The pile-bearing capacity was then evaluated as 4257 kN.
A total of four groups of the compressive test were carried out around six months after the filling. The tests were conducted between at the 7th day after the pile installation. As the pile-bearing capacity was predicted as 4257 kN by the aforementioned β-method, in the pile compressive tests, the maximum test load was prescribed as 4000 kN. The value of the step increment load was defined as 5% of the testing load. During the load tests, the condition for the new stage loading was the settlement of the pile caused by the previous stage load less than 0.1 mm within one hour. The test results are plotted in Figure 3.
According to the test findings, it can be stated that the pile load test results were consistent. In the pile compressive test, the max settlement measured under max axial load (4000 kN) was in the range of 70–82 mm, with a regular curvature of the load–settlement behavior. It should be noted that the piles were not tested for failure under the prescribed maximum load. However, AASHTO LRFD suggests further interpreting the load–settlement curve to obtain the maximum information corresponding to the ultimate limit state (ULS). Therefore, the test findings should be mathematically extrapolated. Kou [17] demonstrated that the Chin extrapolation method [18,19], treating the load–settlement curve as a hyperbola, can be used to determine the anticipated ultimate capacity under ULS. The extrapolation results for all tests are shown in Table 3, where the anticipated compressive bearing capacity ranged from 4400 kN to 4600 kN. The closely anticipated ultimate capacities demonstrated that the soil–pile interfacial parameters in the effective stress-based β-method determined from CPTU test can be used for the later finite element analysis with effective stress theory.
In addition, it should be also noted that the extrapolated results were a bit larger than that of the β-method. It is widely known that the β-method is based on the effective stress principle and more suitable for analyzing the consolidation effects and pile long-term working conditions, while the cohesive soils behaved undrained during the pile load test generally. The present observation is mainly because the selection of the lower limit value for β would result in a conservative capacity and the Chin’s method could overpredict the shaft resistance and ultimate pile capacity (Borel et al. [20]).

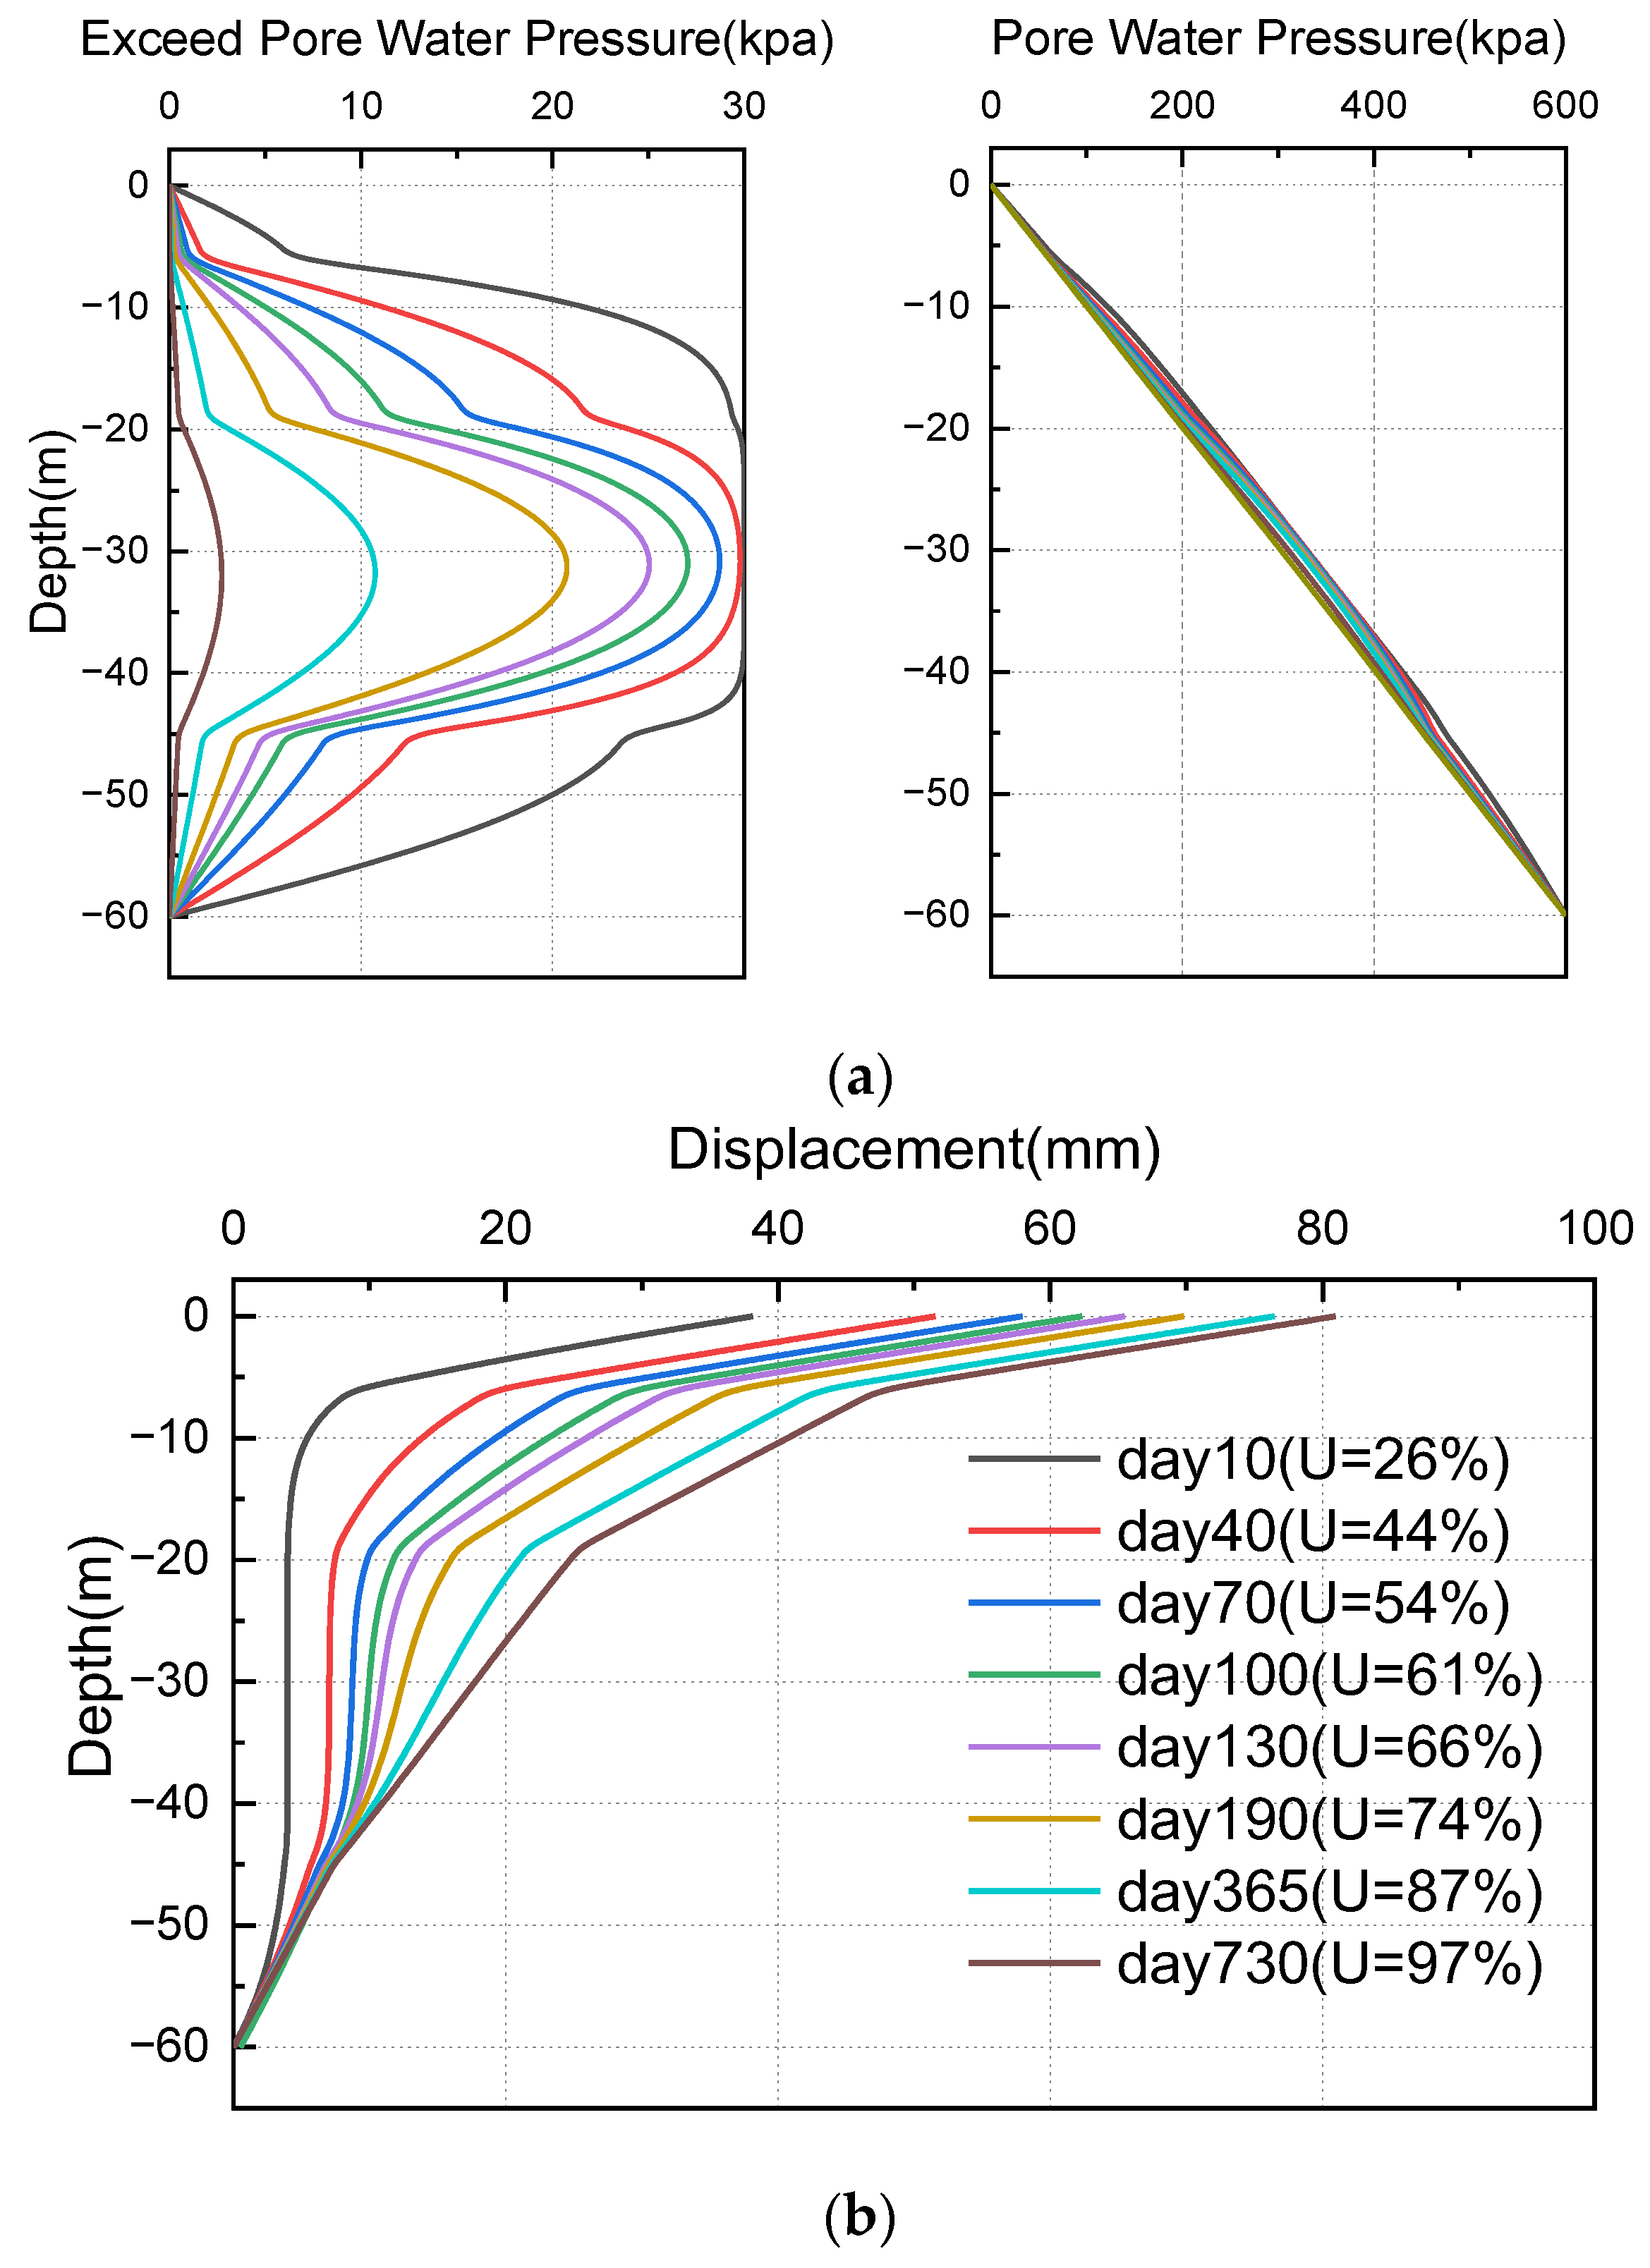
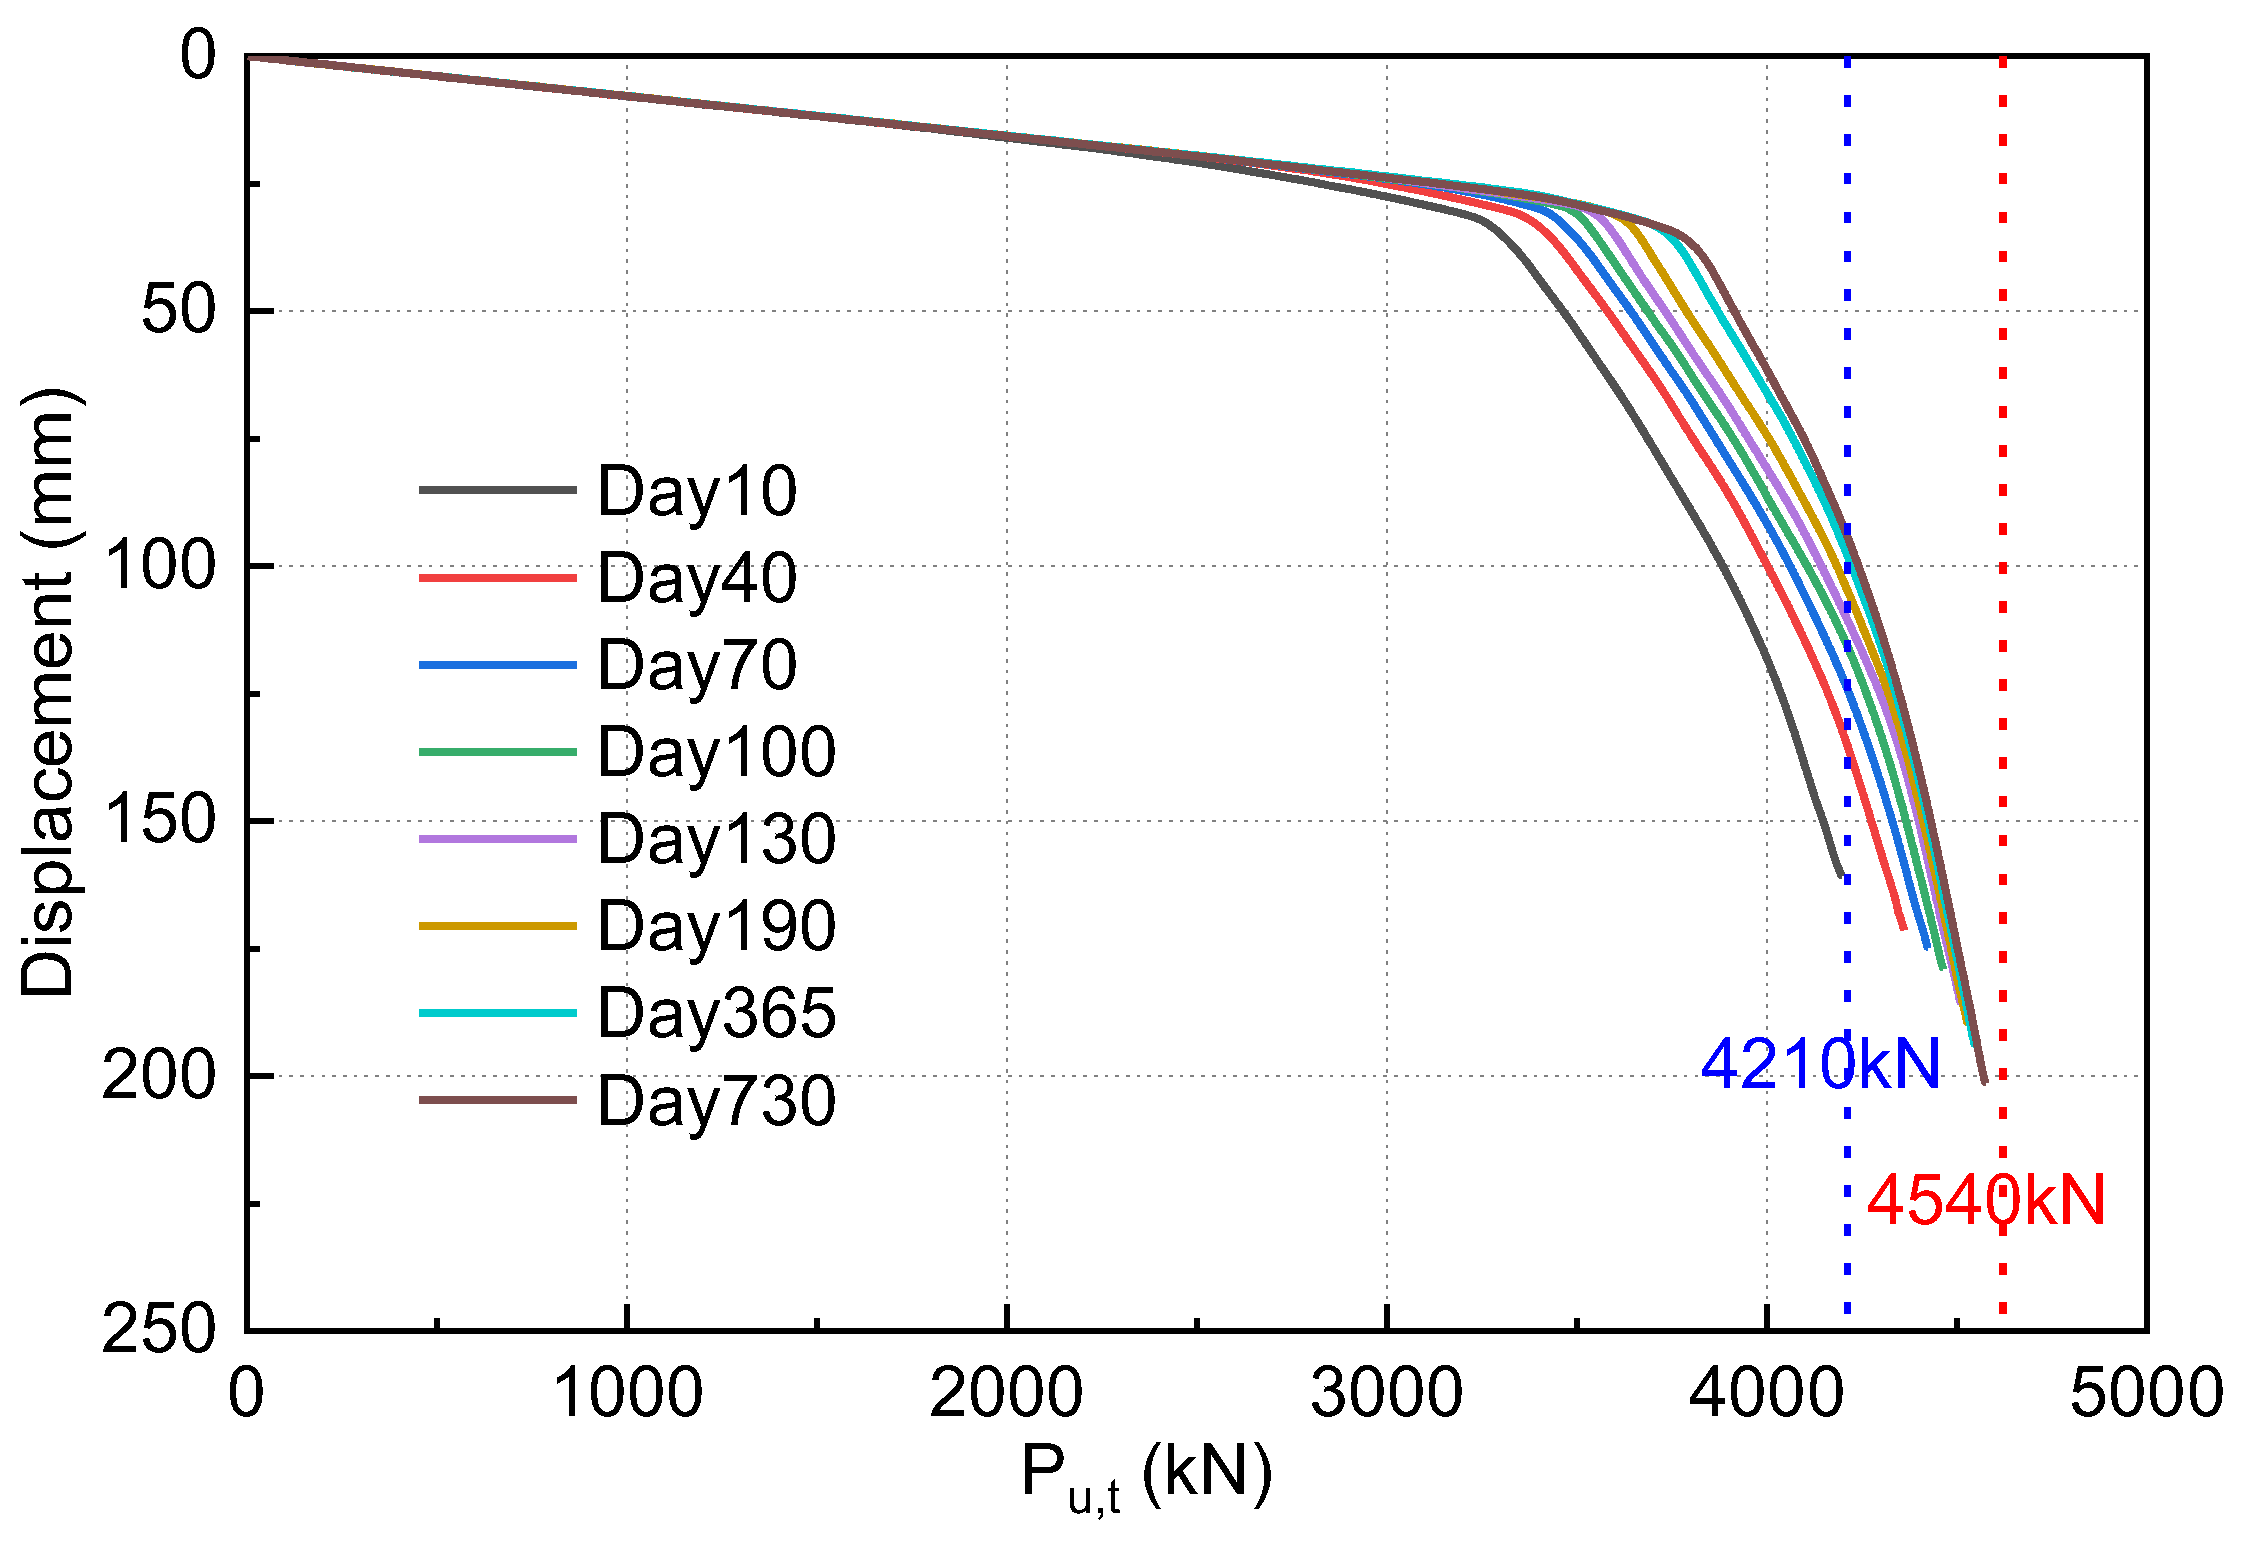
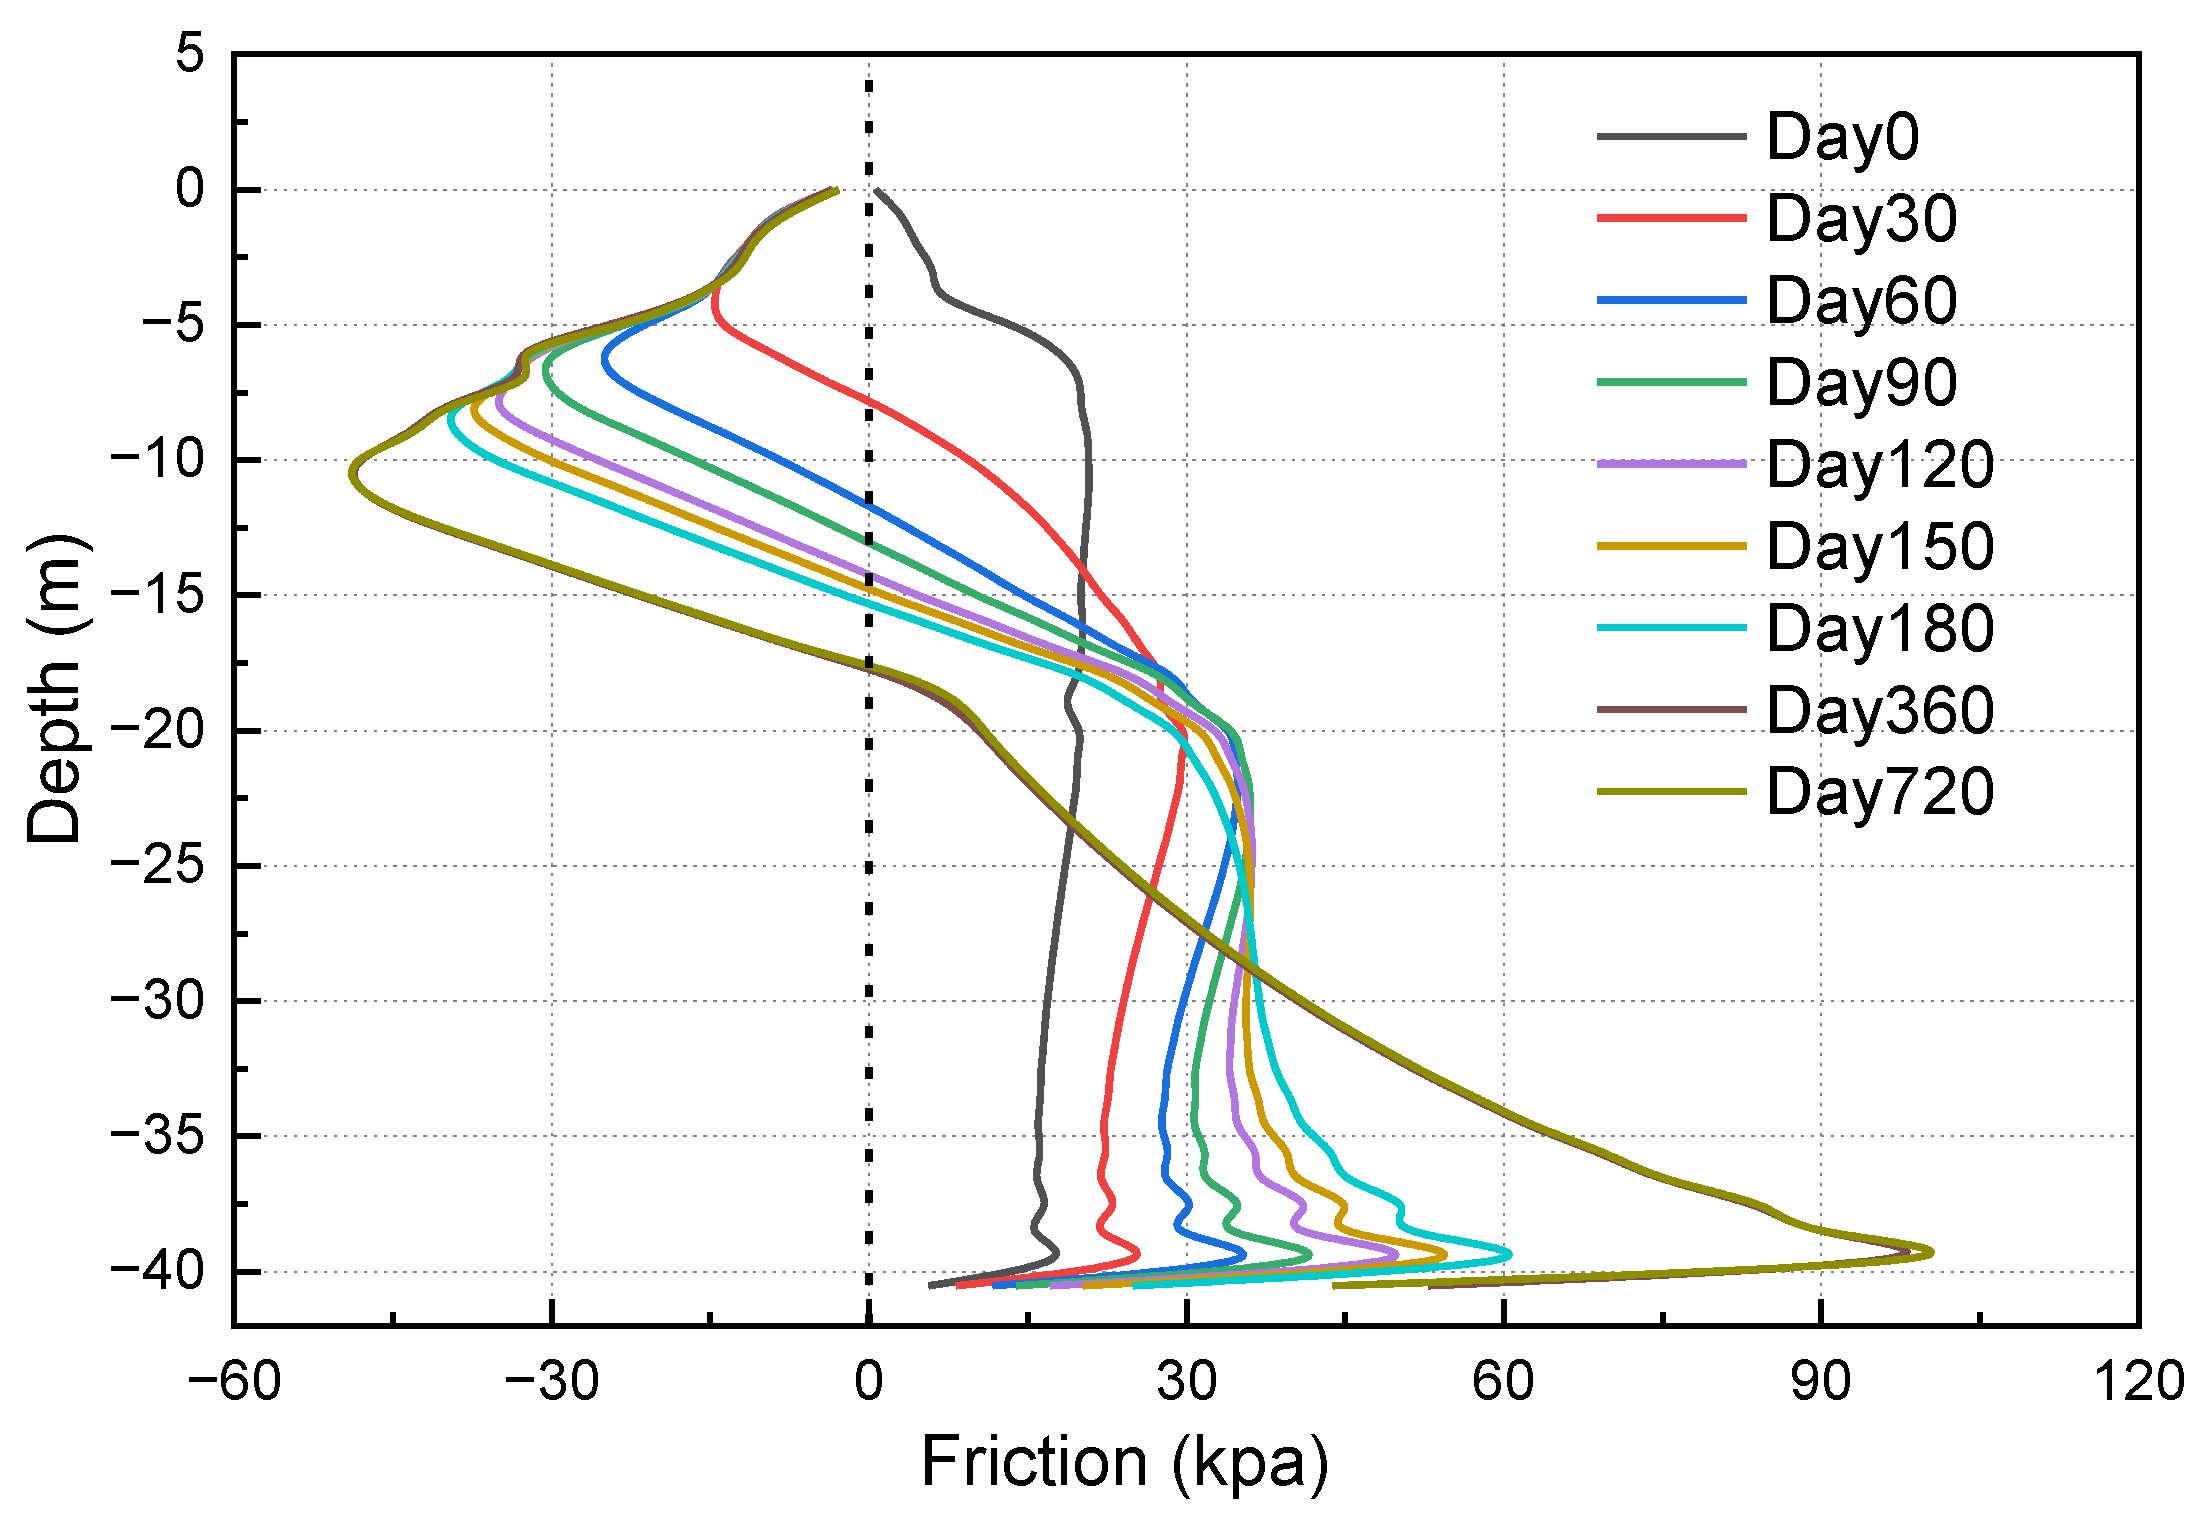
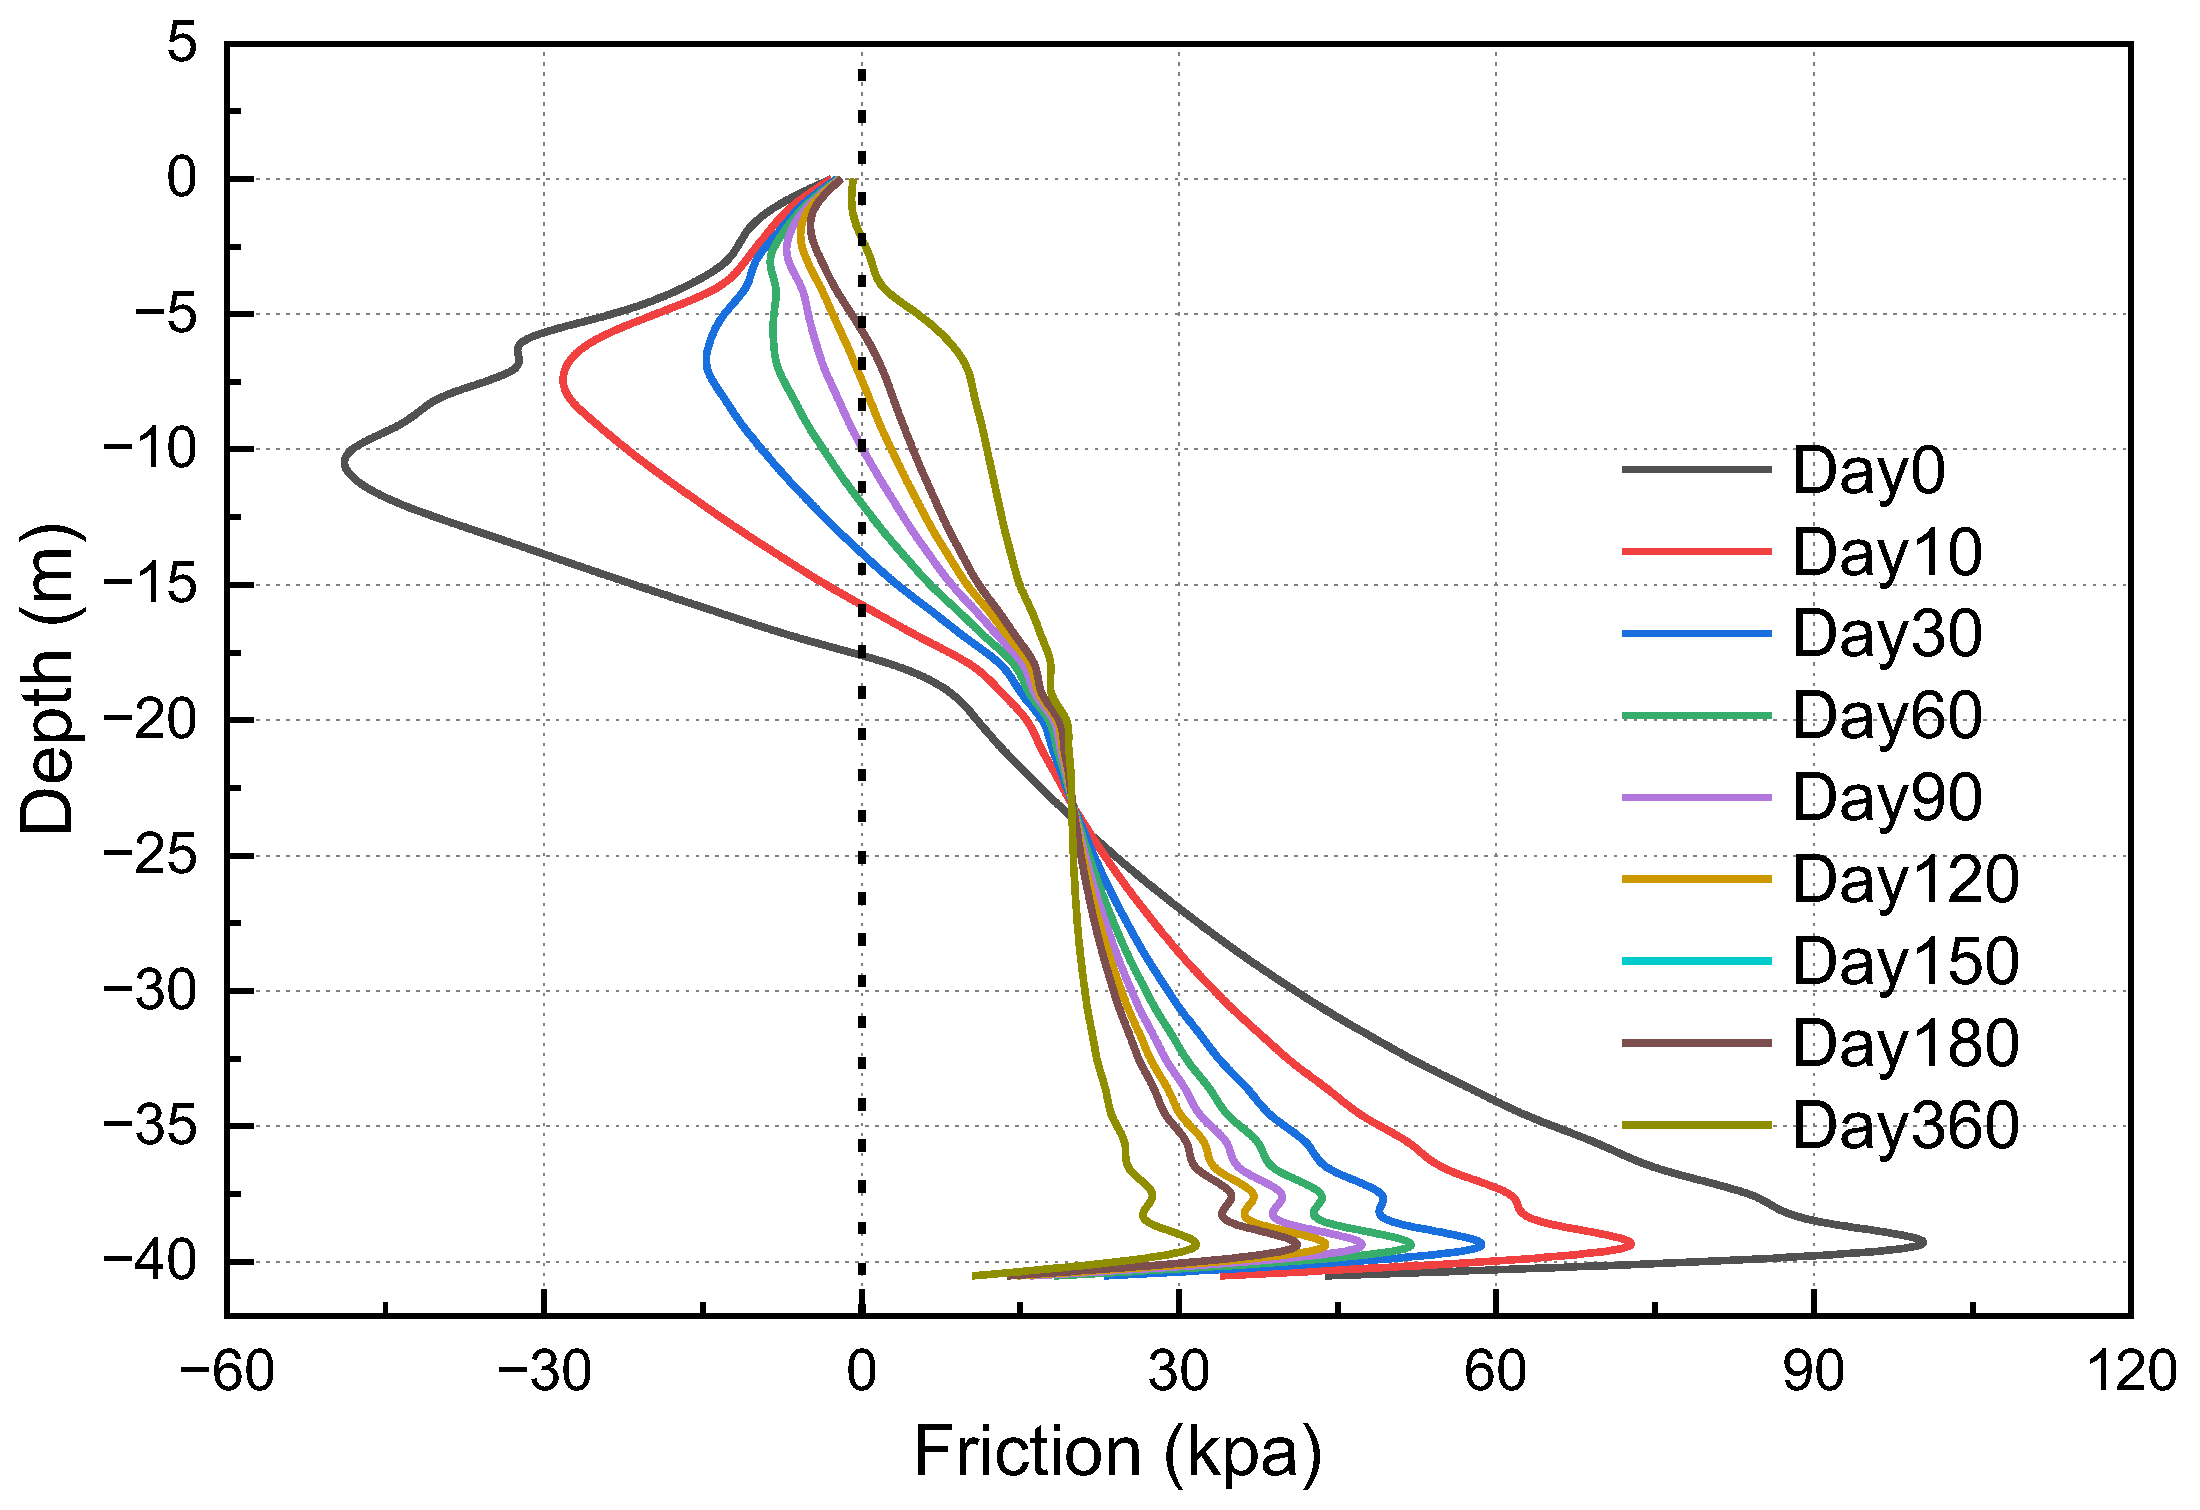
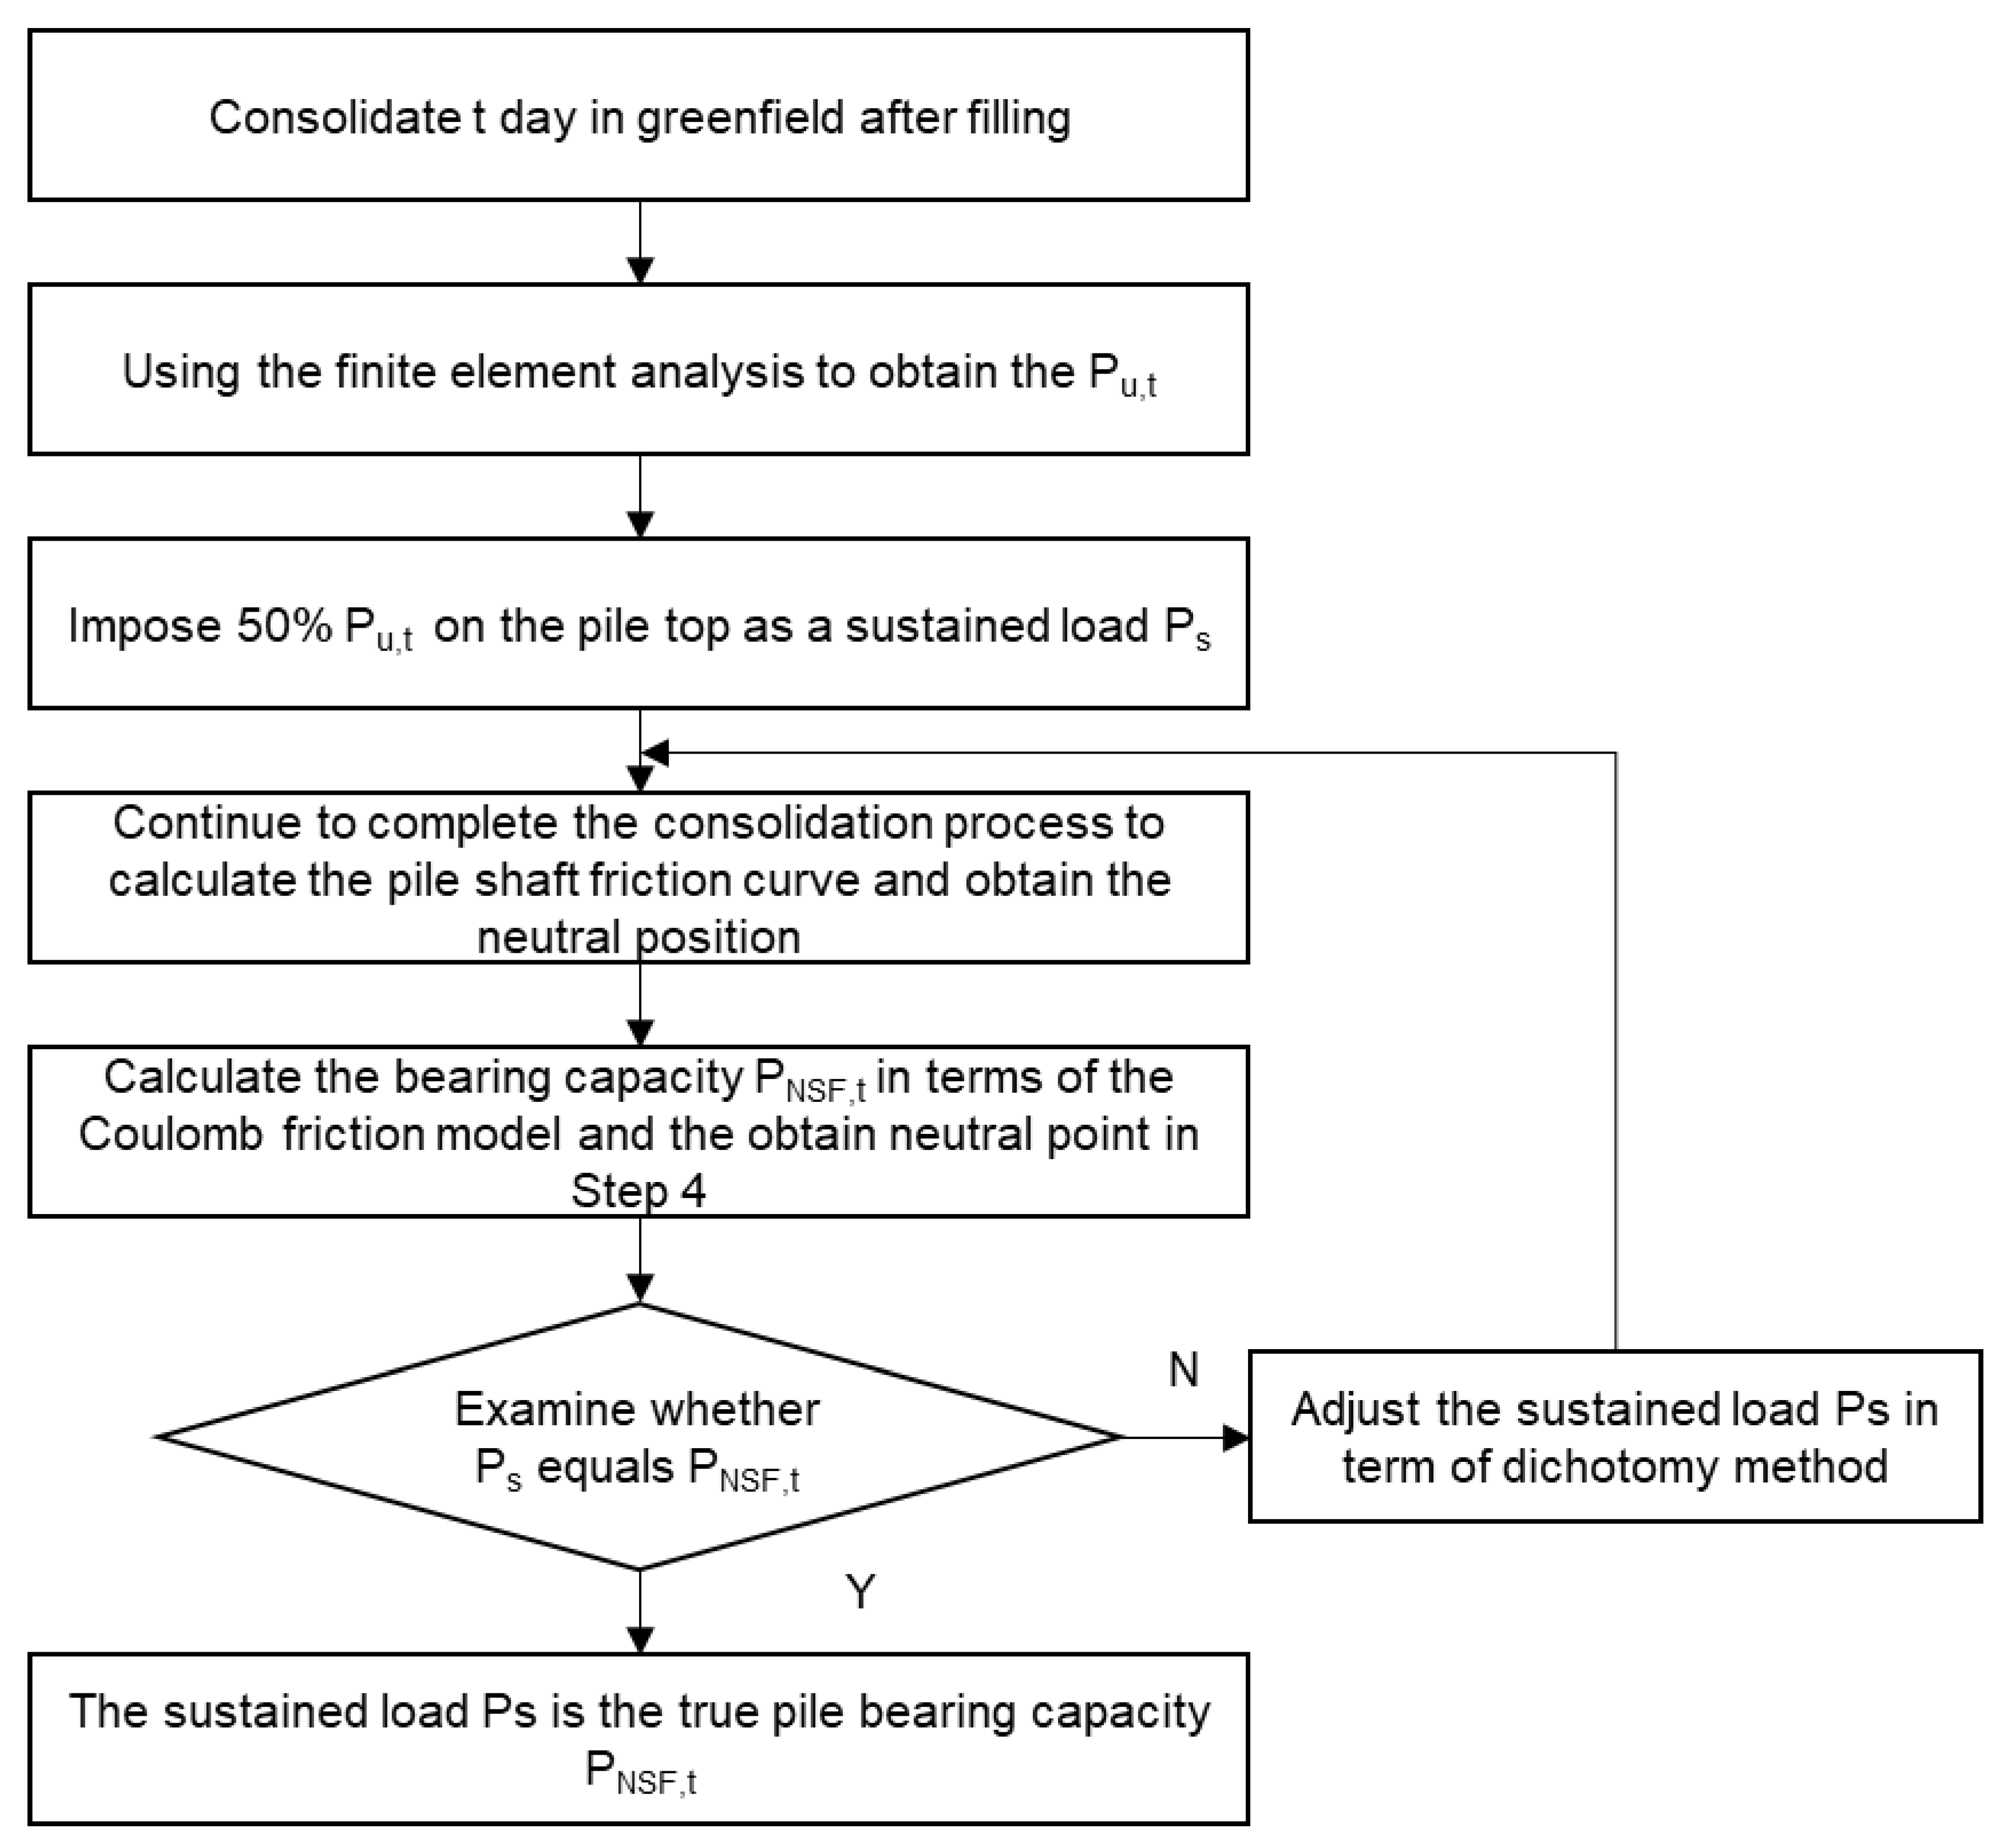
3. Numerical Analysis of Consolidation Influence on Pile Capacity

The numerical simulation method can be used to calculate the capacity of pile foundations in complex geological conditions [21,22,23,24]. In this study, two aspects of the consolidation effect were considered: (1) the placement of the corresponding fills on the surface improves the shear strength of the subsoil layers and leads to a greater capacity for the overall pile foundation; (2) the effect of the fill and the subsequent consolidation produces negative skin friction on the pile, which reduces the load bearing of the pile. By applying pile top load at an appropriate consolidation degree after filling, the pile-bearing capacity can be increased from the two perspectives above.
Liu et al. [6] presented finite element analyses of negative skin friction on a single pile under various influencing factors, including the consolidation time, the properties of pile/soil interface, the intensity of surcharge. Following their works, a series of numerical simulations were further adopted in this study for discussing the influence of NSF on the pile-bearing capacity and the neutral point position of the pile foundation during consolidation period. Finally, a simplified method of planning the pile driving date to achieve a balance between the engineering time limit and pile-bearing capacity is proposed based on the finite element analysis.

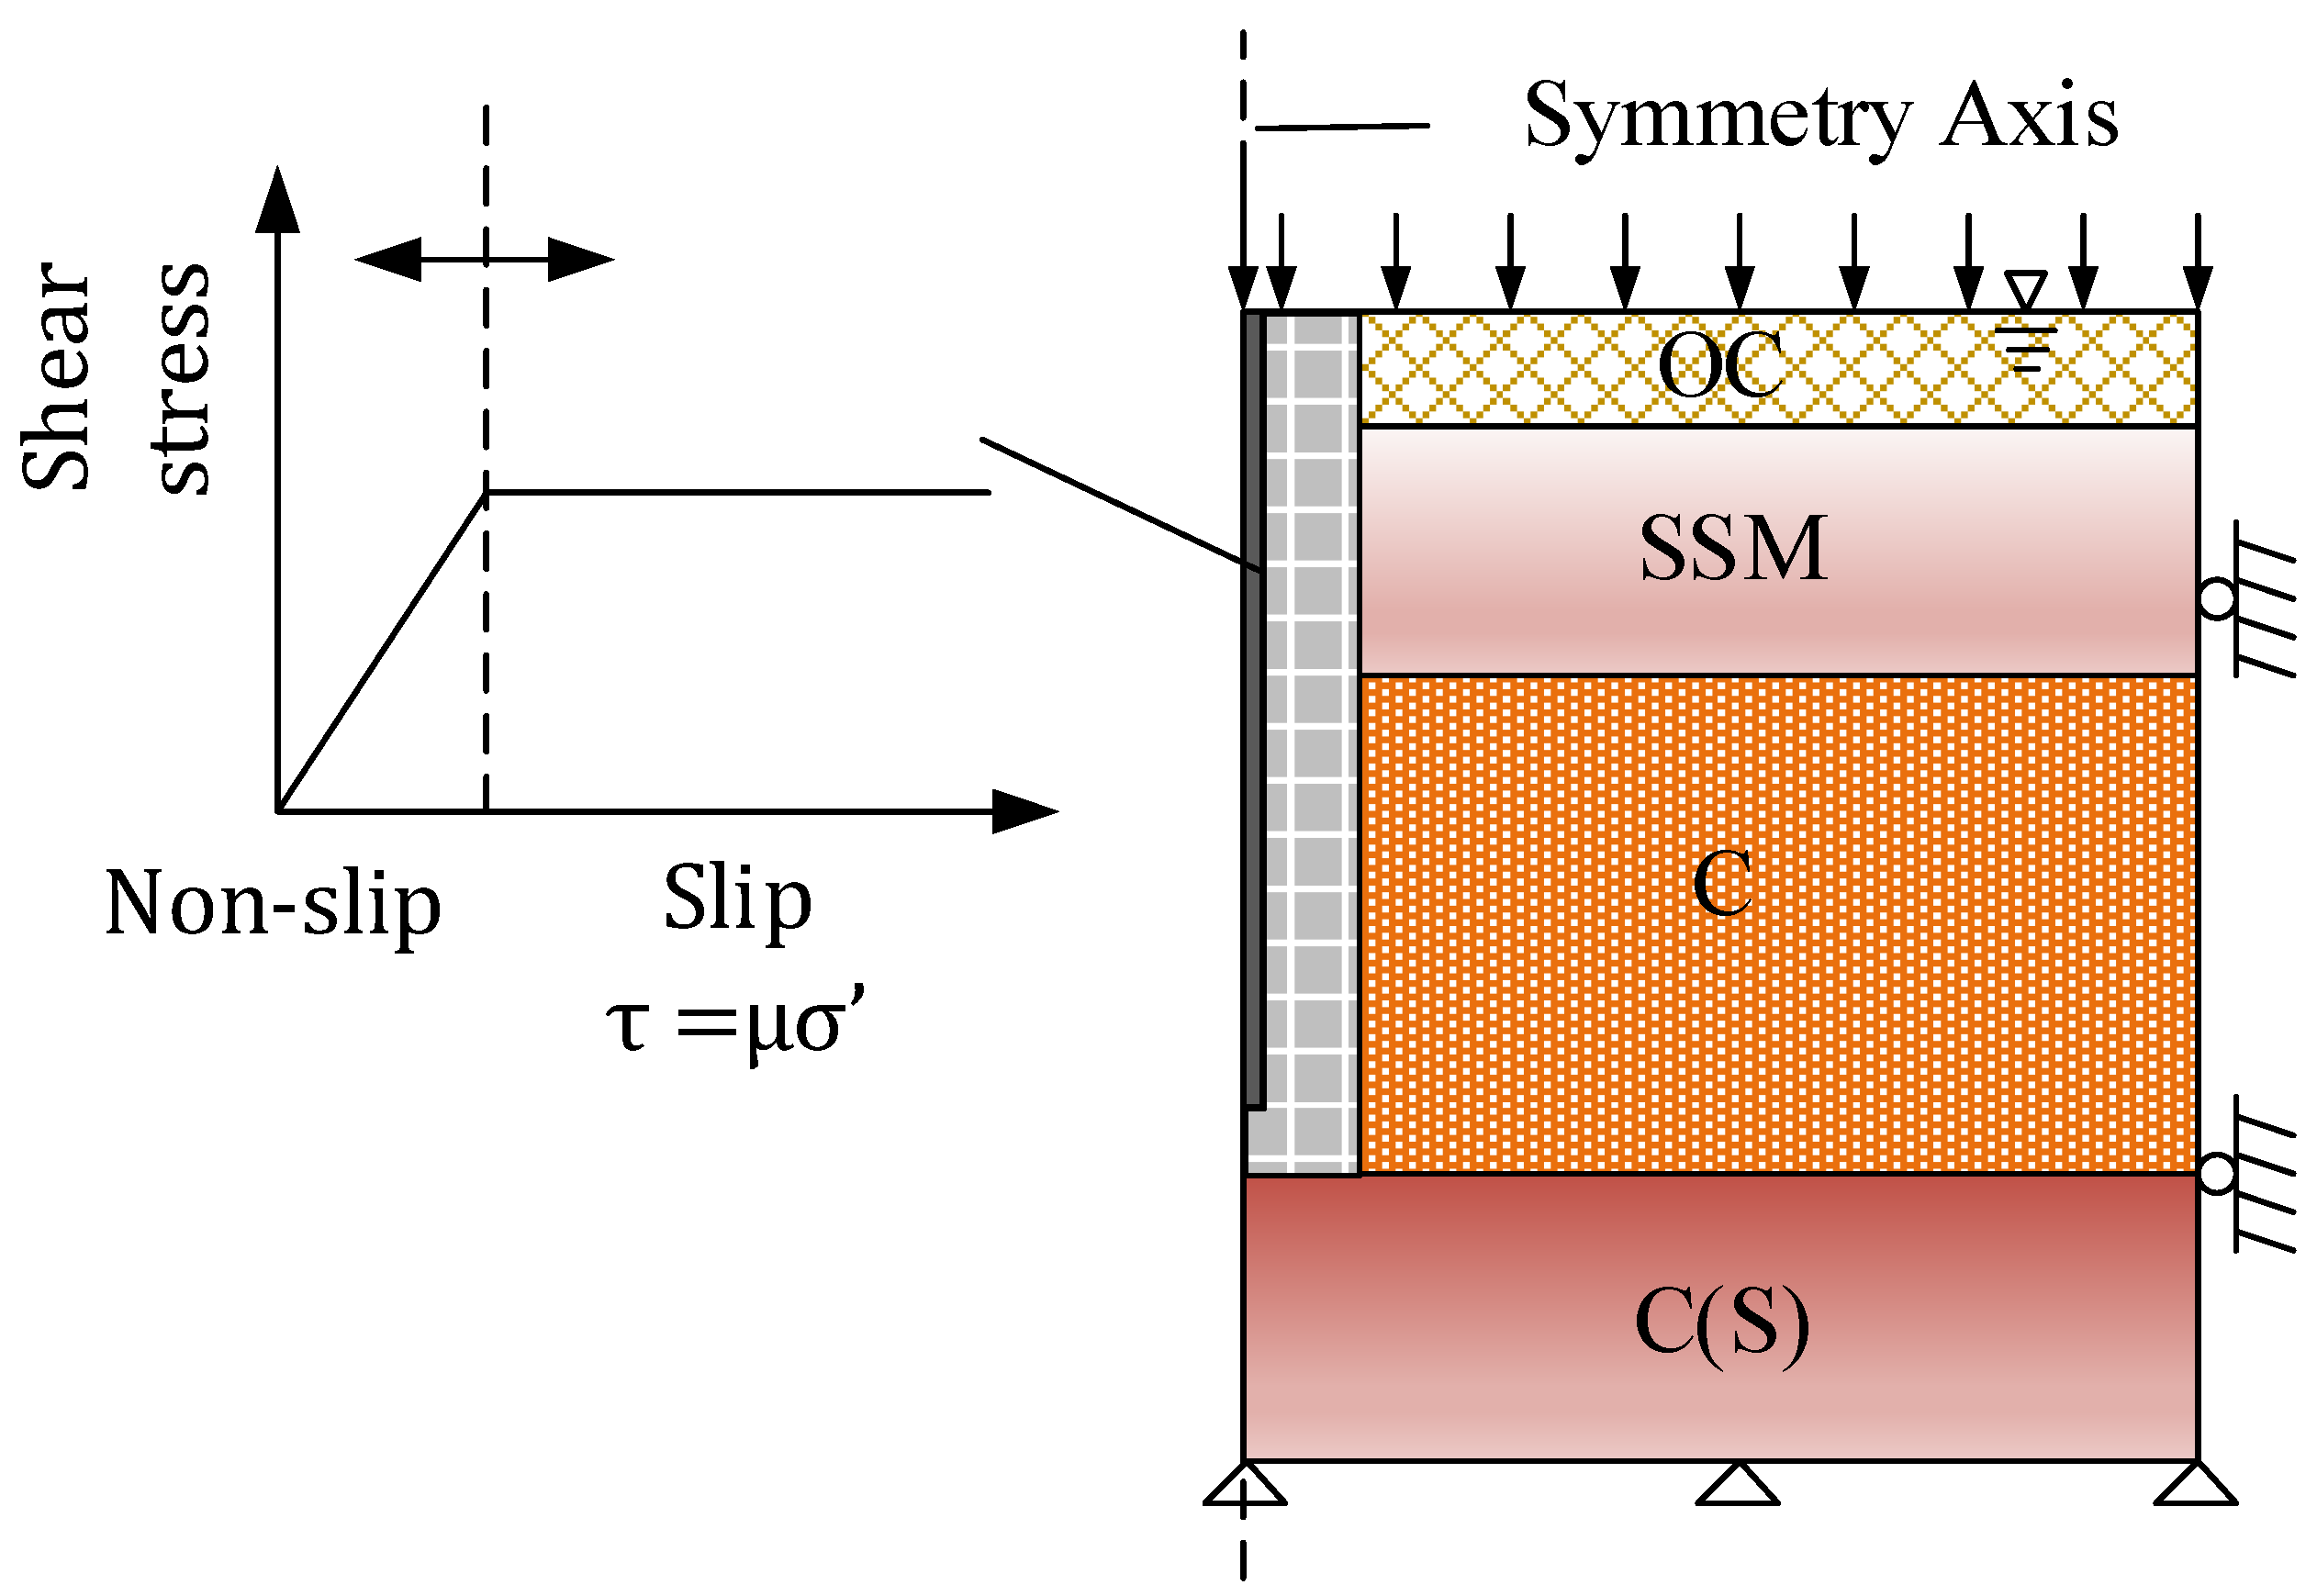
3.1. Finite Element Model

A symmetric calculation model was used to simplify the analysis. The numerical computations are performed by ABAQUS. The vertical boundary on the left side was the symmetrical line, and the right side was fixed in the horizontal direction and free in the vertical direction. The bottom of the model was fixed in both vertical and horizontal directions. The bottom layer was sandy soil with good drainage; thus, the model was set as double-sided drainage. The grid near the pile foundation was better encrypted to reflect the pile foundation’s lateral friction resistance and lessen the impact of concentrated stress. The 42 eight-node bilinear axisymmetric quadrilateral elements (CAX8) were used for the pile, and 7339 eight-node axisymmetric quadrilateral, bilinear displacement, and bilinear pore pressure elements (CAX8P) were selected for soil. The pile foundation adopted isotropic linear elastic material, and the elastic modulus was 30 MPa, the Poisson ratio is 0.3, consistent with the engineering test pile. The soil settlement caused by the surcharge of fills consists of the primary consolidation compression and the secondary consolidation compression like creep. Feng et al. [25] emphasized the importance of the long-term non-linear creep and swelling behavior during land reclamation. However, due to the relatively low permeability of the clays (<10−8 m/s), the surcharge load was mainly taken by the pore pressure. At the early-to-mid stage, the primary consolidation compression due to the dissipation of excess pore pressure had a rapider development than the secondary consolidation. Therefore, following the works of Lee et al. [26] and Liu et al. [6], a non-linear consolidation analysis with an elastic-perfectly plastic soil satisfying the simple Mohr-Coulomb yield criterion was conducted to study the effect the dissipation of excess pore pressure on the pile-bearing capacity. The effect of secondary consolidation was ignored.
The coulomb friction model was widely used to simulate surface contact conditions. The shearing force can be calculated as the normal force multiplied by an interface frictional coefficient μ. The parameter β was used to describe the contact properties of pile–soil interaction in the theoretical calculation. In numerical analyses, the β needs be converted into μ in the finite element calculation by the relationship β = kμ, where k is the lateral earth pressure coefficient [5,26]. This simplified model can take combinations of frictional coefficient, soil unit weight, lateral earth pressure coefficient into consideration to reflect the pile–soil interaction relationship. Lastly, the normal behavior of pile–soil interface is characterized by a no-separation condition to simulate the pile behavior under long term axial load during the consolidation period. The finite element calculation model is shown in Figure 4. The problem is generally analyzed in three steps. Firstly, the self-weight of the pile and soil is applied. Then, a uniform surface load is applied to the ground. Since this step interval is short, no drainage behavior is permitted. Thirdly, the axial pile load is applied after consolidating for a period. By adjusting the consolidation duration, it is possible to investigate the variance in pile-bearing behavior of driving piles with various consolidation degrees.

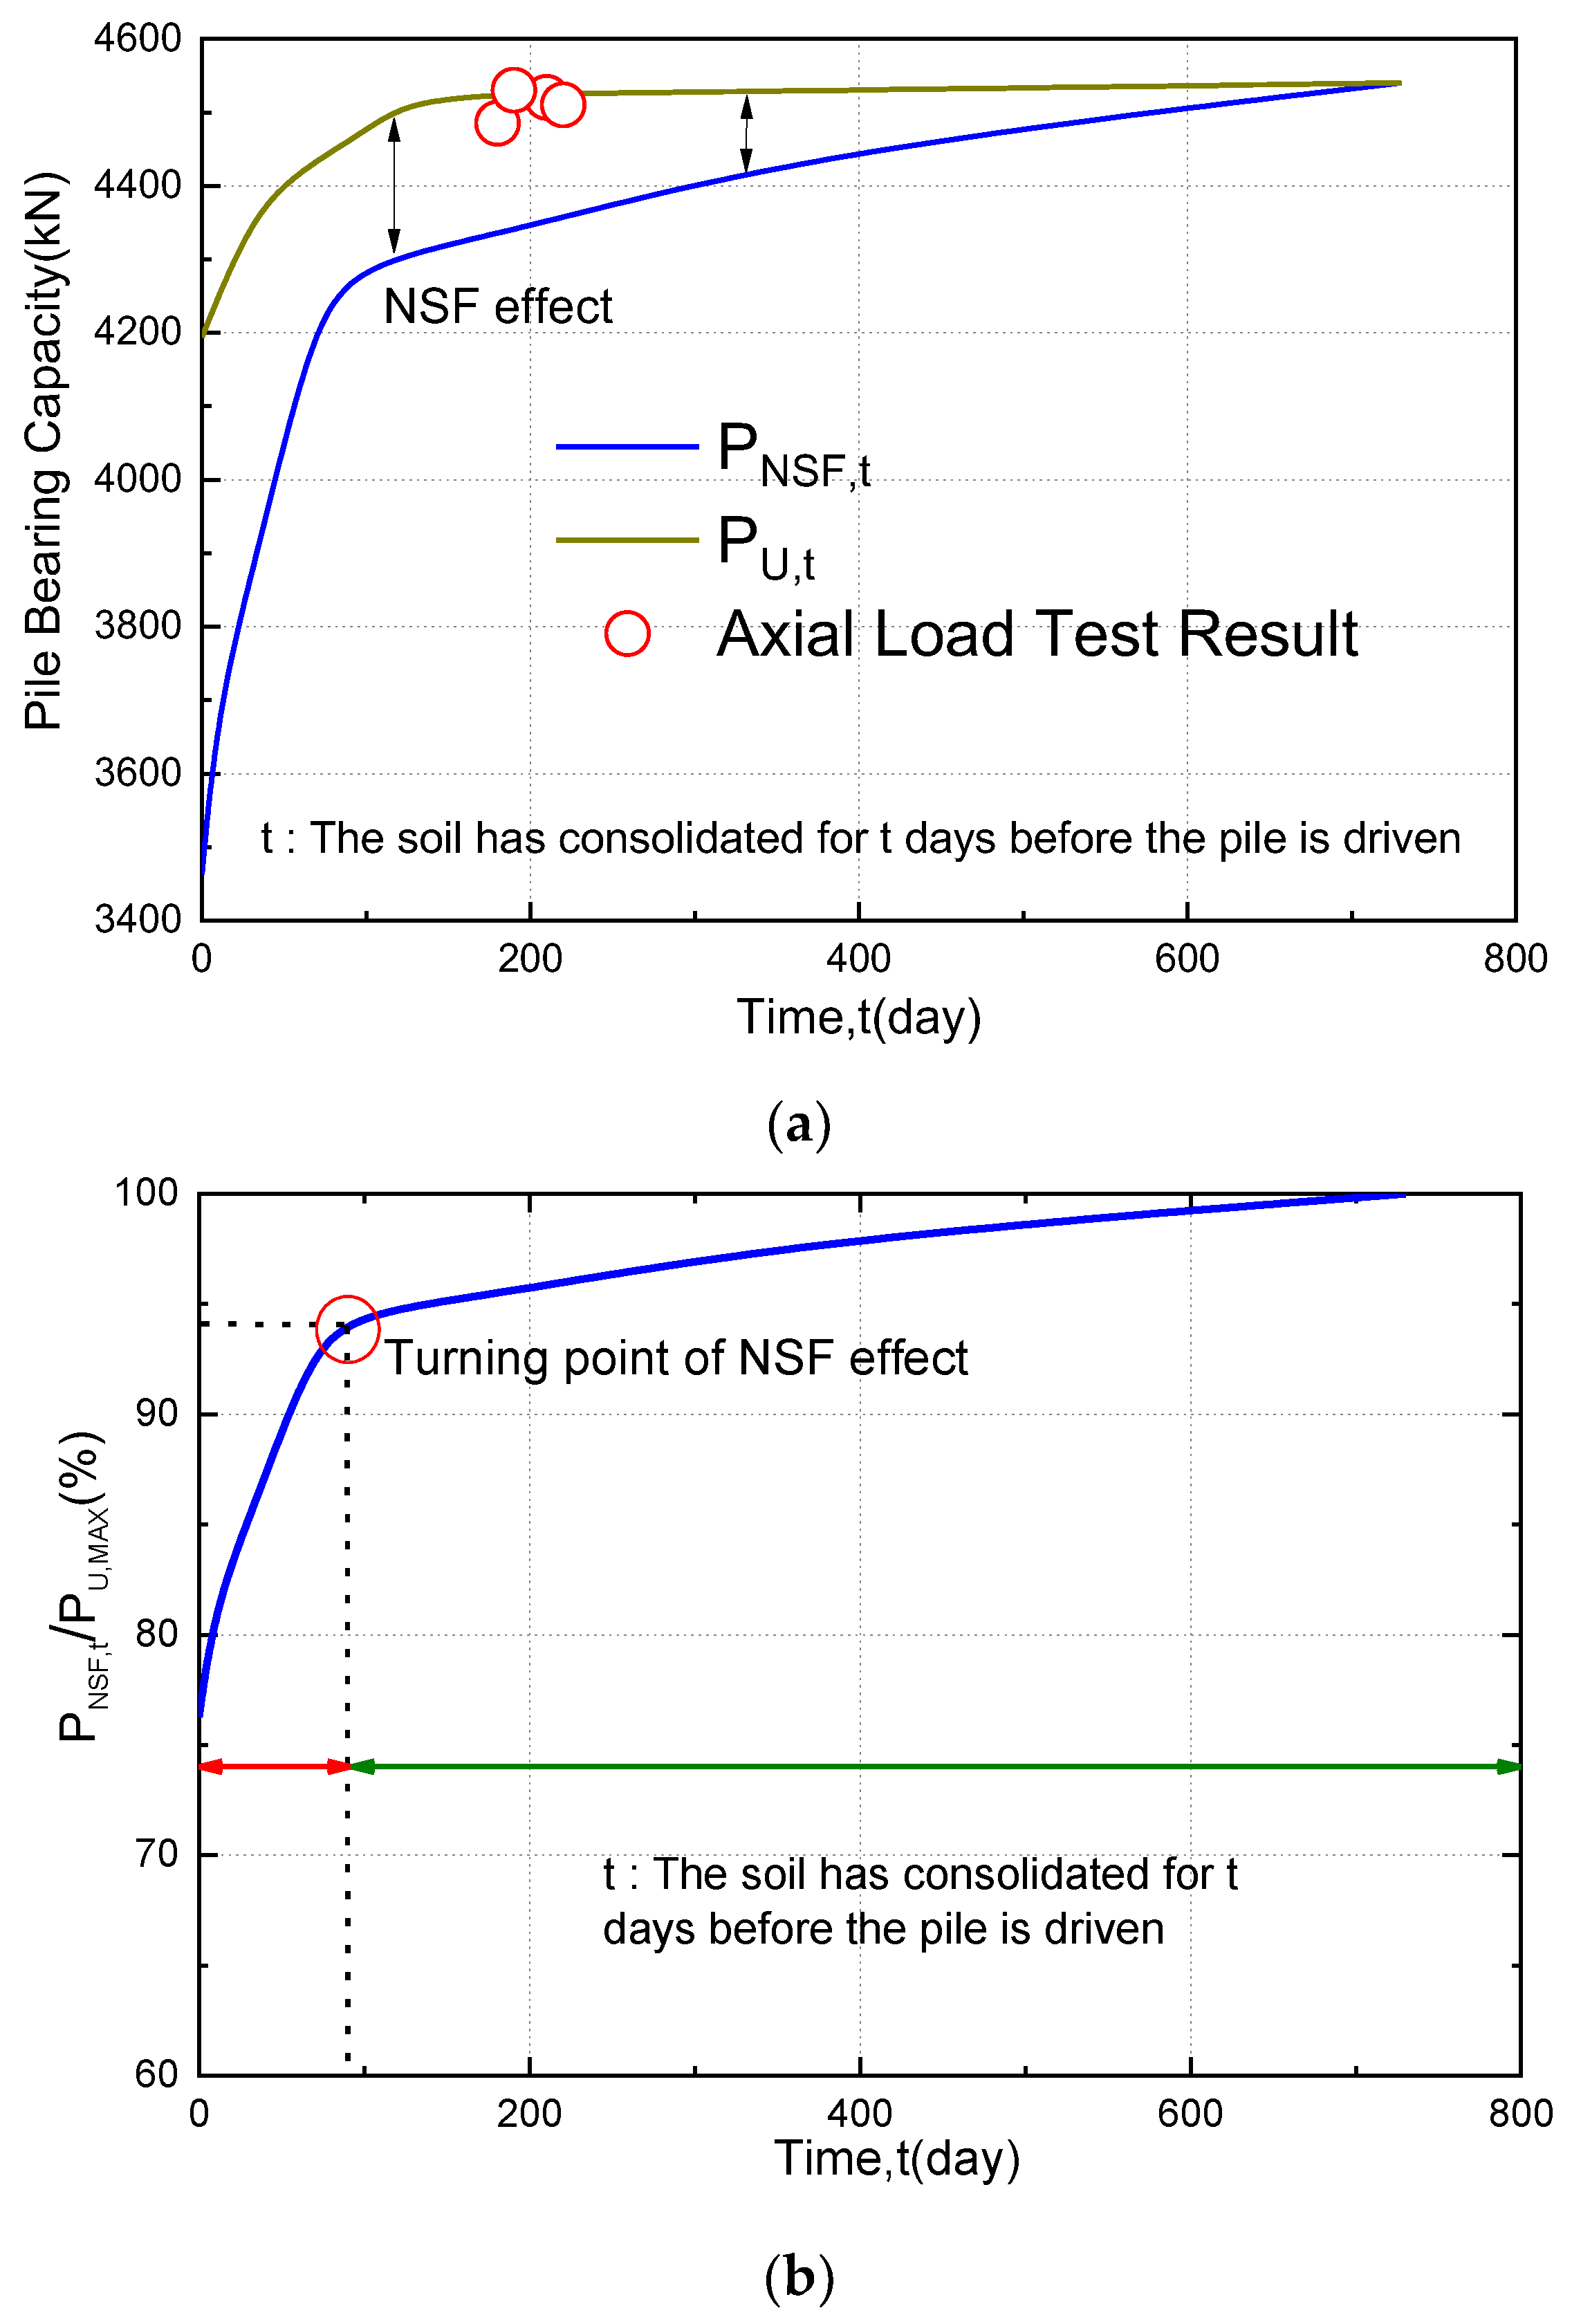
3.2. The Consolidation Effect on Pile-Bearing Capacity

The influence of soil strength increases and NSF on pile-bearing behavior caused by soil consolidation and the pile-bearing capacity under various degrees of consolidation are examined in this subsection. The numerical method was first used to calculate the excess pore water pressure and soil displacement during a 2-year consolidation for further analysis. The result is shown in Figure 5. One important task was to obtain the pile-bearing capacity during the consolidation period. For a pile driven into the soil that has been consolidated for t days, two bearing capacities Pu,t, and PNSF,t can be defined, representing the bearing capacities without and with considering the NSF caused by the further consolidation, respectively.
It was evident that Pu,t can be easily obtained by directly loading the pile to failure in the soil that consolidated for t days. The numerical analysis results are represented in Figure 6.
For the pile driven after filling for about 6–8 months, when the pile top load was noted as 4000 kN, and the pile top displacement was detected as 75–85 mm, which was in good agreement with the test result. The Pu,t increased from 4210 to 4540 kN when the duration of consolidation ranged from 2 days to 2 years. The Pu,t tended to be stable after the consolidation degree reached 66% (after filling about 130 days).
The relationship between consolidation and NSF was investigated to examine the influence of NSF on pile-bearing behavior. The project’s maximum working load of 966 kN designed was used as the sustained load on the pile top in the numerical analysis. Figure 7 shows the friction’s evolution with the consolidation duration, where the pile is driven immediately after filling. The neutral point of the pile foundation gradually descended as the NSF emerged with consolidation. It implied that the pile-bearing capacity decreased during the consolidation.
For piles driven at different times after filling, their friction distributions would differ when the consolidation caused by filling was completed. For this site, a 97% consolidation degree was achieved in two years, and it can be defined that the consolidation has finished. Figure 8 shows the friction distribution of the piles (driven at different times) in two years after filling. Under the same load, the neutral point position becomes higher if the pile is driven after a longer consolidation period. According to the findings, it can be stated that the consolidation duration before the pile construction significantly impacted the pile-bearing capacity. The NSF impact decreased as the consolidation degree increased.
In view of the above-mentioned statements, it is necessary to consider the effect NSF on the pile-bearing capacity. In practical engineering, to determine the PNSF,t (pile-bearing capacity considered NSF), the proportion of neutral point to pile length in different soil is assumed in terms of the engineering experience, ignoring the effect of complex geological conditions [27]. Therefore, a simple procedure to determine PNSF,t, which consists of five steps, was proposed in this study.
In the first stage, the finite element model was established to simulate the greenfield soil layers consolidating t days after filling. In the second stage, the pile axial compressive test was simulated to obtain the Pu,t (As defined earlier, Pu,t represent the bearing capacities of a pile driven into the soil that has been consolidated for t days and without considering the NSF caused by the further consolidation). The 50% Pu,t was applied on the pile head as sustained load Ps. In the third stage, completing the numerical model’s consolidation process was continued to obtain the pile shaft friction curve and the neutral point position. In the fourth stage, an assumption to limit skin friction at the pile–soil interface was fully developed [28,29]. Therefore, it is theoretically possible to determine the PNSF,t, by deducting the positive friction resistance below the neutral point from the negative friction above it. The value of friction can be calculated using Coulomb friction model parameters. In the last stage, the sustained load Ps was compared with PNSF,t. If Ps was found to be equal to the theoretically calculated PNSF,t, it could be considered that Ps represented the true PNSF,t. If not, the sustained load Ps was adjusted according to the dichotomy method and back to the third stage. The calculation process is shown in Figure 9.
This methodology can arrange the installation date of pile foundations if an engineering project has a time limit. In the wind power plant project, this method was used to calculate PNSF,t. The result is illustrated in Figure 10a. Under the condition that the pile was driven directly without consolidation, the PNSF,t was noted as 3462 kN, significantly lower than Pu,t. When the pile was driven after different consolidation durations, the PNSF,t rapidly increased in the first three months. Then, the increase of PNSF,t gradually became slow, and the difference between PNSF,t, and Pu,t also decreased slowly. Finally, when the consolidation was completed, the PNSF,t was equal to Pu,t.
To better reflect the relationship between NSF’s effect on pile-bearing capacity and the consolidation time before driving the pile, the PMAX is defined as the pile-bearing capacity when driving the pile after two years, namely the maximum value of Pu,t. The value of PNSF,t /PMAX can reflect the effect of NSF. The findings are presented in Figure 10b. PNSF,t /PMAX had a rapid increase trend from 76% to 92% in the first three months, implying the influence of NSF on pile-bearing capacity decreased rapidly. The turning point occurred after three months, and PNSF,t /PMAX only increased 7% until complete consolidation. It is demonstrated that, after the turning point, the impact of NSF caused by consolidation on pile-bearing capacity rapidly decreased, which can be a feasible moment to install the pile. The pile-bearing capacity behavior and the turning point may be different due to soil condition. For other specific engineering projects, the feasible moment of installing piles on a filled site can be estimated using the proposed method.

4. Conclusions

The CPTU tests were conducted to calibrate the soil properties, of which the rationalities were verified by comparisons of the pile-bearing capacities between the full-scale axial compressive tests and the β-method. A series of numerical simulations were also conducted to further investigate the feasible moment of installing piles on a filled site.
The fills on tidal area can improve the shear strength of the lower soil layers, and the degree of strength increase becomes slower when the consolidation degree becomes higher. The NSF effect on pile-bearing behavior changes during the consolidation period. The neutral point of the pile foundation gradually descended as the NSF emerged with consolidation. It implies that the pile-bearing capacity decreases during the consolidation. For piles driven at different times after filling, their friction distributions would differ when the consolidation caused by filling is completed. Therefore, the negative influence of NSF can be effectively reduced when installing the pile at a high degree of consolidation.
However, due to the time limit of practical engineering, it is impossible to install piles when the site consolidation is fully completed. Therefore, a straightforward method of planning the pile driving date to achieve a balance between the engineering time limit and pile-bearing capacity is proposed.
Based on the method, a turning point on the curve of the pile-bearing capacity PNSF,t considering the NSF effect versus the corresponding pile driving date can be found. When the pile is installed after the consolidation time represented by the turning point, there is a slight further improvement in pile capacity with time. This method not only can effectively reduce the adverse effect of consolidation on the pile-bearing capacity, but also minimize the construction period. Finally, it should be noted that the consolidation time represented by the turning point was derived for the present soil profile, which may be different due to soil conditions. For a specific engineering project on coastal tidal flat with fill, it can be a useful tool to estimate feasible moment of installing piles.

Author Contributions

Conceptualization, K.S. and J.Y. (Jian Yu); methodology, J.Y. (Juntian Yao) and J.Y. (Jian Yu); software, J.Y. (Juntian Yao); validation, K.S., K.W. and J.Y. (Jian Yu); investigation, K.W.; resources, K.S. and K.W.; data curation, K.W.; writing—original draft preparation, K.S.; writing—review and editing, J.Y. (Jian Yu); visualization, J.Y. (Juntian Yao); supervision, J.Y. (Jian Yu); funding acquisition, K.S. and K.W. All authors have read and agreed to the published version of the manuscript.

Funding

This research was funded by the National Natural Science Foundation of China, grant numbers 52101334 and 52108356.

Institutional Review Board Statement

Not applicable.

Informed Consent Statement

Not applicable.

Data Availability Statement

Some data, including the tables, figures and references that support the finding of this study, are openly available from the corresponding author upon reasonable request.

Conflicts of Interest

The authors declare no conflict of interest.

References

  1. Henkel, D.J. The shear strength of saturated remolded clays. In Proceedings of the Research Conference on Shear Strength of Cohesive Soils, ASCE, Boulder, CO, USA, 13–17 June 1960; pp. 533–554. [Google Scholar]
  2. Terzaghi, K.; Peck, R.B. Soil Mechanics in Engineering Practice, 2nd ed.; Wiley: New York, NY, USA, 1967; p. 729. [Google Scholar]
  3. Shen, Z. Engineering properties of soft soils and design of soft ground. Chin. J. Geotech. Eng. 1998, 20, 12. [Google Scholar]
  4. Fellenius, B.H. Negative Skin Friction of Piles. Second International Seminar, Pile Foundations; Nanyang Technological Institution: Singapore, 1984; p. 12. [Google Scholar]
  5. Al-Tabbaa, A.; Lee, C.J.; Bolton, M.D. Numerical modelling of group effects on the distribution of dragloads in pile foundations. Géotechnique 2002, 52, 325–335. [Google Scholar]
  6. Liu, J.; Gao, H.; Liu., H. Finite element analyses of negative skin friction on a single pile. Acta Geotech. 2012, 7, 239–252. [Google Scholar] [CrossRef]
  7. Xu, D.S.; Xu, X.Y.; Li, W.; Fatahi, B. Field experiments on laterally loaded piles for an offshore wind farm. Mar. Struct. 2020, 69, 102684. [Google Scholar] [CrossRef]
  8. Skov, R.; Denver, H. Time-dependence of bearing capacity of piles. In Proceedings of the Third International Conference on the Application of Stress-Wave Theory to Piles, Ottawa, ON, Canada, 25–27 May 1988; pp. 25–27. [Google Scholar]
  9. Robertson, P.K. Soil classification using the cone penetration test. Can. Geotech. J. 1990, 27, 151–158. [Google Scholar] [CrossRef]
  10. Robertson, P.K. Interpretation of cone penetration tests—A unified approach. Can. Geotech. J. 2009, 46, 1337–1355. [Google Scholar] [CrossRef] [Green Version]
  11. Shuttle, D.A.; Cunning, J. Liquefaction potential of silts from CPTu. Can. Geotech. J. 2007, 44, 1–19. [Google Scholar] [CrossRef]
  12. Wride, C.E.; Robertson, P.K.; Biggar, K.W.; Campanella, R.G.; Hofmann, B.A.; Hughes, J.M.O.; Kupper, A.; Woeller, D.J. Interpretation of in situ test results from the CANLEX sites. Can. Geotech. J. 2000, 37, 505–529. [Google Scholar] [CrossRef]
  13. Bolton, M.D. The strength and dilatancy of sands. Géotechnique 1986, 36, 65–78. [Google Scholar] [CrossRef] [Green Version]
  14. Kulhawy, F.H.; Mayne, P.W. Manual on Estimating Soil Properties for Foundation Design (No. EPRI-EL-6800); Electric Power Research Inst.: Palo Alto, CA, USA; Cornell Univ.: Ithaca, NY, USA; Geotechnical Engineering Group: Exton, PA, USA, 1990. [Google Scholar]
  15. AASHTO LRFD (American Association of State Highway and Transportation Officials LRFD Bridge Design Specification). LRFDBDS-9; American Association of State Highway and Transportation Officials: Washington, DC, USA, 2020. [Google Scholar]
  16. Esrig, M.E.; Kirby, R.C. Advances in General Effective Stress Method for the Prediction of Axial Capacity for Driven Piles in Clay. In Proceedings of the 11th Annual Offshore Technology Conference, Houston, TX, USA, 30 April–3 May 1979; pp. 437–449. [Google Scholar]
  17. Kou, H.; Chu, J.; Guo, W.; Zhang, M. Pile load test of jacked open-ended prestressed high-strength concrete pipe pile in clay. Proc. Inst. Civ. Eng.-Geotech. Eng. 2018, 171, 243–251. [Google Scholar] [CrossRef]
  18. Chin, F.K. Estimation of the ultimate load of piles from tests not carried to failure. In Proceedings of the 2nd Southeast Asian Conference on Soil Engineering, Singapore, 11–15 June 1970; pp. 81–90. [Google Scholar]
  19. Chin, F.K. The inverse slope as a prediction of ultimate bearing capacity of piles. In Proceedings of the 3rd Southeast Asian Conference on Soil Engineering, Hong Kong, China, 6–10 November 1972; pp. 83–91. [Google Scholar]
  20. Borel, S.; Bustamante, M.; Gianeselli, L. An appraisal of the Chin method based on 50 instrumented pile tests. Ground Eng. 2004, 37, 22–26. [Google Scholar]
  21. Leung, C.F.; Radhakrishnan, R.; Tan, S.-A. Performance of precast driven piles in marine clay. J. Geotech. 1991, 117, 637–657. [Google Scholar] [CrossRef]
  22. Lee, C.J.; Ng, C.W.W. Development of downdrag on piles and pile groups in consolidating soil. J. Geotech Geoenviron. 2004, 130, 905–914. [Google Scholar] [CrossRef]
  23. Johannessen, I.J.; Bjerrum, L. Measurement of the compression of a steel pile to rock due to settlement of the surrounding clay. In Proceedings of the 6th International Conference on Soil Mechanics and Foundation Engineering, Montreal, QC, Canada, 8–15 September 1965; pp. 261–264. [Google Scholar]
  24. Comodromos, E.M.; Bareka, S.V. Evaluation of negative skin friction effects in pile foundations using 3D nonlinear analysis. Comput. Geotech 2005, 32, 210–221. [Google Scholar] [CrossRef]
  25. Feng, W.; Lalit, B.; Yin, Z.; Yin, J. Long-term Non-linear creep and swelling behavior of Hong Kong marine deposits in oedom-eter condition. Comput. Geotech. 2017, 84, 1–17. [Google Scholar] [CrossRef]
  26. Lee, C.J.; Ng, C.W.W.; Jeong, S.S. The effect of negative skin friction on piles and pile groups. In Linear and Nonlinear Numerical Analysis of Foundations; Bull, J.W., Ed.; Taylor & Francis: London, UK, 2009. [Google Scholar]
  27. MCC (Ministry of Construction of the People’s Republic of China). Technical Code for Building Pile Foundations, JGJ106 -2014; China Building Industry Press: Beijing, China, 2014.
  28. Alonso, E.E.; Josa, A.; Ledesma, A. Negative skin friction on piles: A simplified analysis and prediction procedure. Geotechnique 1984, 34, 341–357. [Google Scholar] [CrossRef] [Green Version]
  29. Wong, K.S.; The, C.I. Negative skin friction on piles in layered soil deposits. ASCE J. Geotech. Eng. 1995, 121, 457–465. [Google Scholar] [CrossRef]
Figure 1. The normalized CPTU test result. (a) Norm cone resistance, (b) Norm friction ratio, (c) Norm pore pressure ratio.
Jmse 10 01742 g001
Figure 2. Soil classification.
Jmse 10 01742 g002
Figure 3. Compression test result.
Jmse 10 01742 g003
Figure 4. Set-up of finite element model.
Jmse 10 01742 g004
Figure 5. Effect of consolidation on pore water pressure and displacement. (a) Pore water pressure, (b) Soil displacement.
Jmse 10 01742 g005
Figure 6. Simulation result of axial compressive test under different consolidation degrees.
Jmse 10 01742 g006
Figure 7. Friction distribution evolution of the pile driven immediately after filling (times in the legend represents consolidation times after filling).
Jmse 10 01742 g007
Figure 8. Friction distribution of the piles in two years after filling (times in the legend represent different moments of pile installation after filling).
Jmse 10 01742 g008
Figure 9. Method for determining the ultimate bearing capacity of pile foundation.
Jmse 10 01742 g009
Figure 10. Bearing capacity of pile foundation when driving pile after different consolidation times. (a) NSF effect on pile-bearing capacity, (b) Feasible moment for mitigating NSF effect.
Jmse 10 01742 g010
Table 1. Geotechnical design parameters.
Unith
(m)
γ
(kg/m3)
φ
(°)
c
(kPa)
Cu
(kPa)
k
(m/s)
E
(MPa)
e
OC0–61620102010−841.5
SSM6–1919330-10−9131
C19–4518251025–6010−10301.2
C(S)45–6020301010010−9450.6
S>60----10−3--
Note: OC is clay with organic clay, SSM is sand and silt mixtures, C is clay, and C(S) is clay and sandy clay. S is sand.
Table 2. Geotechnical parameter for pile-bearing capacity assessment.
H (m)Cu (kPa)Parameter for
q s   or   τ s   (kPa)
qp (kPa)
OC0.0–6.020 β = 0.33 9 · c u
SSM6.0–19.0- δ = 27.7 °
C F = 0.93
K δ = 1.56
ω = 0
2500
C19.0–45.025–60 β = 0.34 9 · c u
C(S)45.0–60.0100 β = 0.38 9 · c u
Table 3. Chin hyperbolic extrapolation results.
Pile IDHyperbolic Extrapolation Result
(kN)
PTP014485
PTP024520
PTP034510
PTP044530
Publisher’s Note: MDPI stays neutral with regard to jurisdictional claims in published maps and institutional affiliations.

