Article

Research on Uncertainty Evolution of Ship Collision Status Based on Navigation Environment

1
School of Navigation, Wuhan University of Technology, Wuhan 430063, China
2
Hubei Key Laboratory of Inland Shipping Technology, Wuhan University of Technology, Wuhan 430063, China
3
Shaoguan Research Institute, Wuhan University of Technology, Shaoguan 512100, China
4
Inland Port and Shipping Industry Research Co., Ltd. of Guangdong Province, Shaoguan 512100, China
*
Author to whom correspondence should be addressed.
J. Mar. Sci. Eng. 2022, 10(11), 1741; https://doi.org/10.3390/jmse10111741
Submission received: 11 October 2022 / Revised: 10 November 2022 / Accepted: 10 November 2022 / Published: 13 November 2022

Abstract

:
There is a need to study the evolutionary laws of the risks in the navigation environments of complex marine areas. This can promote shipping safety using an early-warning system. The present study determines shipping flows and meteorological conditions in a marine area on the basis of meteorological and automatic identification system (AIS) data. It also determines the uncertainty evolution law of the navigation environment’s influencing factors. Moreover, a navigation risk evolution system for ships in complex marine areas was developed. A case study was carried out in a coastal area of China on the basis of the determined evolutionary laws. Evolution in the navigational environment risk within the case study area was analyzed. The results showed that the hydrometeorology wind factor has the greatest impact on the risk of ship collisions. This work was not only able to show advances in navigational collision environmental evolution laws but also provides a theoretical reference for the evaluation and early warning of risks in shipping environments.

1. Introduction

Water transportation is considered a complex system. All the factors influencing the navigation safety of ships are first manifested in the navigation environment. Recently, the navigation environment has become increasingly complex due to an increase in ship numbers, sizes, and speeds. Ships must adapt to the external navigation environment to guarantee navigation safety under difficult conditions. Mastering the objective laws of the navigational environment risk evolution of ships while in complicated water areas leads to the maintenance of navigation safety in terms of the internal mechanism and system structure.
There have been many studies on the navigation environment. Ivanovsky et al. discussed the influences of weather conditions on the navigation safety of ships [1], while Wang J et al. studied the safe navigation of surface ships in relation to wind [2]. Chen C et al. analyzed the influence of waves on navigation safety through numerical simulation [3]. Y. Tian et al. established an evaluation index system based on a fuzzy analytic hierarchy process (FAHP) and carried out a quantitative analysis of navigational environment characteristics [4]. Qi L et al. proposed a ship traffic flow model of busy waterways based on cellular automaton to determine the influences on transportation efficiency and safety [5]. Chou C et al. evaluated the key environmental influences on navigation safety at Taiwan Port and its surrounding areas [6]. Marine accidents are often unpredictable [7], and their causes are influenced by many factors of the navigation environment [8]. Liu J et al. proposed an evaluation method for navigation safety in uncertain environments based on fuzzy inference [9]. Existing studies have mainly focused on the influences of navigational environment factors on navigation safety. It is more challenging to ensure navigation safety in a dynamic environment than in a static one. However, most scholars have focused on the study of the impact of the navigation environment when considering the navigation safety of ships and less on both the evolution process and the laws of the navigation environment.
Changes in the navigation environment affect navigation safety. A dangerous navigation environment often causes more marine accidents. Among the most frequent marine accidents are ship collisions [10,11]; accordingly, they have attracted attention. Considering the uncertainty of the navigation environment in the evolutionary process, ship collision accidents were used as the research sample data. First, the key navigation environmental impact factors were divided into different levels. The frequency of natural occurrence of a factor was acquired through meteorological, hydrological, and historical data; navigation maps; and automatic identification system (AIS) statistics. Later, the Bayes conditional probability computation method was applied, in which the equation used was set up by introducing the historical accident data, and the accident impact probability could be calculated. Finally, an evolutionary trend model of navigational environment impact factors was constructed using their impact probability as data for the bottom layer to analyze the evolution laws of navigational environment impact factors from the certainty state to the uncertainty state. The research conclusions will help marine administration staff understand navigational environment risks based on the water safety status in a more comprehensive and intuitive manner. These staff can provide references for the management of marine competent authorities to some extent.

2. Selection of Indexes and Calculation of Probabilities

2.1. Ship Collision Probability Model

Similar to studies on causal probability [12,13], this work aimed to explore evolutionary trends and laws of ship collision probability under changing navigational environment factors. It is a macroscopic judgment of overall risk trend characteristics before an early warning or other safety supervision system for maritime staff. This chapter begins with an analysis of meteorological and AIS data retrieved from maritime authorities to determine the probability and frequency of the navigation environment in marine areas through relevant statistical data. Afterward, the Bayesian conditional probability method was used to calculate ship collision probabilities.

2.2. Evaluation Index of Key Navigational Environment Impact Factors

In studies on uncertainty evolution laws of the navigation environment, appropriate factors must be chosen to establish an evaluation index system of key navigational environment impact factors.
There are many factors that influence navigation risk. These may combine to form a complex system. Navigational environment impact factors are usually divided into three categories: hydrometeorology factors, channel condition factors, and traffic factors. According to relevant studies [4,14,15], the established index system is shown in Table 1.

2.3. Grading of Navigational Environment Impact Factors

Ship collision accidents are often related to environmental impact factors at different levels. To better interpret the subjective danger sense (SDS) that is caused by all the environmental impact factors under the same coordinate system, it is necessary to divide the SDS of the navigational environment impact factors before the calculation. For “equivalent” treatment, it is first necessary to determine the corresponding relationship between the optimal values and the worst values of the environmental impact factors. Afterward, it is possible for the impact factors to be divided with comprehensive considerations regarding subjective cognitive influences of acquired data.
Suppose there are n impact factor sequences E i ( i = 1 , 2 , 3 , m , n ) based on the sample data features of maritime accidents. If any E i is dispersed into m levels according to the levels at the occurrence of the navigational environment impact factors, the navigational environment impact factor sequence can be changed to:
E i k ( i = 1 , 2 , 3 , m , , n ; k = 1 , 2 , 3 , N )
Generally, it is believed that the optimal values and the worst values of the factors in a sequence may bring the ship operators almost the same SDS, and the same navigational environment impact factor level has a similar SDS:
D max = D ( E i n ) = 1 , D min = D ( E i 1 ) = 0
D ( E 1 k ) = D ( E 2 k ) = D ( E n k )
Therefore, the impact factors at the same level have similar SDS, but there are different SDS values between two factors at different levels. Nevertheless, the impact probability π ( B i ) , which is based on accident sample data features, varies significantly even though the factors at the same level have a similar SDS without obvious correlation.

2.4. Calculation of the Impact Probability of Ship Collision Accidents

The risk of each impact factor can be quantized by the Bayes conditional probability [16,17]. For two non-independent events, A and B , if B has taken place, the possibility that A will occur is reflected as the conditional probability of A in B . This is denoted as P ( A | B ) :
P ( B | A ) P ( A ) = P ( B ) P ( A | B )
P ( A | B ) = P ( B | A ) P ( A ) P ( B )
where P ( A | B ) is the probability of the occurrence of a maritime accident when there is some impact factor (for a specific level) in the study period; P ( B | A ) is the probability of an impact (for a specific level) when there is a maritime accident in the study period; P ( A ) is the probability of a maritime accident in the study period; and P ( B ) is the probability of natural occurrence when there is an impact factor (for a specific level), which can be replaced by the frequency of occurrence of a factor (for a specific level) in the study period.
On the basis of the data related to maritime accident characteristics [18], the impact probability of a maritime accident when there is an impact factor was deduced through the Bayes conditional probability formula. This was performed by acquiring the probability of an impact factor during maritime accidents, the probability of an impact factor in some period, and the probability of a maritime accident.
The probability of a maritime accident when there is a factor (for a specific level) based on accident characteristics can be gained through dimensionless processing. The probability of the discrete impact factors B i can be defined as follows:
π ( B i ) = P ( A | B i ) ( i = 1 , 2 , 3 , , n )
where { π ( B i ) , i = 1 , 2 , 3 , n } refers to the prior impact probability of a maritime accident when there is an impact factor.
If there were 100 accidents in 10 years, the probability of a maritime accident would be 100/3650 = 0.0274 accidents per day. Since P ( B ) refers to the inherent probability when there is an impact factor (for a specific level), it can be replaced by the frequency of the occurrence of factors at a level in the statistical period.

3. Model of Evolutionary Trends in Navigational Environmental Factors

3.1. State Extraction of Navigational Environment Impact Factors

For a determined accident case, the probability set related to the key environmental impact factors was extracted in this phase.
The sets of impact probability ( P ) and the probability of natural occurrence ( Q ) of navigational environment impact factors were:
P h = ( A 1 i 1 A 2 j 1 , A 3 k 1 , A 4 l 1 , A 5 m 1 , A 6 n 1 )
Q h = ( B 1 i 1 B 2 j 1 , B 3 k 1 , B 4 l 1 , B 5 m 1 , B 6 n 1 )
where A i j refers to the probability of impact factor i at level j , and B i j is the probability of the natural occurrence of impact factor i at level j .
In this study, the maximum collapse distance sample (the furthest distance to collapse) of an accident was defined as the threshold of system collapse [19,20]. A collapse is more likely if the probability extremum is approached. In other words, the extreme probability was viewed as the “complete collapse state”. As it approached this state, it was more likely to collapse. The sets of the maximum impact probability, as well as the maximum probability of the natural occurrence of navigational environment impact factors, were extracted and defined as the complete collapse state:
P h max = ( A 1 max , A 2 max , A 3 max , A 4 max , A 5 max , A 6 max )
Q h max = ( B 1 max , B 2 max , B 3 max , B 4 max , B 5 max , B 6 max )
where A i max is the maximum impact probability corresponding to the impact factor at level i , and B i max is the maximum probability of natural occurrence corresponding to the impact factor at level i .
The collapse distance was defined as the distance from the current state to the complete collapse state. This could then be used to guide the collapse distance of a determined navigational environment impact factor set:
d ( P h , P h max ) = [ ( A 1 max A 1 i 1 ) 2 + ( A 2 max A 2 j 1 ) 2 + + ( A 6 max A 6 n 1 ) 2 ] 1 2
d ( Q h , Q h max ) = [ ( B 1 max B 1 i 1 ) 2 + ( B 2 max B 2 j 1 ) 2 + + ( B 6 max B 6 n 1 ) 2 ] 1 2
where d ( P h , P h max ) refers to the vulnerable distance of the impact probability, and d ( Q h , Q h max ) is the vulnerable distance of the probability of natural occurrence.

3.2. Uncertainty Evolutionary Rules of the Navigational Environment

The navigational environment in a certain accident case usually has a systematic and slow evolution. In fact, considering the timeliness of the navigational environment during accident evolution, the navigational environment does not usually change suddenly in a short period, i.e., there are unlikely to be “jumps” between levels. In some cases, strong wind in a short period may cause instantaneous and significant changes in the navigational environment, although such a scenario was not considered in this study. If a key factor was in the third level of the five-level navigational environment system, it could jump from the third level to the second level or the fourth level or stay at the third level during an accident evolution, but it could not jump to the fifth level or the first level. If a key factor was in the fifth level of a five-level environmental subsystem, it could only jump to the fourth level or stay in the fifth level (Figure 1).
Therefore, the uncertainty state could be determined after the evolutionary rule from the certainty state to the uncertainty state was determined. The uncertainty state sets were:
P h = ( A 1 i 1 , A 2 j 1 , A 3 k 1 , A 4 l 1 , A 5 m 1 , A 6 n 1 )
Q h = ( B 1 i 1 , B 2 j 1 , B 3 k 1 , B 4 l 1 , B 5 m 1 , B 6 n 1 )

3.3. Distance Model between the Uncertainty Evolution and the Ideal Worst Value

The number of the system states that a change from certain to uncertain can be determined on the basis of the relevant evolutionary rules. This quantity changes with the levels of key factors of the certainty state. If the key factors of the system certainty state were mainly at the fifth or first levels, the quantity of the uncertainty evolutionary state decreased. If the key factors of the system’s certain state were mainly in the second, third, or fourth levels, the quantity of the uncertain evolutionary states was approximately 36–729. The collapse distances of the system under all uncertain states were computed, and the average collapse distance ( d ) of an uncertain state was:
d ( P h , P h max ) = [ ( A 1 max A 1 i 1 ) 2 + ( A 2 max A 2 j 1 ) 2 + + ( A 6 max A 6 n 1 ) 2 ] 1 2
d ( Q h , Q h max ) = [ ( B 1 max B 1 i 1 ) 2 + ( B 2 max B 2 j 1 ) 2 + + ( B 6 max B 6 n 1 ) 2 ] 1 2
Supposing the collapse distance of a certain state is d and the average collapse distance of an uncertain state is d , the rate of variation in the collapse distance is as follows:
Δ d P = d ( P h , P h max ) - d ( P h , P h max )
Δ d Q = d ( Q h , Q h max ) - d ( Q h , Q h max )
With Equations (15)–(18), the average collapse distances and relative rates of variation in the certain and uncertain states could be calculated.

3.4. Uncertainty Evolutionary Mechanism Analysis of the Navigational Environment

The probability of natural occurrence and the impact probability develop simultaneously toward the collapse direction during uncertainty evolution when both Δ d P and Δ d Q are greater than 0 at the same time. Under these circumstances, the probability of natural occurrence increases, along with the corresponding impact probability. The uncertainty continuously evolves in a bad direction; in this specific case, the first quadrant is defined as the danger zone. When Δ d P > 0 and Δ d Q < 0, the impact probability develops toward the collapse direction during uncertainty evolution, while the probability of natural occurrence becomes further away from collapse. In this case, the uncertainty evolution in navigational environment impact factors is fuzzy. However, from the definition of risk, it is known that accident risk still has a broad range when it is high, even though the probability of natural occurrence is relatively low. Hence, the scope in the fourth quadrant within 45° of the X-axis is still defined as a danger zone, and the scope within 45° of the Y-axis was defined as a fuzzy zone. When Δ d P < 0 and Δ d Q < 0, both the probability of natural occurrence and the impact probability become further away from collapse; in this case, this region is defined as a safe zone. When Δ d P < 0 and Δ d Q > 0, the impact probability becomes further away from the collapse during an uncertainty evolution, while the probability of natural occurrence develops toward the collapse. In this case, the general uncertainty evolution of navigational environment impact factors becomes further away from collapse, and the distribution of the uncertainty evolution regions of the navigational environment is shown in Figure 2.

4. Case Study

4.1. Study Water Area

A case study based on the navigational environment of a coastal area in China was carried out. With consideration of the characteristics of the navigational environment in this jurisdiction, the following typical navigational environment impact factors in Table 2 were chosen.
There were 73 major ship collisions in the study area from 2007 to 2019. The distribution of these accidents is shown in Figure 3.

4.2. Analysis of Ship Collision Probability

Considering the relationship between the total number of accidents and their grading, at least one accident can be assigned to the level of each environmental factor as far as possible. Table 3 shows the grading of the key levels of navigational environment risk.
The P ( B ) of the impact factors was acquired through data collection and reviewing of the natural occurrence of key navigational impact factors at different levels, numerical calculation, simulation, or reasonable hypotheses (Table 4).
The probability of the natural occurrence variation of impact factors with regard to the level was plotted through the statistical analysis and calculations of the case study. The characteristics of the navigational environment system of the study area are shown in Figure 4.
The water environmental characteristics of the study area are shown in Figure 4. It is clear that the inherent probabilities of wind, visibility, and the channel crossing ratio were all negatively related to the levels of the impact factors. This conformed to the hydrological environment features of the study area since the probability of bad weather was relatively low. The inherent probabilities of channel width, ship density, and traffic flow fluctuated with the levels, peaking at around Level 3. This agreed with the channel and traffic flow characteristics of the study area.
The impact probabilities of environmental impact factors were calculated according to Equation (5), and the results are shown in Table 5.
The variations in the impact probability with the impact factor level were plotted through analysis of the probability of natural occurrence in the case study (Figure 5).
The effects of the navigational environment on ship collision accidents in the study area are presented in Figure 5. It is clear that the impact probabilities fluctuated greatly according to the levels rather than having a single linear relationship. According to the formula of impact probability, the impact probabilities of the impact factors were related to both the probability of natural occurrence and the frequency of occurrence. The impact probability of the wind impact first increased and then decreased with an increase in level, reaching a peak at Level 4 and having a broad interval between Levels 4 and 5. The impact probabilities of visibility, channel crossing ratio, channel width, and ship density all peaked at Level 2 and were low between Levels 3 and 4. The impact probability of traffic flow changed slightly with level, with a moderate value in relation to the other navigational environment impact factors.
In the expression of the impact probabilities, three properties of each navigational environment impact factor were recognized: SDS (level of indicator), the probability of natural occurrence, and the impact probability calculated with the Bayes formula. When analyzing these three properties, it was possible to conclude that none of them had consistent changes in subjective cognition. Regarding subjective cognition, impact probability was positively correlated with the level, while the probability of natural occurrence was negatively correlated. In fact, such relationships were fluctuating rather than linear.
After calculating and analyzing the impact probabilities of each accident case, their distribution remained unknown. Nevertheless, using the statistics of all possible navigational environment conditions (i.e., the whole sample), the accident case impact probability, and the full sample, the impact probability distribution diagram was drawn, as shown in Figure 6.
It can be seen in Figure 6 that when the impact probabilities were sorted, the impact probability distribution of the accident cases was mostly concentrated in the upper part of the whole sample, which is consistent with the usual subjective perception of risk; that is, the higher the impact probability, the higher the probability that an accident will occur.

4.3. Uncertainty Evolution Laws

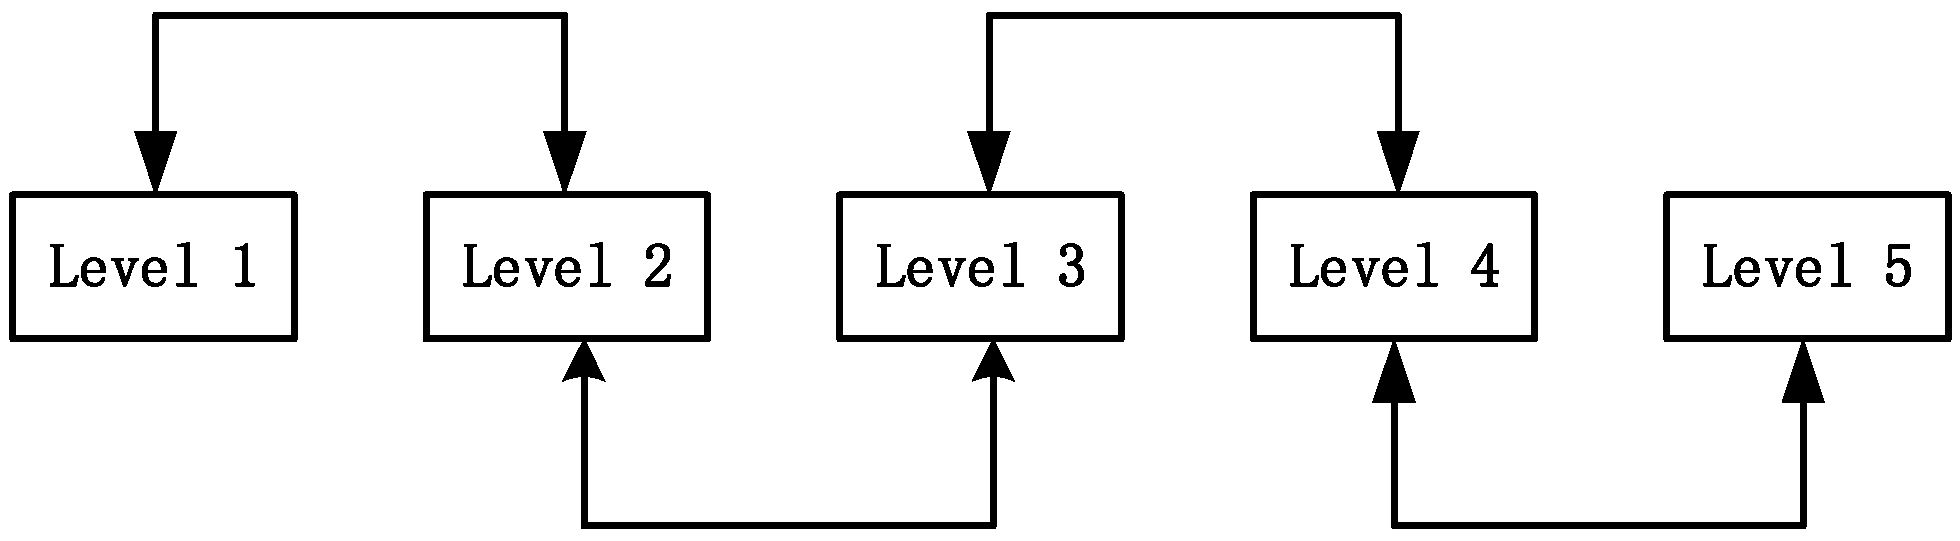
According to the uncertainty evolution rules shown in Figure 2, the uncertainty states of the case study were calculated. They ranged from 143 (only 1 accident) to 728 (8 accidents).
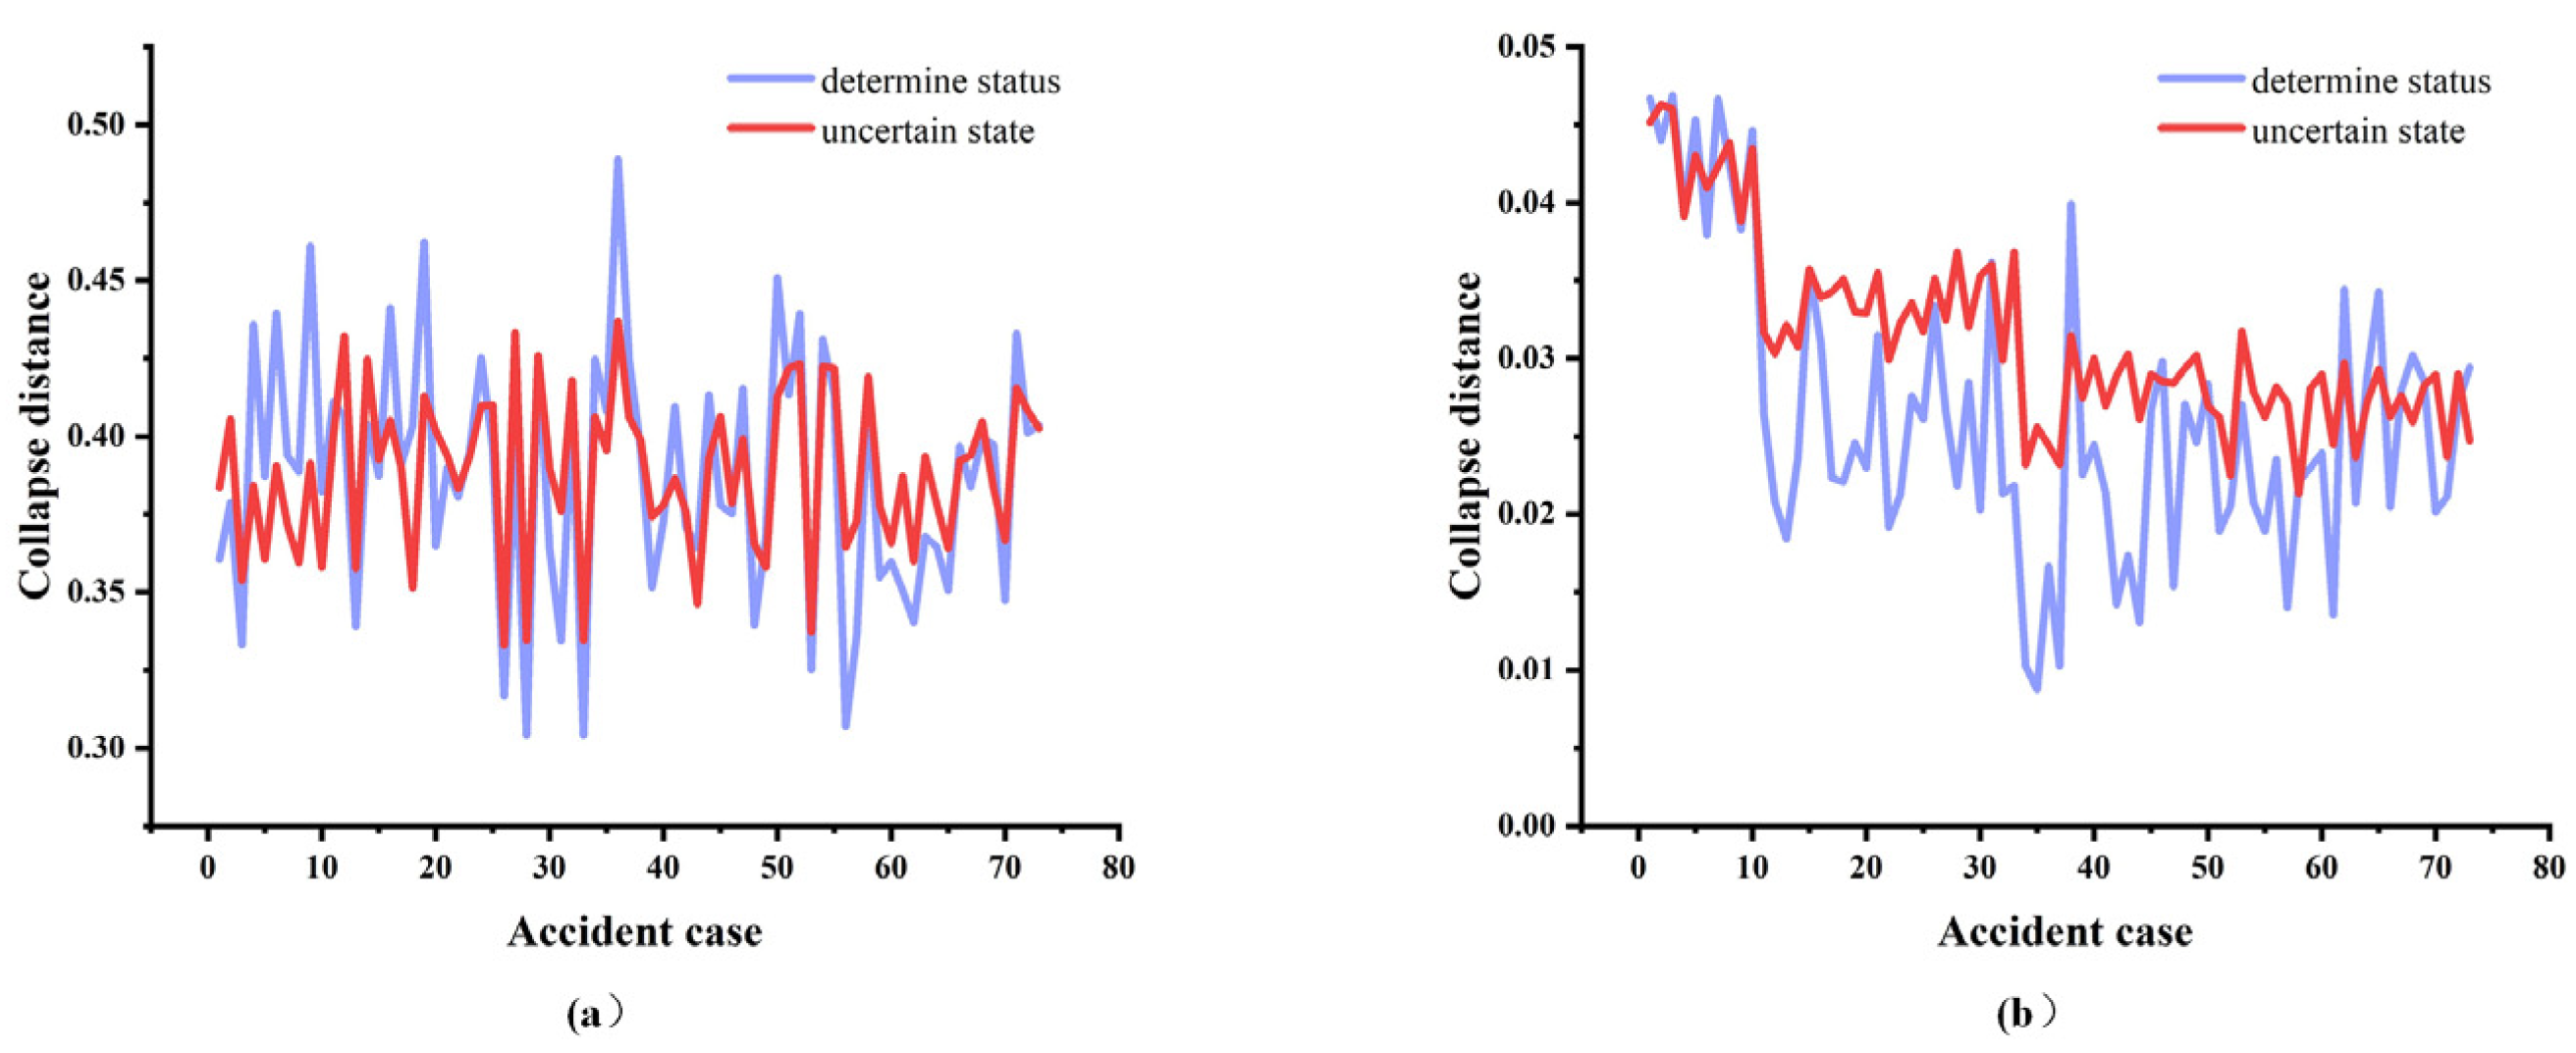
The collapse distances of the certain and uncertain states were calculated according to Equations (15) and (16):
It can be seen in Figure 7 that the collapse distances of the certain states, which were based on the probability of natural occurrence, were concentrated between 0.3 and 0.5, while the average collapse distances of the uncertain states were concentrated between 0.35 and 0.45. The collapse distance of the certain states based on impact probability was 0.01–0.05, while the average collapse distance of the uncertain state was 0.25–0.45. Compared with the certain variation in the navigational environment impact factors, the uncertain variation in the inherent probability showed a higher concentration, and the collapse distance decreased. Similarly, the uncertain variation on the impact probability had a higher concentration, but the collapse distance increased compared with that of the certain state.
The evolutions in the navigational environment impact factors Δ d P and Δ d Q were calculated according to Equations (17) and (18). Their relationship is plotted in Figure 8.
According to conventional risk management theory, accident risk is related to both the consequence and probability of occurrence. In this study, only major accidents with risks proportional to the probability of occurrence were chosen under the premise of ignoring the consequences. In other words, the risk was greater when the probability of occurrence, or the impact probability, was higher.
In Figure 8, it is possible to see that among the 73 ship collision accidents, there were 7 in the first quadrant, 24 in the second quadrant, 30 in the third quadrant, and 12 in the fourth quadrant.
It can be seen in Figure 7 and Figure 8 that when comparing the uncertainty variation in the inherent probability to the certainty variation of the navigational environment impact factors, it showed a higher concentration with a decrease in the collapse distance. Similarly, the uncertain variation on the impact probability had a higher concentration, while the collapse distance increased compared with that of the certain state.
The relationship between Δ d P and Δ d Q is plotted according to the collapse distances of the probability of natural occurrence and the impact probability in Figure 9.
According to both Figure 9 and Table 6, when one navigational environment impact factor was constant, the uncertainty evolution laws of the navigation environment were different from those when all impact factors changed. For example, when the wind was constant, the danger zone was the smallest during the uncertainty evolution, which proved that wind was the primary navigational environment impact factor of uncertainty evolution, and consequently, the system became further away from collapse when the wind was constant.

5. Conclusions and Prospects

In this study, the probabilities of the natural occurrence of selected key navigational impact factors at different levels were established. These were explored in combination with maritime accident statistics from a case study. The inherent probabilities of the impact factors were analyzed, and an uncertainty distribution of brittleness risks was summarized on the basis of the impact probabilities. The system collapse trend was disclosed through variation analysis. Some major conclusions can be drawn from this study:
(1)
In view of maritime safety, ship navigation is always influenced by one or several impact factors. The environmental system stress determines whether a ship’s collision risk develops toward collapse. To describe such a collapse trend, the brittleness parameter of the key impact factors at different levels was described by the impact probability of accidents. The brittleness parameter can directly measure the degree of collapse of the navigational environment system and impact factors. Moreover, Bayes conditional probability was introduced to calculate the brittleness parameter, aiming to reflect the relationship between the distributions of the key factors among different levels of historical accidents as well as the probability of natural occurrence. This relationship also determines the subsequent evolution laws of collapse distance. The results show that the hydrometeorology wind factor has the greatest impact on ship collision risk during the evolution process.
(2)
The probabilities of the natural occurrence of key navigational environment impact factors at different levels change randomly. In accident statistics, the number of accidents at a level of a key impact factor is also random. As a result, the calculation of ultimate impact probabilities tends to be uncertain. The impact probability of all impact factors is uncertain to some extent due to the uncertainty of the impact probability distribution of a single key impact factor. However, the impact probability of all impact factors was finally determined by the ratio between the number of key impact factors at different levels as well as the probability of natural occurrence in the system. The impact probability at the levels of the adjacent extrema decreased or increased with a posterior decrease in the uncertainty. Because of this, primary attention should be given to the extrema of the impact probabilities of the key impact factors in the system when studying accident mechanisms.

Author Contributions

Conceptualization, L.H., Y.C. and S.C.; methodology, L.H.; software, Y.C., L.W. and S.C.; validation, S.C. and C.X.; formal analysis, L.H. and Y.C.; investigation, L.W. and Y.C.; resources, C.X.; data curation, Y.C.; writing—original draft preparation, Y.C.; writing—review and editing, L.H. and S.C.; visualization, C.X.; supervision, L.W. All authors have read and agreed to the published version of the manuscript.

Funding

This work is supported by the National Key Research and Development Program of China (2019YFB1600603) and the Fund of the National Engineering Research Center for Water Transport Safety (A2022001).

Institutional Review Board Statement

Not applicable.

Informed Consent Statement

Not applicable.

Data Availability Statement

Data are available on request due to restrictions of privacy.

Conflicts of Interest

The authors declare no conflict of interest.

References

  1. Ivanovsky, N.; Chernyi, S.; Sokolov, S.; Anton, Z.; Anton, Z. Algorithm design for ship’s steering with specified limitations under various weather conditions. Brodogr. Teor. I Praksa Brodogr. I Pomor. Teh. 2021, 72, 19–32. [Google Scholar] [CrossRef]
  2. Wang, J.; Zou, Z.; Wang, T. Path following of a surface ship sailing in restricted waters under wind effect using robust H∞ guaranteed cost control. Int. J. Nav. Archit. Ocean. Eng. 2019, 11, 606–623. [Google Scholar] [CrossRef]
  3. Chen, C.; Sasa, K.; Prpić-Oršić, J.; Mizojiri, T. Statistical analysis of waves’ effects on ship navigation using high-resolution numerical wave simulation and shipboard measurements. Ocean. Eng. 2021, 229, 108757. [Google Scholar] [CrossRef]
  4. Tian, Y.; Sun, X. Risk evaluation Index system of navigation environment of Qiongzhou strait based on FAHP. In Proceedings of the International Conference on Transportation Information and Safety (ICTIS), Wuhan, China, 25–28 June 2015; pp. 729–731. [Google Scholar]
  5. Qi, L.; Ji, Y.; Balling, R.; Xu, W. A cellular automaton-based model of ship traffic flow in busy waterways. J. Navig. 2021, 74, 605–618. [Google Scholar] [CrossRef]
  6. Chou, C.C.; Su, Y.L.; Li, R.F.; Tsai, C.L.; Ding, J.F. Key navigation safety factors in Taiwanese harbors and surrounding waters. J. Mar. Sci. Technol. 2015, 23, 12. [Google Scholar]
  7. Ozturk, U.; Cicek, K. Individual collision risk assessment in ship navigation: A systematic literature review. Ocean. Eng. 2019, 180, 130–143. [Google Scholar] [CrossRef]
  8. Li, B. Navigation risk assessment scheme based on fuzzy Dempster–Shafer evidence theory. Int. J. Adv. Robot. Syst. 2018, 15, 1729881418799572. [Google Scholar] [CrossRef] [Green Version]
  9. Liu, J.; Jiang, X.; Huang, W.; He, Y.; Yang, Z. A novel approach for navigational safety evaluation of inland waterway ships under uncertain environment. Transp. Saf. Environ. 2022, 4, tdab029. [Google Scholar] [CrossRef]
  10. Chen, P.; Huang, Y.; Mou, J.; Van Gelder, P.H.A.J.M. Probabilistic risk analysis for ship-ship collision: State-of-the-art. Saf. Sci. 2019, 117, 108–122. [Google Scholar] [CrossRef]
  11. Chen, Y.; Xie, C.; Chen, S.; Huang, L. A New Risk-based Early-warning Method for Ship Collision Avoidance. IEEE Access 2021, 9, 108236–108248. [Google Scholar] [CrossRef]
  12. Fujii, Y.; Shiobara, R. The analysis of traffic accidents. J. Navig. 1971, 24, 534–543. [Google Scholar] [CrossRef]
  13. MacDuff, T. The probability of vessel collisions. Ocean. Ind. 1974, 9, 9. [Google Scholar]
  14. Zhou, X. A comprehensive framework for assessing navigation risk and deploying maritime emergency resources in the South China Sea. Ocean. Eng. 2022, 248, 110797. [Google Scholar] [CrossRef]
  15. Chen, S.; Wu, L.; Xie, C.; Zhou, L.; Wang, R.; Liu, Z.; Zho, Q.; Zhu, L. Risk Evaluation of Navigation Environment Based on Dynamic Weight Model and Its Application. J. Mar. Sci. Eng. 2022, 10, 770. [Google Scholar] [CrossRef]
  16. Xie, C.; Huang, L.; Wang, R.; Deng, J.; Shu, Y.; Jiang, D. Research on quantitative risk assessment of fuel leak of LNG-fuelled ship during lock transition process. Reliab. Eng. Syst. Saf. 2022, 221, 108368. [Google Scholar] [CrossRef]
  17. Xie, C.; Huang, L.; Deng, J.; Wang, R.; Hao, G. Hazard assessment and hazard mitigation of fuel leak inside a ship elevator for LNG-fueled vessel. Ocean. Eng. 2022, 259, 111943. [Google Scholar] [CrossRef]
  18. Liang, M.; Liu, R.W.; Li, S.; Xiao, Z.; Liu, X.; Lu, F. An unsupervised learning method with convolutional auto-encoder for vessel trajectory similarity computation. Ocean. Eng. 2021, 225, 108803. [Google Scholar] [CrossRef]
  19. Li, Y.; Long, M.; Zuo, L.; Li, W.; Zhao, W. Brittleness evaluation of coal based on statistical damage and energy evolution theory. J. Pet. Sci. Eng. 2019, 172, 753–763. [Google Scholar] [CrossRef]
  20. Wang, H.; Jiang, H.; Yin, L. Cause mechanism study to human factors in maritime accidents: Towards a complex system brittleness analysis approach. Procedia-Soc. Behav. Sci. 2013, 96, 723–727. [Google Scholar] [CrossRef]
Figure 1. Evolutionary laws of navigational environmental impact factors among levels.
Jmse 10 01741 g001
Figure 2. Distribution of uncertainty evolutionary zones in the navigation environment.
Jmse 10 01741 g002
Figure 3. Distribution of ship collision accidents in the study area from 2007 to 2019.
Jmse 10 01741 g003
Figure 4. Probability of the natural occurrence variation in navigational environment impact factors at different levels.
Jmse 10 01741 g004
Figure 5. Variations in impact probabilities with navigational environment impact factor level.
Jmse 10 01741 g005
Figure 6. Accident cases and full sample impact probability distribution.
Jmse 10 01741 g006
Figure 7. Variation of collapse distance in the case study. (a) Probability of natural occurrence; (b) impact probability.
Jmse 10 01741 g007
Figure 8. Relationship between Δ d P and Δ d Q .
Jmse 10 01741 g008
Figure 9. Relationship between Δ d P and Δ d Q when one impact factor is constant. (a) Wind constant; (b) visibility constant; (c) channel crossing constant; (d) channel width constant; (e) ship density constant; (f) traffic flow constant.
Jmse 10 01741 g009
Table 1. Evaluation index system of navigational environment impact factors.
CategoryNavigational Environment Impact Factors
Hydrometeorology factorsWind
Currents
Waves
Tides
Visibility
Channel condition factorsChannel width
Channel length
Channel depth
Bending degree of channel
Channel crossing
Channel barriers
Traffic impact factorsVessel traffic flow
Traffic flow density
Safety clearance of ships
Navigation AIDs
Table 2. Research indicators.
CategoryImpact Factor
Hydrometeorology factorsWind
Visibility
Channel conditions factorsChannel crossing ratio
Channel width
Traffic impact factorsShip density
Traffic flow
Table 3. Grading of the environmental impact factors of navigation.
Impact FactorsLevel 1Level 2Level 3Level 4Level 5
Wind0–11–22–44–6>6
Visibility>30001000–3000500–1000200–500<500
Channel crossing ratio<0.50.5–11–1.51.5–2>2
Channel width>500300–500200–300100–200<100
Ship density (number of ships)<5050–8080–100100–150>150
Traffic flow (ships/day)<2020–2525–3030–36>36
Table 4. The probability of natural occurrence of navigational environment at different levels.
Impact FactorLevel 1Level 2Level 3Level 4Level 5
Wind0.3840.2210.1840.1090.102
Visibility0.3610.2820.1710.1220.064
Channel crossing ratio0.3660.2280.1970.1230.086
Channel width0.1440.1970.2890.2460.124
Ship density0.1230.2850.2690.2160.107
Traffic flow (ships/day)0.0940.2980.3040.1780.126
Table 5. The impact probability of navigational environment at different levels.
Impact FactorsLevel 1Level 2Level 3Level 4Level 5
Wind0.00290.01490.04170.07790.0672
Visibility0.00610.04370.03200.02920.0599
Channel crossing ratio0.01350.03490.03060.05120.0255
Channel width0.02280.05420.02090.01000.0398
Ship density0.03340.04040.01220.01650.0461
Traffic flow0.03500.02760.02520.02310.0326
Table 6. Quantitative relationship of evolutionary zone distribution.
Evolutionary ZoneAll Changes1 Constant2 Constants3 Constants4 Constants5 Constants6 Constants
Safety zone54575158545354
Danger zone12101513141215
Fuzzy zone7672584
Publisher’s Note: MDPI stays neutral with regard to jurisdictional claims in published maps and institutional affiliations.

