Article

Modified Method for Determination of Wear Coefficient of Reciprocating Sliding Wear and Experimental Comparative Study

1
South China Sea Marine Survey and Technology Center of State Oceanic Administration, Guangzhou 510310, China
2
State Key Laboratory of Hydraulic Engineering Simulation and Safety, Tianjin University, Tianjin 300072, China
3
Key Laboratory of Marine Environmental Survey Technology and Application, Ministry of Natural Resources, Guangzhou 510310, China
4
Fujian Key Laboratory of Digital Simulations for Coastal Civil Engineering, Department of Civil Engineering, Xiamen University, Xiamen 361005, China
*
Author to whom correspondence should be addressed.
J. Mar. Sci. Eng. 2022, 10(8), 1014; https://doi.org/10.3390/jmse10081014
Submission received: 22 June 2022 / Revised: 15 July 2022 / Accepted: 21 July 2022 / Published: 25 July 2022
(This article belongs to the Special Issue Failure Analysis of Marine Structure)

Abstract

:
A modified method for predicting the wear coefficient of reciprocating sliding wear was proposed in this study, which is less time-consuming. Based on this method, reciprocating sliding wear tests of three chain alloys (CM490, SS316, and TC4) under different loadings were conducted and the friction coefficient, wear coefficient, and wear morphology were obtained and compared. The results indicated that the time-variant coefficient of friction (CoF) could be used as an indicator for the stable wear state; moreover, it also changes periodically with the wear direction. Statistical analysis of friction coefficient indicated that it follows bimodal distribution or multimodal distribution. The friction and wear behaviors of CM490 and SS316 were different from those of TC4, and a detailed micro-morphological analysis indicated that the discrepancy is caused by the difference in the quantity and size of the wear debris. Furthermore, an upper limit of the contact stress-dependent wear coefficient was also observed, and the variability of the wear coefficient was also analyzed.

1. Introduction

Wear and corrosion are known to be the main factors leading to premature failure of marine structures [1,2,3]. Thus, the damage mechanism and damage evolution law should be well-understood so that an optimized shape and dimension of marine structures can be designed. For floating structures (e.g., platforms and buoys) in the ocean, six-degree-of-freedom movement is inevitable due to the actions of wind, wave, and current, which then drives a periodic movement of the mooring system (such as mooring chain and mooring cable). For mooring chains exposed to the atmosphere, the relative movement between links results in wear, and for chains immersed in seawater, the wear–corrosion is inevitable [4]. The typical wear morphology of chain links recovered from a mooring chain of a buoy is shown in Figure 1, where severe wear can be observed in the contact region of two adjacent chain links. Generally, the relative motion between links is small, and “fretting wear” dominates the wear mechanism [5]. In the presence of fine particles (such as sand or deposition)—for example, in the case of chains in the touch-down area—the wear regime is considered “abrasive wear” [6]. Undoubtedly, local wear damage can reduce the strength of the link, which can be easily broken under harsh sea conditions, resulting in a drift of the floating structure and huge economic loss [7]. Thus, the wear mechanism and damage evolution law should be well-understood.
To date, the wear between metals has been extensively studied [5,6,7,8,9,10], and the traditional “pin-on-disk” method is most widely used [5,11], which estimates the wear rate as a function of the sliding distance and applied force. However, the traditional unidirectional wear scenario is not applicable to chain wear [12], as it involves oscillatory motion between the links. Under the actions of waves and ocean currents, the floating drives a periodic movement of the anchor chain, and the tension force acting on the anchor chain varies continuously. According to the wave period, the dynamic tension varies up to 300 kN and the average period of the cyclic load acting on the anchor chain is approximately 10 s [5,13]. This value is the time-history statistical value of the dynamic tension response of the mooring line under typical sea conditions [14]. Jayasinghe [4] showed that the average wave period was approximately 12 s, and the range of motion between the chains under the actions of a floating body and ocean current was between 1° and 2° [10]. Liu [5] indicated that the fretting sliding distance between the contact surfaces of a chain link was approximately 10–50 μm. These results indicate that the wear regime for mooring chains is “adhesive wear” [10], which generally occurs under high local contact stresses and might result in plastic deformation. Moreover, a highly short-term localized adhesion of asperities on the involved mating surfaces produces a weld, which is then sheared by further relative movement.
A small-scale anchor-chain wear test (low carbon steel with a nominal diameter of 16 mm) was conducted by Yaghin and Melchers [10], and the effects of axial load, dry/wet contact conditions, and corrosion on wear were explored to test the breaking strength of the worn anchor chain. The load range of the test was 3–6% minimum breaking load, and its angle range was approximately 18°; the test cycle was approximately 5 s. The applied angle range and sliding velocity were much larger than the values encountered in actual engineering to accelerate the experimental process (the actual chain link motion angle is about 1–2° [10]). Takeuchi [15] validated the quantitative interlink wear estimation method. A material test and a finite-element (FE) analysis were conducted, where an interlink wear estimation formula was derived, and a coupled dynamic analysis was conducted to obtain the mooring chain response. Pauw [6,16] designed a new test rig, a full-scale test on the wear of shackle chains was conducted, both planar and circular motions were simulated, and higher wear rates in case of circular relative motion were found. Based on the available research, Liu [5] evaluated the cumulative corrosion–wear damage incurred by the anchor chain by using an FE method and calculated the overall wear–corrosion damage by using a decoupling method, where the uniform corrosion rate was calculated separately according to the available corrosion model, and the wear damage was calculated according to Archard’s wear theory combined with the contact pressure and sliding distance obtained from numerical simulation. A similar method was adopted by Su [17]. Although such a method is relatively straightforward, the simulation results might substantially deviate from the actual damage because of the over-predicted wear damage, as the wear damage caused under the dry condition is much higher than that caused under wet conditions [7,10]. More recently, a fully coupled numerical simulation method for tribocorrosion was proposed by Wang [18], and the synergies between stress and corrosion were taken into account.
Note that a full-scale chain wear test [6,10,16] is expensive and time-consuming, and a numerical simulation is an effective replacement. For wear simulation, a wear model should be applied; generally, Archard’s [19] wear model or its derivative is used [18]. According to Archard’s model [19], the wear volume is proportional to the sliding distance and applied load. In order to determine the value of the wear coefficient k, a pin-on-disk wear test needs to be conducted, and the volume loss (or mass loss) should be determined [5,17,19,20,21]. In order to reduce the test error, sufficient mass loss and test time are required; the weight loss should be at least greater than the accuracy of the analytical balance so that more reliable test data can be obtained. In the case of low contact stress, the mass loss rate is slow, which leads to a longer test time. Note that the wear coefficient differs a lot for different materials [22,23,24]; moreover, wear coefficients show considerable variation, both in repeat testing and in the testing of different materials, which may be attributed to the difference in apparent pressure, temperature, and stiffness of the supports of the sliding system [23]. Generally, a stable wear state will be reached after a period of time since the experiment began, and the wear coefficient measurement will be more accurate at this stage [24].
In view of the above deficiency, this work proposes a modified method to quickly determine the wear coefficient, and this method is especially suitable for wear conditions under low contact stress. Based on this method, a modified wear coefficient prediction equation is proposed based on Archard’s wear model. Moreover, a new indicator for determining the wear stable state is proposed, three types of commonly used buoy chain alloys are tested, and the wear behavior was analyzed.

2. Wear Theory and Realization of Modified Method

The traditional method used for determining the wear coefficient of Archard’s [19] wear model was based on the mass loss method; the wear volume (V) can be determined from Δm/ρ, where Δm is the mass loss incurred by wear and ρ is the density of the target material. A modified version of Archard’s [19] wear model can be expressed as
h = V A = k H F A s
where h is the wear depth (m), V is the wear volume (m3), A is the contact area, and k is the wear coefficient (a dimensionless value obtained from the experiment). For most material pairs, the value of k ranged from 10−8 to 10−4 for slight wear and from 10−4 to 10−2 for severe wear [5,23]; F is the normal force (N) applied to the test sample, H is the hardness of the soft materials between the contact pair (N/m2), and s is the sliding distance (m). For a circular section, Equation (2) yields
k = H A h F s = H σ c o n t a c t s h σ c o n t a c t = F A
In this work, the wear volume was not measured; instead, the wear depth h was directly measured using a surface profilometer (see Section 2), and the average wear depth was used. For the upper pin specimen, as all material points contacted each other at all times during the wear process, the total relative sliding distance s of each material point can be obtained as follows:
s = 2 L 0 T t f
where L0 is the sliding distance (L0 = 5 mm in this paper; see Figure 2), Tt is the total test time (min), and f is the loading frequency of the reciprocating wear test.
In contrast, for the lower contact pair, the material points on the contact surface were not always in contact. For the convenience of data analysis, the concept of equivalent contact length, Le, was proposed:
L e = A W = π D 2 / 4 D = π D 4
where A is the contact area (the same as that mentioned above) and W is the width of the upper contact pair; for a circular section, W = D (a detailed definition of these parameters is shown in Figure 2). Such a concept is necessary for specimens with a non-rectangular cross-section, and the section was turned into an equivalent rectangle based on the area equality. The relation between the contact sliding distance L′ of each material point on the lower contact surface and the equivalent contact length Le, as well as the sliding distance s of the upper contact pair, can be expressed as follows:
L s = L e L 0
Substituting Equations (4)–(6) into Equation (3) yields
k = h H F L 1 4 π D 2 = D H 1 2 F T t f h
Note that only the wear depth measurements performed at the parallel sections were used (in the range of L0 in Figure 2, an example is shown in Figure 3).

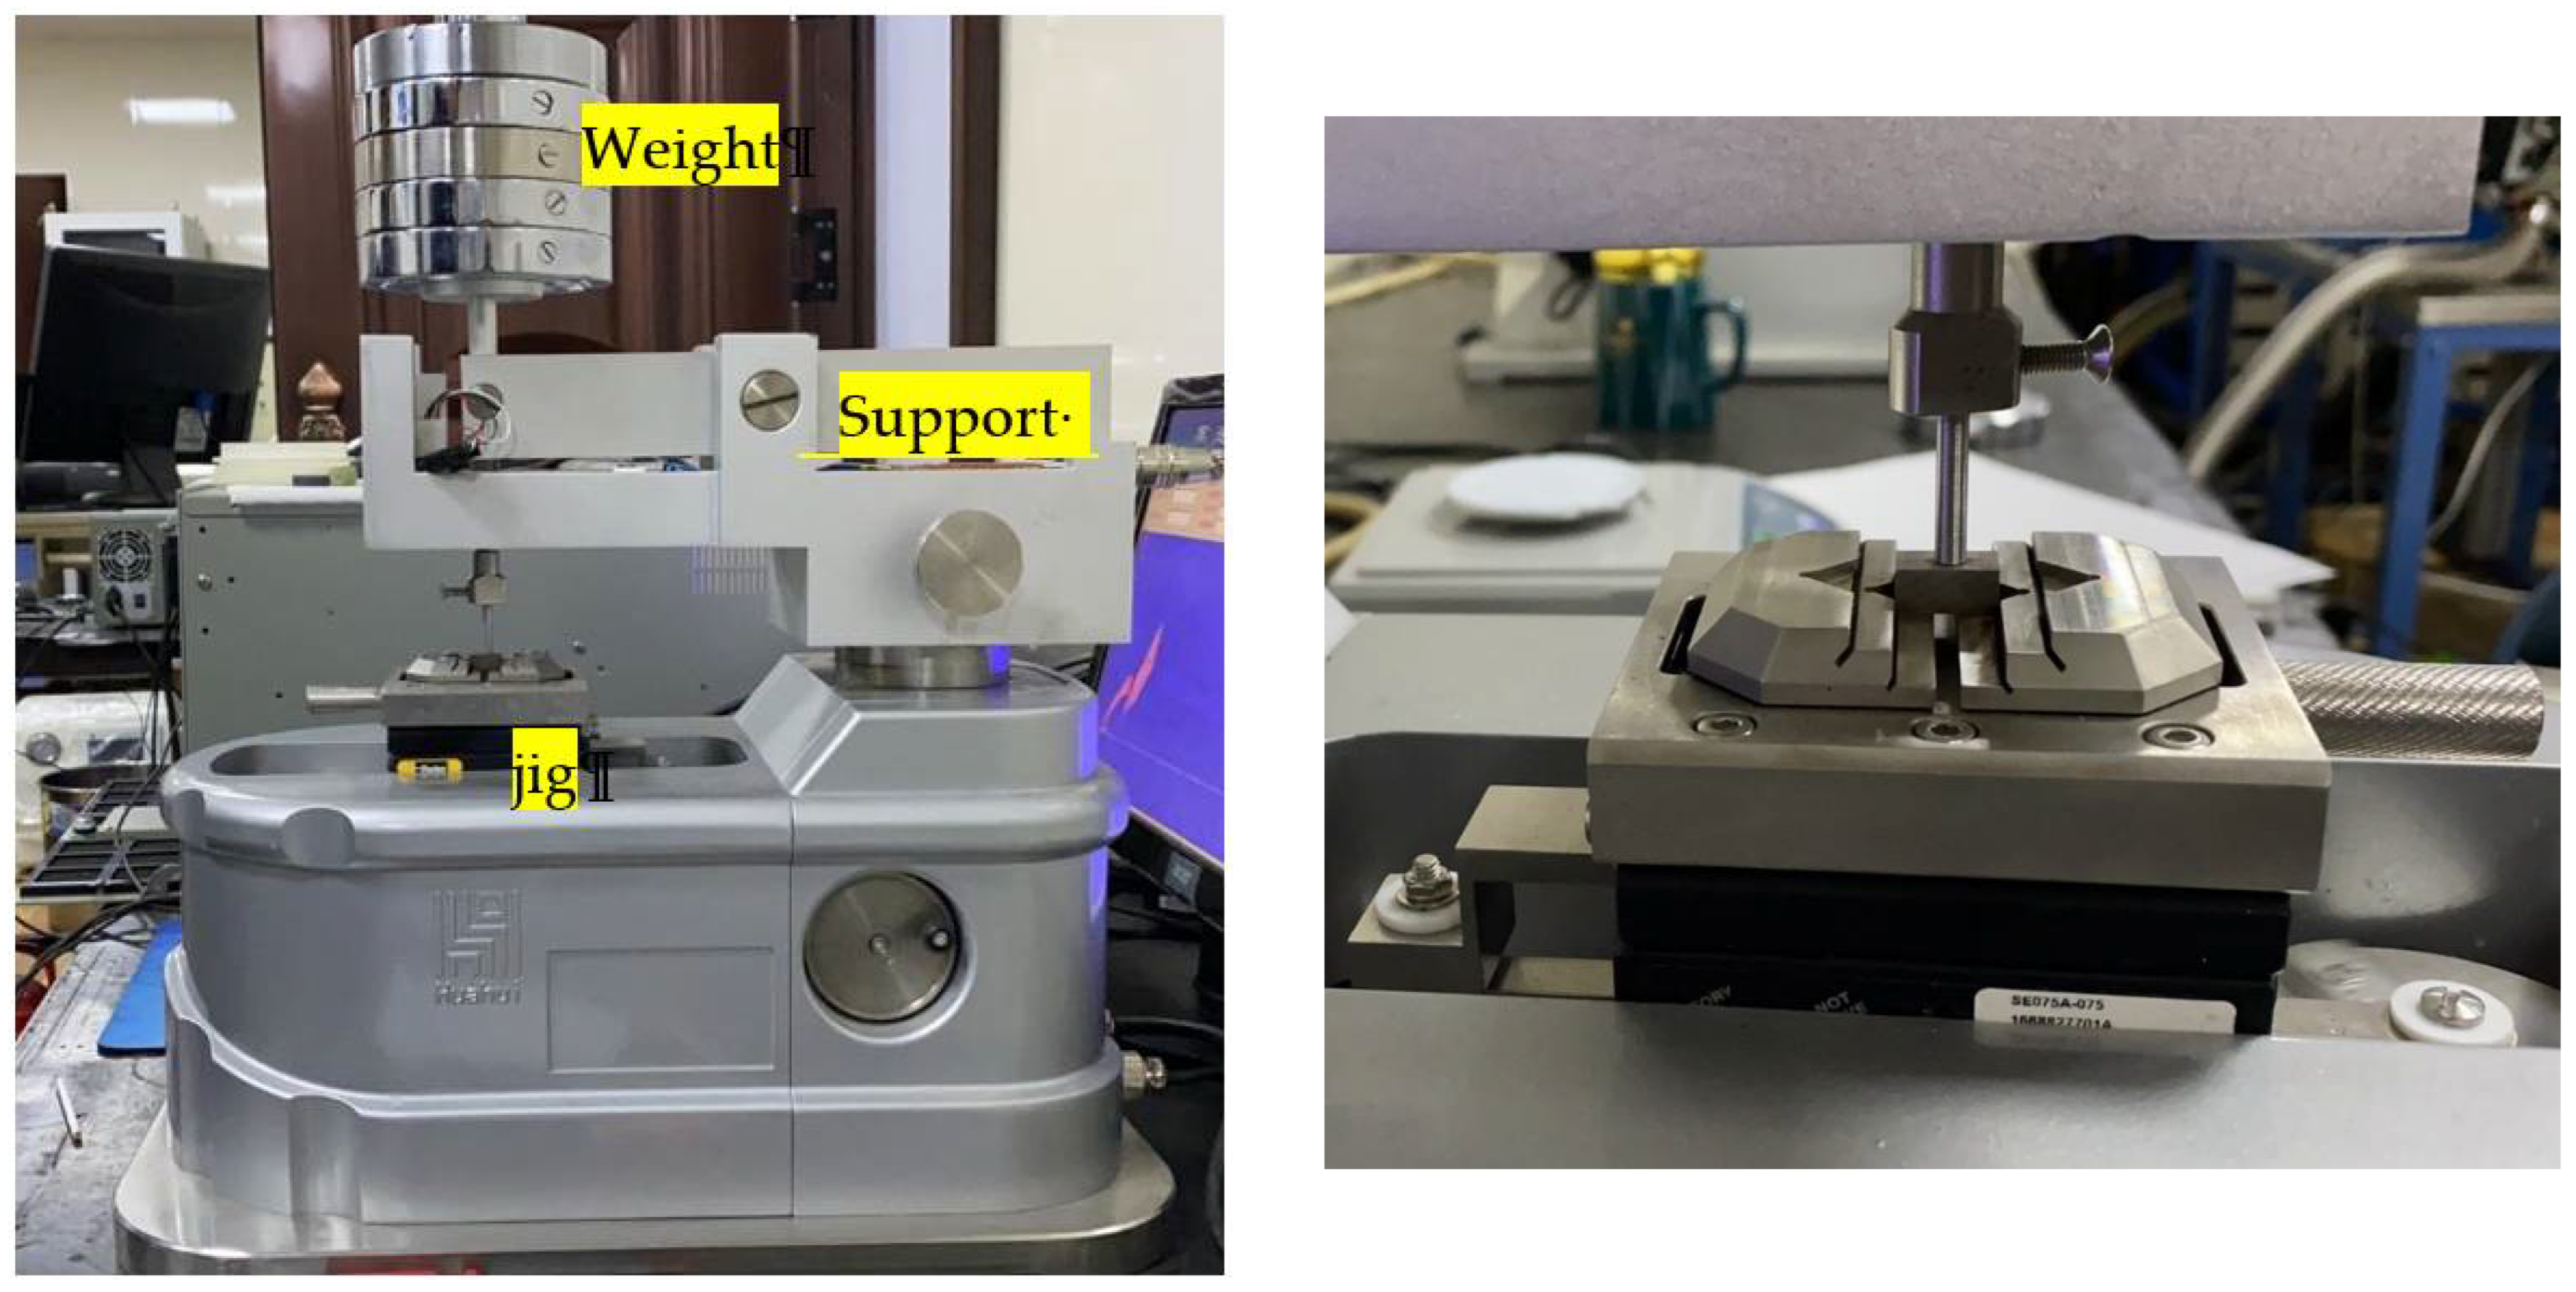
3. Reciprocating Wear Test and Modified Method for Stable-State Assessment

The service environment of the anchor chain includes the atmospheric area, splash zone, and full immersion area, and this study mainly focuses on the dry-wear behavior, which is representative of the wear behavior in the atmosphere zone. The cycle of the reciprocating motion of chains is close to a wave cycle, which is approximately 10–12 s [5], and the actual movement angle of the chain link is approximately 1–2° [4,10,14]; however, considering the test cost and test period, the actual wear test cycle is much shorter, and the amplitude is much higher. In Yaghin’s study [10], the test cycle was approximately 5 s (0.2 Hz), whereas, in the full-scale test conducted by Pauw [6,16], the test cycle was even shorter (1 Hz). In order to reduce the test period, the reciprocating wear period used in our test is maintained the same as that used by Pauw. In order to save time in this study, the condition applied for the distance of travel (L0) was set to be much larger than that applied for the actual project; similar methods have been adopted by many other researchers [10]. The test results indicated that there was no significant temperature rise of the contact surface under this loading frequency, and the influence of heat generation due to friction could be ignored.
Three materials were used in this work—carbon steel CM490, stainless steel SS316, and titanium alloy TC4. When considering the actual service condition of the anchor chain, the pin material is chosen to be the same as the flat specimen material, and both of them are machined from the chain link. The reciprocating wear test was conducted on the MFT-R4000 high-speed reciprocating friction and wear tester (Lanzhou Institute of Chemical Physics, China, see Figure 4). According to the principle of pin-on-disk friction, the reciprocating friction and wear state between the chain links were simulated, and the friction properties and wear resistance of the tested material under different loads were quantitatively evaluated. All samples were machined from the chain link by wire-electrode cutting, where the length direction of the test sample was along the axial direction of the link. The form and size of the test sample of the pin-on-flat plate friction pairs are shown in Figure 5.
Three load classes were used in the test—10 N, 30 N, and 50 N—and the load was applied by weights (see Figure 4). Due to the limitations of the test devices, no higher load was applied. The maximum loading ability of MFT-R4000 is 200 N; however, during the pre-experiment, the friction force was much higher than expected, and thus, the axial load was adjusted according to the measurement range of the friction sensor and the loading amplitude was assigned a certain gradient. According to the API SPEC 2F specification [25], the test load FP (kN) of the anchor chain can be obtained. The operating load F0 of the anchor chain is generally 1/3rd the test load [10], which is much larger than the maximum normal force applied in the test (the corresponding nominal contact stress is ~15.9 MPa). Nevertheless, the test results still have important reference significance for engineering applications since an upper limit of the dependence of wear coefficient on nominal contact stress was observed (see Section 5.3). In each case, only one test sample was used [note: the number of recovered mooring chain links is limited, and the links obtained from the operator were only enough to process the three samples required in this study (under three loading conditions); thus the specimen-to-specimen scatter was not tested]. In order to eliminate the test error, the tests were interrupted (at 600 s and 1200 s), and the wear damage was examined three times for each case. To ensure that the contact surfaces were put back in the same location and orientation as they were in the prior test segment, aligned marking lines are made on the flat specimen and fixture of the testing machine in advance so as to restore them to the original position as far as possible after measurement.
The total test time (Tt) was determined from the friction force history and measurement accuracy of a profilometer. In fact, the total test time can be much lower than that used in this study (i.e., 30 min), a wear depth detection time interval of 5 min is enough (as long as there is a certain wear depth increment, and it is easy to determine such depth increment due to the high accuracy of the profilometer, which can be up to 1 μm), and the total test time is considerably reduced compared to the conventional method. Moreover, due to uneven wear (see Figure 3), the difference between the actual contact stress and the nominal contact stress will become larger with the longer time.
Before conducting the test, the contact surface of the friction pairs was wet-ground step-by-step to 1000 grits by using an abrasive paper. After the test, the depth of the wear scar along the width direction was measured three times every 10 min at different positions along the wear direction by using a surface profilometer (with a precision of up to 1 μm), and the cross-sectional area of the wear scar was obtained (Figure 3). In addition, the average value of the three measurements was divided by the contact width (equal to the diameter of pin, D) to obtain the average wear depth havg, and then the relation between the wear depth and wear cycle (or sliding distance s) was obtained based on the modified wear model (see Section 3).
Moreover, this study proposes a method that can estimate the wear process to reach a stable state. The change in the coefficient of friction (CoF) was monitored during the test, where the sampling frequency of CoF was 0.048 s, which means that at least 20 samples were taken per loading cycle. Once the CoF reached a relatively stable state, it corresponded to a stable wear state. In this case, the wear depth increased with the wear length almost linearly, and the wear coefficient (k) was obtained. After the wear test, a scanning electron microscope (SEM) was used to observe the wear surface to determine its wear mechanism. In addition, material hardness was also measured on a Vickers hardness tester, five measuring points were taken for each material, and the average value was calculated. The test conditions used in this work are listed in Table 1.

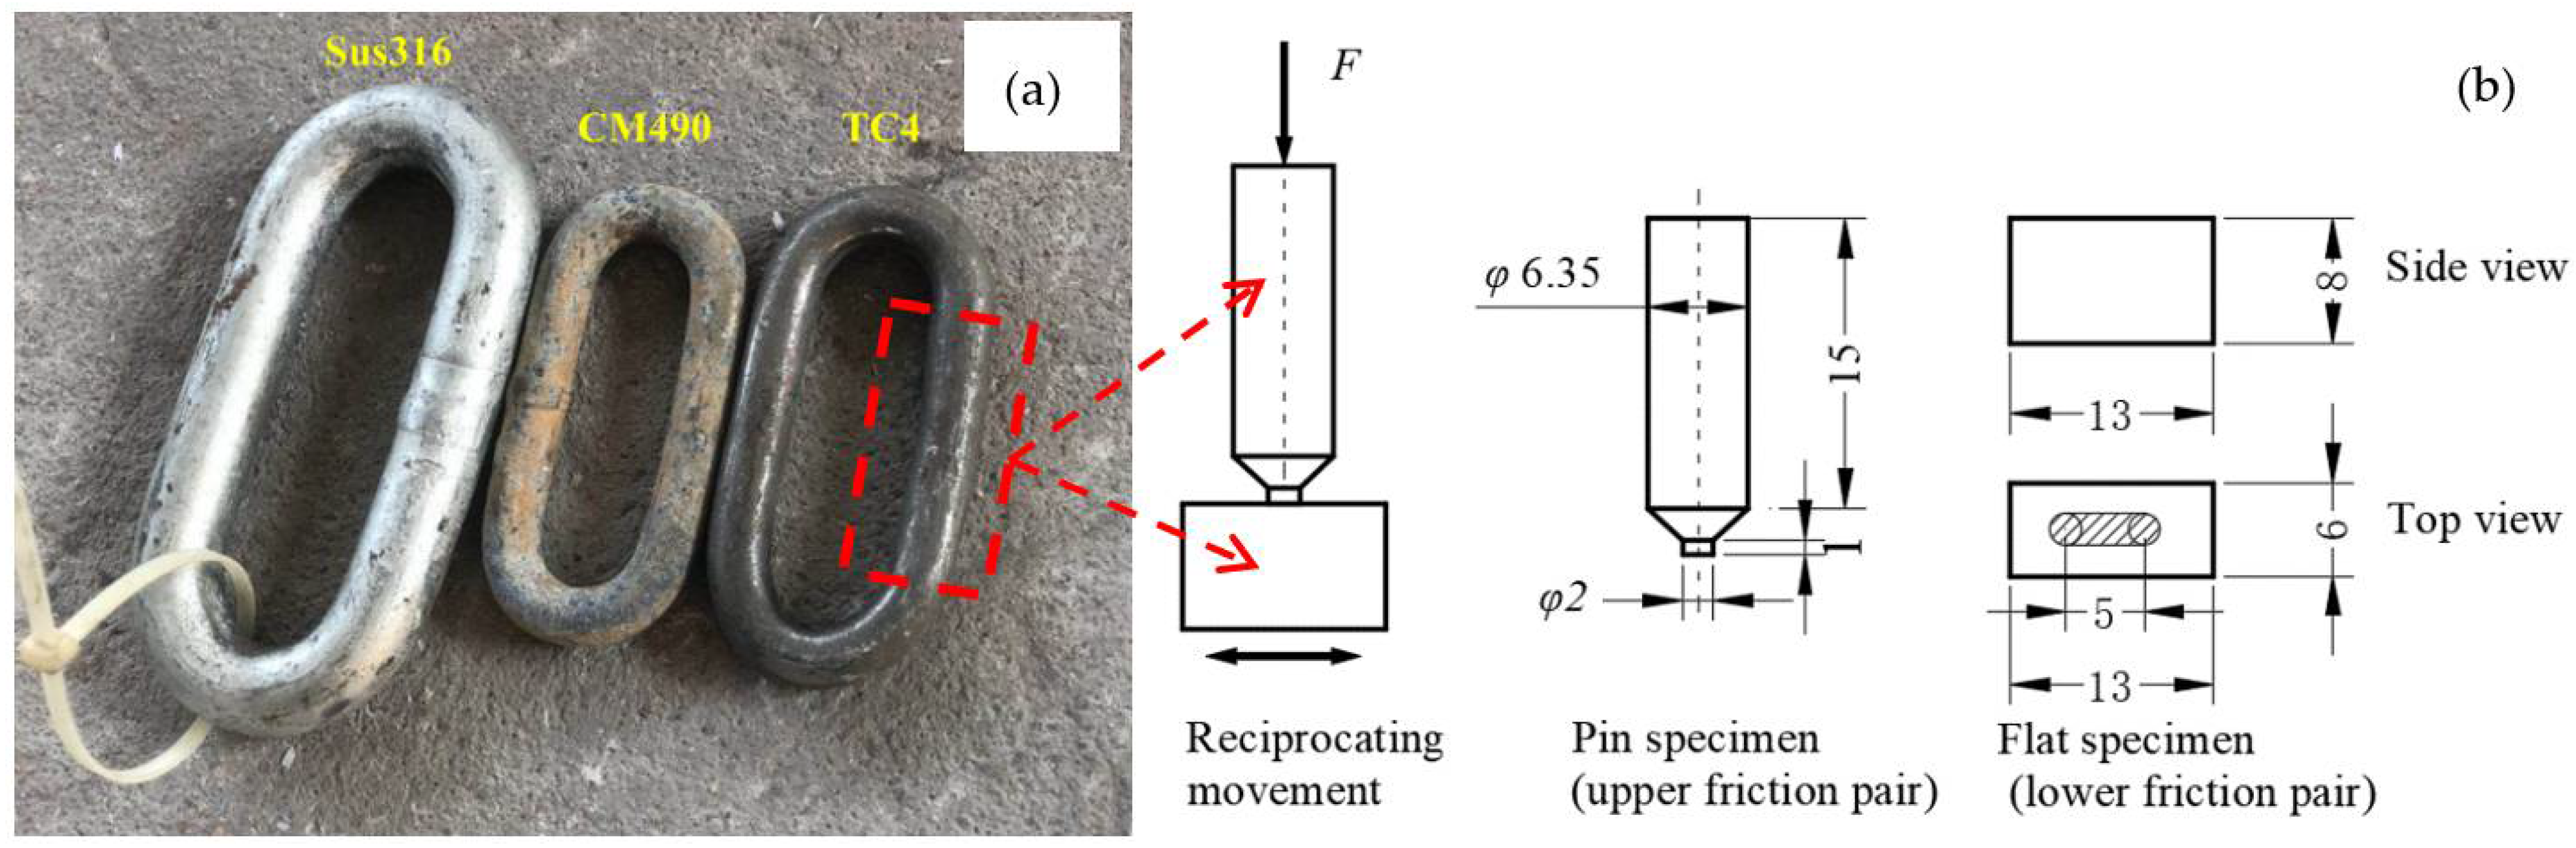
4. Material Properties

The chemical compositions of the tested materials are listed in Table 2; for further analysis (such as numerical simulation), the mechanical parameters are needed, including Young’s modulus E, Poisson’s ratio v, yield strength σy, tensile strength σb, and density ρ, which are shown in Table 3. The hardness of the tested material was determined by a Vickers hardness tester based on the test procedure given by ASTM E92-17 [26]. Figure 6 shows the measured hardness of the three alloys, indicating that the hardness of TC4 is the highest, whereas that of SS316 is the lowest. The variation of the measured hardness of CM490 is the largest, whereas that of SS316 is the lowest. Generally, the wear resistance is directly proportional to the material hardness [2,19], which is confirmed by the measured value. Moreover, the higher yield strength of TC4 (Table 3) might also be related to its better wear resistance (see Section 5), which leads to smaller contact stress to hardness (σcontact/Hv) or yield stress ratio (σcontact/σy). Moreover, the much lower Young’s modulus of TC4 indicates its lower rigidity, which leads to the generation of lower stress under the same deformation.

5. Test Results and Wear Mechanism Analysis

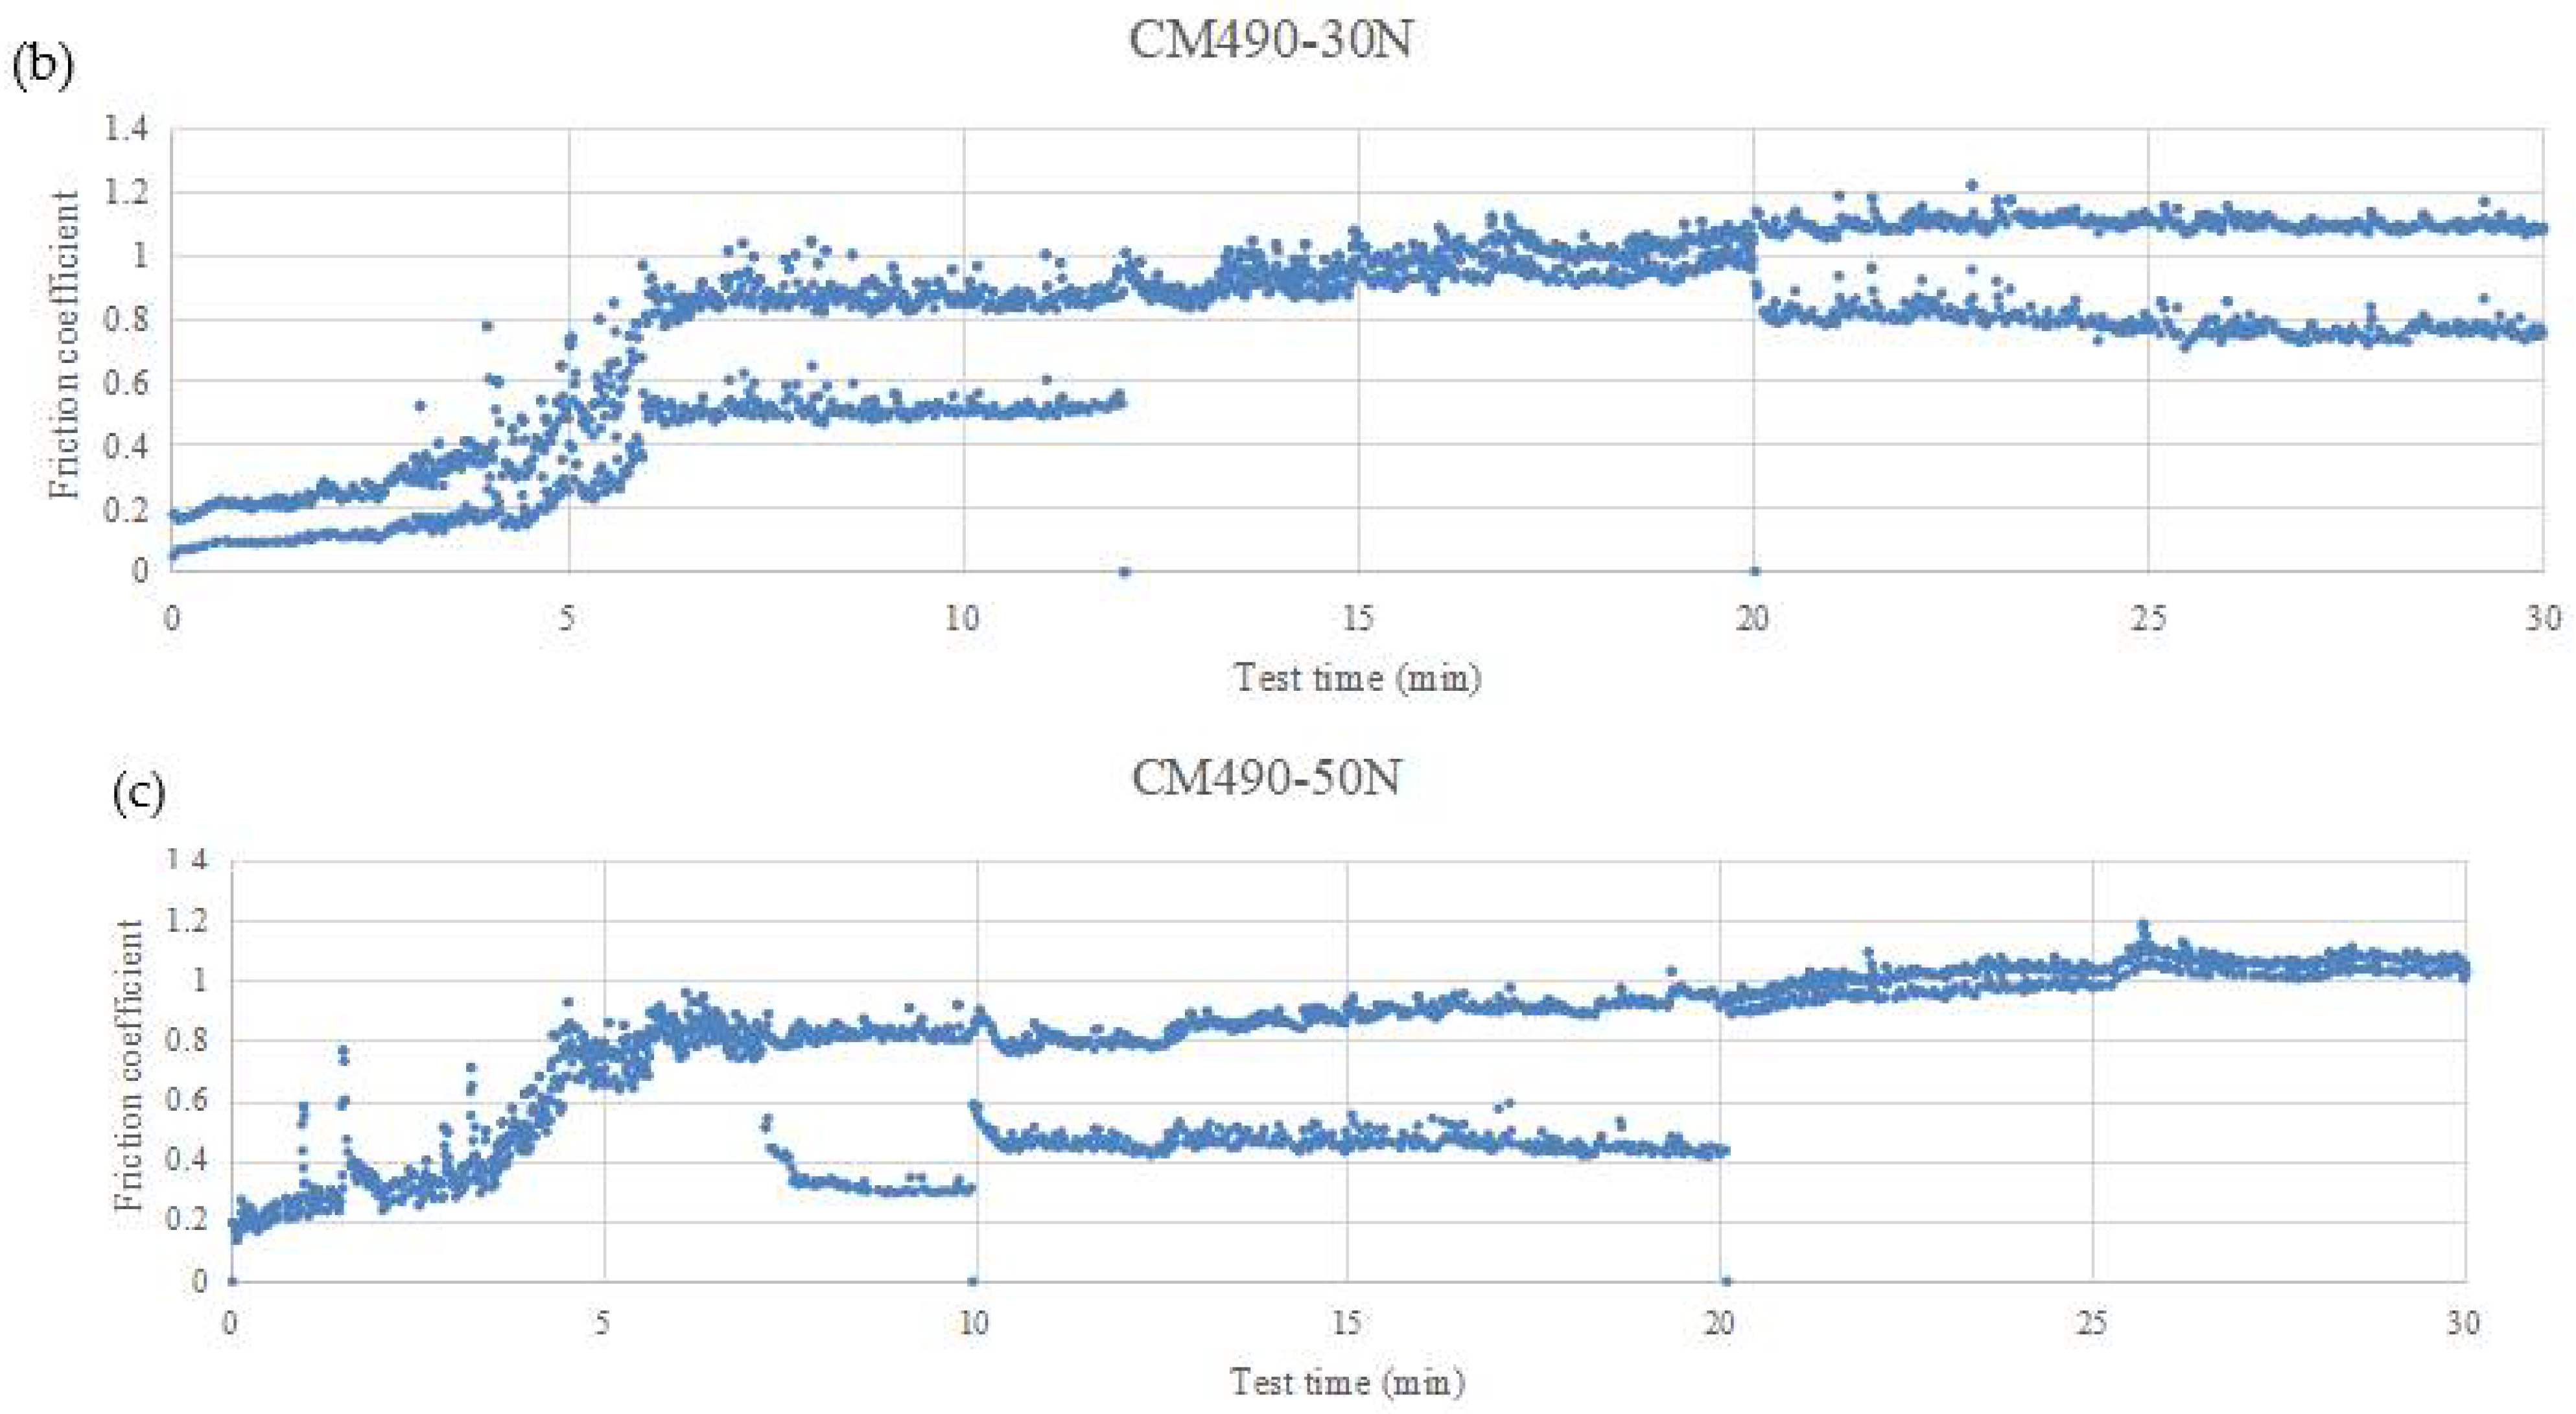
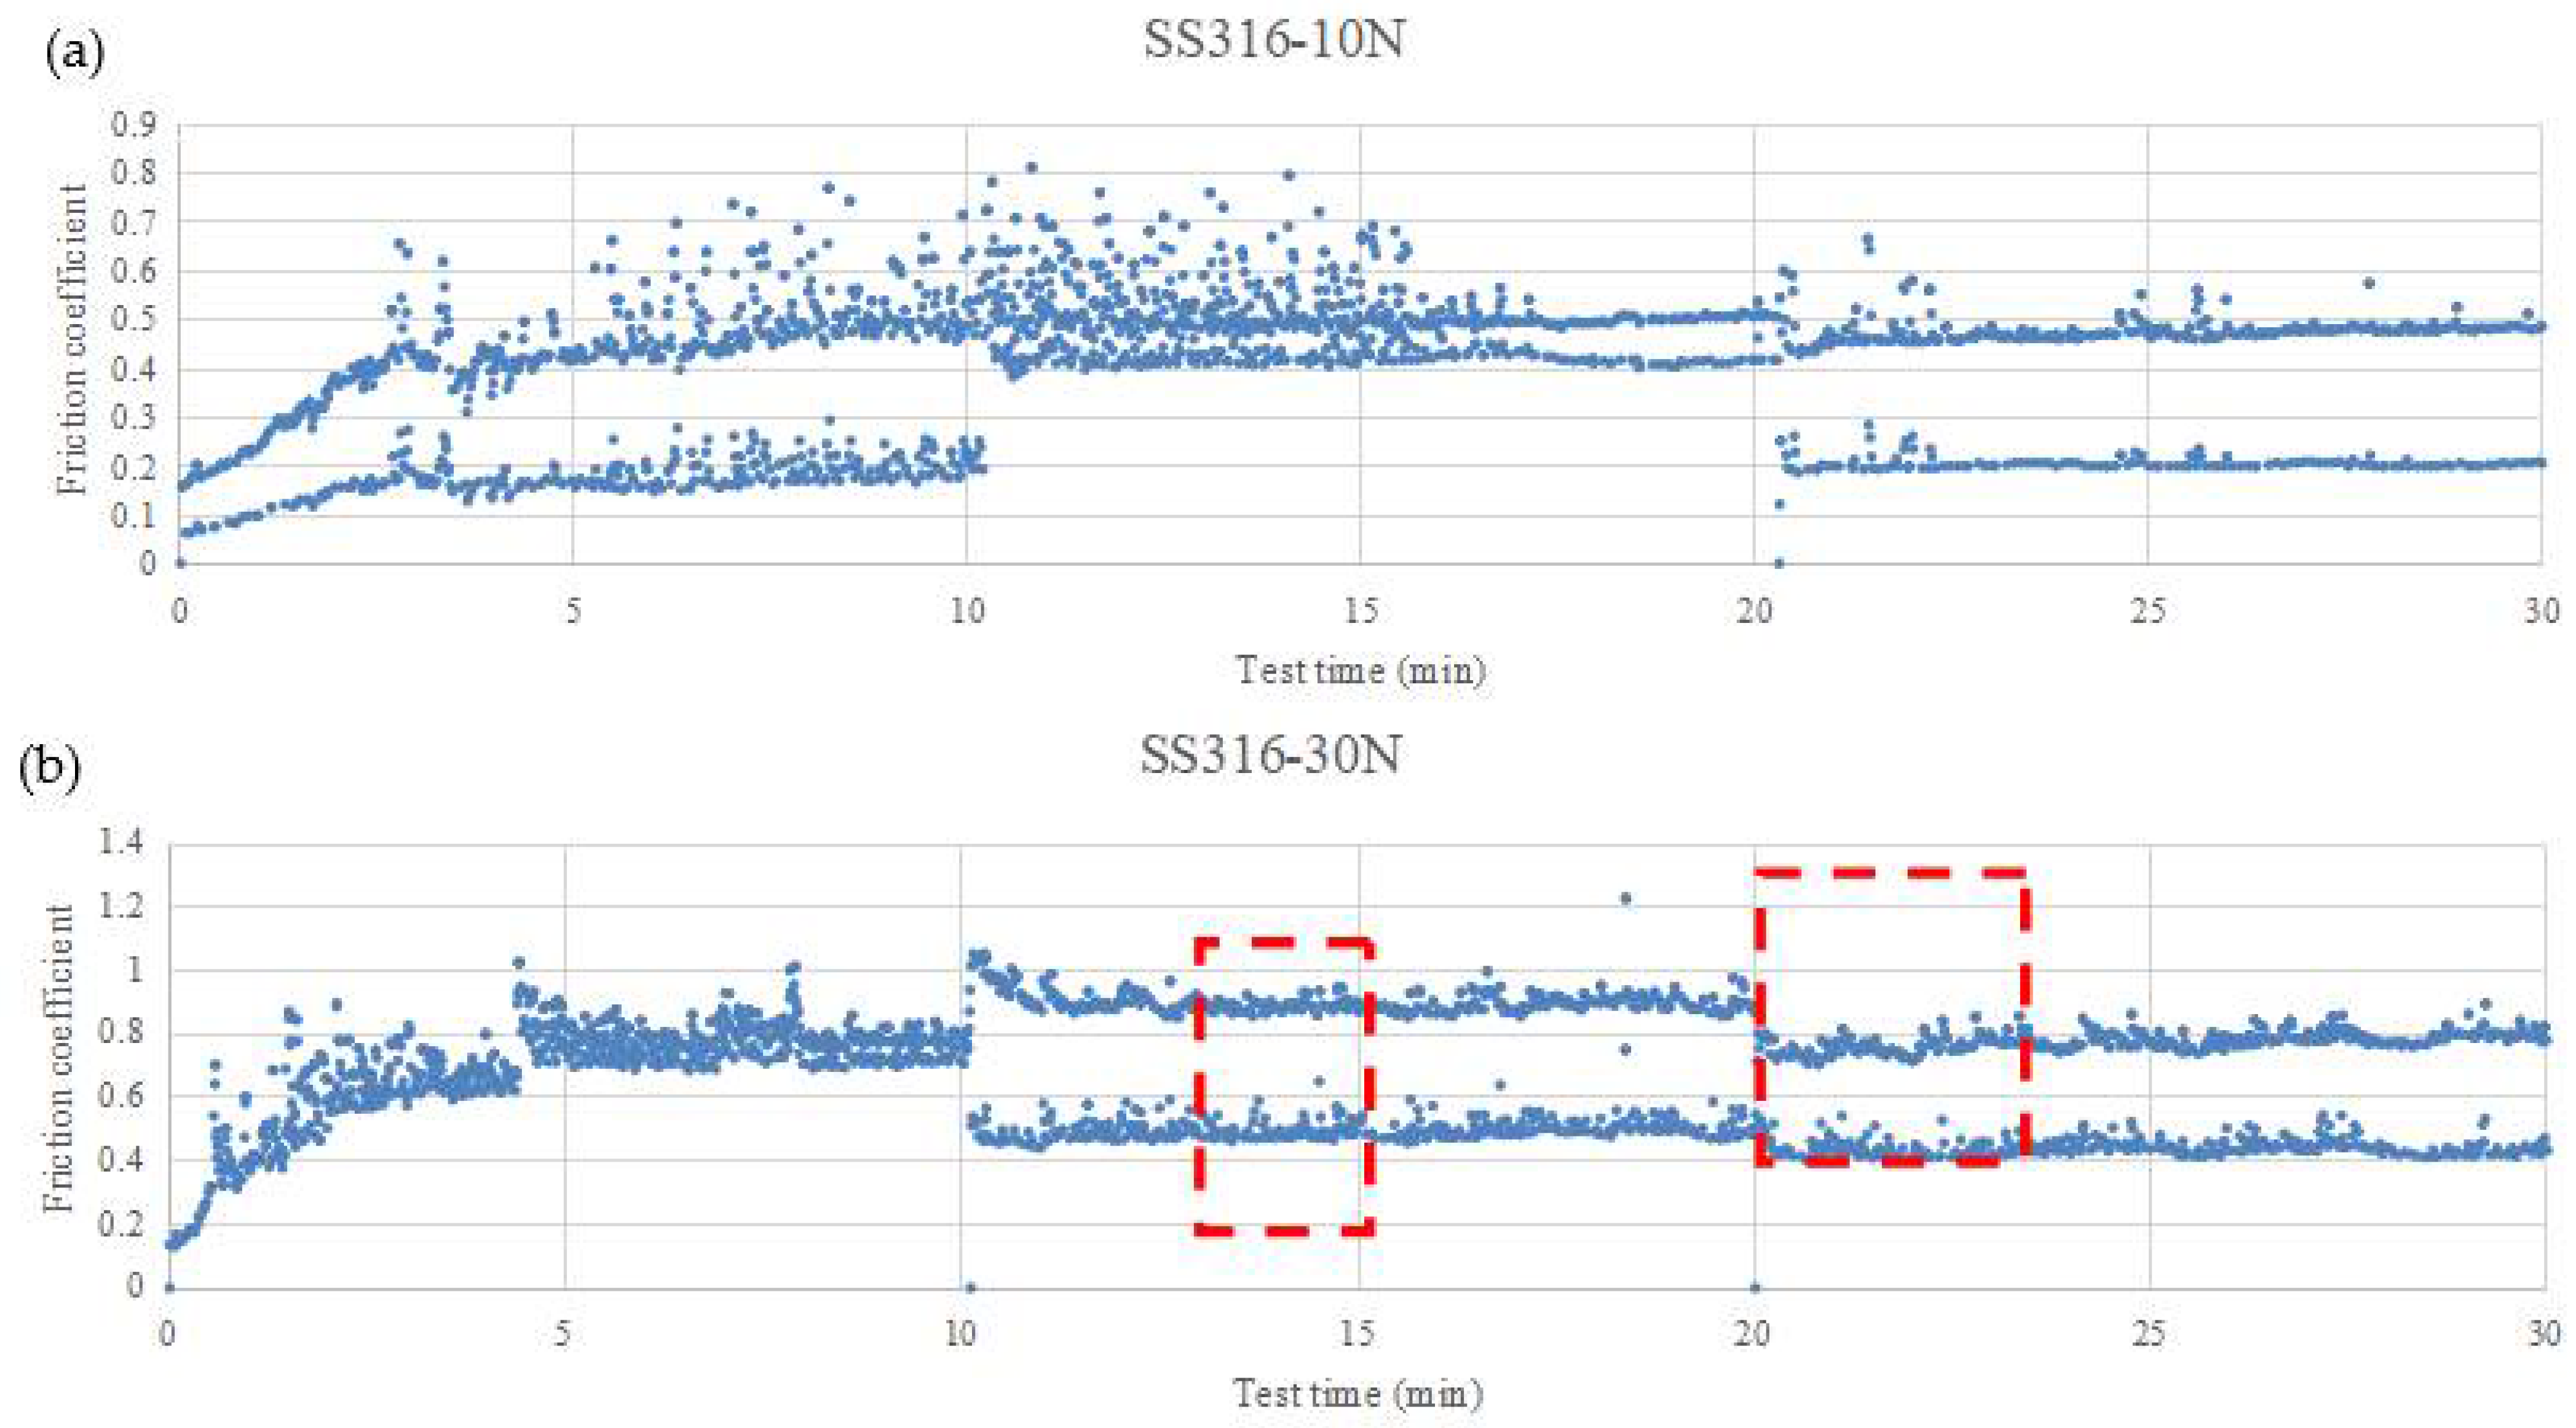
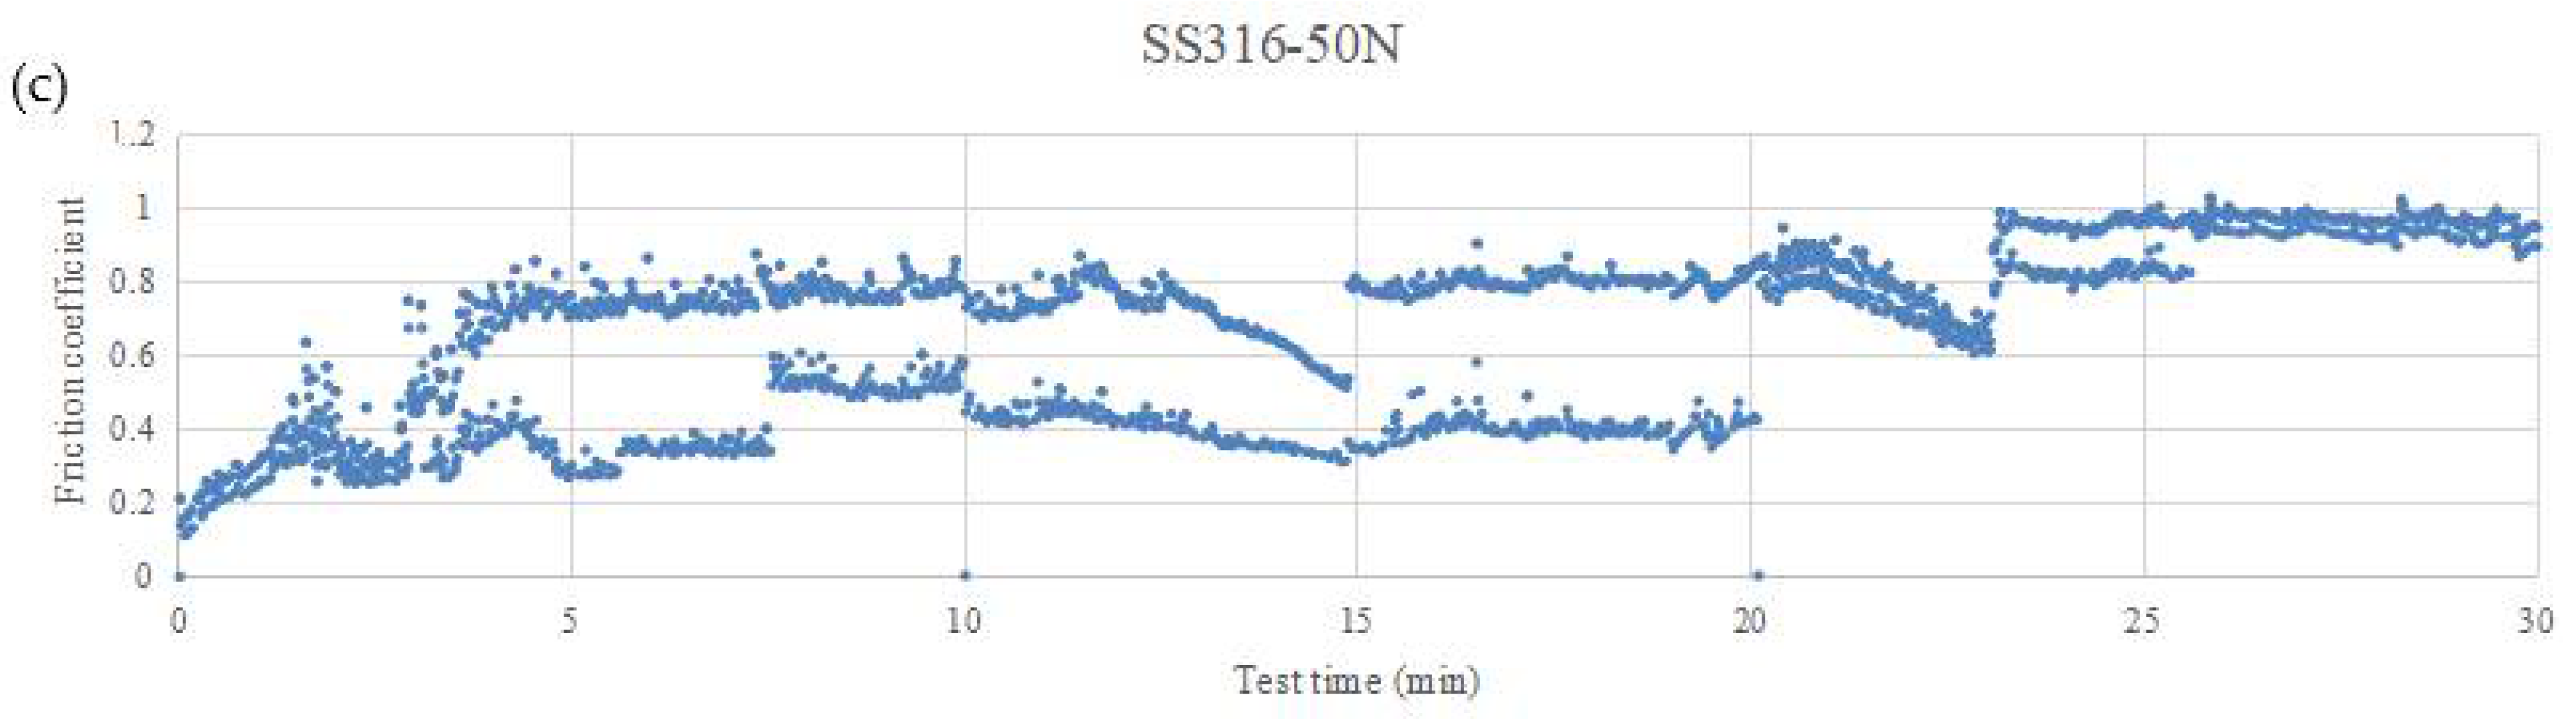
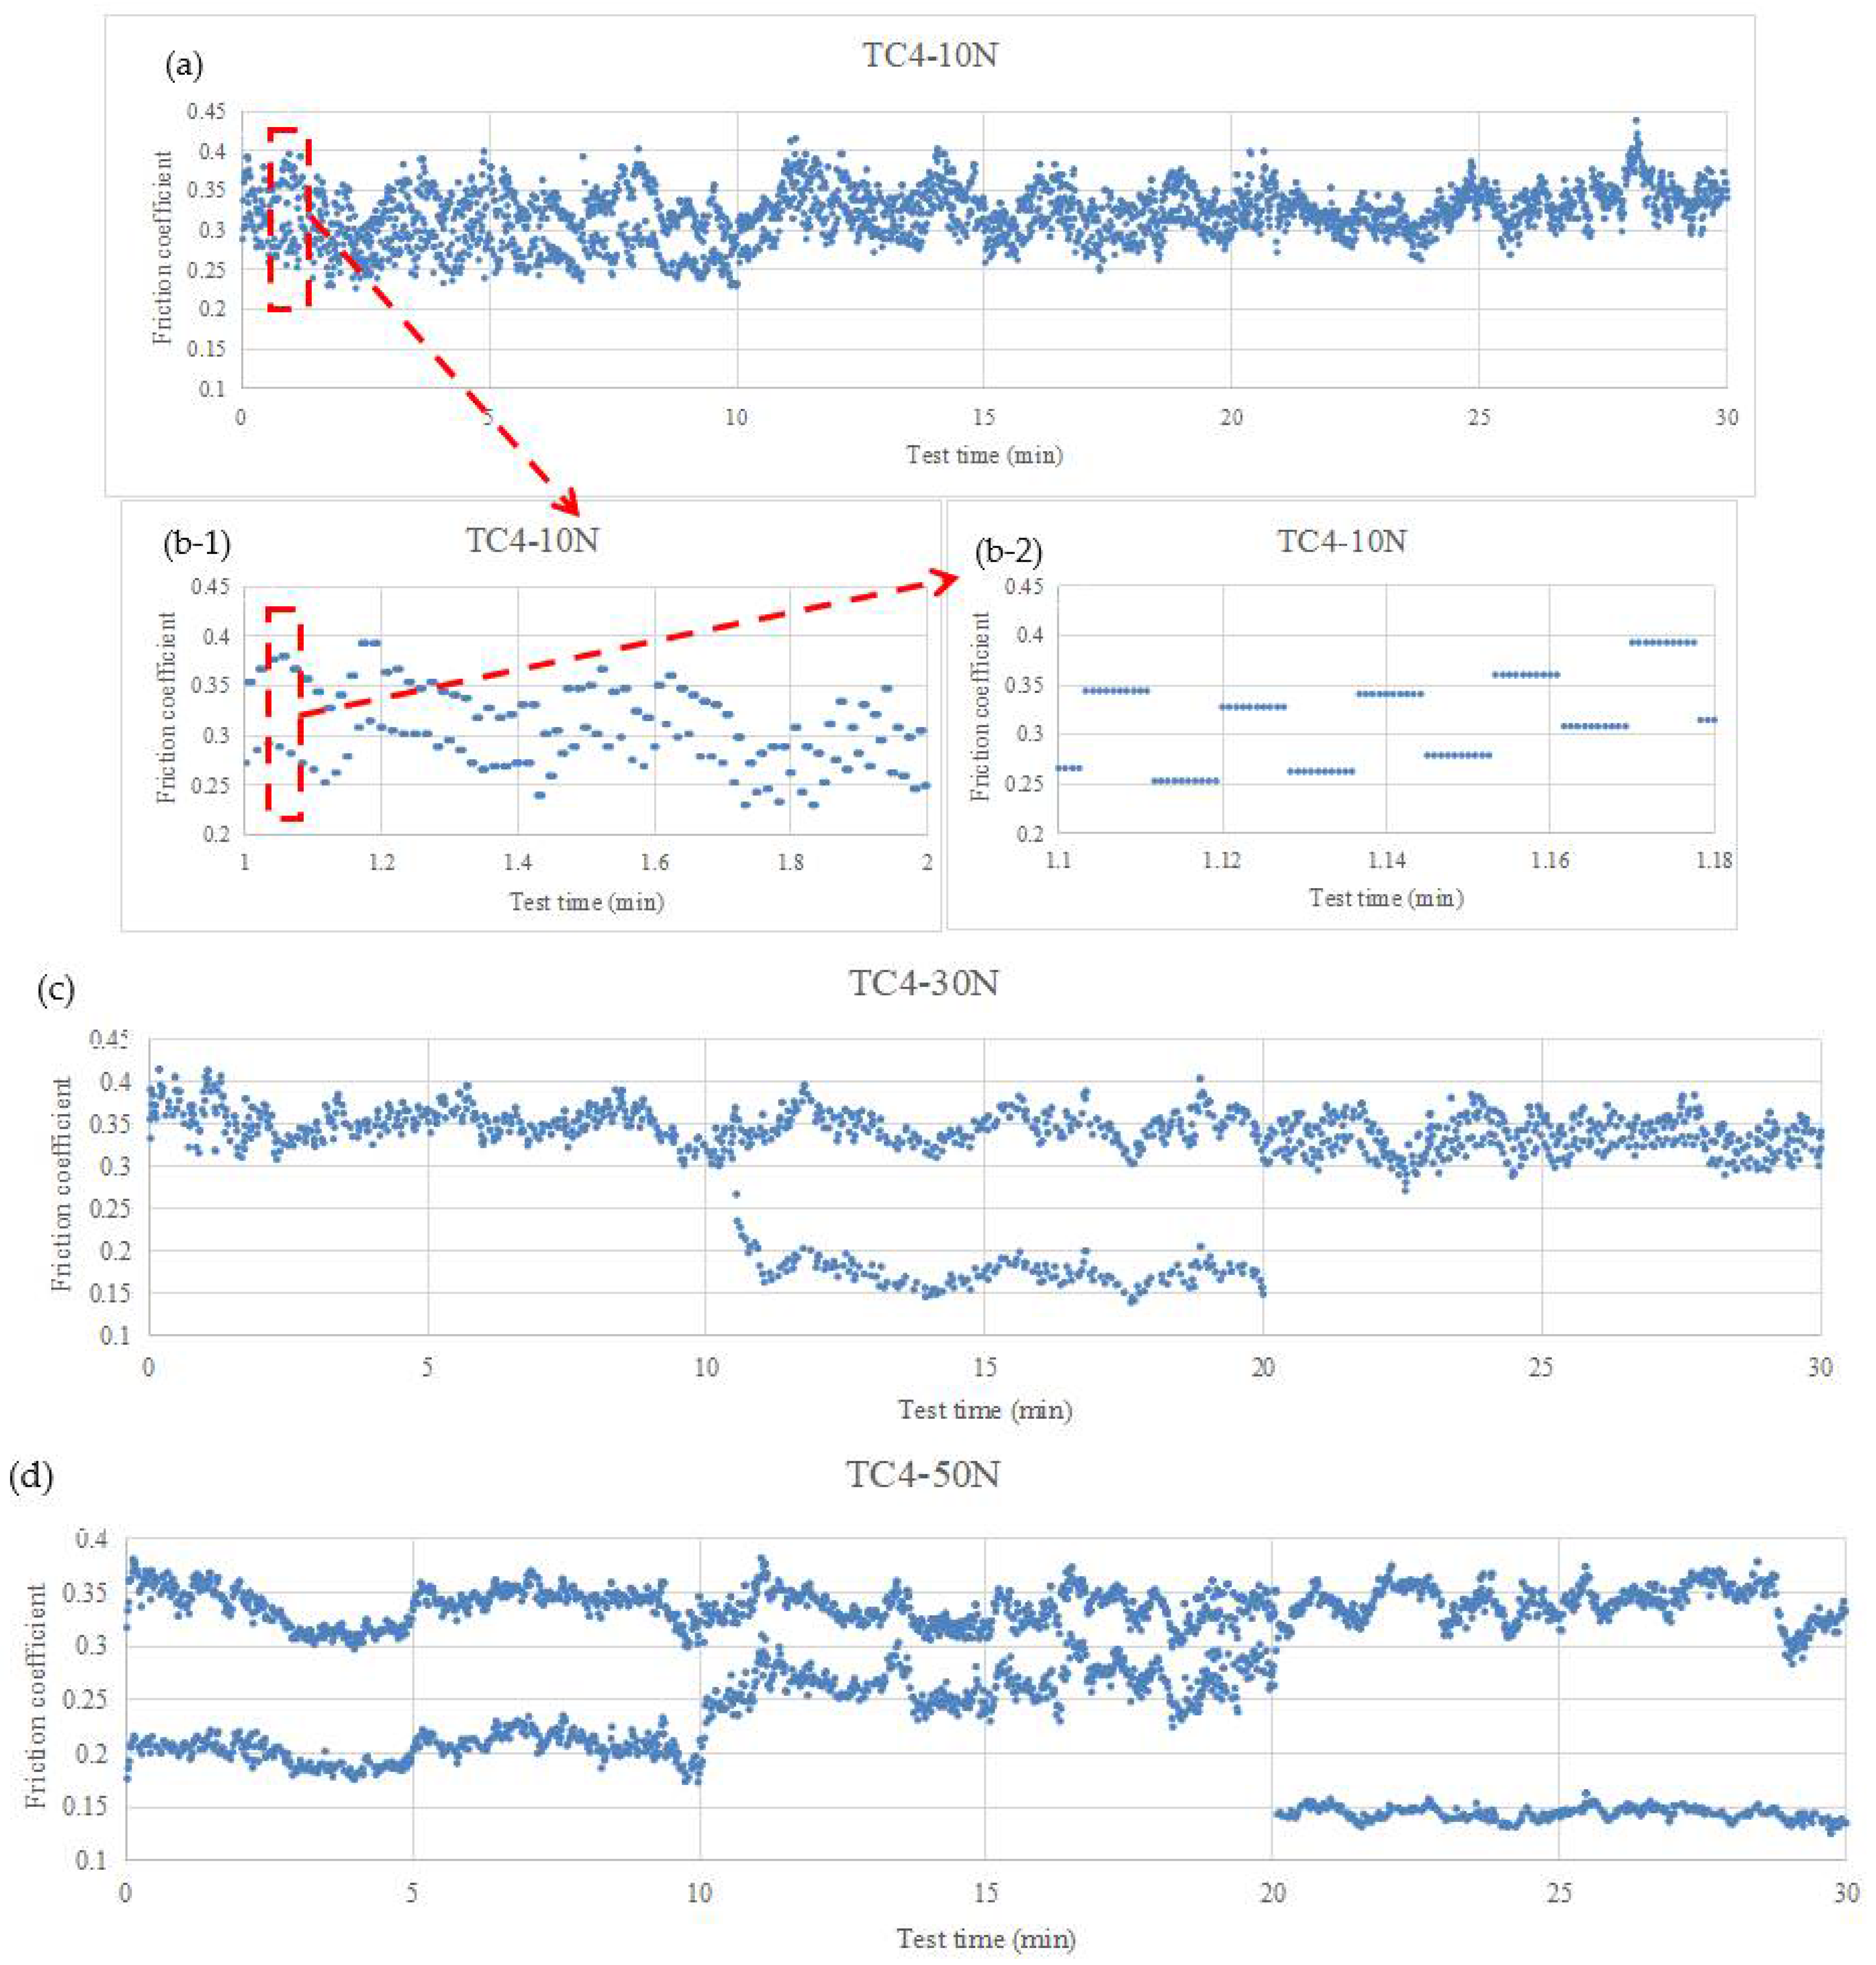
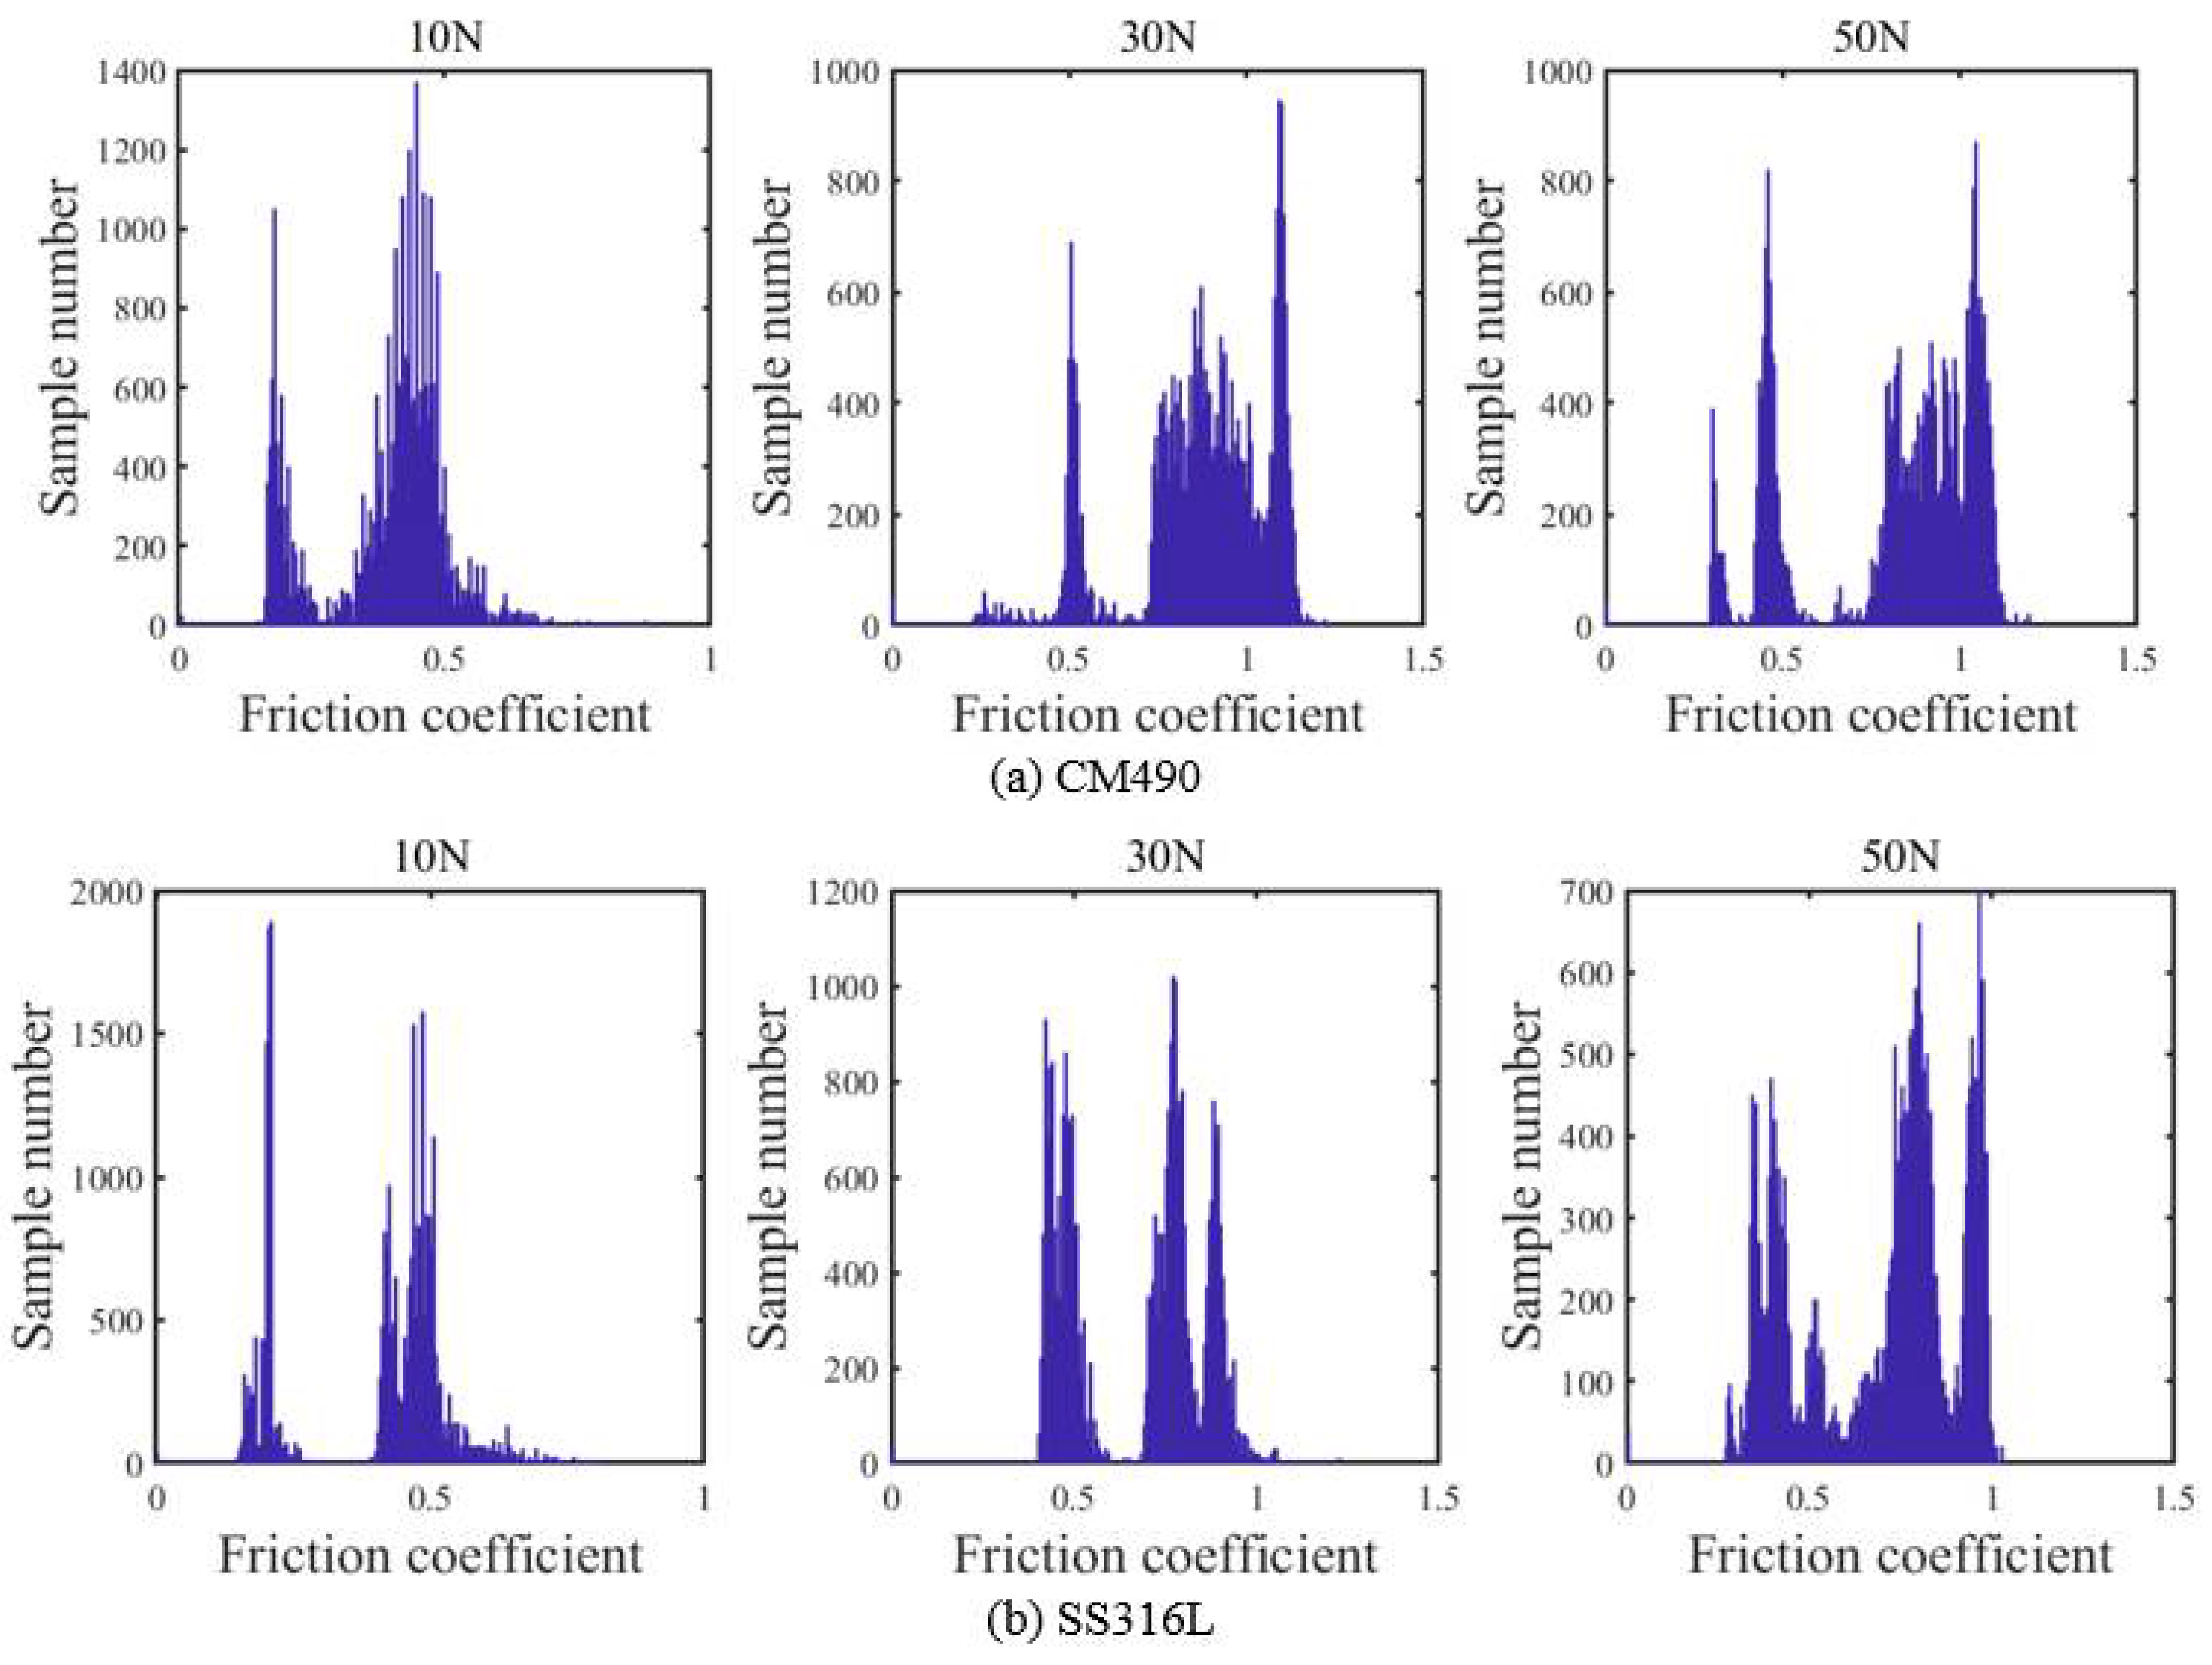
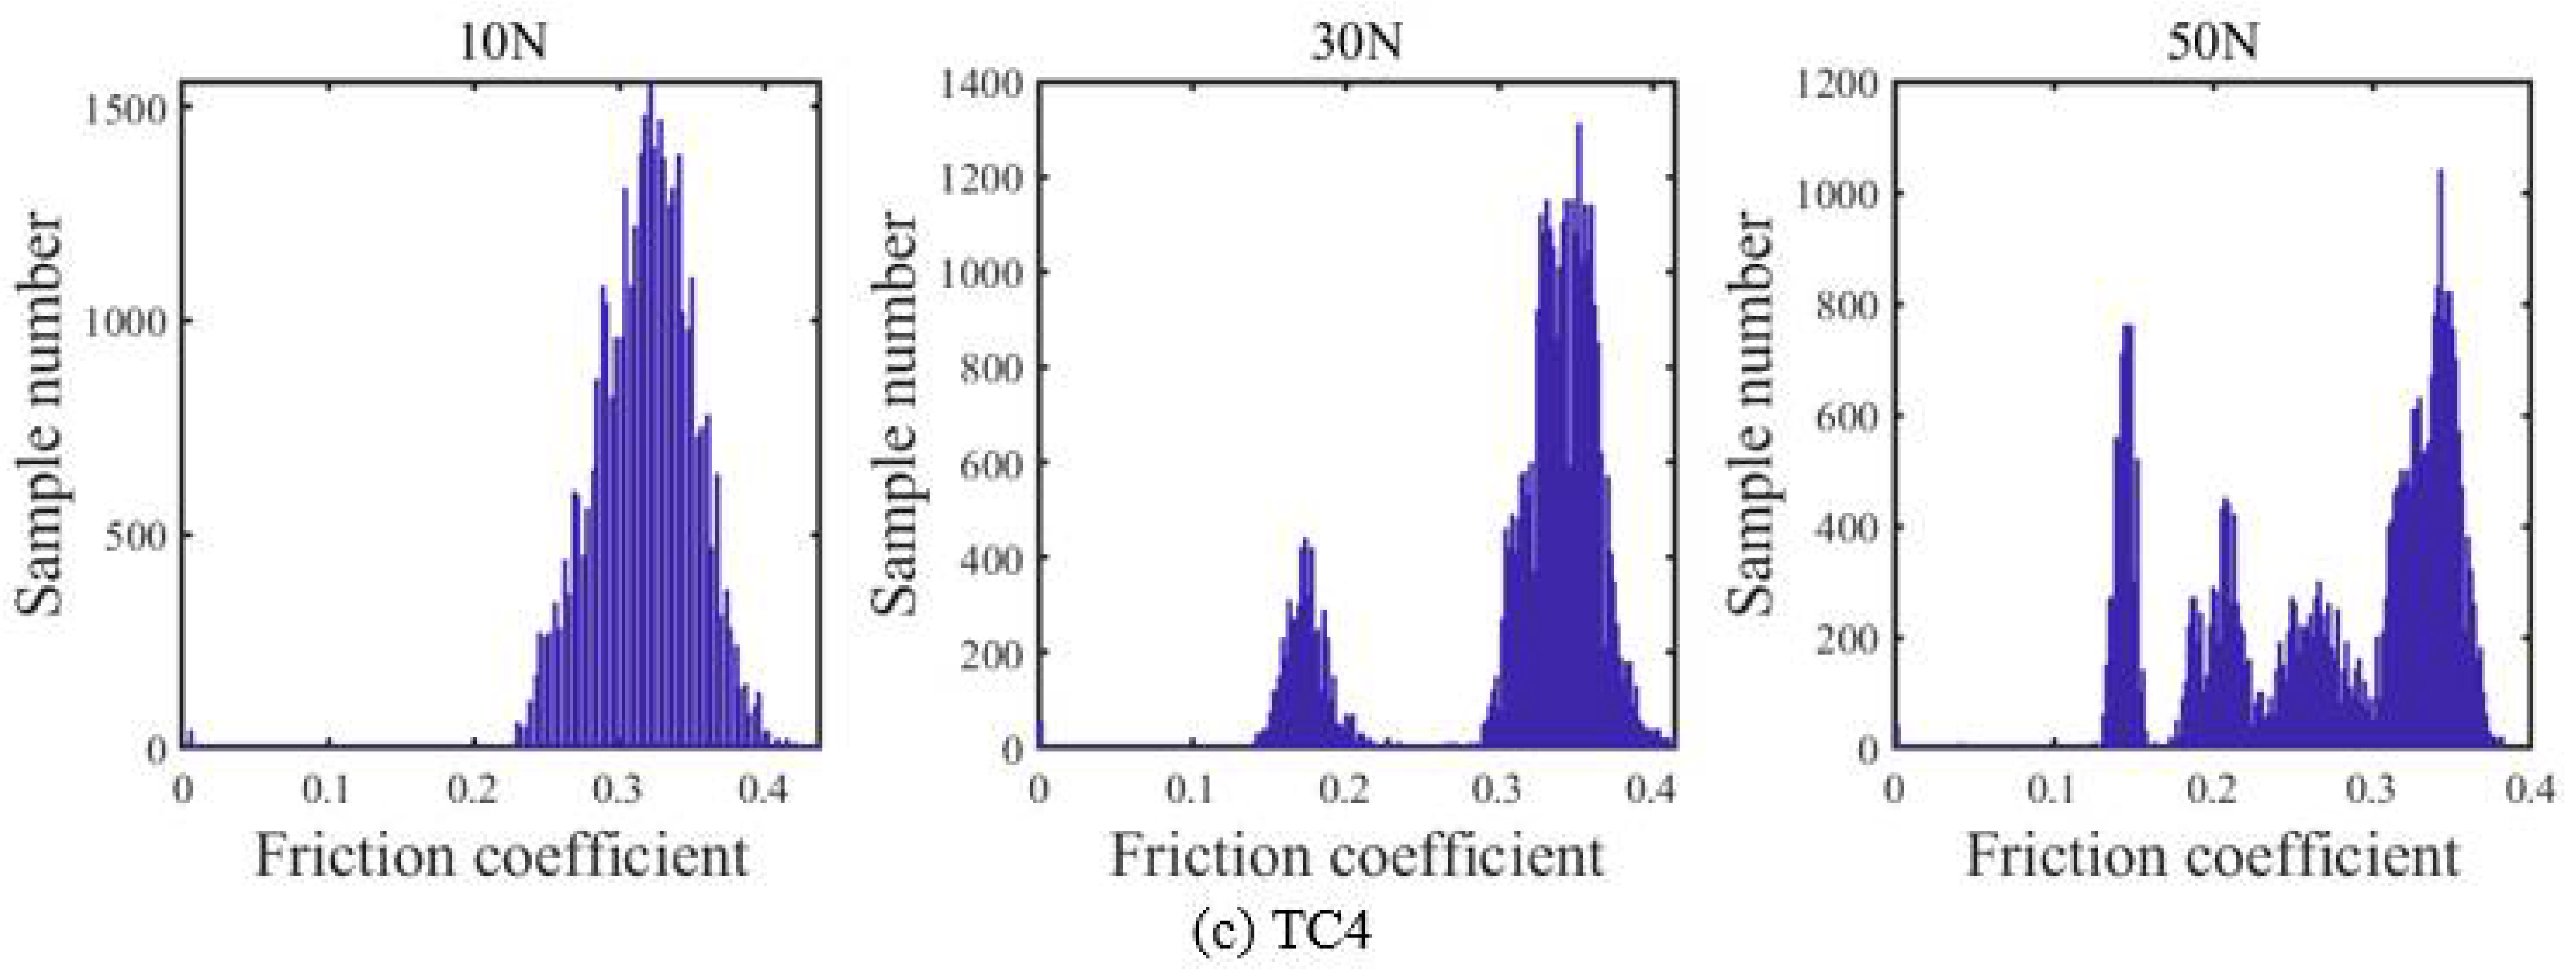
5.1. Variation in CoF

In order to understand the friction process in detail, the friction coefficient was monitored throughout the test. Figure 7, Figure 8 and Figure 9 show the time history of CoF during the test, where the jumps observed at 10 and 20 min are related to the stop intervals for wear damage detection. This result indicates that the loading and unloading of the sample have a certain influence on the wear process, which is attributable to a certain dislocation of the mated surface after re-installation. Thus, the fixed part of the test sample should be designed with a fixed orientation to ensure a consistent contact state before and after the loading and unloading. However, other unusual jumps were observed at other times, as shown in Figure 8c (marked by a dotted line), whose underlying reason is still not clear, as these are not commonly observed phenomena. The recorded results indicate that there are two completely different values of CoF in all figures. A detailed examination of the test data indicates that the friction coefficients alternate with the change in the wear direction (see Figure 9(b-1) and (b-2), within a much smaller time scale). Moreover, the CoF is basically the same within each half cycle. Evidently, the change in the friction direction significantly changes the friction force, which is attributable to the coupling between the worn surface and wear debris. Therefore, in the reciprocating sliding wear process of the link, a constant CoF is not reasonable, and thus, different values of CoF should be used when the wear direction changes.
The results shown in Figure 7, Figure 8 and Figure 9 indicate that the CoF is constantly changing; similar phenomena have been observed previously [29,30]. In addition to the reciprocating periodic change, the friction coefficient also presented periodic fluctuations due to the dynamic wear process. Among the three tested materials, the CoF of TC4 is less force-dependent, at least within the test load range, whereas those of SS316 and CM490 increased with the applied force. During the test, for CM490 and SS316, the CoF increased rapidly first and then stabilized, after which it increased slowly. Such an increase became more significant under the application of large loads. The increase in CoF in the early stage during the wear test is mainly attributed to the fact that the contact surface reached a stable contact state after the contact pair was established for a given period, and the wear debris scraped from the contact surface enabled the contact surface to reach a stable contact state; thus, the friction force remained constant. In the subsequent wear process, the friction coefficient increased gradually, which is mainly attributed to the formation of a wear scar on the surface of the flat specimen. With the formation of the wear scar, their sides contacted the outer surface of the pin specimen, which led to an increase in the friction force and the measured CoF. Under large loads, the CoF increased more rapidly after a steady contact state was reached due to faster wear. However, this phenomenon was not observed for TC4; the CoF of TC4 remained constant in the range of approximately 0.14 to 0.44. However, COF values higher than unity were observed for CM490 and SS316, which were relatively rarely observed [31,32]. Such a phenomenon indicates that it is easier to lift the piece than drag it; however, the underlying reason is still not clear. The value of CoF of CM490 under low stress is compatible with that of carbon steel observed in the literature [33], and the value of CoF of SS316 is compatible with that observed by García-LeónJ [34], where the applied force on AISI 316 L was relatively low (5, 10, and 20 N). In their study, a rapid increase in CoF was observed at the beginning of the test, which remained in a relatively stable state. The CoF increased slightly with the applied force, and the observed maximum value of CoF was approximately 0.6; similar results have been achieved in previous studies [35]. Other researchers have indicated that the CoF of 316 stainless-steel pins against a yttria-stabilized zirconia disk was approximately 0.6–0.8 [36,37]. The value of CoF of TC4 was the same as that observed in cold-sprayed Ti and Ti-TiC composite coatings [38], where the CoF was approximately 0.42 at 25 °C.
When considering the significant variation of friction coefficient, some statistical analyses are carried out. The statistical graphs of friction coefficients under different applied loads are shown in Figure 10. In most cases, the coefficient of friction shows bimodal distribution or multimodal distribution, which indicates that the coefficient of friction changes significantly during the reciprocating sliding wear process. The randomness of the friction coefficient indicated that the damage evolution process on the contact surface is complicated, which should be carefully considered for wear simulation. The averaged value of CoF is shown in Table 4. Comparing the CoFs of CM490 and SS316, the variation in CoF of TC4 was relatively small. Moreover, the variation became significant as the applied force was increased (Figure 9a–d); similar trends were observed for CM490 and SS316.

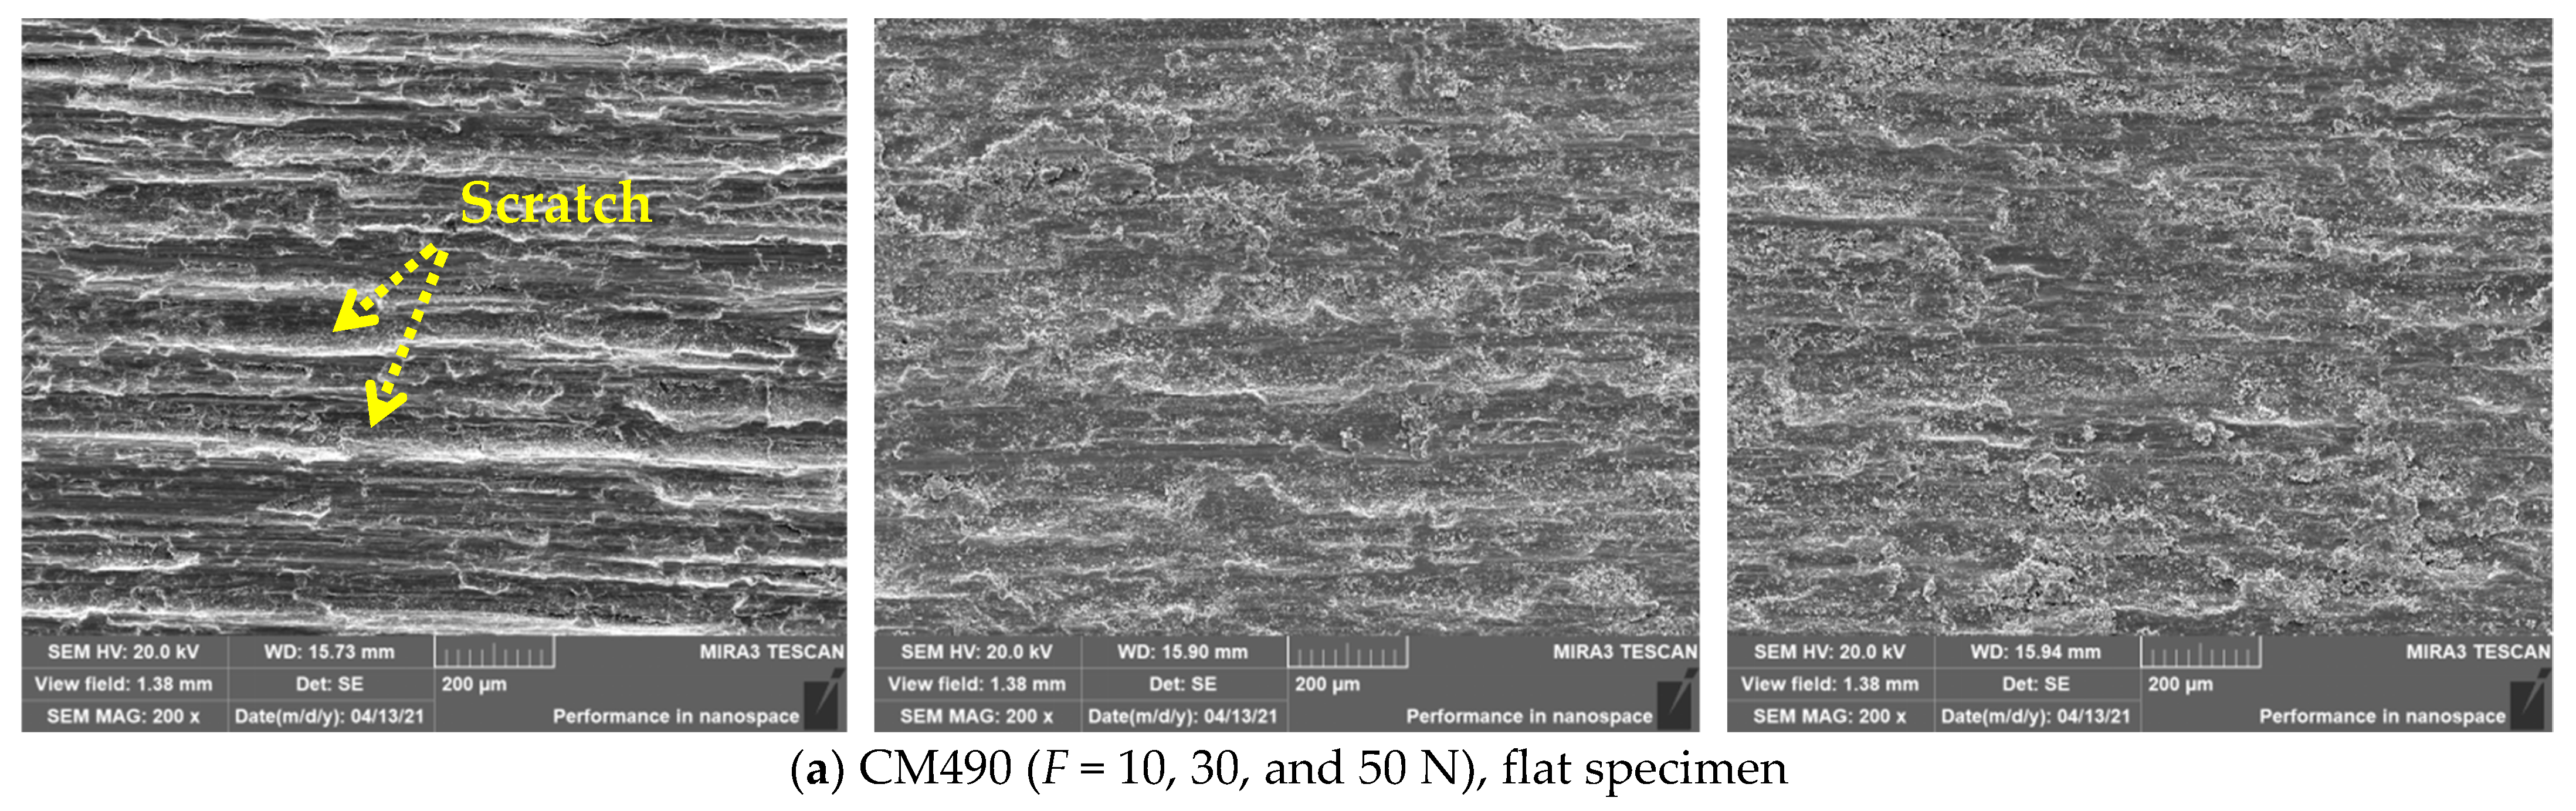
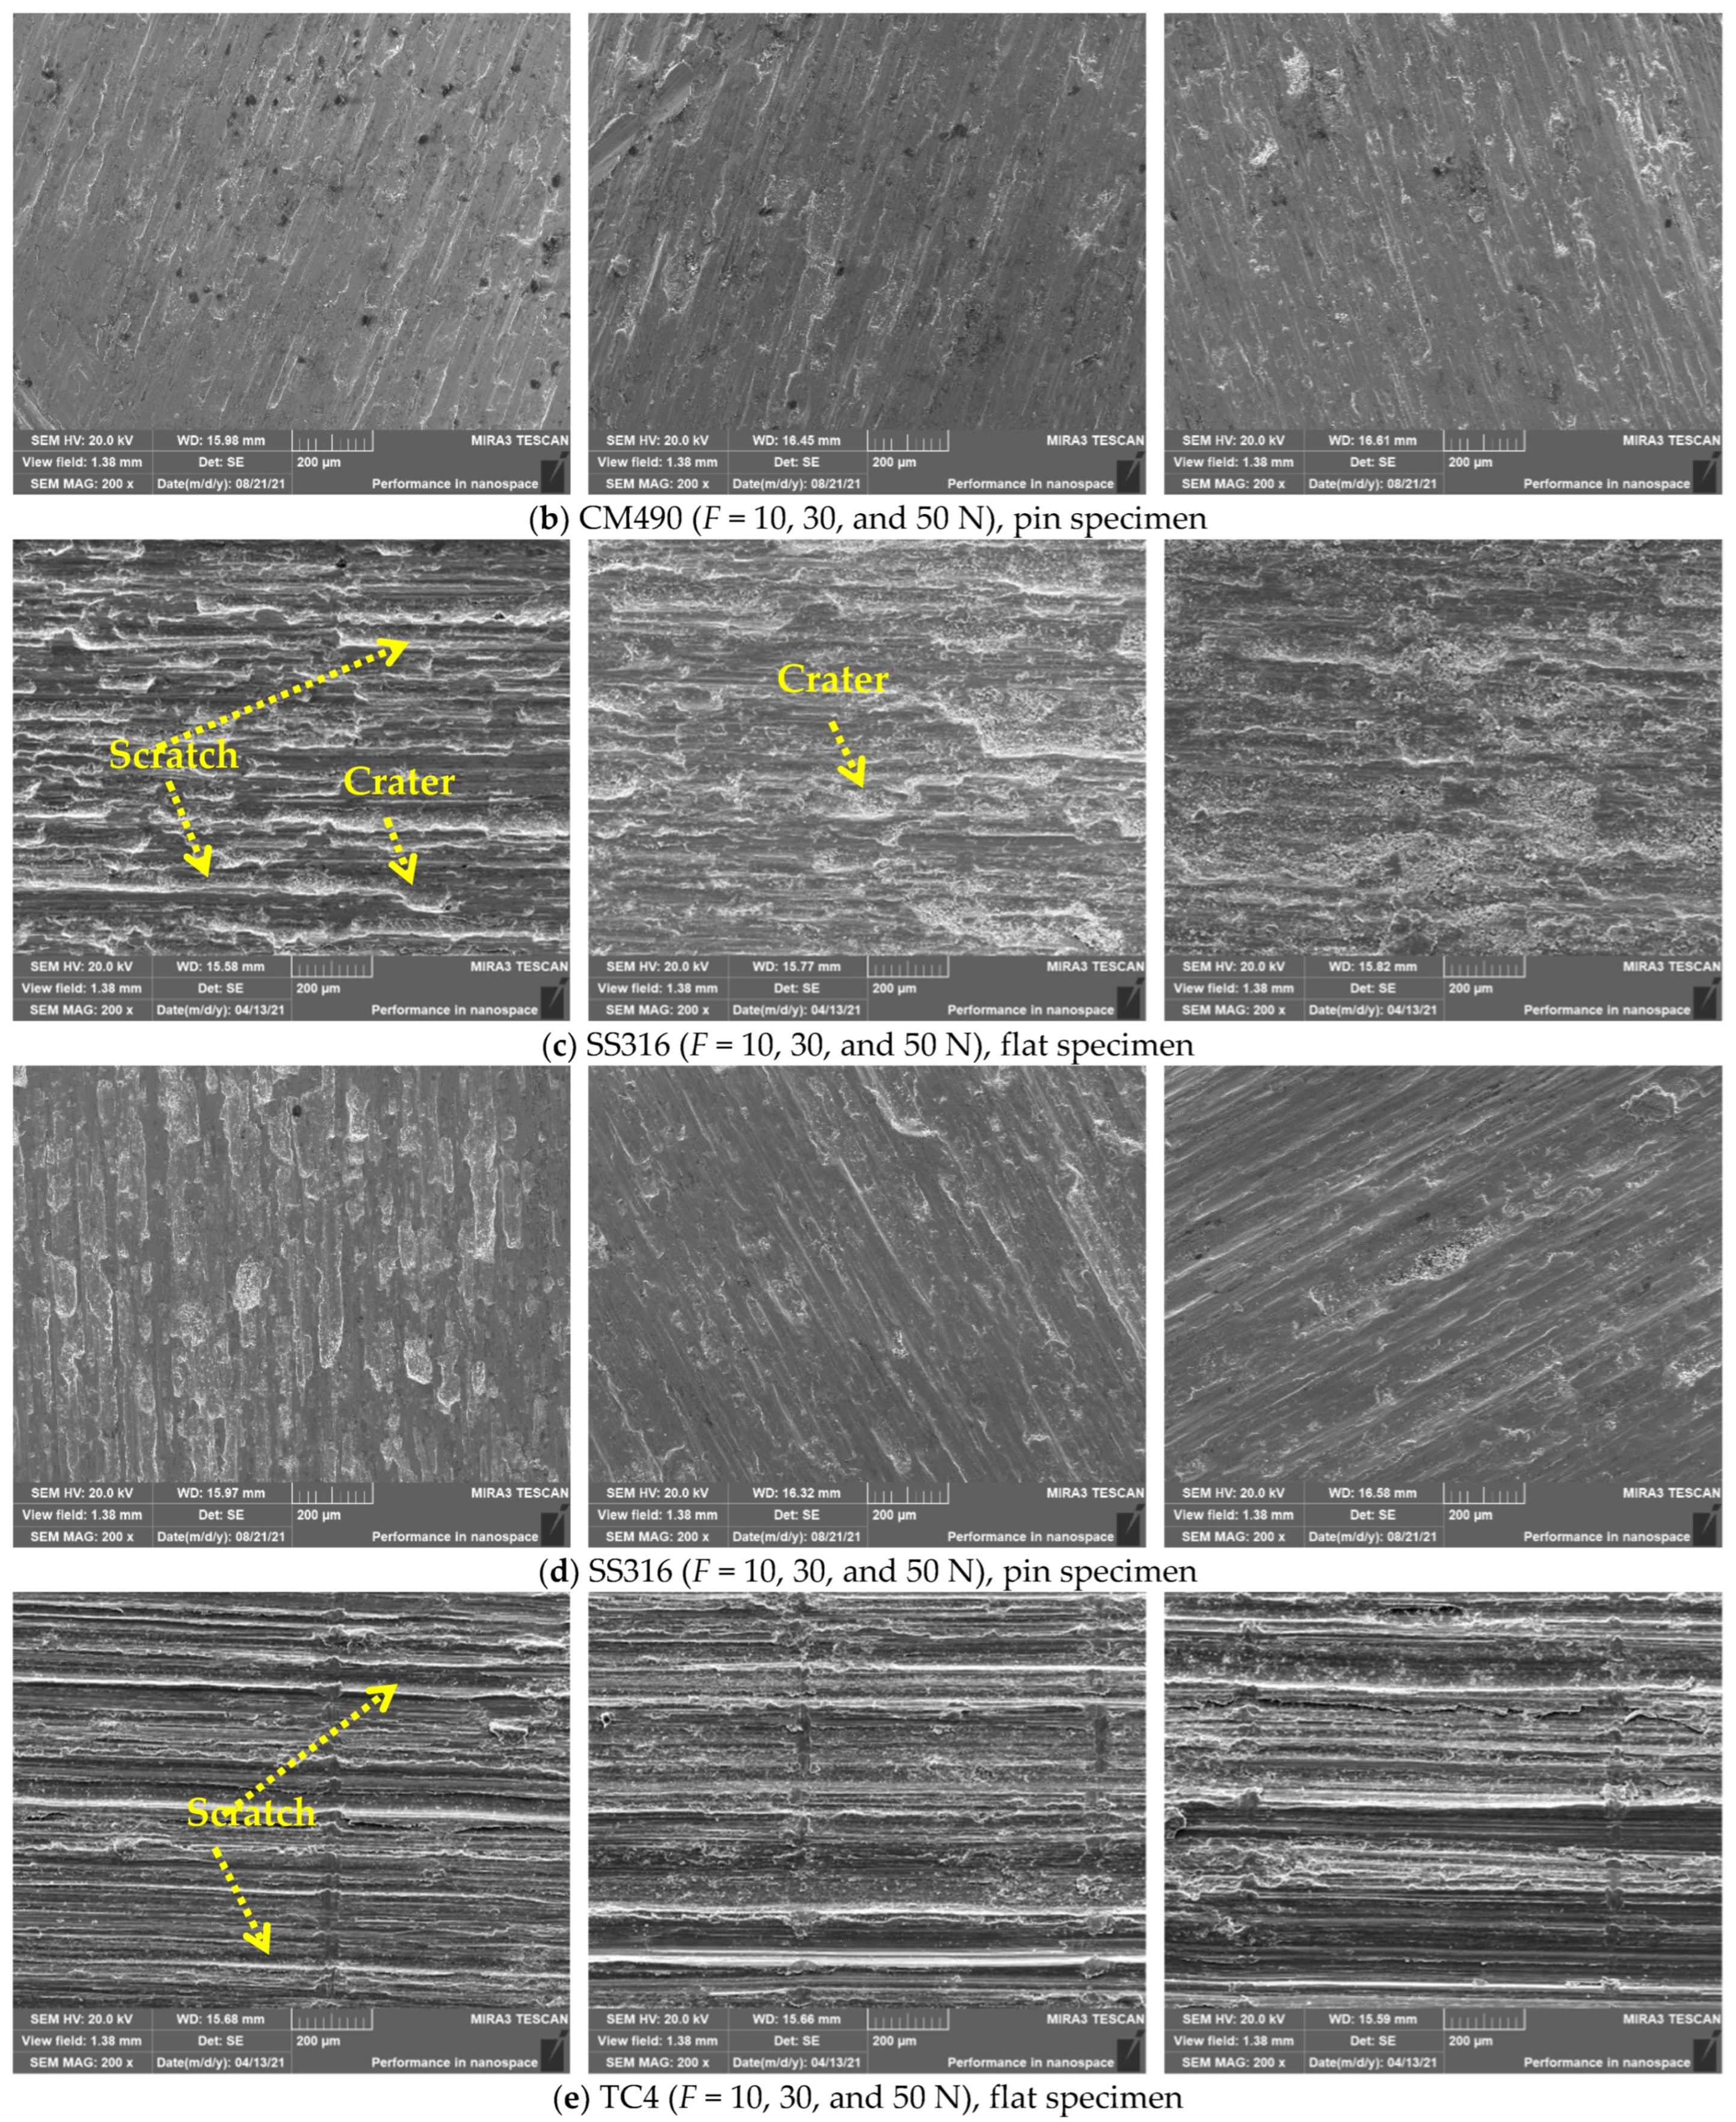
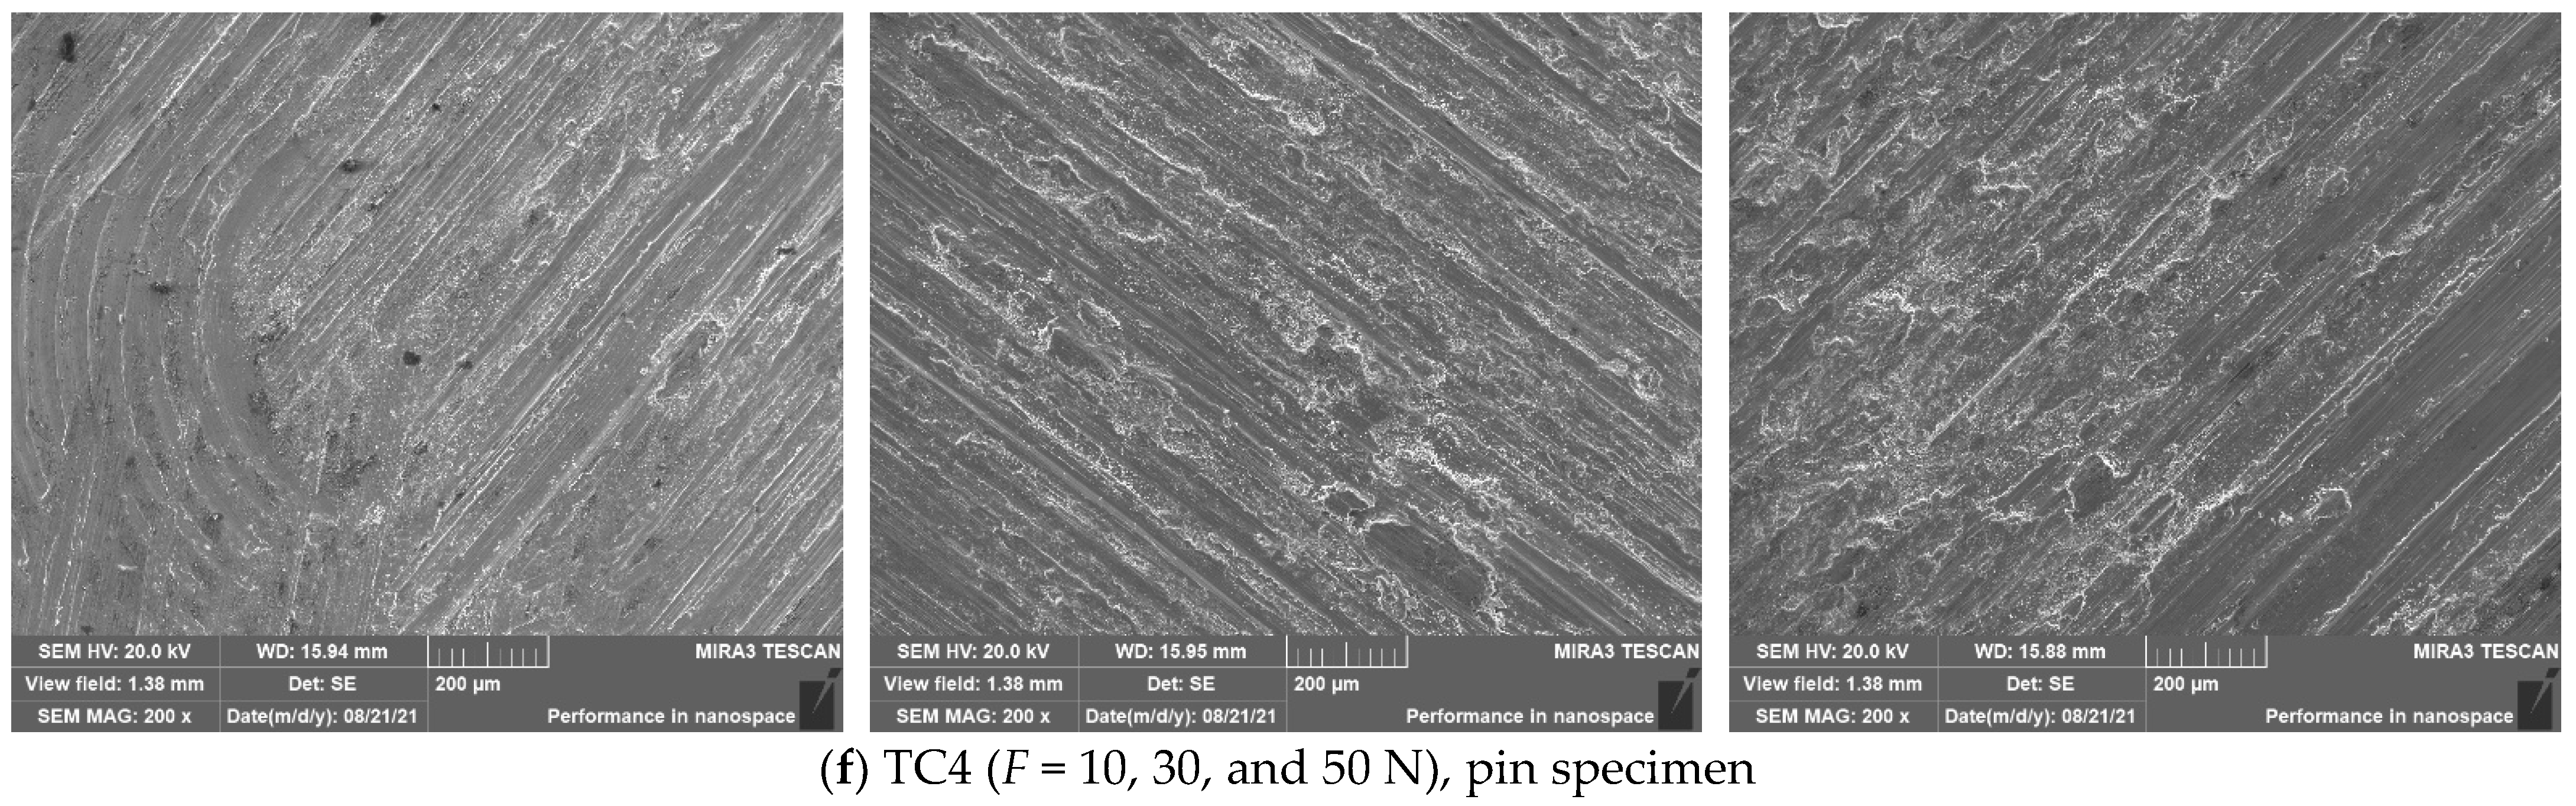
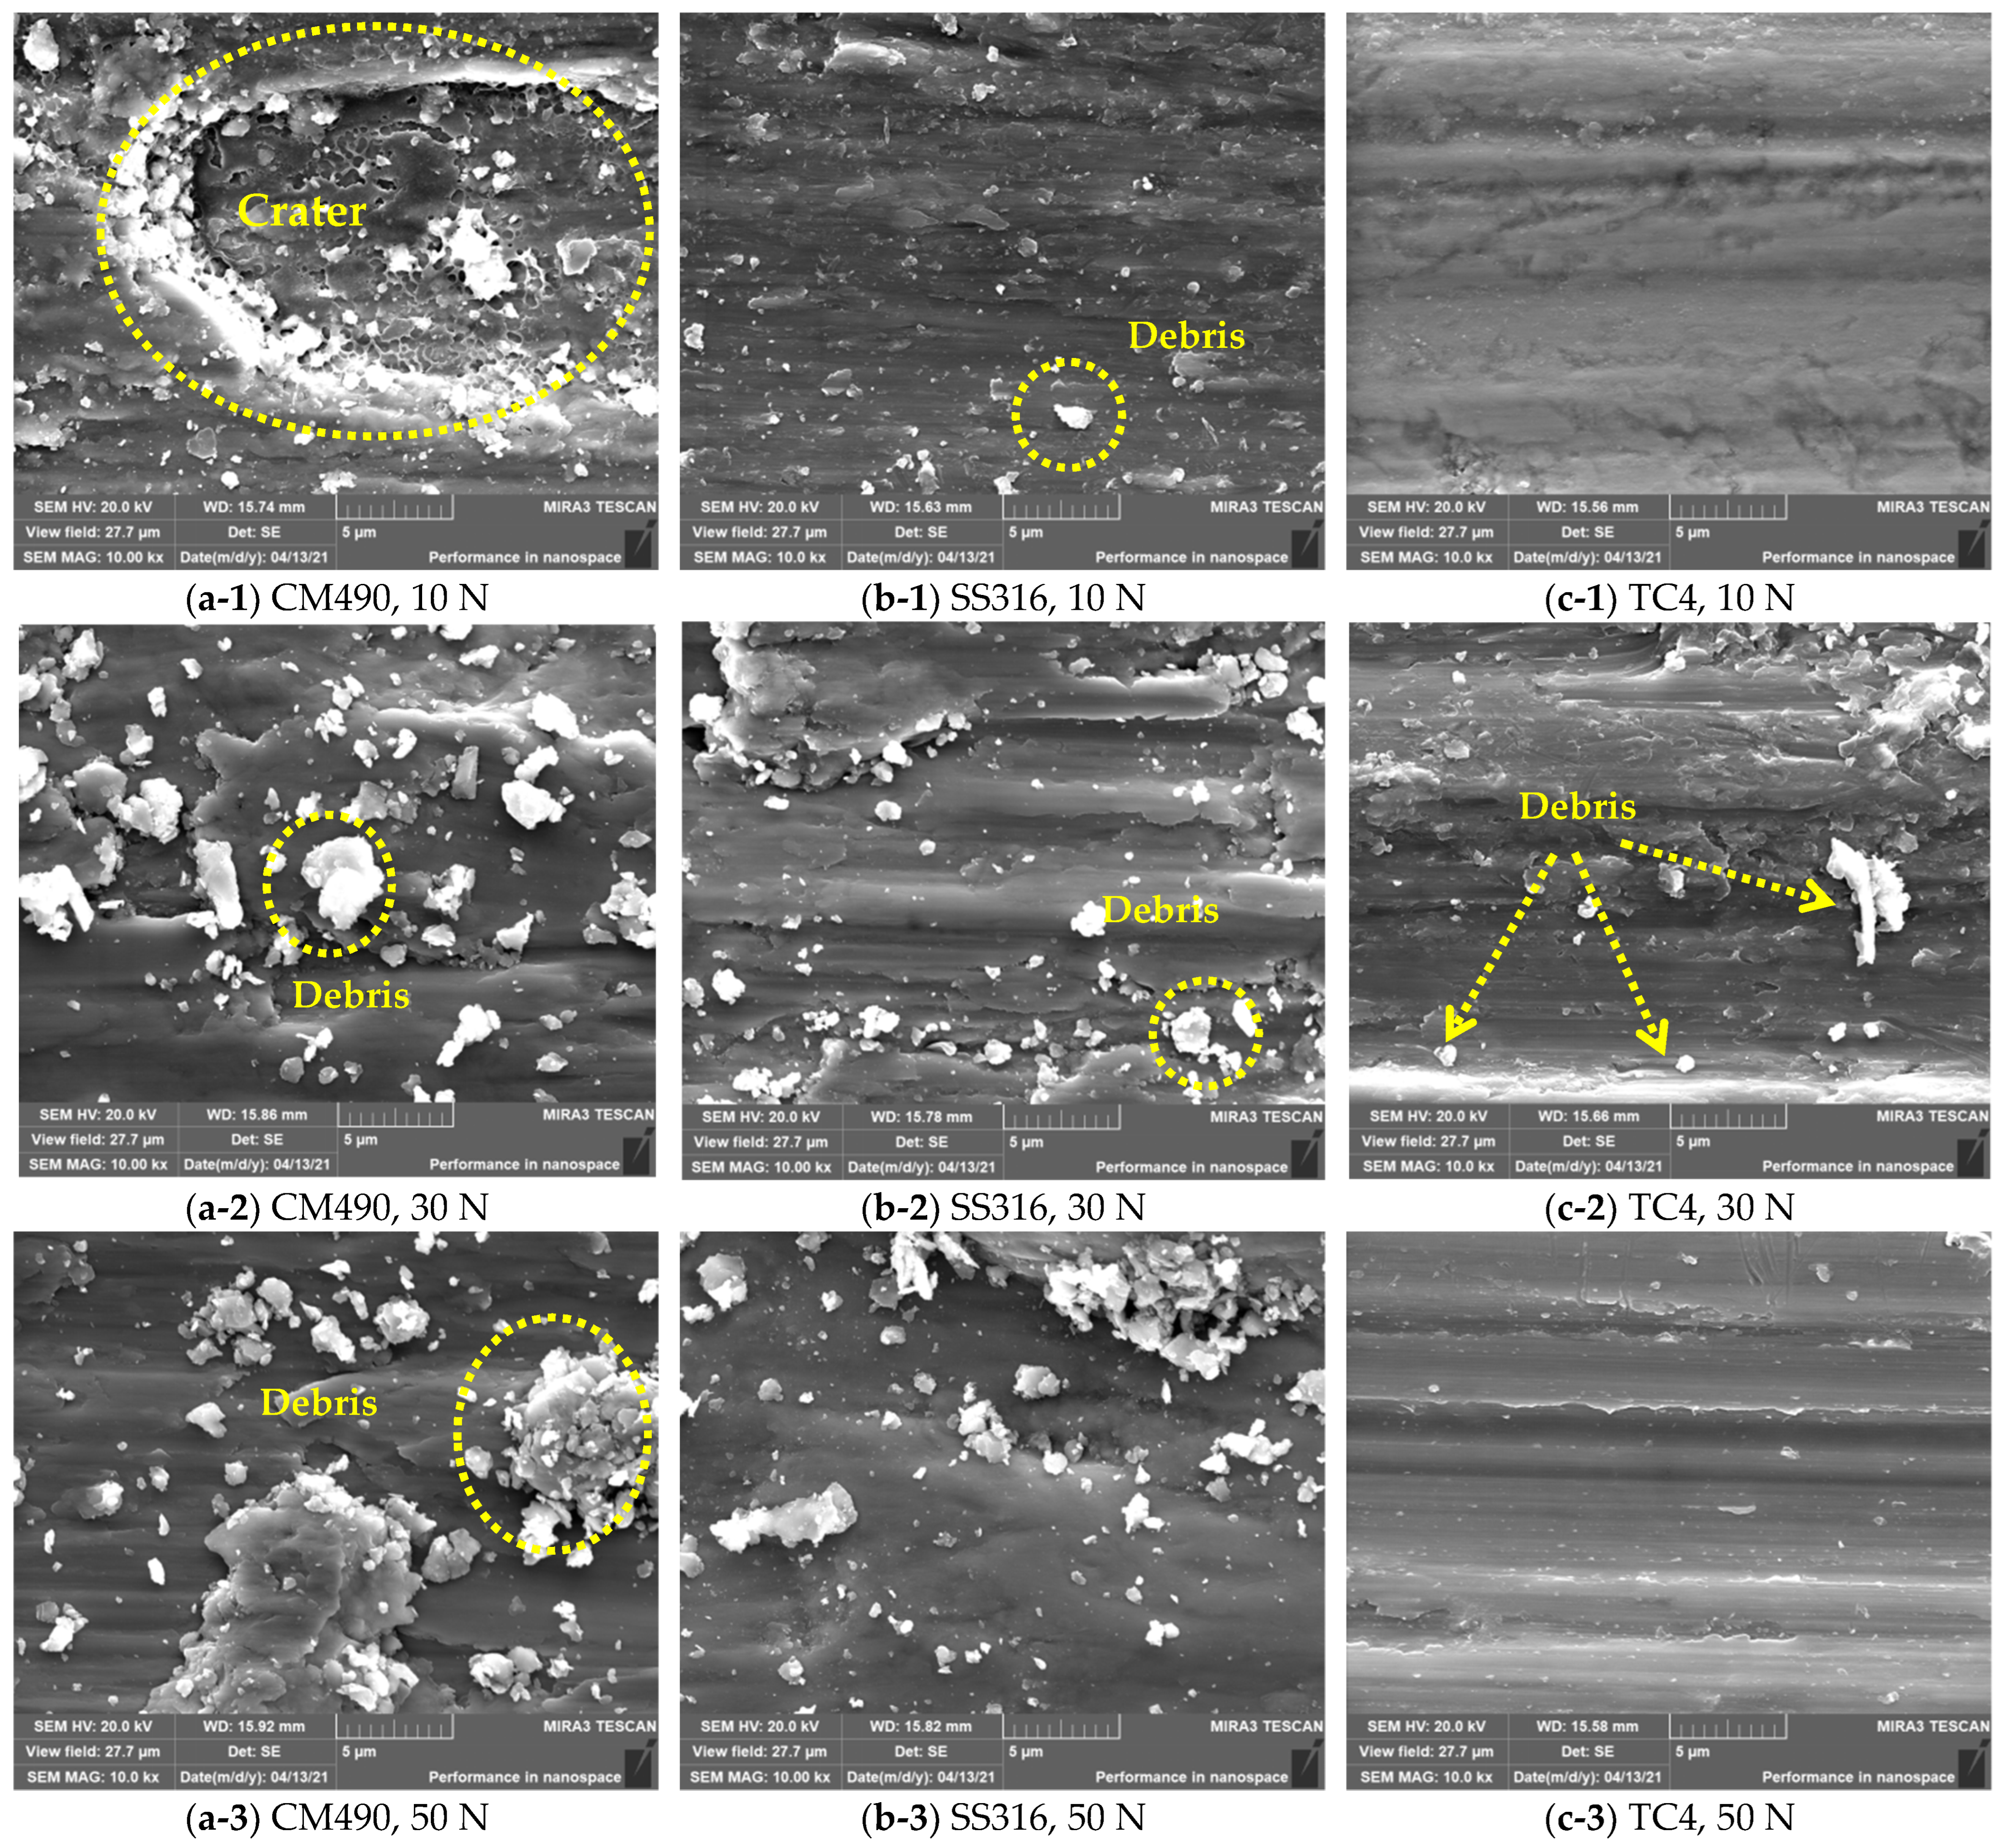
5.2. Wear Morphology

After the wear test, the tribosurfaces of the pin-flat specimens were characterized using an SEM (TESCAN-MRIA 3) (Figure 11). An overview of the macroscopic wear morphology and damage detection scheme (yellow dotted line, the corresponding wear depth is shown in Figure 3a is shown in Table 5. Clearly, the wear morphology of each friction pair is similar; the higher the normal force, the more severe the wear damage, and the wear damage of CM490 was found to be the most severe. According to the wear depth obtained by the profilometer shown in Figure 3, Equation (6), and the test parameters, the corresponding wear coefficient can be calculated (see Section 5.3). As shown in Figure 3, the wear depth is not uniform, especially in the width direction; thus, an average depth (havg) was used for the wear analysis. The detailed wear scar also indicated that due to the uneven contact surface, the longer the test time, the greater the error will be, which also makes the proposed wear coefficient measurement method more significant.
A more detailed examination of the tribosurfaces (Figure 11) indicated that individual particles (wear debris) traversed the wear surface in a mixed slide-roll manner, and clear scratches were observed. The wear morphology of CM490 and SS316 were similar, with large craters and deep-and-wide scratches, which are closely related to the debris size (Figure 12). The wear morphology of TC4 was very different, where few craters were found, and the scratch was relatively fine and uniform; moreover, the number of wear debris on the contact surface of TC4 was much less than those observed on CM490 and SS316 surfaces, which resulted in a more uniform wear process. A detailed examination of the wear surface indicated that the typical sizes of wear debris of CM490 and SS316 ranged from 0.5 to 5 μm, and there was much coarse debris; however, the debris size of TC4 was much smaller; the typical size was approximately 0.5 μm, and coarse debris was rarely observed (Figure 12).

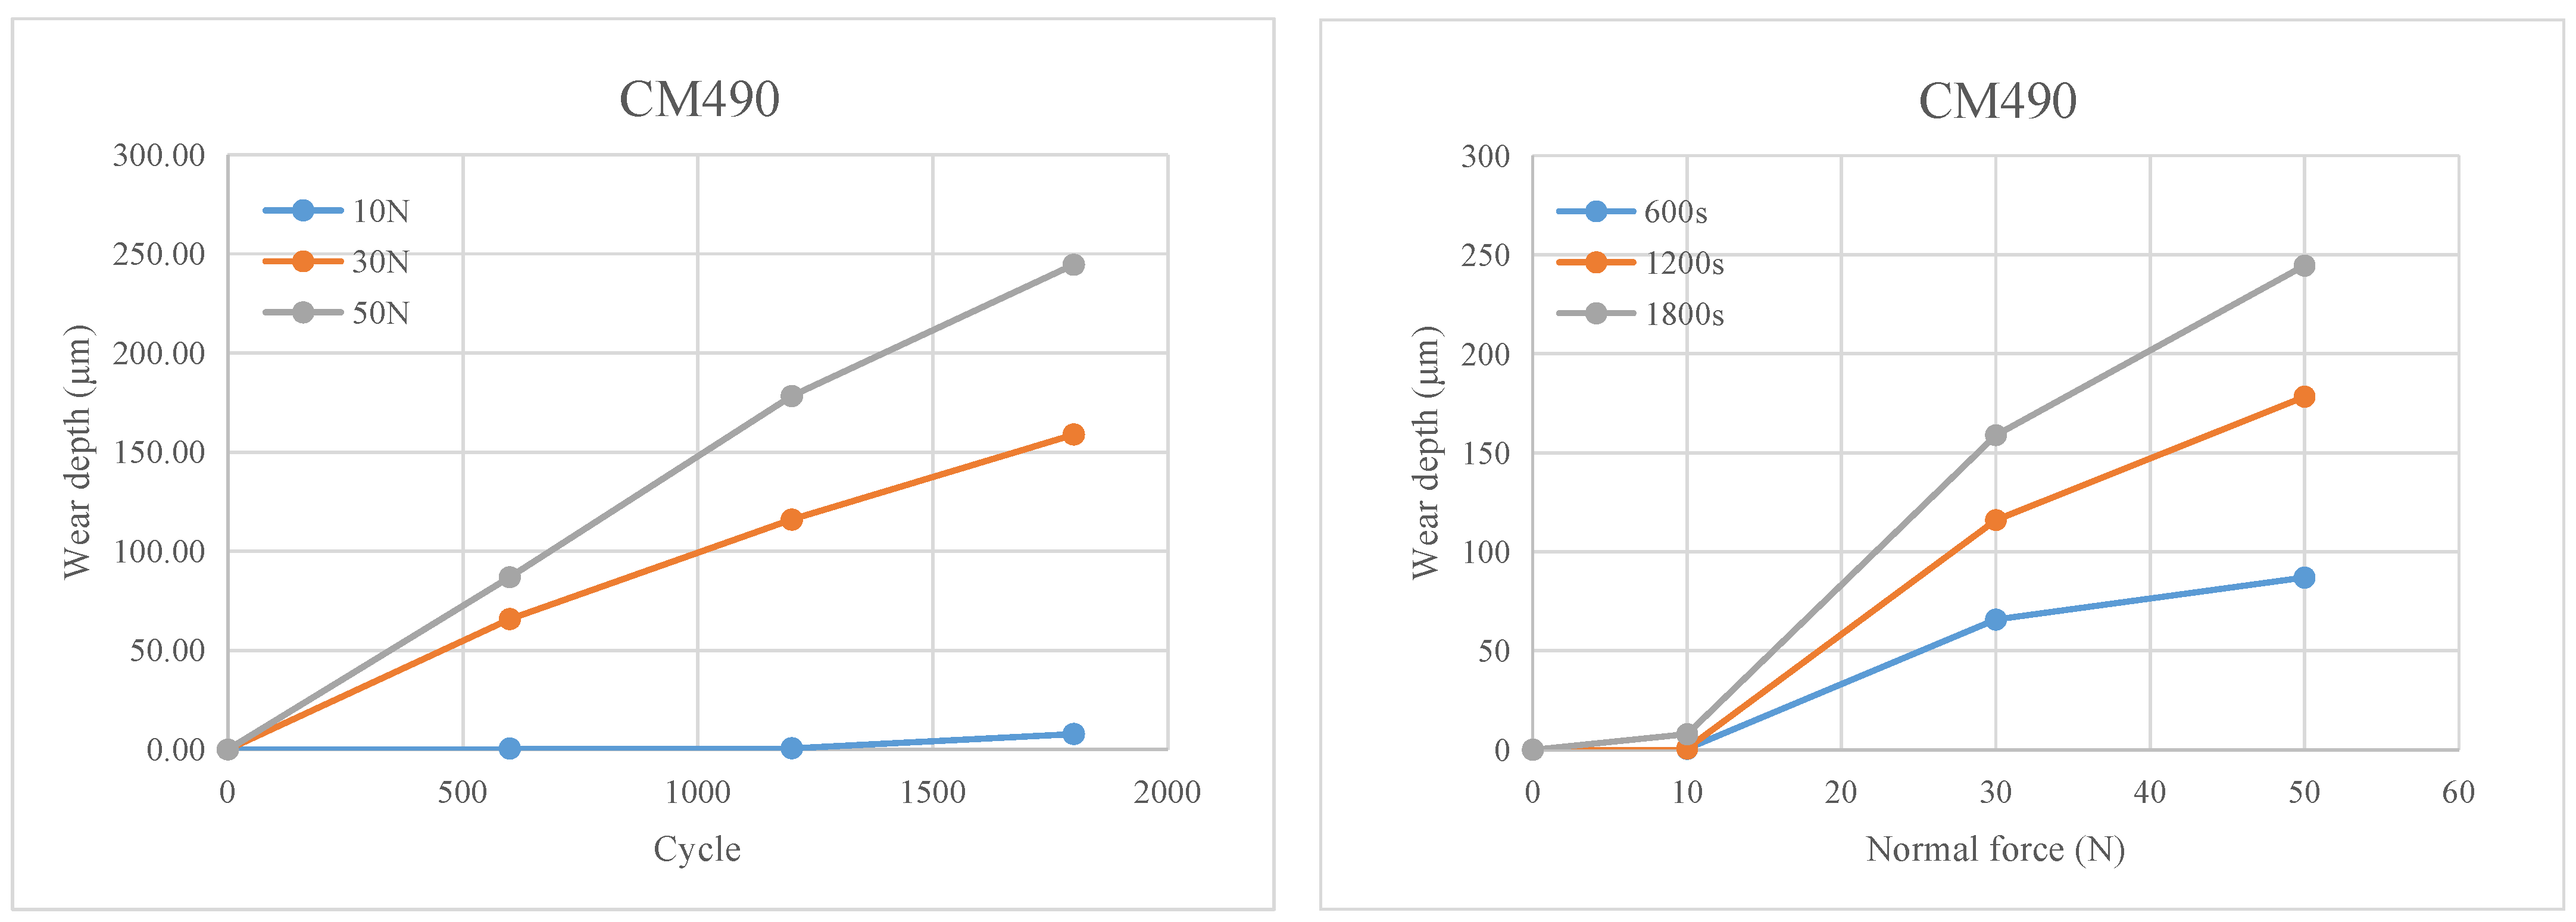
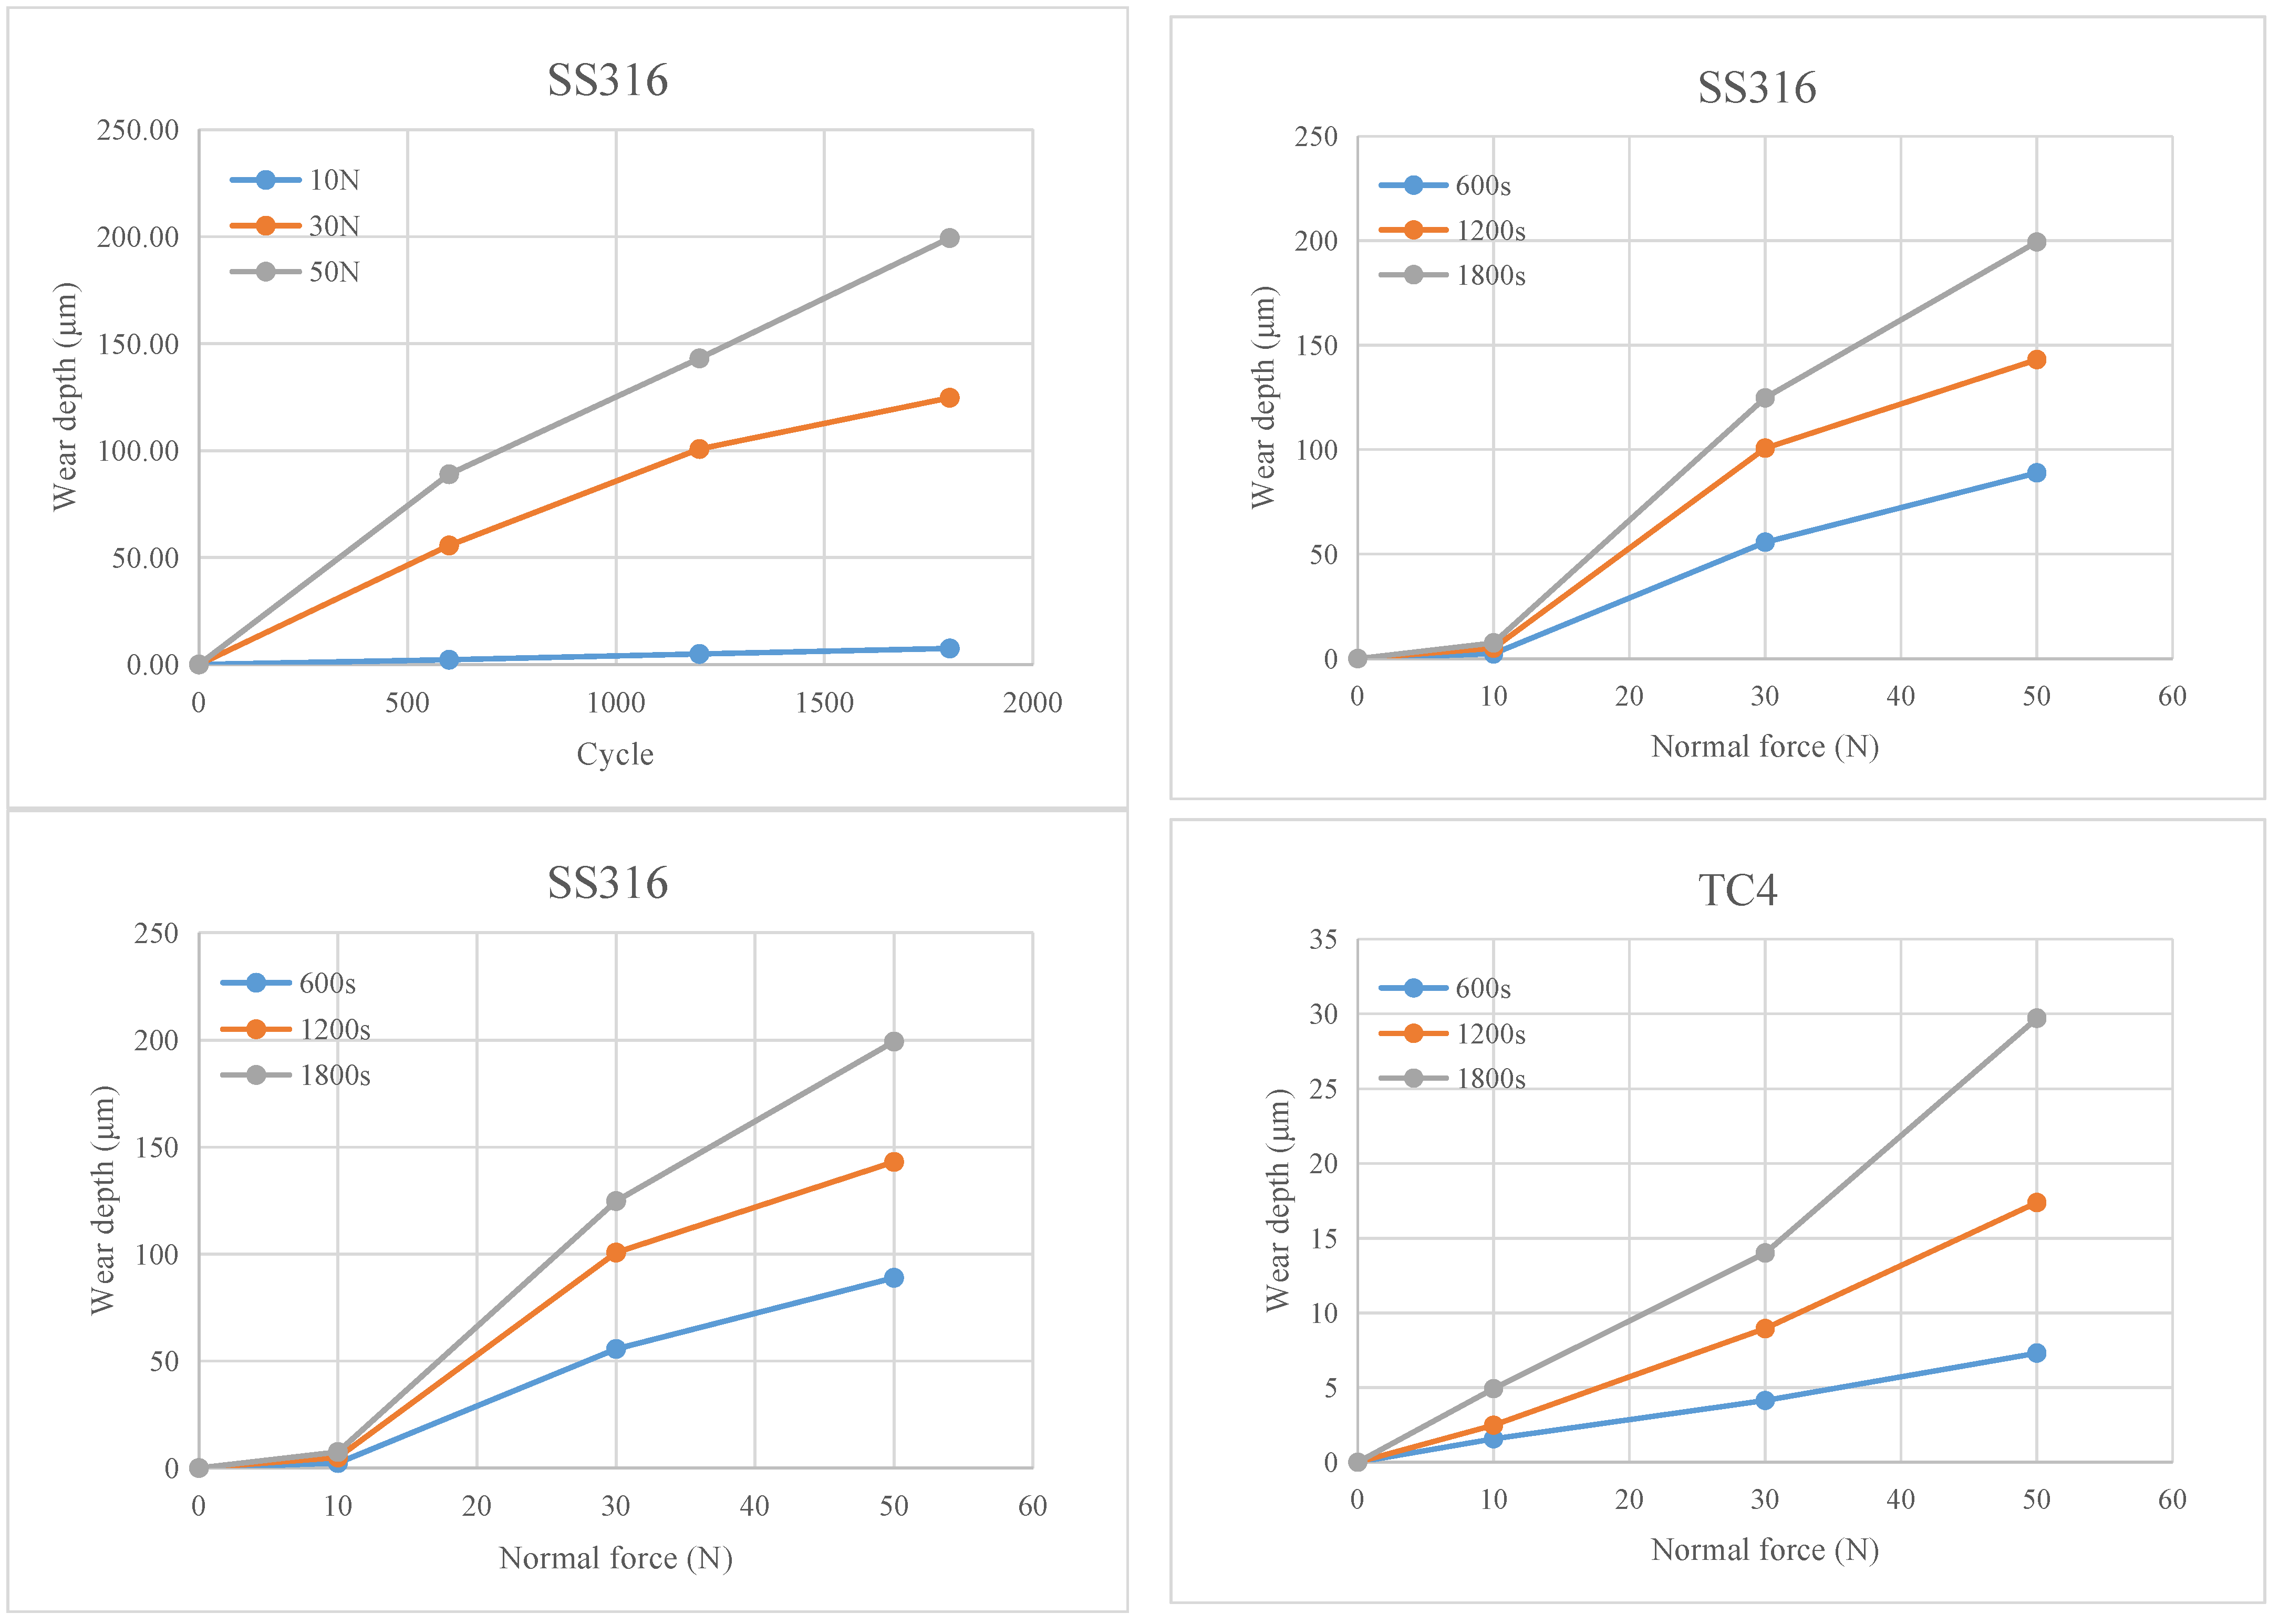
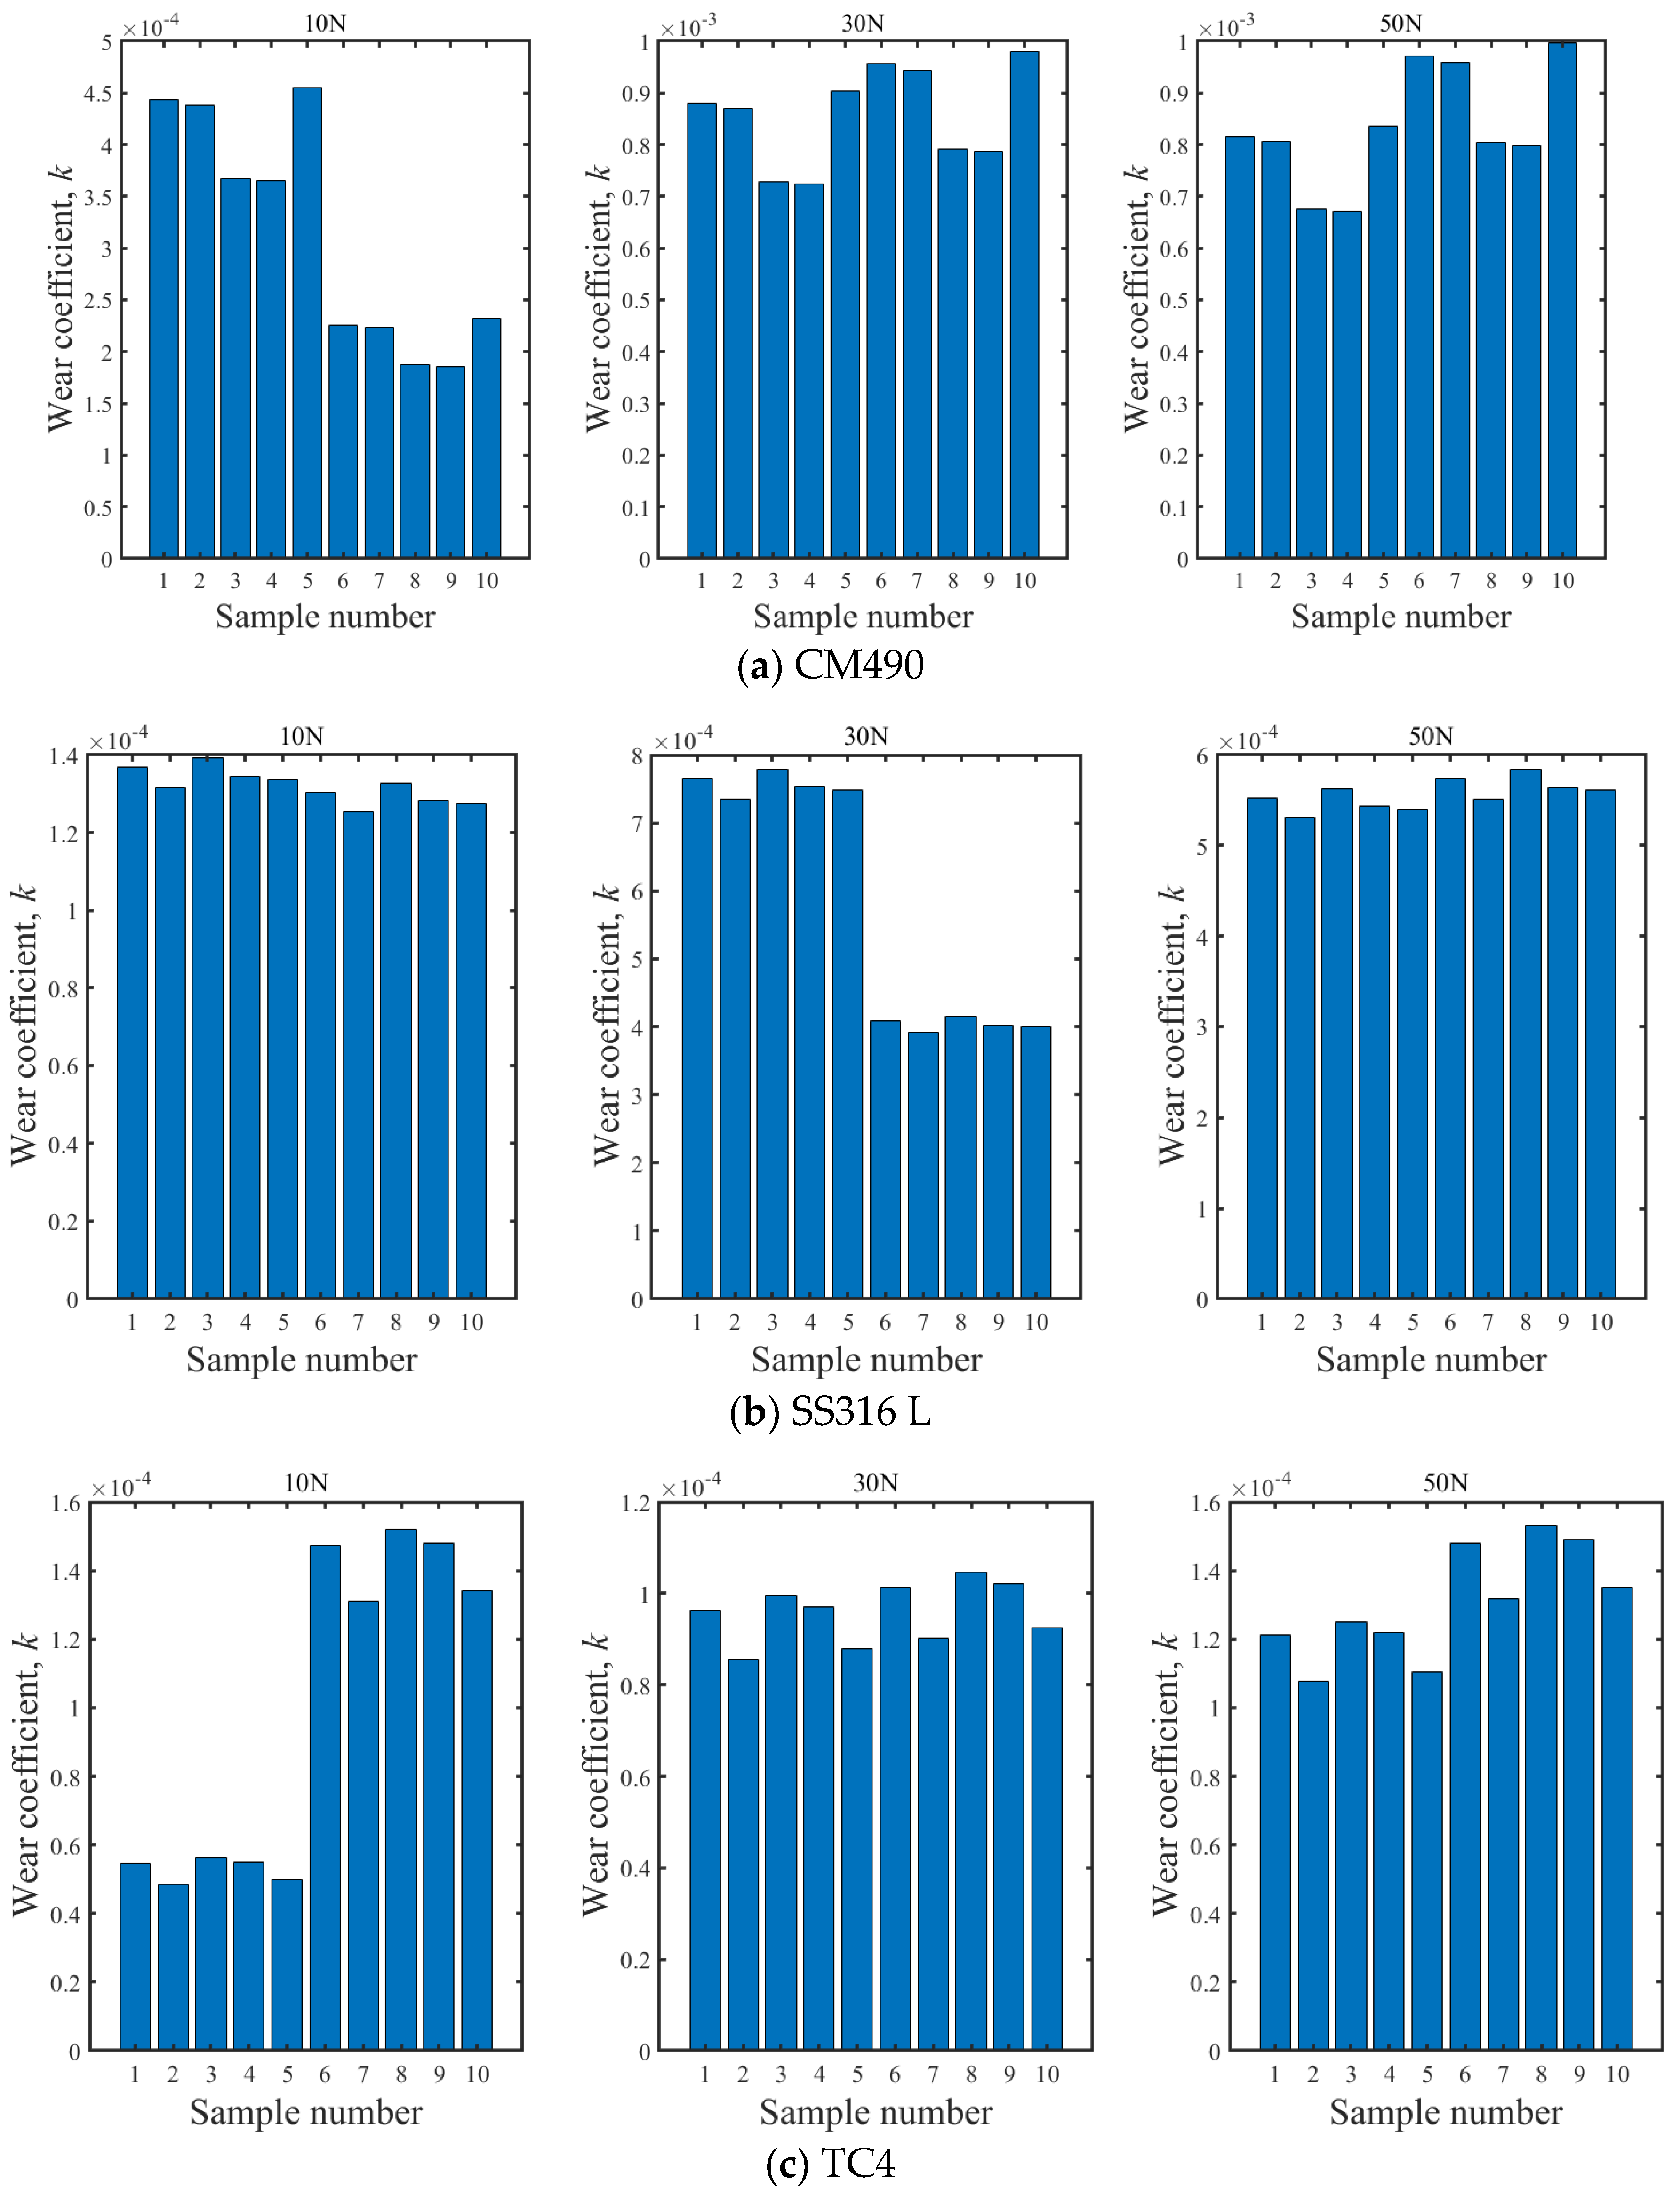
5.3. Wear Coefficient

In this section, the wear coefficients of the three types of alloys used in this study were obtained using the method proposed in Section 3. Figure 13 shows the relation between the wear depth and loading cycle as well as the normal force, and the slope of the curve indicates the wear coefficient. Three averaged wear depths were obtained, considering that the first stage comprises a running-in process (i.e., a phase in which stable wear has not been achieved), and the difference between the first measured depth (havg1) and second measured depth (havg2), as well as the second measured depth (havg2) and last measured depth (havg3) and the corresponding sliding distance (corresponding to 600 s), were used for calculating the wear coefficient, which is shown in Table 2. As Figure 13 shows, the wear depth increases almost linearly with the sliding distance, which confirms that an index of 1 for the sliding distance, s, in the Archard model is reasonable. According to the literature, the wear coefficient behaves randomly [37,38,39,40]; however, due to the limitation of the test data, no statistical analysis was conducted. In all cases, a nonlinear relation between the wear depth and applied force F was observed. As the applied load increased, the wear depth increased sharply. The trends of CM490 and SS316 were similar, where the wear rate decreased as the applied load increased. In contrast, the wear rate of titanium alloy increased with the applied load, and such discrepancy is attributed to the difference in the micro-wear mechanism, as discussed in Section 5.2.
For the results shown in this work, no clear hardness dependence can be observed. Many researchers indicated that the wear resistance is positively related to the material hardness; however, the wear resistance of CM490 was lower than that of SS316, even though its hardness was much higher. Moreover, TC4 was much more wear-resistant than CM490, even though their average hardness was almost the same. Thus, the micro-wear morphology and size of the wear debris are the main reasons leading to the discrepancy in wear resistance of different materials.
Based on the measured wear depth and the method mentioned in Section 3 (Equation (6), the wear coefficient can be obtained. In order to account for the variability of hardness and wear damage, the possible wear coefficiencies in each stage are shown in Figure 14 (which corresponds to the measured five hardness). Considering that the first stage comprises a running-in process, the corresponding test data are not used. The difference in the calculated wear coefficient may be up to one time in some cases; for example, F = 10 N for CM490, F = 30 N for SS316 L, and F = 10 N for TC4; such variability should be considered in wear prediction. An overview of the test results is shown in Table 6. For CM490 and SS316, the wear coefficient increased considerably as the applied force increased from 10 N to 30 N. However, it remained almost constant as the applied force was further increased. Such a trend is consistent with the variation trend of the friction coefficient. In contrast, for TC4, the wear coefficient increased nonlinearly with the applied force. The magnitude of the wear coefficient indicates that severe wear occurred under the loading conditions used in this study [5]. In an actual contact region between chain links, high contact stress may lead to material yield, and local plastic flow may occur [10]; in this case, the stress range is higher than that achieved in the test conditions used in this study, and the corresponding wear coefficient may be larger.
Figure 15 shows the relation between the calculated wear coefficient and contact stress to hardness ratio (σ/Hv) and contact stress to yield stress ratio (σ/σy), where σ = F/A is the nominal contact stress (A is the idealized cross-section area of the pin specimen) and σy is the yield strength. The test results indicated that the wear coefficient remains almost constant when the normalized stress reaches a critical value, and such a critical value is material-dependent. The critical values of CM490 and SS316 were approximately 2.77% and 3.16% of their hardness (corresponding to 3.74% and 3.24% of their yield strength), respectively. However, the observed critical contact stress of TC4 was much smaller, which is approximately 0.39% of its hardness (and 0.38% of its yield strength); such a low stress ratio is also attributable to the difference in the micro-wear mechanism. Even though a slight increase in the wear coefficient of TC4 was observed under the loading condition of 50 N, however, such an increase is not significant, and the discreteness of the data is small, which confirms the stable state of the wear coefficient.

6. Conclusions

This paper proposes a modified method that can predict the wear coefficient of reciprocating sliding wear of alloys. Based on this method, three types of chain materials were used for the wear test, and the following conclusions were drawn.
(1)
The proposed method is suitable for a quick determination of the wear coefficient of reciprocating sliding wear under low contact stress, which can save considerable test time.
(2)
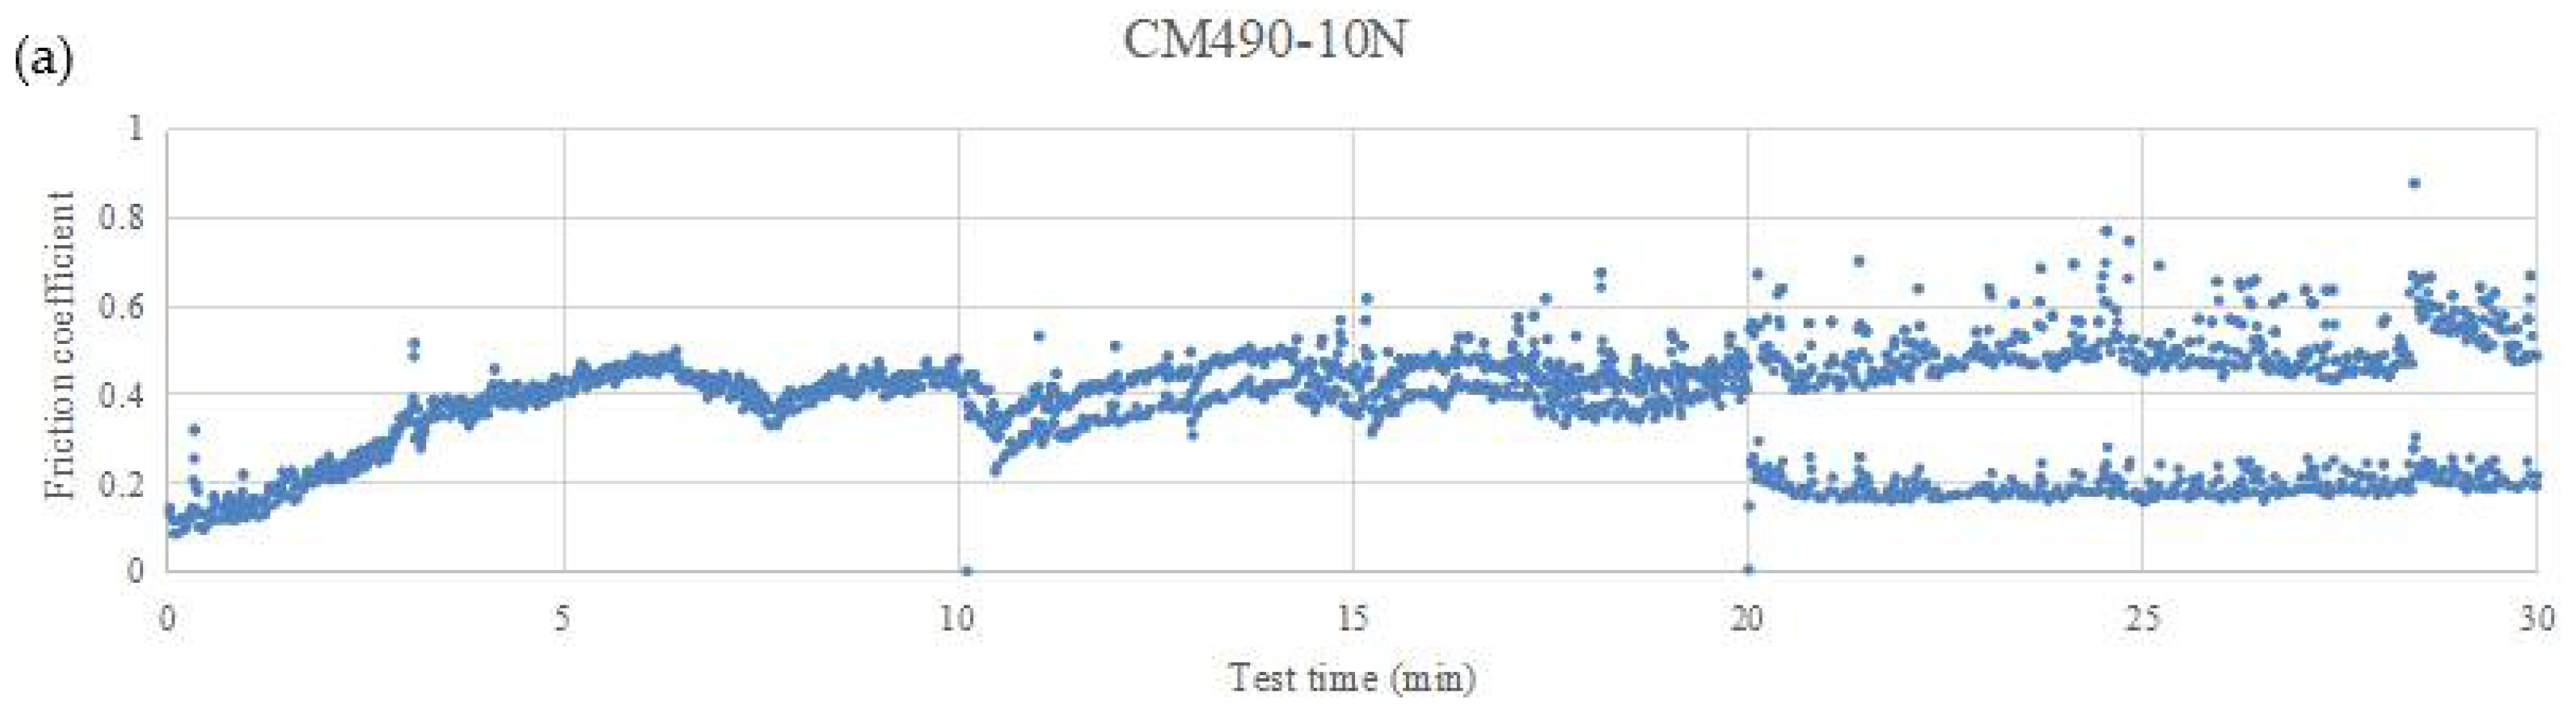
The time-variant CoF can be used as an indicator of the stable wear state. For CM490 and SS316, approximately 6 min are required for a stable contact state to be established after the test begins, whereas for TC4, a relatively stable state is reached immediately once the wear starts. The CoF changes alternately in the reciprocating wear process, which is due to the coupling effect between the wear debris and wear surface. Moreover, the statistical analysis indicated that the coefficient of friction follows bimodal distribution or multimodal distribution rather than a constant value.
(3)
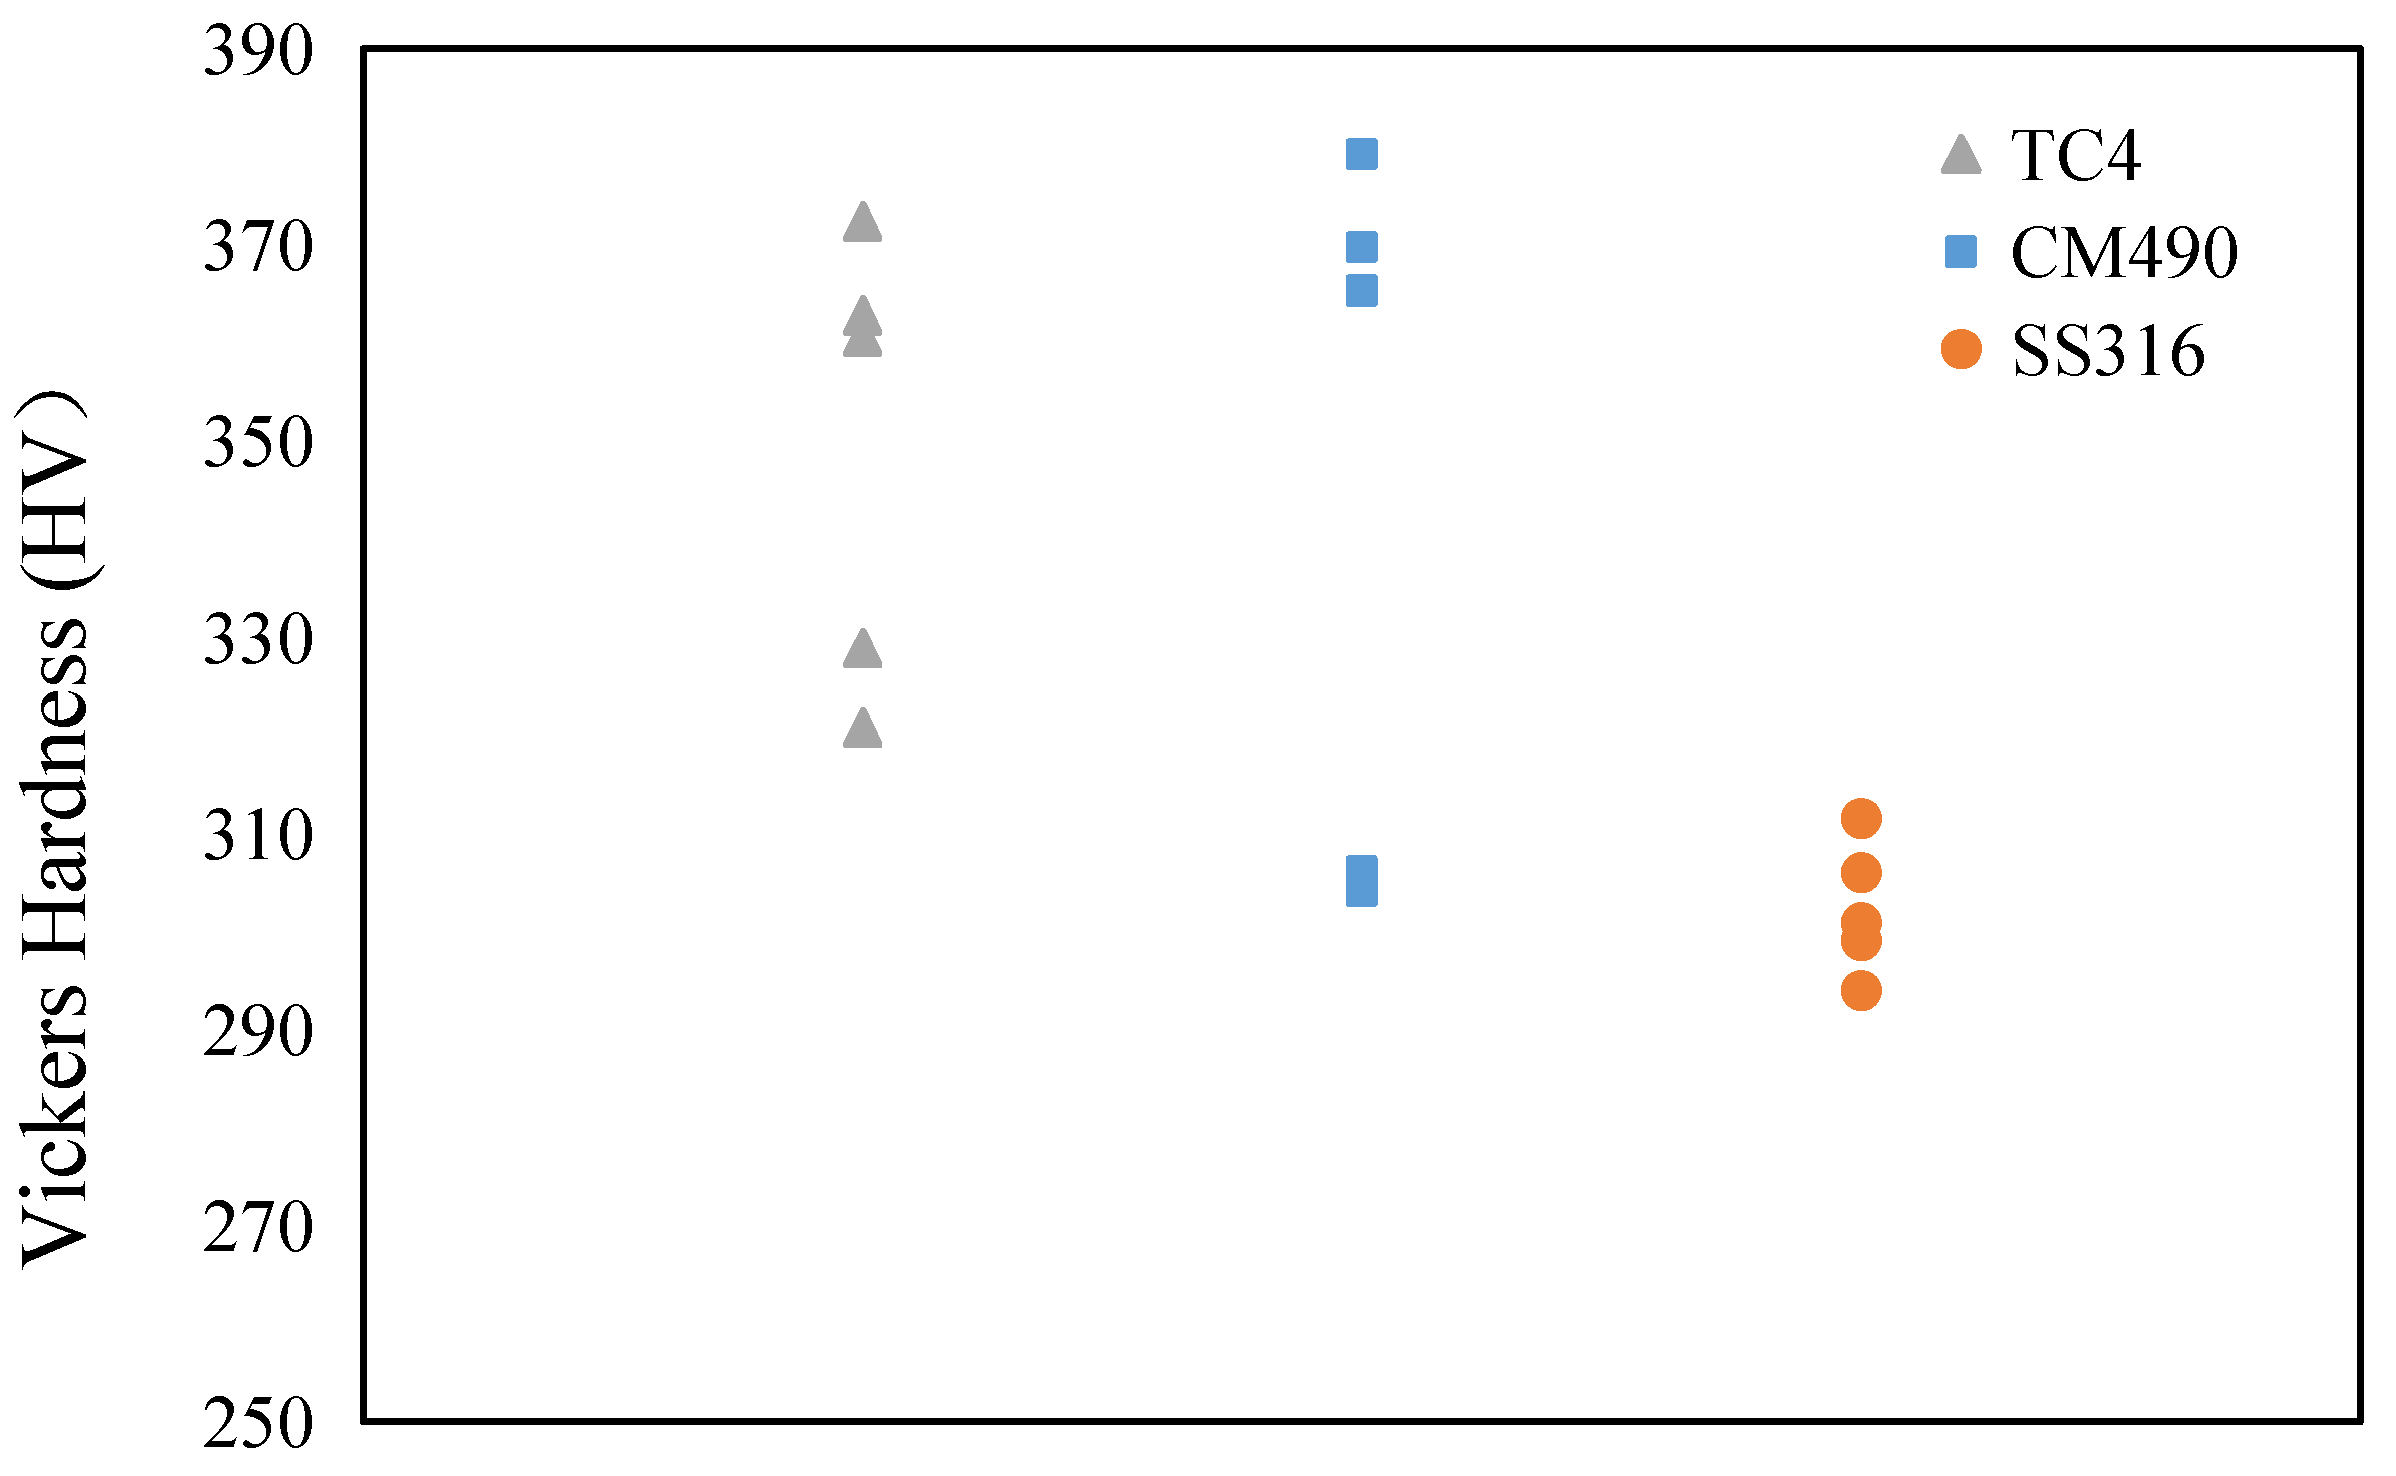
For the three materials tested in this study, TC4 is the most wear-resistant due to less-and-small wear debris and higher hardness, whereas CM490 exhibits the lowest wear resistance; the wear resistance of SS316 is basically the same as that of CM490 because of a similar wear mechanism, and the relative lower wear resistant is mainly caused by the somewhat lower hardness.
(4)
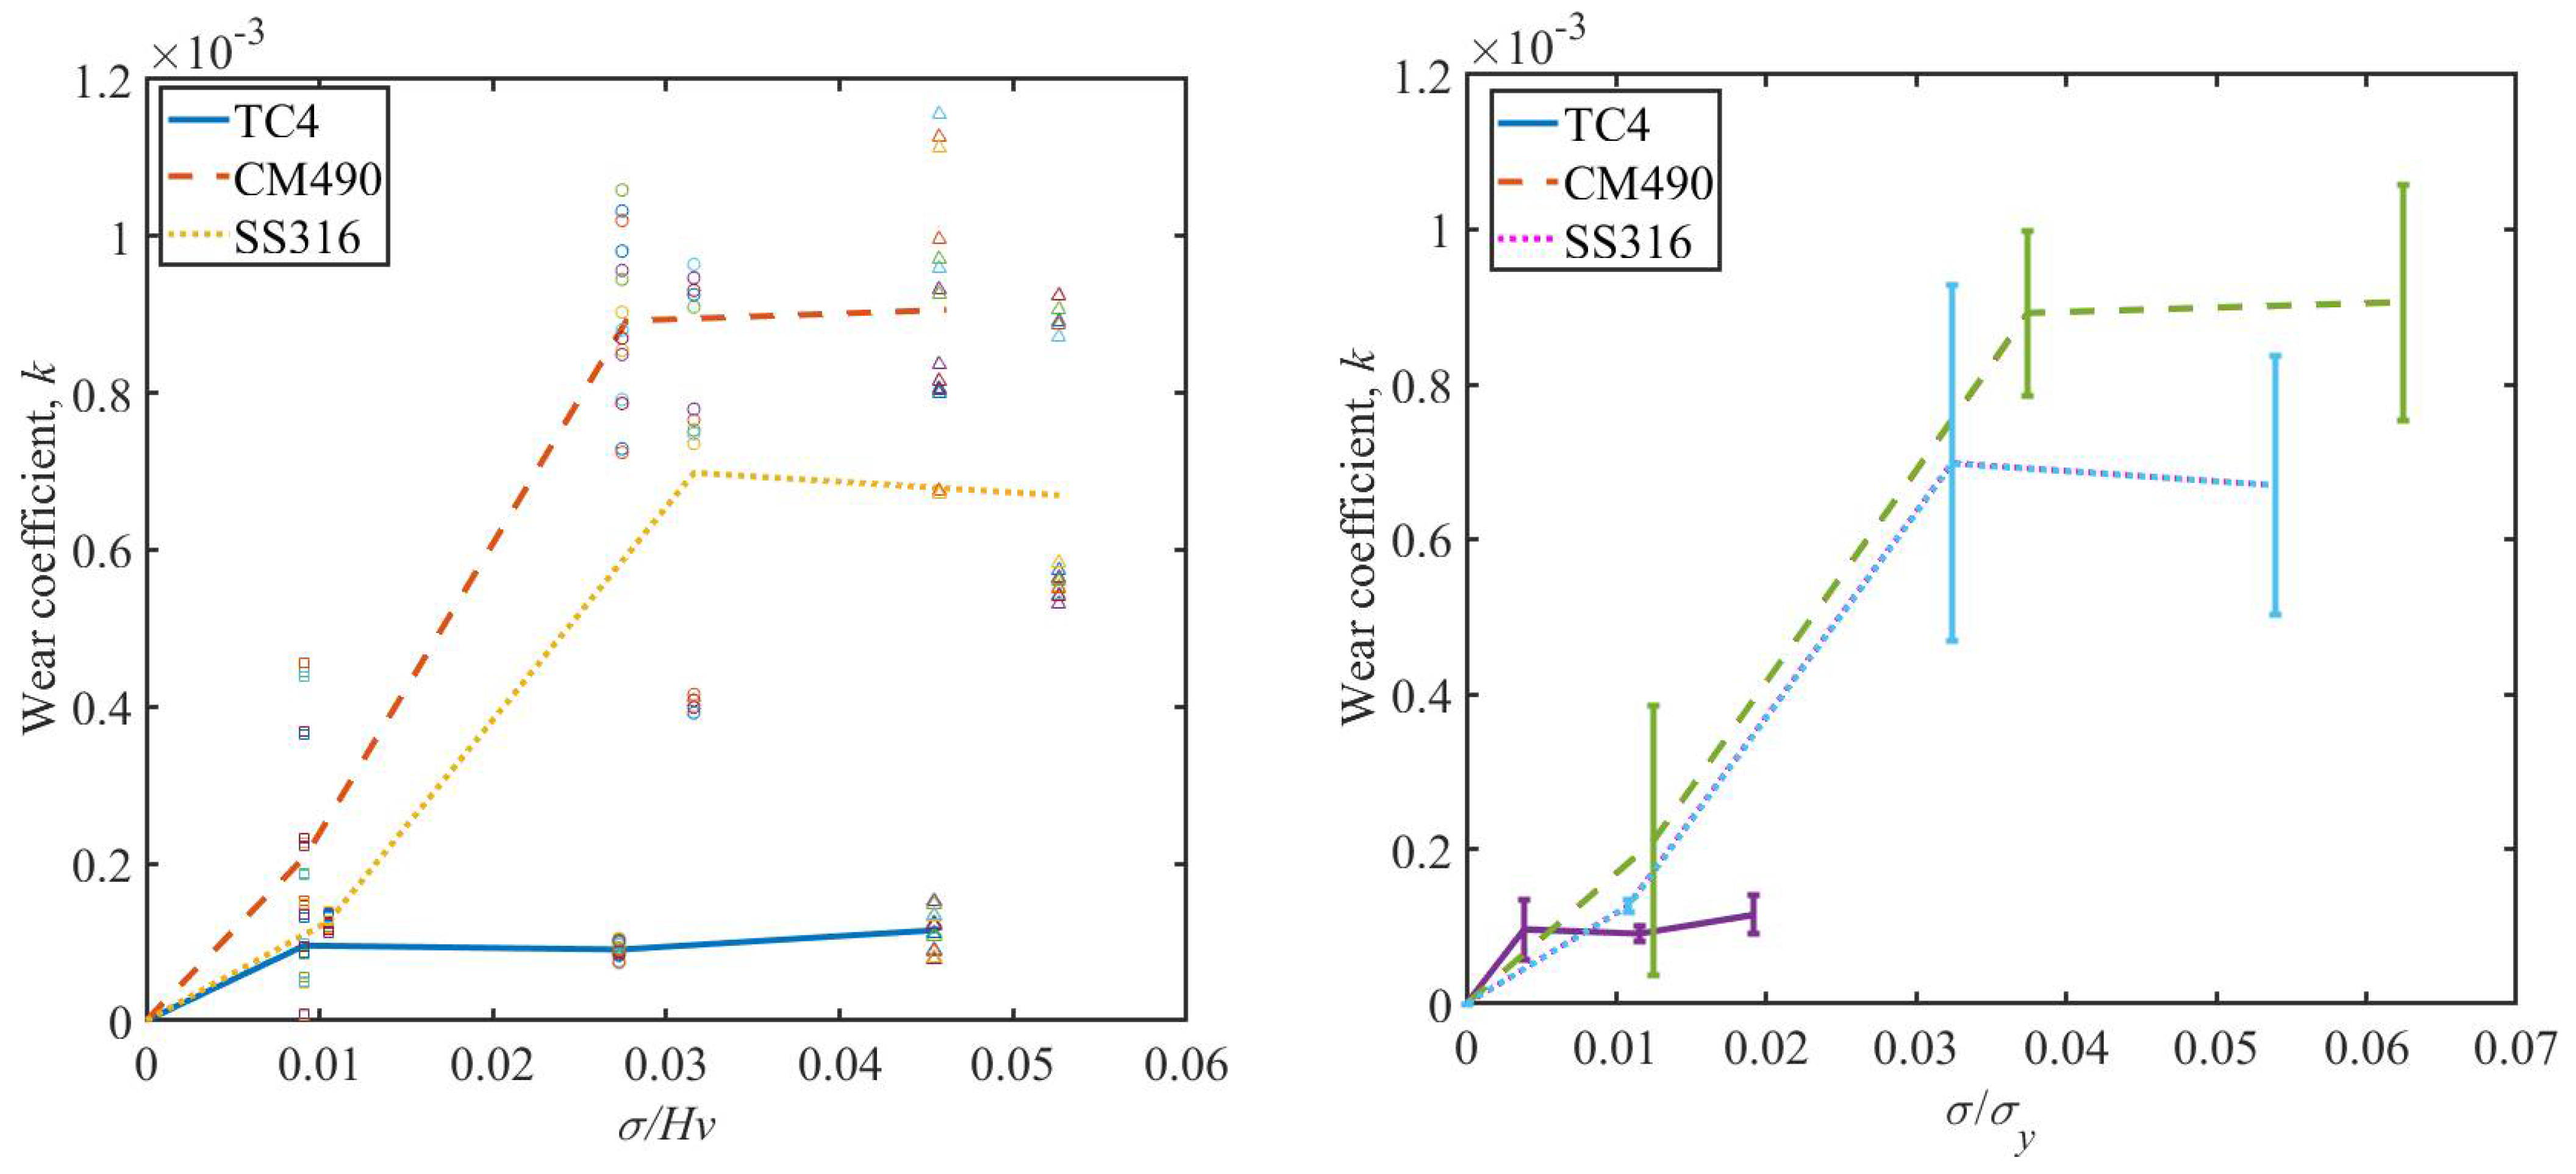
The critical values of contact stress of CM490, SS316, and TC4 are approximately 2.77%, 3.16%, and 0.39% of their hardness (corresponding to 3.74% and 3.24% of their yield strength), respectively; for contact stress beyond these points, the wear coefficient is contact stress-independent. Such a conclusion is suitable for the loading condition used in this study; however, extensive extrapolation should be used with caution since the wear tendency is not clear under ultra-high contact pressure.

Author Contributions

Conceptualization, methodology, investigation, resources, funding acquisition, T.L., J.Y. and H.W.; supervision, J.Y.; writing—original draft preparation, T.L. and H.W.; software, validation, writing—review and editing, Y.Y., H.L. and B.Z. All authors have read and agreed to the published version of the manuscript.

Funding

This research was funded by the Special Fund for Marine Economic Development (Six Major Marine Industries) of Guangdong Province (GDNRC[2020]025), the President’s Foundation of Xiamen University (20720210068), the National Natural Science Foundation of China (Grant No. U2005216, 51879189), the Natural Science Foundation of Fujian Province (2021J05004, 2020J01010).

Conflicts of Interest

The authors declare no conflict of interest.

References

  1. Yu, J.; Wang, H.; Yu, Y.; Luo, Z.; Liu, W.; Wang, C. Corrosion behavior of X65 pipeline steel: Comparison of wet–dry cycle and full immersion. Corros. Sci. 2018, 133, 276–287. [Google Scholar] [CrossRef]
  2. Wang, H.; Yu, Y.; Yu, J.; Duan, J.; Zhang, Y.; Li, Z.; Wang, C. Effect of 3D random pitting defects on the collapse pressure of pipe-Part I: Experiment. Thin-Walled Struct. 2018, 127, 512–526. [Google Scholar] [CrossRef]
  3. Pandim, T.; Doca, T.; Figueiredo, A.; Pires, F.A. Torsional fretting wear experimental analysis of a R3 offshore steel against a PC/ABS blend. Tribol. Int. 2020, 143, 106090. [Google Scholar] [CrossRef]
  4. Jayasinghe, K.; Potts, A.; Kilner, A.; Melchers, R. Mooring chain wear experiments and findings. Proc. Annu. Offshore Technol. Conf. 2018, 1, 210–228. [Google Scholar]
  5. Liu, J. Research on Approach for Corrosion and Wear Cumulative Damage Assessment of Chain Links. Master’s Thesis, Dalian University of Technology, Dalian, China, 2013. [Google Scholar]
  6. De Pauw, J.; De Baets, P.; Delgado, Y.P.; Sukumaran, J.; Ost, W. A full scale test rig for assessment of abrasive wear of shackle chains. Wear 2013, 302, 1017–1025. [Google Scholar] [CrossRef]
  7. Van Steenkiste, D.; Plasschaert, S.; De Baets, P.; De Pauw, J.; Perez Delgado, Y.; Sukumaran, J. Abrasive wear of link chains. Sustain. Constr. Des. 2011, 2, 388–396. [Google Scholar] [CrossRef]
  8. Fouvry, S.; Merhej, R. Introduction of a power law formulation to quantify the contact size effects on friction and wear responses of dry oscillating sliding contacts: Application to a chromium steel interface. Wear 2013, 301, 34–46. [Google Scholar] [CrossRef]
  9. Ojala, N.; Valtonen, K.; Heino, V.; Kallio, M.; Aaltonen, J.; Siitonen, P.; Kuokkala, V.-T. Effects of composition and microstructure on the abrasive wear performance of quenched wear resistant steels. Wear 2014, 317, 225–232. [Google Scholar] [CrossRef]
  10. Yaghin, A.L.; Melchers, R.E. Long-term inter-link wear of model mooring chains. Mar. Struct. 2015, 44, 61–84. [Google Scholar] [CrossRef]
  11. Velkavrh, I.; Lüchinger, M.; Kern, K.; Klien, S.; Ausserer, F.; Voyer, J.; Diem, A.; Schreiner, M.; Tillmann, W. Using a standard pin-on-disc tribometer to analyse friction in a metal forming process. Tribol. Int. 2017, 114, 418–428. [Google Scholar] [CrossRef]
  12. ASTM G99-2005; Standard Test Method for Wear Testing with a Pin-on-Disk Apparatus. ASTM International: West Conshohocken, PA, USA, 2016.
  13. Lopes Pacheco PM, C.; Kenedi, P.P.; Ferreria Jorge, J.C. Elastoplastic analysis of the residual stress in chain links. In Proceedings of the 21st International Conference on Offshore Mechanics and Arctic Engineering, Oslo, Norway, 23–28 June 2002. [Google Scholar]
  14. Qiao, D.; Kang, Z.; Yan, J.; Li, Y.; Zhou, D.; Ou, J. Analysis of combined wear and corrosion effects on mooring chain subjected to out-of-plane bending load. J. Harbin Eng. Univ. 2019, 40, 1194–1200. [Google Scholar] [CrossRef]
  15. Takeuchi, T.; Utsunomiya, T.; Gotoh, K.; Sato, I. Development of interlink wear estimation method for mooring chain of floating structures: Validation and new approach using three-dimensional contact response. Mar. Struct. 2021, 77, 102927. [Google Scholar] [CrossRef]
  16. De Pauw, J.; Sukumaran, J.; Delgado, Y.P.; Rodriguez, V.; De Baets, P. Effect of hardness in shackle chain wear under harsh environmentally conditions. Wear 2013, 306, 131–137. [Google Scholar] [CrossRef]
  17. Su, J.; Liu, G.; Sun, J.J. Research on tests and numerical analysis of corrosion and wear damage of mooring chain steel 22MnCrNiMo. Chin. J. Comput. Mech. 2015, 32, 113–117. [Google Scholar] [CrossRef]
  18. Wang, H.; Liu, T.; Zhang, Y.; Sun, Z.; Yu, Y. A fully coupled tribocorrosion simulation method for anchor chain considering mechano-electrochemical interaction. Appl. Ocean. Res. 2022; (under revision). [Google Scholar]
  19. Archard, J.F. Contact and Rubbing of Flat Surfaces. J. Appl. Phys. 1953, 24, 981–988. [Google Scholar] [CrossRef]
  20. Liu, R.; Li, D. Modification of Archard’s equation by taking account of elastic/pseudoelastic properties of materials. Wear 2001, 251, 956–964. [Google Scholar] [CrossRef]
  21. Terva, J.; Teeri, T.; Kuokkala, V.-T.; Siitonen, P.; Liimatainen, J. Abrasive wear of steel against gravel with different rock-steel combinations. Wear 2009, 267, 1821–1831. [Google Scholar] [CrossRef]
  22. Archard, J.F.; Hirst, W. The wear of metals under unlubricated conditions. Proc. R. Soc. Lond. A 1956, 236, 387–410. [Google Scholar] [CrossRef]
  23. Rabinowicz, E. The Wear Coefficient—Magnitude, Scatter, Uses. J. Tribol. 1981, 103, 188–193. [Google Scholar] [CrossRef]
  24. Yang, L.J. A test methodology for the determination of wear coefficient. Wear 2005, 259, 1453–1461. [Google Scholar] [CrossRef]
  25. American Petroleum Institute. Recommended Practice API-2F, Specification for Mooring Chain; American Petroleum Institute: Washington, DC, USA, 1997. [Google Scholar]
  26. ASTM E92-17; Standard Test Methods for Vickers Hardness and Knoop Hardness of Metallic Materials. ASTM International: West Conshohocken, PA, USA, 2017.
  27. GB/T 18669-2012; Steel Bar for Ship Anchor Chain. National Standardization Management Committee of China: Beijing, China, 2012.
  28. Wan, Y.; Jiang, W.; Li, H. Cold bending effect on residual stress, microstructure and mechanical properties of Type 316L stainless steel welded joint. Eng. Fail. Anal. 2020, 117, 104825. [Google Scholar] [CrossRef]
  29. Ferreira, R.; Galvani, G.; Tertuliano, I.; Rodrigues, A.; Azevedo, C. Characterization and evolution of the coefficient of friction during pin on disc tribotest: Comparison between C10200 Cu, AA6082-T6 Al and C36000 brass pins under varying normal loads. Tribol. Int. 2019, 138, 403–414. [Google Scholar] [CrossRef]
  30. Petrica, M.; Katsich, C.; Badisch, E.; Kremsner, F. Study of abrasive wear phenomena in dry and slurry 3-body conditions. Tribol. Int. 2013, 64, 196–203. [Google Scholar] [CrossRef]
  31. Bakshi, S.R.; Wang, D.; Price, T.; Zhang, D.; Keshri, A.K.; Chen, Y.; McCartney, D.G.; Shipway, P.H.; Agarwal, A. Microstructure and wear properties of aluminum/aluminum–silicon compositecoatings prepared by cold spraying. Surf. Coat. Technol. 2009, 204, 503–510. [Google Scholar] [CrossRef]
  32. Wang, Z.; Li, Y.; Zhang, Z.; Zhang, S.; Ren, P.; Qiu, J.; Wang, W.; Bi, Y.; He, Y. Friction and wear behavior of duplex-treated AISI 316L steels by rapid plasma nitriding and (CrWAlTiSi)N ceramic coating. Results Phys. 2021, 24, 104132. [Google Scholar] [CrossRef]
  33. Luo, Q.; Li, J.; Yan, Q.; Li, W.; Gao, Y.; Kitchen, M.; Bowen, L.; Farmilo, N.; Ding, Y. Sliding wear of medium-carbon bainitic/martensitic/austenitic steel treated by short-term low-temperature austempering. Wear 2021, 476, 203732. [Google Scholar] [CrossRef]
  34. García-León, R.; Martínez-Trinidad, J.; Zepeda-Bautista, R.; Campos-Silva, I.; Guevara-Morales, A.; Martínez-Londoño, J.; Barbosa-Saldaña, J. Dry sliding wear test on borided AISI 316L stainless steel under ball-on-flat configuration: A statistical analysis. Tribol. Int. 2021, 157, 106885. [Google Scholar] [CrossRef]
  35. García-León, R.A.; Martínez-Trinidad, J. Wear maps of borided AISI 316L steel under ball-on-flat dry sliding conditions. Mater. Lett. 2021, 282, 128842. [Google Scholar] [CrossRef]
  36. Guo, X.; Baker, I.; Kennedy, F.E.; Ringer, S.P.; Chen, H.; Zhang, W.; Liu, Y.; Song, M. A comparison of the dry sliding wear of single-phase f.c.c. carbon-doped Fe40.4Ni11.3Mn34.8Al7.5Cr6 and CoCrFeMnNi high entropy alloys with 316 stainless steel. Mater. Charact. 2020, 170, 110693. [Google Scholar] [CrossRef]
  37. Guo, X.; Baker, I.; Kennedy, F.E.; Song, M. A comparison of the dry sliding wear behavior of NiCoCr medium entropy alloy with 316 stainless steel. Mater. Charact. 2020, 160, 110132. [Google Scholar] [CrossRef]
  38. Koricherla, M.; Torgerson, T.; Alidokht, S.; Munagala, V.; Chromik, R.; Scharf, T. High temperature sliding wear behavior and mechanisms of cold-sprayed Ti and Ti–TiC composite coatings. Wear 2021, 476, 203746. [Google Scholar] [CrossRef]
  39. Da Silva, C.R.A., Jr.; Pintaude, G. Uncertainty analysis on the wear coefficient of Archard model. Tribol. Int. 2009, 41, 473–481. [Google Scholar] [CrossRef]
  40. Reichelt, M.; Cappella, B. Large scale multi-parameter analysis of wear of self-mated 100Cr6 steel—A study of the validity of Archard’s law. Tribol. Int. 2021, 159, 106945. [Google Scholar] [CrossRef]
Figure 1. Typical wear pattern of chain links in the contact region (recovered from buoys in South China Sea).
Jmse 10 01014 g001
Figure 2. Definition of model parameters used in Equation (5).
Jmse 10 01014 g002
Figure 3. Wear depth measurement (Unit: μm) (a): along the width direction (b): along the wear direction.
Jmse 10 01014 g003aJmse 10 01014 g003b
Figure 4. MFT-R4000 high speed reciprocating friction and wear tester (Lanzhou Institute of Chemical Physics, China).
Jmse 10 01014 g004
Figure 5. (a) Chains links formed of different materials and (b) pin-on-flat friction pair.
Jmse 10 01014 g005
Figure 6. Test results of the Vickers hardness.
Jmse 10 01014 g006
Figure 7. Friction coefficient of CM490 as a function of test time. (a) F = 10 N (b) F = 30 N (c) F = 50 N.
Jmse 10 01014 g007aJmse 10 01014 g007b
Figure 8. Friction coefficient of SS316 as a function of test time. (a) F= 10 N (b) F = 30 N (c) F = 50 N.
Jmse 10 01014 g008aJmse 10 01014 g008b
Figure 9. Friction coefficient of TC4 as a function of test time (a) F = 10 N (c) F = 30 N (d) F = 50 N (Note: the time scales in (b-1,b-2) are different, where a single sample point can be clearly observed in (b-2)).
Jmse 10 01014 g009
Figure 10. Statistical graphs of friction coefficients at each test condition.
Jmse 10 01014 g010aJmse 10 01014 g010b
Figure 11. Microscopic wear morphology (200× magnification).
Jmse 10 01014 g011aJmse 10 01014 g011bJmse 10 01014 g011c
Figure 12. Morphology of wear debris (10k× magnification).
Jmse 10 01014 g012
Figure 13. Wear depth as a function of wear cycle and applied normal force.
Jmse 10 01014 g013aJmse 10 01014 g013b
Figure 14. The variability of wear coefficient considering the variation of hardness (The second and third stages).
Jmse 10 01014 g014
Figure 15. Wear coefficient as a function of contact stress to hardness ratio (σ/Hv) and contact stress to yield stress ratio (σ/σy) (the total error bar lengths are double the standard deviation values of the calculated wear coefficient).
Jmse 10 01014 g015
Table 1. Test conditions.
Sample No.MaterialNormal Force, F (N)Test Cycle, f (Hz)Distance of Travel, L0 (mm)Total Testing Time Tt (min)
2-1-1CM490101530
2-2-130
2-3-150
3-1-1SS316101530
3-2-130
3-3-150
1-1-1TC4101530
1-2-130
1-3-150
Table 2. Chemical compositions of the tested materials (%).
Test SampleCSiMnPSCrNiAlMoFe
CM4900.220.241.240.0280.018 0.019 Balance
SS3160.081.02.000.0450.0316.0–18.010.0–14.0-2.0–3.0Balance
TC4CNHOAlVTi Fe
0.10.050.0150.25.5–6.83.5–4.5Balance 0.03
Table 3. Material parameters of CM490 [27], SS316 [28], and TC4.
MaterialYoung’s Modulus, E (MPa)Poisson’s Ratio, vYield Strength, σy (MPa)Tensile Strength, σb (MPa)Density, ρ (g/cm3)Averaged Vickers Hardness, HV
(200 g, 5 s) (kgf/mm2)
CM490 [27]2060.3≥295490–6907.85344.89 (std = 33.94)
SS316 [28]1990.272555707.85302.25 (std = 6.21)
TC4
(from manufacturer)
1150.348308954.4349.05 (std = 21.06)
Table 4. Test results (Note: the value of CoF is the representative value after the stable state is reached).
Sample No.MaterialNormal Force,
F (N)
Upper Limit of CoFLower Limit of CoF
2-1-1CM490100.8780.172
2-2-1301.2240.502
2-3-1501.1980.302
3-1-1SS316100.8130.165
3-2-1301.2290.437
3-3-1501.030.277
1-1-1TC4100.4390.266
1-2-1300.4150.152
1-3-1500.3820.140
Table 5. Macroscopic wear morphology and damage detection scheme.
Material10 N30 N50 N
CM490 Jmse 10 01014 i001 Jmse 10 01014 i002 Jmse 10 01014 i003
Wear morphology on the surface of flat specimen
Jmse 10 01014 i004 Jmse 10 01014 i005 Jmse 10 01014 i006
Wear morphology on the surface of pin specimen
SS316 Jmse 10 01014 i007 Jmse 10 01014 i008 Jmse 10 01014 i009
Wear morphology on the surface of flat specimen
Jmse 10 01014 i010 Jmse 10 01014 i011 Jmse 10 01014 i012
Wear morphology on the surface of pin specimen
TC4 Jmse 10 01014 i013 Jmse 10 01014 i014 Jmse 10 01014 i015
Wear morphology on the surface of flat specimen
Jmse 10 01014 i016 Jmse 10 01014 i017 Jmse 10 01014 i018
Wear morphology on the surface of pin specimen
Table 6. Test results of wear coefficient.
Sample No.MaterialNormal Force,
F (N)
Dimensionless Wear Coefficient, k
(Standard Deviation, std)
2-1-1CM490102.108 × 10−4 (std = 1.739 × 10⁻⁴)
2-2-1308.921 × 10−4 (std = 1.064 × 10⁻⁴)
2-3-1509.059 × 10−4 (std = 1.519 × 10⁻⁴)
3-1-1SS316101.266 × 10−4 (std = 8.644 × 10⁻⁶)
3-2-1306.984 × 10−4 (std = 2.292× 10⁻⁴)
3-3-1506.696 × 10−4 (std = 1.664 × 10⁻⁴)
1-1-1TC4109.560 × 10−5 (std = 3.854 × 10⁻⁵)
1-2-1309.058 × 10−5 (std = 9.580 × 10⁻⁶)
1-3-1501.153× 10−4 (std = 2.570 × 10⁻⁵)
Publisher’s Note: MDPI stays neutral with regard to jurisdictional claims in published maps and institutional affiliations.

