
Seasonal Pattern of the Effect of Slurry Ice during Catching and Transportation on Quality and Shelf Life of Gilthead Sea Bream

 , , , and
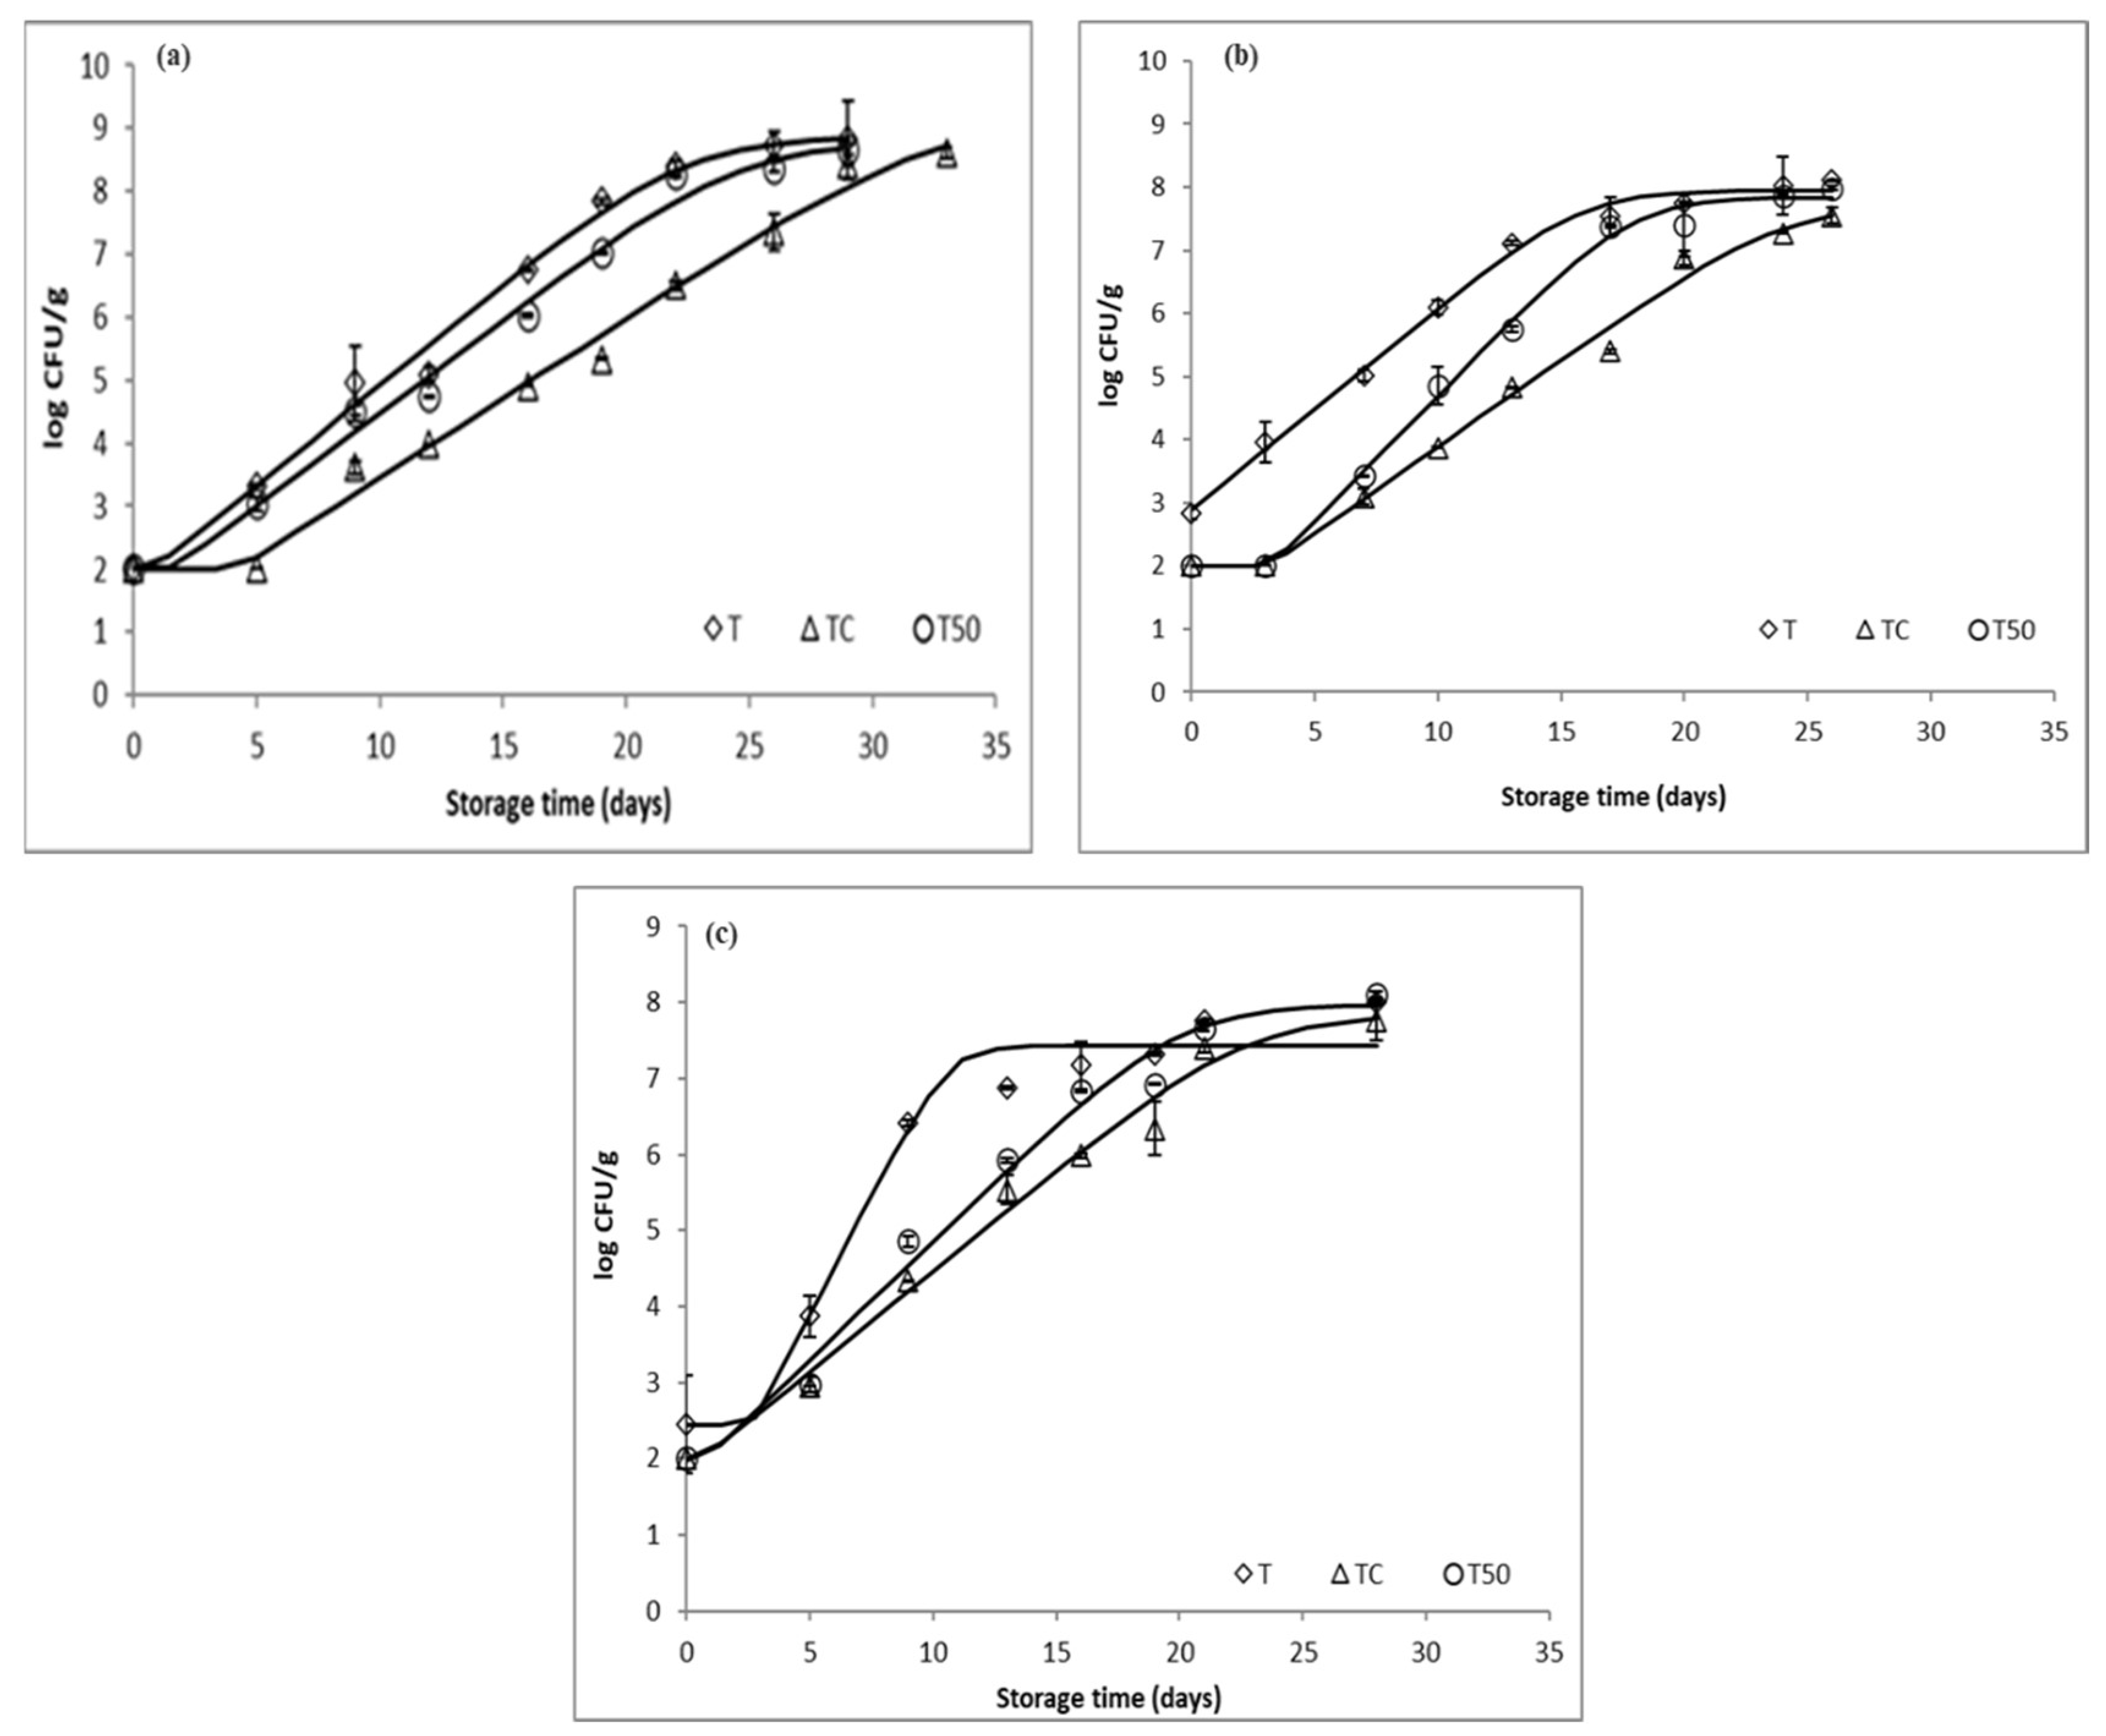
Abstract
:1. Introduction
2. Materials and Methods
2.1. Experimental Design
2.2. Measurement Methods
2.2.1. Microbiological Parameters
2.2.2. Physicochemical Quality Parameters
2.2.3. Fatty Acids Analysis
2.2.4. Proteolytic Enzymes Activity
2.2.5. Sensory Evaluation
2.3. Data Analysis
3. Results and Discussion
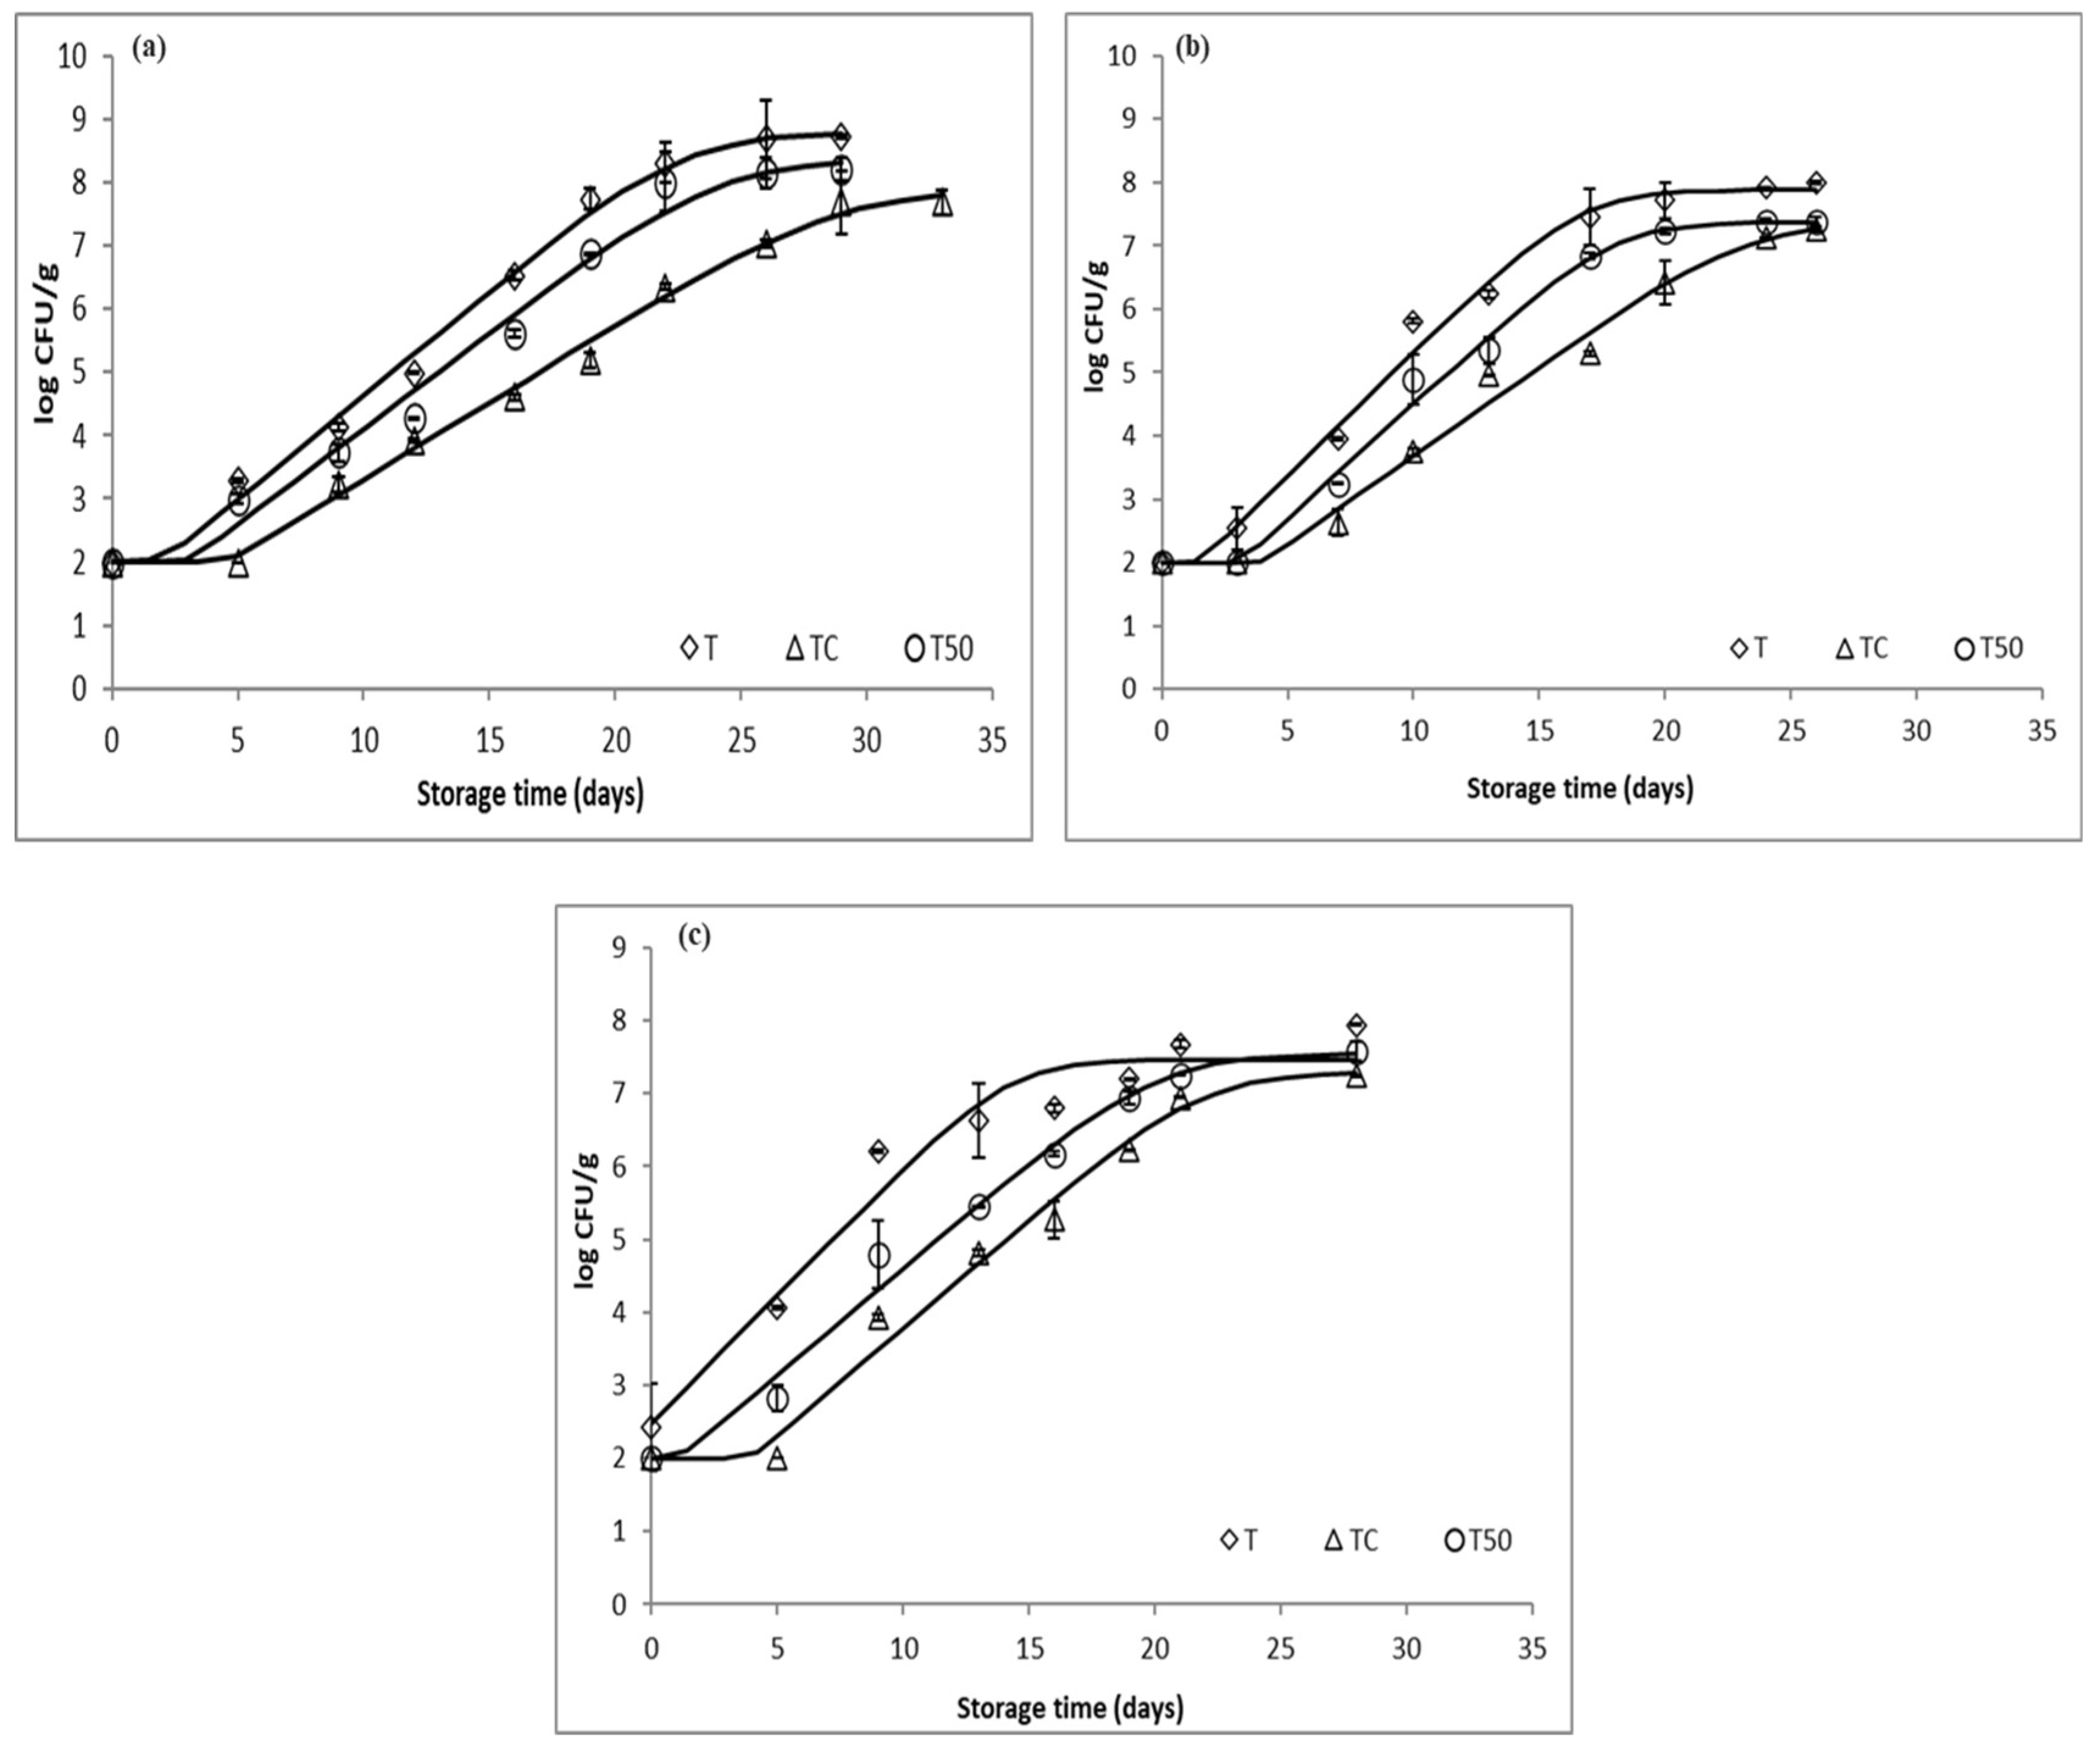
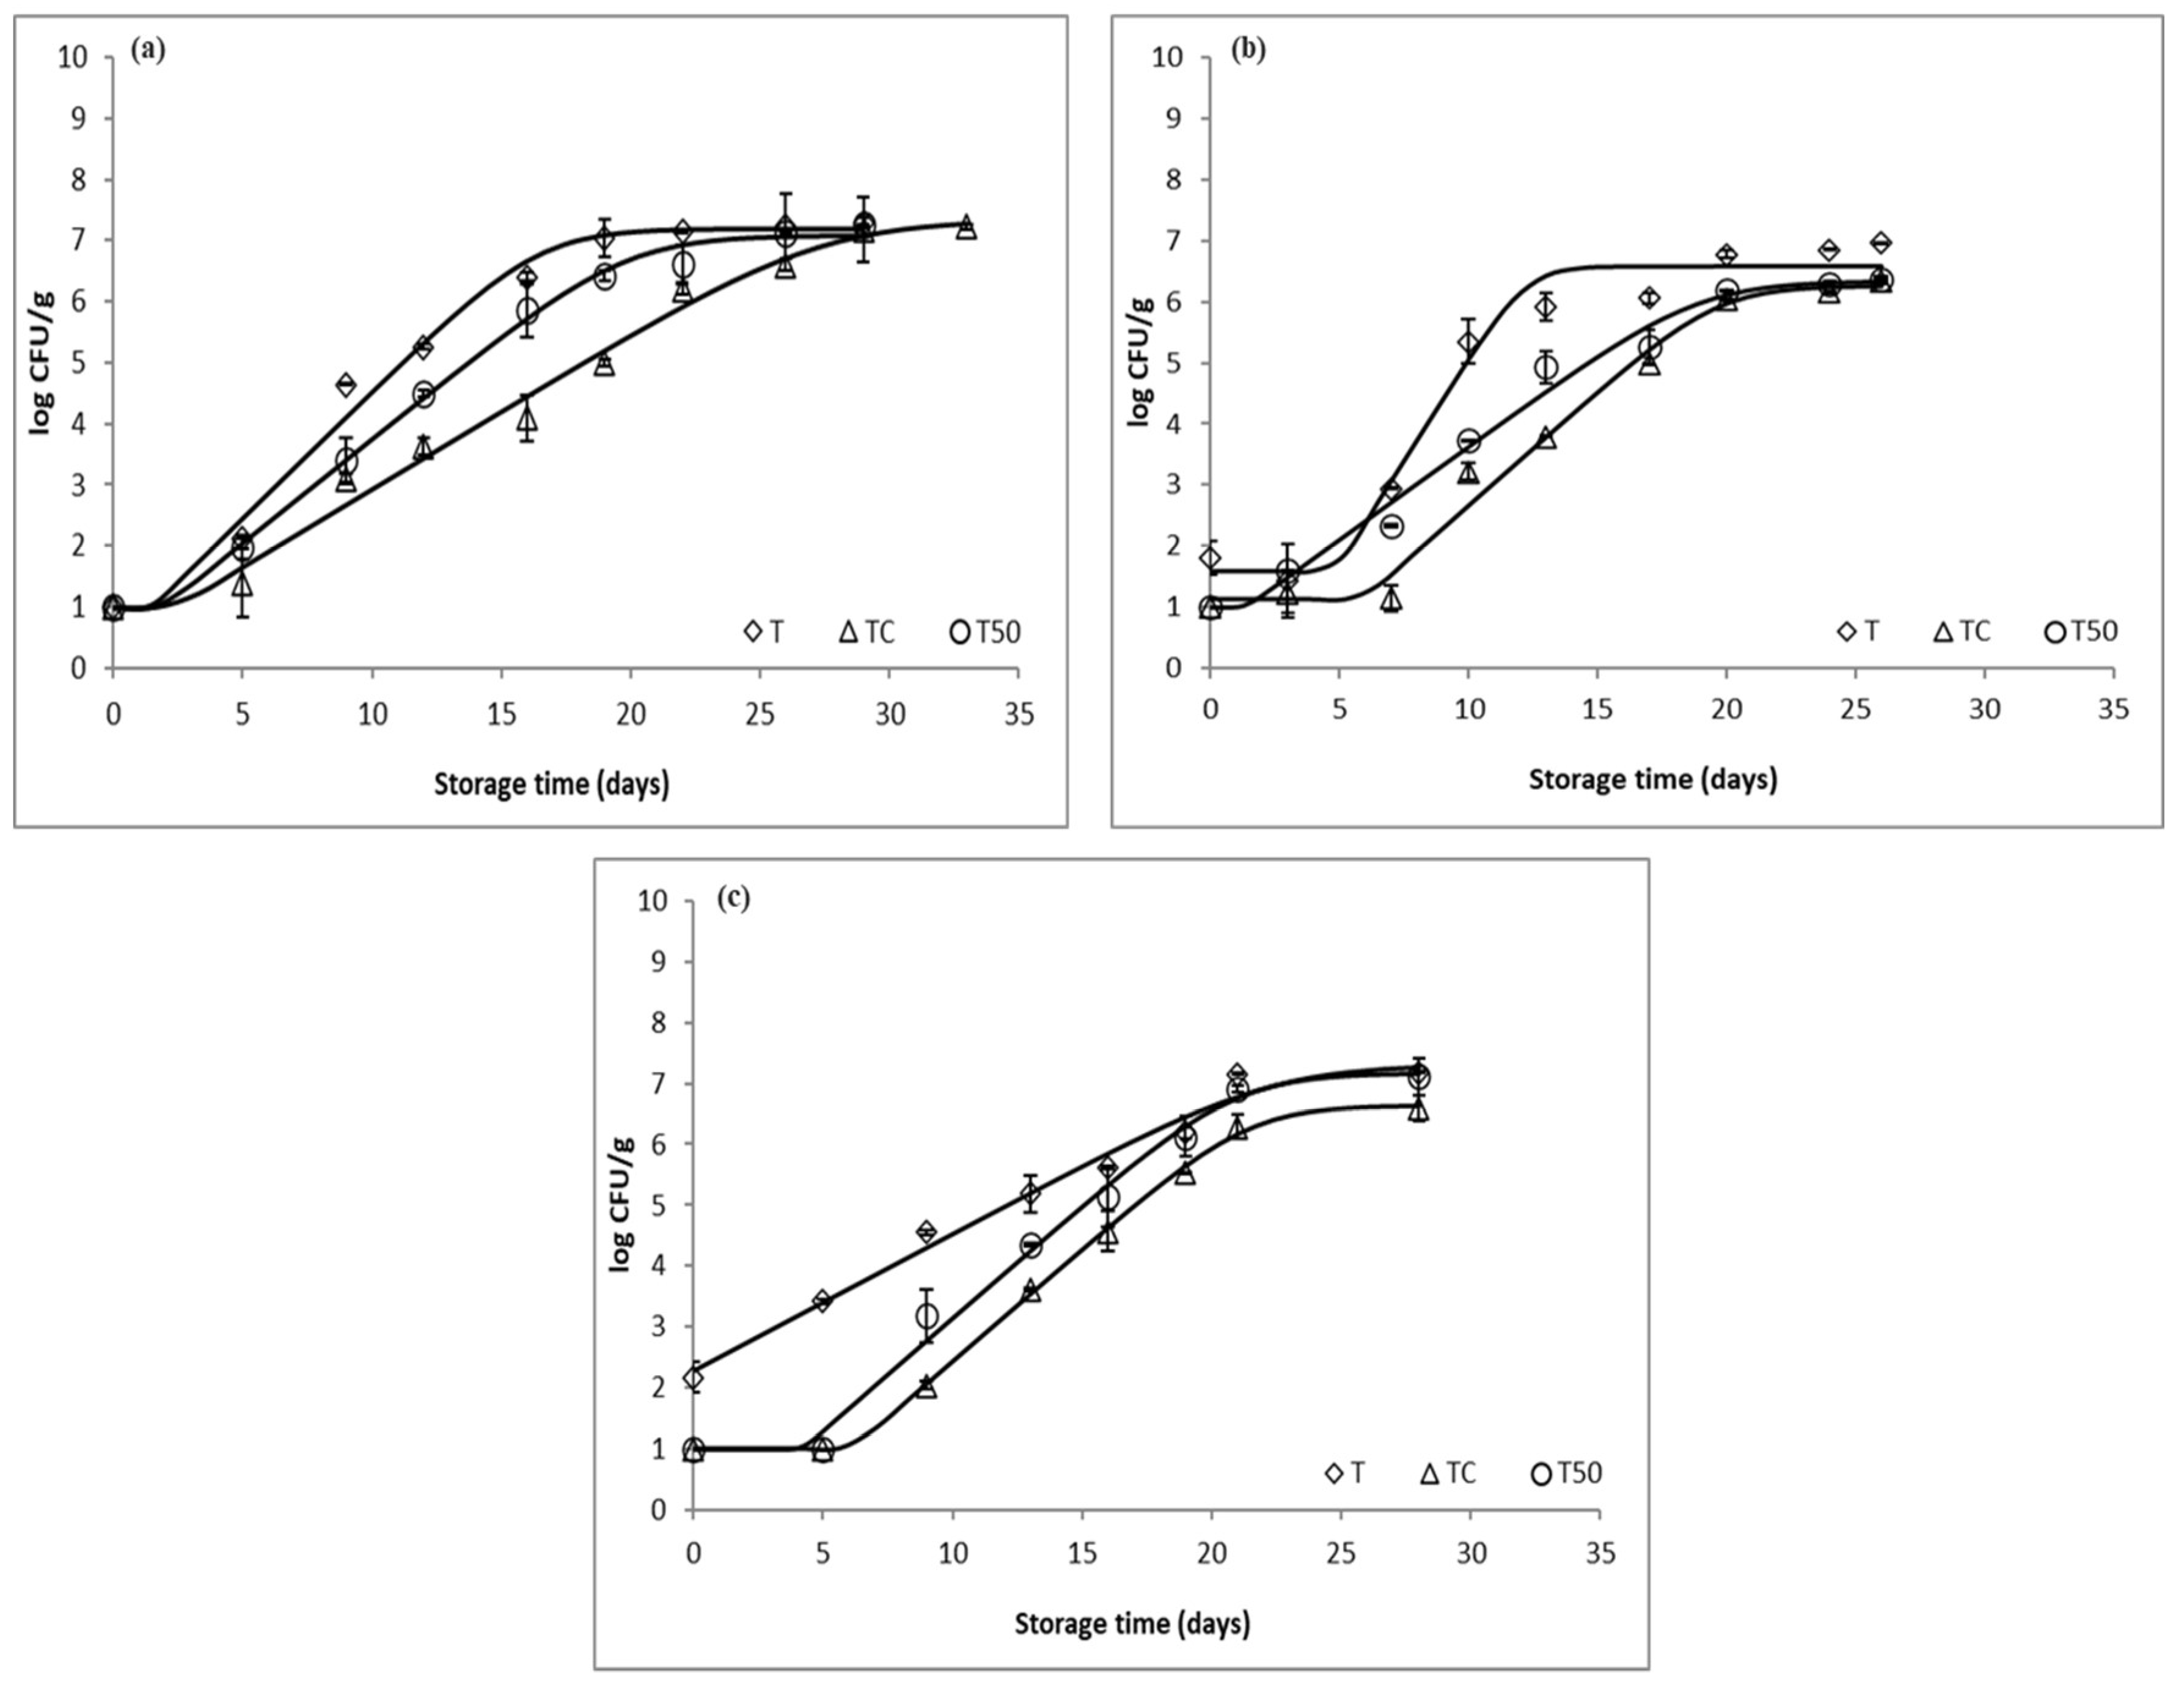
3.1. Microbial Growth
3.2. Physicochemical Analysis
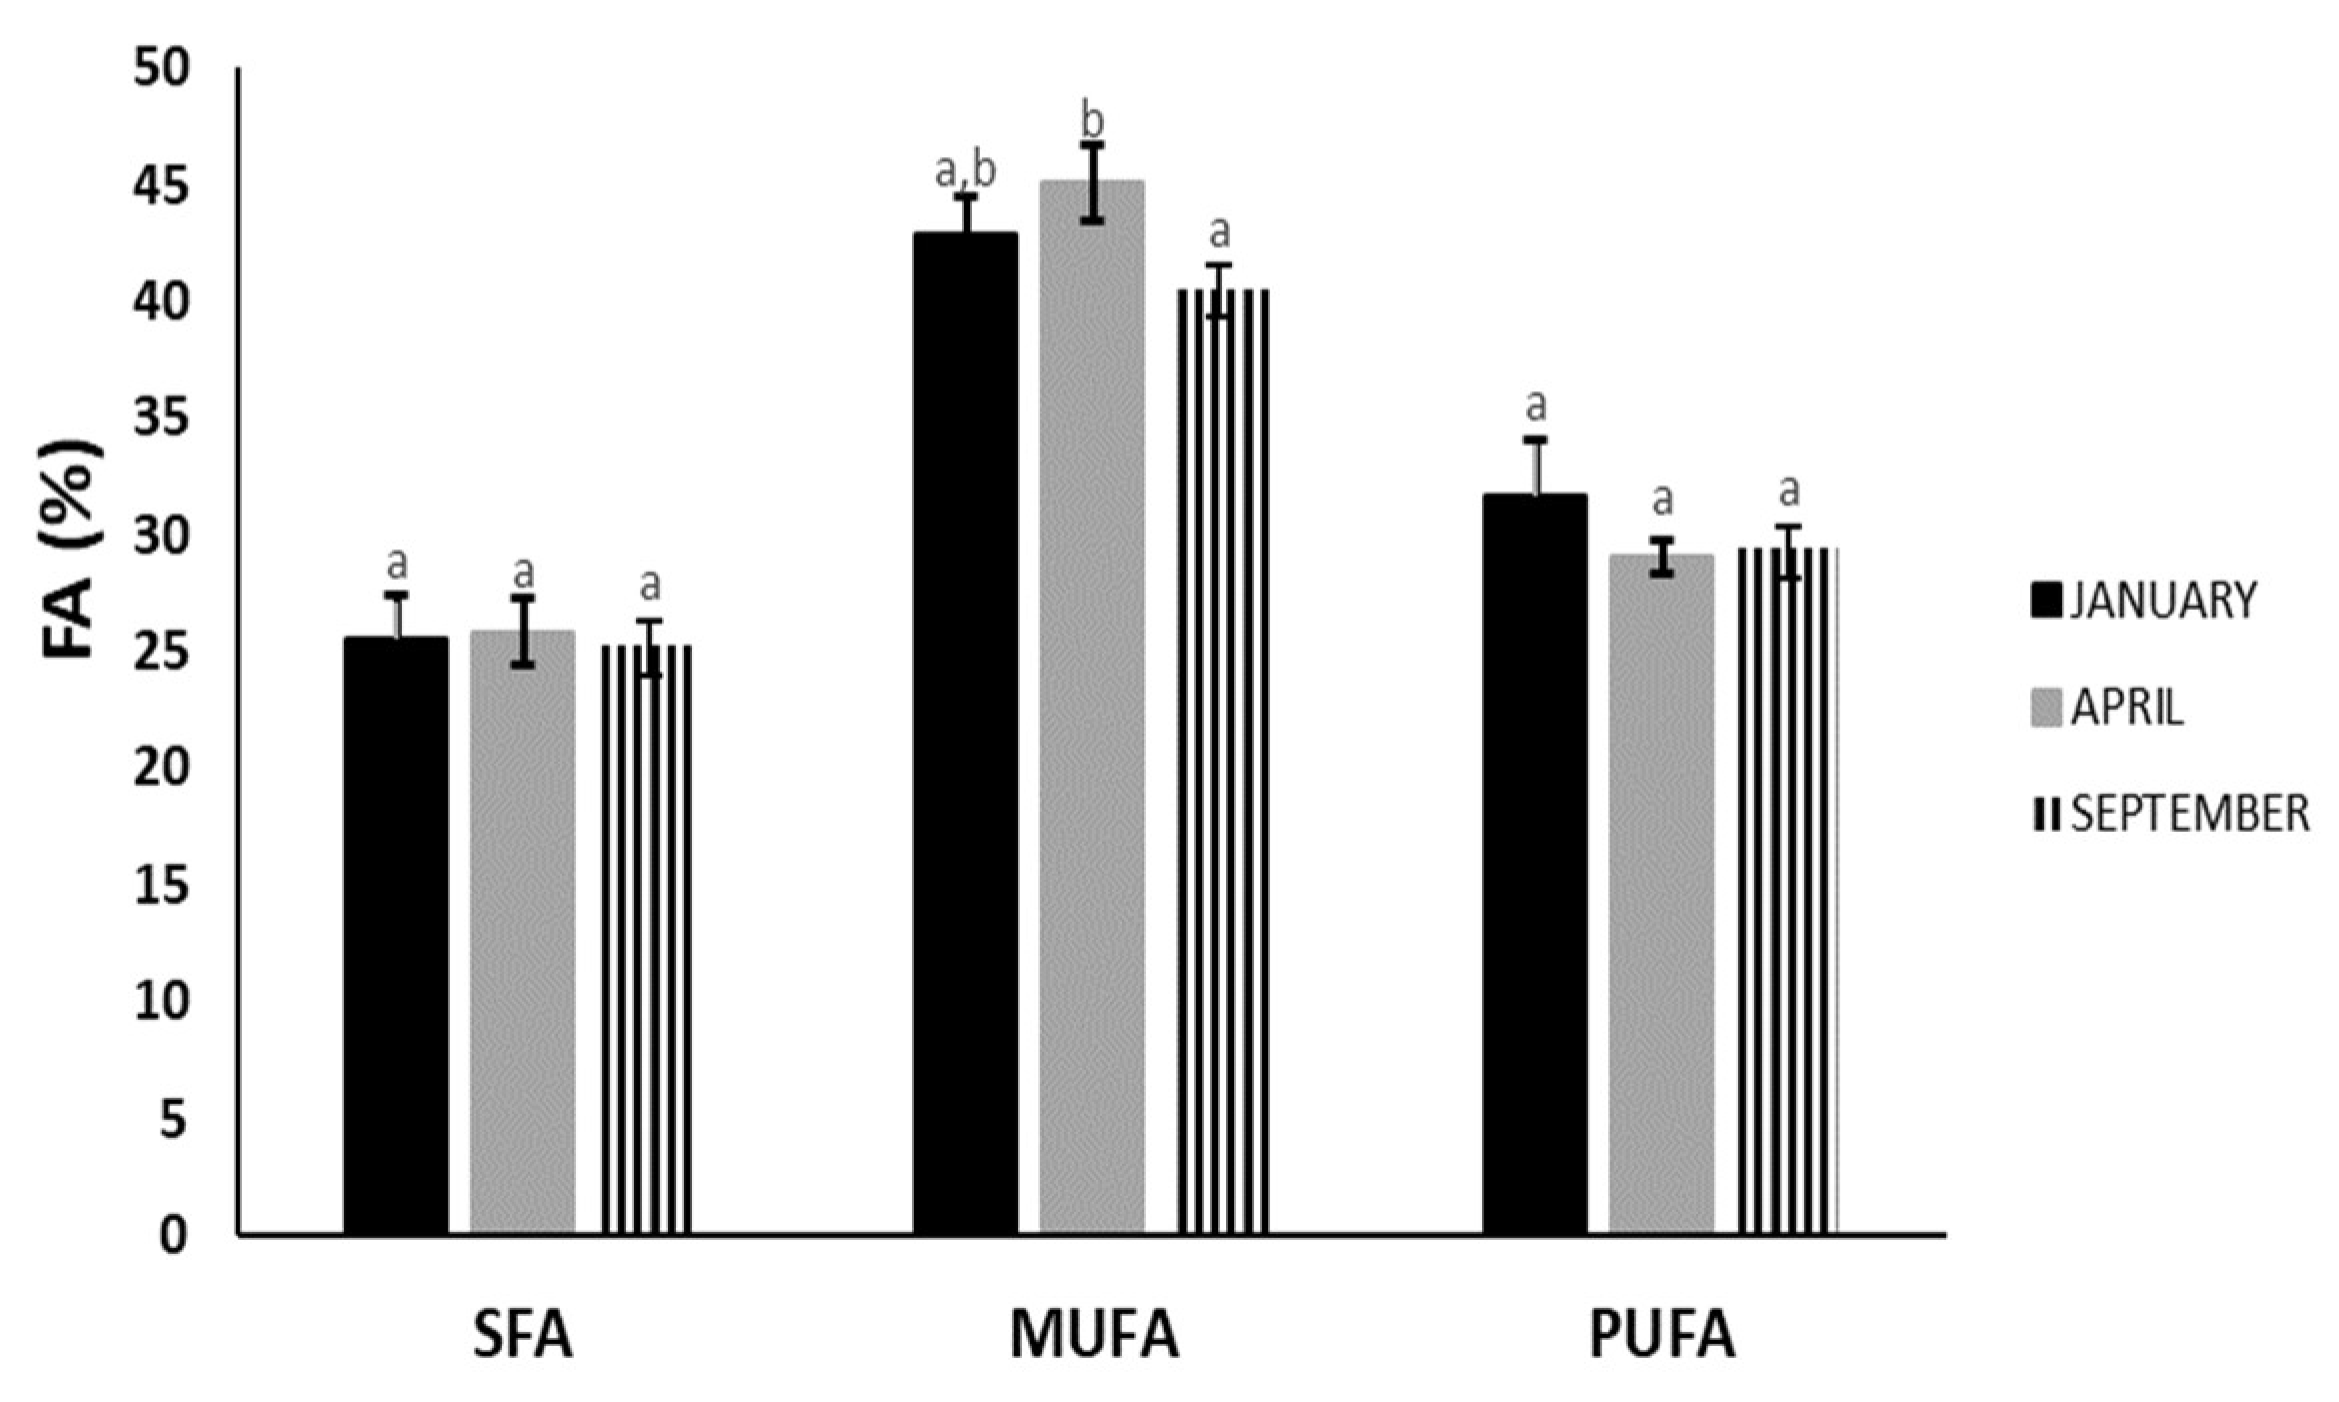
3.3. Fatty Acid Analysis
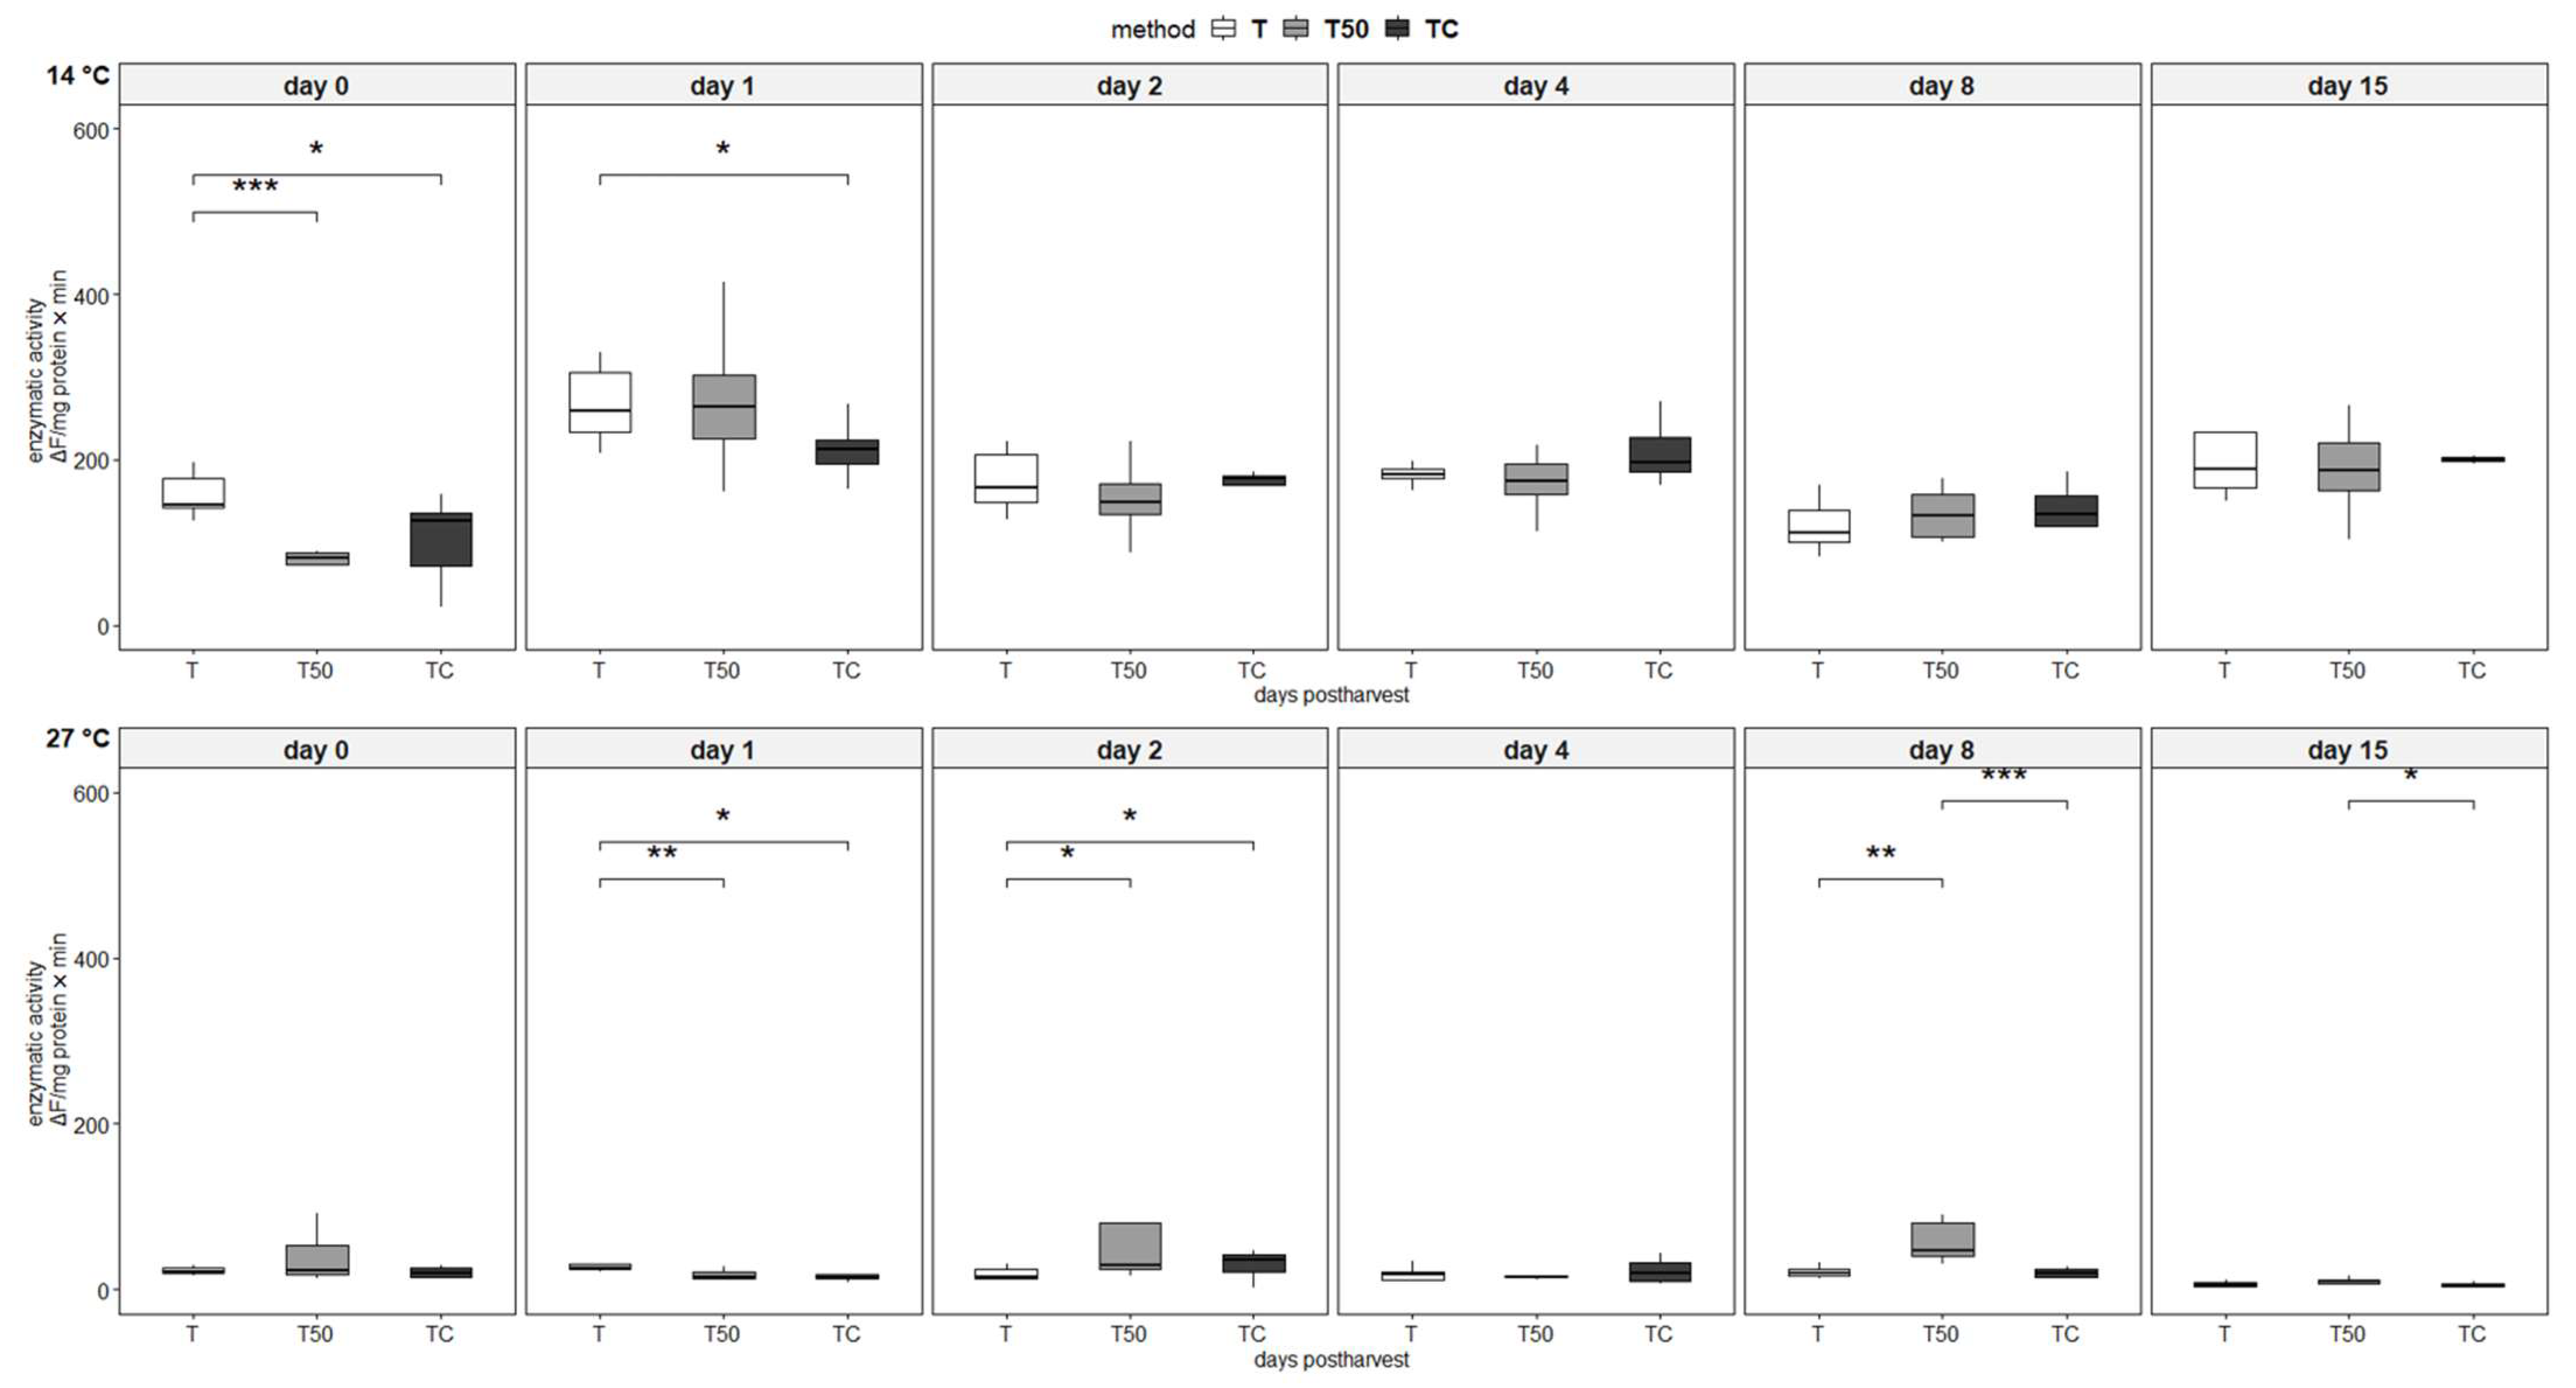
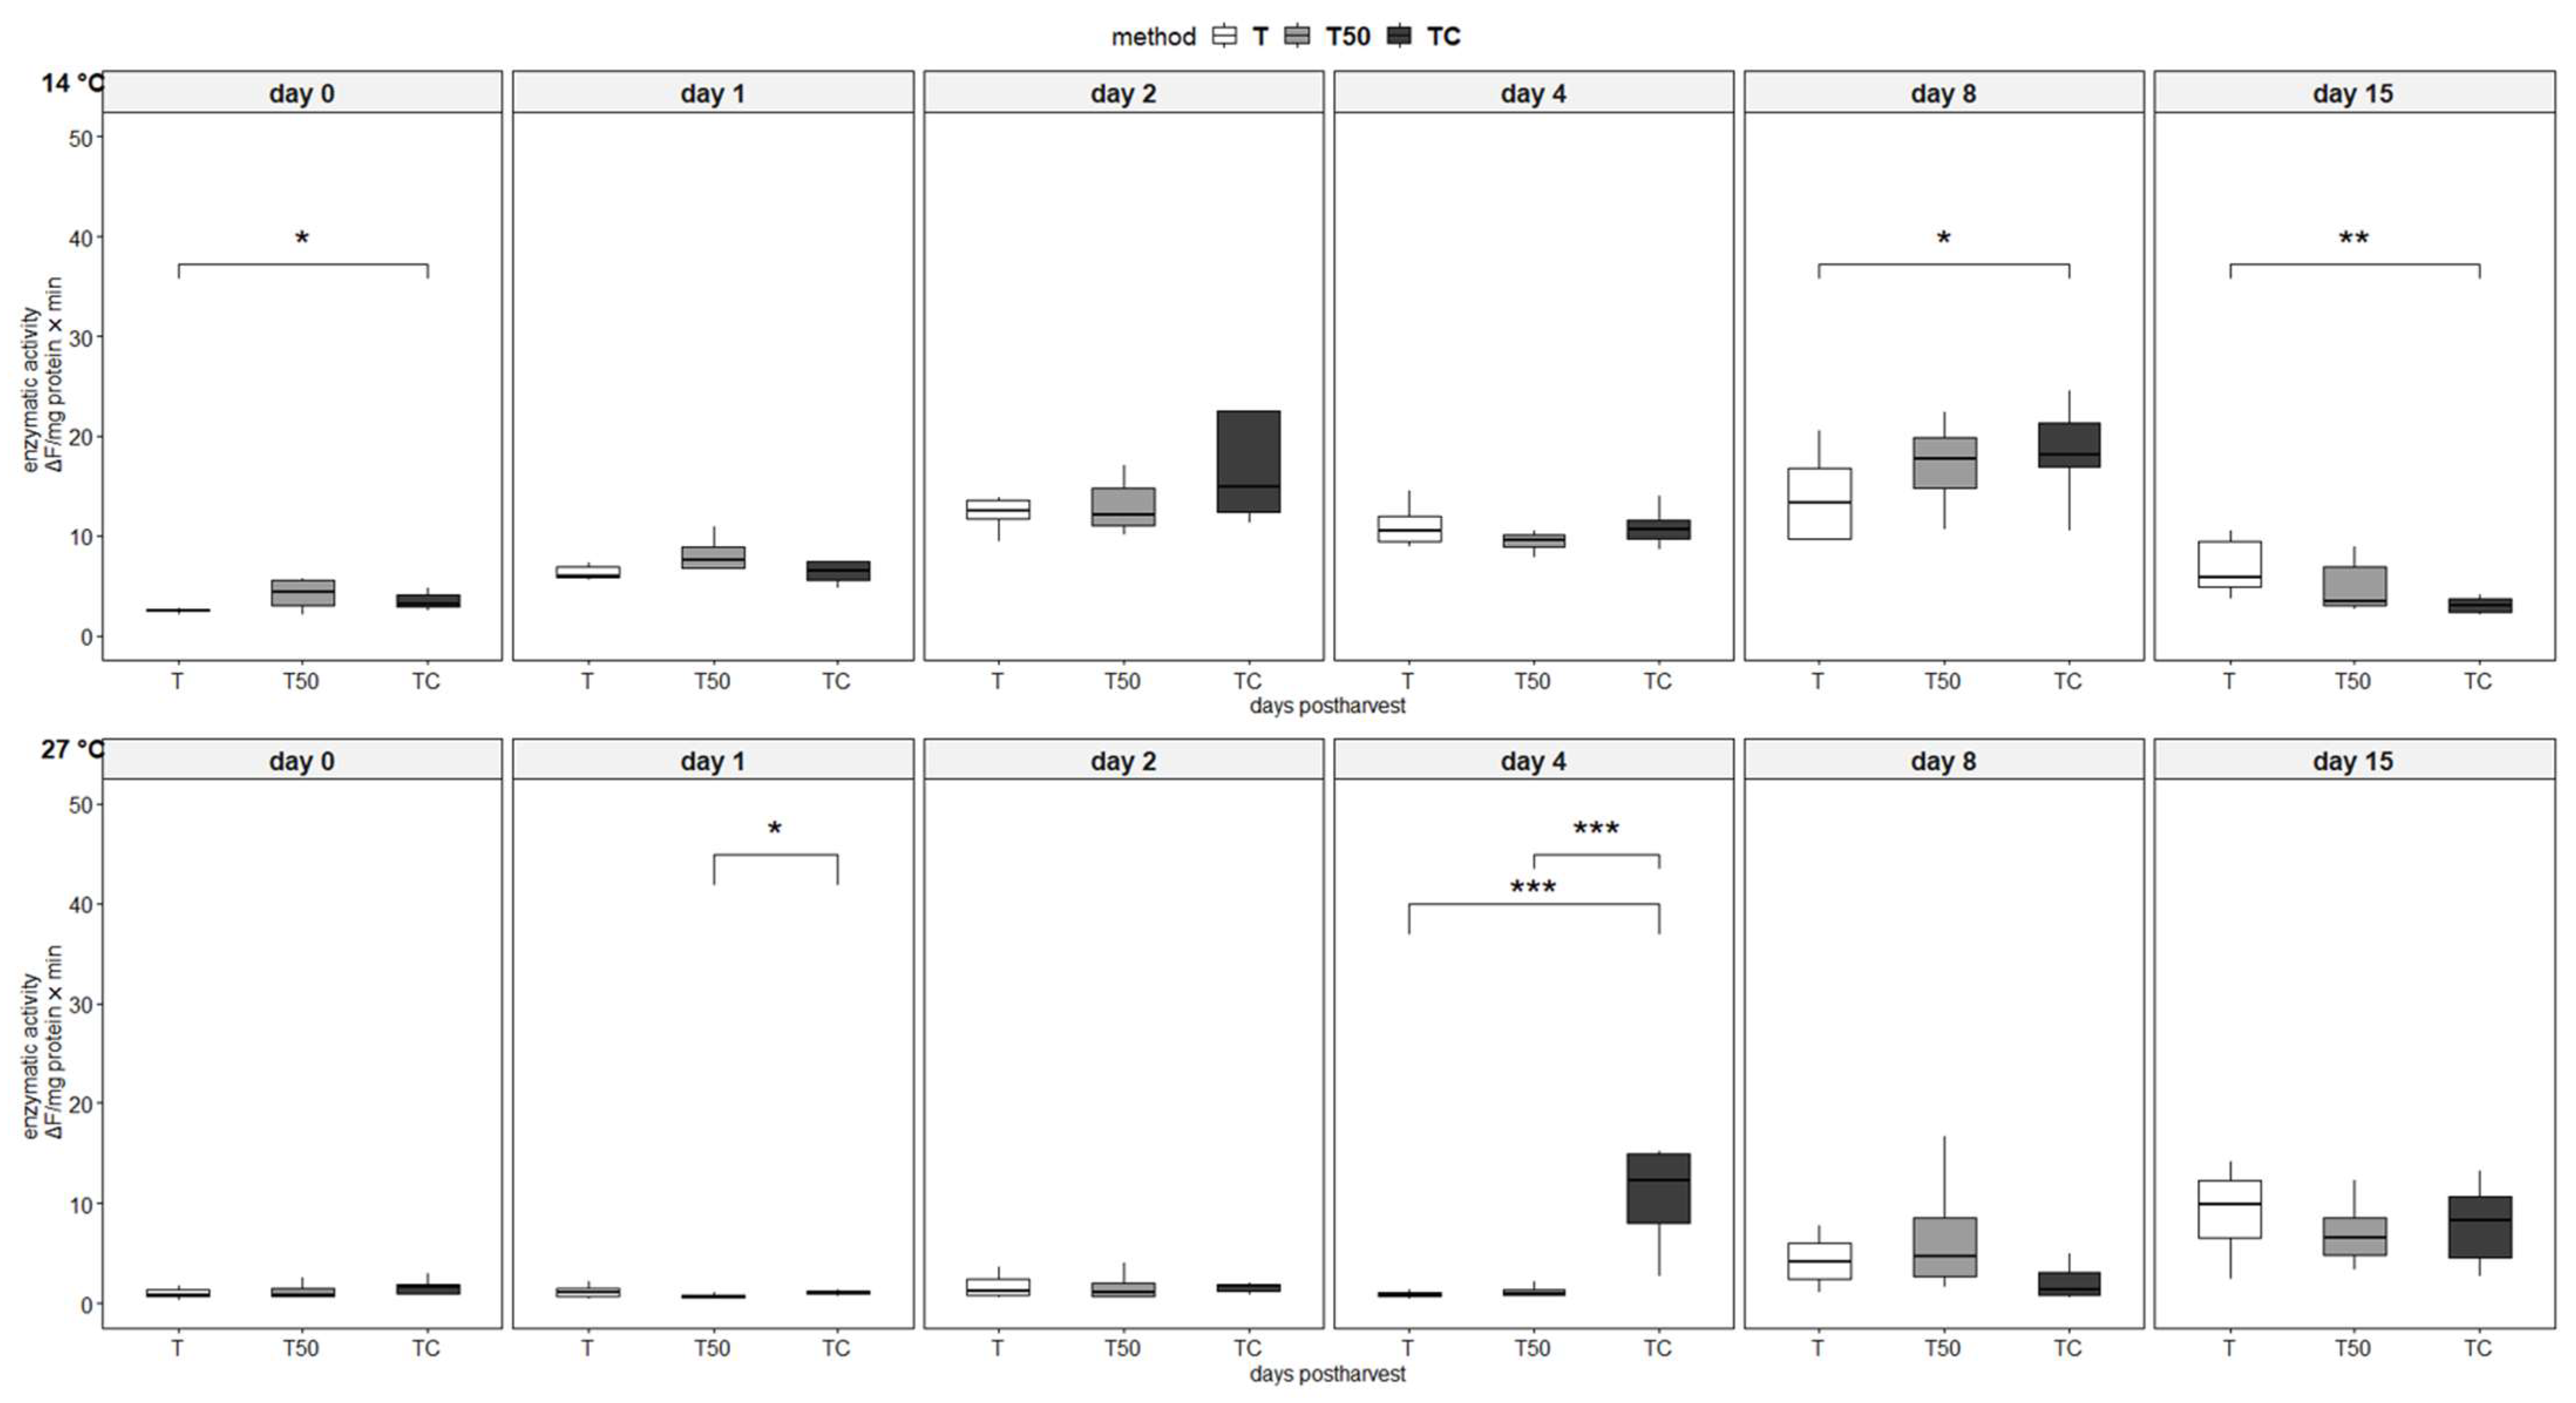
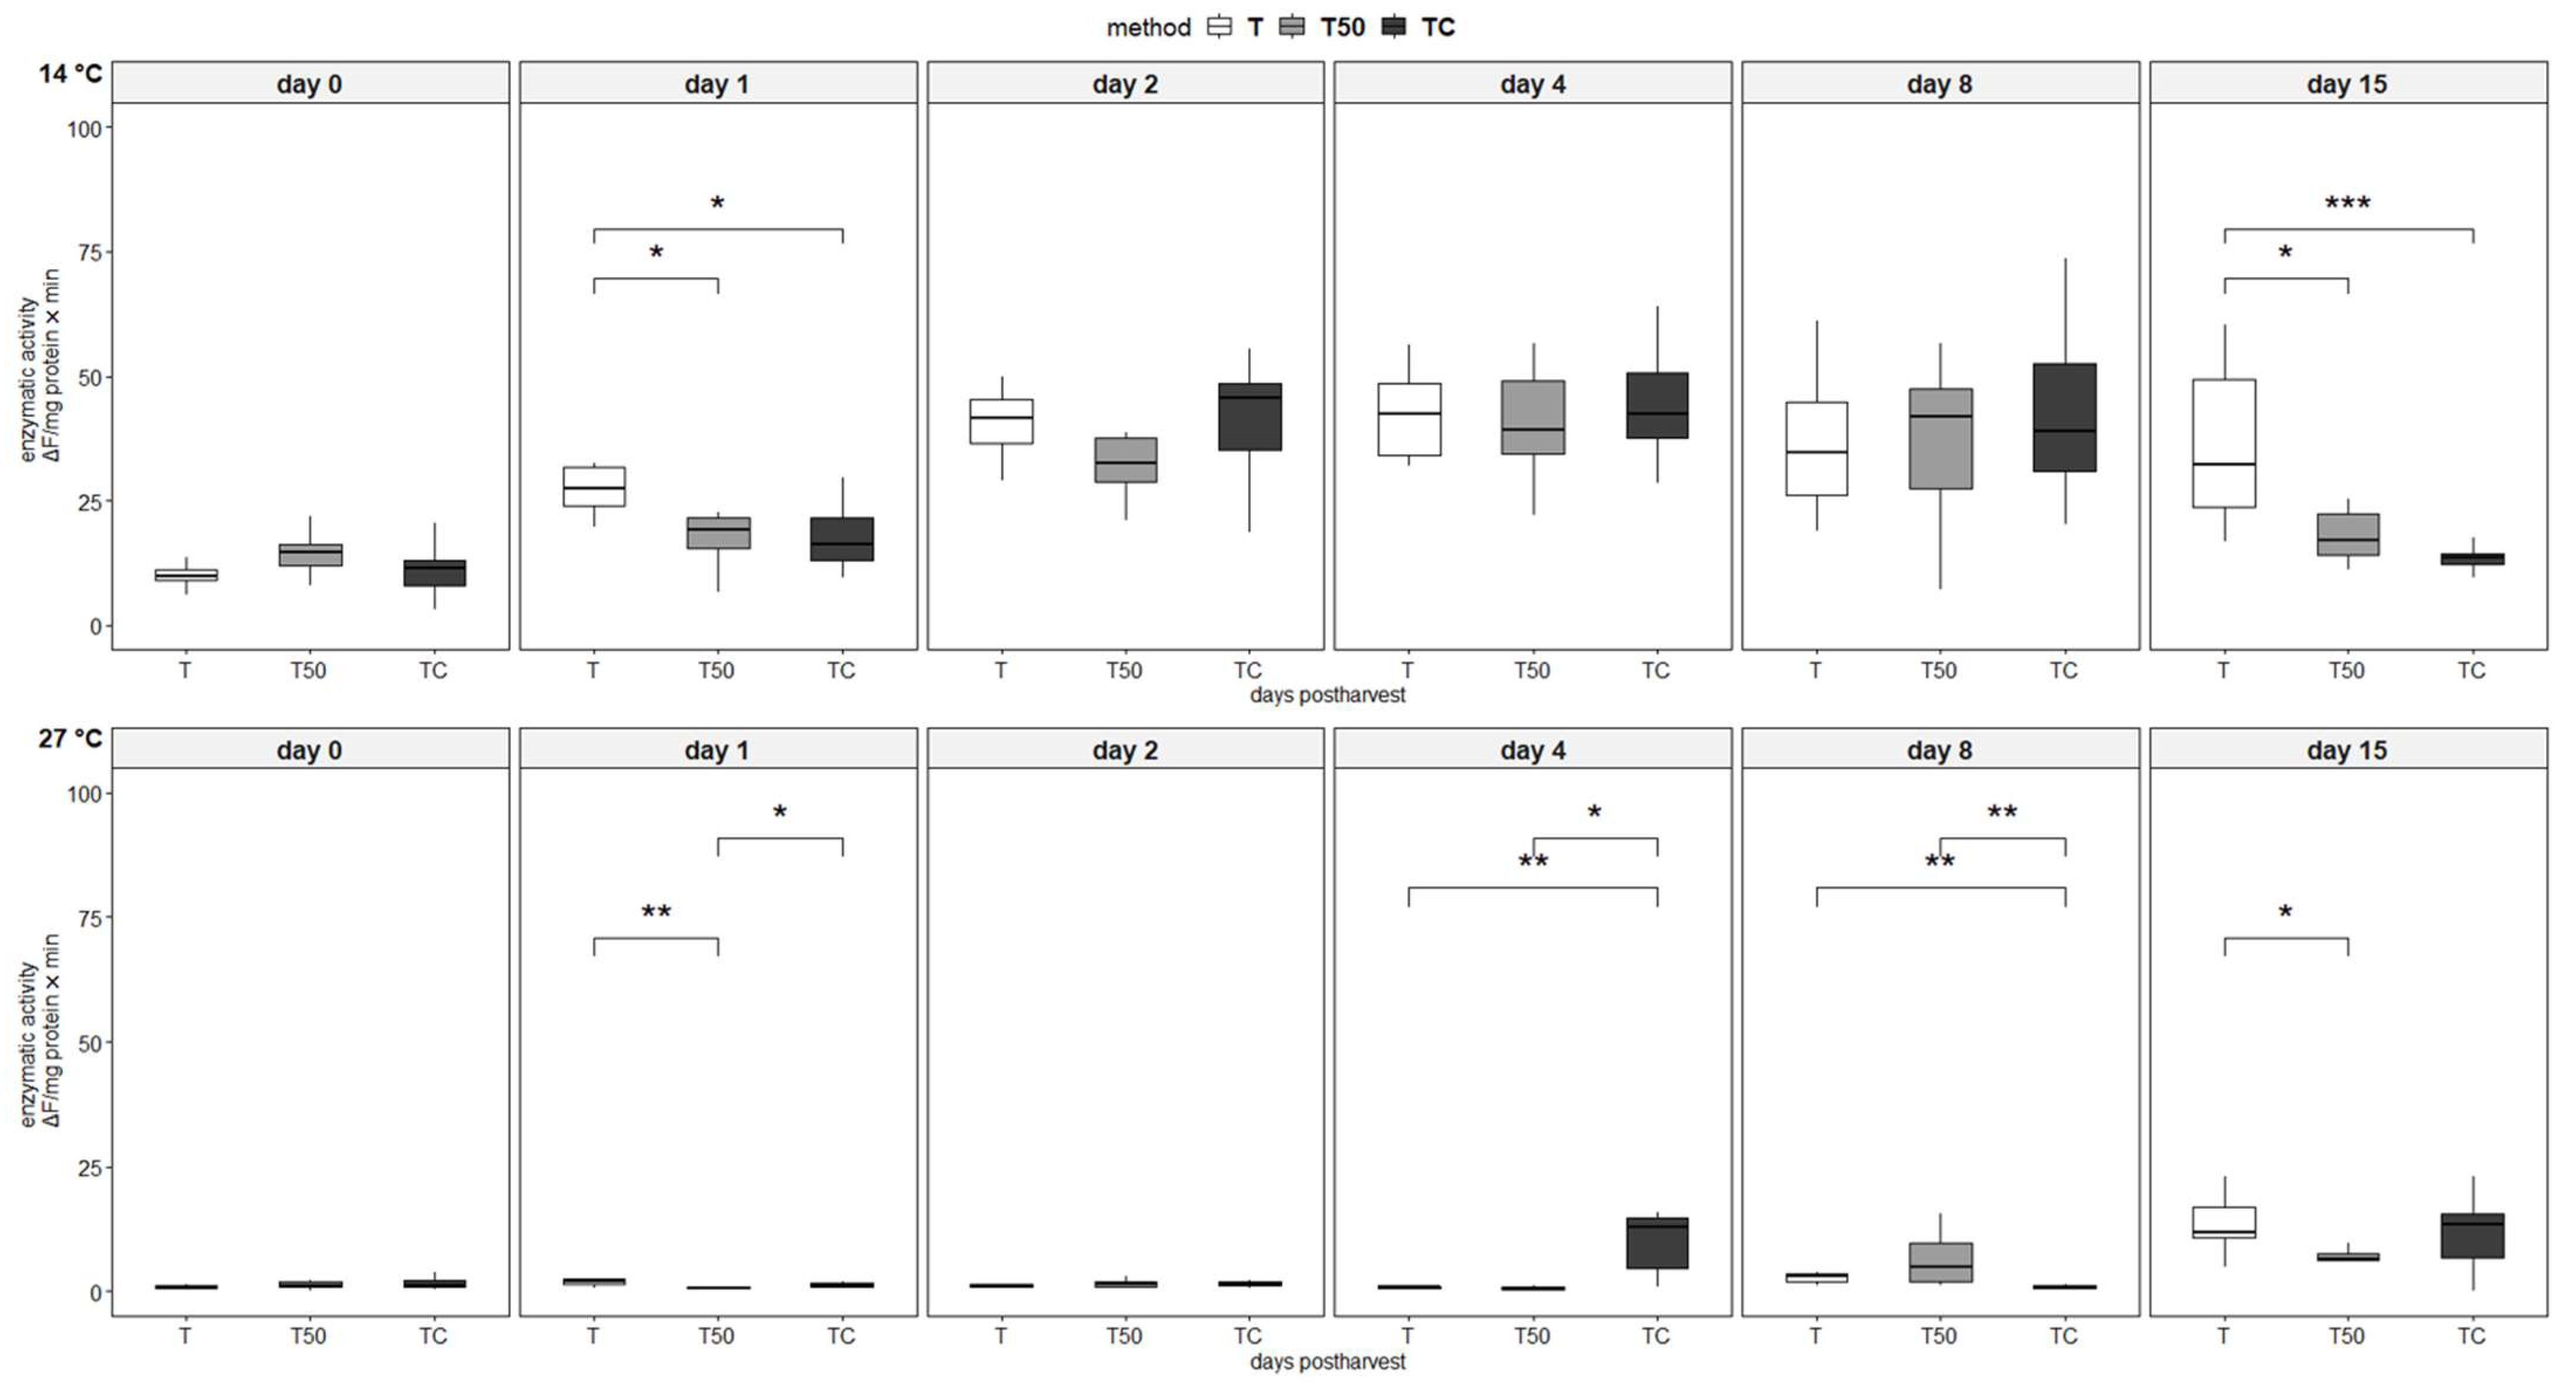
3.4. Enzymatic Activity
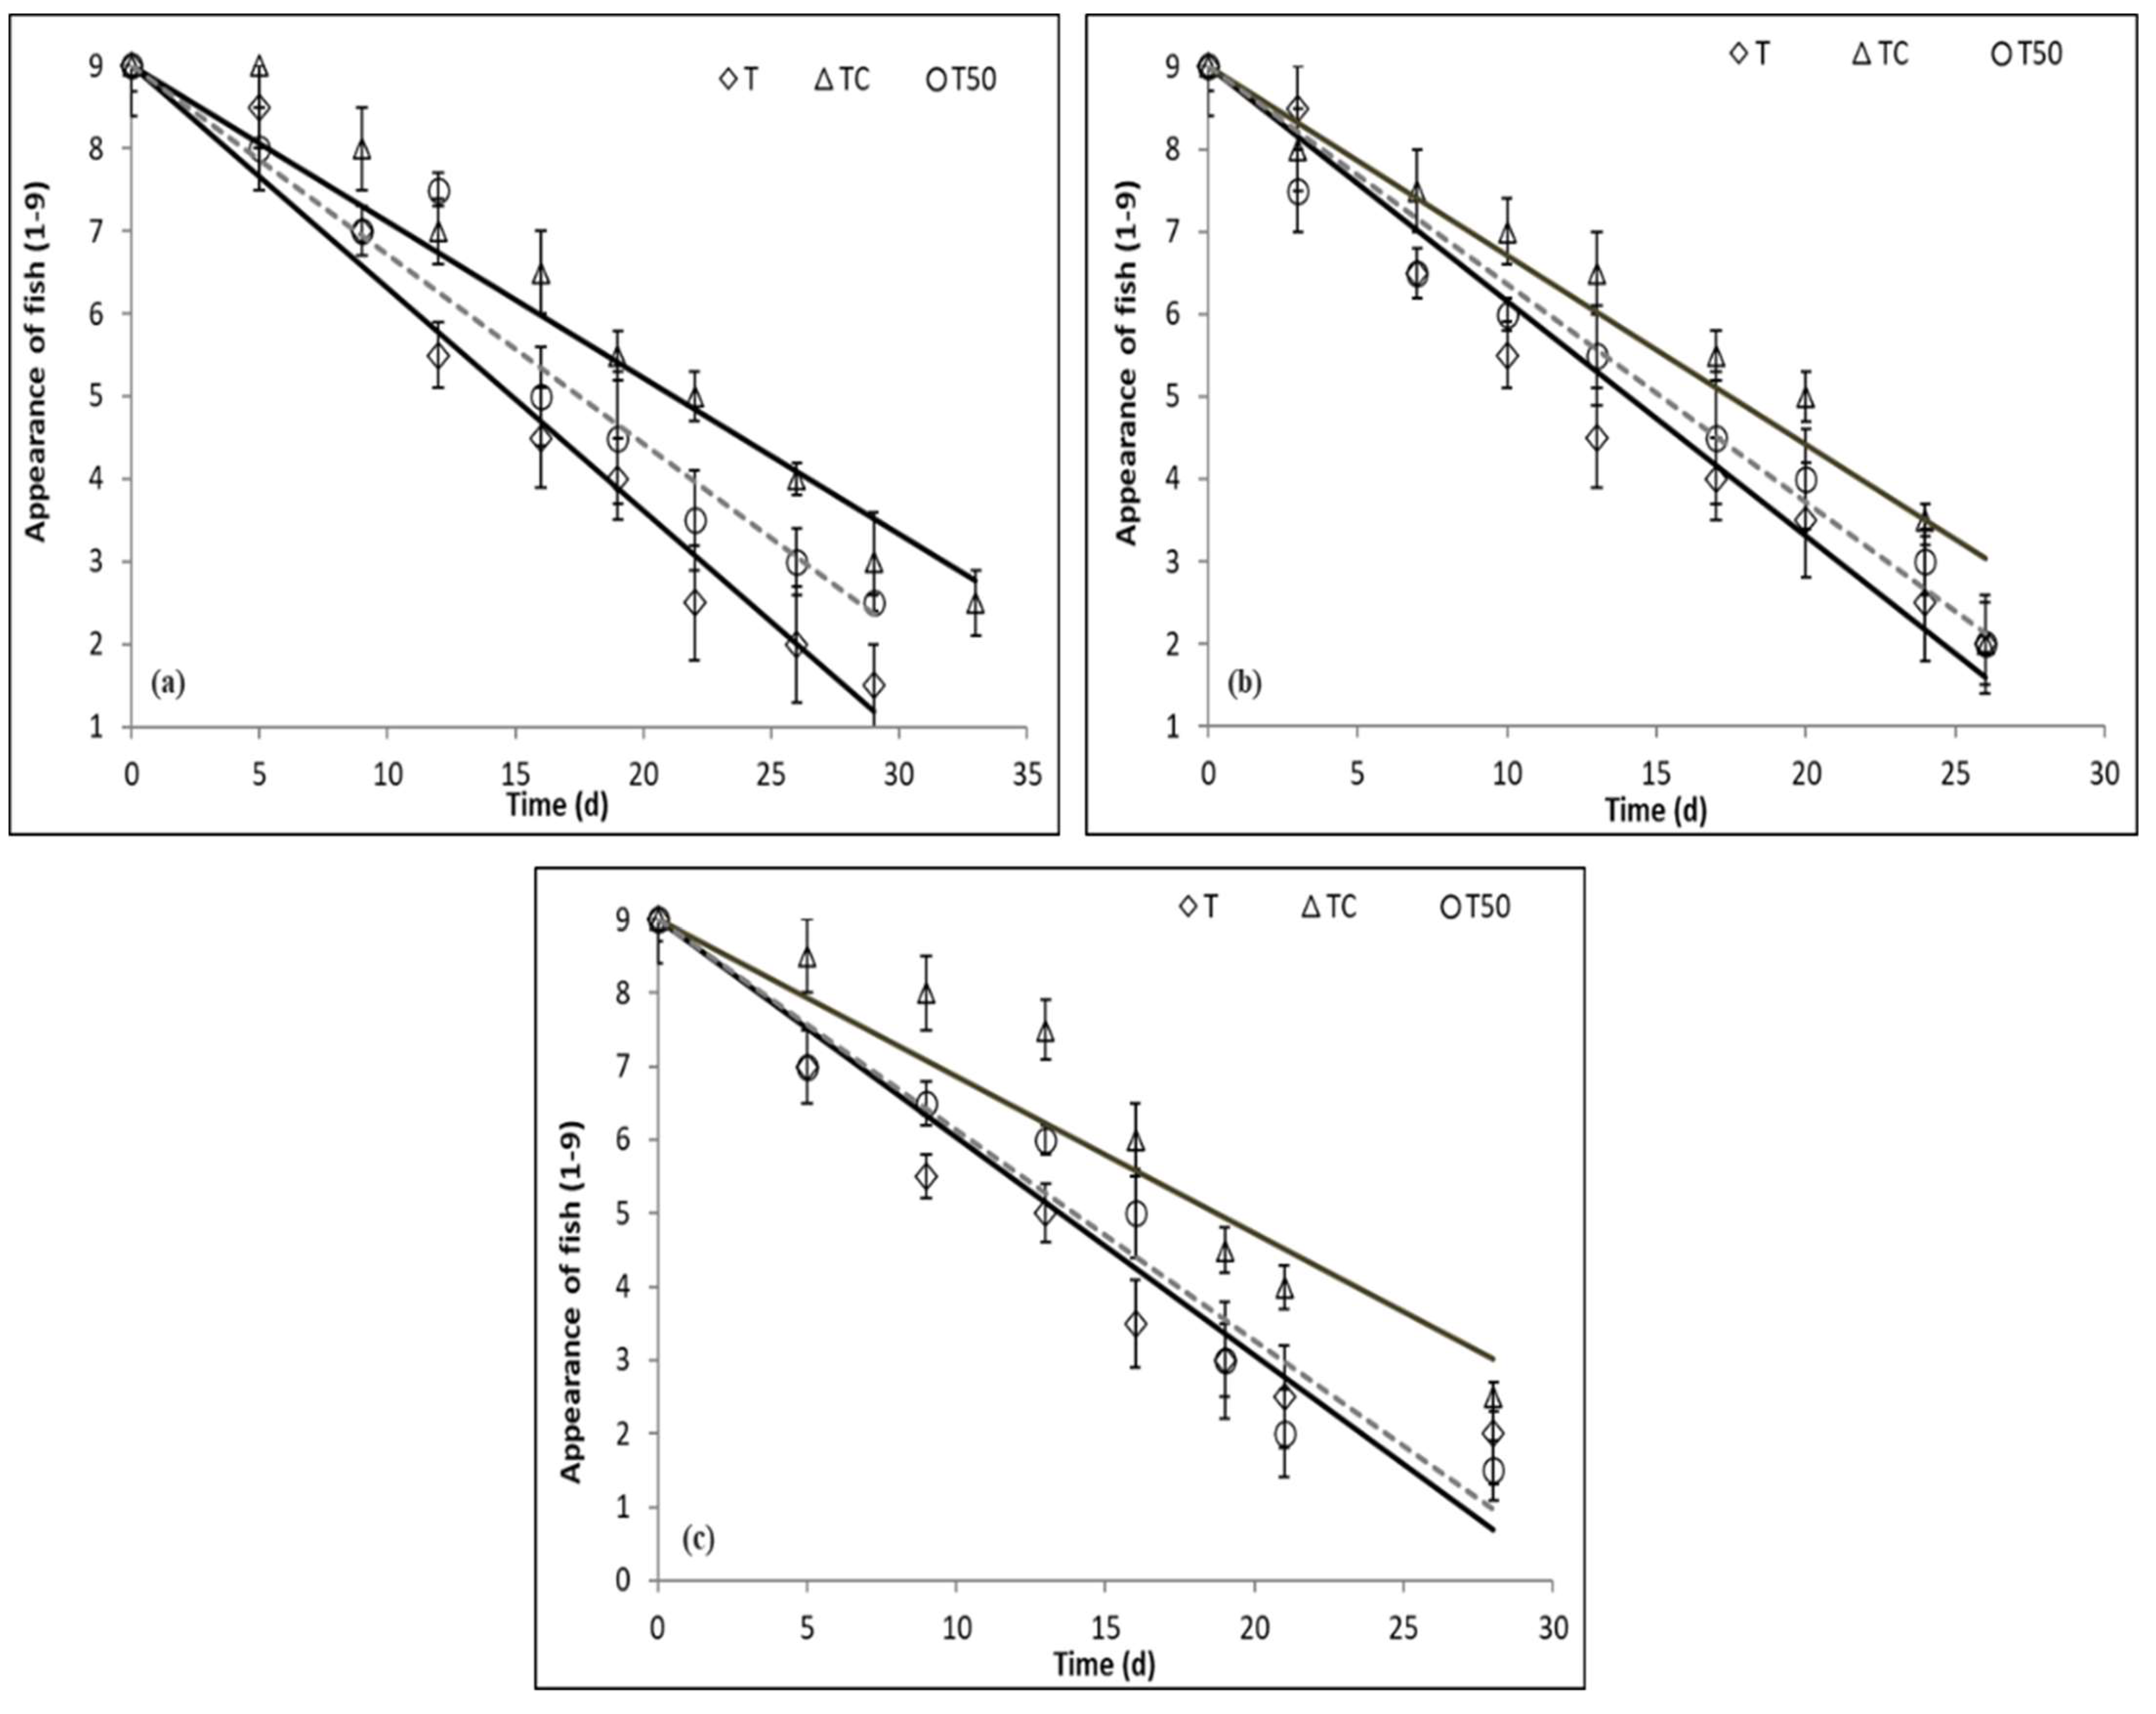
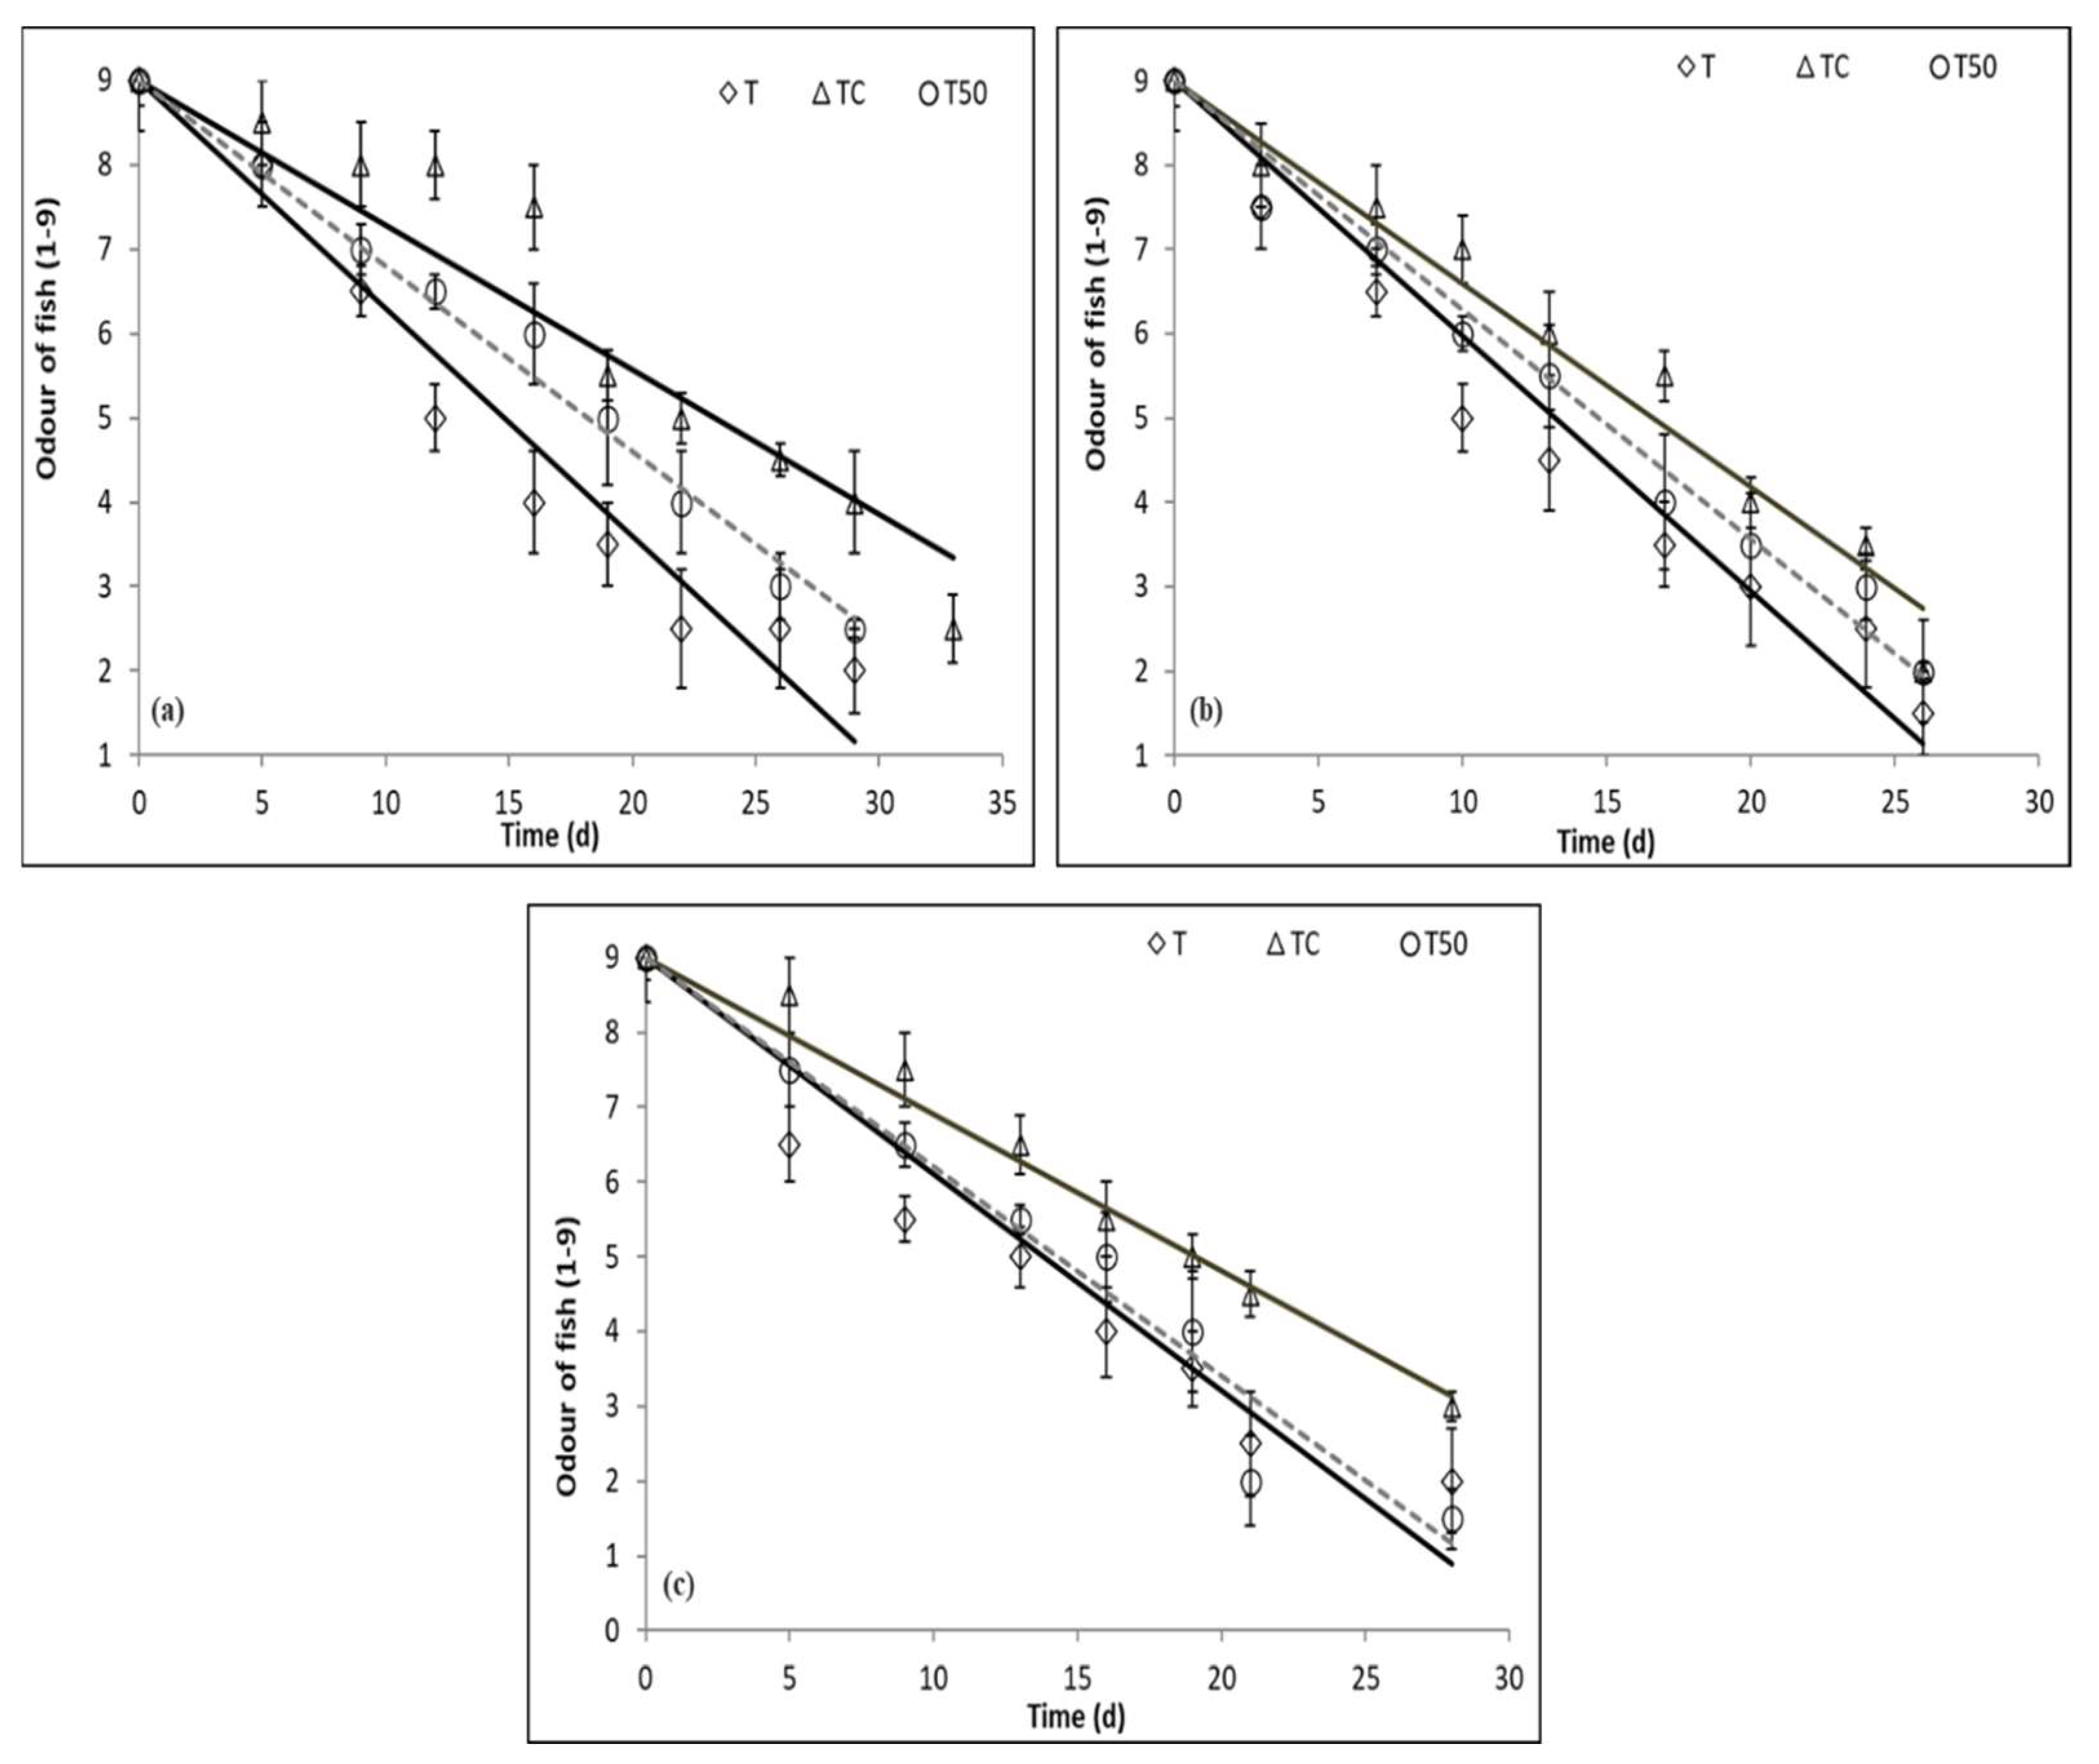
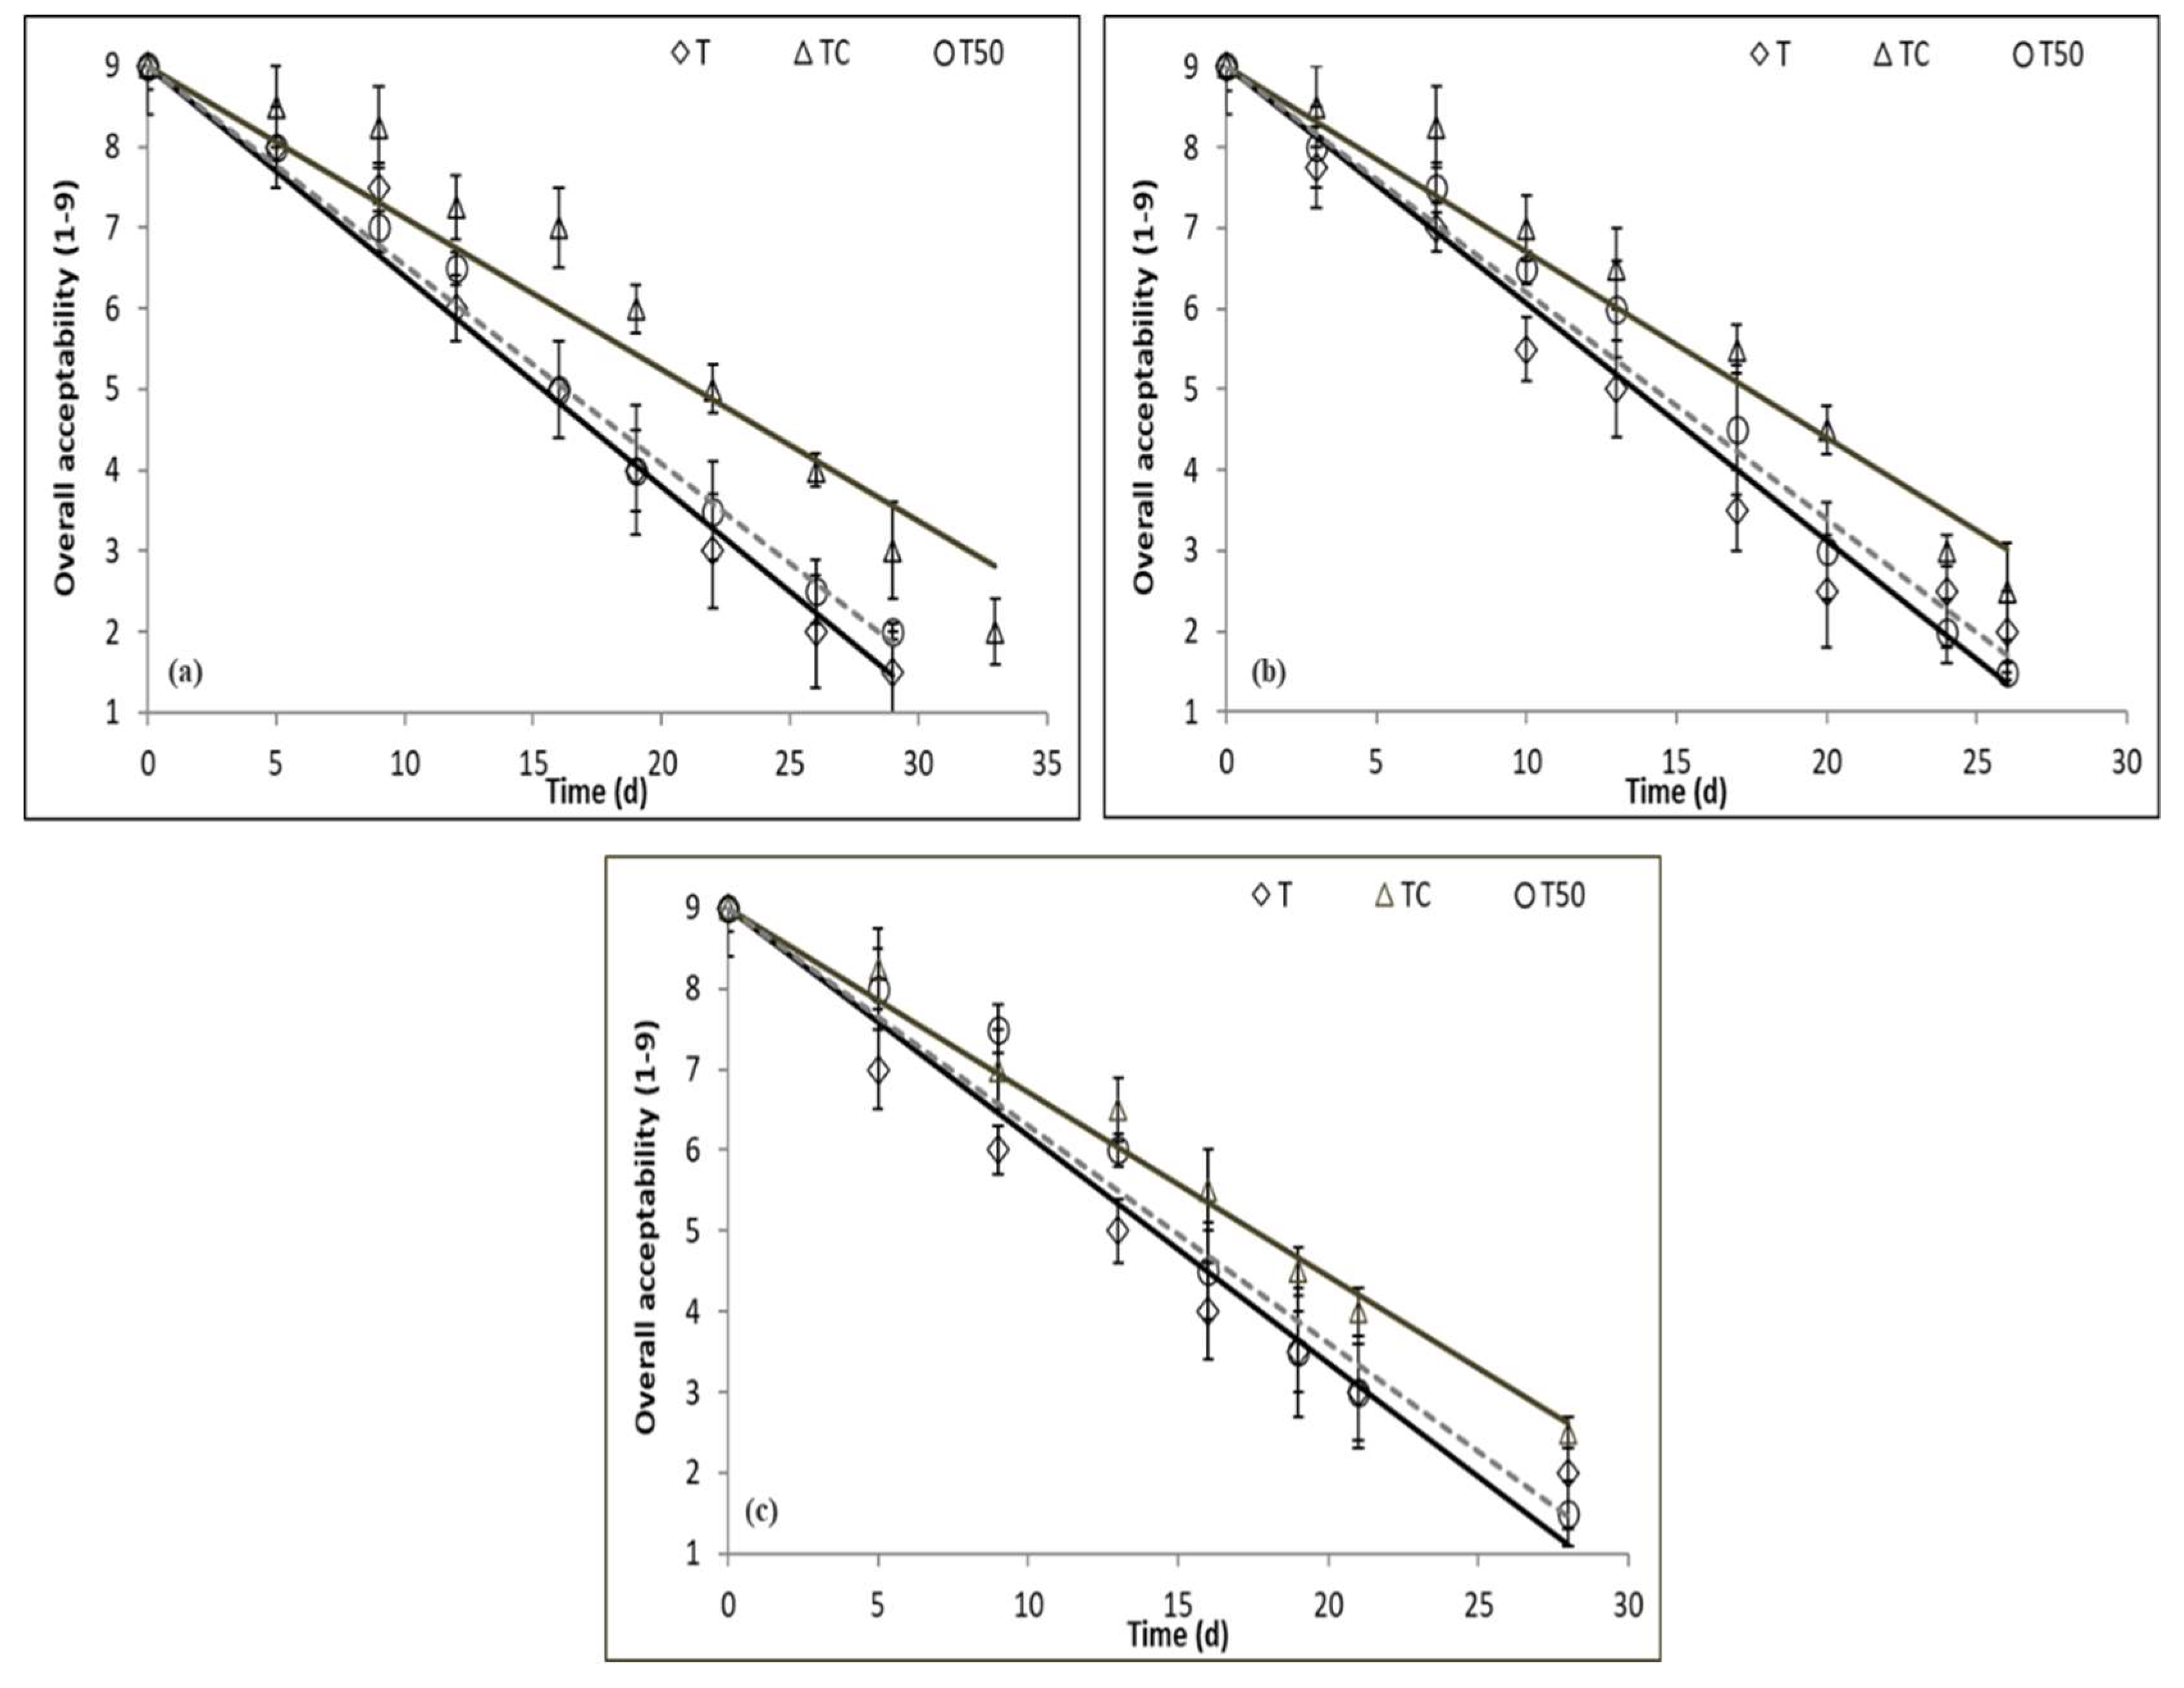
3.5. Sensory Evaluation
4. Conclusions
Author Contributions
Funding

Institutional Review Board Statement
Informed Consent Statement
Data Availability Statement
Conflicts of Interest
References
- Tavares, J.; Martins, A.; Fidalgo, L.G.; Lima, V.; Amaral, R.A.; Pinto, C.A.; Silva, A.M.; Saraiva, J.A. Fresh Fish Degradation and Advances in Preservation Using Physical Emerging Technologies. Foods 2021, 10, 780. [Google Scholar] [CrossRef] [PubMed]
- Sriket, C. Proteases in Fish and Shellfish: Role on Muscle Softening and Prevention. Int. Food Res. J. 2014, 21, 433–445. [Google Scholar]
- Pornrat, S.; Sumate, T.; Rommanee, S.; Sumolaya, K.; Kerr, W.L. Changes in the Ultrastructure and Texture of Prawn Muscle (Macrobrachuim Rosenbergii) during Cold Storage. LWT-Food Sci. Technol. 2007, 40, 1747–1754. [Google Scholar] [CrossRef]
- Delbarre-Ladrat, C.; Verrez-Bagnis, V.; Noël, J.; Fleurence, J. Relative Contribution of Calpain and Cathepsins to Protein Degradation in Muscle of Sea Bass (Dicentrarchus Labrax L.). Food Chem. 2004, 88, 389–395. [Google Scholar] [CrossRef] [Green Version]
- Chang, K.L.B.; Chang, J.; Shiau, C.Y.; Pan, B.S. Biochemical, microbiological, and sensory changes of sea bass (Lateolabrax japonicus) under partial freezing and refrigerated storage. J. Agric. Food Chem. 1998, 46, 682–686. [Google Scholar] [CrossRef] [PubMed]
- Rodríguez, O.; Barros-Velázquez, J.; Piñeiro, C.; Gallardo, J.M.; Aubourg, P. Effects of storage in slurry ice on the microbial, chemical and sensory quality and on the shelf-life of farmed turbot (Psetta maxima). Food Chem. 2006, 95, 270–278. [Google Scholar] [CrossRef] [Green Version]
- Burgaard, M.G.; Jørgensen, B.M. Effect of temperature on quality-related changes in cod (Gadus morhua) during short-and long-term frozen storage. J. Aquat. Food Prod. Technol. 2010, 19, 249–263. [Google Scholar] [CrossRef]
- Kauffeld, M.; Wang, M.J.; Goldstein, V.; Kasza, K.E. Ice slurry applications. Int. J. Refrig. 2010, 33, 1491–1505. [Google Scholar] [CrossRef] [PubMed] [Green Version]
- Ayel, V.; Lottin, O.; Peerhossaini, H. Rheology, flow behaviour and heat transfer of ice slurries: A review of the state of the art. Int. J. Refrig. 2003, 26, 95–107. [Google Scholar] [CrossRef]
- Zhao, Y.; Lan, W.; Shen, J.; Xu, Z.; Xie, J. Combining ozone and slurry ice treatment to prolong the shelf-life and quality of large yellow croaker (Pseudosciaena crocea). LWT 2022, 154, 112615. [Google Scholar] [CrossRef]
- Campos, C.A.; Losada, V.; Rodríguez, Ó.; Aubourg, S.P.; Barros-Velázquez, J. Evaluation of an ozone–slurry ice combined refrigeration system for the storage of farmed turbot (Psetta maxima). Food Chem. 2006, 97, 223–230. [Google Scholar] [CrossRef] [Green Version]
- Egolf, P.W.; Kauffeld, M. From physical properties of ice slurries to industrial ice slurry applications. Int. J. Refrig. 2005, 28, 4–12. [Google Scholar] [CrossRef]
- Huidobro, A.; Mendes, R.; Nunes, M.L. Slaughtering of gilthead seabream (Sparus aurata) in liquid ice: Influence on fish quality. Eur. Food Res. Technol. 2001, 213, 267–272. [Google Scholar] [CrossRef]
- Losada, V.; Barros-Velázquez, J.; Gallardo, J.; Aubourg, S. Effect of advanced chilling methods on liquid damage during sardine (Sardina pilchardus) storage. Eur. J. Lipid Sci. Technol. 2004, 106, 844–850. [Google Scholar] [CrossRef] [Green Version]
- Losada, V.; Piñeiro, C.; Barros-Velázquez, J.; Aubourg, S. Inhibition of chemical changes related to freshness loss during storage of horse mackerel (Trachurus trachurus) in slurry ice. Food Chem. 2005, 93, 619–625. [Google Scholar] [CrossRef] [Green Version]
- Rodríguez, O.; Losada, V.; Aubourg, S.P.; Barros-Velázquez, J. Enhanced shelf-life of chilled European hake (Merluccius merluccius) stored in slurry ice as determined by sensory analysis and assessment of microbiological activity. Food Res. Int. 2004, 37, 749–757. [Google Scholar] [CrossRef] [Green Version]
- Ntzimani, A.; Angelakopoulos, R.; Semenoglou, I.; Dermesonlouoglou, E.; Tsironi, T.; Moutou, K.; Taoukis, P. Slurry Ice as an Alternative Cooling Medium for Fish Harvesting and Transportation: Study of the Effect on Seabass Flesh Quality and Shelf-life. Aquac. Fish. 2021. In Press, Corrected Proof. [Google Scholar] [CrossRef]
- Fezzardi, D.; Massa, F.; Àvila-Zaragoza, P.; Rad, F.; Yücel-Gier, G.; Deniz, H.; Salem, M.H.A.; Hamza, H.A.; Salem, S. Ben Indicators for sustainable aquaculture in Mediterranean and Black Sea countries: Guide for the use of indicators to monitor sustainable development of aquaculture. Gen. Fish. Comm. Mediterr. Stud. Rev. 2013, 93, 1–60. [Google Scholar]
- Annamalai, J.; Lakshmi, N.M.; Sivam, V.; Chandragiri Nagaraja Rao, R. A comparative study on the quality changes of croaker (Johnius dussumieri) fish stored in slurry ice and flake ice. J. Aquat. Food Prod. Technol. 2018, 27, 508–517. [Google Scholar] [CrossRef]
- Liu, L.; Lan, W.; Pu, T.; Zhou, Y.; Xie, J. Combining slightly acidic electrolyzed water and slurry ice to prolong the shelf-life of mackerel (Pneumatophorus japonicus). J. Food Process. Preserv. 2021, 45, e15762. [Google Scholar] [CrossRef]
- Papaharisis, L.; Tsironi, T.; Dimitroglou, A.; Taoukis, P.; Pavlidis, M. Stress assessment, quality indicators and shelf-life of three aquaculture important marine fish, in relation to harvest practices, water temperature and slaughter method. Aquac. Res. 2019, 50, 2608–2620. [Google Scholar] [CrossRef]
- Carrascosa, C.; Millán, R.; Saavedra, P.; Jaber, J.R.; Raposo, A.; Pérez, E.; Montenegro, T.; Sanjuán, E. Microbiological evolution of gilthead sea bream (Sparus aurata) in Canary Islands during ice storage. J. Food Sci. Technol. 2015, 52, 1586–1593. [Google Scholar] [CrossRef] [PubMed] [Green Version]
- Grigorakis, K.; Kogiannou, D.; Genevieve, C.; Pérez-Sánchez, J.; Agnes, A.; Sándor, Z. Impact of Diets Containing Plant Raw Materials as Fish Meal and Fish Oil Replacement on Rainbow Trout (Oncorhynchus mykiss), Gilthead Sea Bream (Sparus aurata), and Common Carp (Cyprinus carpio) Freshness. J. Food Qual. 2018, 2018, 1717465. [Google Scholar]
- Tsironi, T.N.; Taoukis, P.S. Shelf-life extension of gilthead seabream fillets by osmotic treatment and antimicrobial agents. J. Appl. Microbiol. 2012, 112, 316–328. [Google Scholar] [CrossRef] [PubMed]
- FEAP (Federation of European Aquaculture Producers). European Aquaculture Production Report 2014–2019; FEAP Secretariat: Brussels, Belgium, 2020. [Google Scholar]
- EU. 95/149/EC. Fixing the Total Volatile Basic Nitrogen (TVB-N) Limit Values for Certain Categories of Fishery Products and Specifying the Analysis Methods To Be Used; ANNEX II: Determination of the concentration of volatile nitrogen bases (TVB-N) in fish and fish products: A reference procedure; European Commission: Brussel, Belgium, 1995. [Google Scholar]
- Lepage, G.; Roy, C. Improved recovery of fatty acid through direct sterification without prior extraction or purification. J. Lipid Res. 1984, 25, 1391–1396. [Google Scholar] [CrossRef]
- Bradford, M.M. A Rapid and Sensitive Method for the Quantitation of Microgram Quantities of Protein Utilizing the Principle of Protein-Dye Binding. Anal. Biochem. 1976, 72, 248–254. [Google Scholar] [CrossRef]
- ISO 8586-1; Sensory Analysis—General Guidance for the Selection, Training and Monitoring of Assessors, Part 1: Selected Assessors. International Organization for Standardization: Geneva, Switzerland, 1993.
- Botta, J.R. Evaluation of Seafood Freshness Quality; Library of Congress: Washington, DC, USA, 1995. [Google Scholar]
- Tsironi, T.; Maltezou, I.; Tsevdou, M.; Katsaros, G.; Taoukis, P. High-Pressure Cold Pasteurization of Gilthead Seabream Fillets: Selection of Process Conditions and Validation of Shelf-life Extension. Food Bioproc. Technol. 2015, 8, 681–690. [Google Scholar] [CrossRef]
- Meilgaard, M.; Civille, G.V.; Carr, B.T. Sensory Evaluation Techniques, 3rd ed.; CRC Press: Boca Raton, FL, USA, 1999; p. 387. [Google Scholar]
- Baranyi, J.; Roberts, T.A. Mathematics of predictive food microbiology. Int. J. Food Microbiol. 1995, 26, 199–218. [Google Scholar] [CrossRef] [Green Version]
- Navarro-Segura, L.; Ros-Chumillas, M.; López-Cánovas, A.E.; García-Ayala, A.; López-Gómez, A. Nanoencapsulated essential oils embedded in ice improve the quality and shelf-life of fresh whole seabream stored on ice. Heliyon 2019, 5, e01804. [Google Scholar] [CrossRef] [PubMed] [Green Version]
- Koutsoumanis, K.; Nychas, G.-J.E. Application of a systematic procedure to develop a microbial model for rapid fish shelf-life predictions. Int. J. Food Microbiol. 2000, 60, 171–184. [Google Scholar] [CrossRef]
- Tsironi, T.; Ntzimani, A.; Gogou, E.; Tsevdou, M.; Semenoglou, I.; Dermesonlouoglou, E.; Taoukis, P. Modelling the effect of active modified atmosphere packaging on the microbial stability and shelf-life of gutted sea bass. Appl. Sci. 2019, 9, 5019. [Google Scholar] [CrossRef] [Green Version]
- Lan, W.Q.; Liu, L.; Zhang, N.N.; Huang, X.; Weng, Z.M.; Xie, J. Effects of ε-polylysine and rosemary extract on the quality of large yellow croaker (Pseudosciaena crocea) stored on ice at 4 ± 1 °C. J. Food Biochem. 2020, 44, e13418. [Google Scholar] [CrossRef] [PubMed]
- Liu, J.; Lan, W.; Sun, X.; Xie, J. Effects of chitosan grafted phenolic acid coating on microbiological, physicochemical and protein changes of sea bass (Lateolabrax japonicus) during refrigerated storage. J. Food Sci. 2020, 85, 2506–2515. [Google Scholar] [CrossRef] [PubMed]
- Simeonidou, S.; Govaris, A.; Vareltzis, K. Quality assessment of seven Mediterranean fish during storage on ice. Food Res. Int. 1998, 30, 479–484. [Google Scholar] [CrossRef]
- Tejada, M.; Huidobro, A. Quality of farmed gilthead sea bream (Sparus aurata) during ice storage related to the slaughter method and gutting. Eur. Food Res. Technol. 2002, 215, 1–7. [Google Scholar] [CrossRef]
- Li, Y.; Jia, S.; Hong, H.; Zhang, L.; Zhuang, S.; Sun, X.; Liu, X.; Luo, X. Assessment of bacterial contributions to the biochemical changes of chill-stored blunt snout bream (Megalobrama amblycephala) fillets: Protein degradation and volatile organic compounds accumulation. Food Microbiol. 2020, 91, 103495. [Google Scholar] [CrossRef] [PubMed]
- Duarte, A.M.; Silva, F.; Pinto, F.R.; Barroso, S.; Gil, M.M. Quality Assessment of Chilled and Frozen Fish-Mini Review. Foods 2020, 25, 1739. [Google Scholar] [CrossRef] [PubMed]
- Zotos, A.; Vouzanidou, M. Seasonal changes in composition, fatty acid, cholesterol and mineral content of six highly commercial fish species of Greece. Food Sci. Technol. Int. 2012, 18, 139–149. [Google Scholar] [CrossRef] [PubMed]
- Yildiz, M.; Şener, E.; Timour, M. The Effects of Seasons and Different Feeds on Fatty Acid Composition in Fillets of Cultured Gilthead Sea Bream (Sparus aurata L.) and European Sea Bass (Dicentrarchus labrax L.) in Turkey. Turk. J. Vet. Anim. Sci. 2006, 30, 133–141. [Google Scholar]
- Celano, R.; Campone, L.; Piccinelli, A.L.; Acernese, F.; Nabavi, S.M.; Di Bella, G.; Rastrelli, L. Fatty acid composition, antioxidant levels and oxidation products development in the muscle tissue of Merluccius merluccius and Dicentrarchus labrax during ice storage. LWT 2016, 73, 654–662. [Google Scholar] [CrossRef]
- Caballero, M.J.; Obach, A.; Rosenlund, G.; Montero, D.; Gisvold, M.; Izquierdo, M.S. Impact of different dietary lipid sources on growth, lipid digestibility, tissue fatty acid composition and histology of rainbow trout, Oncorhynchus mykiss. Aquaculture 2002, 214, 253–271. [Google Scholar] [CrossRef]
- Grigorakis, K.; Alexis, M.N.; Taylor, K.D.A.; Hole, M. Comparison of wild and cultured gilthead sea bream (Sparus aurata); composition, appearance and seasonal variation. Int. J. Food Sci. Technol. 2002, 37, 477–484. [Google Scholar] [CrossRef]
- Bao, Y.; Wang, K.; Yang, H.; Regenstein, J.M.; Ertbjerg, P.; Zhou, P. Protein Degradation of Black Carp (Mylopharyngodon Piceus) Muscle during Cold Storage. Food Chem. 2020, 308, 125576. [Google Scholar] [CrossRef] [PubMed]
- Hernández-Herrero, M.M.; Duflos, G.; Malle, P.; Bouquelet, S. Collagenase Activity and Protein Hydrolysis as Related to Spoilage of Iced Cod (Gadus Morhua). Food Res. Int. 2003, 36, 141–147. [Google Scholar] [CrossRef]
- Lajus, L.D.; Lysenko, L.A.; Kantserova, N.P.; Tushina, E.D.; Ivanova, T.S.; Nemova, N.N. Spatial Heterogeneity and Temporal Dynamics of Protein-Degrading Activity and Life-History Traits in Threespine Stickleback Gasterosteus Aculeatus. Int. Aquat. Res. 2020, 12, 161–170. [Google Scholar]
- Caballero, M.J.; Betancor, M.; Escrig, J.C.; Montero, D.; Espinosa de los Monteros, A.; Castro, P.; Ginés, R.; Izquierdo, M. Post mortem changes produced in the muscle of sea bream (Sparus aurata) during ice storage. Aquaculture 2009, 291, 210–216. [Google Scholar] [CrossRef]
- Sáez, M.I.; Navarro, G.; García-Mesa, S.; Martínez, T.F.; García-Gallego, M.; Suárez, M.D. Influence of pre-slaughtering feed restriction on muscle characteristics of farmed sea bass (Dicentrarchus labrax L.) during cold storage. J. Sci. Food Agric. 2013, 93, 2323–2330. [Google Scholar] [CrossRef] [PubMed]
- Salmerón, C.; Navarro, I.; Johnston, I.A.; Gutiérrez, J.; Capilla, E. Characterisation and expression analysis of cathepsins and ubiquitin-proteasome genes in gilthead sea bream (Sparus aurata) skeletal muscle. BMC Res. Notes 2015, 8, 149. [Google Scholar] [CrossRef] [PubMed] [Green Version]
- Chéret, R.; Delbarre-Ladrat, C.; de Lamballerie-Anton, M.; Verrez-Bagnis, V. Calpain and cathepsin activities in post mortem fish and meat muscles. Food Chem. 2007, 101, 1474–1479. [Google Scholar] [CrossRef] [Green Version]
- Goll, D.E.; Thompson, V.F.; Li, H.; Wei, W.; Cong, J. The Calpain System. Physiol. Rev. 2003, 83, 731–801. [Google Scholar] [CrossRef] [PubMed]
- Johnston, I.A.; Bower, N.O.; Macqueen, D.J. Growth and the Regulation of Myotomal Muscle Mass in Teleost Fish. J. Exp. Biol. 2011, 214, 1617–1628. [Google Scholar] [CrossRef] [PubMed] [Green Version]
- Overturf, K.; Gaylord, T.G. Determination of Relative Protein Degradation Activity at Different Life Stages in Rainbow Trout (Oncorhynchus Mykiss). Comp. Biochem. Physiol. Part B Biochem. Mol. Biol. 2009, 152, 150–160. [Google Scholar] [CrossRef] [PubMed]
- Nemova, N.N.; Lysenko, L.A.; Kantserova, N.P. Degradation of Skeletal Muscle Protein during Growth and Development of Salmonid Fish. Russ. J. Dev. Biol. 2016, 47, 161–172. [Google Scholar] [CrossRef]
- Guderley, H.; St-Pierre, J. Going with the Flow or Life in the Fast Lane: Contrasting Mitochondrial Responses to Thermal Change. J. Exp. Biol. 2002, 205, 2237–2249. [Google Scholar] [CrossRef] [PubMed]
- Hisar, O.; Yanik, T.; Kocaman, E.M.; Arslan, M.; Slukvin, A.; Goncharova, R. Effects of Diludine Supplementation on Growth Performance, Liver Antioxidant Enzyme Activities and Muscular Trace Elements of Rainbow Trout (Oncorhynchus Mykiss) Juveniles at a Low Water Temperature. Aquac. Nutr. 2012, 18, 211–219. [Google Scholar] [CrossRef]
- Cai, L.Y.; Hu, Y.; Liu, X.; Jiang, H.; Yang, S.; Shao, Z.; Xia, Y.; Xiong, L. ROS-Mediated Lysosomal Membrane Permeabilization Is Involved in Bupivacaine-Induced Death of Rabbit Intervertebral Disc Cells. Redox Biol. 2018, 18, 65–76. [Google Scholar] [CrossRef] [PubMed]
- Piñeiro, C.; Barros-Velazquez, J.; Auboug, S.P. Effects of newer slurry ice systems on the quality of aquatic food products. Trends Food Sci. Technol. 2004, 15, 575–582. [Google Scholar] [CrossRef]
- Chen, J.; Huang, J.; Deng, S.; Huang, Y. Combining ozone and slurry ice to maximize shelf-life and quality of bighead croaker (Collichthys niveatus). J. Food Sci. Technol. 2016, 53, 3651–3660. [Google Scholar] [CrossRef] [PubMed] [Green Version]
- Rodríguez, O.; Losada, V.; Aubourg, S.P.; Barros-Velázquez, J. Sensory, microbial and chemical effects of a slurry ice system on horse mackerel (Trachurus trachurus). Sci. Food Agric. 2005, 85, 235–242. [Google Scholar] [CrossRef] [Green Version]
- Campos, C.A.; Rodruqiez, O.; Losada, V.; Aubourg, S.P.; Barros-Velázquez, J. Effects of storage in ozonised slurry ice on the sensory and microbial quality of sardine. Int. J. Food Microbiol. 2005, 103, 121–130. [Google Scholar] [CrossRef] [PubMed] [Green Version]
- Cakli, S.; Kilinc, B.; Cadun, A.; Tolasa, S. Effects of using slurry ice on the microbiological, chemical and sensory assessments of aquacultured sea bass (Dicentrarchus labrax) stored at 4 °C. Eur. Food Res. Technol. 2006, 222, 130–138. [Google Scholar] [CrossRef]


Publisher’s Note: MDPI stays neutral with regard to jurisdictional claims in published maps and institutional affiliations. |
© 2022 by the authors. Licensee MDPI, Basel, Switzerland. This article is an open access article distributed under the terms and conditions of the Creative Commons Attribution (CC BY) license (https://creativecommons.org/licenses/by/4.0/).
Share and Cite
Ntzimani, A.; Angelakopoulos, R.; Stavropoulou, N.; Semenoglou, I.; Dermesonlouoglou, E.; Tsironi, T.; Moutou, K.; Taoukis, P. Seasonal Pattern of the Effect of Slurry Ice during Catching and Transportation on Quality and Shelf Life of Gilthead Sea Bream. J. Mar. Sci. Eng. 2022, 10, 443. https://doi.org/10.3390/jmse10030443
Ntzimani A, Angelakopoulos R, Stavropoulou N, Semenoglou I, Dermesonlouoglou E, Tsironi T, Moutou K, Taoukis P. Seasonal Pattern of the Effect of Slurry Ice during Catching and Transportation on Quality and Shelf Life of Gilthead Sea Bream. Journal of Marine Science and Engineering. 2022; 10(3):443. https://doi.org/10.3390/jmse10030443
Chicago/Turabian StyleNtzimani, Athina, Rafael Angelakopoulos, Natalia Stavropoulou, Ioanna Semenoglou, Efimia Dermesonlouoglou, Theofania Tsironi, Katerina Moutou, and Petros Taoukis. 2022. "Seasonal Pattern of the Effect of Slurry Ice during Catching and Transportation on Quality and Shelf Life of Gilthead Sea Bream" Journal of Marine Science and Engineering 10, no. 3: 443. https://doi.org/10.3390/jmse10030443