Article

Growth Heterogeneity of Chub Mackerel (Scomber japonicus) in the Northwest Pacific Ocean

1
College of Marine Sciences, Shanghai Ocean University, Shanghai 201306, China
2
National Engineering Research Center for Oceanic Fisheries, Shanghai 201306, China
3
Key Laboratory of Sustainable Exploitation of Oceanic Fisheries Resources, Ministry of Education, Shanghai 201306, China
4
Zhejiang Mariculture Research Institute, Wenzhou 325005, China
*
Author to whom correspondence should be addressed.
J. Mar. Sci. Eng. 2022, 10(2), 301; https://doi.org/10.3390/jmse10020301
Submission received: 25 December 2021 / Revised: 14 February 2022 / Accepted: 18 February 2022 / Published: 21 February 2022
(This article belongs to the Special Issue Marine Fish and Invertebrate Aquaculture)

Abstract

:
Chub mackerel (Scomber japonicus) is a pelagic fish widely distributed in temperate and subtropical zones throughout the Indian and Pacific Oceans and is commercially exploited, particularly in the North Pacific. Although highly targeted in this region, little is known about their life history aspects. The objectives of this study are to evaluate the growth heterogeneities and ageing analysis of this species. We describe the length-at-age, weight-at-length, relative condition factor relationships, spatiotemporal heterogeneity and compare estimated growth parameter values to those reported from other regions. This study used data obtained from Chinese fishing vessels collected from 2016–2020 in the northwest Pacific Ocean. Length-weight data from 2686 specimens (40–294 mm, fork length; 0.8–311.8 g body weight) were analyzed, and the Length-weight relationship was W = (1.41 × 10⁻⁶) × FL3.37. Seven linear mixed-effects models (LMEM) were used to analyze the heterogeneity of length-weight relationships of Chub mackerel. The Length-weight relationships for Chub mackerel were best described by a model with random effects with both year and season (spring, summer, autumn) with the scalar parameter a. Age estimates were obtained from 175 specimens, and the length-at-estimated ages relationship was described using three non-linear candidate growth models. The von Bertalanffy growth model fit the data best for Chub mackerel in the northwest Pacific Ocean. Comparing the results to that of previous studies, we observed that individual Chub mackerel exhibited a slower growth rate than that observed in previous studies. In addition, relative condition factors varied among years, seasons, and regions. Information presented in this study provides an effective scientific basis for stock assessment and fishery management of Chub mackerel in the northwest Pacific Ocean.

1. Introduction

Chub mackerel (Scomber japonicus), a pelagic migratory fish, is widely distributed in the Indian Ocean and the Pacific Ocean [1]. It is an important target species in China’s coastal area and pelagic fisheries, and the main operation methods are purse seine and pelagic trawl. The current study on the fishery biology of Chub mackerel mainly focuses on stock structure [2,3], reproduction [1,4], and mortality rates [5,6]. Age–growth relationships are one of the most important parameters in understanding fish life history and population dynamics [7,8,9,10,11,12]. Past studies have reported that Chub mackerels’ growth is influenced by recruitment and environmental variables, and their growth is not significantly different between sexes [13]. The cause of Chub mackerels’ distribution expansion far offshore may be as a result of lower water temperatures and the poor condition of feeding grounds, which may as well affect its growth. The growth of this species has been examined, including the effect of competition with the Pacific sardine [6,13].
As a highly migratory fish, Chub mackerel in China’s coastal area and the high seas of the northwest Pacific Ocean belongs to the same population. The lack of research with the aim to implement management measures on the Chub mackerel population in the high seas off the northwest Pacific Ocean may not only directly affect the interests of countries’ pelagic fisheries but also indirectly affect the status of Chub mackerel stocks in the coastal waters opened to the northwest Pacific Ocean. There are few studies on Chub mackerel fishery in the high seas of China off the northwest Pacific Ocean; however, to date, no updated research on age and growth directly related to Chub mackerel in Chinese waters has been published [11,12,14]. Meanwhile, still in east Asia, Japanese scholars have done some studies based on their surveys in the offshore and distant waters off the Japanese coasts [15,16,17]. Studies on the age characteristics of Chub mackerel in this region are still very limited. The longevity for this species was estimated at 7 or 8 years old using age composition data from catch [18]. In recent years, catches of Chub mackerel specimens of age 6 and above have been very rare, probably indicating a decline in captures mostly due to overfishing. However, understanding the age and growth characteristics of Chub mackerel in waters off the northwest Pacific would elucidate the life history of this important fish and help guide its management and conservation.
In order to more comprehensively evaluate the age and growth of Chub mackerel in the offshore and high seas of the northwest Pacific, this paper analyzes the relationship between the fork length and weight and the relationship between fork length and otolith-derived age estimates using a suite of non-linear growth models, relative condition factors, and spatiotemporal distribution characteristics based on years of fishery production and resource survey data. Furthermore, using otoliths, age classes are analyzed, and results are compared between regions. The overall aim of the present work is to provide basic information for more rational conservation and management of Chub mackerel resources.

2. Materials and Methods

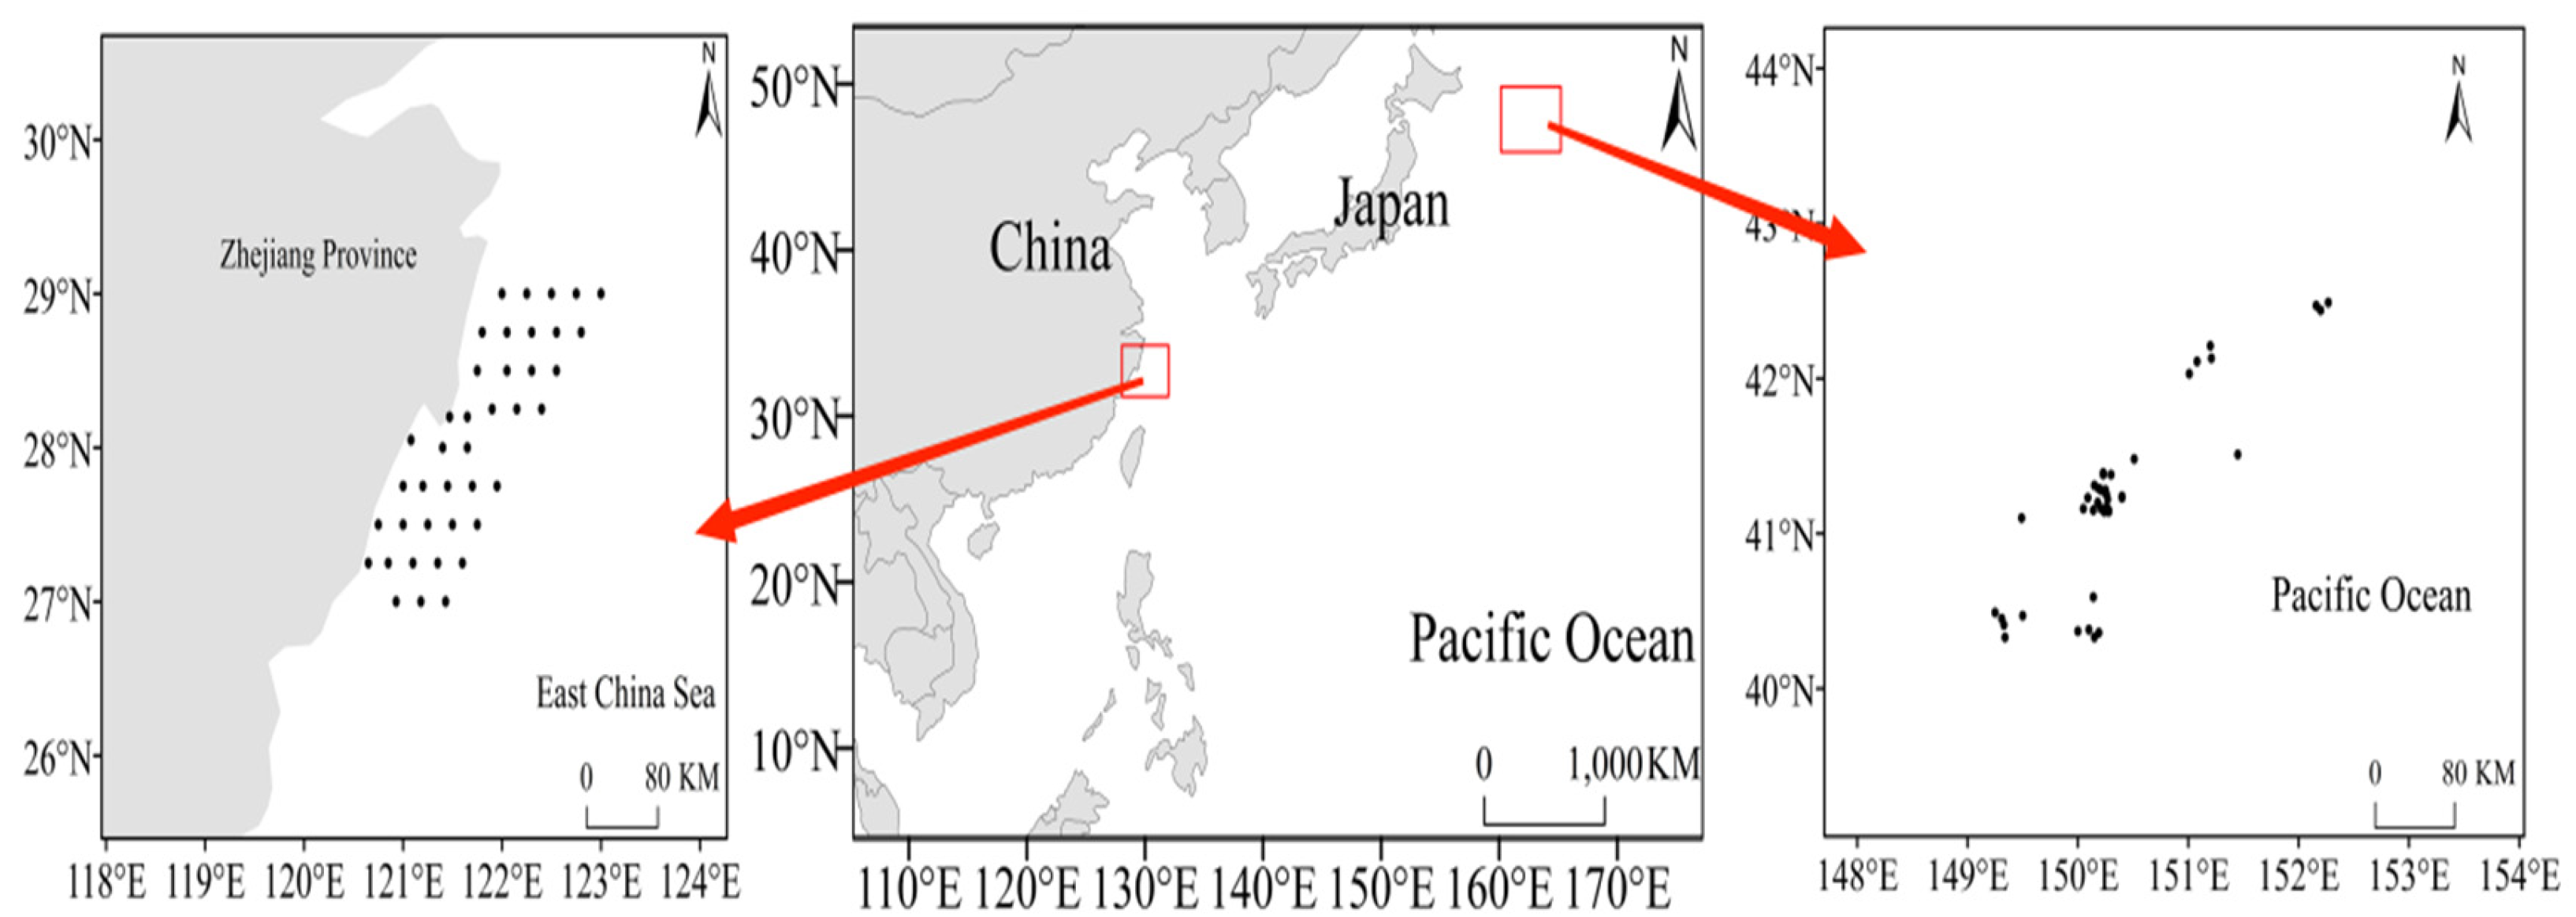
2.1. Data Collection

Chub mackerel samples were collected by a resource survey in the Zhejiang coastal area and a fishery production survey in the high seas near Japan (Figure 1). Four seasonal surveys (May, August, Nov., Feb.) were conducted annually from 2016–2020 in the Zhejiang coastal area. The sampling vessel used was an offshore, single-vessel bottom trawler with 800 t gross registered ton and 403 kW main engine power, and the bottom trawl used for sampling had a net total length of 95 m, an upper outline of 100 m, bottom outline and floating sub-outline of 80 m, a width of 40 m, a height of 7.5 m, and cod-end mesh size of 2 cm. One tow was performed at each station at a speed of 3 nm/h for 60 min.
High seas samples were collected by the fishery production survey in June, July, and September 2020 onboard the vessel “Fu yuan yu 601,” a light-loaded fishing vessel with a total length of 58.35 m, a width of 9.8 m, a depth of 4.2 m, and a tonnage of 875 t. The perimeter of the network port was 280 m, the cod-end mesh size was 38 mm, and a working depth was 60 m. One tow was performed at each station at a speed of 1.5 nm/h for 60 min (Table 1).

2.2. Ageing Analysis

The collected Chub mackerel samples were brought to the laboratory for biological determination in accordance with the “Regulations for Marine Survey” (GB/T 12763.6-2007) [19]. The fork length (FL) was measured to the nearest mm and the weight (W) to the nearest gram. Sagittal otoliths of specimens collected from the high seas were extracted, cleaned of surface organic residues, and stored in plastic tubes filled with 75% ethanol. Otoliths were grouped by 10-mm intervals, and twenty samples were selected from each length group. All samples were used for a group if there were less than twenty. Some difficulties observed were the non-availability of otoliths from small individuals; hence, in our divided 12 groups lengths, the forked length group (172.9–182.9 mm) had no otoliths collected; thus, there were 11 individual-length groups left for age determination. Twenty samples were randomly selected from each body length group if the body length group had less than 20 samples. The left otolith was used whenever possible to avoid variations in distance from the core to the edge of the translucent zone that might be observed between the left and right otoliths. Selected otoliths were wiped dry with alcohol, placed in plastic molds, and fixed with resin. After 24 h, when the resin was completely solidified, the excess mold and resin parts were excised with a thin saw and polished into thin mold slices of 0.5-mm diameter using 150, 600, 1200, and 2000 mm grit-size, water-resistant sandpaper. Otolith sections were continuously placed on slides during the polishing process and observed through an Olympus microscope (SZX 23) under reflected light at 100× magnification. Broad opaque and narrow translucent zones appeared alternately on the otolith surface; however, only translucent zones that encircled the otolith were considered as true zones and enumerated.
A total of 175 Chub mackerel were aged. The criteria for age determination for this species in this study followed the process from past Chub mackerel age analysis, which stated that a translucent and all-opaque ring (summer growth zone) is deposited on the otolith every year [11,12,20]. Each otolith was read by two readers. When differences in age readings occurred, the otolith readings were discussed and repeated or rejected by the two readers [21].

2.3. Fork Length-Weight Relationship

The Length-weight relationship can be expressed as [7]:
W = a F L b
where W is the wet weight of an individual fish (g), FL is the standard fork length (mm), a is the scaling parameter, and b is the allometric growth parameter. Because the variance of W increases when FL increases, the above equation was log-transformed, and the equation became:
l n ( W ) = l n ( a ) + b * l n ( FL )
In this paper, a generalized linear model (GLM) and a linear mixed-effects model (LMEM) were used to describe the relationship between the fork length and weight of Chub mackerel. Seven LMEMs used years, seasons (spring, summer, and autumn), and regions (Zhejiang coastal area and high seas near Japan) as the random effects of the conditional factor a to illustrate the spatiotemporal heterogeneity of the Length-weight relationship of Chub mackerel (Table 2).

2.4. Condition Factors

Condition factor (K) was calculated for each individual [22]:
K = W a FL b
where W and FL are the observed weight and fork length data, respectively, and parameters a and b are the Chub mackerel’s weight–length relationship parameters. In this paper, the parameters of the weight–length relationship of Chub mackerel from the 1960s to the present date in the northwest Pacific Ocean were investigated to analyze its relative condition factors (Table 3). The relative condition factors can be used to reflect the time change of individual growth characteristics and indirectly reflect the change of environment and resources.

2.5. Growth Models

We described the age–length relationship of Chub mackerel in the northwest Pacific Ocean by estimating growth parameters using three different nonlinear models: von Bertalanffy, logistic, and Gompertz.
The von Bertalanffy growth equation used here is a growth equation that replaces the original estimate of t0 (theoretical age at which the expected length is zero) by estimating L0 [24,25] as shown below:
L t = L ( L L 0 ) × e ( k t )
Both the logistic growth equation and the Gompertz growth equation used L0 to fit the relevant growth parameters [24,26] as follows:
L t = L L 0 e ( k t ) L + L 0 ( e ( k t ) 1 )
L t = L e ( L 0 e ( k t ) )
where Lt is the fork length at age t, L is the maximum attainable fork length, k is the growth coefficient measuring the rate at which the maximum size is approached, and L0 is the size at birth.
The fork Length-age data were extracted from the mean fork length data at each age by the bootstrap method. Specimens of the same age were sampled using 500 (resampling approach) put-backs, and the mean fork length of each age was calculated for each sample taken, thus obtaining 500 mean fork length data for each age, which were later used to fit the growth equation.
Given that most specimens collected from coastal waters of Zhejiang were of smaller sizes, complicating the determination of annual rings, we opted to use length frequency data to plot length-at-age data for specimens from this region. Therefore, the ELEFAN I (Electronic Length Frequency Analysis) method in the software FiSAT II (Version 1.2.2, Roma, Italy, accessed on 21 June 2021) was used to fit the growth parameters (L and k) of the Chub mackerel samples collected in the Zhejiang coastal waters since sufficient otoliths were not obtained from the samples [27,28].

2.6. Model Comparison

The Akaike Information Criterion (AIC) and Root Mean Squared Error (RMSE) values are used to compare the performance of different linear mixed-effects models. The AIC was estimated using
AIC = 2 p 2 M N
where p is the number of parameters in the model, N is the number of samples, M is the likelihood function, and the smaller the AIC value, the better the fit of the model.
The RMSE was calculated using the following formula:
RMSE = i = 1 N ( ŷ i y i ) 2 N
where ŷ is the fitted value, and y is the observed value. The smaller the RMSE value, the smaller the deviation between the fitted value and the observed value, and the better the fitting result of the model. In addition, the fitting effects of different non-linear growth equations describing the length-at-age relationship were compared using AIC and Bayesian Information Criterion (BIC). The BIC is calculated as
BIC = p ln ( N ) 2 ln ( M )
where p is the number of model parameters, N is the number of samples, and M is the likelihood functions. The smaller the BIC value, the better the fitting effect of the model; hence, this model was selected as the “best” candidate model for having the greatest predictive capability.
An age–length key (ALK) was computed using FSA and FSAdata packages in R. The ALK was used to identify age composition for the entire examined samples by assigning age estimates to individuals based on length measurements. The data statistics in this work were constructed and analyzed through the “lme4”, “Matrix”, “nlme”, “Metrics”, “rjstat”, and “FSA” packages in the R language software (Version 4.0.3, accessed on 19 July 2021) [29,30,31].

3. Results

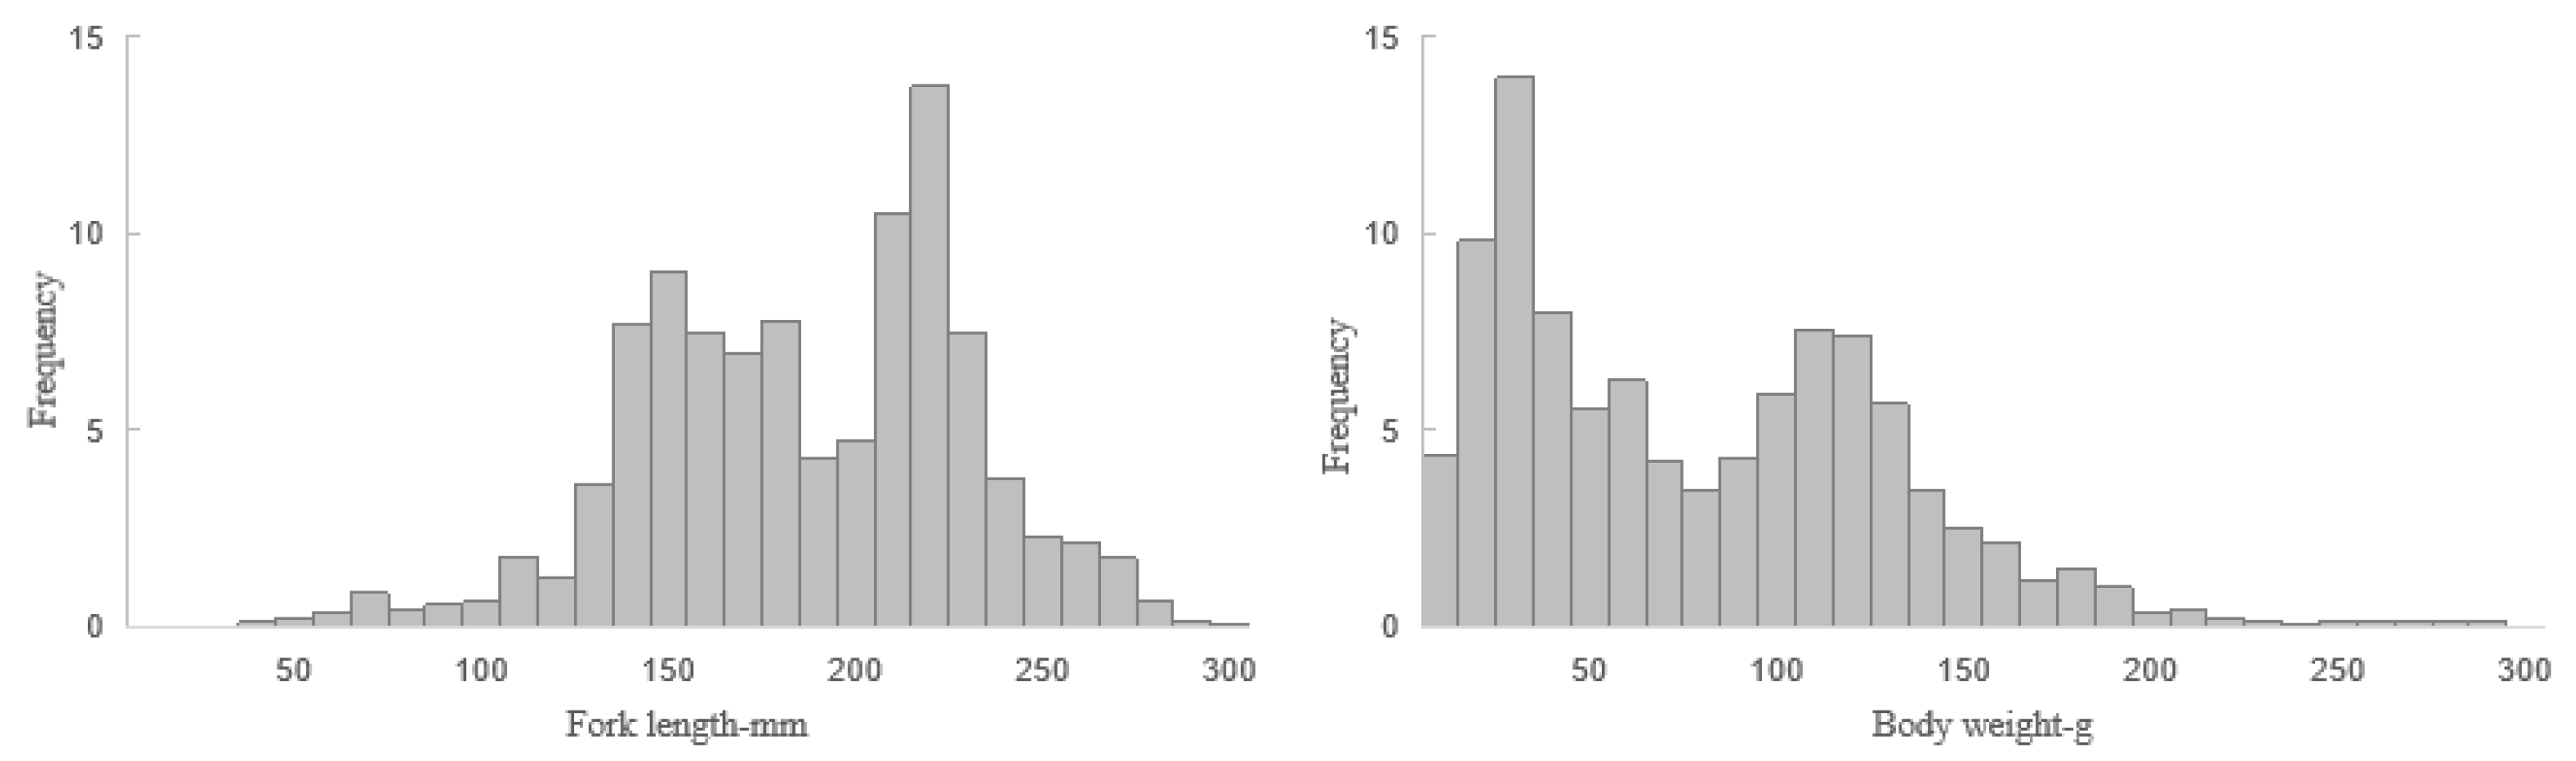
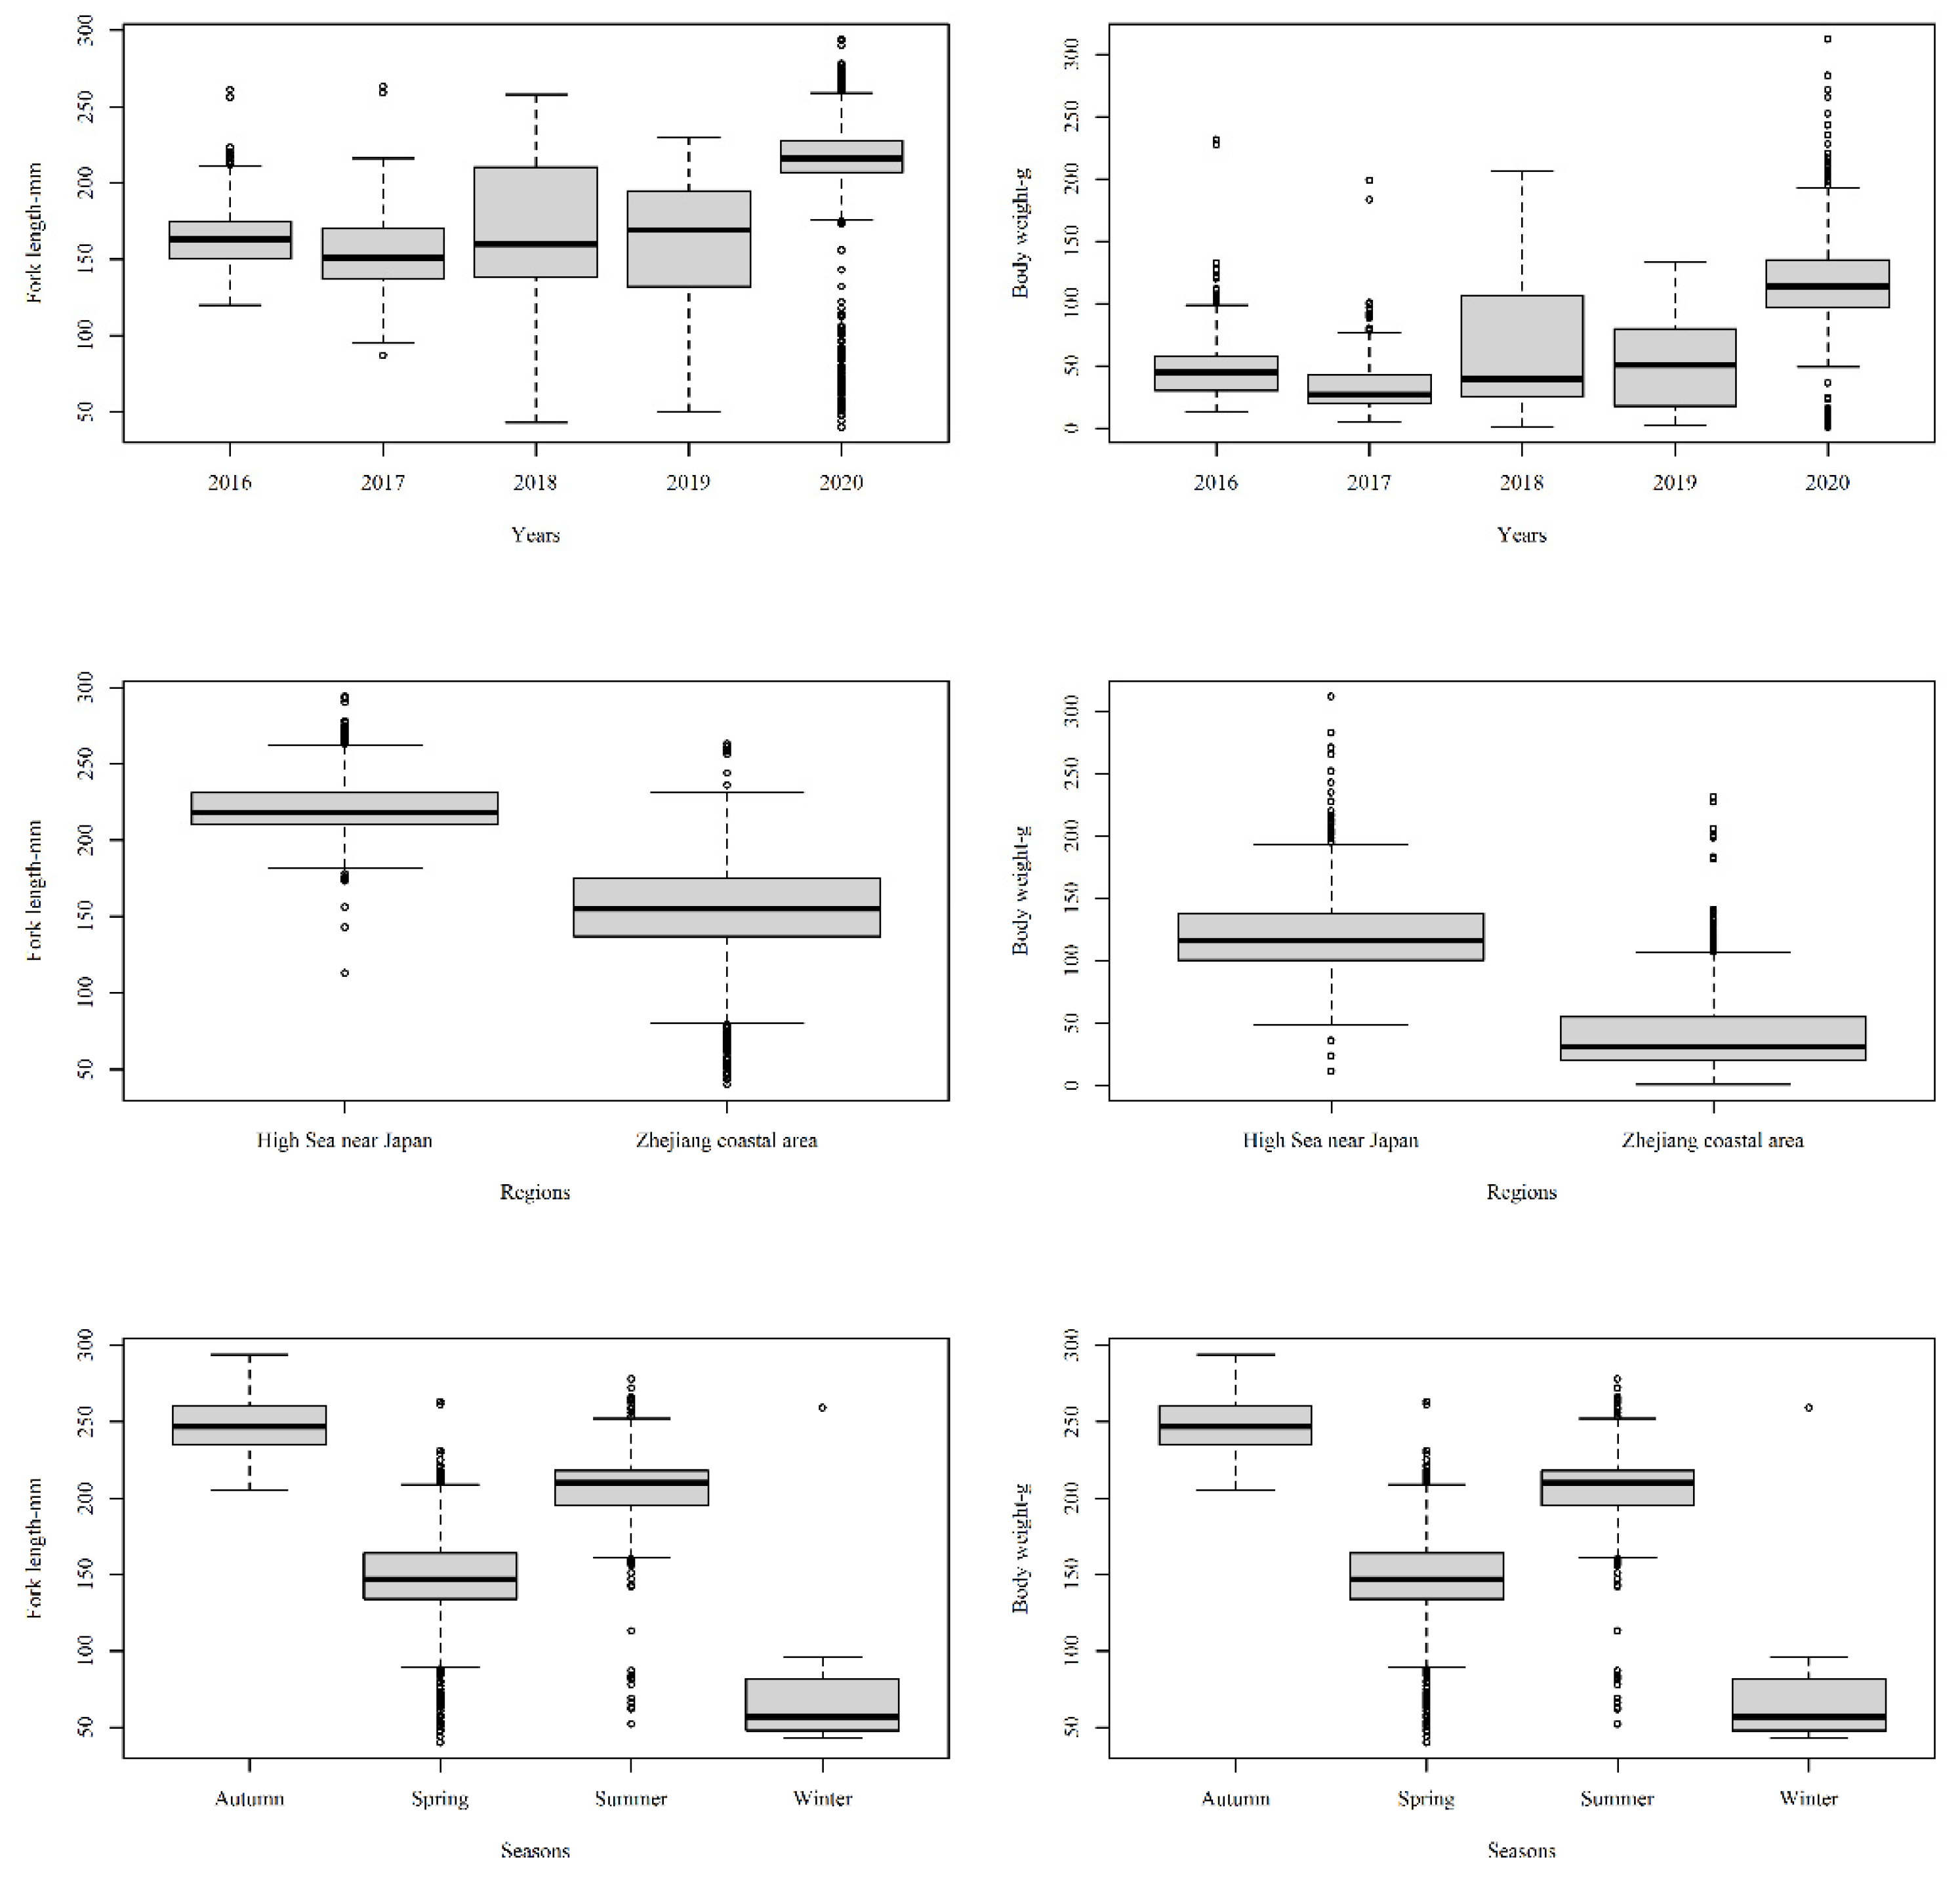
3.1. Fork Length and Weight Distribution of Chub Mackerel

All 2686 Chub mackerel samples specimens collected had fork lengths ranging from 40 to 294 mm, with an average fork length of 181.91 mm, and the dominant fork length group was 210–220 mm. Body weights ranged from 0.8 to 311.8 g, with an average weight of 73.27 g and 20–30 g in the dominant group (Figure 2).
The fork length and weight distribution of Chub mackerel collected in different years, seasons, and regions showed some differences, with fork length and weight significantly greater in 2020 than in other years, and the median fork length of Chub mackerel in the high seas near Japan (220 mm) was much higher than that of specimens collected in the Zhejiang coastal area (150 mm). The fork length and weight of mackerel samples were higher during autumn, followed by summer (Figure 3).

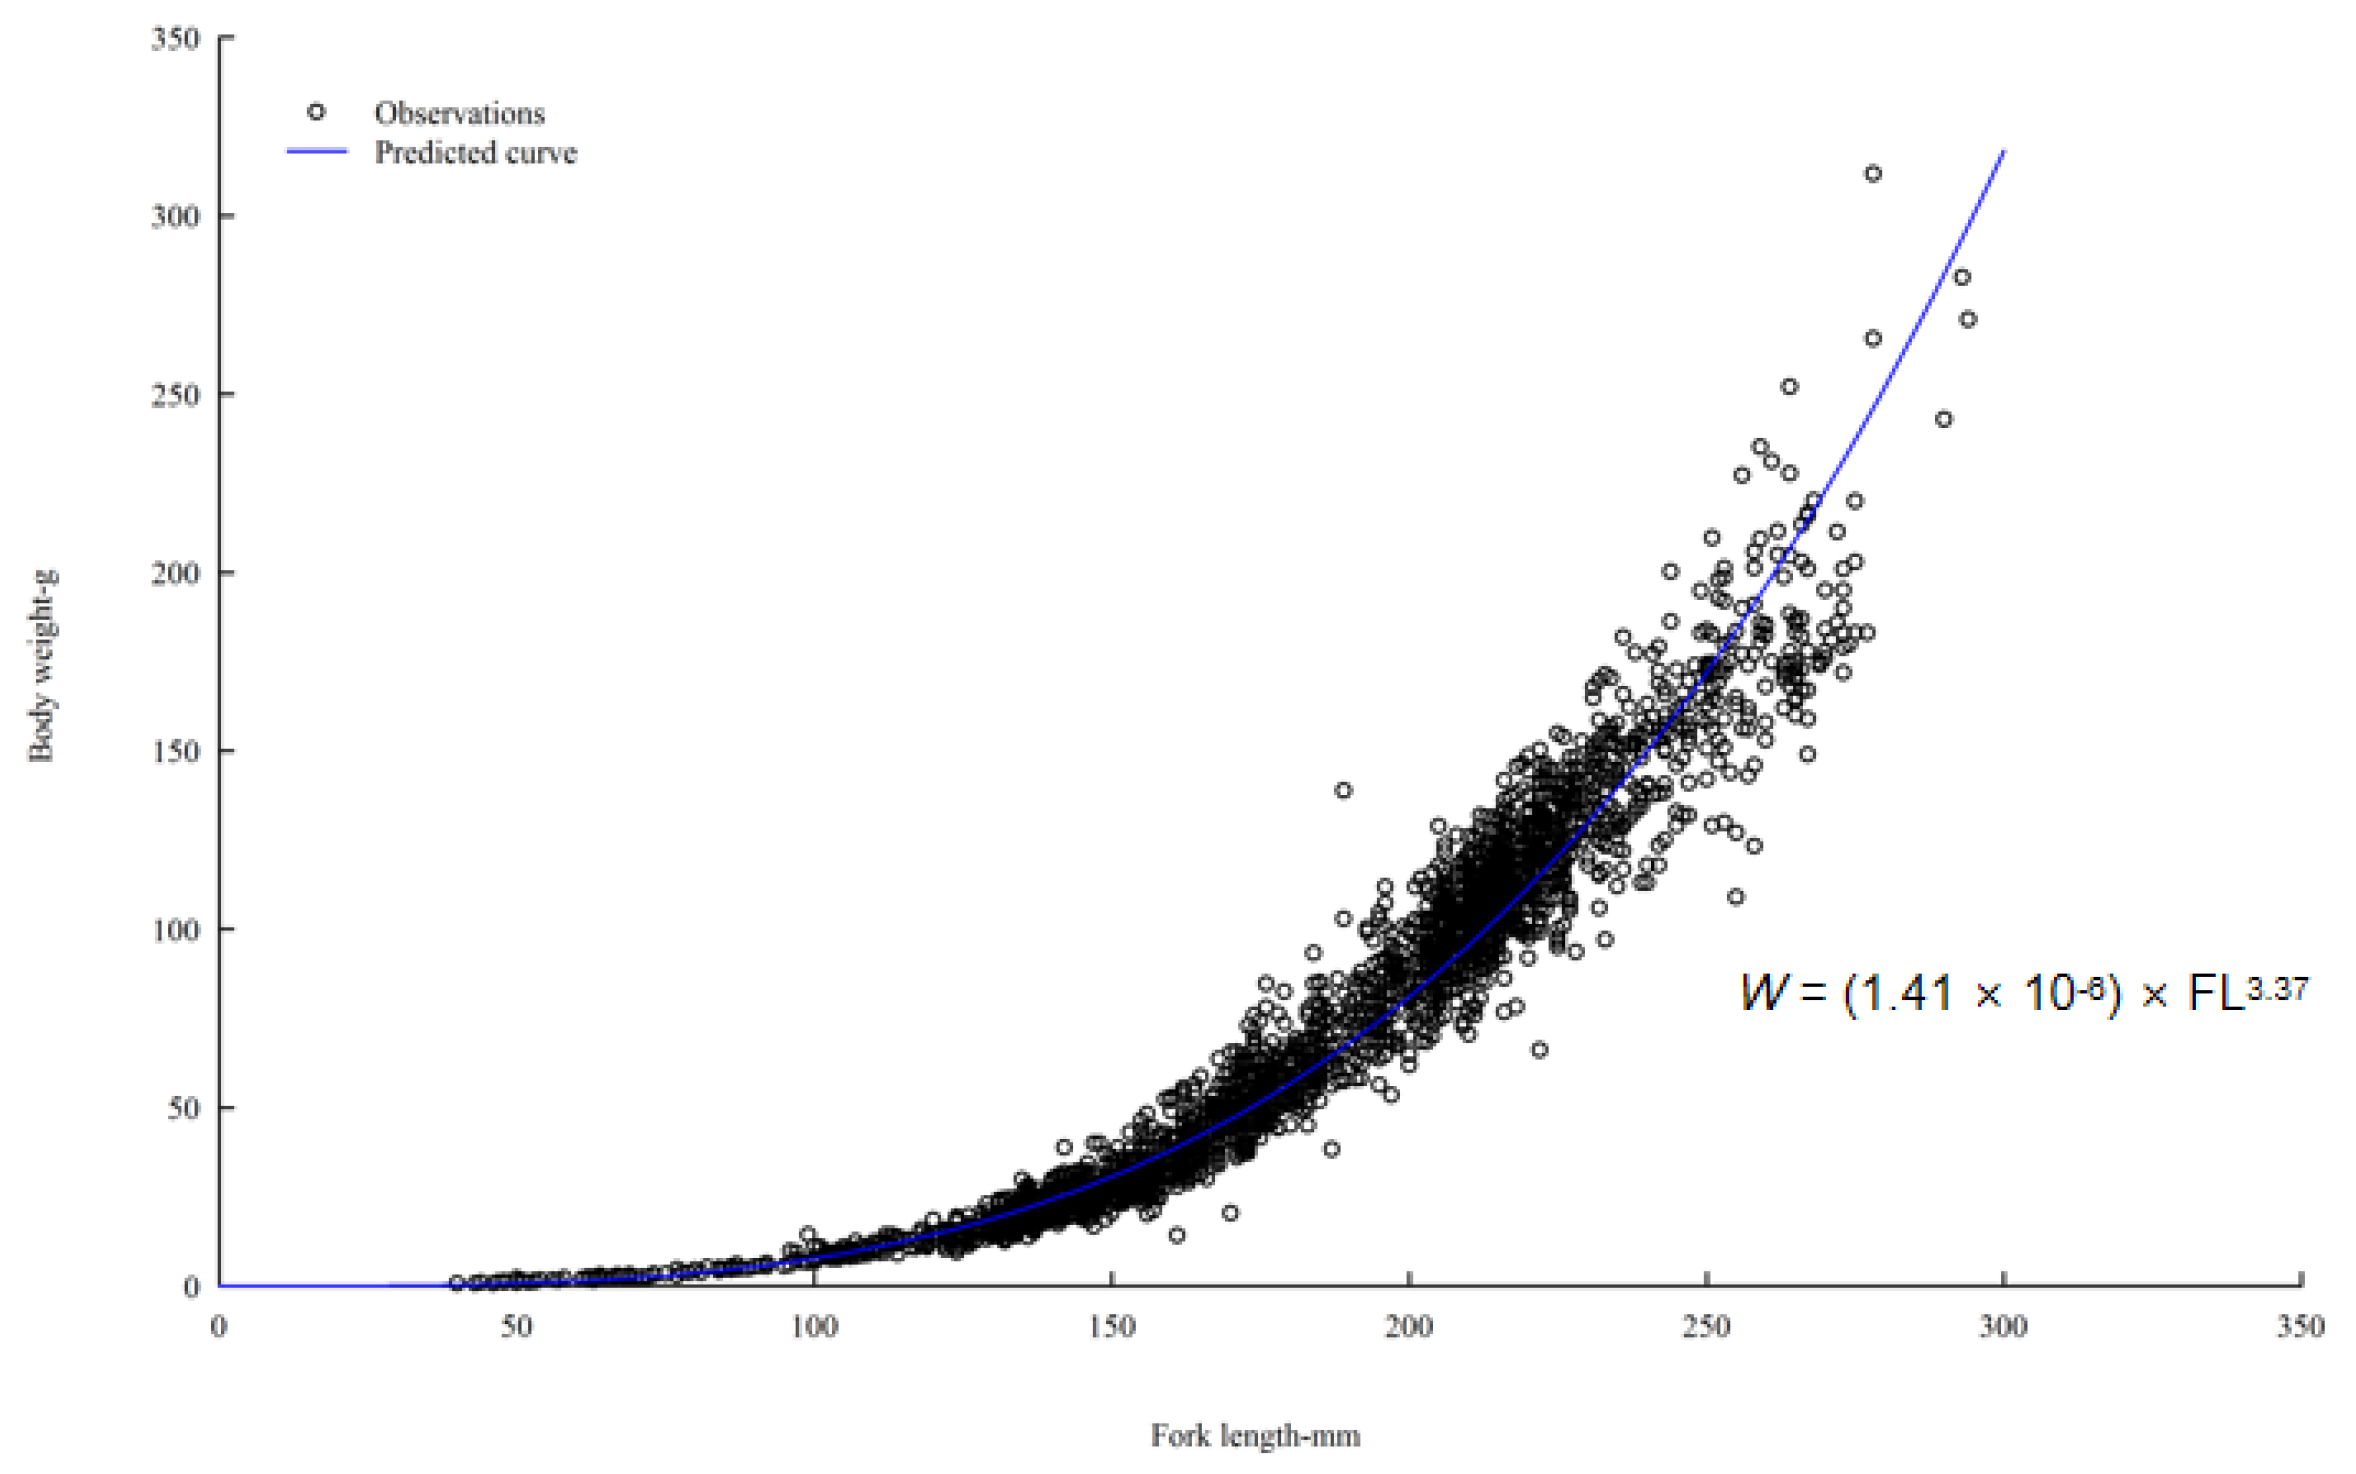
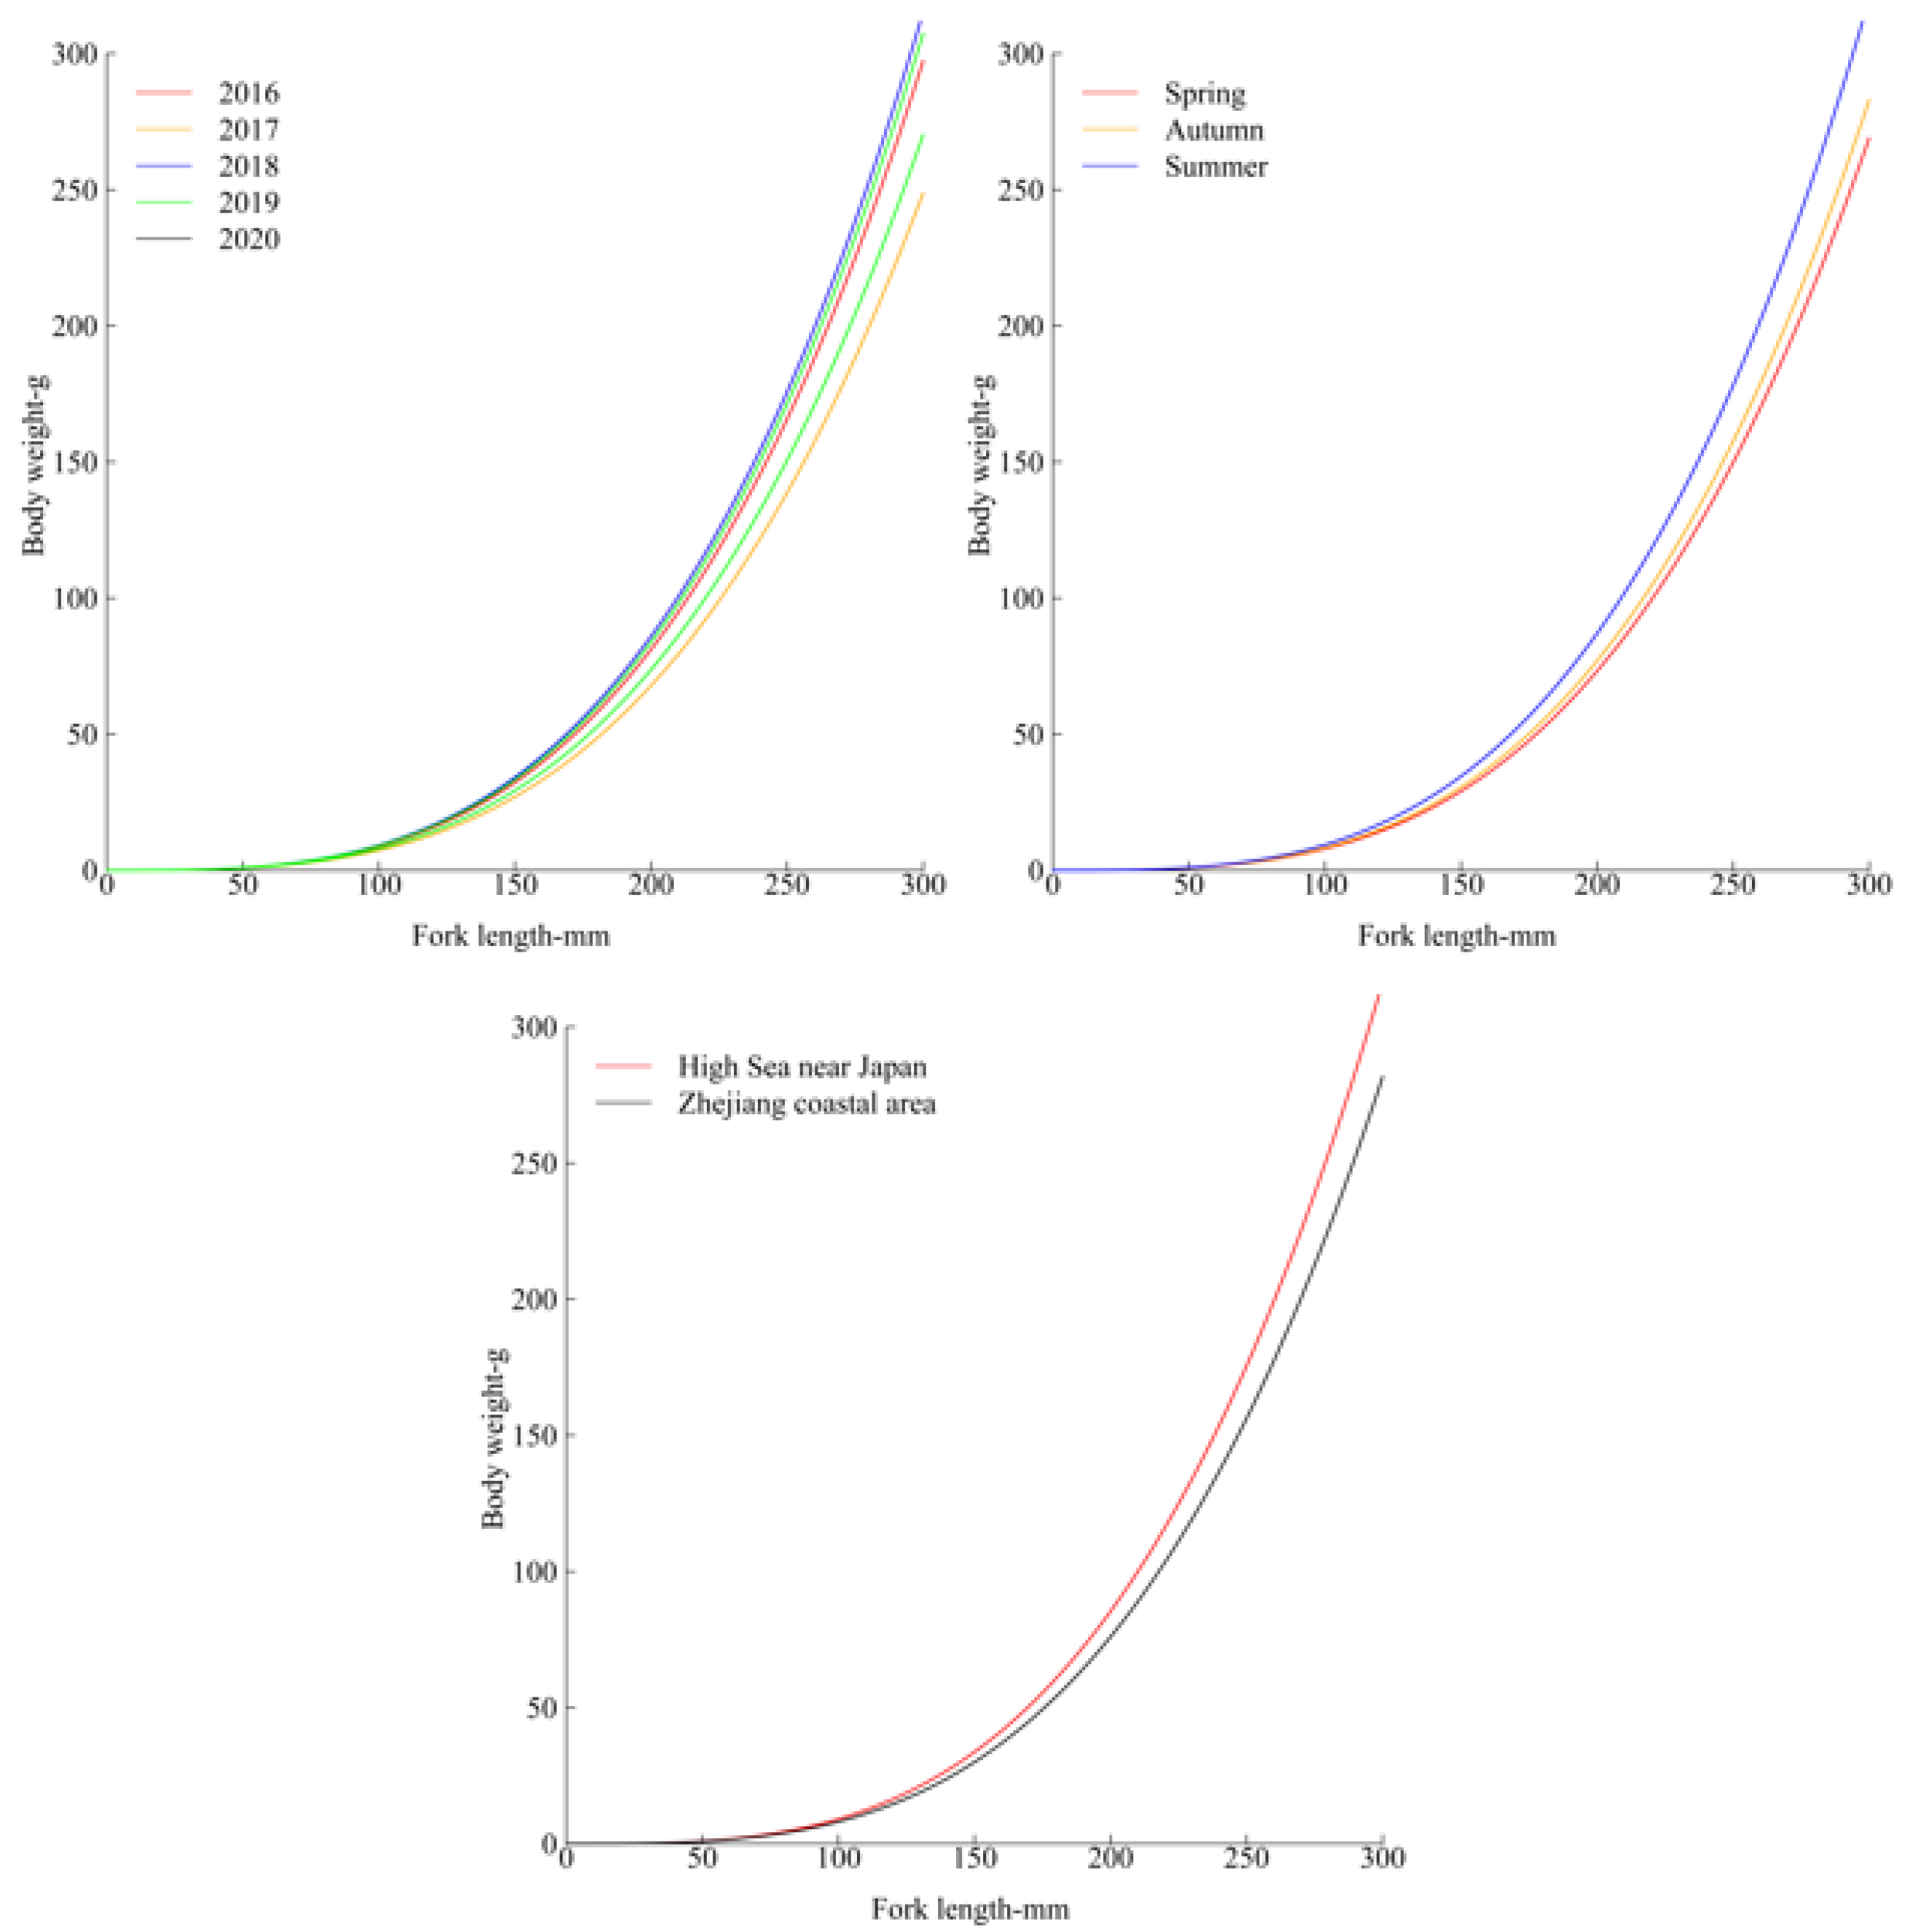
3.2. Fork Length-Weight Relationship and the Heterogeneity of Chub Mackerel

The GLM model fitted well the fork Length-weight power function relationship of W = (1.41 × 10⁻⁶) × FL3.37 (Figure 4). Comparative fit analysis showed that the LMEM (R&Y&S) had the smallest AIC and RMSE values (Table 2), indicating that a random effect with year, season, and region on a was the best fit for the fork Length-weight relationship of Chub mackerel in the fitted LMEM. In terms of different years, the largest a was 3.64 × 10⁻⁶ in 2018, which was closer to that of 2020, and the smallest a was 2.87 × 10⁻⁶ in 2017. In terms of different regions, parameter a was larger in the Zhejiang coastal area than in the high seas near Japan. In terms of different seasons, the largest a was in summer, and a was slightly larger in autumn than in spring (Figure 5). Differences in parameter a for years, regions, and seasons were 7.66 × 10⁻⁷, 5.57 × 10⁻⁷, and 3.20 × 10⁻⁷, respectively, indicating larger variations in years than in regions and/or seasons.
The growth heterogeneity of Chub mackerel presented different results for different fork length ranges. For specimens in the 0–200-mm fork length range, the effects of season, year, and region were minimal. Meanwhile, for Chub mackerel specimens larger than 200-mm fork length, the growth rate varied significantly by year and region, with a similar growth rate effect in spring and autumn but significantly lower in summer.

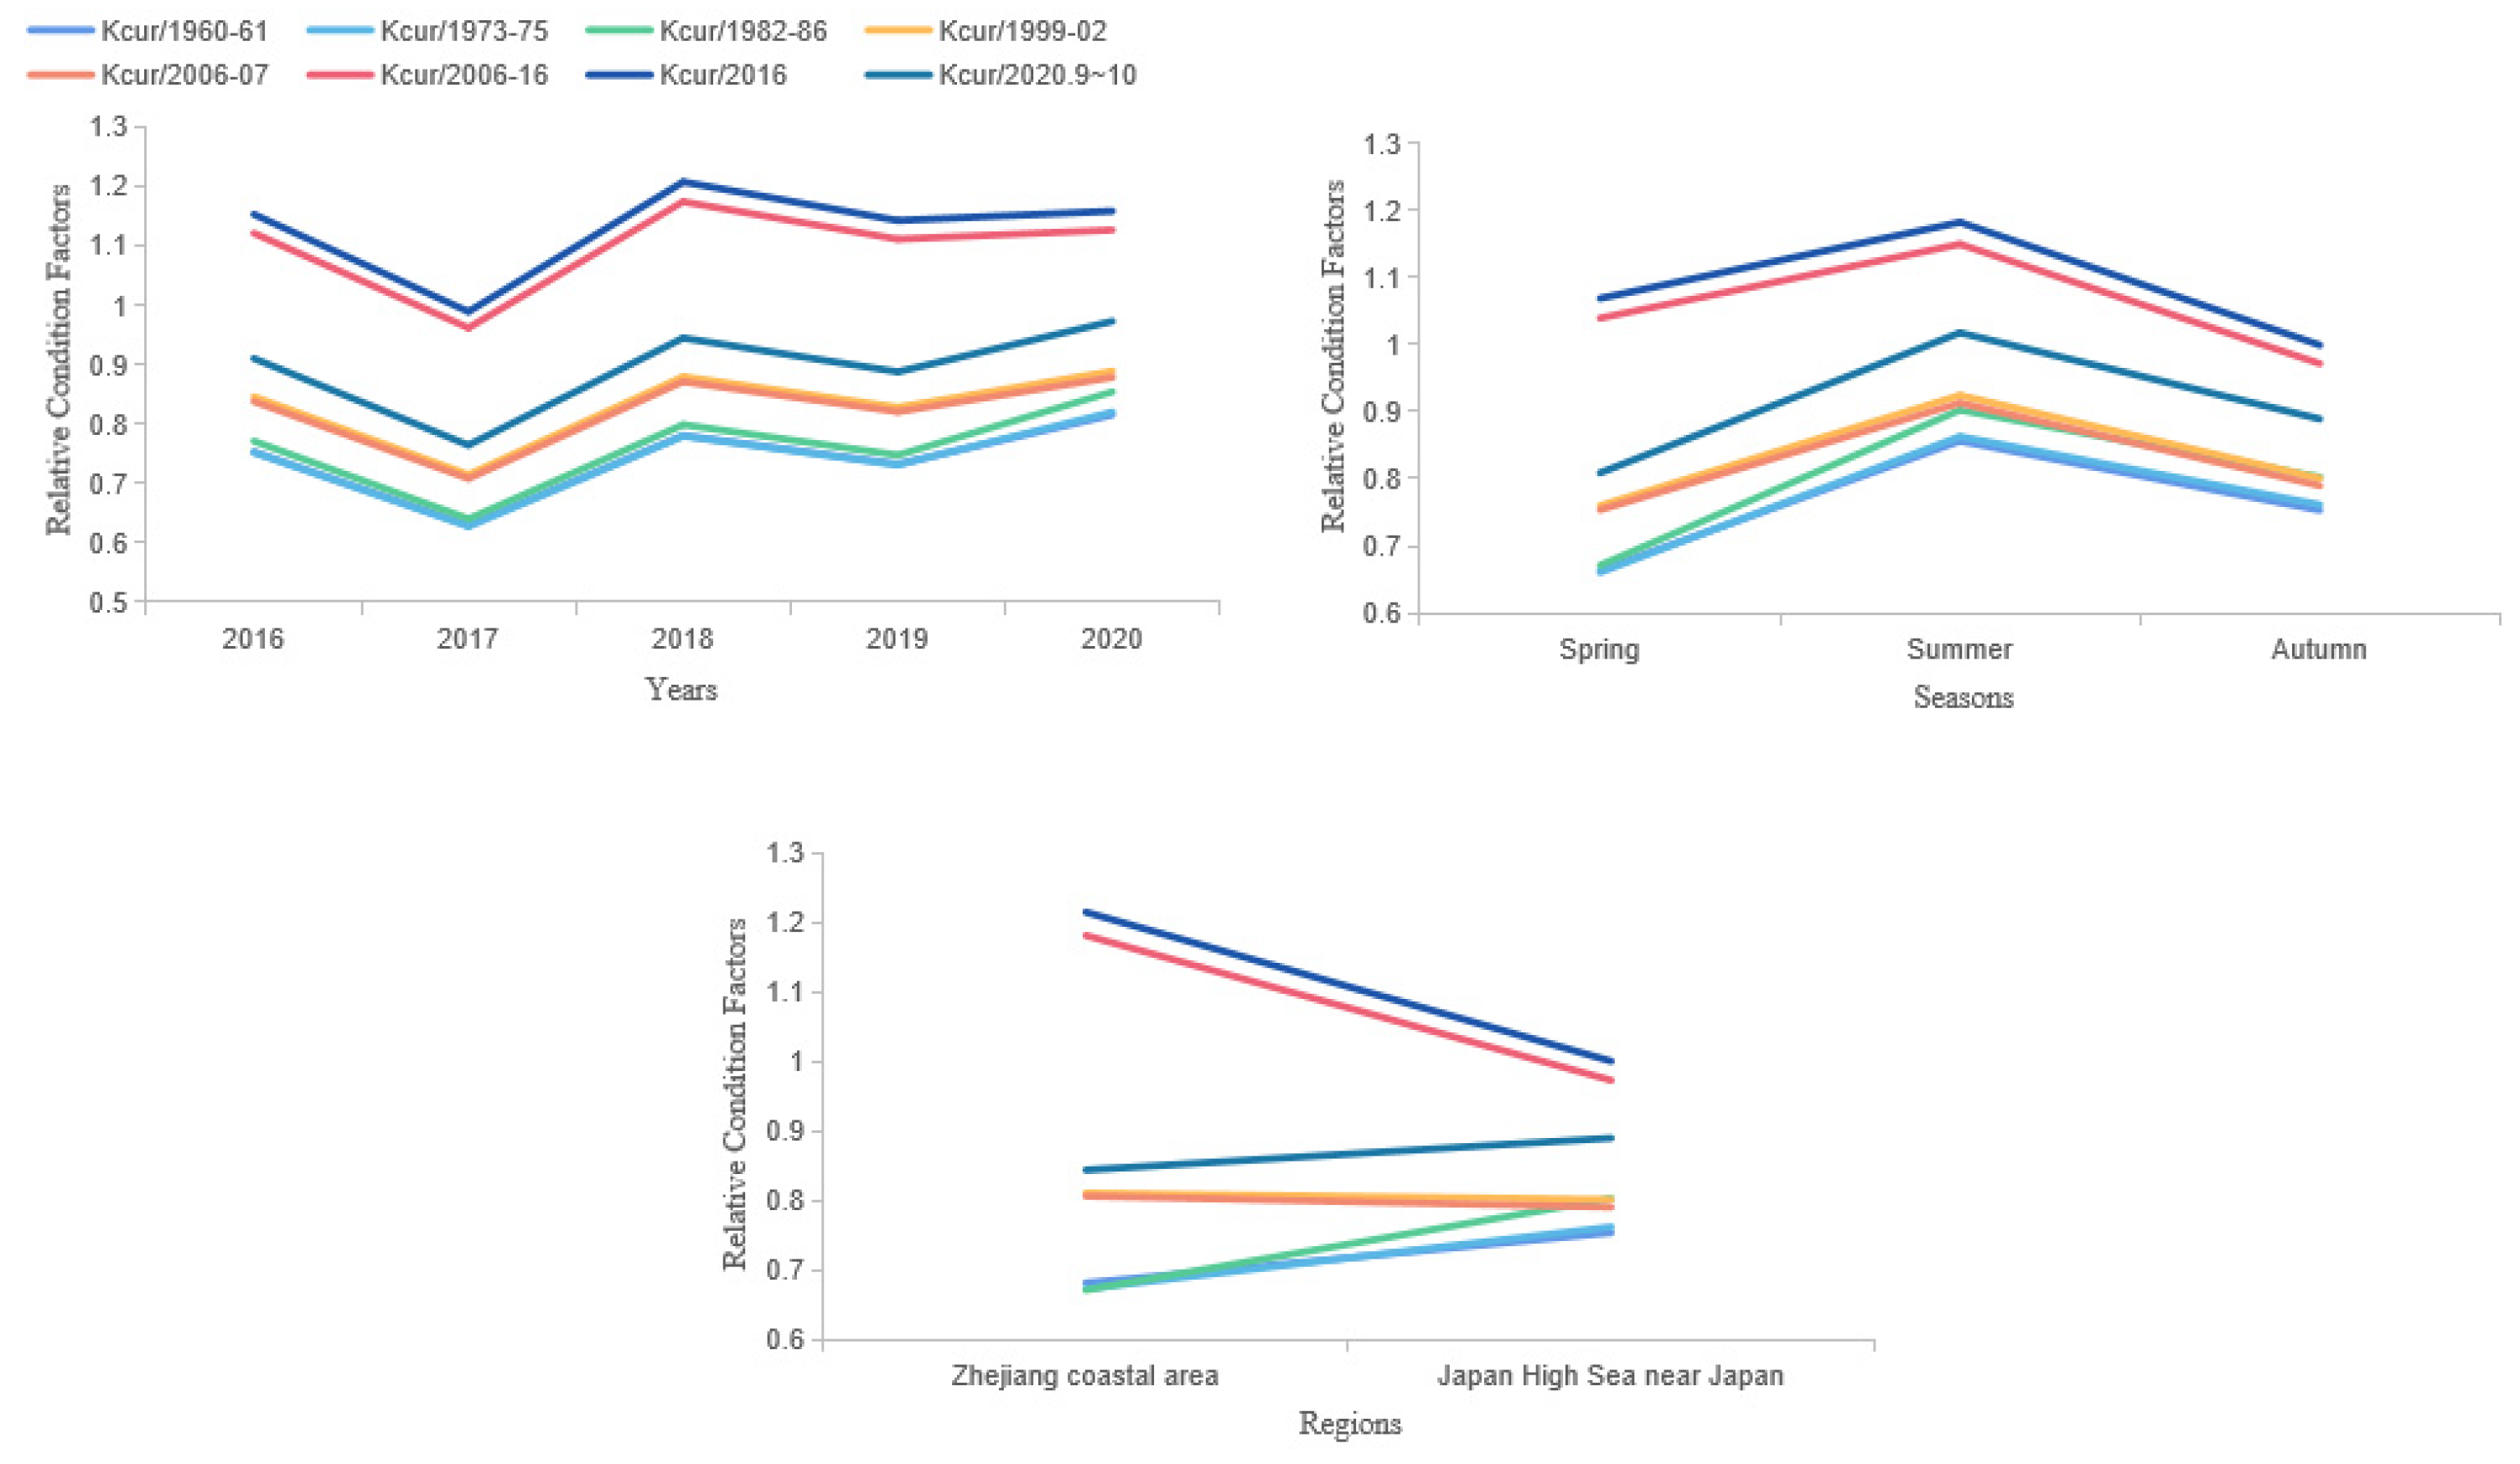
3.3. Relative Condition Factors of Chub Mackerel

The relative condition factors evaluation based on reference years showed that only Kcur/2006~16 and Kcur/2016 had mean values higher than 1, while the rest of the years had relative condition factors less than 1 (Table 4). Apart from Kcur/2020.9~10, the relative condition factors increased with time. Some variations were observed in the relative condition factors by years, seasons (spring, summer, and autumn), and regions (Figure 6). As for different years, the interannual variation trend of each relative condition factor was relatively similar; however, the lowest value of the relative condition factor was observed in 2017. Regarding different seasons, summer had the highest seasonal relative condition factors, and the relative condition factors of spring and autumn were relatively similar. The relative condition factors Kcur1999~02, Kcur/2006~07, Kcur/2006~16, and Kcur/2016 were greater in the Zhejiang coastal area than in the high seas near Japan and vice versa for the other factors.

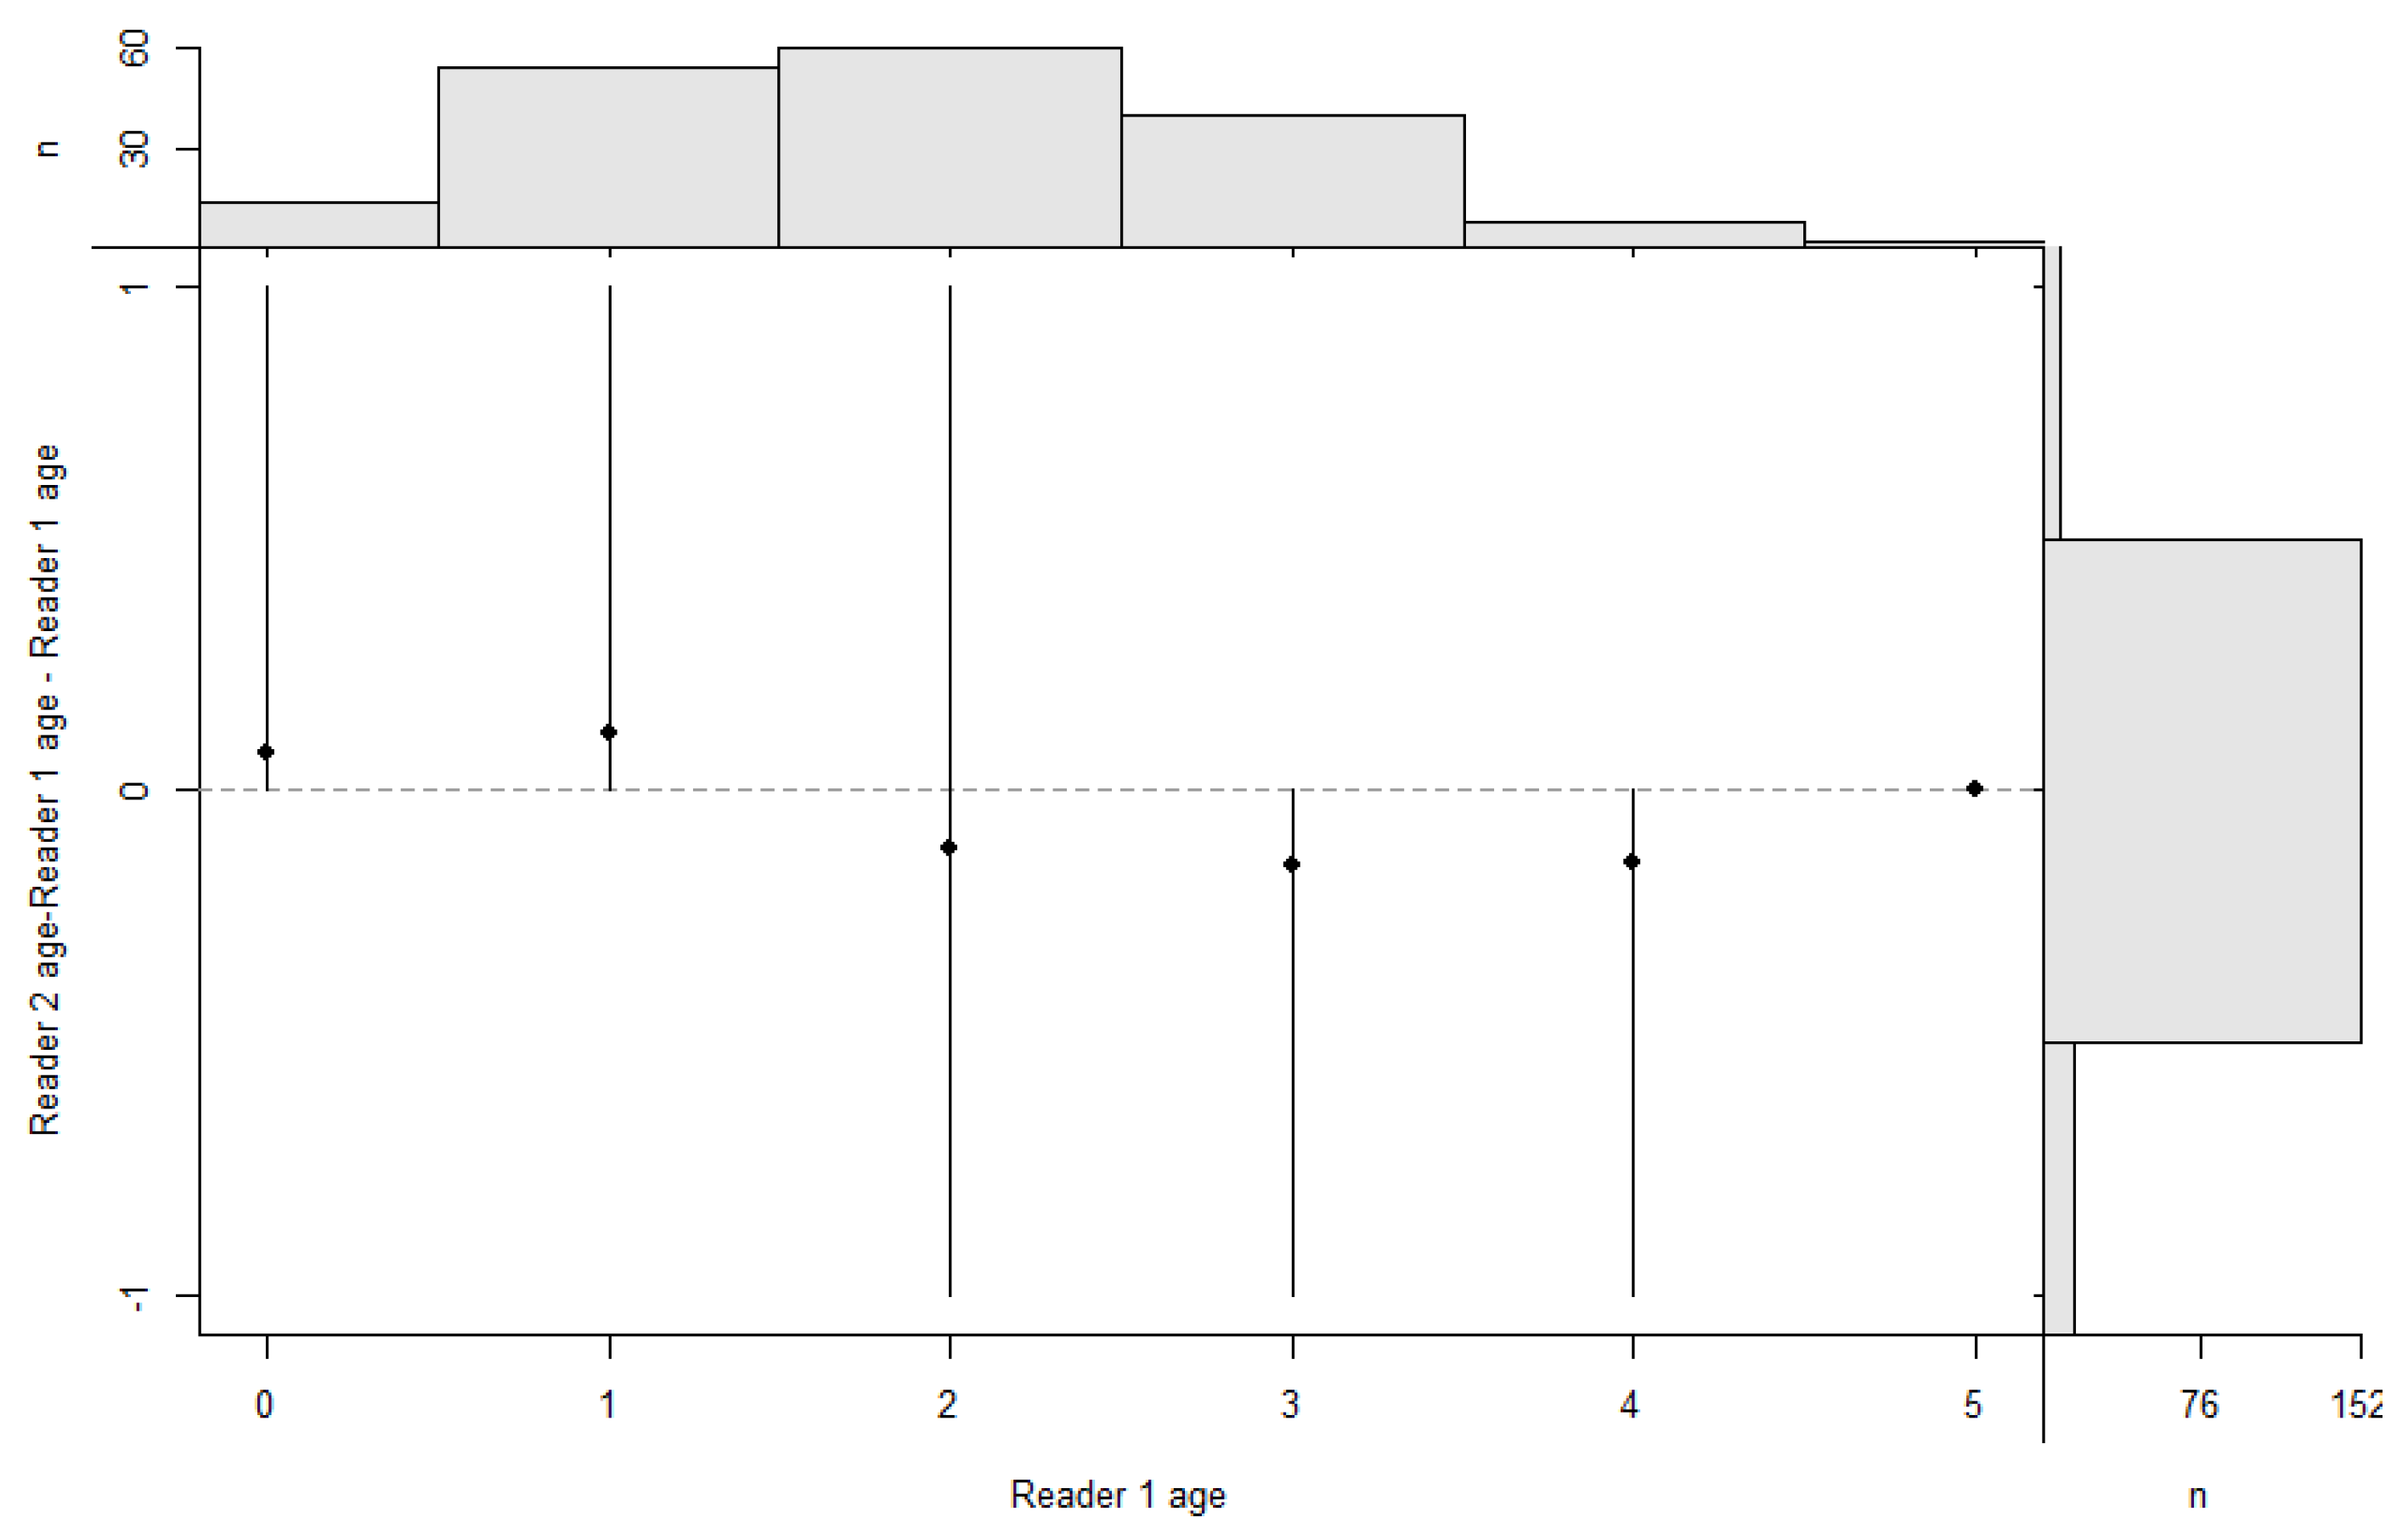
3.4. Agreement between Age Readers

An age-bias plot (Figure 7) shows no detectable bias in readings in any systematic direction. This figure shows high consistency in band pair readings between readers and a high agreement in age estimates. The observed age range was from 0–5 years, with 13 otoliths from age 0, 54 from age 1, 60 from age 2, 40 from age 3, 7 from age 4, and 1 from age 5.

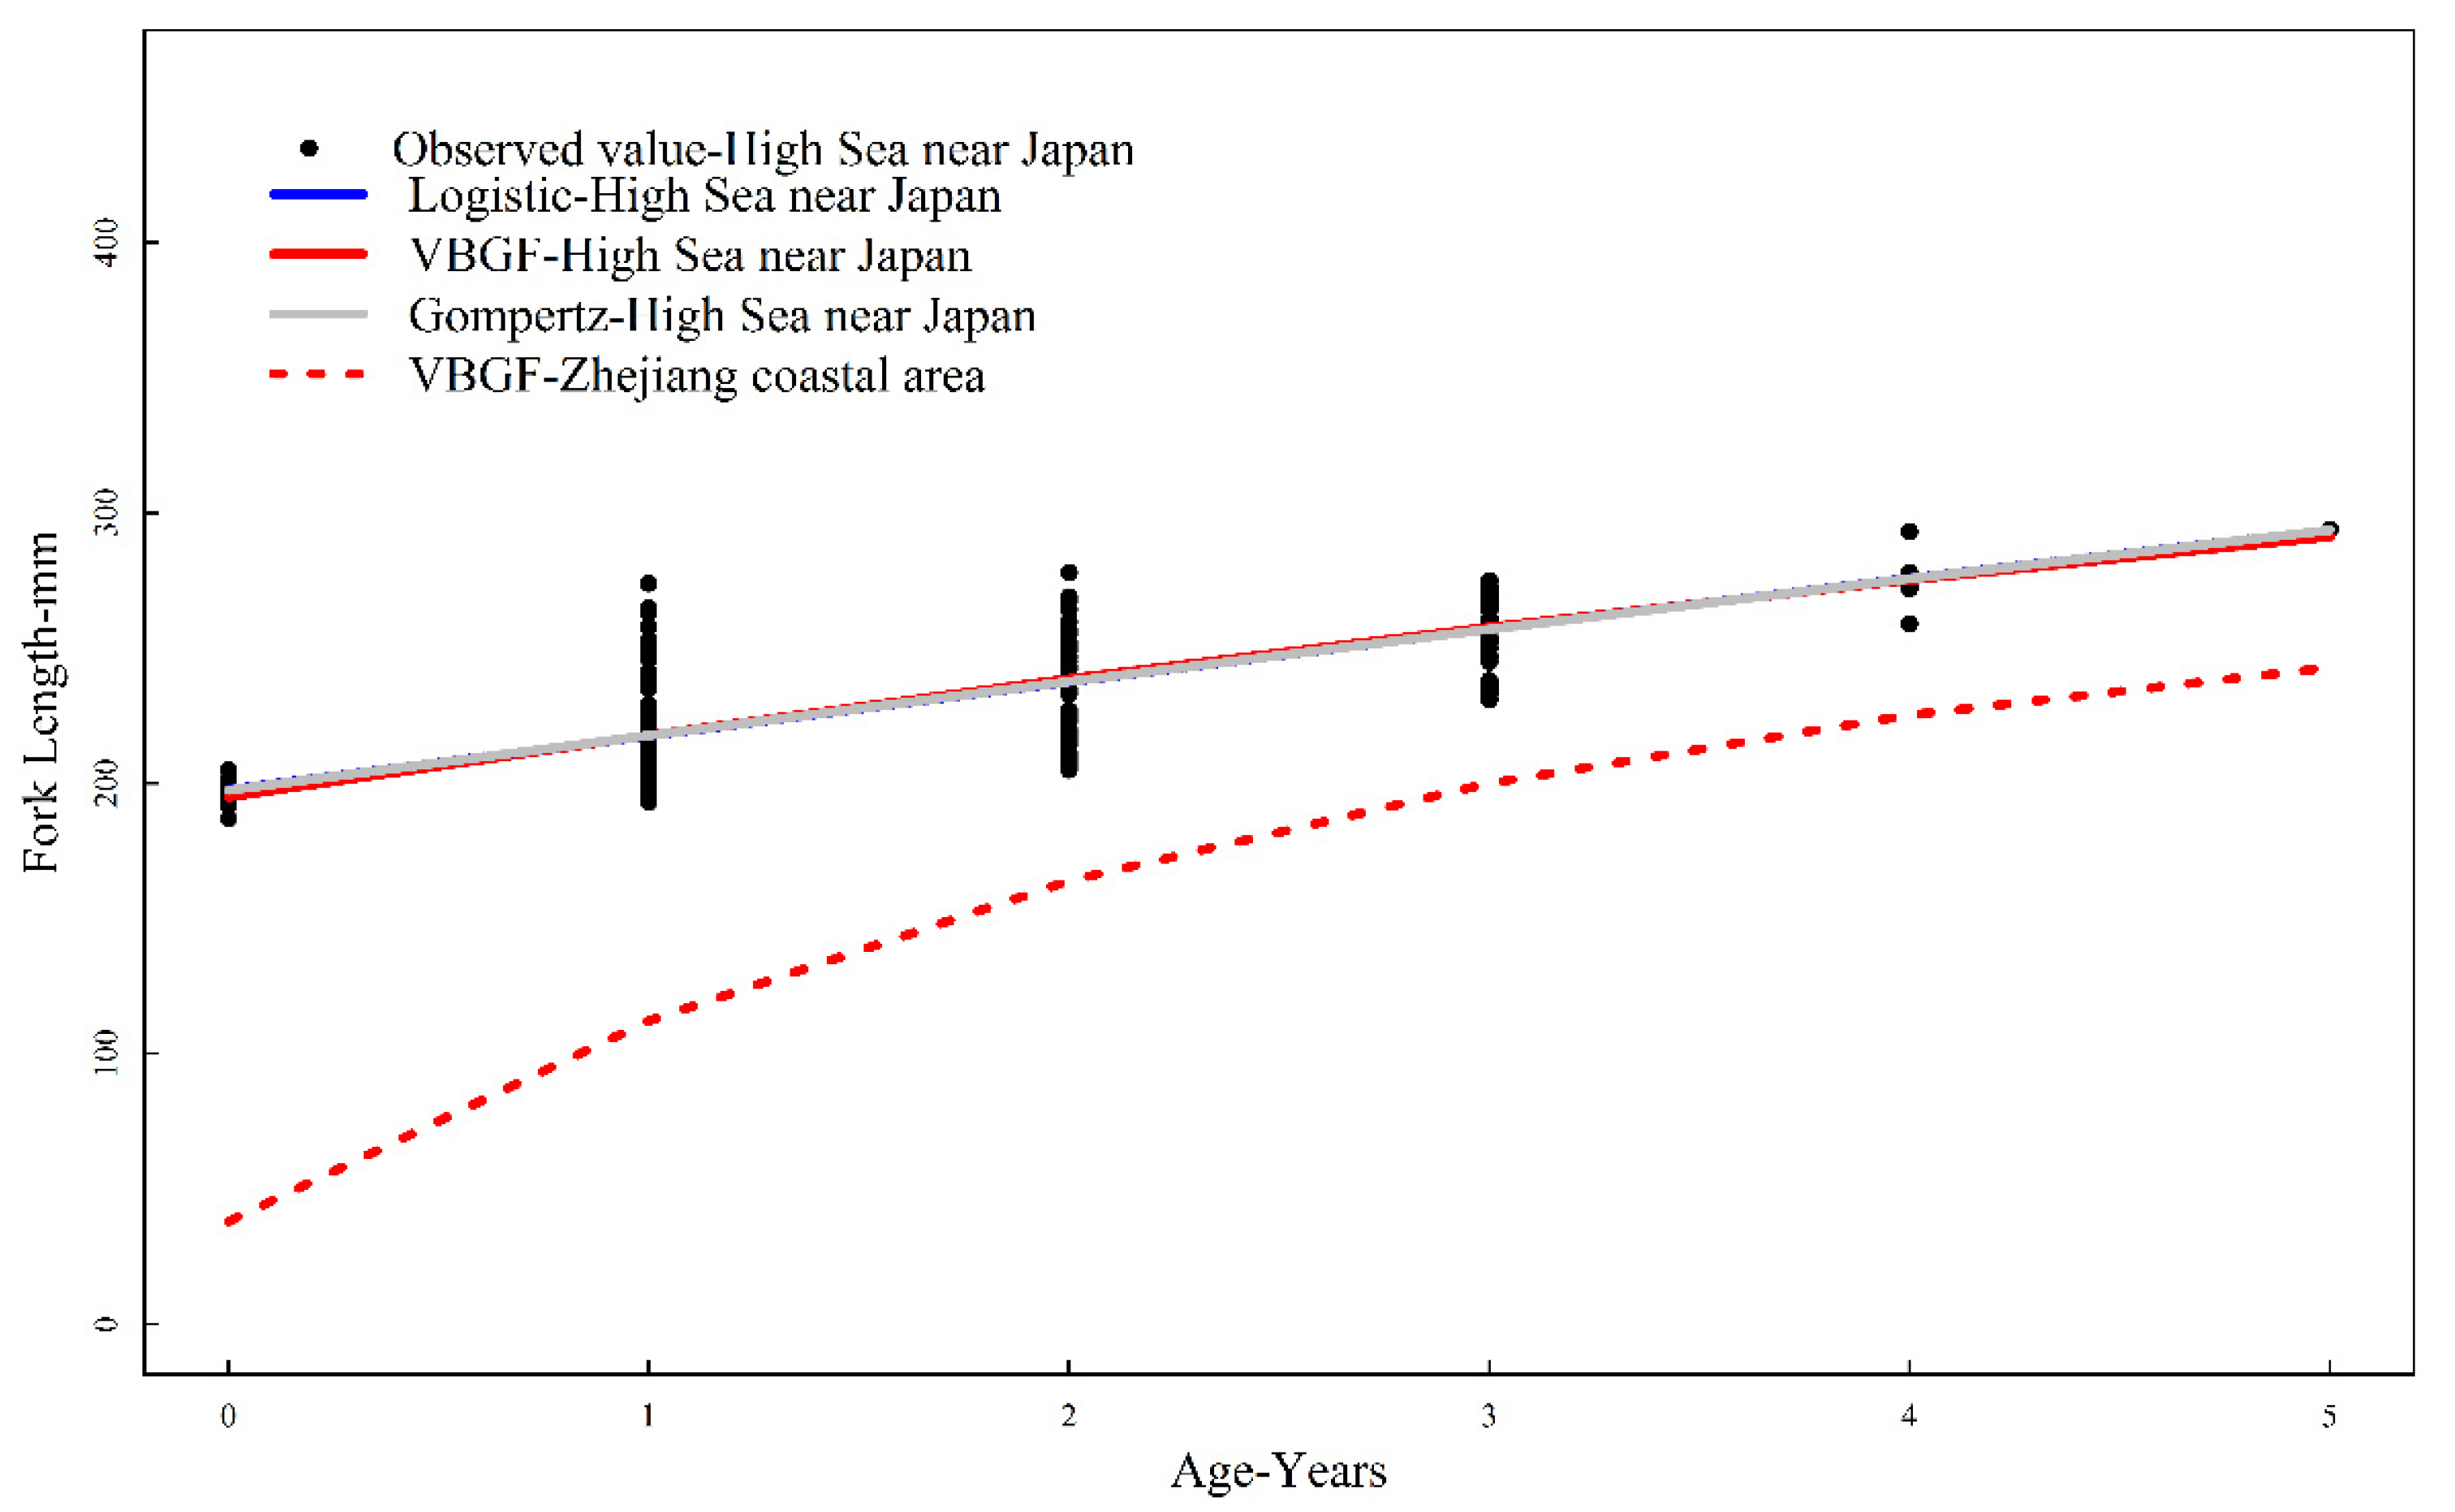
3.5. Growth Modelling of Chub Mackerel

The estimates of the growth parameters obtained from the three growth models previously defined are presented in Table 5. The values of AIC and BIC observed after analysis shows very slight differences amongst models, suggesting that all three models fit the observed length-at-age data for Chub mackerel in the high seas near Japan. However, the VBGF model had the smallest values of AIC and BIC and so was selected to present final growth parameters for this species in this region. Moreover, the L value estimated by VBGF was within range to known reported maximum size and L as compared to the estimated value obtained via ELEFAN I from the Zhejiang coastal area. The predicted length-at-age zero (L0) from VBGF was smaller compared to reported values in other studies.
The age groups and growth characteristics for Chub mackerel samples in the high seas near Japan were fitted using length-at-age data developed from the ageing analysis and mean lengths of different age groups and then further bootstrapped. The growth parameters of Chub mackerel in the coastal waters of the Zhejiang province were obtained using ELEFAN I from FiSAT II software (Version 1.2.2, accessed on 21 June 2021). Growth characteristics for the species in the two regions were fitted to their respective data as seen in Figure 8.

4. Discussion

In the present study, we analyzed the heterogeneity of fork Length-weight relationship, relative condition factors, and growth equation of the Chub mackerel population off the northwest Pacific Ocean. Equally, Chub mackerels were aged, and the associated age-length curves were plotted using three different growth equations for specimens collected in the high seas of Japan. We found that the growth characteristics of Chub mackerel varied in different years, seasons, and regions, and these changes might have been caused by variations of environmental and anthropogenic fishing factors. The von Bertalanffy growth equation presented the lowest AIC and BIC values and so was used to fit the age-and-length data for this species in the high Sea of Japan.

4.1. Analysis of Growth Changes in Body Weight and Condition Factors

In this paper, 2686 Chub mackerel collected in the northwest Pacific were analyzed for fork length and weight and fitted with a power function relationship, W = (1.41 × 10⁻⁶) × FL3.37. In this relationship, the length-weight scaling parameter (a value) of the fork Length-weight relationship, reflecting the suitability of a fish to survive, and the power index coefficient (b value, allometric growth parameter), used to compare whether a specimen is in a state of constant growth [7], were both used in the present work. The scaling parameter observed in our study (1.41 × 10⁻⁶) fell within the range of previously reported values for the same species as shown in Table 2 (1.06 × 10⁻⁶~1.66 × 10⁻⁵). However, our value as compared to others was very low, which may be due to the difference in the regions and years when Chub mackerel was reported or may be due to the deterioration of the Chub mackerel’s habitat in the northwest Pacific Ocean caused, by high fishing pressure on their population. The allometric parameter (b) was 3.37, which fell within the range of previously reported values as in Fishbase (2.7–3.7) [32], and indicates that Chub mackerels’ growth in this area follows positive allometry, with the body weight increasing faster than fork length.
To evaluate the heterogeneity of growth characteristics, we used LMEM to analyze the FL-W relationship, as it provides a more comprehensive analysis of fish growth than GLM, and was used to analyze the fork Length-weight relationship. LMEM includes fixed effects, reflecting the overall characteristics of the sampled data, and random effects, reflecting the variability of the data source. For the present study, the best LMEM indicated significant spatial and temporal differences in the growth of Chub mackerel in the northwest Pacific ocean. The Chub mackerels caught in 2018 were the heaviest and in the best condition as compared to those recorded in other years at the same fork length. Meanwhile, Chub mackerels in 2017 were the lightest and in the worst conditions. This result is corroborated by studies carried out on species such as Decapterus maruadsi and Pampus echinogaster in the Zhejiang coastal area, reporting similar results for the same year 2017 [33,34].
The water depth during winter when Chub mackerel specimens are recorded in China’s coastal waters range from 100–150 m [35]; meanwhile, the maximum water depth at the sampling sites in the Zhejiang coastal area was 70 m. This difference in water depth may be the main reason why very few samples were collected in autumn and winter. The long overwintering migrations in autumn and winter led to the species spending more energy swimming; consequently, Chub mackerels at the same fork length were lean [1,36,37]. Furthermore, the addition of supplementary groups in spring prompted the condition factor in spring to also be relatively low [4,38]. The optimum reported water temperature suitable for Chub mackerel was 25 °C, and the water temperature recorded in the present study from the high seas near Japan was closer to 25 °C in summer than in spring and autumn, where studies observed fatter Chub mackerels in summer as compared to those from other seasons with the same fork length [37,39].
From the different spatial distributions shown in the present study, we observed that the Chub mackerel in the Zhejiang coastal area were heavier than those in the high seas near Japan at the same fork length. The Chub mackerel in the Zhejiang coastal area collected in this paper were from the Tsushima cohort, while the Pacific cohort was sampled at the northwest Pacific, with slight population differences between the two groups [2,3,40,41]. The Pacific cohort in the high seas is located further north and farther from the coast, while the Tsushima cohort lives on the side of the continent, where the water masses are much warmer and considerably higher in nutrients due to the influence of continental runoff and other factors. The primary production is abundant, and the diet has a greater effect on the growth of the fish, so the Chub mackerel collected in the Zhejiang coastal area were better in shape [42]. In addition, compared to the pelagic Chub mackerel fishery in the high seas off the northwest Pacific, the offshore Chub mackerel fishery in China started early, with high production and fishing pressure [43,44,45,46,47], and the pressure to perpetuate the stock has led to adaptive changes in the Chub mackerel population in this area, with faster growth rates and larger body weight for the same fork length.
Relative condition factors are an effective method to compare the relationship between body weight and length of fish at different life stages [22,48]. The condition of the population status of Chub mackerel in recent years was lower as compared to those of the early stages when Chub mackerel fishery began [6,11,41]. This information directly reflects the change of the relative condition factors compared with reported Chub mackerels before 2006; in recent years, the relative condition factors of Chub mackerel have been decreasing (the relative condition factors of Chub mackerel are less than 1). The growth rate of Chub mackerel in 2017 and during summer was the lowest.

4.2. Growth Modelling

The von Bertalanffy growth equation is one of the most commonly used by many researchers to estimate the growth parameters of many fish species, including Chub mackerel, and is more robust than other growth equations [11,12,49,50].
In this study, the best results for the estimation of growth parameters of Chub mackerel in the high sea near Japan were obtained by fitting the von Bertalanffy growth equation (recorded lowest AIC and BIC). However, the estimated results of the logistic growth equation and Gompertz growth equation were close to the von Bertalanffy growth equation. Further, the results of growth parameters derived in this paper for Chub mackerel in the high sea near Japan seemed different from those reported earlier for the same species: the k value (0.09) obtained in the present study was the lowest as compared to previous results of k (0.2–0.55) [17,51]. This may be due to the lack of small and large individual samples, the short span of the sampling period (otolith collection) and area in this study, and the lack of representativeness of the species size classes in the high sea near Japan. Thus, the size classes obtained for Chub mackerel used in the present study represented a very narrow size composition data, consequently providing the observed curve presented in the results section. This may also be related to the fact that the sampling method of the high sea near Japan was via a production survey, hence limiting the selectivity of the fishing gears used in the process. Moreover, Chub mackerel caught by the production survey vessels are of similar sizes, and the sampling periods and areas are relatively small. The growth equation in this study does not provide a comprehensive description of the relationship between age and fork length for the entire Chub mackerel growth history, but it does provide a realistic picture of the relationship between age and fork length for Chub mackerel in the size range (180 mm–300 mm). For subsequent samplings, the use of gears that harvest Chub mackerel specimens representing all size groups could be considered so as to cover the entire life history of this species, allowing for a complete analysis of its age and growth characteristics.
The growth parameters L, k, and t0 of Chub mackerel in the Zhejiang coastal area were 283.39, 0.36, and −0.40, respectively, compared with those fitted by Li et al. [11] for Chub mackerel in the East Yellow Sea (L = 404.65, k = 0.49, t0 = −0.90), which revealed that the asymptotic fork length of Chub mackerel was smaller [11]. This may be due to the small number of older fish in the sample [52,53]. In addition, since all samples taken off Zhejiang were spring and summer mackerels, and the spawning season is from January to June [18], the supplemental population of Chub mackerel was not given enough time to grow, resulting in low asymptotic fork lengths.

4.3. Limitations

In this study, the growth characteristics and heterogeneity of Chub mackerel in the northwest Pacific were obtained by LMEM, relative condition factor relationships, and growth modelling. However, there are still many deficiencies in this study. This study does not consider the influence of environment, bait, climate and other factors in the process of cumulative life history, and the sampling and investigation period of the high sea near Japan is relatively short, which causes difficulty in reflecting the reasons for the time difference of fish biological characteristics. In addition, for the lack of larger samples for ageing Chub mackerel of the high sea near Japan, the relationship between body length-at-age of Chub mackerel was not well obtained. We hope to optimize the setting of fisheries resource survey sites, time and frequency, and sampling area coverage in the future so as to make it more suitable for rational and comprehensive research to obtain more accurate results.

5. Conclusions

In this study, the growth characteristics of two cohorts of Chub mackerel in the northwest Pacific Ocean were studied, and a series of life-history parameters were obtained, which provide some reference value for subsequent resource assessment and fisheries management. In addition, it was found that there may be some heterogeneity in the growth characteristics of Chub mackerel across years, seasons, and regions, and therefore, the study and management of the Chub mackerel cohort need to take into account spatial and temporal differences. However, the fork length of the Chub mackerel samples in the high sea near Japan was too concentrated, resulting in a poor fit of the age and growth parameters, and it is hoped that more comprehensive samples of Chub mackerel will be available for analysis and comparison in future studies.

Author Contributions

Conceptualization, K.C. and Q.M.; methodology, R.K.; software, K.C.; validation, Q.M. and R.K.; formal analysis, K.C.; investigation, X.H. and S.Q.; resources, Q.M.; data curation, X.H. and S.Q.; writing—original draft preparation, K.C.; writing—review and editing, R.K. and Q.M.; supervision, R.K.; project administration, Q.M. All authors have read and agreed to the published version of the manuscript.

Funding

This research was supported by the National Key R&D Programs of China (2019YFD0901404).

Institutional Review Board Statement

Not applicable.

Informed Consent Statement

Not applicable.

Data Availability Statement

Data can be made available upon request to the corresponding author.

Acknowledgments

We thank the teachers and students from the Research Laboratory of Quantitative Assessment and Management of Fisheries Resources and Ecosystems, Shanghai Ocean University, and Zhejiang Institute of Marine Aquaculture for their work and help in sample collection and biological analysis.

Conflicts of Interest

The authors declare no conflict of interest.

References

  1. Yamada, U.; Tokimura, M.; Horikawa, H.; Nakabo, T. Fishes and Fisheries of the East China and Yellow Seas; Tokai University: Hadano, Japan, 2007; ISBN 9784486017400. [Google Scholar]
  2. Kuroda, H.; Yoda, M.; Yasuda, T.; Suzuki, K.; Takegaki, K.; Sasa, Y.; Takahashi, M. Stock Assessment of the Tsushima Current Cohort of Chub Mackerel (Scomber Japonicus) in 2017; Seikai National Fisheries Research Institute: Nagasaki, Japan, 2017. [Google Scholar]
  3. Yoshiue, R.; Nishijima, S.; Isu, S.; Watanabe, C.; Uemura, T.; Hashimoto, M. Stock Assessment of the Pacific Cohort of Chub Mackerel (Scomber Japonicus) in 2017; National Research Institute of Fisheries Science: Yokohama, Japan, 2017. [Google Scholar]
  4. Watanabe, C. A Review of the Reproductive Studies for Chub Mackerel in Relation to the Stock Assessment. Bull Fish. Res. 2006, 101–111. Available online: https://agris.fao.org/agris-search/search.do?recordID=JP2007000286 (accessed on 24 December 2021).
  5. Yan, Y.M.; Dai, Q.S.; Lu, Z.B. Growth and mortality of Chub mackerel in north-central Fujian. J. Fujian Fish 1986, 2, 1–7. [Google Scholar]
  6. Cheng, J.H.; Lin, L.S. Study on the biological characteristics and status of common mackerel (Scomber japonicus Houttuyn) fishery in the East China Sea region. Mar. Fish. 2004, 26, 73–78. [Google Scholar] [CrossRef]
  7. Keys, A.B. The weight-length relation in fishes. Proc. Natl. Acad. Sci. USA 1928, 14, 922–925. [Google Scholar] [CrossRef] [PubMed] [Green Version]
  8. Froese, R. Cube law, condition factor and weight–length relationships: History, meta-analysis and recommendations. J. Appl. Ichthyol. 2006, 22, 241–253. [Google Scholar] [CrossRef]
  9. Ma, Q.; Yan, J.; Ren, Y. Linear mixed-effects models to describe length-weight relationships for yellow croaker (Larimichthys Polyactis) along the north coast of China. PLoS ONE 2017, 12, e0171811. [Google Scholar] [CrossRef] [Green Version]
  10. Kindong, R.; Wang, H.; Dai, X.; Tian, S. Age, growth, and sexual maturity of the crocodile shark, Pseudocarcharias kamoharai, from the tropical eastern Atlantic Ocean. Front. Mar. Sci. 2020, 7, 857. [Google Scholar] [CrossRef]
  11. Li, G.; Chen, X.; Feng, B. Age and growth of chub mackerel (Xcomber japonicus) in the East China and Yellow Seas using sectioned otolith samples. J. Ocean. Univ. China 2008, 7, 439–446. [Google Scholar] [CrossRef]
  12. Liu, Y.; Yan, L.P.; Cheng, J.H. Growth characteristics and rational exploitation of Scomber japonicus in the north of the East China Sea and the nouth of the Yellow Sea. J. Fish. Sci. China 2006, 13, 814–822. [Google Scholar] [CrossRef]
  13. Watanabe, C.; Yatsu, A. Effects of density-dependence and sea surface temperature on inter-annual variation in length-at-age of chub mackerel (Scomber japonicus) in the Kuroshio-Oyashio area during 1970–1997. Fish. B-Noaa 2004, 102, 196–206. [Google Scholar] [CrossRef]
  14. Zhuang, Z.D.; Ma, C.; Liu, Y. A Preliminary Study on Biological Characteristics of scomber japonicus in the North Pacific Ocean in Autumn. Trans. Oceanol. Limnol. 2018, 6, 125–131. [Google Scholar] [CrossRef]
  15. Akihiro, M.; Momoko, I.; Ryuji, Y. Catch, Weight, and Maturity at Age of the Chub Mackerel of Japan; NPFC-2020-TWG CMSA03-WP02; North Pacific Fisheries Commission: Tokyo, Japan, 2020. [Google Scholar]
  16. Takahashi, M.; Yoneda, M.; Kitano, H.; Kawabata, A.; Saito, M. Growth of juvenile chub mackerel Scomber japonicus in the western North Pacific Ocean: With application and validation of otolith daily increment formation. Fish. Sci. 2014, 80, 293–300. [Google Scholar] [CrossRef]
  17. Kamimura, Y.; Taga, M.; Yukami, R.; Watanabe, C.; Furuichi, S. Intra-and inter-specific density dependence of body condition, growth, and habitat temperature in chub mackerel (Scomber japonicus). ICES J. Mar. Sci. 2021, 78, 3254–3264. [Google Scholar] [CrossRef]
  18. Yukami, R.; Ohshimo, S.; Yoda, M.; Hiyama, Y. Estimation of the spawning grounds of Chub mackerel Scomber japonicus and spotted mackerel Scomber australasicus in the East China Sea based on catch statistics and biometric data. Fish. Sci. 2009, 75, 167–174. [Google Scholar] [CrossRef]
  19. General Administration of Quality Supervision, Inspection and Quarantine of the People’s Republic of China; Standardization Administration of the People’s Republic of China. GB/T 12763. 6-2007 Specifications for Oceanographic Survey Part 6: Marine Biological Survey; Standards Press of China: Beijing, China, 2008; pp. 56–62.
  20. Chen, X.J.; Li, G. Production of a Cross-Sectional Section of Chub Mackerel Otolith and Its Age Identification Method. Chinese Patent CN200910046983, 23 September 2009. [Google Scholar]
  21. Qiu, H.Y.; Xu, D.P.; Shi, W.G. A Review of the Relationship between Fish Otolish and Age. J. Zhejiang Ocean. Univ. Nat. Sci. 2009, 28, 331–337. [Google Scholar]
  22. Le Cren, E.D. The Length-Weight Relationship and Seasonal Cycle in Gonad Weight and Condition in the Perch (Perca fluviatilis). J. Anim. Ecol. 1951, 20, 201–219. [Google Scholar] [CrossRef] [Green Version]
  23. Furuichi, S.; Kamimura, Y.; Yukami, R. Length-length and Length-weight Relationships for Four Dominant Small Pelagic Fishes in the Kuroshio-Oyashio Current System. Thalass. Int. J. Mar. Sci. 2021, 37, 651–657. [Google Scholar] [CrossRef]
  24. Cailliet, G.M.; Smith, W.D.; Mollet, H.F.; Goldman, K.J. Age and growth studies of chondrichthyan fishes: The need for consistency in terminology, verification, validation, and growth function fitting. Environ. Biol. Fish. 2006, 77, 211–228. [Google Scholar] [CrossRef]
  25. Von Bertalanffy, L. A quantitative theory of organic growth (inquires on growth laws. II). Hum. Biol. 1938, 10, 181–213. [Google Scholar]
  26. Ricker, W.E. 11 Growth Rates and Models. Fish Physiol. 1979, 8, 677–743. [Google Scholar] [CrossRef]
  27. Pauly, D.; David, N. ELEFAN I, a BASIC program for the objective extraction of growth parameters from length-frequency data. Meeresforschung 1981, 28, 205–211. [Google Scholar]
  28. Du, X.X.; Gao, C.X.; Tian, S.Q.; Liu, W.C.; Wang, J.Q.; Ye, S. Growth, mortality and optimum catchable size of Bombay duck (Harpadon nehereus) in the Wentai fishing ground, East China Sea. Fish. Res. 2018, 42, 41–49. [Google Scholar] [CrossRef]
  29. Bates, D.M.; Mächler, M.; Bolker, B.; Walker, S. Fitting linear mixed-effects models using lme4. J. Stat. Softw. 2015, 67, 1–48. [Google Scholar] [CrossRef]
  30. Ogle, D.H. Introductory Fisheries Analyses with R; CRC Press: Boca Raton, FL, USA, 2018. [Google Scholar] [CrossRef]
  31. Pinheiro, J.; Bates, D.; DebRoy, S.; Sarkar, D. Linear and Nonlinear Mixed Effects Models [EB]. R Package Version 3.1-140. Available online: https://CRAN.R-project.org/package=nlme> (accessed on 6 November 2021).
  32. Froese, R.; Pauly, D. 2021. Available online: www.fishbase.de (accessed on 8 December 2021).
  33. Cui, M.Y.; Chen, W.F.; Dai, L.B.; Ma, Q.Y. Growth heterogeneity and natural mortality of Japanese scad in offshore waters of southern Zhejiang. J. Fish. Sci. China 2020, 27, 1427–1437. [Google Scholar] [CrossRef]
  34. Wang, Y.N.; Han, D.Y.; Ma, Q.Y.; Gao, C.X.; Tian, S.Q.; Tang, J. Linear mixed-effect models for heterogeneity analysis of fork length-mass relationships for Pampus echinogaster. J. Shanghai Ocean Univ. 2021, 30, 135–143. [Google Scholar] [CrossRef]
  35. Zheng, B. Age and Growth of Mackerel (Scomber Japonicus) and the Relationship between Its Abundance and Environmental Variables; Shanghai Ocean University: Shanghai, China, 2007. [Google Scholar]
  36. Wu, S.N.; Chen, X.J. Review on Fishery Biology and Fishery Oceanography of Chub Mackerel. (Scomber japonicus) in the Northwest Pacific Ocean. J. Guangdong Ocean Univ. 2018, 38, 10. [Google Scholar] [CrossRef]
  37. Li, Y.S.; Xing, Y.N.; Pan, L.Z.; Zhang, Y.; Yu, W. Research progress on life history and model application of Scomber japonicus. J. Dalian Ocean Univ. 2021, 36, 694–705. [Google Scholar] [CrossRef]
  38. Hu, C.L.; Zhang, Y.Z.; Li, D.W.; Zhu, W.B.; Jiang, R.J.; Li, P.F.; Wang, Y.; Zhou, Y.D.; Zhang, H.L. Study on fish resources and community diversity during spring and summer in the coastal spawning ground of Zhejiang province, China. Acta Hydrobiol. Sin. 2018, 42, 984–995. [Google Scholar] [CrossRef]
  39. Cheung, W.W.L.; Watson, R.; Pauly, D. Signature of ocean warming in global fisheries catch. Nature 2013, 497, 365–368. [Google Scholar] [CrossRef]
  40. Shao, F.; Chen, X.J. Genetic Variations of Scomber japonicus and S. australasicus Based on Random Amplified Polymorphic DNA in the Yellow Sea and the East China Sea. J. Guangdong Ocean Univ. 2008, 28, 5. [Google Scholar] [CrossRef]
  41. Yan, L.P.; Zhang, H.; Li, S.F.; Li, J.S. Progress of population identification and classification of chub mackerel ( Scomber japonicus) in the East China Sea and the Yellow Sea. Mar. Fish. 2012, 34, 5. [Google Scholar] [CrossRef]
  42. Enberg, K.; Jørgensen, C.; Dunlop, E.S.; Varpe, Ø.; Boukal, D.S.; Baulier, L.; Eliassen, S.; Heino, M. Fishing-induced evolution of growth: Concepts, mechanisms and the empirical evidence. Mar. Ecol. 2012, 33, 1–25. [Google Scholar] [CrossRef] [Green Version]
  43. Yatsu, A.; Watanabe, T.; Ishida, M.; Sugisaki, H.; Jacobson, L.D. Environmental effects on recruitment and productivity of Japanese sardine Sardinops melanostictus and chub mackerel Scomber japonicus with recommendations for management. Fish Oceanogr. 2005, 14, 263–278. [Google Scholar] [CrossRef]
  44. Fishery and Fishery Administration of the Ministry of Agriculture and Rural Areas; National Aquatic Technology Promotion Terminal; Chinese Society of Fisheries. China Fishery Statistical Yearbook, 2017; China Agriculture Press: Beijing, China, 2017; pp. 39–42.
  45. Fishery and Fishery Administration of the Ministry of Agriculture and Rural Areas; National Aquatic Technology Promotion Terminal; Chinese Society of Fisheries. China Fishery Statistical Yearbook, 2018; China Agriculture Press: Beijing, China, 2018; pp. 40–44.
  46. Fishery and Fishery Administration of the Ministry of Agriculture and Rural Areas; National Aquatic Technology Promotion Terminal; Chinese Society of Fisheries. China Fishery Statistical Yearbook, 2019; China Agriculture Press: Beijing, China, 2019; pp. 38–44.
  47. Fishery and Fishery Administration of the Ministry of Agriculture and Rural Areas; National Aquatic Technology Promotion Terminal; Chinese Society of Fisheries. China Fishery Statistical Yearbook, 2020; China Agriculture Press: Beijing, China, 2020; pp. 39–42.
  48. Schneider, J.C.; Laarman, P.W.; Gowing, H. Length-weight relationships. In Manual of Fisheries Survey Methods II: With Periodic Updates; Schneider, J.C., Ed.; Michigam Department of Natural Resources: Ann Arbor, MI, USA, 2000; Charpter 17; pp. 1–16. [Google Scholar]
  49. Shiraishi, T.; Okamoto, K.; Yoneda, M.; Sakai, T.; Ohshimo, S.; Onoe, S.; Yamaguchi, A.; Matsuyama, M. Age validation, growth and annual reproductive cycle of chub mackerel Scomber japonicus off the waters of northern Kyushu and in the East China Sea. Fish. Sci. 2008, 74, 947–954. [Google Scholar] [CrossRef]
  50. Booth, A.J. On the life history of the lesser gurnard (Scorpaeniformes: Triglidae) inhabiting the Agulhas Bank, South Africa. J. Fish Biol. 2010, 51, 1155–1173. [Google Scholar] [CrossRef] [PubMed]
  51. Nishijima, S.; Kamimura, Y.; Yukami, R.; Manabe, A.; Oshima, K.; Ichinokawa, M. Update on Natural Mortality Estimators for Chub Mackerel in the Northwest Pacific Ocean; NPFC-2021-TWG CMSA04-WP05; North Pacific Fisheries Commission: Tokyo, Japan, 2021. [Google Scholar]
  52. Chen, Y.; Mello, L. Growth and maturation of cod (Gadus morhua) of different year classes in the Northwest Atlantic, NAFO subdivision 3Ps. Fish. Res. 1999, 42, 87–101. [Google Scholar] [CrossRef]
  53. Yukami, R.; Nishijima, S.; Isu, S.; Kamiura, Y.; Furuichi, S.; Watanabe, R. Stock Assessment of Chub Mackerel Pacific Stock; National Research Institute of Fisheries Science: Yokohama, Japan, 2019. [Google Scholar]
Figure 1. Sample stations for Chub mackerel in the coastal waters off the northwest Pacific Ocean.
Jmse 10 00301 g001
Figure 2. Distribution of the fork length and body weight of Chub mackerel in coastal waters off the northwest Pacific Ocean.
Jmse 10 00301 g002
Figure 3. Changes in fork length and body weight distribution of Chub mackerel specimens collected from waters off the northwest Pacific Ocean presented by years, seasons (spring, summer, and autumn), and regions.
Jmse 10 00301 g003
Figure 4. Fork Length-weight relationship of Chub mackerel specimens collected from waters off the northwest Pacific Ocean.
Jmse 10 00301 g004
Figure 5. Fork Length-weight relationships variations by years, seasons, and regions for Chub mackerel specimens.
Jmse 10 00301 g005
Figure 6. Changes in condition factors for Chub mackerel by years, seasons, and regions.
Jmse 10 00301 g006
Figure 7. Age-bias plot of reader 1 estimates versus reader 2 estimates. Notes: Mean (dots) and range (intervals) of differences in otolith age are estimates between two readers at the estimates for the first reader for Chub mackerel in the northwest Pacific Ocean. The agreement line, which is the horizontal line, suggests a difference in the two age estimates from readers. Marginal histograms are for age estimates of the first reader (top) and differences in age estimates between readers (right). The bar at a difference of zero represents the amount of perfect agreement between the sets of age estimates (n = 152).
Jmse 10 00301 g007
Figure 8. The length-at-age curves for Chub mackerel specimens collected from coastal waters off the northwest Pacific Ocean.
Jmse 10 00301 g008
Table 1. The sample size of Chub mackerel for different years, seasons, and regions off the northwest Pacific Ocean.
YearZhejiang Coastal AreaHigh Sea Near JapanTotal
SpringSummerAutumnWinterSpringSummerAutumnWinter
20162824200----324
201762314802----773
2018147036----156
201911614900----265
20207612---836244-1168
Total124435138-836244-2686
Table 2. Fork Length-weight relationship of Chub mackerel and its fitting effects. Notes: R refers to the spatial random effects with intercept ln(a); Y refers to the random effect of years with intercept ln(a); S refers to the random effect of seasons with intercept ln(a).
ModelsLog-TransformedAICRMSE
GLM W = a × FL b l n ( W ) = l n ( a ) + b × l n ( FL ) −201116.62
R W = ( a × e x p ( R e R ) ) × FL b   l n ( W ) = ( l n ( a ) + R e R ) + b × l n ( FL ) −217716.07
Y W = ( a × e x p ( R e Y ) ) × FL b l n ( W ) = ( l n ( a ) + R e Y ) + b × l n ( FL L ) −270014.54
R&Y W = ( a × e x p ( R e R ) × e x p ( R e Y ) ) × FL b l n ( W ) = ( l n ( a ) + R e R + R e Y ) + b × l n ( FL ) −270214.52
S W = ( a × e x p ( R e S ) ) × FL b l n ( W ) = ( l n ( a ) + R e S ) + b × l n ( FL L ) −252115.06
R&S W = ( a × e x p ( R e R ) × e x p ( R e S ) ) × FL b l n ( W ) = ( l n ( a ) + R e R + R e S ) + b × l n ( FL ) −254014.98
Y&S W = ( a × e x p ( R e Y ) × e x p ( R e S ) ) × FL b l n ( W ) = ( l n ( a ) + R e Y + R e S ) + b × l n ( FL ) −316813.28
R&Y&S W = ( a × e x p ( R e R ) × e x p ( R e Y ) × e x p ( R e S ) ) × FL b l n ( W ) = ( l n ( a ) + R e R + R e Y + R e S ) + b × l n ( FL ) −318513.22
Table 3. Summary of the Length-weight relationship parameters of Chub mackerel used to estimate the condition factors.
VariablesTimeRegionabReferences
Kcur/1960~611960~1961East China Sea1.02 × 10−53.05[6]
Kcur/1973~751973~1975East China Sea1.19 × 10−53.02[6]
Kcur/1982~861982~1986East China Sea1.66 × 10−52.95[6]
Kcur1999~021999~2002East China Sea4.44 × 10−63.19[6]
Kcur/2006~072006~2007East China Sea and Yellow Sea4.26 × 10−63.20[11]
Kcur/2006~162006~2016Northwest Pacific Ocean1.09 × 10−63.41[17]
Kcur/20162016Northwest Pacific Ocean1.06 × 10−63.41[14]
Kcur/2020.9~102020.9~2020.10Northwest Pacific Ocean6.21 × 10−63.11[23]
Table 4. Condition factors of Chub mackerel relative to reference years.
VariablesRegionMeanMaxMin
Kcur/1960~61East China Sea0.744 1.551 0.259
Kcur/1973~75East China Sea0.745 1.555 0.258
Kcur/1982~86East China Sea0.769 1.609 0.264
Kcur1999~02East China Sea0.827 1.971 0.292
Kcur/2006~07East China Sea and Yellow Sea0.818 1.975 0.289
Kcur/2006~16Northwest Pacific Ocean1.079 3.395 0.389
Kcur/2016Northwest Pacific Ocean1.110 3.491 0.400
Kcur/2020.9~10Northwest Pacific Ocean0.895 1.927 0.313
Table 5. Estimates of growth parameters for Chub mackerel in the northwest Pacific Ocean from different growth models fitted to length-at-age data and ELEFAN I in waters off Zhejiang coast.
ModelParameterEstimatesL (mm) under Different Models at Different AgesAICBICRegion
Age = 0Age = 1Age = 2Age = 3Age = 4Age = 5
VBGFL460.460–195.01195.01–217.86217.86–238.74238.74–257.82257.82–275.26275.26–291.2030.8029.97High Sea near Japan
k0.09
L0195.01
LogisticL427.940–197.69197.69–217.64217.64–237.53237.53–257.02257.02–275.79275.79–293.5731.3530.52
k0.19
L0197.69
GompertzL508.020–197.55197.55–217.76217.76–237.63237.63–256.99256.99–275.69275.69–293.6231.0830.24
k0.11
L00.94
ELEFAN IL283.390–38.0138.01–112.19112.19–163.95163.95–200.06200.06–225.25225.25–242.83--Zhejiang coastal area
k0.36
t0−0.40
Publisher’s Note: MDPI stays neutral with regard to jurisdictional claims in published maps and institutional affiliations.

