Article

Predicting the Instability Trajectory of an Obliquely Loaded Pipeline on a Clayey Seabed

1
Institute of Mechanics, Chinese Academy of Sciences, Beijing 100190, China
2
School of Engineering Science, University of Chinese Academy of Sciences, Beijing 100049, China
*
Authors to whom correspondence should be addressed.
J. Mar. Sci. Eng. 2022, 10(2), 299; https://doi.org/10.3390/jmse10020299
Submission received: 13 January 2022 / Revised: 17 February 2022 / Accepted: 18 February 2022 / Published: 21 February 2022
(This article belongs to the Special Issue Feature Papers in Ocean Engineering)

Abstract

:
Predicting the instability trajectory of an obliquely loaded pipeline on the seabed is vital for the global buckling assessment. To numerically investigate the obliquely loaded pipe–soil interactions, a plane strain elastoplastic finite element model incorporating the adaptive meshing technique and the contact-pair algorithm is employed and verified with the existing experimental data and the analytical predictions. The evolution of slip mechanisms within the underlying soil is simulated, indicating the instability direction of the pipe, and the corresponding ultimate soil resistance is closely correlated. It is also indicated that the ultimate load angle is in the positive correlation with the movement angle, the dimensionless embedment of the pipe and the roughness coefficient of the pipe–soil interface. On the basis of numerous simulations, a force-resultant plasticity model including the bearing capacity envelope and the flow rule is proposed for predicting the behavior of a partially embedded pipeline on the clayey seabed. Finally, an explicit expression with respect to the critical submerged weight of the pipe is derived for distinguishing the lateral instability of a pipe between the ‘light’ and the ‘heavy’ mode.

1. Introduction

Submarine pipelines in deep waters are commonly laid directly on the seabed, which is a dominantly soft clayey deposit with low shear strength [1,2,3]. The deep-sea pipelines may penetrate into the clayey seabed by a fraction of a diameter due to self-weight and the dynamic effect involved in the laying process [4]. When the pipelines are initiated to transport the hydrocarbon product and other fluids at high temperatures and pressures, the thermally induced axial stress renders the hot pipe tend to buckle and break out from the initial location. In pipeline engineering practices, a significant proportion of the costs is for measures to stabilize the pipeline on the seabed. Controlled lateral buckling is a widely used cost-effective solution to accommodate the thermal load, which requires the reliable assessment of the soil resistance to ensure that the buckles form as planned [5]. Therefore, an accurate prediction of the instability trajectory of an obliquely loaded pipeline (i.e., under a combined vertical (V) and horizontal loading (H)) is crucial for the design of deep-sea pipelines.
An effective framework to characterize the pipe behavior on a soil is to use the combined loading failure envelope in the V-H space. The initial pipe embedment into the seabed is a primary input related to the subsequent response under an oblique load. During the laying process or the operating period, additional embedment relative to the embedment expected from the self-weight can be induced due to both stress concentrations at the touchdown zones and the soil remolded by the cyclic movements of the pipeline [4]. Moreover, the pipe embedment may be influenced by the seabed mobility and liquefaction [6,7,8,9].
In the past few decades, theoretical analyses have been made regarding the settlement and the bearing capacity of offshore foundations [10]. In contrast to the bearing capacity theories for a conventional strip footing with a flat bottom [11], the effects of the curved pipe–soil interface need to be investigated. Karal [12] proposed an upper bound solution for the vertical bearing capacity of a partially embedded pipe by assuming a wedged pipe–soil interface. Such simplification as a wedged pipe–soil interface might be reasonable for the small pipe embedment condition, but a significant error could be generated with increasing embedment. Numerical limit analysis was employed by Martin and White [13] to investigate the ultimate bearing capacity of a rigid, plane-strain pipe segment embedded in undrained clay. Two extreme cases were considered in their limit analysis, where the pipe–soil interface can sustain either zero shear stress (smooth pipe) or the full shear strength of the adjacent soil (rough pipe).Taking account of the geometric curvature effect of the pipe, the adhesion/friction at the pipe–soil interface, and/or the internal friction of the soil, Gao et al. [14,15] presented slip-line field solutions of the vertical bearing capacity under undrained and fully drained condition, respectively. These slip-line field solutions are essentially extensions from the conventional bearing capacity theories for the strip footings and can thereby be degenerated into Prandtl’s solutions for conventional strip footings by neglecting the geometric curvature of the pipe. Via a parametric study, an overestimation up to 28.5% regarding the vertical bearing capacity would emerge, if the circular pipe was simplified as a conventional strip footing. Recently, this geometric curvature effect on the vertical bearing capacity was adopted in the new version of the DNV-GL Recommended Practice [16]. In addition to theoretical analyses, numerical modelling has been employed to investigate the vertical pipe–soil interactions [17,18]. Detailed information associated with evolution of both soil plastic strains and pipe-pushing-induced berms can be obtained through numerical simulations.
The lateral instability of a deep-sea pipeline could be triggered by the drag force due to ocean currents, including turbidity flow, or the variation of the temperature and internal pressure of the pipeline while transporting oil and gas with high temperatures [19,20]. An empirical model by Wagner et al. [21] was adopted to predict the ultimate lateral resistance in the DNV Recommended Practice [22]. In this model, the lateral resistance consists of a sliding-resistance vector component and passive-pressure vector component, which, however, should not be directly summed in the scalar form. Recently, Gao et al. [23] proposed an analytical solution of the ultimate lateral resistance for pipelines partially embedded in a sandy seabed based on Coulomb’s theory of passive earth pressure. The effect of the seabed sloping angle was also considered in Gao et al.’s solution.
To investigate the undrained behavior of a rigid pipe on a clayey soil when subjected to an obliquely downward load, a force-resultant plasticity model was proposed by Hodder and Cassidy [24]. In addition, the families of failure envelopes fitted by simple equations have been proposed by adopting the upper bound plasticity theorem [25,26] and the small-strain finite element method [27,28]. These failure envelopes form a practical basis for assessing the stability of submarine pipelines. Moreover, some numerical simulations regarding the full process of undrained penetration and large-amplitude lateral displacement for the pipelines laid on a clayey seabed were presented by using large-deformation finite element methods and incorporating a softening rate-dependent soil model [18,29].
Under shallowly embedded conditions, the light pipe tends to rise from its as-laid position, while the heavy one tends to move downwards [9]. The vertical component of pipe displacement affects not only the pipe displacement, but also the lateral soil resistance and the instability modes. It is vital to accurately predict the critical submerged weight of the pipe to distinguish the light and heavy pipes. The process associated with the large lateral displacement of a pipeline was experimentally and numerically studied by Tian and Cassidy [30] and Chatterjee et al. [31], respectively. Their results indicated that the movement trends for either the upward or the downward were mainly dependent on the overpenetration ratio (e.g., the ratio of the vertical ultimate bearing capacity to the submerged pipe weight for a pipeline initially laid on the seabed) and the dimensionless embedment of the pipe. For accurately predicting the instability trajectory of a partially embedded pipe under a combined vertical and horizontal loading, how to distinguish the light and heavy pipes needs to be further investigated.
The present study aims to reveal failure mechanisms and to predict the instability trajectory of an obliquely loaded pipe on the clayey seabed. A series of plane-strain elastoplastic finite element (FE) analyses were conducted to investigate the effects of pipe–soil interface roughness and the relative pipe embedment on the pipe behavior. The evolution of slip mechanisms within the underlying soil is presented for the obliquely loaded pipelines. Based on parametric study, empirical equations are proposed for the critical submerged weight of the pipe to distinguish between the ‘heavy’ and the ‘light’ modes of the lateral instability of a partially embedded pipeline.

2. Numerical Modelling

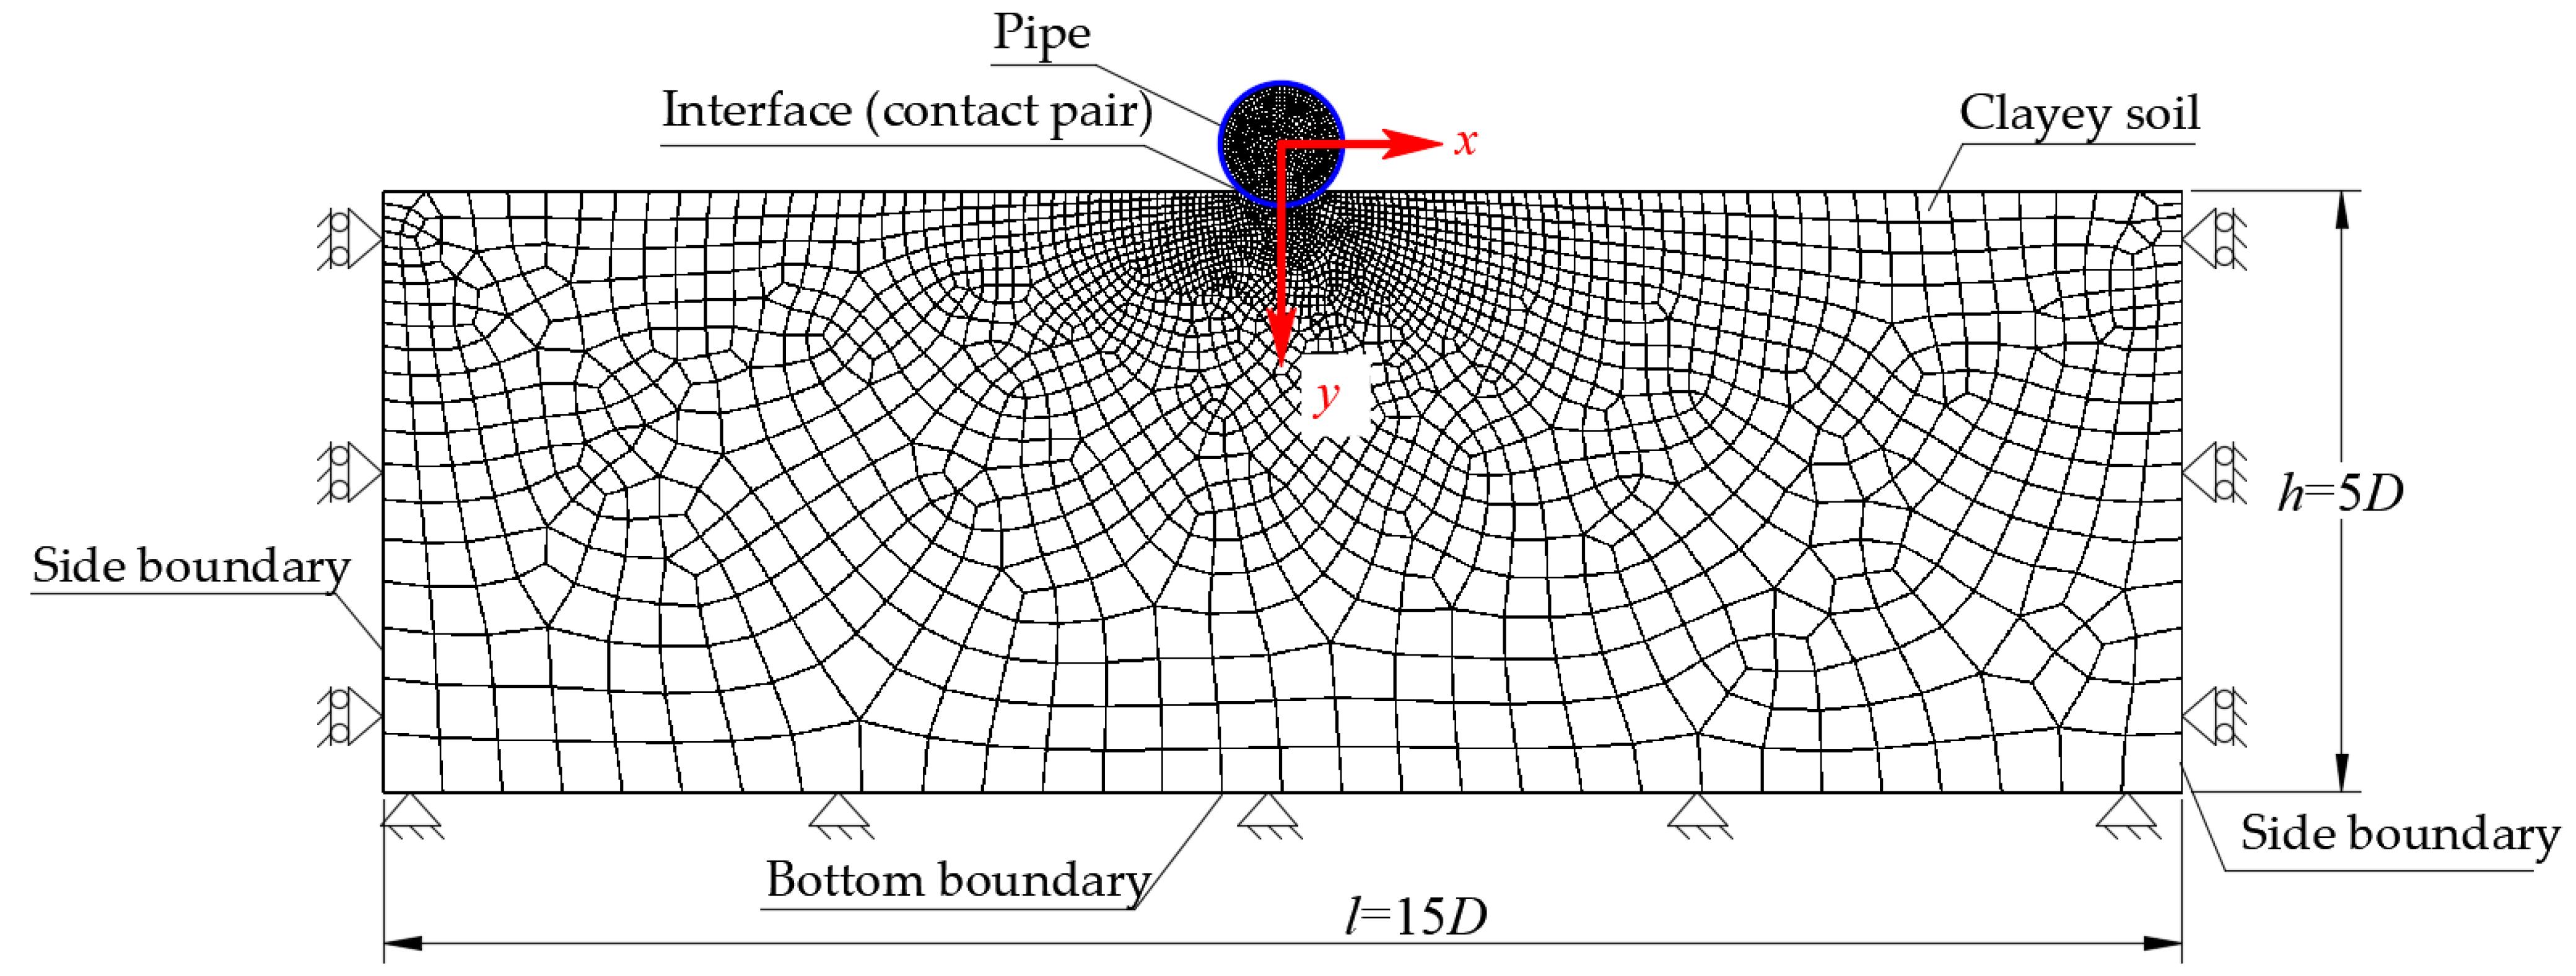
2.1. Finite Element Mesh and Boundary Conditions

For a long and straight pipeline laid on the seabed, the pipe–soil interaction in the V-H space can be regarded as a plain strain problem (see Figure 1). When a partially embedded pipe is obliquely loaded to move in a specified direction, a slip zone with curved boundary in the soil could be mobilized adjacent to the pipe–soil interface. The meanings of the symbols in Figure 1 are as follows: the point O is the center of a pipe section with the diameter of D and the embedment of e. The line OB is in the vertical direction. The point A is the left boundary of the slip mechanism on the right side. The point E is the intersection point of the pipe surface and the mudline. Arc ACE is the pipe–soil interface. The shear stress f on the pipe–soil interface is zero at point C and in the opposite direction on arcs AC and CE. Lines OD and OF are the directions of the ultimate load Fu (including the submerged pipe weight) and the corresponding pipe movement, respectively. The angle of the slip zone boundary (∠BOA), the “zero” shear stress point (∠BOC), the load direction (∠BOD), the pipe embedment (∠BOE) and the movement direction (∠BOF) are termed as εs, εf, εF, θ0 and εu, respectively. The counterclockwise direction from OB is defined positive.
A plane-strain FE model was developed using the commercial package ABAQUS [32] to simulate the pipe–soil interaction. Figure 2 illustrates the meshes of a partially embedded pipe and its surrounding soils for the case of the embedment ratio e/D = 0.1. The width and depth of the soil domain were set as 15D and 5D, respectively.
Both the soil and the pipe are simulated with 4-node bilinear plane strain reduced integration quadrilateral element (CPE4R). The dimensions of meshes were tested by a mesh sensitivity study. The mesh dimension on the bottom and side boundary of soil domain ranged from 1/3D to 1/10D. Referring to the numerical model by Merifield et al. [28], in which the typical mesh dimension around the pipe–soil interface was about 1/28D for e/D = 0.3, we chose the mesh dimension ranging from 1/25D to 1/50D near the pipe–soil interface for 0.1 ≤ e/D ≤ 0.5 to secure the computational accuracy.
The large deformation of the meshes may occur near the pipe–soil interface, especially for the meshes adjacent to point A (see Figure 1) during the horizontal swipe of the pipe. The adaptive meshing technique (ALE) [32] is used on the soil elements to maintain the high quality of meshes during the process of pipe–soil interactions. By employing the ALE technique, the distort elements can be renewed with the deformation of the geometric model, so that the meshes are adjusted to their optimal shapes to secure the computational accuracy. That is, the resulting topology is maintained and the variables are remapped to the updated meshes during the adjusting process.
The horizontal displacement was restrained on both sides of the soil domain. Both the horizontal and vertical displacement were restrained at the bottom of the soil (see Figure 2). The rotation of the pipe was restricted. The contact-pair algorithm was applied on the pipe–soil interface. The pipe surface was set as the master surface, while the soil surface was the slave surface. The pipe–soil interface friction ratio α, which is defined as the ratio of shear strength of the pipe–soil interface to the undrained shear strength of the soil, was adopted to set the maximum allowable shear stress at the interface as αsu. The value of α ranges from 0 for a smooth interface to 1.0 for a fully rough interface. In design, it is common to assume that a pipe–soil interface extending to the free surface cannot sustain tension, because a crack may open [13]. In the present simulation, the pipe–soil interface can sustain shear stress αsu, but cannot sustain tension. For the aluminum pipe commonly used in pipe–soil interaction tests, α is approximately in the range of 0.30 to 0.36 [33,34]. A kinematic coupling constraint was imposed between the nodes of model pipe and the reference point at the pipe center. The translational displacement of the model pipe was applied on the reference point, then transferred to the pipe section by the coupling constraint.

2.2. Constitutive Models

The pipe–soil interaction for a clayey seabed was assumed to be in perfectly undrained condition. The pipe elements were assumed to obey the isotropic linear elastic constitutive model (see Equation (1)), while the soil was modelled as a uniform isotropic elastoplastic continuum with the failure described by the Tresca yield criterion (Equations (2)–(4)). The cohesion of the clayey soil was characterized by the undrained shear strength su.
[ σ xx σ yy σ zz σ xy σ yz σ xz ] = E ( 1 ν ) ( 1 + ν ) ( 1 2 ν ) [ 1 ν 1 ν ν 1 ν 0 0 0 ν 1 ν 1 ν 1 ν 0 0 0 ν 1 ν ν 1 ν 1 0 0 0 0 0 0 1 2 ν 2 ( 1 ν ) 0 0 0 0 0 0 1 2 ν 2 ( 1 ν ) 0 0 0 0 0 0 1 2 ν 2 ( 1 ν ) ] [ ε xx ε yy ε zz ε xy ε yz ε xz ]
J cos Θ = s u
J = ( ( σ 1 σ 2 ) 2 + ( σ 2 σ 3 ) 2 + ( σ 3 σ 1 ) 2 ) / 6
Θ = arctan ( ( 2 σ 2 σ 3 σ 1 σ 3 1 ) / 3 )
where σij represents the normal and shearing stress in the three-dimensional Cartesian coordinate system, and εij represents the normal and shearing strain. J is the deviatoric stress and Θ is Lode’s angle. σ1, σ′2, and σ3 are the first, second and the third principal stress, respectively. The elastic behavior is described by the Poisson’s ratio νs = 0.49, and the Young’s modulus of the soil Es = 50 MPa. As Es barely affects the ultimate bearing capacity of the pipe [35,36], the present relatively large value of Es = 50 MPa was adopted to ensure that the soil’s elastic deformation would not change the initial embedment of the model pipe.

2.3. Properties of the Pipe and the Clayey Soil

A total of 225 cases were analyzed numerically. The dimensionless parameters α, e/D and εu were the independent variables. A wished-in-place model pipe was set on the flat seabed with initial embedment no more than 0.5D. The model pipe was then obliquely loaded to move relative to the seabed in a specific direction, which is characterized by εu. The value of εu was zero for the vertical penetration (see Figure 1). The model pipe displacement, soil resistance, normal and shear stresses on the pipe–soil interface, equivalent plastic strain (PEEQ) were recorded synchronously. The numerical simulation was terminated after the soil resistance reached its residual value.
The outer diameter of the model pipe D was 0.46 m, which is equal to the out-transferred pipeline diameter of LS 17-2 gas field (Northern South China Sea, the water depth ranging from 500 m to 1500 m; see Liu et al. [2]). The initial pipe embedment e ranged from 0.1D to 0.5D. Significant achievements have been made to evaluate marine soil strength in the deep waters [2,37]. According to a series of Torvane tests conducted in the LS 17-2 gas field [2], the average untrained shear strength of the soft clayey soil within the depth of 0~1.0 m below the mudline is 3.2 kPa, which was adopted as the undrained shear strength of the seabed in the present simulations. As the clayey soil around the shallowly embedded pipe is under the undrained condition and the disturbed depth is limited, the soil model can be assumed to be uniform and weightless [13]. The input data for the numerical simulations are listed in Table 1.
These analyses involved several simplifications that made the numerical model less sophisticated. The heaves around the shoulders of the pipe were generated during the installation, which may subsequently vanish due to scour effect [38]. The pipe model was ‘wished-in-place’ in this study, indicating an absence of the soil heave effect on the ultimate soil resistance. In deep waters, the submarine pipelines are usually no longer buried, but laid directly on the seabed [39]. It was assumed that the anti-rolling pipe was shallowly embedded into the uniform clayey seabed [14,40]. Note that the vertical profile of soil strength could have certain influence on the pipe–soil interactions.

3. Results and Discussion

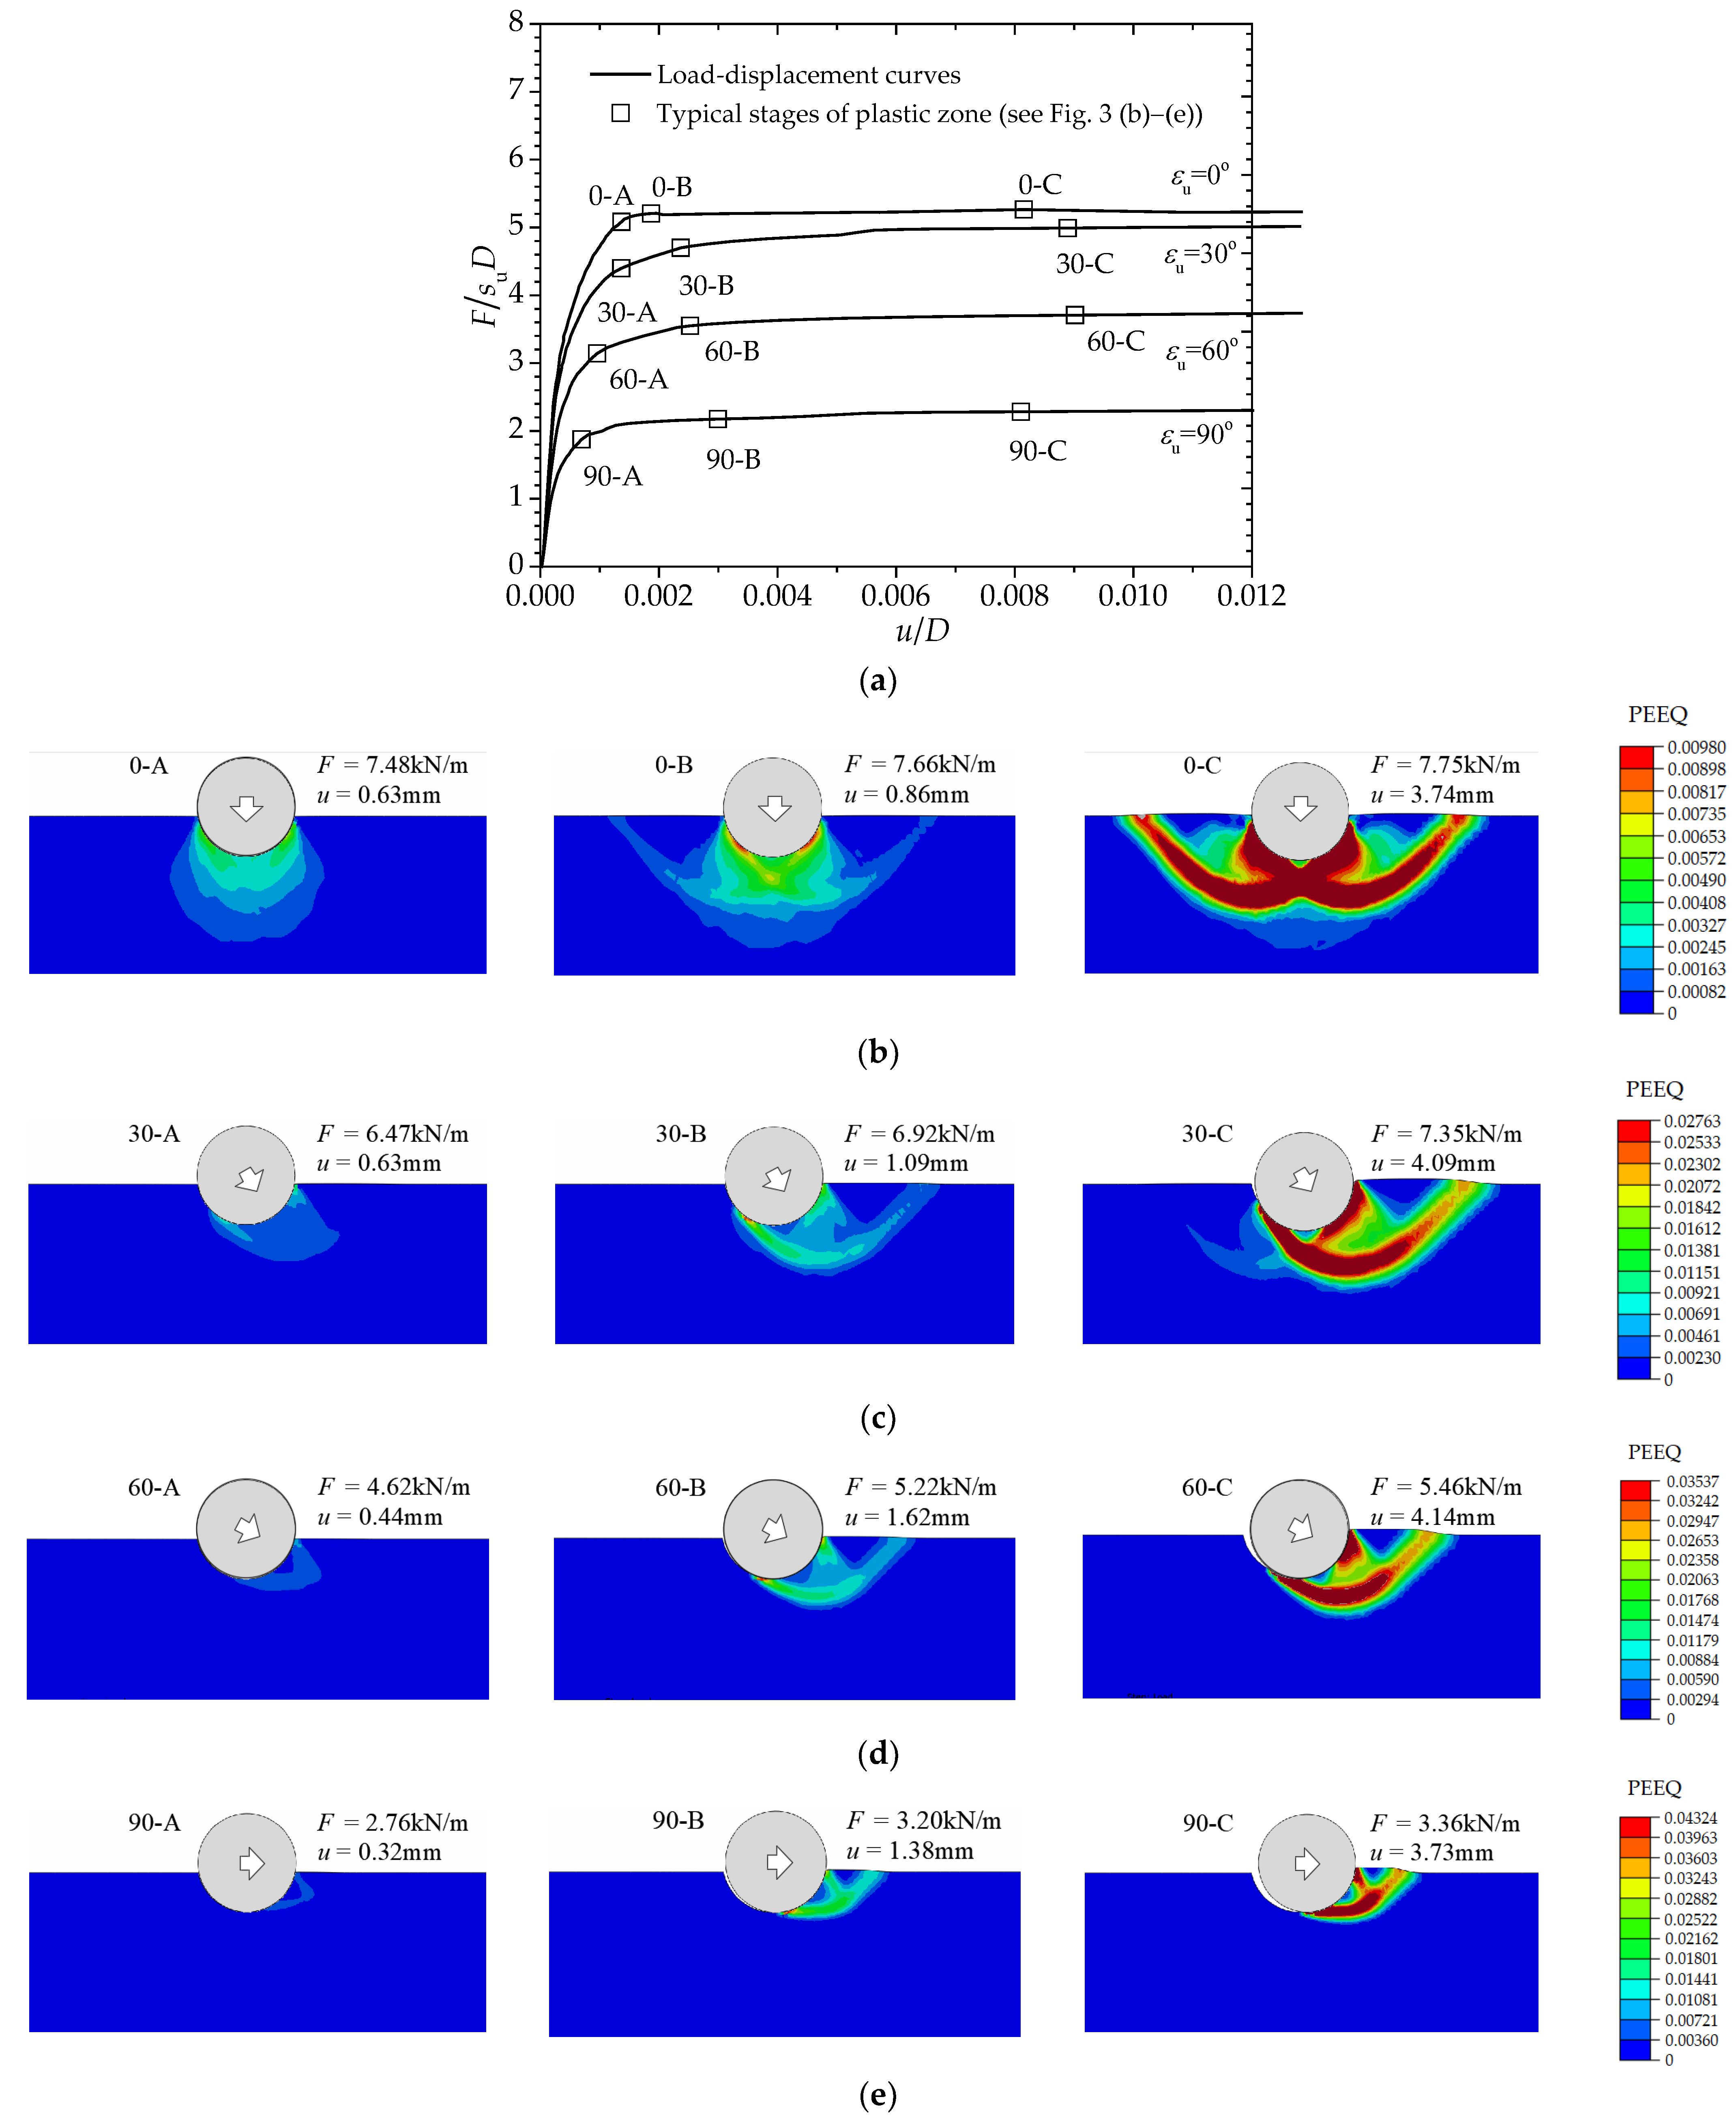
3.1. Failure Mechanism

The soil resistance F onto an obliquely loaded pipe and the evolution of equivalent plastic strain zone in the soils were recorded. The normalized force-displacement curves are presented in Figure 3a for four representative load angles, i.e., εu = 0° (vertical), 30° (oblique), 60° (oblique), and 90° (horizontal). The soil resistance gradually approaches its ultimate value with the increase in pipe displacement. The maximum value of the ultimate bearing capacity was achieved for the case of vertical penetration. As the load direction shifts from vertical (εu = 0°) to horizontal (εu = 90°), the ultimate soil resistance decreases significantly.
The evolution processes of the equivalent plastic strain (PEEQ) within the seabed under various load angles are illustrated in Figure 3b–e, which reflect the development of the slip mechanism in the soil. In Figure 3, “PEEQ” denotes the equivalent plastic strain in the soil. Since the pipe displacement is generally very small under the ultimate condition (u/D < 0.004, as indicated by Figure 3a), the pipe displacement and soil deformations are of 10 times magnification so that the separation on the pipe–soil interface can be easily identified. The plastic zone firstly appears in the soil adjacent to the pipe (point A in Figure 3). Then, the slip mechanism is fully generated when the plastic zone spreads to the soil surface (point B in Figure 3) with the soil resistance approaching its maximum value. The soil resistance at point B is regarded as the bearing capacity due to the slip mechanism being completely formed at this point. The soil resistance exhibits only slight increase with increasing pipe displacement after point B.
For the pipe–soil interaction under the oblique loading (e.g., εu = 30°, see Figure 3c), the slip mechanism first emerges on the front side and then a plastic zone is observed on the back side as the soil resistance approaches its residual value. The area of plastic zone on the back side decreases rapidly as εu increases. The position of the slip zone boundary within the soil can be characterized by εs (see Figure 1). The relationship between εs and the movement angle (εu) is presented in Figure 4. It is indicated that for εu > 45°, the calculated values of εs match well with the prediction by Equation (5):
ε s = ε u π / 2

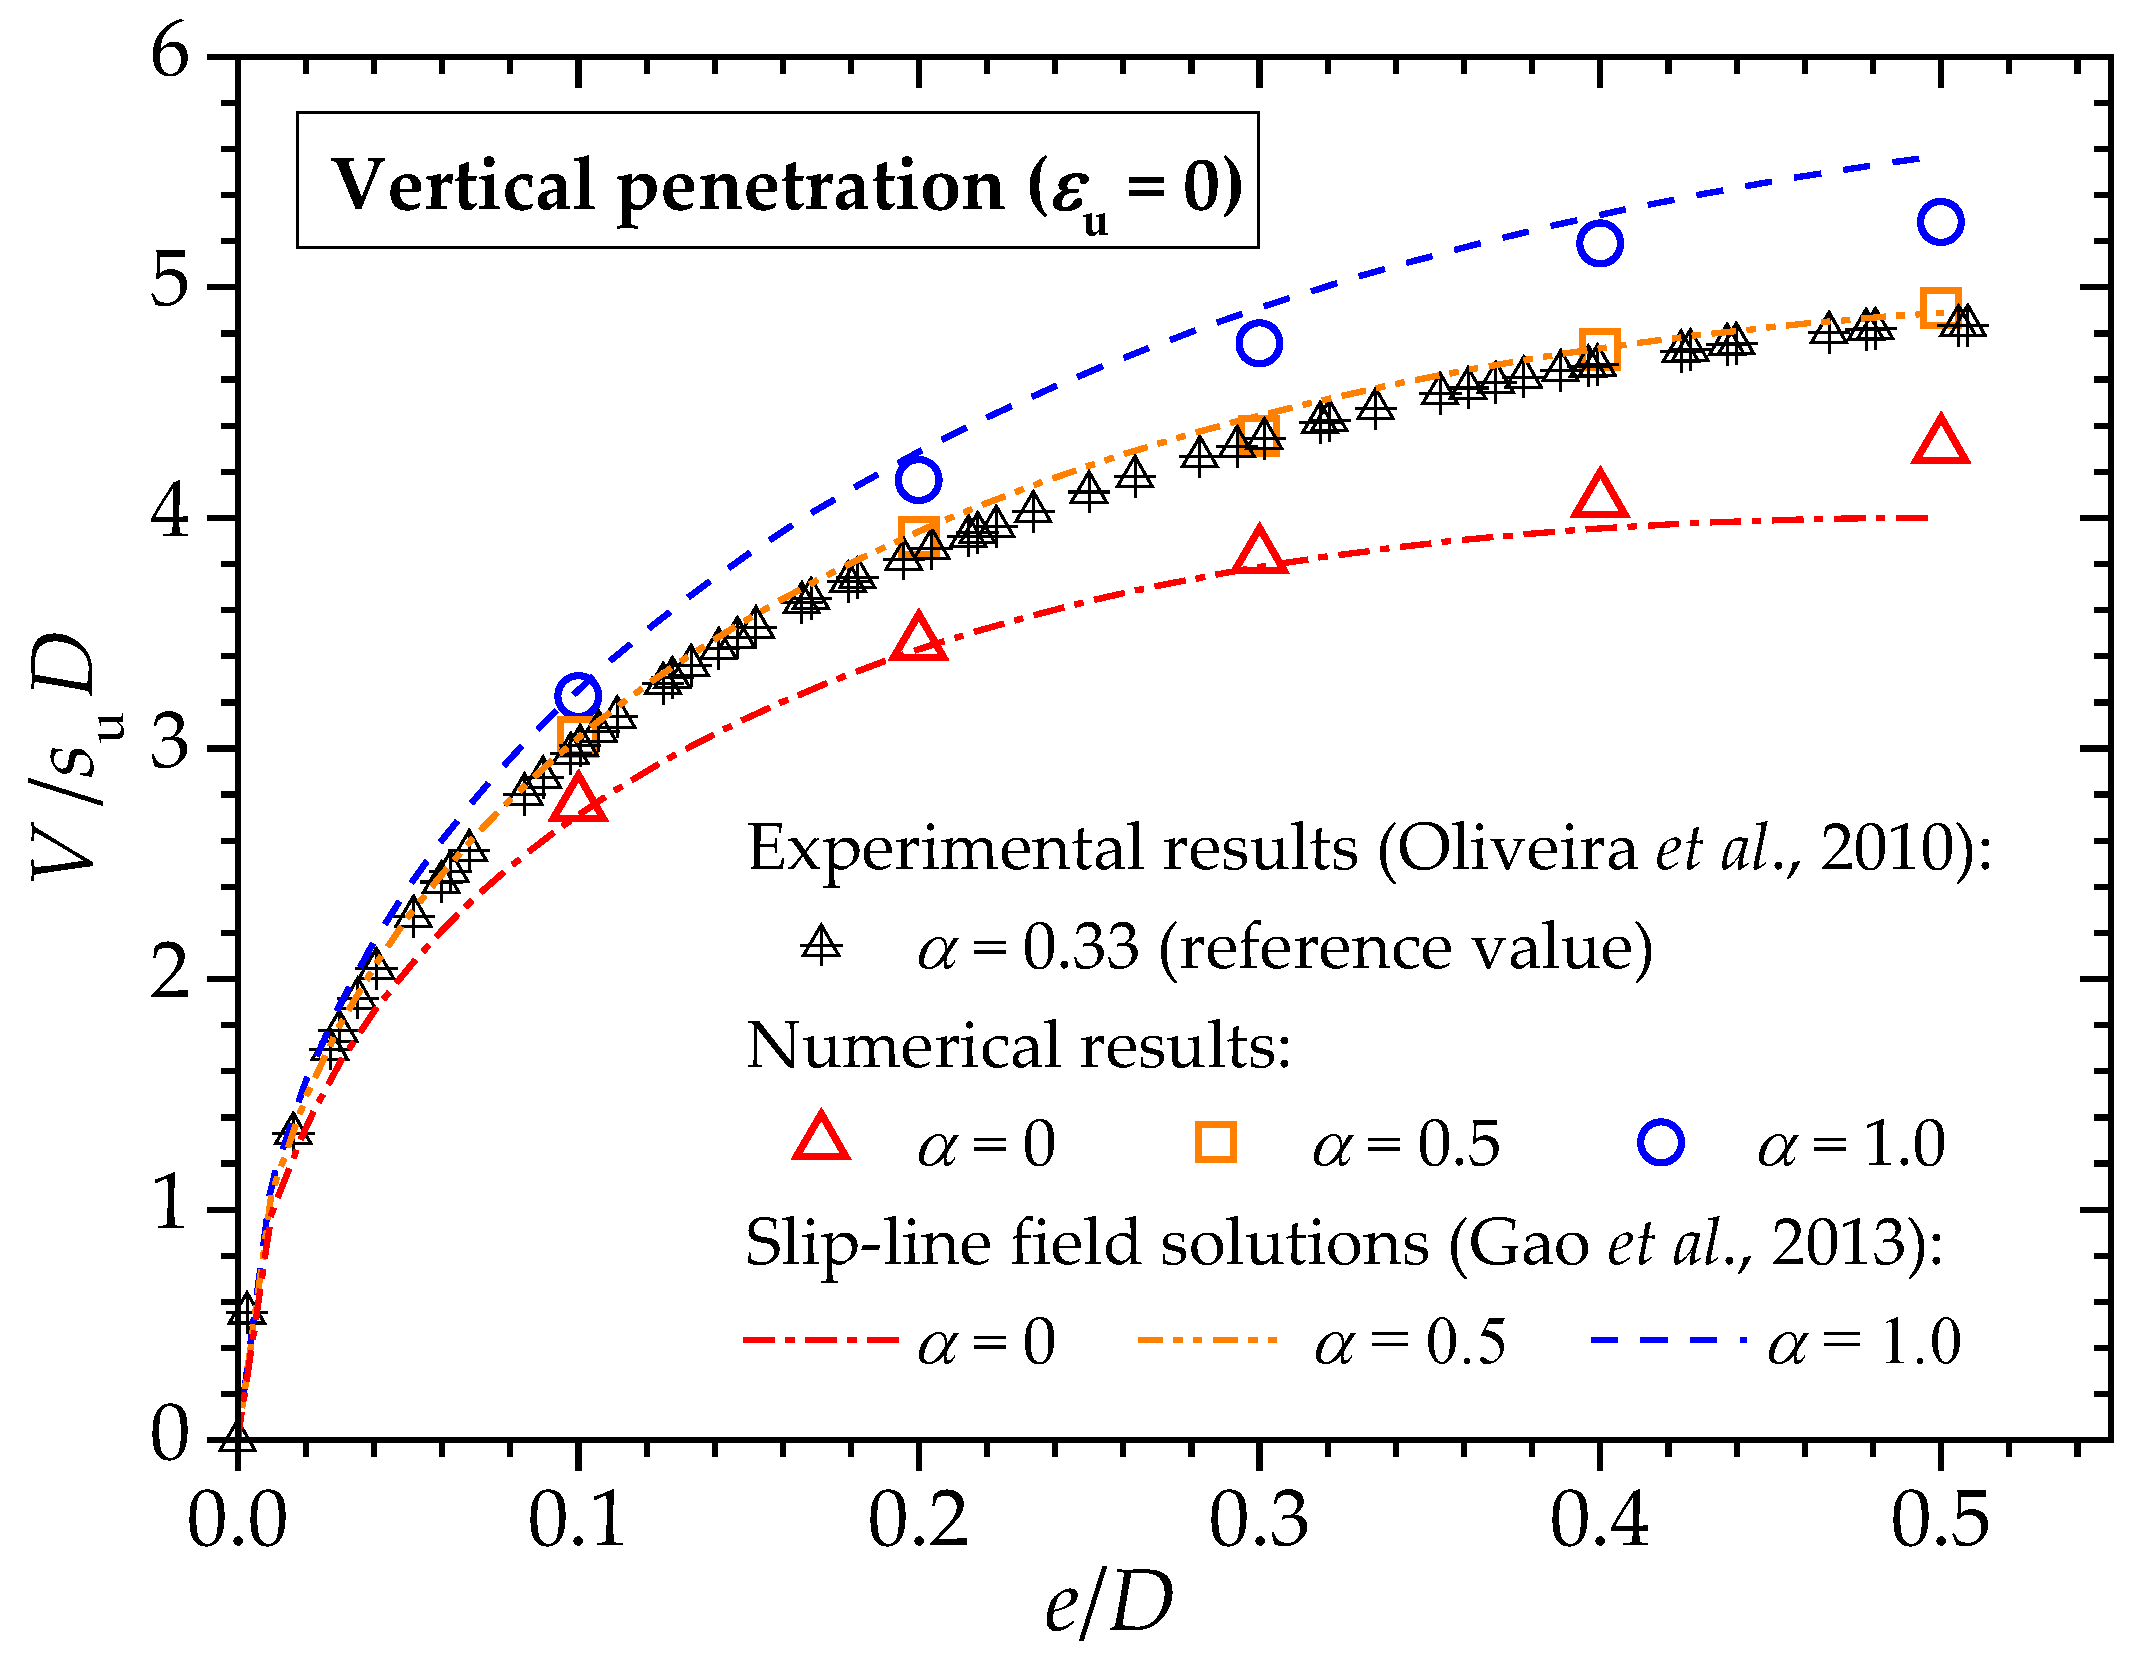
3.2. Ultimate Bearing Capacity for Vertical and Horizontal Instability

A series of mechanical loading tests were conducted by Oliveira et al. [41] for partially embedded and shallowly buried model pipes on the reconstituted clay sampled from Guanabara Bay. The metal model pipe was forced to move in the vertical and horizontal direction, respectively. The reference range of α was proposed as 0.30~0.36 for a smooth aluminum pipe [33,34]. The soil resistances in both directions were measured synchronously. The comparisons between the experimental results of Oliveira et al. [41] and the present numerical results for the vertical penetration (εu = 0°) and the horizontal swipe (εu = 90°) are shown in Figure 5 and Figure 6, respectively. The vertical component of the ultimate bearing capacity is termed as V, while the horizontal component is denoted by H.
As shown in Figure 5, the vertical bearing capacity rapidly increases with the increase in pipe embedment for e/D ≤ 0.25 and the growth rate significantly decreases for 0.25 < e/D ≤ 0.5. The vertical bearing capacity is in a positive correlation with the interface friction ratio of the pipe–soil interface (α). The effect of α on the vertical bearing capacity becomes more striking with the increase in e/D. The present numerical results of the vertical soil resistance for α = 0.5 match well with the measured ones in vertical penetration tests by Oliveira et al. [41]. Gao et al. [14] proposed a slip-line field solution for the vertical bearing capacity of a pipeline on clayey seabed. Assuming that the absolute value of shear stress on the pipe–soil interface is αsu, the shearing and normal stress on the pipe–soil interface can be calculated as follows:
f = α s u
σ = σ A + s u ( π + arcsin α 2 θ ) + s u 1 α 2
where f and σ are the shear and normal stress of an arbitrary point on the pipe-soil interface, respectively. σA is the mean stress on the seabed surface. θ is the position angle of the point on the pipe–soil interface (θ = 0 for the bottom point). Assuming that the shear stress is uniformly distributed on the pipe–soil interface, the normalized vertical bearing capacity V/suD for e/D < 0.5 can be predicted by:
V | ε u = 0 / ( s u D ) = sin θ 0 ( 1 + arcsin α + π + ( 1 α 2 ) 0.5 2 θ 0 ) + ( α + 2 ) ( 1 cos θ 0 )
The theoretical results calculated by Equation (8) are also shown in Figure 5. The numerical results are generally consistent with the theoretical solutions for α = 0.5.
Under the horizontal loading conditions shown in Figure 6, both the vertical (V) and horizontal (H) component of the ultimate bearing capacity increases with the increase in pipe embedment. In contrast to the positive correlation between V and α for the cases of vertical penetration, increasing α renders V decrease for cases of horizontal swipe. Moreover, the effect of α on V gradually reduces with the increase in e/D. The present numerical results of H and V for α = 0.5 generally agree with the horizontal swipe tests by Oliveira et al. [41] for a small embedment ratio.
Figure 7 shows the distribution of the shear stress along the pipe–soil interface under the ultimate state for the movement angle εu = π/2. The absolute value of the shear stress reaches its maximum αc (= 3.20 kPa) on the edge of the pipe–soil interface, while the directions of the local shear stress vary along the interface. The numerical results indicate that, for εu < 45°, the shear stress along the pipe–soil interface has different directions on the left and right side of the pipe’s geometric center. With the increase in εu, the plastic zone within the soil reduces (see Figure 3), while the direction of the shear stress on the interface tends to be identical (see Figure 8; note: εf represents the position where the shear stress is zero). Referring to Figure 8, the correlation of εf with εu can be represented by Equation (9):
ε f = { 0 ε u π / 4 ( ε u < π / 4 ) ( π / 4 ε u π / 4 + θ 0 )
Referring to the correlation between εf and εu (see Figure 8), for the horizontal swipe case, the magnitude of the contact shear stress τ on the pipe–soil interface can be reasonably assumed to be αc with the direction of τ reversing at the position θ = π/4. Note that the pipe and its underlying soil surface disconnect with each other at θ = 0. By integrating σ and τ using Equations (6) and (7) along the pipe–soil interface, the dimensionless horizontal and vertical components of the ultimate bearing capacity for the horizontal swipe tests can be calculated by Equations (10) and (11), respectively:
H / ( s u D ) = 0 π / 4 ( f | s u cos θ + σ | s u sin θ ) d θ + π / 4 θ 0 ( f | s u cos θ + σ | s u sin θ ) d θ
V / ( s u D ) = 0 π / 4 ( f | s u sin θ + σ | s u cos θ ) d θ + π / 4 θ 0 ( f | s u sin θ + σ | s u cos θ ) d θ
Submitting Equations (6) and (7) into Equations (10) and (11), the theoretical solution of the dimensionless ultimate soil resistance can be expressed as follows:
H / ( s u D ) = sin θ 0 + 1 2 cos ( θ 0 Δ ) 1 2 cos Δ 2 2 sin Δ +   1 2 ( π 2 θ 0 + Δ ) cos θ 0 2 2 Δ + 1 2 ( cos θ 0 π + Δ 1 )
V / ( s u D ) = cos θ 0 1 2 sin ( θ 0 Δ ) 2 1 2 sin Δ 1 2 ( π 2 θ 0 + Δ 1 ) sin θ 0 + 2 2 Δ 1
where Δ = arcsin α .
The slip-line field solutions of the ultimate soil resistance for the horizontal swipe case are plotted in Figure 6. The analytical solutions generally match well with the numerical results for the cases of α = 0 and 0.5. The vertical component of the ultimate soil resistance V decreases with the interface friction ratio α. The horizontal component H decreases with α, when the value of α is small. Nevertheless, for the fully rough pipe–soil interface (α = 1.0), the slip mechanism generated according to the slip-line field theory would distort at the pipe–soil interface when θ < π/4, which may reduce the soil resistance (see Figure 6b).

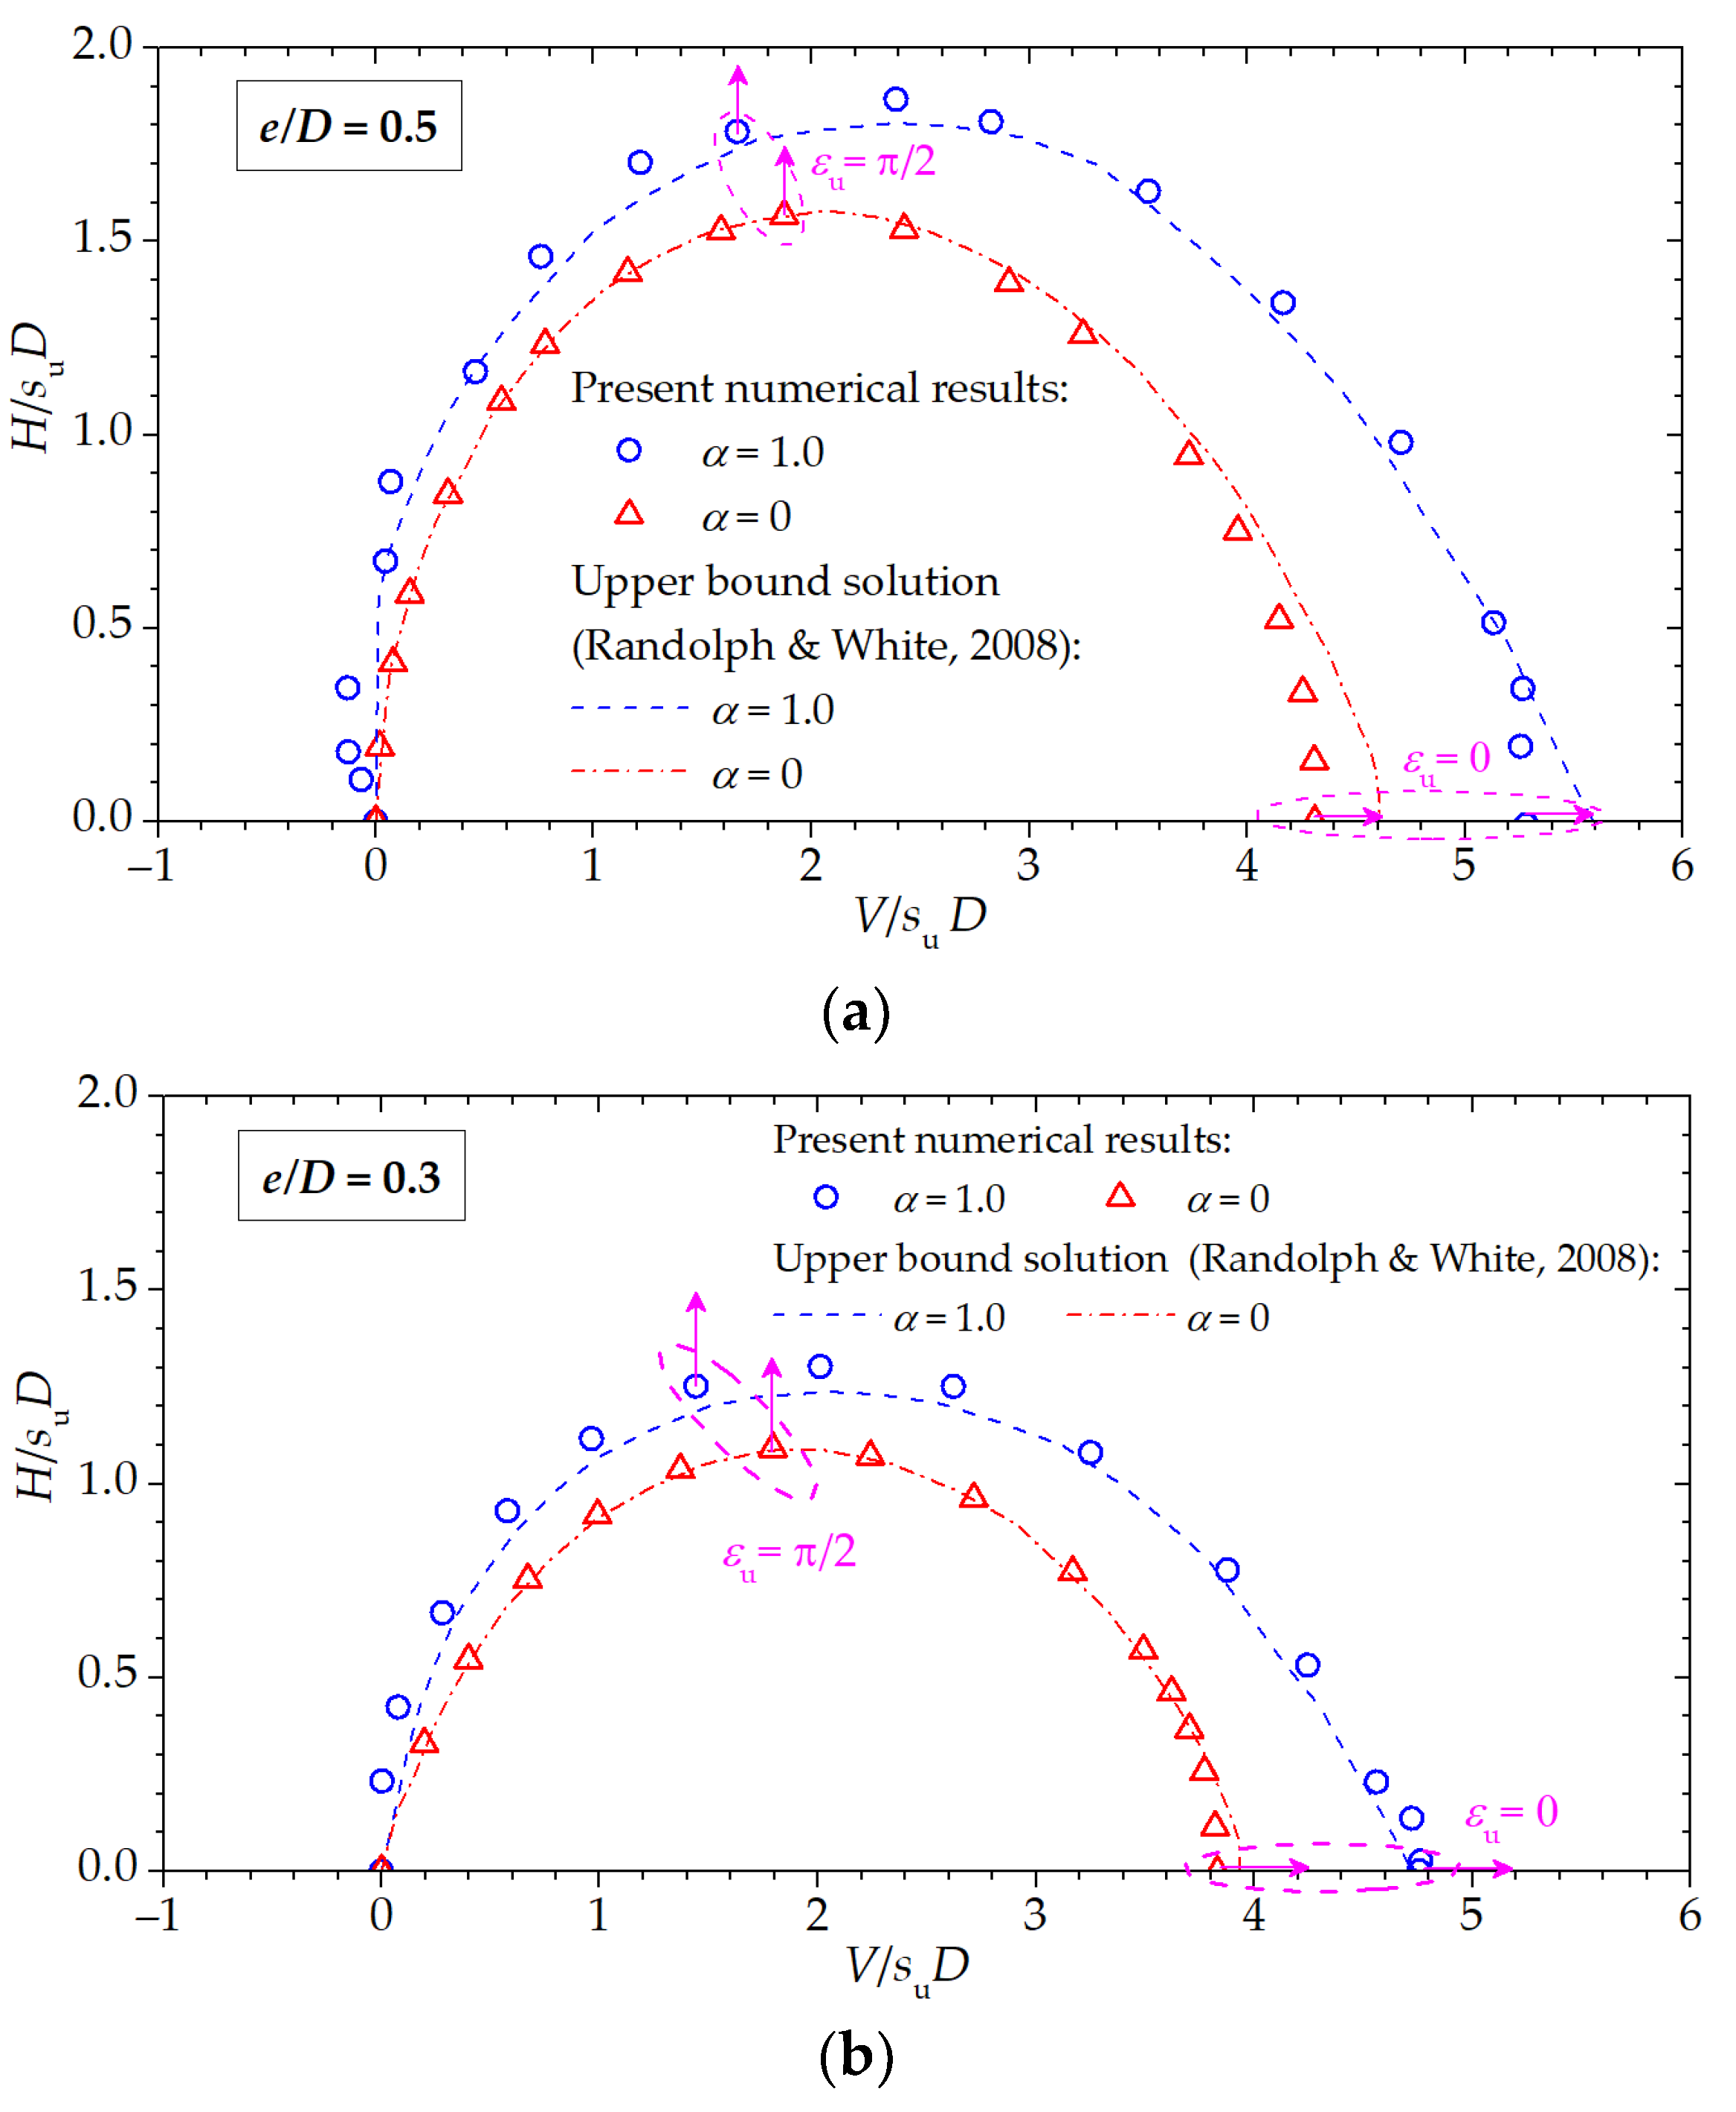
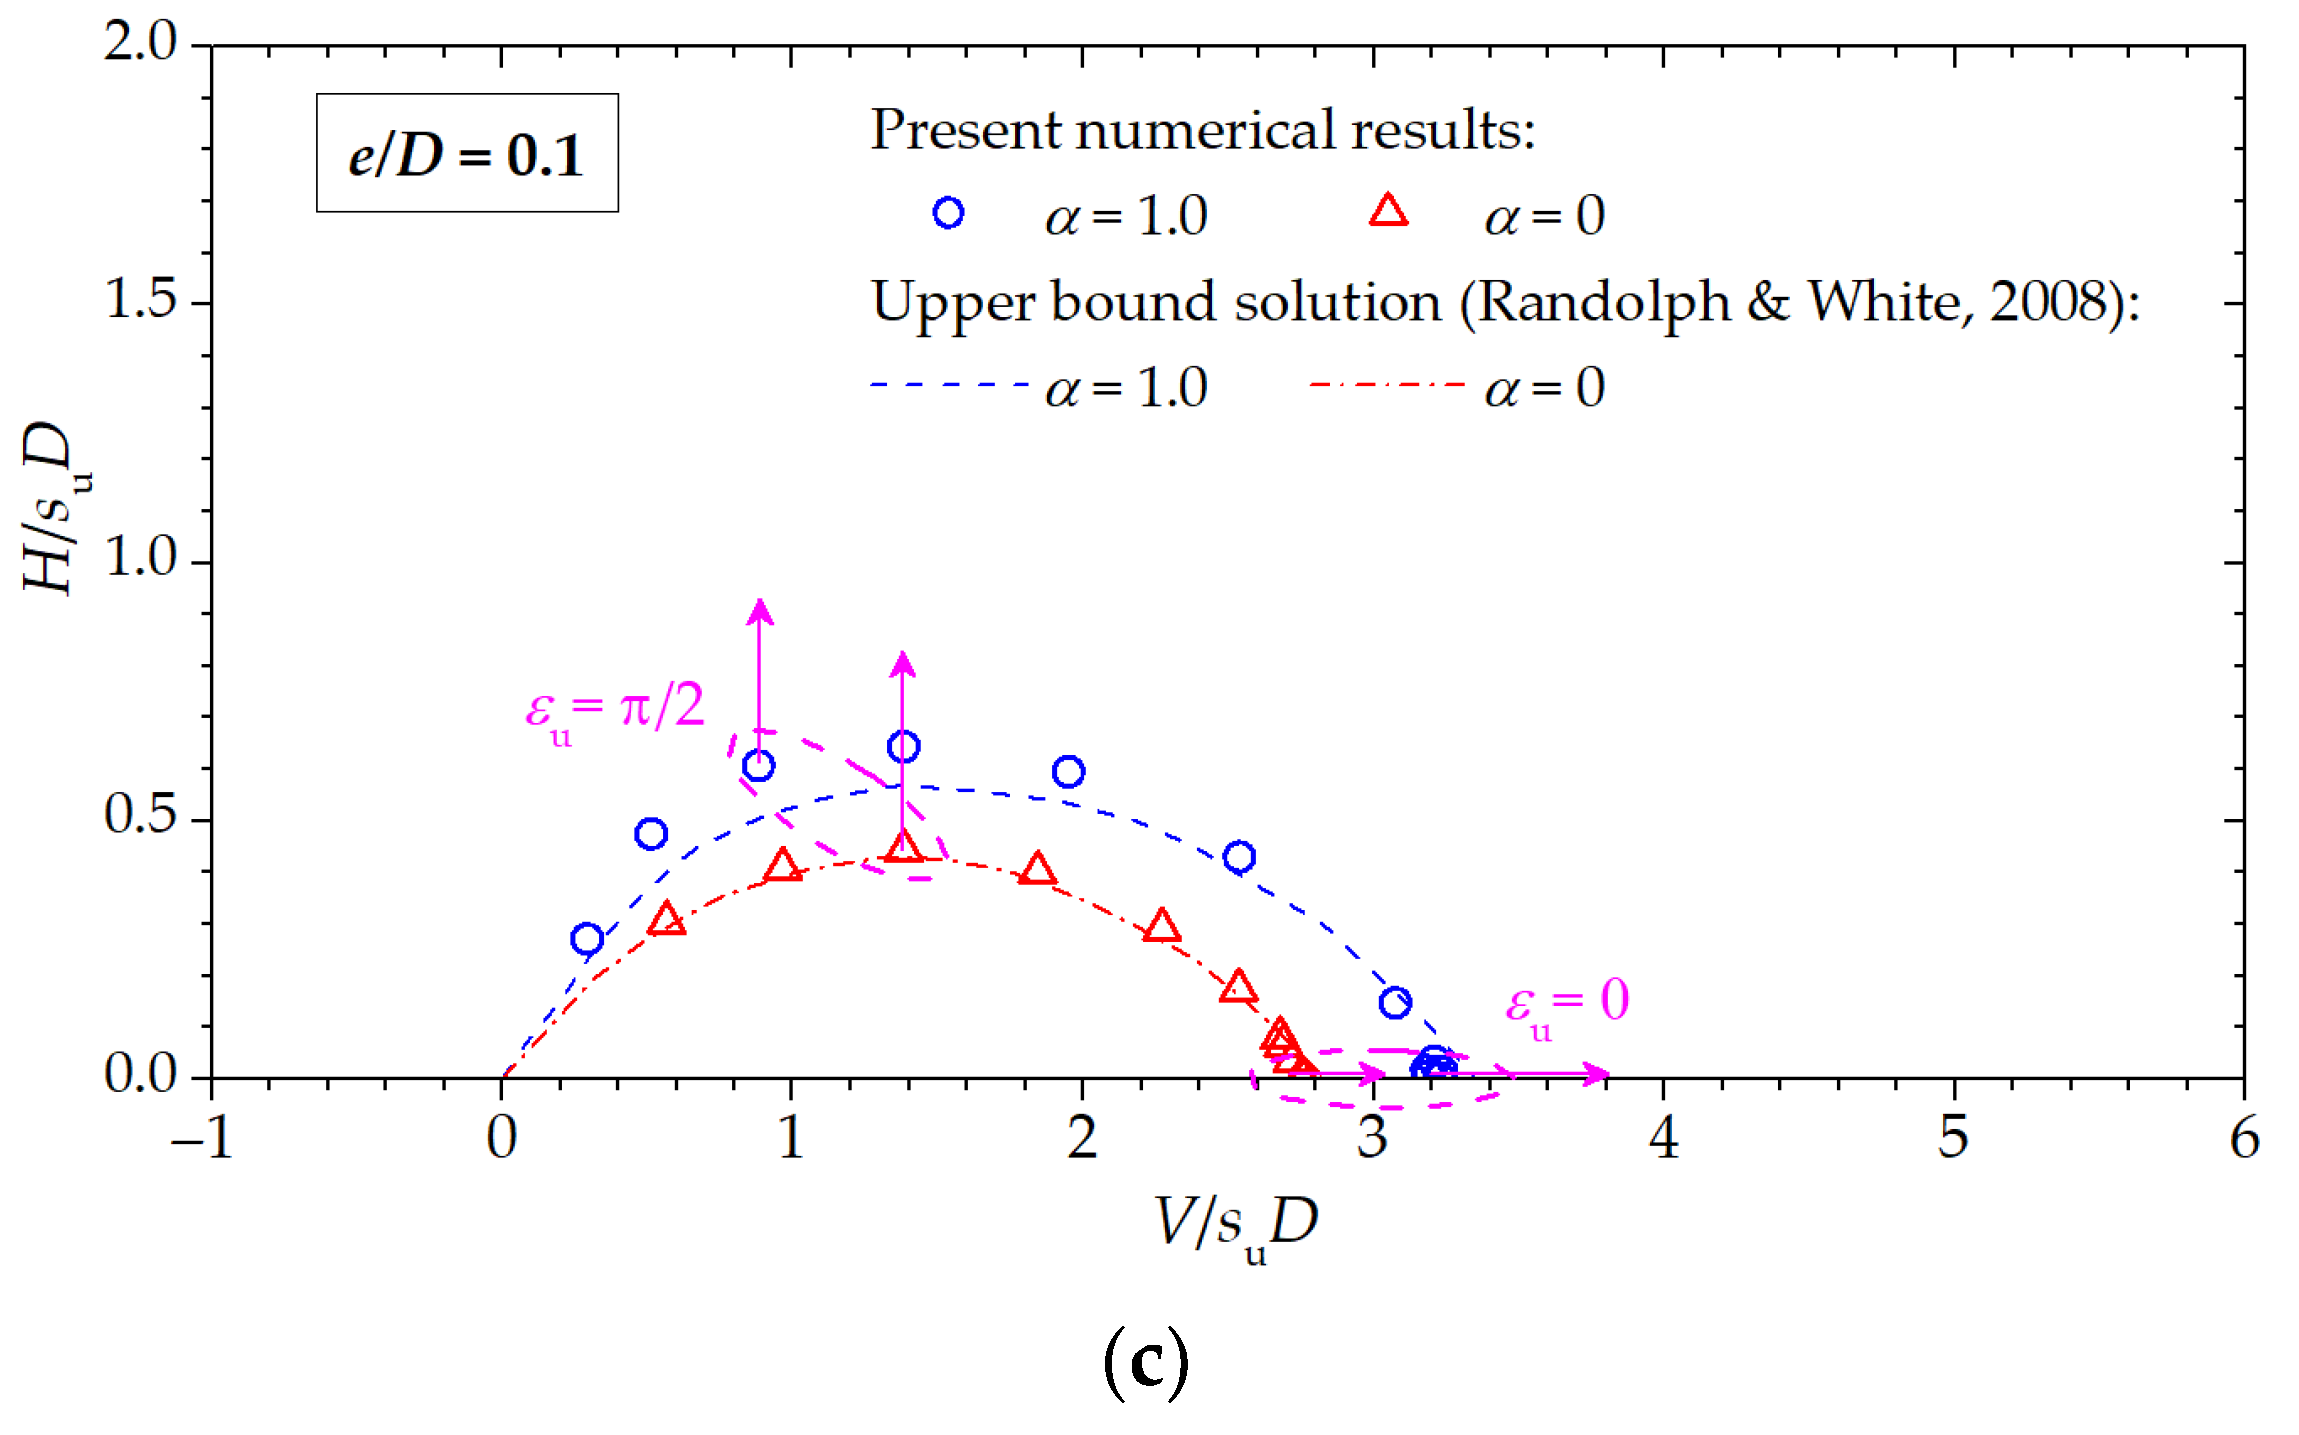
3.3. Failure Envelopes

The failure envelopes obtained from the present numerical simulations are shown in Figure 9, along with those from the upper bound solution proposed by Randolph and White [26]. The ellipse-shaped envelopes are generally consistent with the upper bound solutions. As the pipe moves upward and the value of εu approaches its maximum (θ0 + π/2), negative values of V were observed in the present numerical simulations (see Figure 9), especially for the rough pipe–soil interface and the large initial embedment of the pipe. As shown in Figure 9a–c, with the increase in the pipe embedment (e/D) from 0.1 to 0.5, the bearing capacity for the lateral instability (H/suD) increases more significantly than that for the vertical penetration (V/suD). For the fully rough pipe–soil interface (α = 1.0), the values of Vm/Hm are 4.96 and 2.85 for the case e/D = 0.1 and 0.5, respectively. Vm is the maximum vertical ultimate bearing capacity and Hm is the maximum horizontal bearing capacity of the failure envelope. For the smooth pipe (α = 0), the values of Vm/Hm are 6.22 and 2.75 for the case e/D = 0.1 and 0.5, respectively. As εu approaches its maximum value θ0 + π/2, the value of εs increases and the plastic failure zone within the underlying soils becomes smaller.
As shown in Figure 9, the bearing capacity envelope for a partially embedded pipe can be simplified as an ellipse. The length of the long axis represents the bearing capacity for vertical penetration. Compared with the upper bound solution [26], an elliptic envelope makes the bearing capacity much easier to solve. Based on the numerical results, half the length of the short axis of the elliptic envelope (Hm/suD, see Figure 9), the length of the long axis (Vm/suD) and the equation of the envelope can be expressed bys Equations (14)–(16), respectively:
H m / ( s u D ) = 2.5 ( 1 + 0.30 α 0.5 ) ( e / D ) 0.7
V m / ( s u D ) = 5.5 ( 1 + 0.25 α 0.9 ) ( e / D ) 0.3
( H / H m ) 2 + ( 2 V / V m 1 ) 2 = 1
For a partially embedded pipe laid on the seabed with submerged pipe weight (i.e., V = Ws), the critical horizontal breakout load Fbr can be further derived from Equation (16):
F br = H m 1 ( 2 / R 1 ) 2
where R is the overpenetration ratio:
R = V m / W s
Hm and Vm are in correlation with the diameter (D) and the embedment (e) of the pipe, the undrained shear strength (su) of the soil and the interface friction ratio (α) of the pipesoil interface (see Equations (14) and (15)). The overpenetration ratio can be affected by the laying process and the spanning of a pipeline caused by scour or upheaval buckling [42].

3.4. Trajectory of Pipe Instability: Critical Submerged Weight of the Pipe

According to Det Norske Veritas [43], the global buckling of submarine pipelines may occur either horizontally or vertically, which could further induce an ultimate failure mode, such as local buckling, fracture or fatigue. The submerged weight of the pipe is vital for determining the displacement tendency during the development of global buckling.
The present numerical results indicate that the movement direction of a smooth pipe basically obeys an associated flow rule (i.e., the movement tendency is perpendicular to the ultimate bearing capacity envelope; see Figure 9). This finding is generally consistent with the numerical results by Chatterjee [44]. However, for the rough pipes (e.g., α = 1.0; see Figure 9), the flow rule is more likely to be non-associated. Based on the present numerical results, the correlations of the ultimate load angle (εF) with the pipe movement angle (εu) for various values of α are shown in Figure 10. It is indicated that the ultimate load angle εF is in the positive correlation with the movement angle εu, the dimensionless embedment e/D and the roughness coefficient of the pipe–soil interface α. An empirical equation for such correlation is established:
ε F = 0.84 ( e / D ) 0.4 ( 2 ε u / π ) 1.5 ( 1 + α 1.2 ( 2 ε u / π ) / ( 8 ( e / D ) 0.8 ) )
where εF and εu are both in radians. The corresponding curves predicted with Equation (19) are compared with the numerical results in Figure 10. A good consistency can be observed.
For a ‘light’ pipe under a horizontal external load, the pipe embedment and the corresponding horizontal bearing capacity would be gradually reduced during pipe movement, which may result in an uncontrollable lateral movement. By contrast, for a ‘heavy’ pipe, while the pipe breaks out from its original location, the horizontal bearing capacity would be enhanced and a new balance can be achieved with increasing embedment. This would induce a gradually obliquely downward movement. The critical submerged weight of the pipe distinguishes whether the lateral instability is in a ‘heavy’ or a ‘light’ mode. Whether a pipe shallowly embedded on a seabed rises or not while losing lateral stability mainly depends on the submerged weight of the pipe and the bearing capacity of the soil [45]. Based on the present numerical results, an empirical solution for the critical submerged weight of the pipe can be further derived as follows.
For a pipe with a critical submerged weight, the value of εu is equal to π/2 with the pipe losing lateral stability. According to Equation (19), the load direction of the pipe under the ultimate loading can be expressed as:
ε F | ε u = π / 2 = 0.84 ( e / D ) 0.4 ( 1 + α 1.2 / ( 8 ( e / D ) 0.8 ) )
As shown in Figure 11, the predicted values with Equation (20) (termed as εF-pre) match well with the numerical results (εF-num).
For a partially embedded pipe under the ultimate condition, the total ultimate load on the elliptical envelope can be described by Equations (21)–(23):
V = V m ( 1 cos β ) / 2
H = H m sin β
H / V = tan ε F
where H and V are the horizontal and the vertical component of the total ultimate load (Fu), respectively. Note that V includes the submerged weight per unit length of the pipe (Ws) and the vertical component of the external load (Vex), i.e., V = Ws + Vex. The comparison between the predicted values of the non-dimensional ultimate load (Fu-pre/suD) and numerical results (Fu-num/suD) is illustrated in Figure 12, indicating a good consistency.
Submitting Equation (20) into Equations (21)–(23), the dimensionless critical submerged weight of the pipe (Gcr = Wscr/suD) can be derived:
G cr = 4 H m s u D H m V m / ( tan 2 ε F | ε u = π / 2 + 4 H m 2 V m 2 ) V ex s u D
Alternatively,
V m / W scr = ( 4 ( H m / V m ) 2 / ( tan 2 ε F | ε u = π / 2 + 4 H m 2 / V m 2 ) V ex / ( s u D ) ) 1
where Vm/Wscr represents the critical overpenetration ratio Rcr, i.e.,
Rcr = Vm/Wscr
The values of Hm, Vm and εF depend on the dimensionless pipe embedment (e/D) and the interface friction ratio of the pipe–soil interface (α) (see Equations (14), (15) and (20)). Note that Vex = 0 if the external load is in the horizontal direction. The value of εF can be obtained by Equation (20). The pipe has the tendency to rise during its lateral instability, when its submerged weight per unit length is less than the critical value Wscr. Otherwise, the pipe would move downwards when it is heavier than the critical submerged weight.
As aforementioned, the lateral stability of a partially embedded pipe is affected by various parameters, including the initial embedment ratio (e0/D), the submerged weight of the pipe (Ws), the undrained strength of the clayey soil (su), the interface friction ratio of the pipe–soil interface (α), and the external load (F). For a partially embedded pipe under the horizontal external loading, the movement trajectory during lateral instability can be calculated using an iterative algorithm based on Equations (19) and (23). The developments of the embedment ratio (ex/D) with the horizontal component of pipe displacement (ux) for e0/D = 0.2 and various values of R at α = 0, 0.5, and 1.0 are illustrated in Figure 13a–c, respectively. Note that the overpenetration ratio R is in negative correlation with the submerged pipe weight Ws (see Equation (18)).
As shown in Figure 13, the pipes with the same initial embedment may move downwards or upwards during lateral instability. The value of Rcr can be solved with Equation (25). For the case R > Rcr, the pipe rises to a constant embedment during its lateral instability, while the pipe moves downward for R < Rcr. The values of Rcr are 2.00, 2.41 and 3.54 for the cases of α = 0, 0.5, 1.0, respectively. That is, Rcr is in the positive correlation with α.
Under the horizontal external loading (Vex = 0), the variations of Gcr with e/D for various values of α are shown in Figure 14. The effect of the pipe embedment ratio to the dimensionless critical submerged weight of the pipe decreases when the values of e/D become larger. The pipe with a rougher surface generally tends to plough into the soil (i.e., the corresponding values of Gcr become smaller), while the smoother pipe is more likely to move upwards.

4. Conclusions

The instability trajectory and bearing capacity of an obliquely loaded pipeline on the soft clayey seabed were investigated numerically. The adaptive meshing technique and the contact-pair algorithm were adopted to simulate the evolutions of soil plastic strain zone and the pipe–soil interface, respectively. Based on the parametric study, the following conclusions can be drawn:
(1)
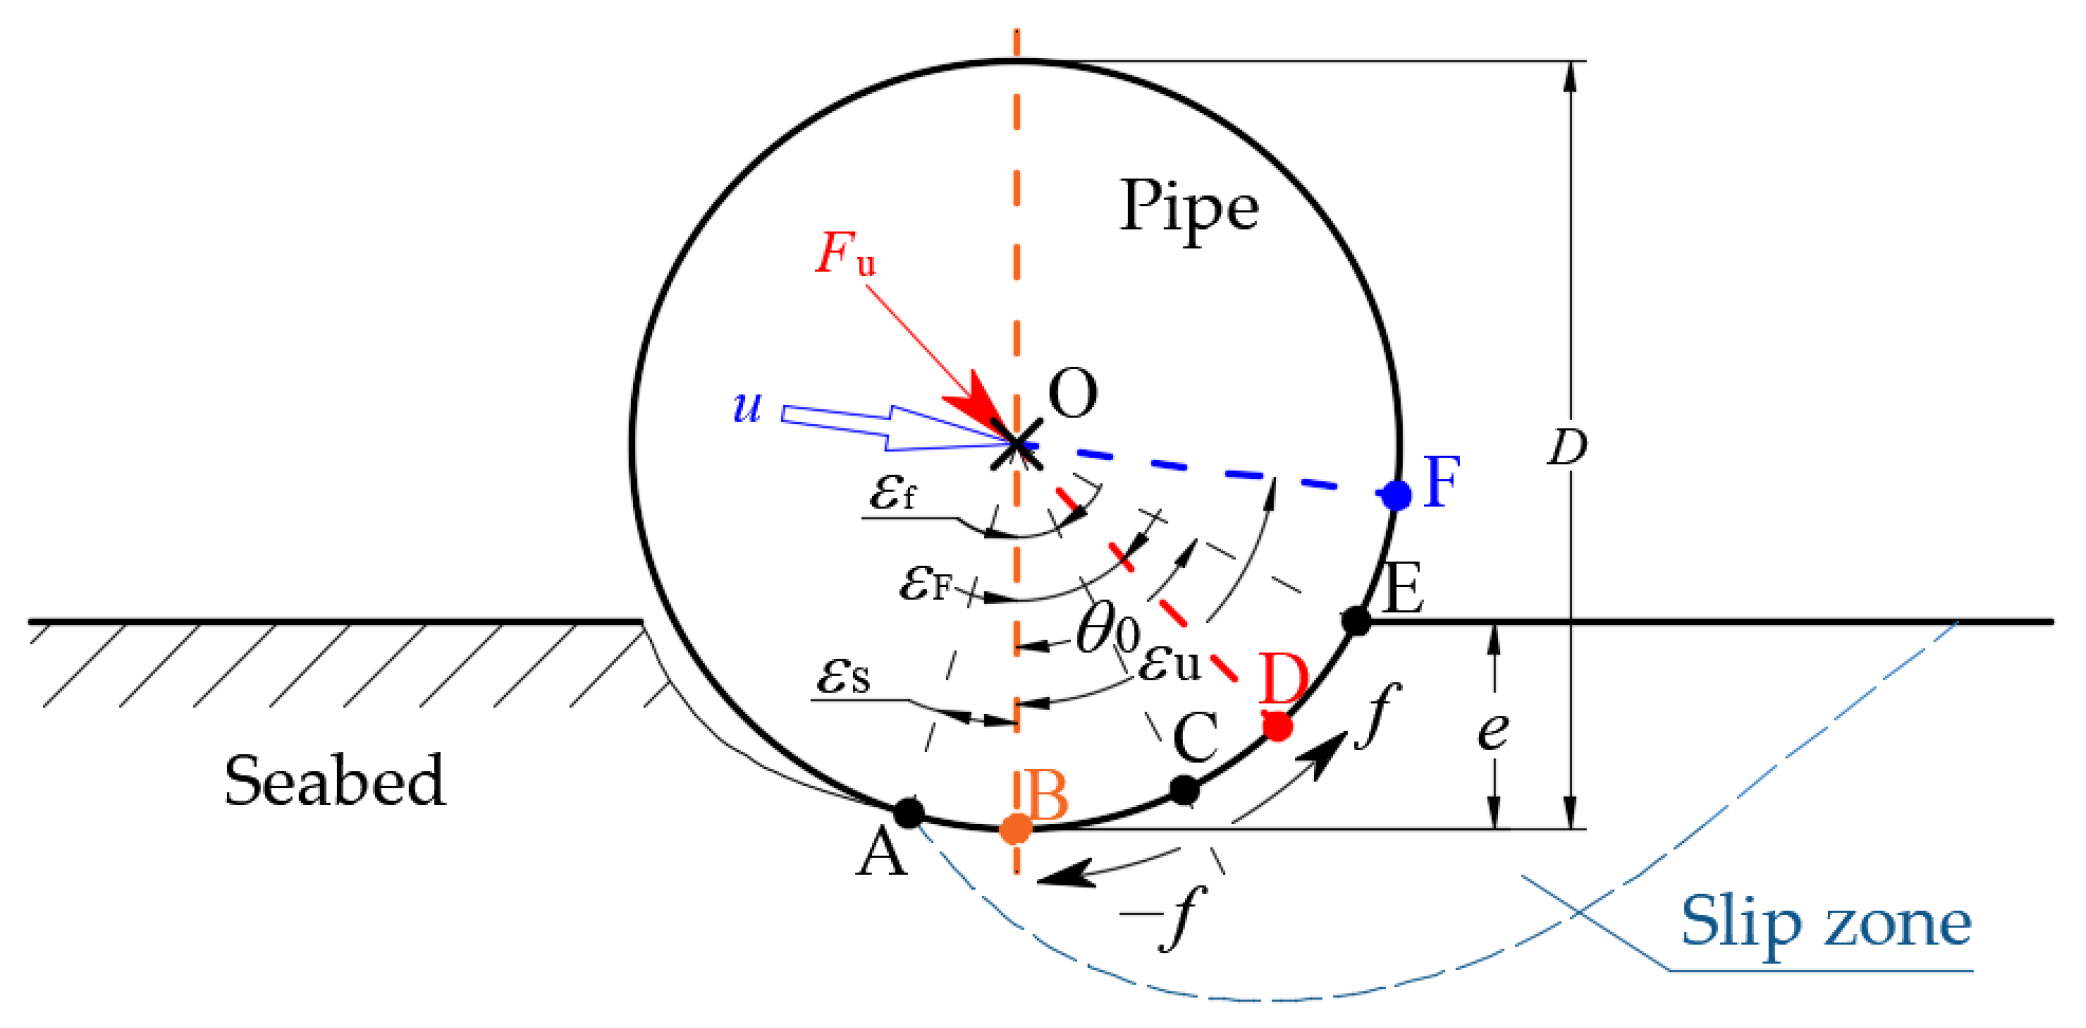
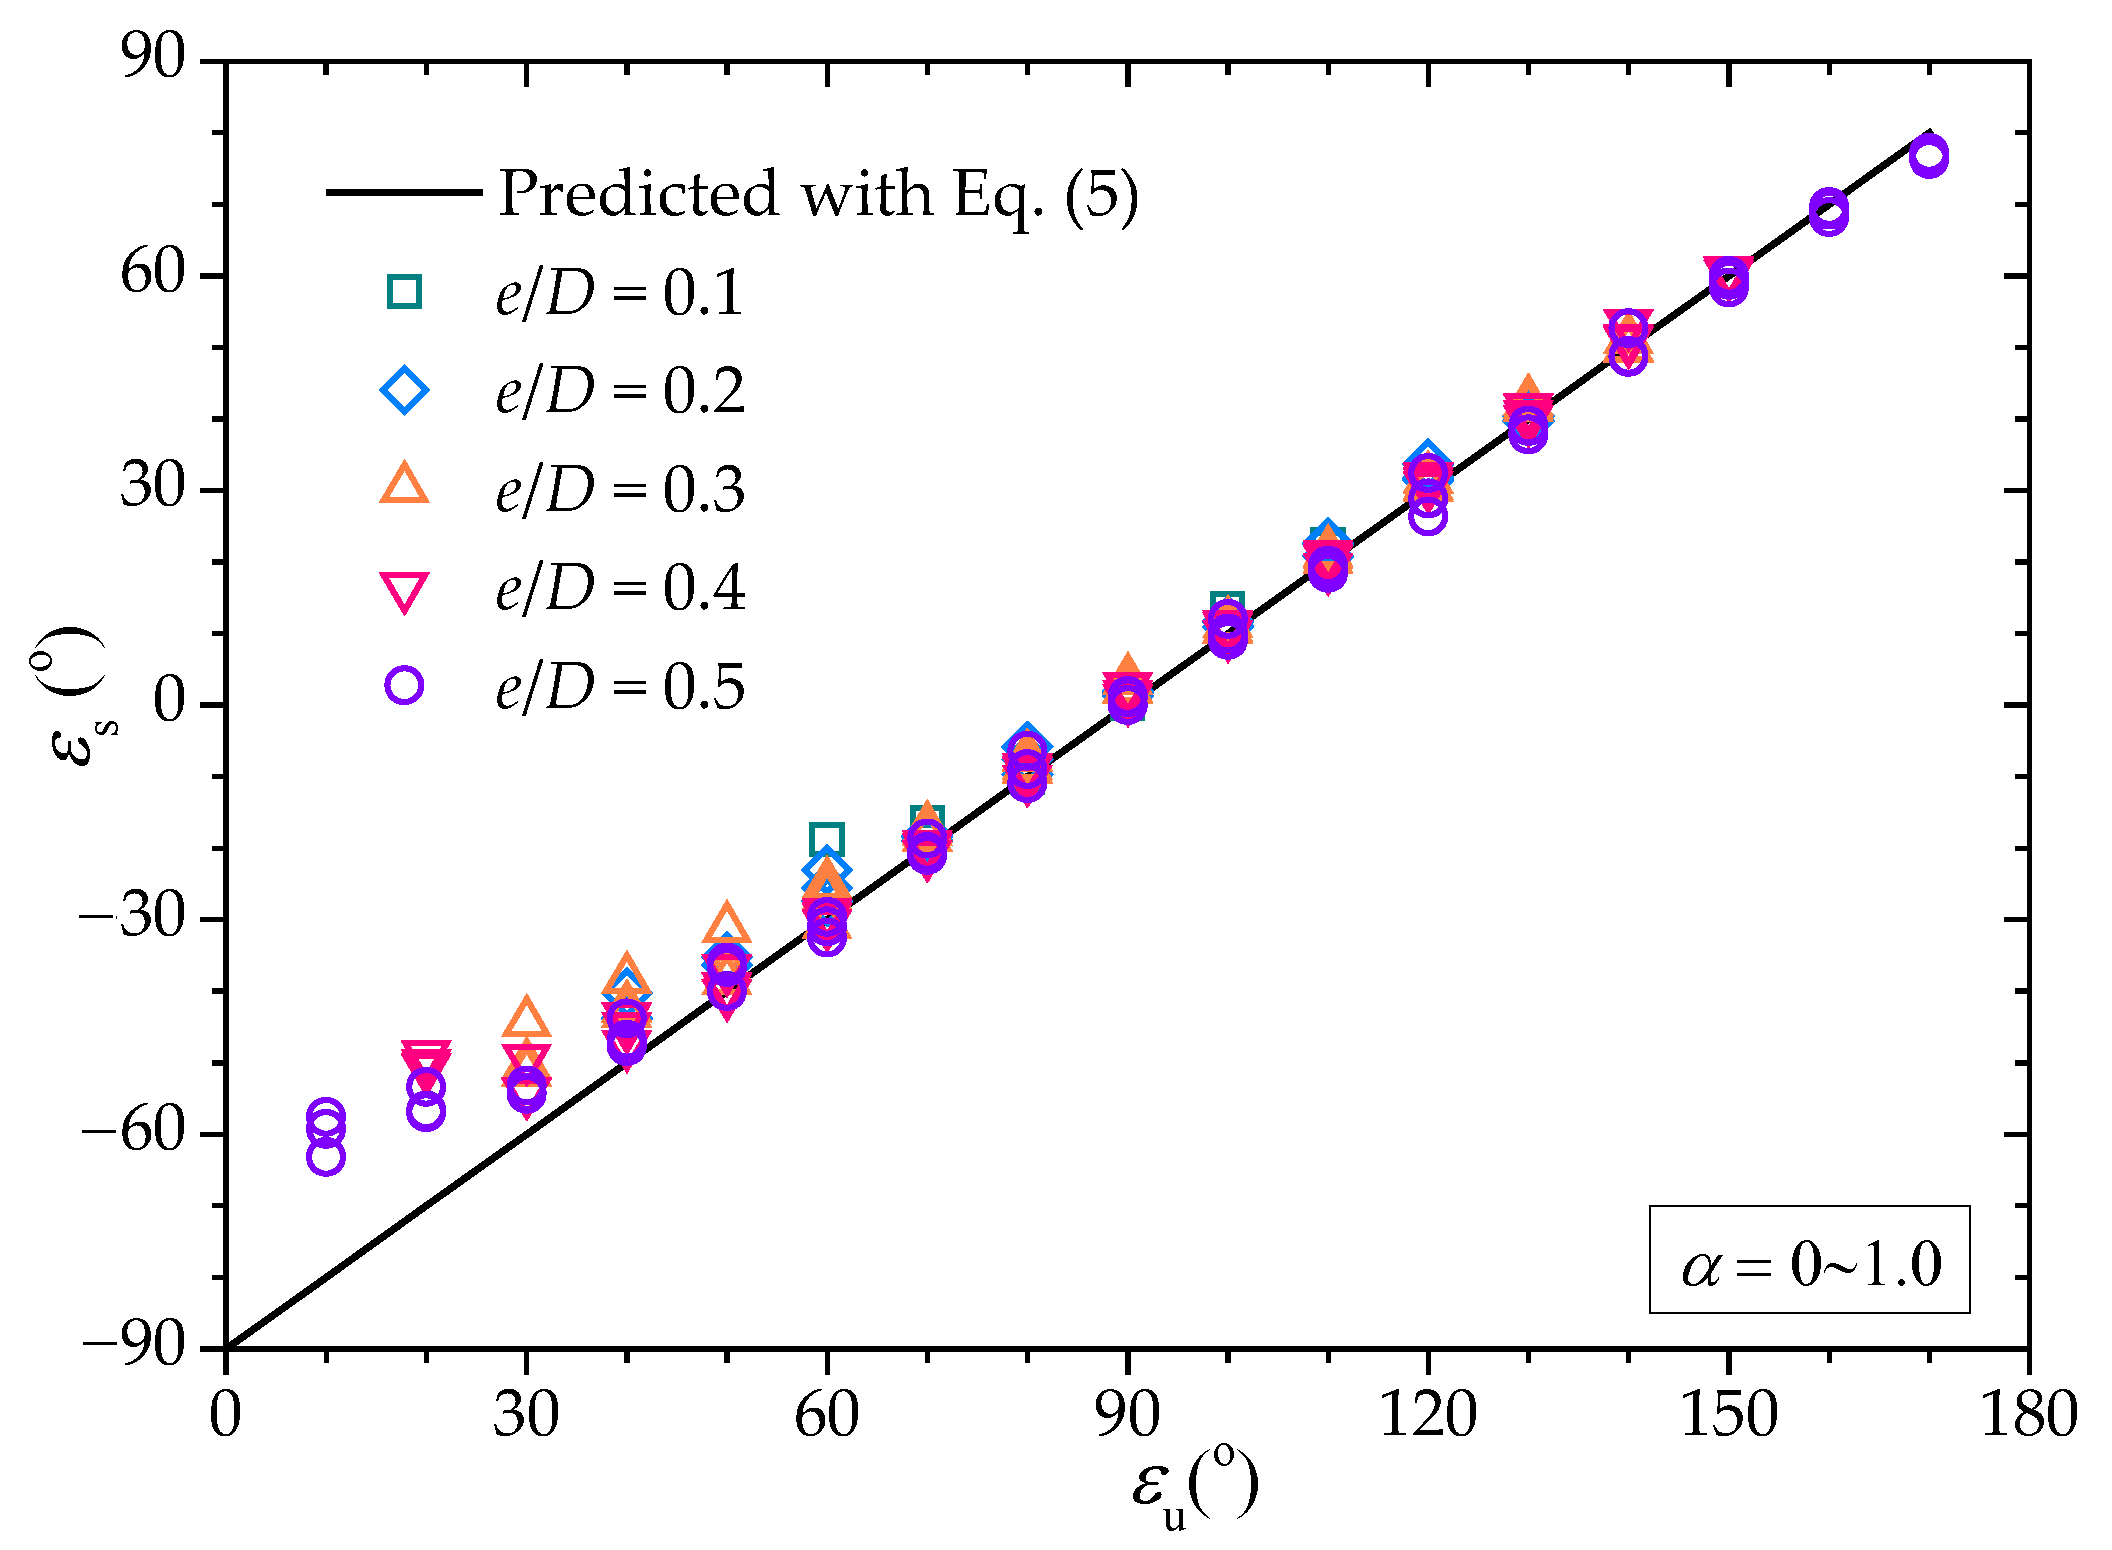
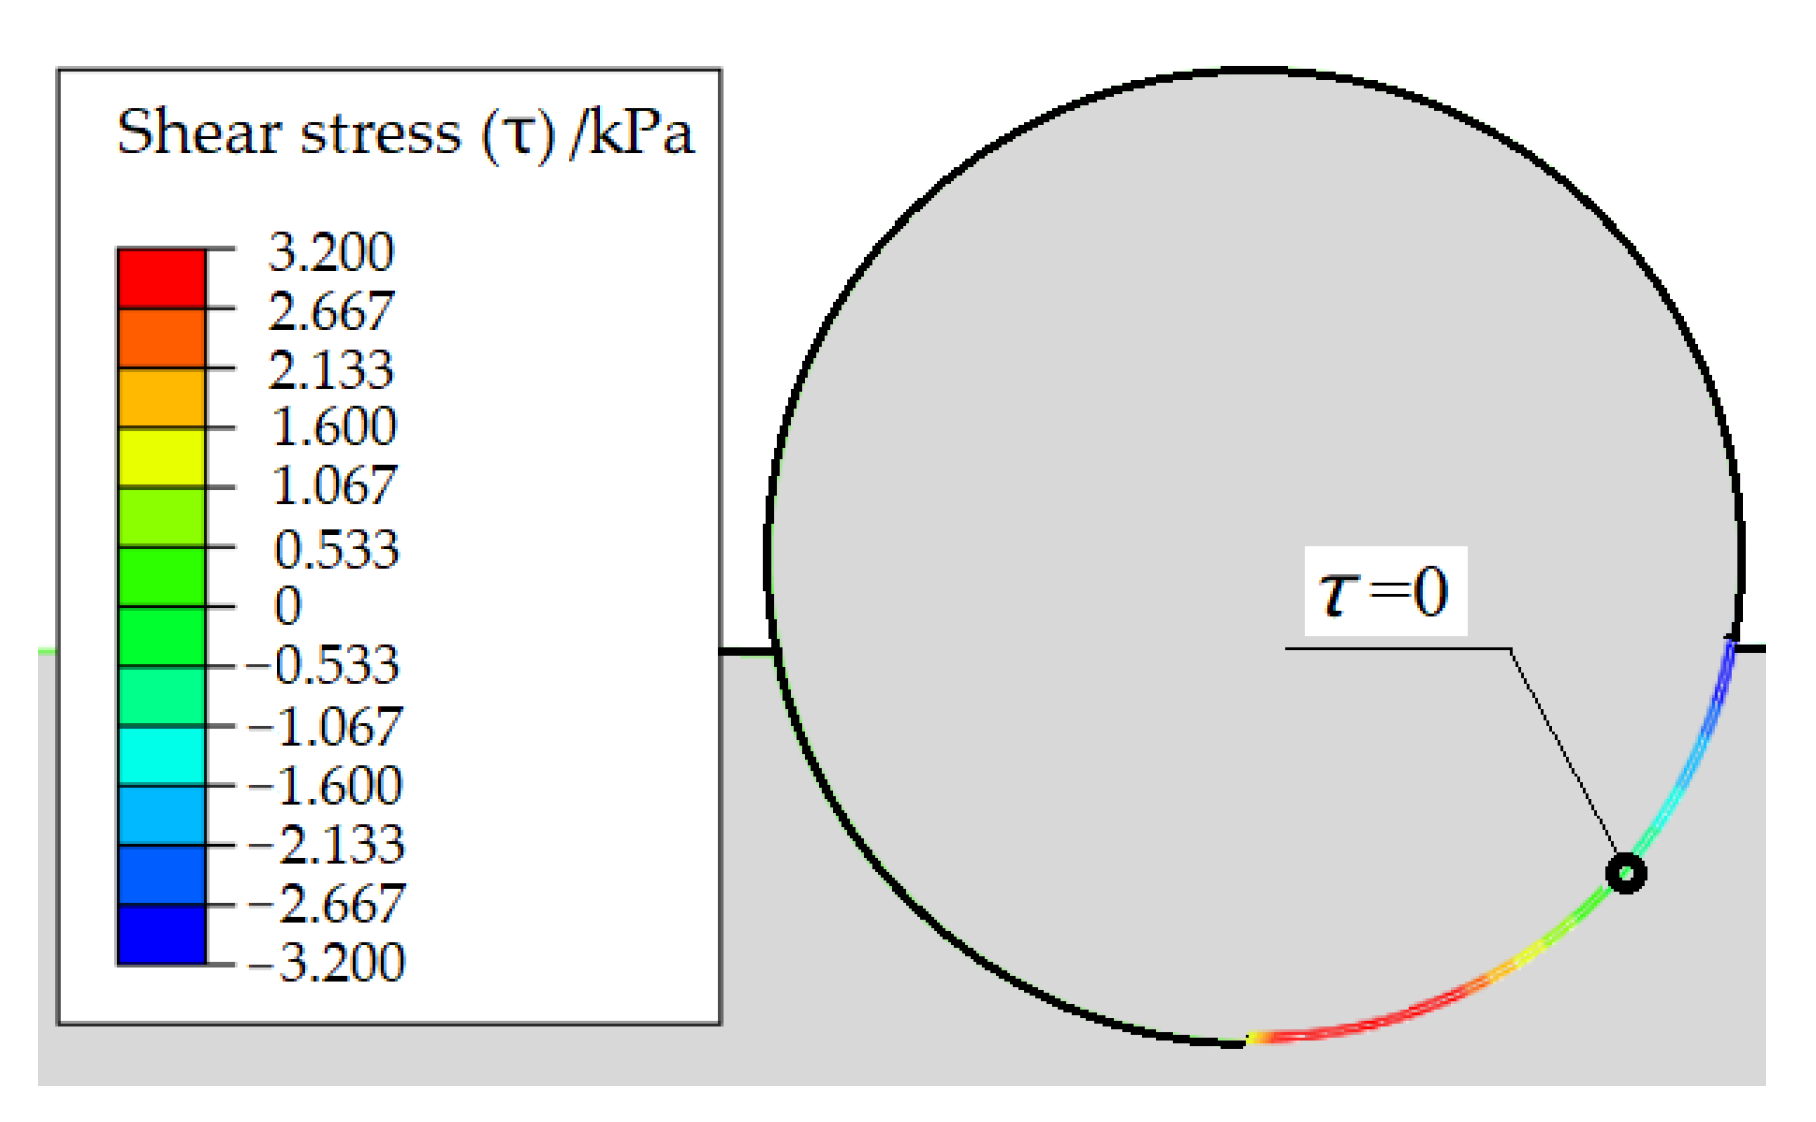
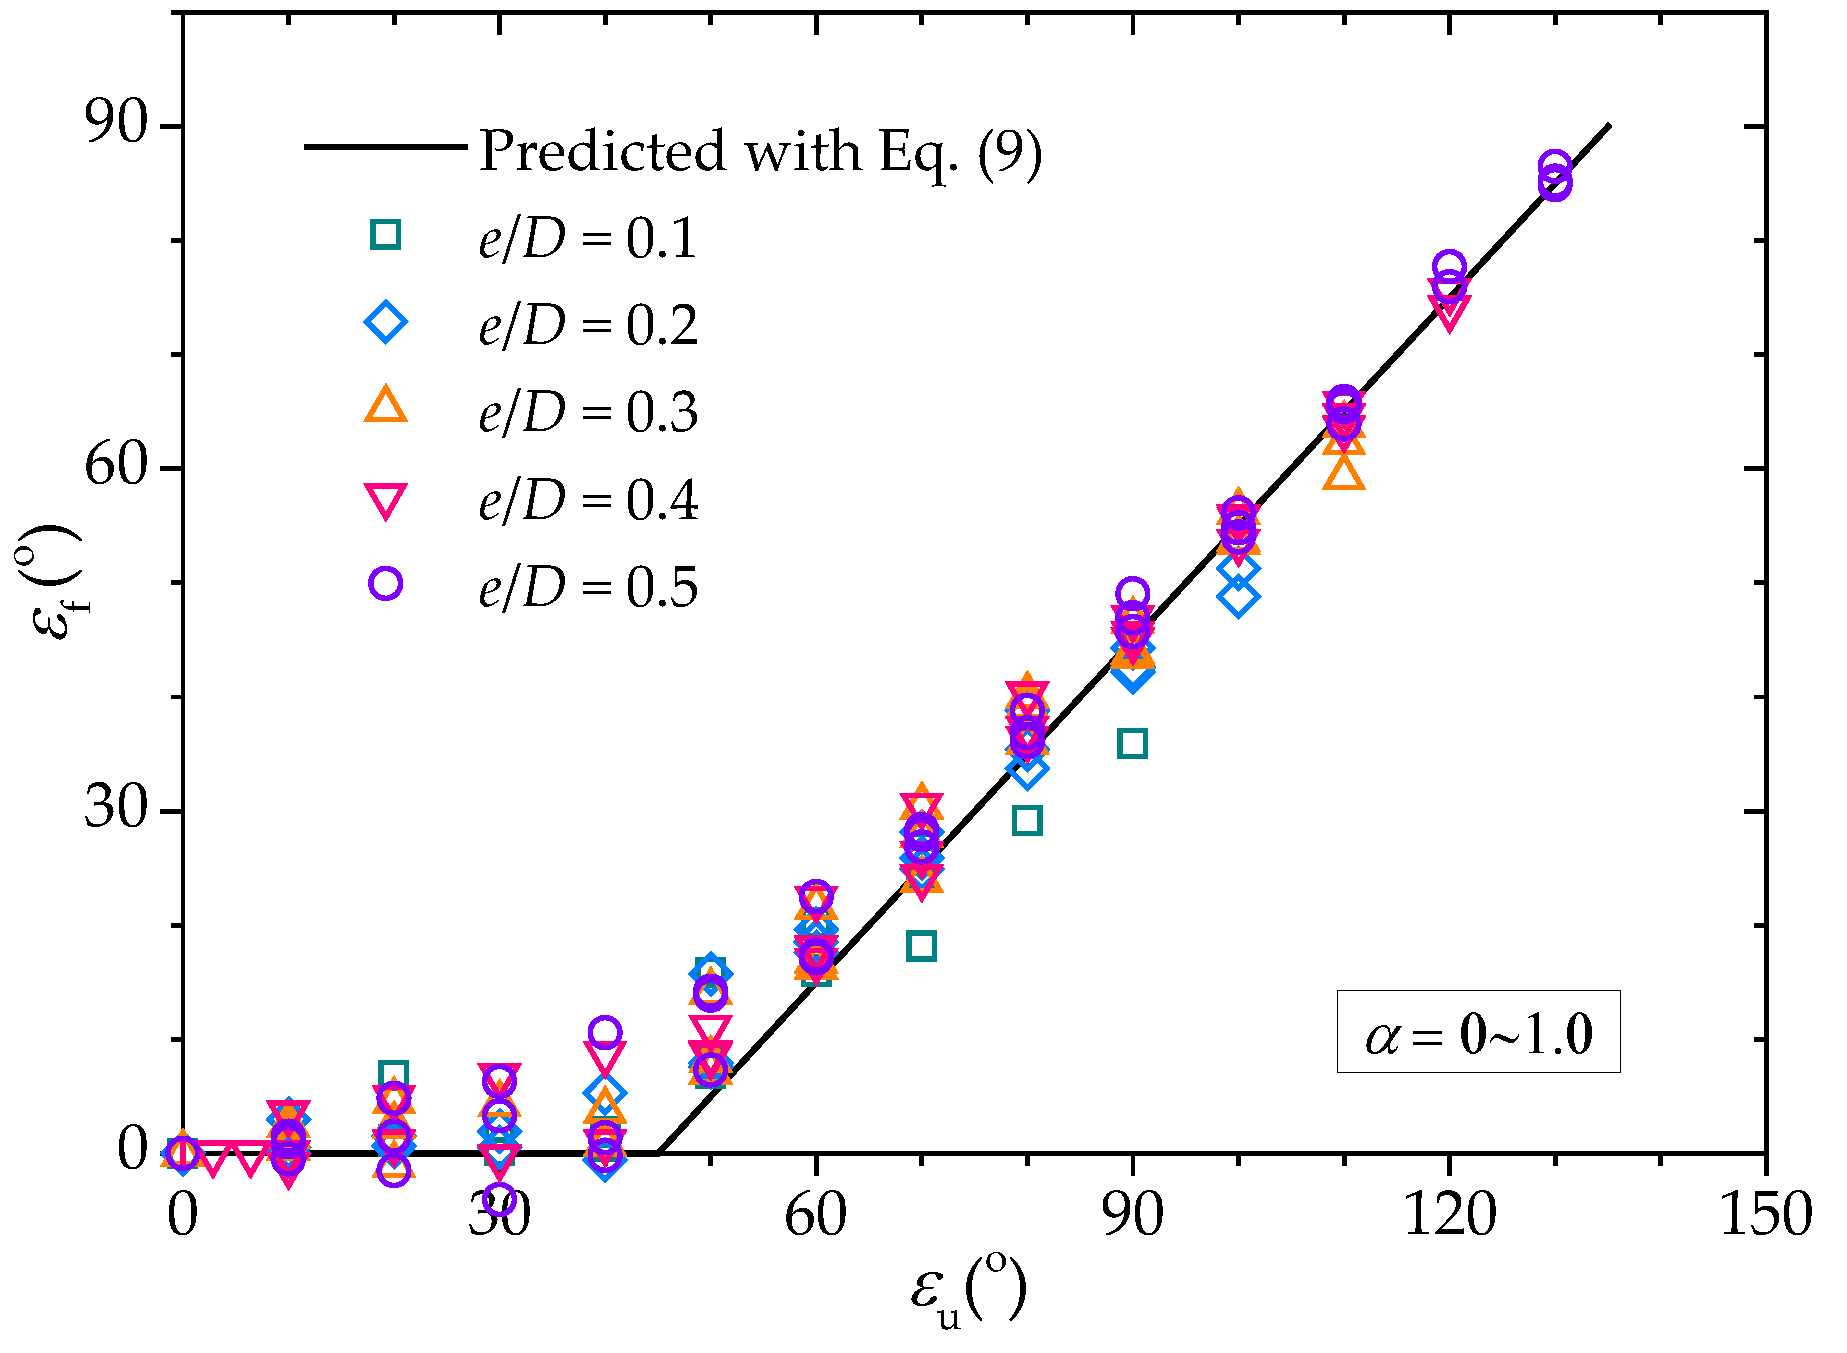
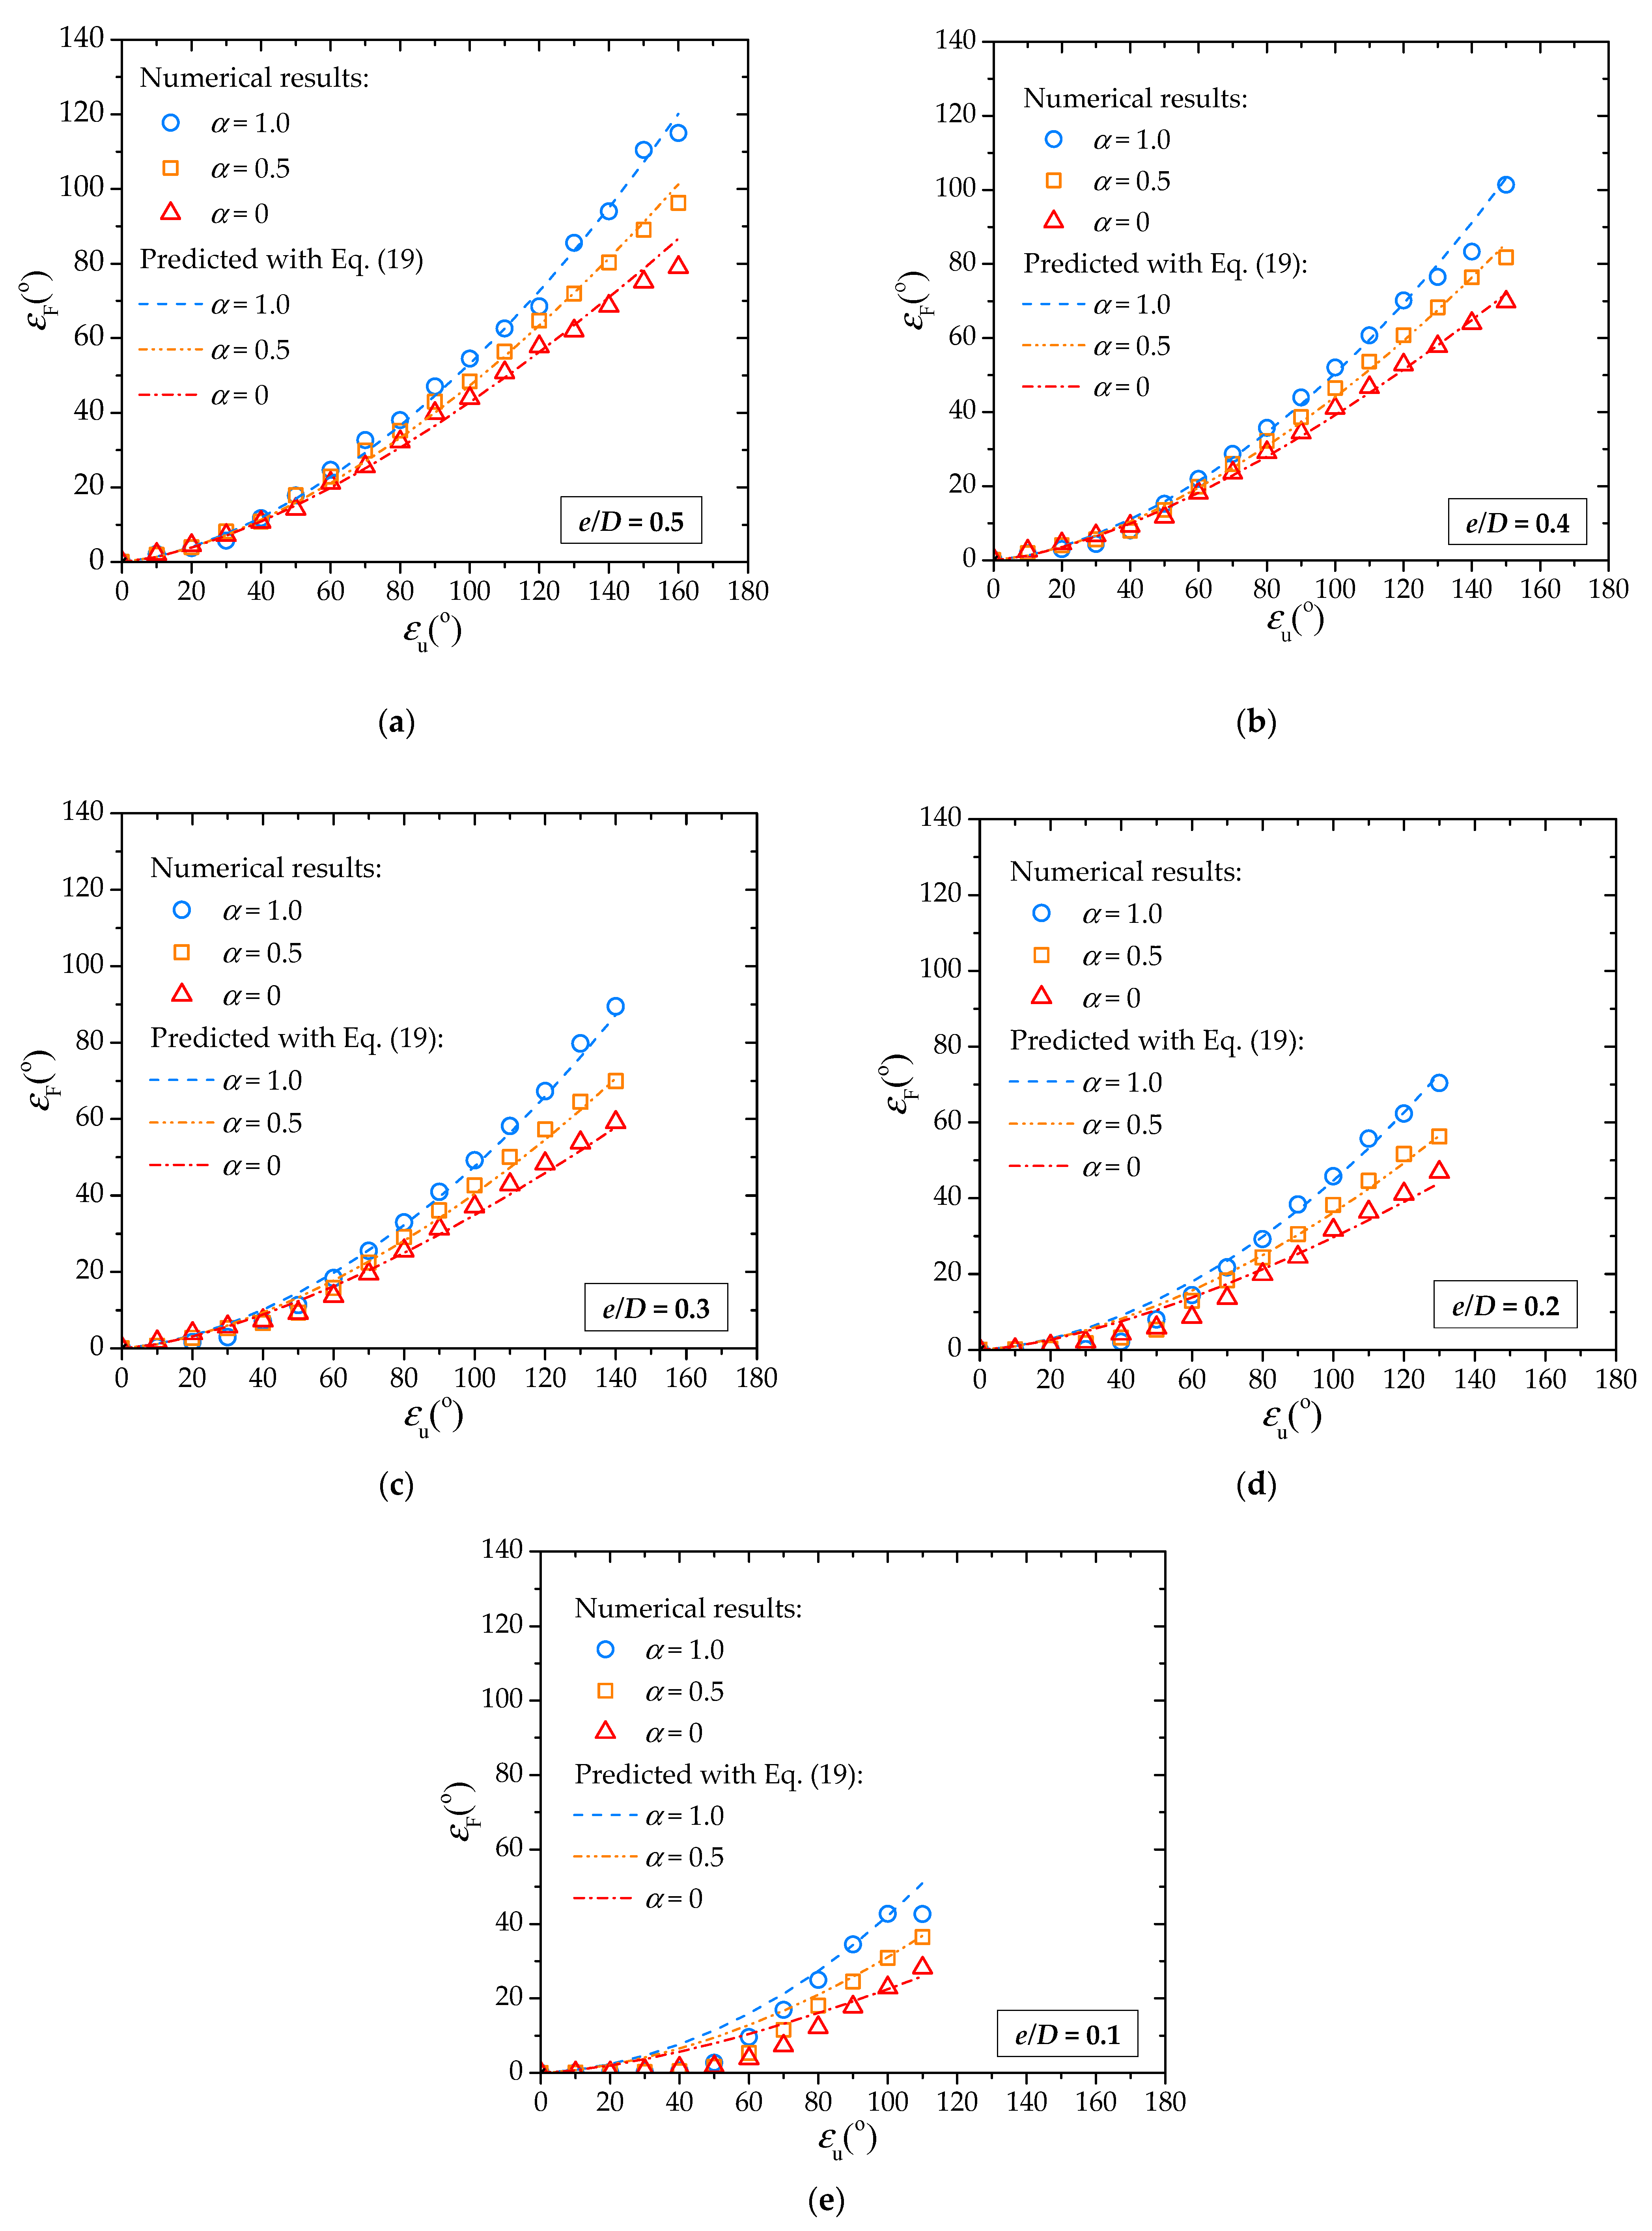
As the pipe movement angle εu increases from 0° (vertical) to 90° (horizontal), the spatial range of the slip zone in front of the partially embedded pipe decreases gradually, and the corresponding ultimate soil resistance decreases significantly. The angle of slip zone boundary εs and the pipe movement angle εu can be linearly correlated (see Equation (5)). It was found that the direction of shear stress varies along the pipe–soil interface. The angle of the “zero” shear stress point εf generally keeps constant for εu < π/4 and increases linearly with increasing εu for εu > π/4.
(2)
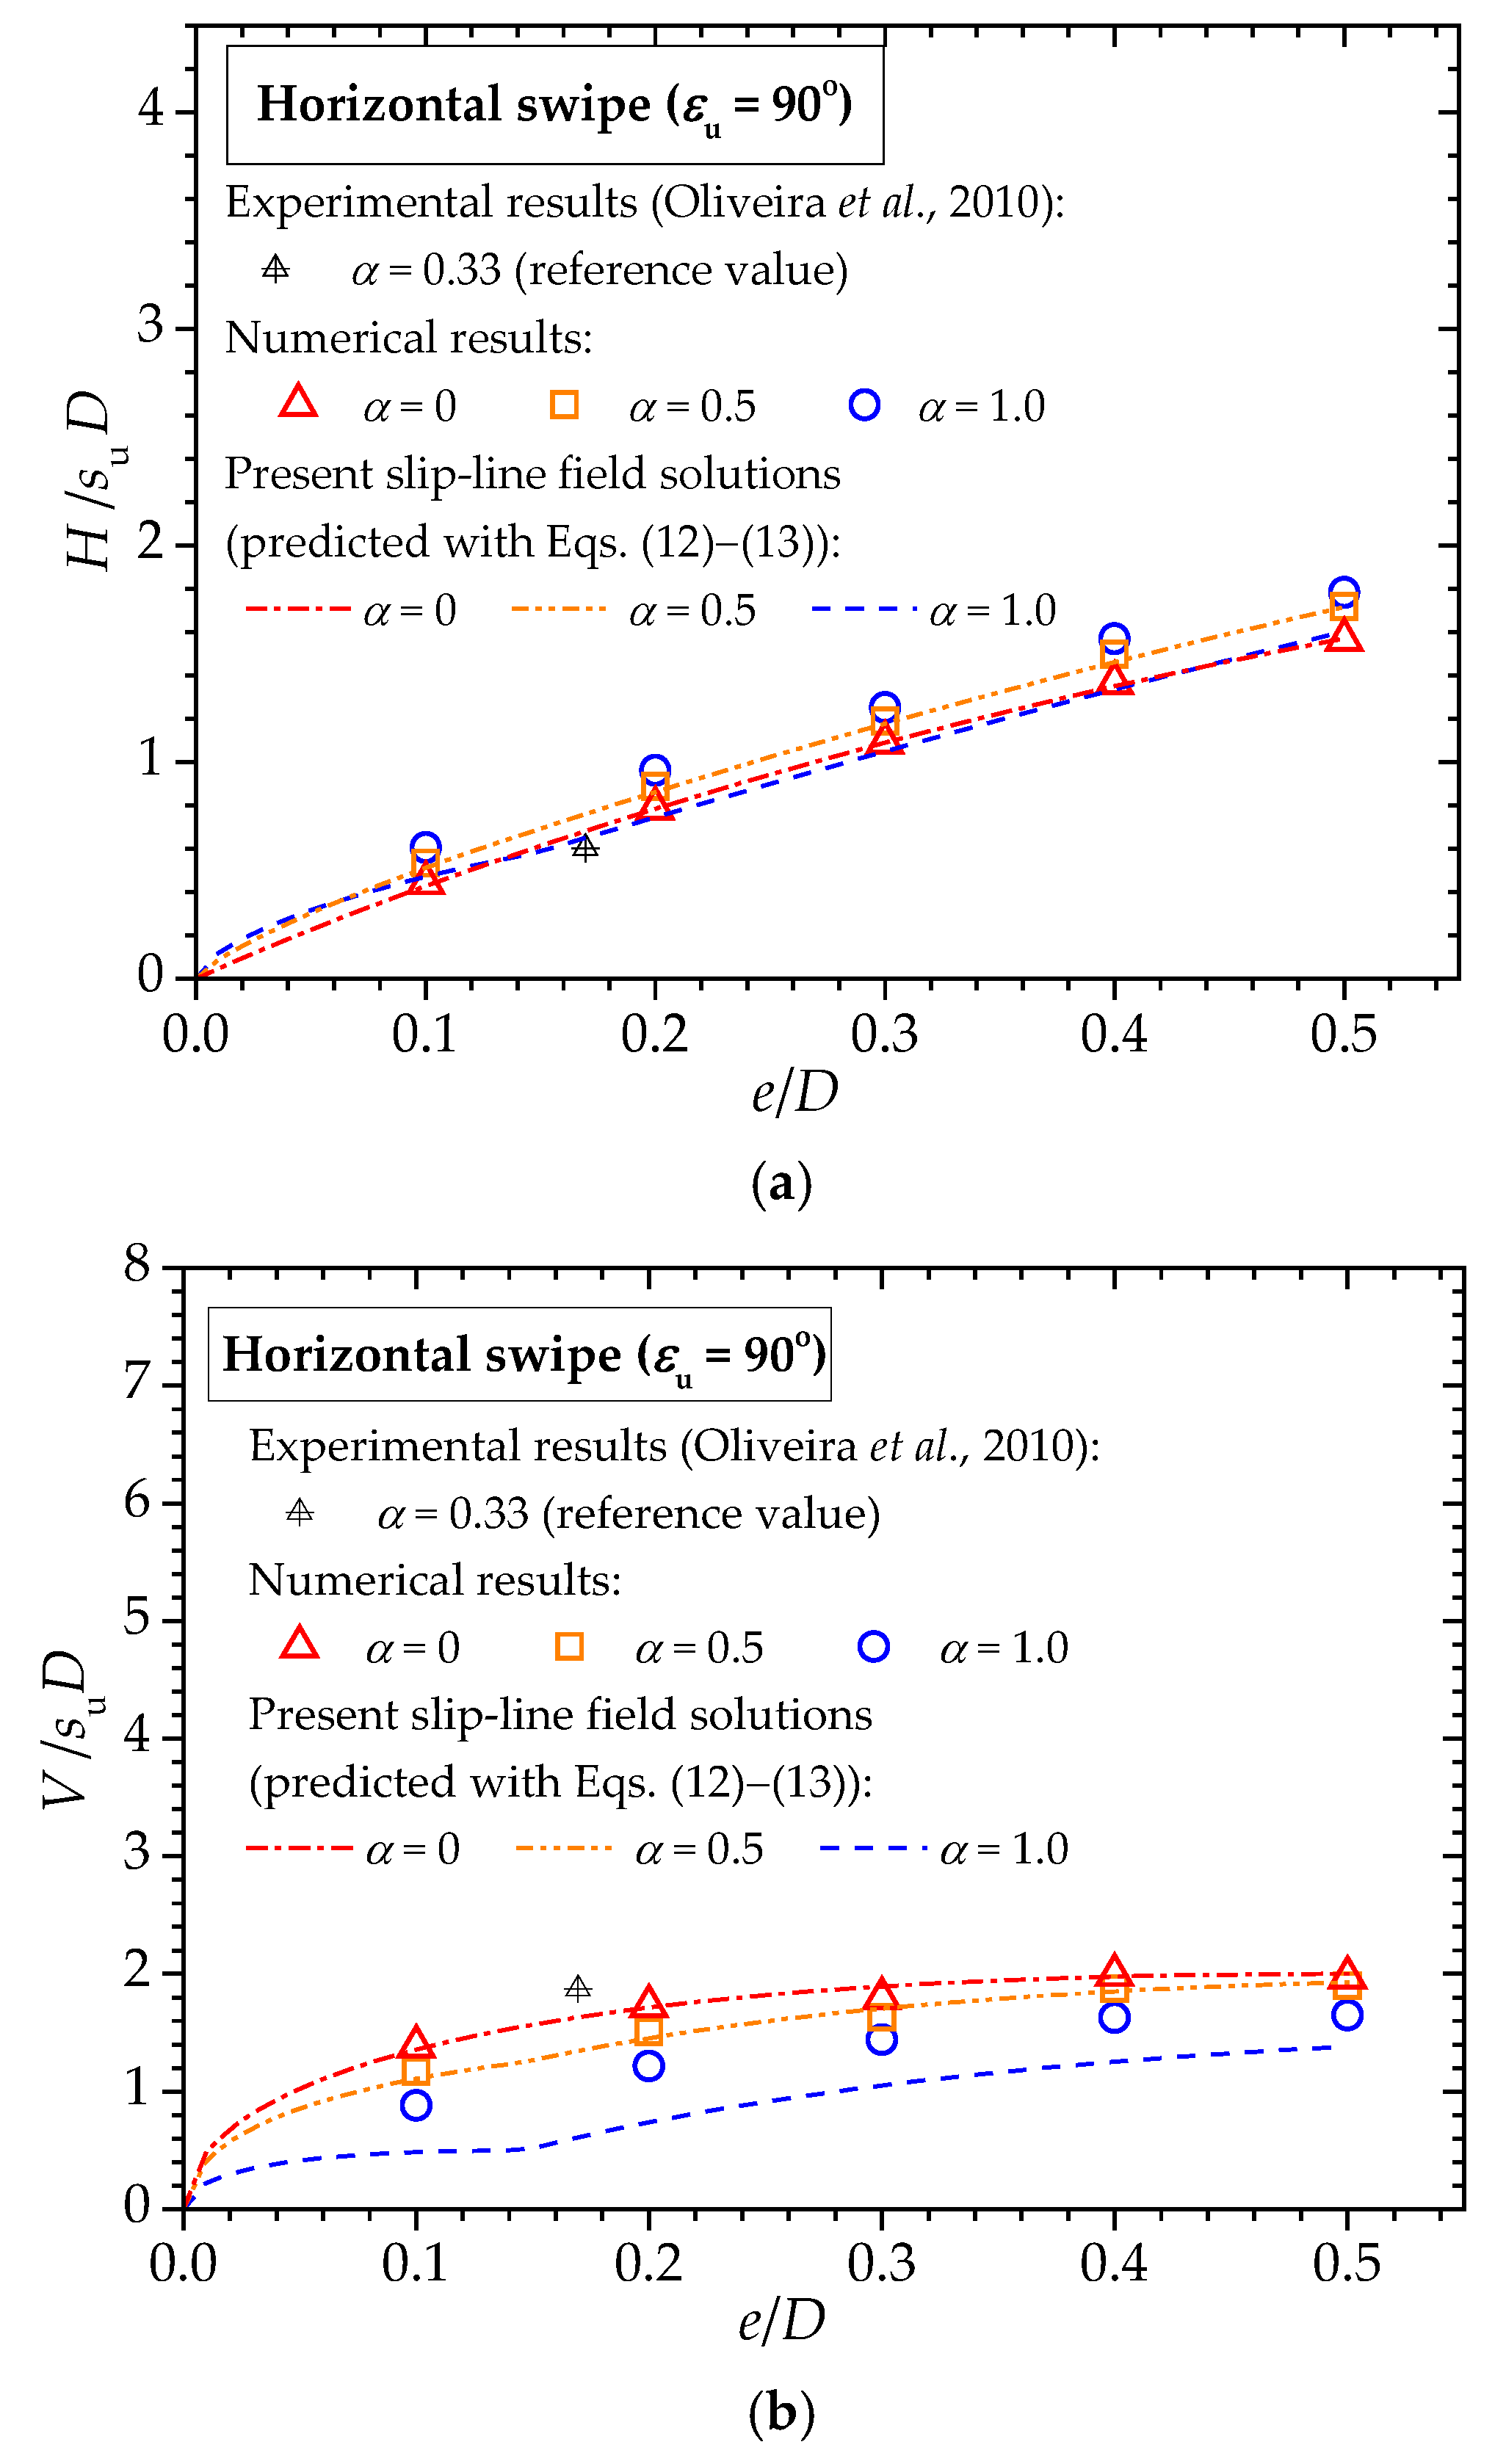
Numerical results indicate that the shape of bearing capacity envelopes resembles an ellipse, which can be empirically described with Equation (16). A slip-line field solution of the bearing capacity for the horizontal swipe was further derived. The slip-line field solutions agree well with the present numerical results, indicating the prospect of the derived slip-line field solution for predicting the horizontal swipe failure.
(3)
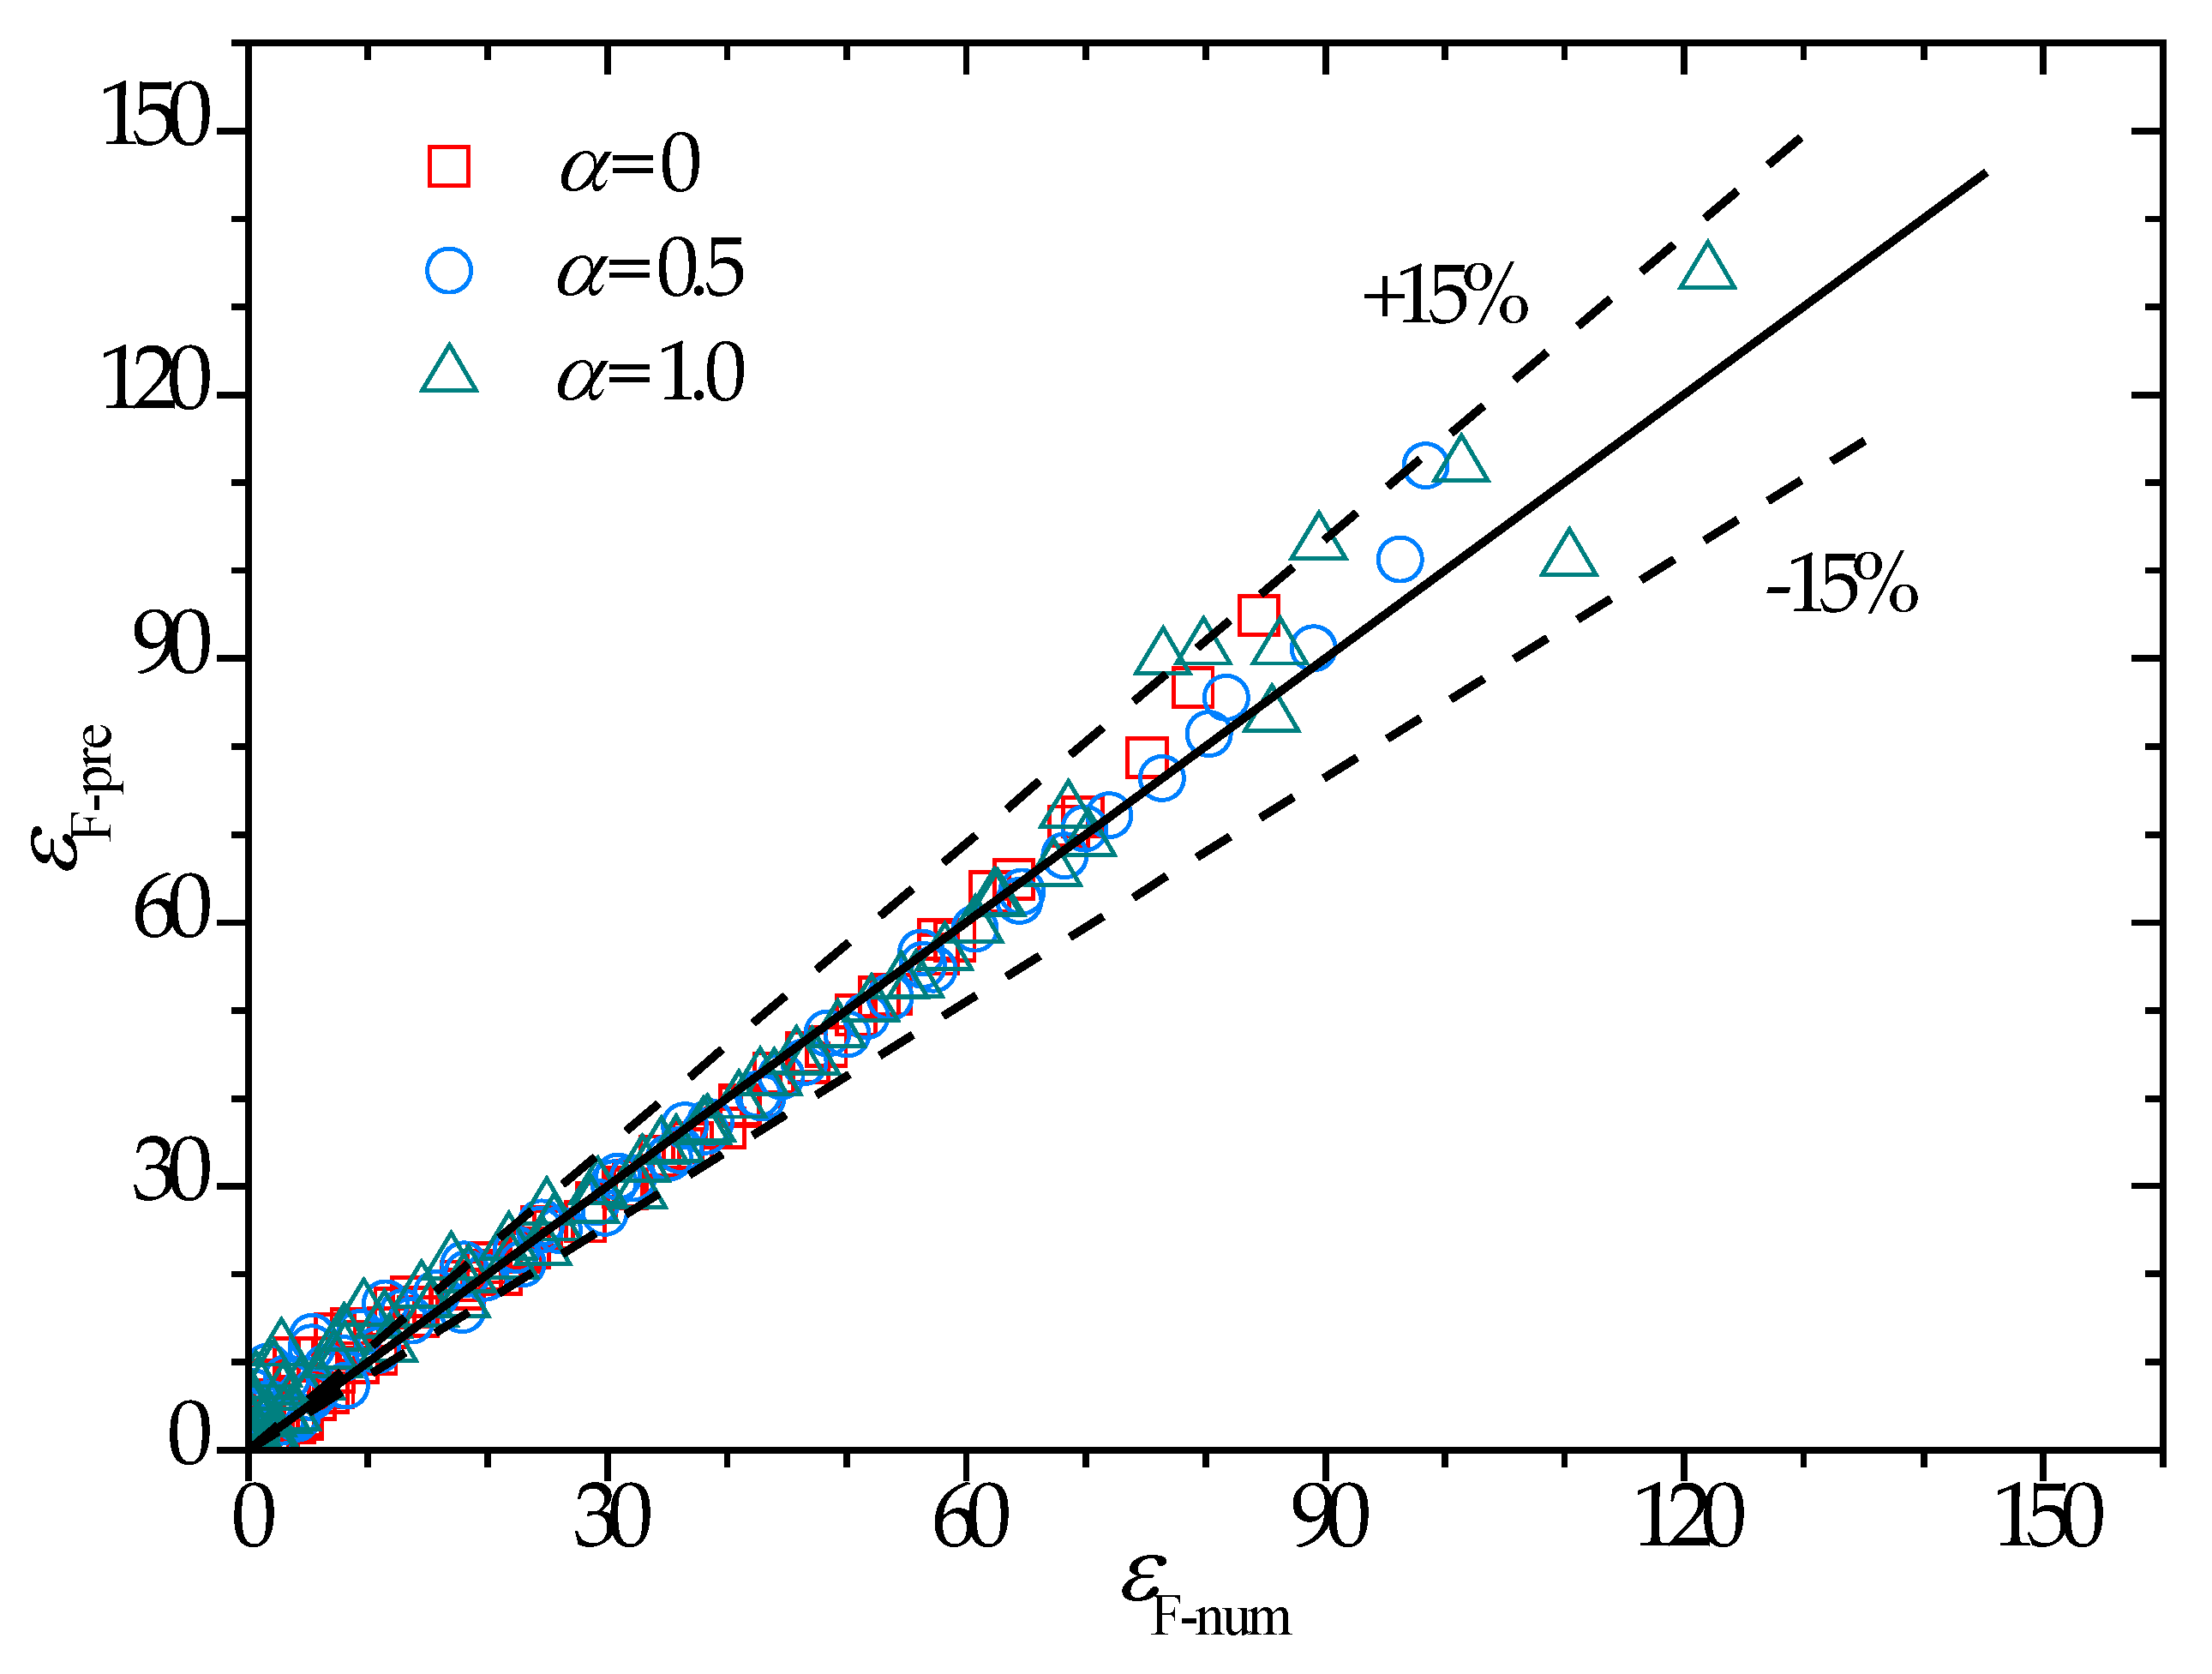
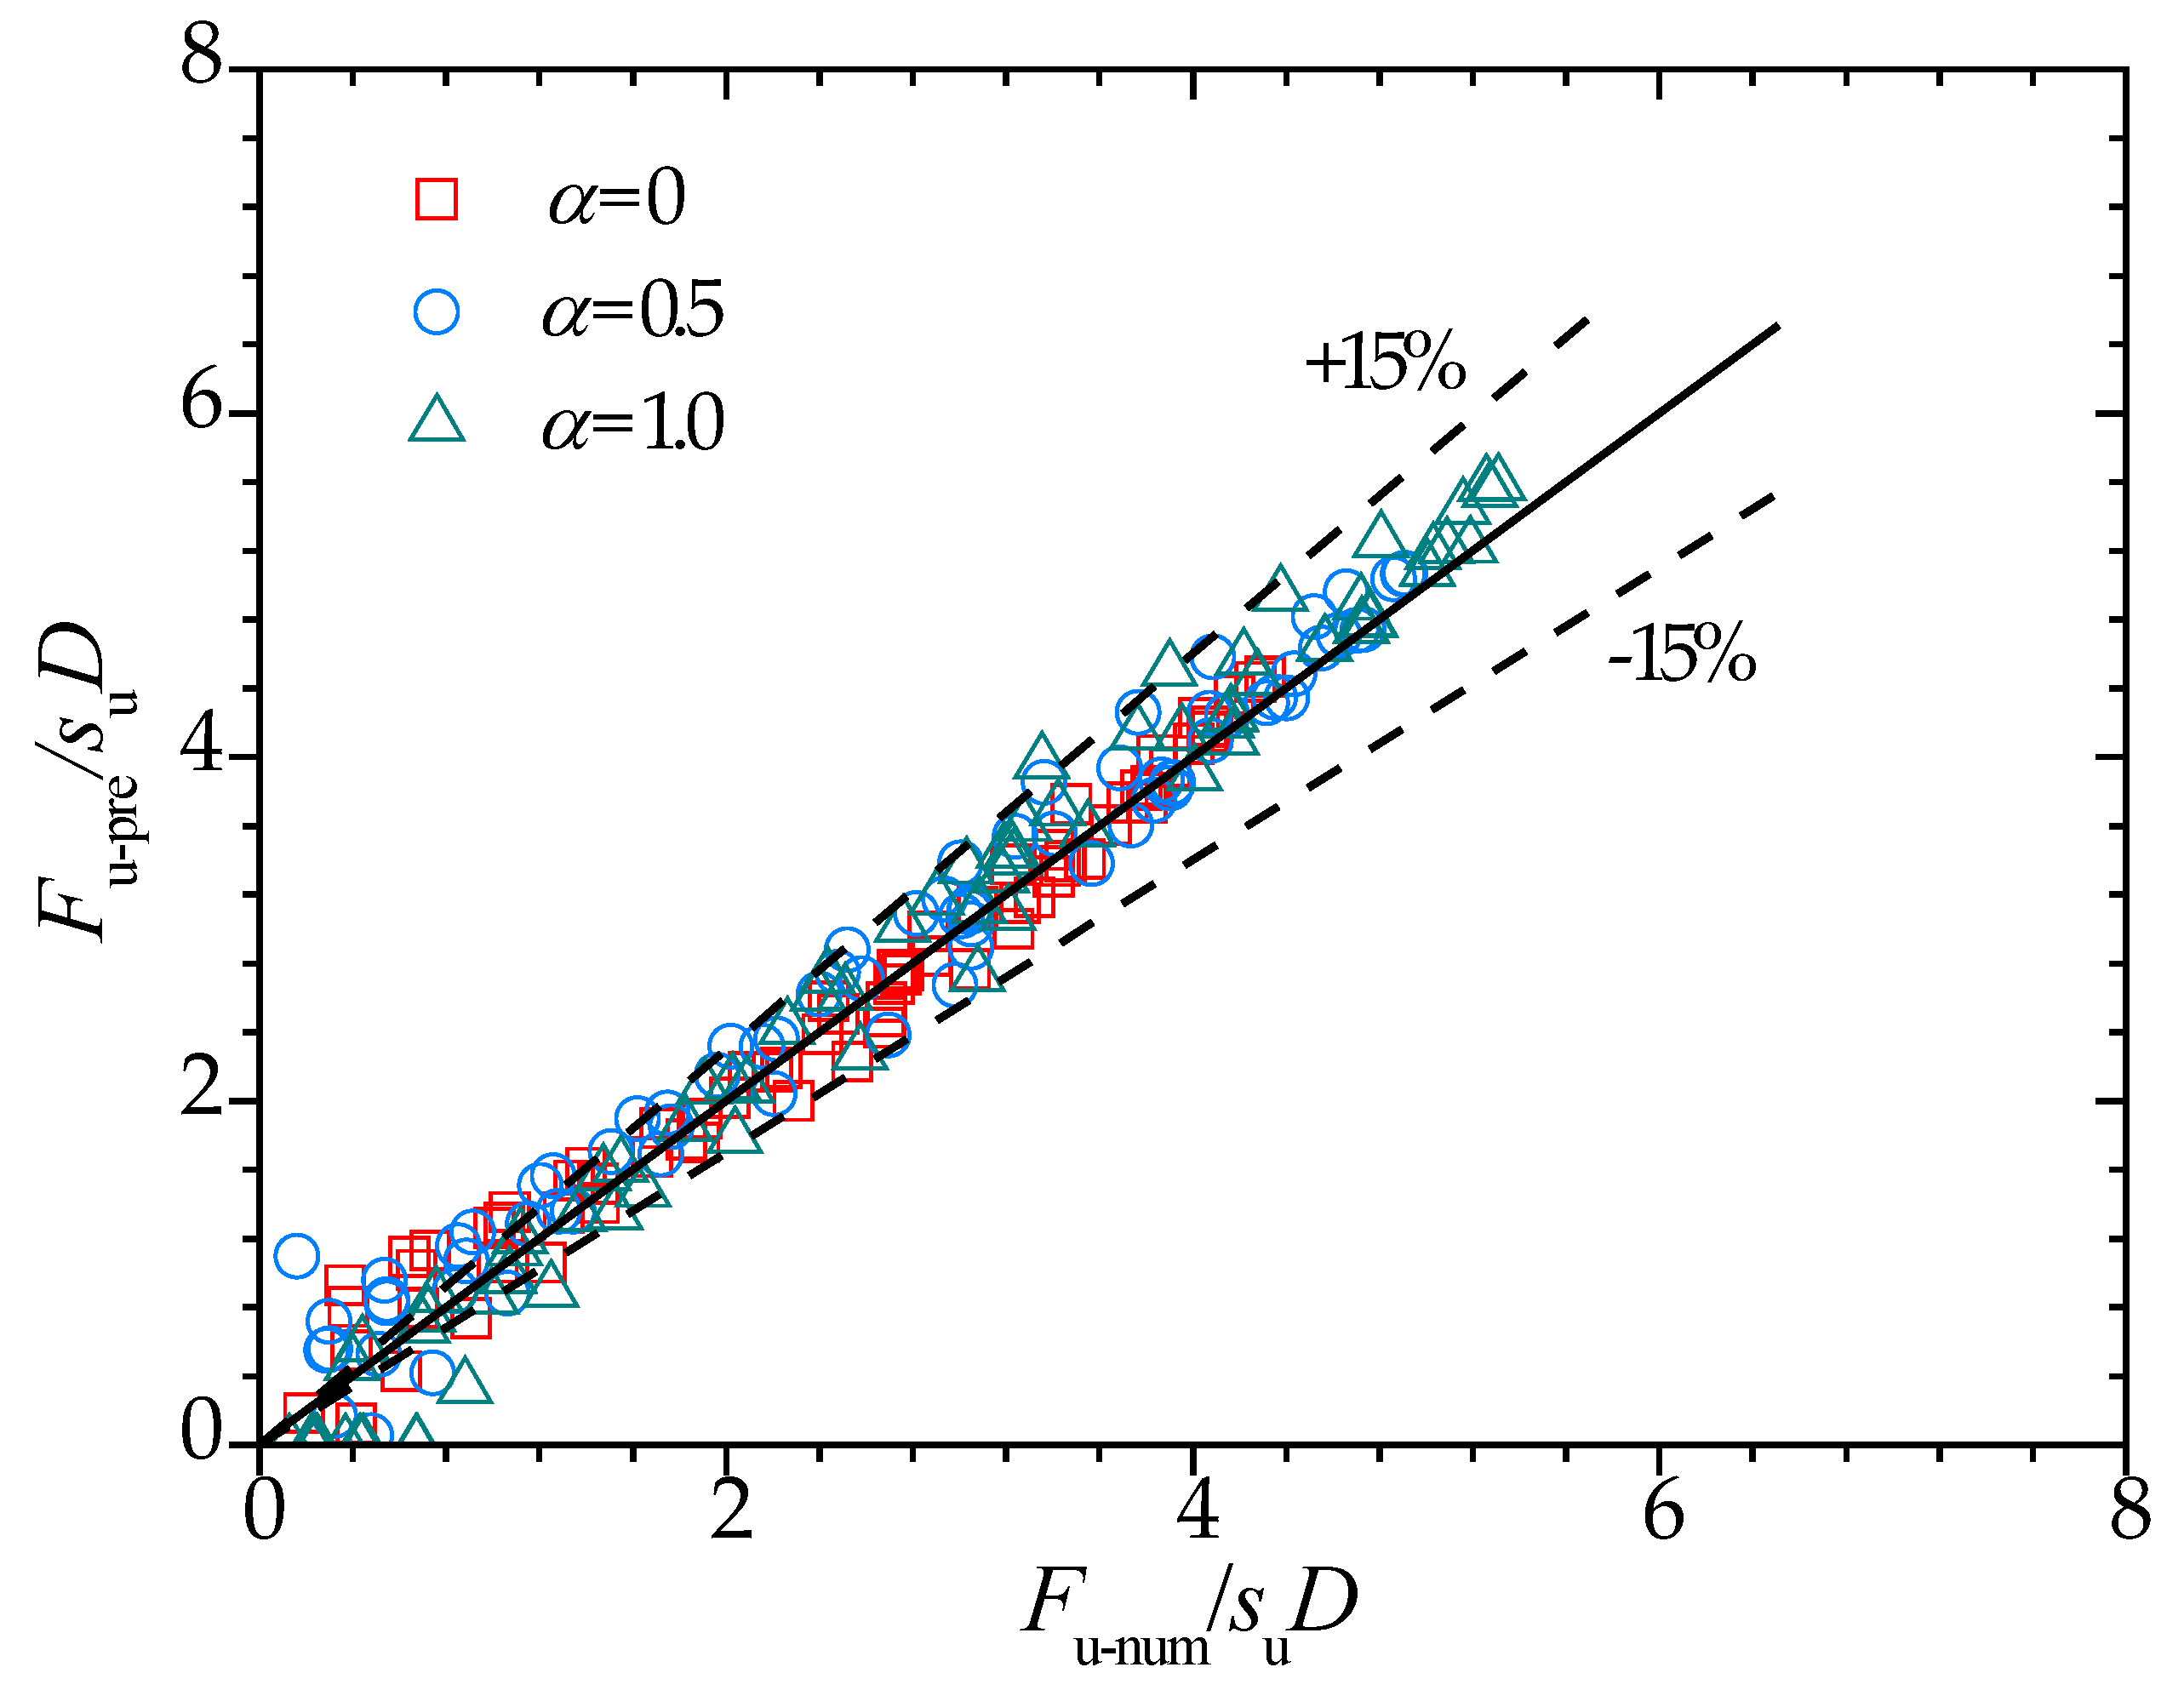
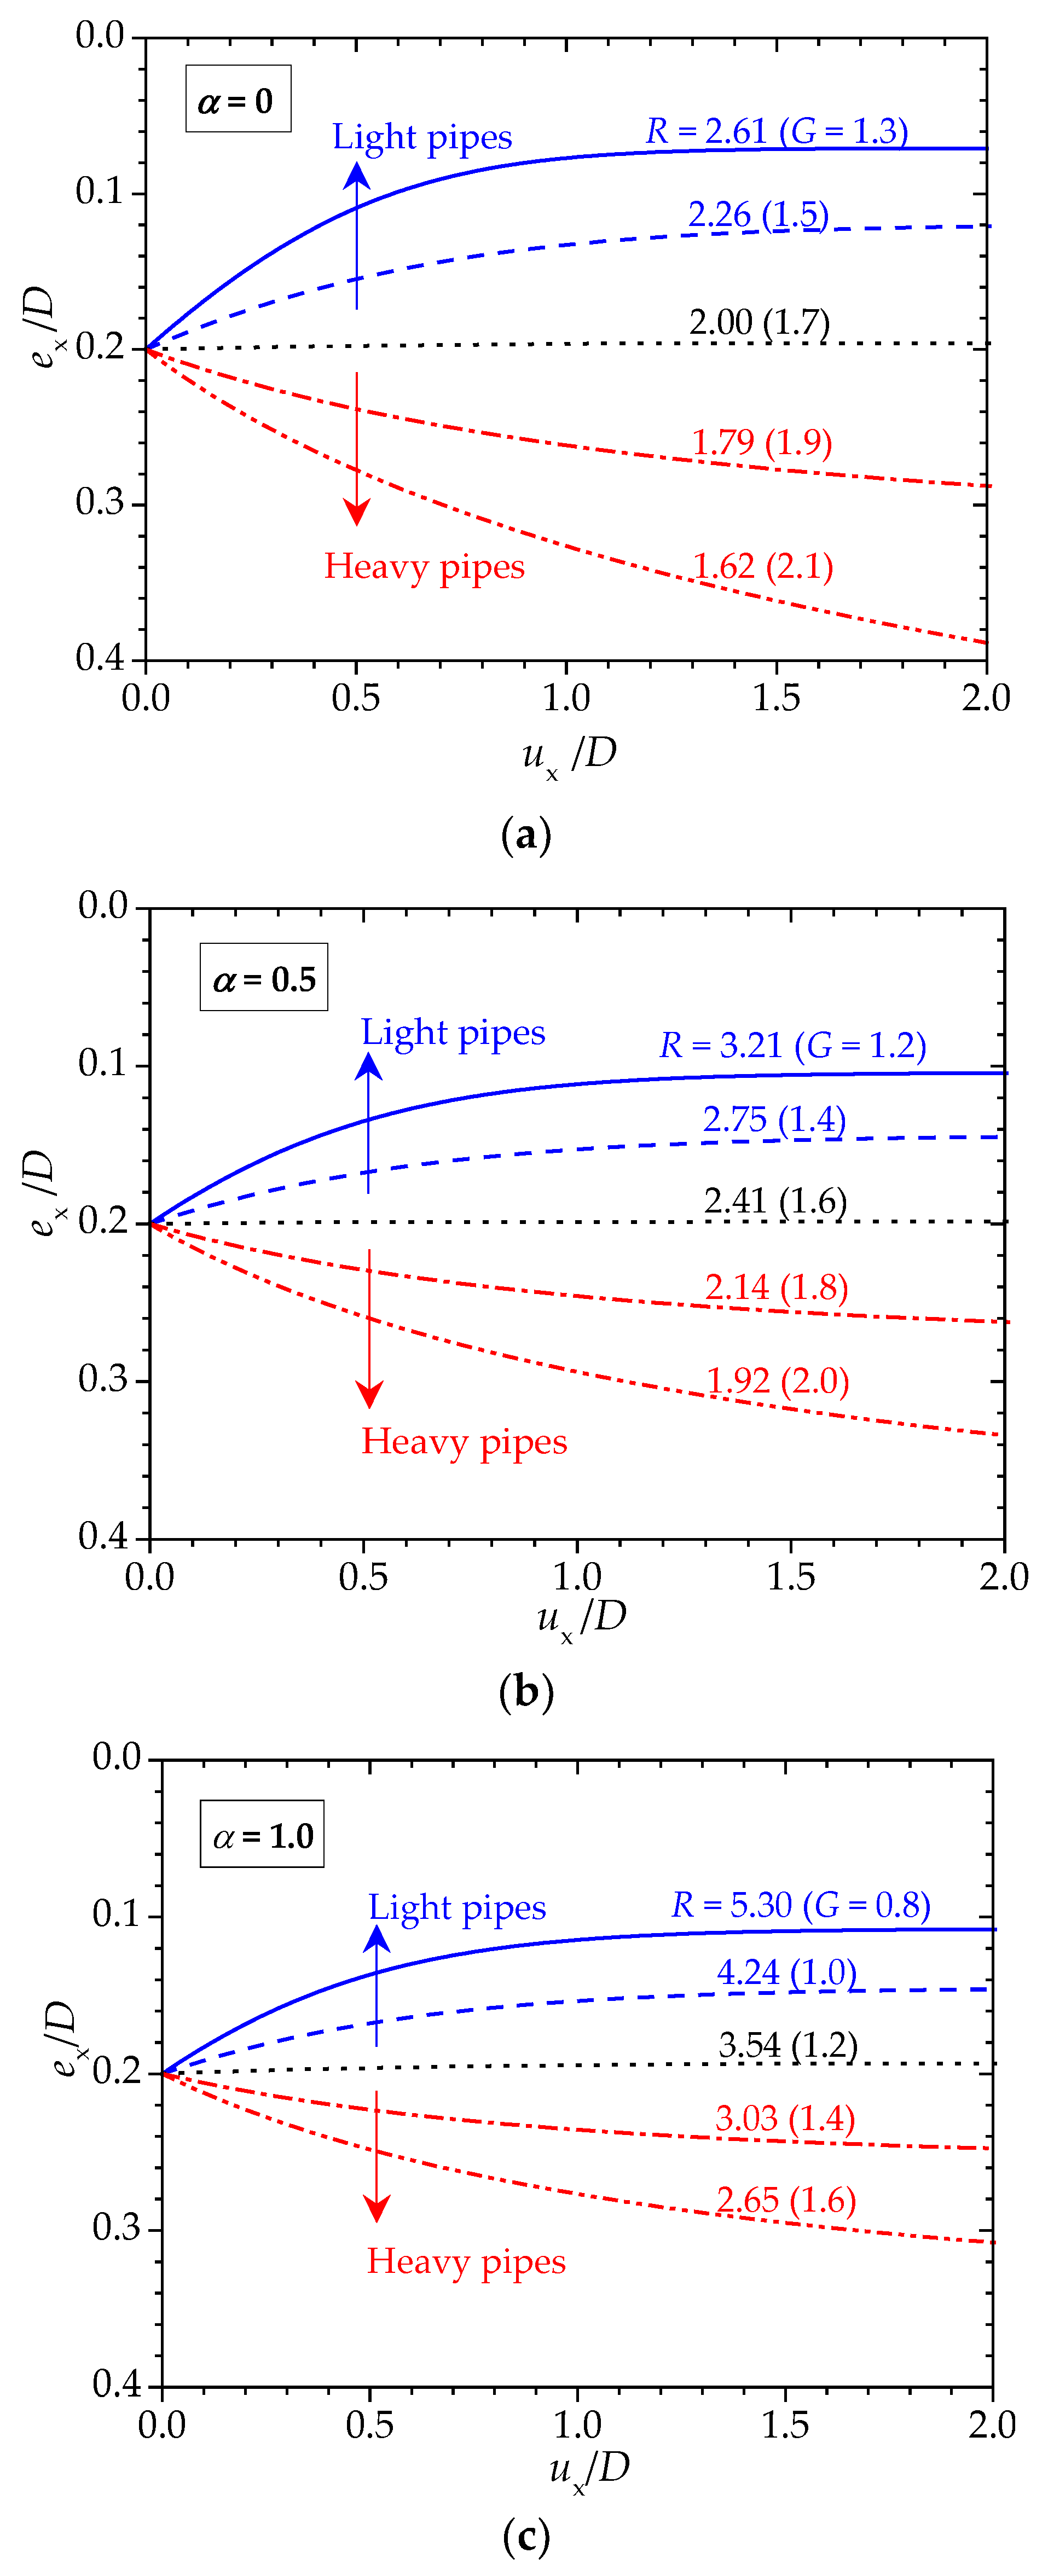
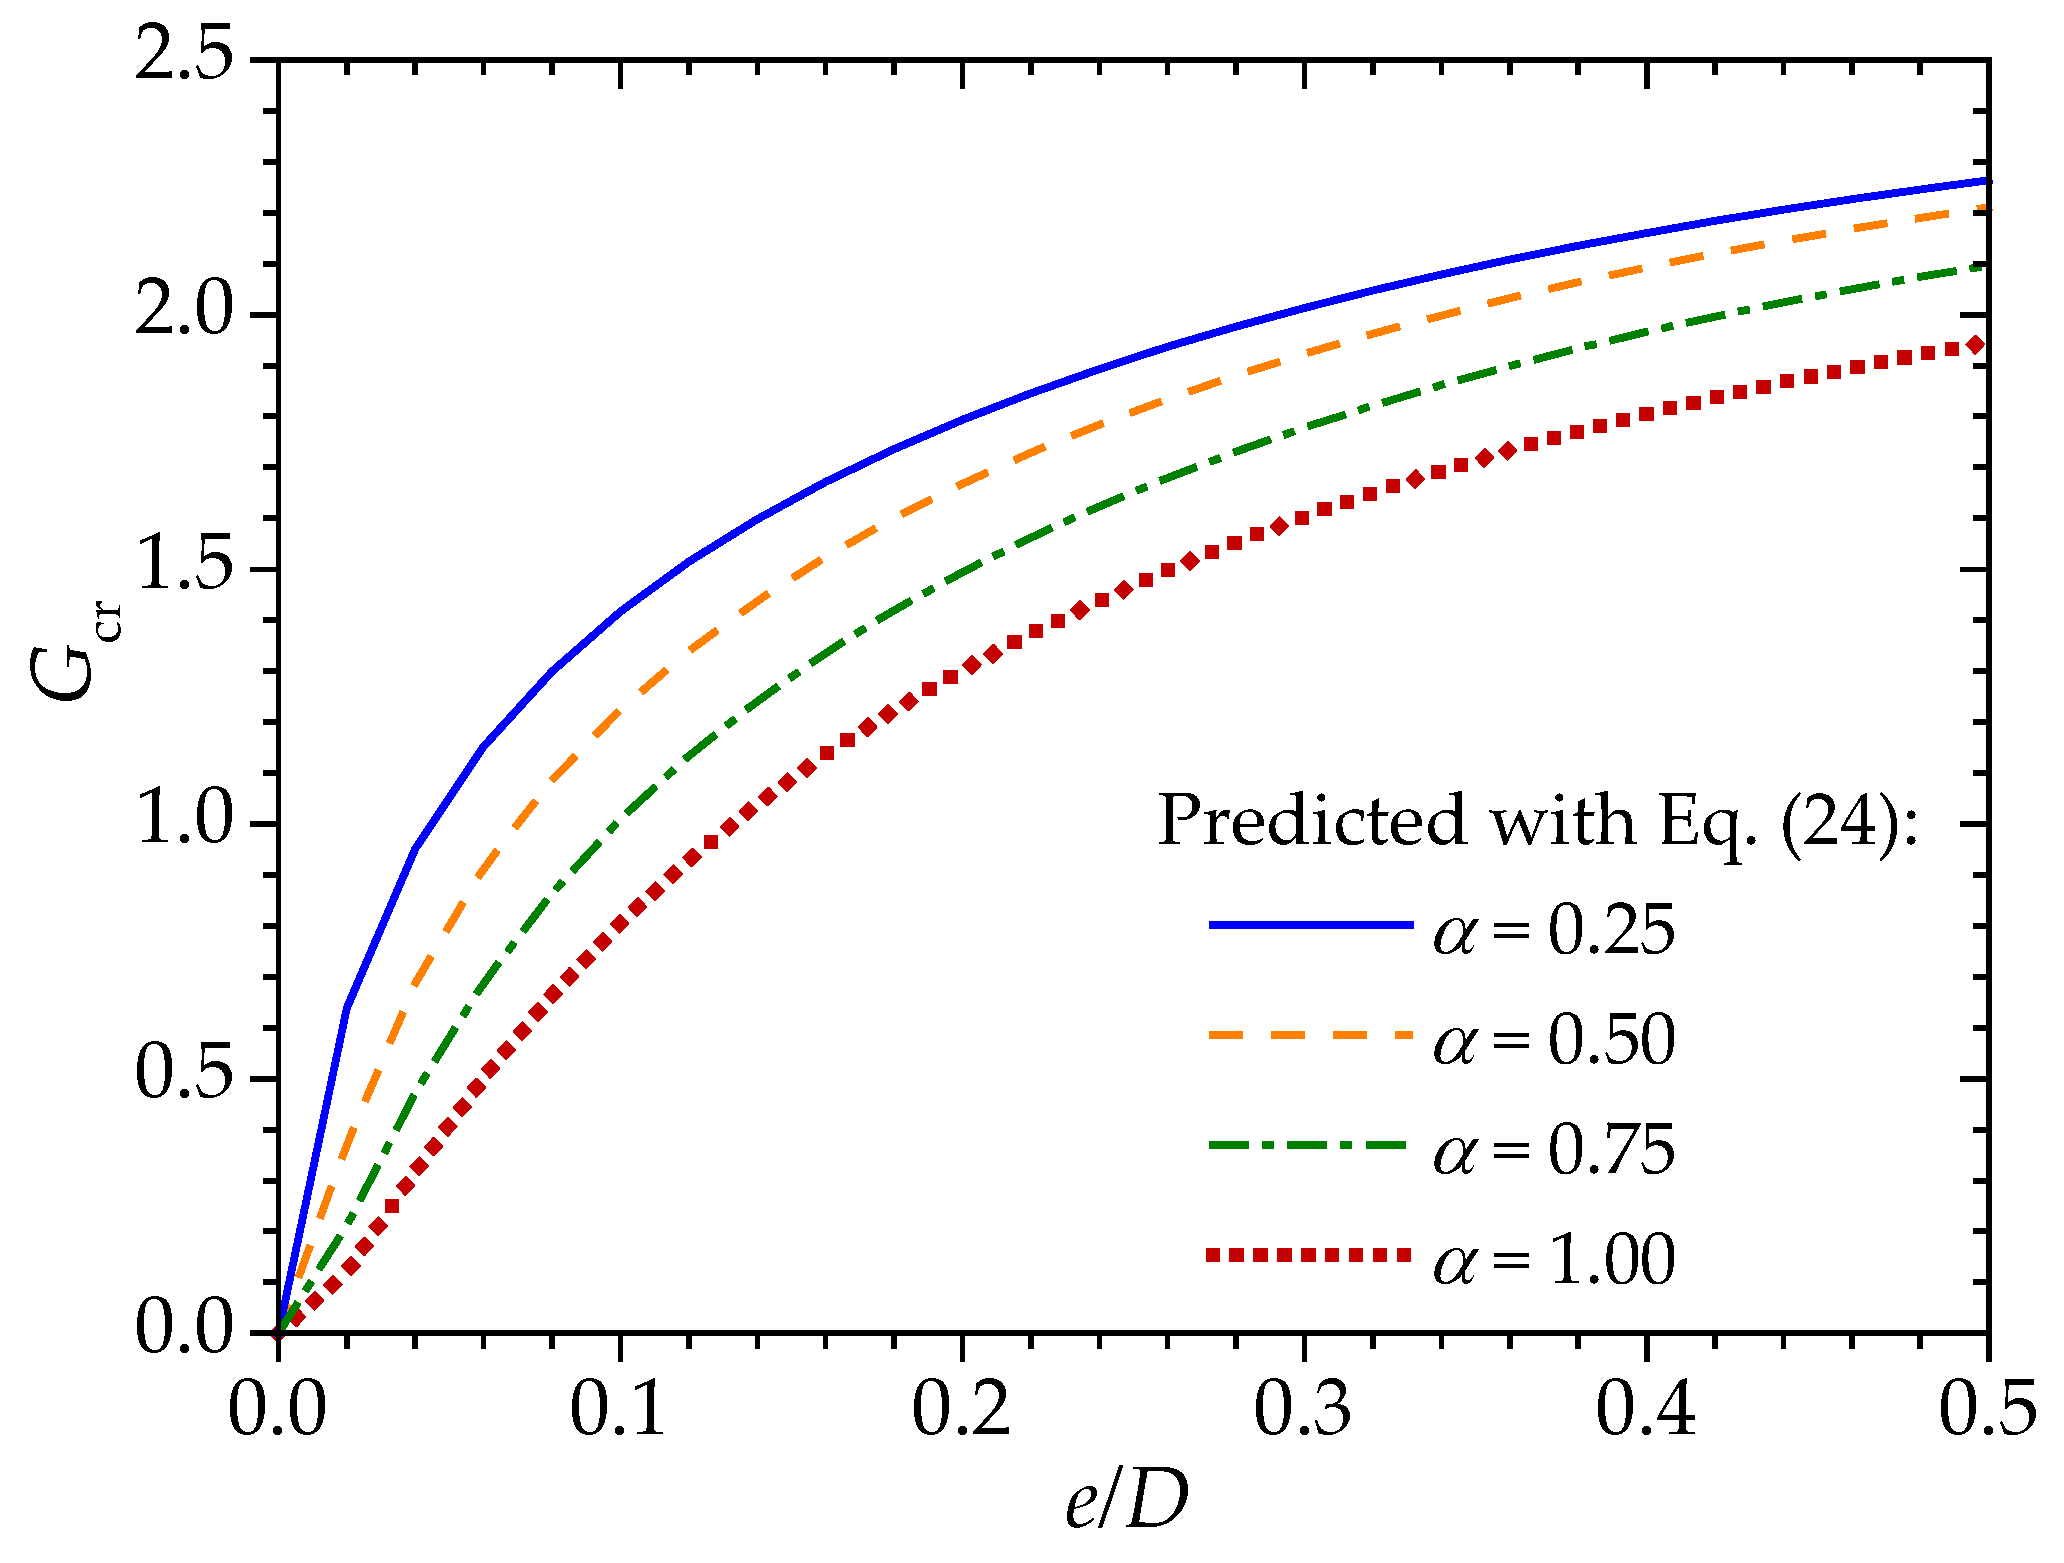
An empirical expression of the load angle εF in correlation with εu, the embedment ratio e/D and the interface friction ratio α, was proposed to characterize the flow rule of a force-resultant plasticity model for predicting the pipe behavior. The trajectories of the pipes with different submerged weight under the horizontal loading were obtained. Based on the established bearing capacity envelope and the flow rule, an analytical solution of the critical submerged weight of the pipe was finally obtained for distinguishing the “light” and the “heavy” pipes.

Author Contributions

Conceptualization, F.G. and W.Q.; numerical simulations and data analyses, N.W., W.Q. and F.G.; writing—original draft, N.W. All authors have read and agreed to the published version of the manuscript.

Funding

This work was funded by the National Natural Science Foundation of China (11825205; 12061160463) and the Youth Innovation Promotion Association CAS (Grant No. 2021018).

Institutional Review Board Statement

Not applicable.

Informed Consent Statement

Not applicable.

Data Availability Statement

The data presented in this study are available upon request from the corresponding author.

Conflicts of Interest

The authors declare no conflict of interest.

Abbreviations

D Outer diameter of the pipe
e Pipe embedment
e x Pipe embedment during lateral movement
E p Young’s modulus of the pipe
E s Young’s modulus of the soil
f Shearing stress at the pipe–soil interface
F Total load upon the pipe
F br Horizontal load inducing pipe breakout
F u Total ultimate load
F u - num Numerical result of the ultimate load
F u - pre Predicted value of the ultimate load
G cr Critical dimensionless submerged pipe weight
h Depth of the soil model
H Horizontal component of the ultimate bearing capacity
H m Maximum horizontal bearing capacity of the failure envelope
J Deviatoric stress
l Width of the soil model
R Overpenetration ratio
R cr Critical overpenetration ratio
s u Undrained strength of the clayey soil
u Displacement of the pipe
u x Horizontal component of the pipe displacement
V Vertical component of the ultimate bearing capacity
V ex Vertical component of the external ultimate load
V m Maximum vertical component of the bearing capacity of the failure envelope
W s Submerged pipe weight per unit length
W scr Critical submerged weight of the pipe per unit length
α Interface friction ratio
β Parameter in Equation (21)
σ ij Normal and shearing stress
σ 1 ~ σ 3 Principal stresses of the soil
Δ The value equal to arcsin α
ε ij Normal and shearing strain
ε f Angle of “zero” shear stress point
ε F Angle of the load direction
ε s Angle of the slip zone boundary
ε u Movement angle
ε ucr Critical movement angle
v p Poisson’s ratio of the pipe
v s Poisson’s ratio of the soil
θ Position angle of an arbitrary point on the pipe–soil interface
θ 0 Half of embedment angle

References

  1. Lunne, T.; Andersen, K.H.; Low, H.E.; Randolph, M.F.; Sjursen, M. Guidelines for offshore in situ testing and interpretation in deepwater soft clays. Can. Geotech. J. 2011, 48, 543–556. [Google Scholar] [CrossRef]
  2. Liu, J.T.; Shi, Y.M.; Wang, J.Q.; Zhu, Y.S.; Li, C.F.; Qi, W.G.; Gao, F.P. Statistical characteristics analyses on engineering properties of surface sediments in the deep-water of northern South China Sea. Ocean Eng. 2021, 39, 90–98. [Google Scholar]
  3. Guo, X.-S.; Nian, T.-K.; Wang, D.; Gu, Z.-D. Evaluation of undrained shear strength of surficial marine clays using ball penetration-based CFD modelling. Acta Geotech. 2021. [Google Scholar] [CrossRef]
  4. Westgate, Z.; Randolph, M.; White, D.; Li, S. The influence of sea state on as-laid pipeline embedment: A case study. Appl. Ocean Res. 2010, 32, 321–331. [Google Scholar] [CrossRef]
  5. Bruton, D.A.S.; White, D.J.; Cheuk, C.Y.; Bolton, M.D.; Carr, M.C. Pipe/soil interaction behaviour during lateral buckling, including large amplitude cyclic displacement tests by the Safebuck JIP. In Proceedings of the Offshore Technology Conference, Houston, TX, USA, 1–4 May 2006. [Google Scholar]
  6. Leckie, S.H.; Draper, S.; White, D.J.; Cheng, L.; Fogliani, A. Lifelong embedment and spanning of a pipeline on a mobile seabed. Coast. Eng. 2015, 95, 130–146. [Google Scholar] [CrossRef]
  7. Qi, W.-G.; Gao, F.-P. Wave induced instantaneously-liquefied soil depth in a non-cohesive seabed. Ocean Eng. 2018, 153, 412–423. [Google Scholar] [CrossRef] [Green Version]
  8. Zhou, M.; Liu, H.; Jeng, D.-S.; Qi, W.; Fang, Q. Modelling the wave-induced instantaneous liquefaction in a non-cohesive seabed as a nonlinear complementarity problem. Comput. Geotech. 2021, 137, 104275. [Google Scholar] [CrossRef]
  9. Zhou, M.-Z.; Qi, W.-G.; Jeng, D.-S.; Gao, F.-P. A non-Darcy flow model for a non-cohesive seabed involving wave-induced instantaneous liquefaction. Ocean Eng. 2021, 239, 109807. [Google Scholar] [CrossRef]
  10. Gao, F.; Li, J.; Qi, W.; Hu, C. On the instability of offshore foundations: Theory and mechanism. Sci. China Ser. G Phys. Mech. Astron. 2015, 58, 124701. [Google Scholar] [CrossRef] [Green Version]
  11. Chen, W.F. Limit Analysis and Soil Plasticity; Elsevier Scientific Publishing Co.: New York, NY, USA, 1975. [Google Scholar]
  12. Karal, K. Lateral stability of submarine pipelines. In Proceedings of the Annual Offshore Technology Conference, Houston, TX, USA, 2–5 May 1977; pp. 71–78. [Google Scholar]
  13. Martin, C.; White, D. Limit analysis of the undrained bearing capacity of offshore pipelines. Géotechnique 2012, 62, 847–863. [Google Scholar] [CrossRef]
  14. Gao, F.-P.; Wang, N.; Zhao, B. Ultimate bearing capacity of a pipeline on clayey soils: Slip-line field solution and FEM simulation. Ocean Eng. 2013, 73, 159–167. [Google Scholar] [CrossRef] [Green Version]
  15. Gao, F.P.; Wang, N.; Zhao, B. A general slip-line field solution for the ultimate bearing capacity of a pipeline on drained soils. Ocean Eng. 2015, 104, 405–413. [Google Scholar] [CrossRef] [Green Version]
  16. Det Norske Veritas (DNV). Pipe-Soil Interaction for Submarine Pipelines. In DNVGL Recommended Practice DNVGL-RP-F114; Det Norske Veritas: Oslo, Norway, 2017. [Google Scholar]
  17. Merifield, R.S.; White, D.J.; Randolph, M.F. Effect of Surface Heave on Response of Partially Embedded Pipelines on Clay. J. Geotech. Geoenviron. Eng. 2009, 135, 819–829. [Google Scholar] [CrossRef] [Green Version]
  18. Dutta, S.; Hawlader, B.; Phillips, R. Finite element modeling of partially embedded pipelines in clay seabed using Coupled Eulerian–Lagrangian method. Can. Geotech. J. 2015, 52, 58–72. [Google Scholar] [CrossRef]
  19. Fredsøe, J. Pipeline–seabed interaction. J. Waterw. Port Coast. Ocean. Eng. 2016, 142, 03116002. [Google Scholar] [CrossRef] [Green Version]
  20. Gao, F.-P. Flow-pipe-soil coupling mechanisms and predictions for submarine pipeline instability. J. Hydrodyn. 2017, 29, 763–773. [Google Scholar] [CrossRef]
  21. Wagner, D.; Murff, J.; Brennodden, H.; Sveggen, O. Pipe-Soil Interaction Model. J. Waterw. Port Coast. Ocean Eng. 1989, 115, 205–220. [Google Scholar] [CrossRef]
  22. Det Norske Veritas (DNV). On-Bottom Stability Design of Submarine Pipeline. In DNV Recommended Practice DNV-RP-F109; Det Norske Veritas: Oslo, Norway, 2010. [Google Scholar]
  23. Gao, F.-P.; Wang, N.; Li, J.; Han, X.-T. Pipe-soil interaction model for current-induced pipeline instability on a sloping sandy seabed. Can. Geotech. J. 2016, 53, 1822–1830. [Google Scholar] [CrossRef] [Green Version]
  24. Hodder, M.; Cassidy, M. A plasticity model for predicting the vertical and lateral behaviour of pipelines in clay soils. Géotechnique 2010, 60, 247–263. [Google Scholar] [CrossRef]
  25. Cheuk, C.; White, D.; Dingle, H. Upper Bound Plasticity Analysis of a Partially-Embedded Pipe Under Combined Vertical and Horizontal Loading. Soils Found. 2008, 48, 133–140. [Google Scholar] [CrossRef] [Green Version]
  26. Randolph, M.F.; White, D.J. Upper-bound yield envelopes for pipelines at shallow embedment in clay. Géotechnique 2008, 58, 297–301. [Google Scholar] [CrossRef]
  27. Aubeny, C.P.; Shi, H.; Murff, J.D. Collapse Loads for a Cylinder Embedded in Trench in Cohesive Soil. Int. J. Géoméch. 2005, 5, 320–325. [Google Scholar] [CrossRef]
  28. Merifield, R.; White, D.J.; Randolph, M.F. The ultimate undrained resistance of partially embedded pipelines. Geotechnique 2008, 58, 461–470. [Google Scholar] [CrossRef]
  29. Wang, D.; White, D.; Randolph, M. Large-deformation finite element analysis of pipe penetration and large-amplitude lateral displacement. Can. Geotech. J. 2010, 47, 842–856. [Google Scholar] [CrossRef]
  30. Tian, Y.; Cassidy, M.J. Pipe-Soil Interaction Model Incorporating Large Lateral Displacements in Calcareous Sand. J. Geotech. Geoenviron. Eng. 2011, 137, 279–287. [Google Scholar] [CrossRef]
  31. Chatterjee, S.; White, D.; Randolph, M. Numerical simulations of pipe–soil interaction during large lateral movements on clay. Géotechnique 2012, 62, 693–705. [Google Scholar] [CrossRef]
  32. Hibbitt, D.; Karlsson, B.; Sorensen, P. Abaqus: Analysis User’s Manual, Version 6.11; Simulia DCS: Pawducket, RI, USA, 2011. [Google Scholar]
  33. Dingle, H.R.; White, D.J.; Gaudin, C. Mechanisms of pipe embedment and lateral breakout on soft clay. Can. Geotech. J. 2008, 45, 636–652. [Google Scholar] [CrossRef]
  34. Hossain, M.; O’Loughlin, C.; Kim, Y. Dynamic installation and monotonic pullout of a torpedo anchor in calcareous silt. Géotechnique 2015, 65, 77–90. [Google Scholar] [CrossRef] [Green Version]
  35. Zhou, T.; Tian, Y.; Cassidy, M.J. Effect of Tension on the Combined Loading Failure Envelope of a Pipeline on Soft Clay Seabed. Int. J. Géoméch. 2018, 18, 04018131. [Google Scholar] [CrossRef]
  36. Qi, W.-G.; Shi, Y.-M.; Gao, F.-P. Uplift soil resistance to a shallowly-buried pipeline in the sandy seabed under waves: Poro-elastoplastic modeling. Appl. Ocean Res. 2020, 95, 102024. [Google Scholar] [CrossRef]
  37. Guo, X.; Nian, T.; Zhao, W.; Gu, Z.; Liu, C.; Liu, X.; Jia, Y. Centrifuge experiment on the penetration test for evaluating undrained strength of deep-sea surface soils. Int. J. Min. Sci. Technol. 2021, in press. [Google Scholar] [CrossRef]
  38. Shi, Y.; Gao, F.; Wang, N.; Yin, Z. Coupled Flow-Seepage-Elastoplastic Modeling of a Competition Mechanism between Lateral Instability and Tunnel Erosion of a Submarine Pipeline. J. Mar. Sci. Eng. 2021, 9, 889. [Google Scholar] [CrossRef]
  39. Hong, Z.; Fu, D.; Liu, W.; Zhou, Z.; Yan, Y.; Yan, S. Effect of Gain in Soil Friction on the Walking Rate of Subsea Pipelines. J. Mar. Sci. Eng. 2019, 7, 401. [Google Scholar] [CrossRef] [Green Version]
  40. Bransby, M.F.; Zajac, P.; Amman, S. Finite element analysis of the vertical penetration of “on-bottom” pipelines in clay. In Proceedings of the 18th International Off Shore and Polar Engineering Conference, Vancouver, BC, Canada, 6–11 July 2008; pp. 245–249. [Google Scholar]
  41. Oliveira, J.R.M.S.; Almeida, M.S.S.; Asce, M.; Almeida, M.; Borges, R.G. Physical modeling of lateral clay-pipe interaction. J. Geotech. Geoenviron. Eng. 2010, 136, 950–956. [Google Scholar] [CrossRef]
  42. Zhang, B.; Gong, R.; Wang, T.; Wang, Z. Causes and Treatment Measures of Submarine Pipeline Free-Spanning. J. Mar. Sci. Eng. 2020, 8, 329. [Google Scholar] [CrossRef]
  43. Det Norske Veritas (DNV). Global Buckling of Submarine Pipelines—Structure Design Due to High Temperature/High Pressure. In DNV Recommended Practice DNV-RP-F110; Det Norske Veritas: Oslo, Norway, 2007. [Google Scholar]
  44. Chatterjee, S. Numerical Modelling of Pipe-Soil Interactions. Ph.D. Thesis, University of Western Australia, Perth, Australia, 2012. [Google Scholar]
  45. Zhang, J.; Stewart, D.P.; Randolph, M. Modeling of Shallowly Embedded Offshore Pipelines in Calcareous Sand. J. Geotech. Geoenviron. Eng. 2002, 128, 363–371. [Google Scholar] [CrossRef]
Figure 1. Schematic diagram of the pipe–soil interaction system with the pipe moving in an obliquely downward direction.
Jmse 10 00299 g001
Figure 2. Meshes and boundary conditions of the FE model.
Jmse 10 00299 g002
Figure 3. (a) The non-dimensional soil resistance vs. the non-dimensional pipe displacement for obliquely loaded pipe–soil interactions; the evolutions of equivalent plastic strain zone (α = 1.0, e/D = 0.4): (b) the pipe movement angle εu = 0° (vertical penetration); (c) εu = 30°; (d) εu = 60°; (e) εu = 90° (horizontal swipe).
Jmse 10 00299 g003
Figure 4. The relationship between the position of the slip zone boundary (εs) and the pipe movement angle (εu).
Jmse 10 00299 g004
Figure 5. Variations of the normalized vertical bearing capacity (V/suD) with the relative embedment (e/D) for various values of pipe roughness (α) in the vertical penetration.
Jmse 10 00299 g005
Figure 6. Variations of (a) the horizontal component and (b) the vertical component of the normalized ultimate bearing capacity with the relative embedment (e/D) for various values of the pipe roughness (α) in the horizontal swipe.
Jmse 10 00299 g006
Figure 7. The distribution of shear stress along the pipe–soil interface under the ultimate state for the movement angle εu = π/2 (e/D = 0.4, α = 1.0).
Jmse 10 00299 g007
Figure 8. The correlation between the angle for zero shear stress point (εf) and the pipe movement angle (εu).
Jmse 10 00299 g008
Figure 9. The bearing capacity envelopes for the pipe with various embedment ratios (e/D): (a) e/D = 0.5; (b) e/D = 0.3; (c) e/D = 0.1. Note: For the vertical penetration (εu = 0) and the horizontal swipe (εu = π/2) cases, the moving directions of the pipe are specially marked with pink arrows.
Jmse 10 00299 g009aJmse 10 00299 g009b
Figure 10. The correlation of pipe movement angle (εu) with the direction angle of ultimate load (εF) for various values of the pipe embedment ratio (e/D): (a) e/D = 0.5; (b) e/D = 0.4; (c) e/D = 0.3; (d) e/D = 0.2; (e) e/D = 0.1.
Jmse 10 00299 g010
Figure 11. Comparison between the predicted direction angle of the ultimate load (εF-pre) and the numerical results (εF-num).
Jmse 10 00299 g011
Figure 12. Comparison between the predicted values of the non-dimensional ultimate load (Fu-pre/suD) and the numerical results (Fu-num/suD).
Jmse 10 00299 g012
Figure 13. Developments of the embedment ratio (ex/D) with the horizontal displacement of the pipe (ux) for e/D = 0.2 and various values of the overpenetration ratio (R): (a) α = 0; (b) α = 0.5; (c) α = 1.0.
Jmse 10 00299 g013
Figure 14. Variations of the non-dimensional critical submerged weight of the pipe (Gcr) with the embedment ratio (e/D) for various values of the interface friction factor (α).
Jmse 10 00299 g014
Table 1. Properties of the pipe and the seabed.
Parameters SymbolsUnitsValues
Outer diameter of the pipeDm0.46
Elastic modulus of the pipeEpGPa210
Poisson’s ratio of the pipeνp--0.19
Sumerged weight of the pipeWsN/mVaried in Section 3.4
Elastic modulus of the soilEsMPa50
Poisson’s ratio of the soilνs--0.49
Undrained shear strength of the soilsukPa3.2
Pipe–soil interface friction ratioα--0, 0.5, 1.0
Embedment of the pipeem0.1, 0.2, 0.3, 0.4, 0.5
Half of embedment angle θ0--arccos (1 − 2e/D)
Angle of instabilityεu--0 ~ (π/2 + θ0)
Publisher’s Note: MDPI stays neutral with regard to jurisdictional claims in published maps and institutional affiliations.

