
On-Site Investigations of Coastal Erosion and Accretion for the Northeast of Taiwan


 , , and
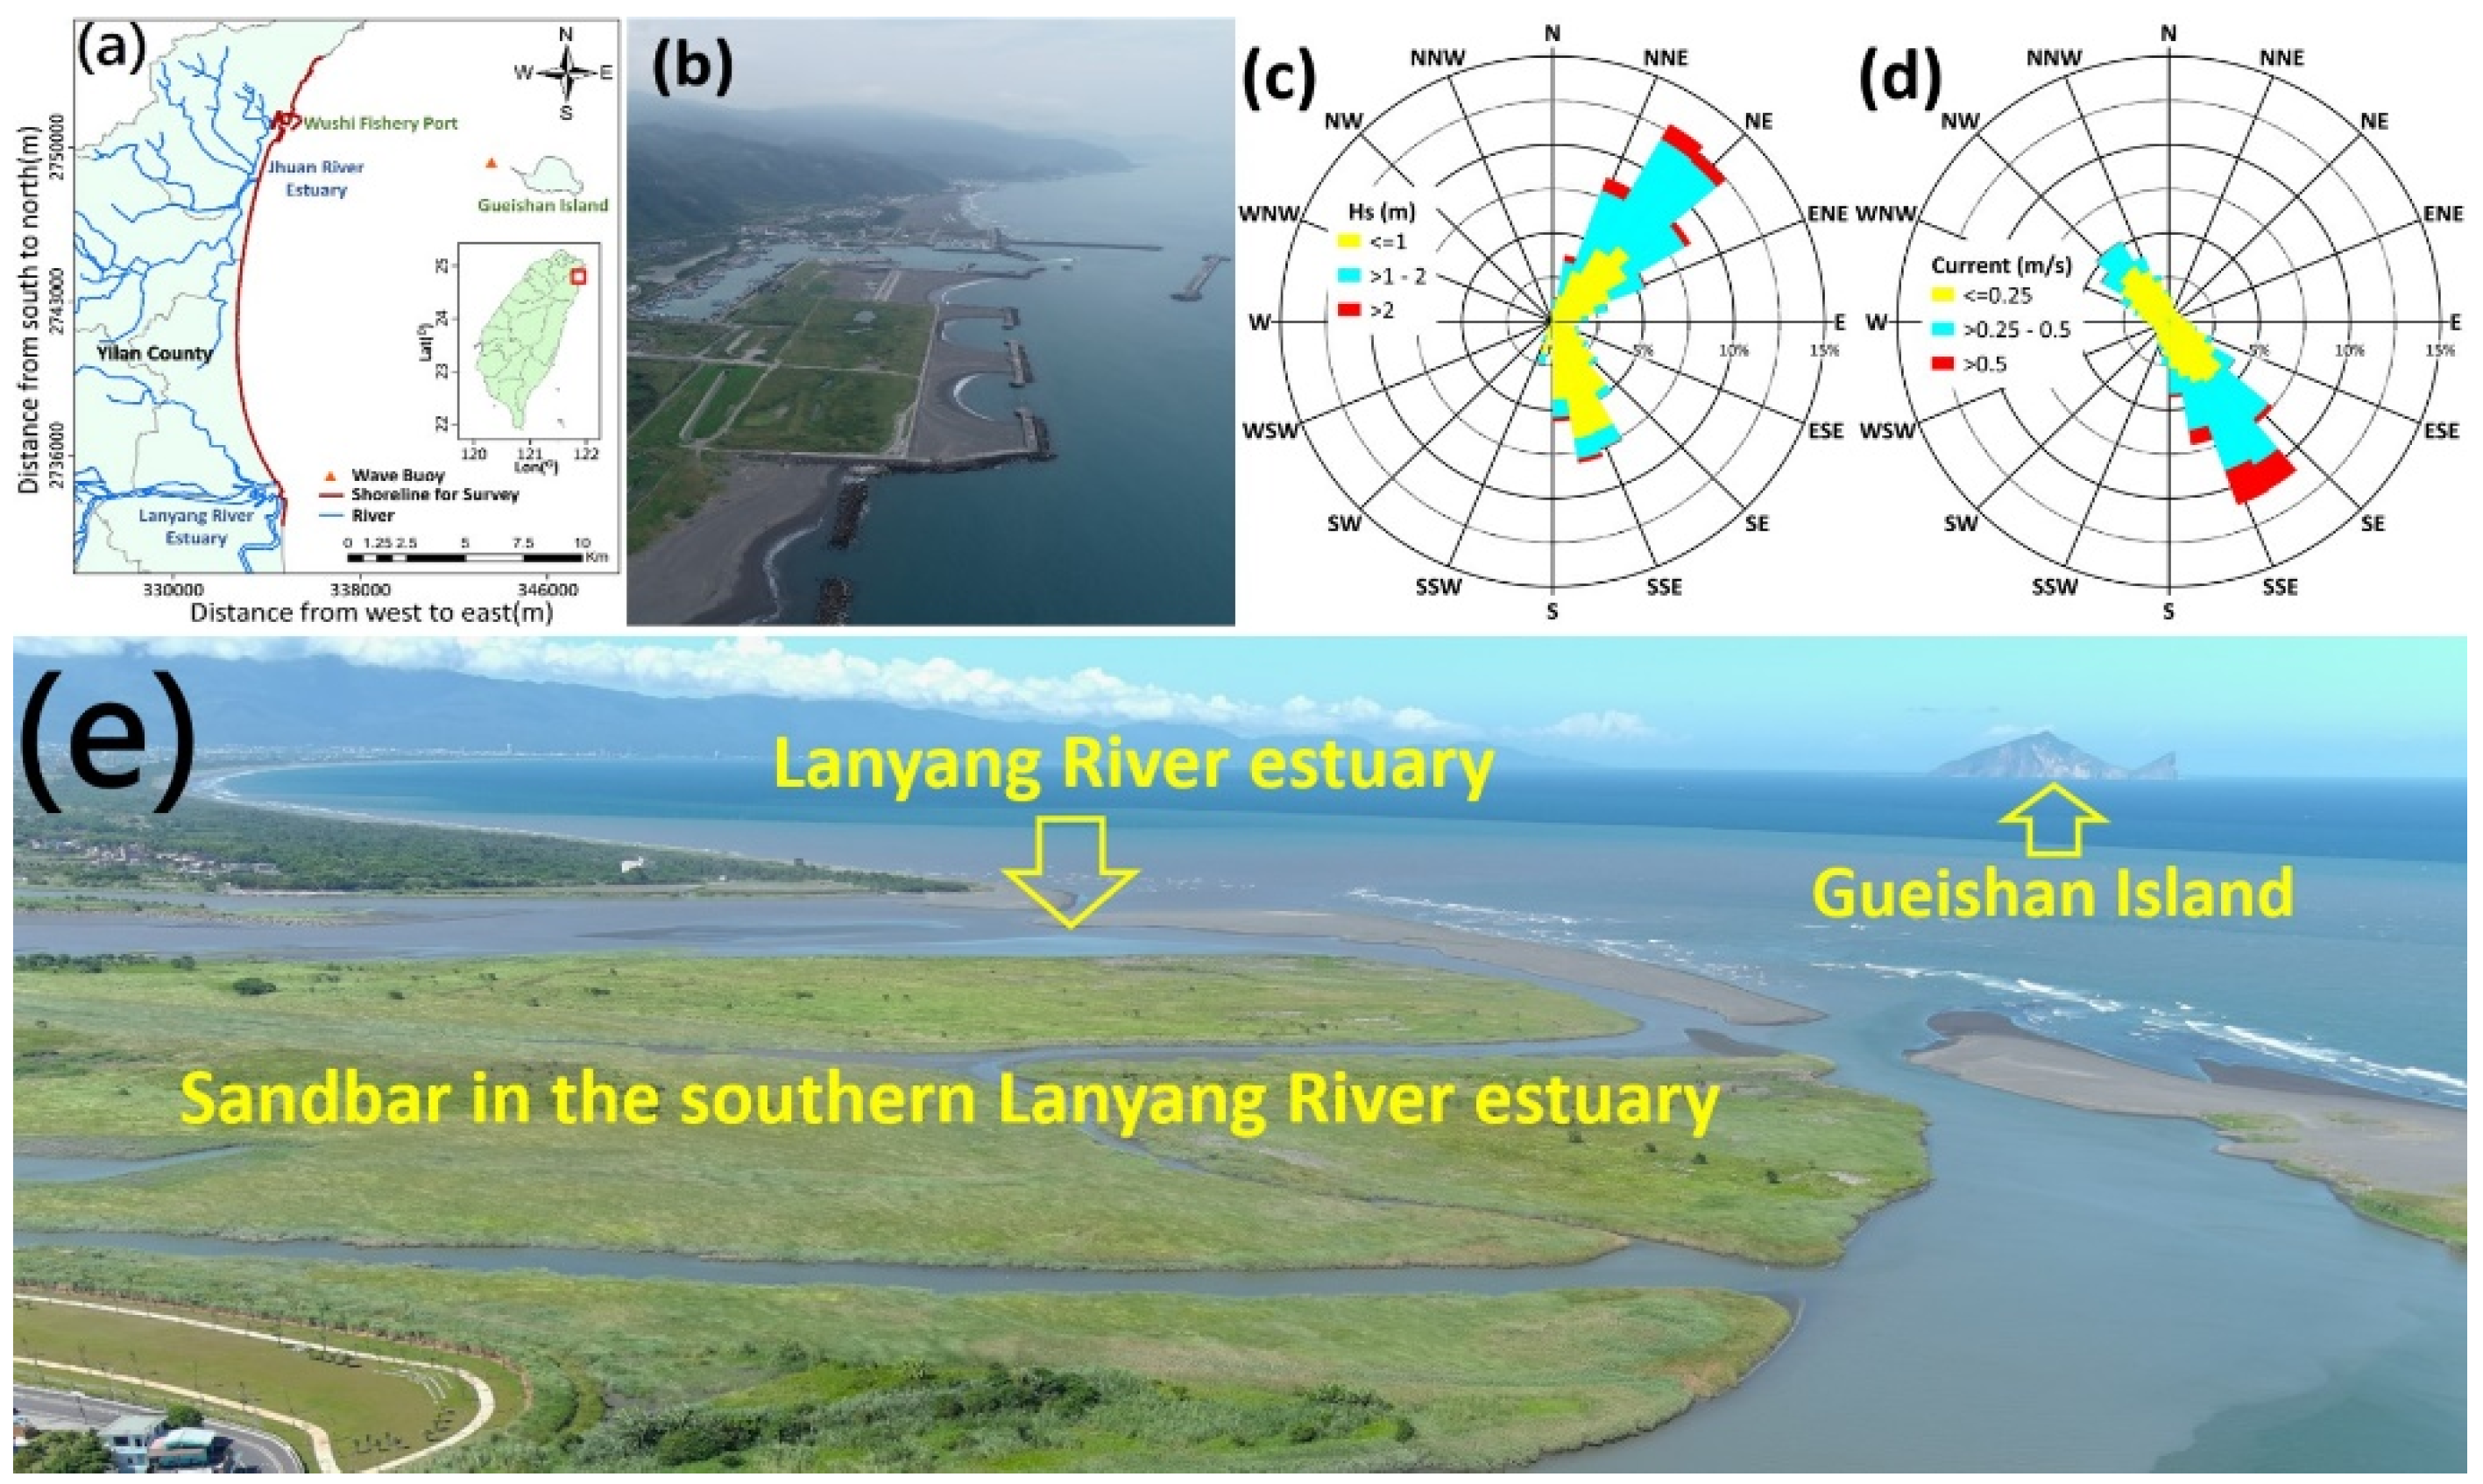
Abstract
:1. Introduction
2. Materials and Methods
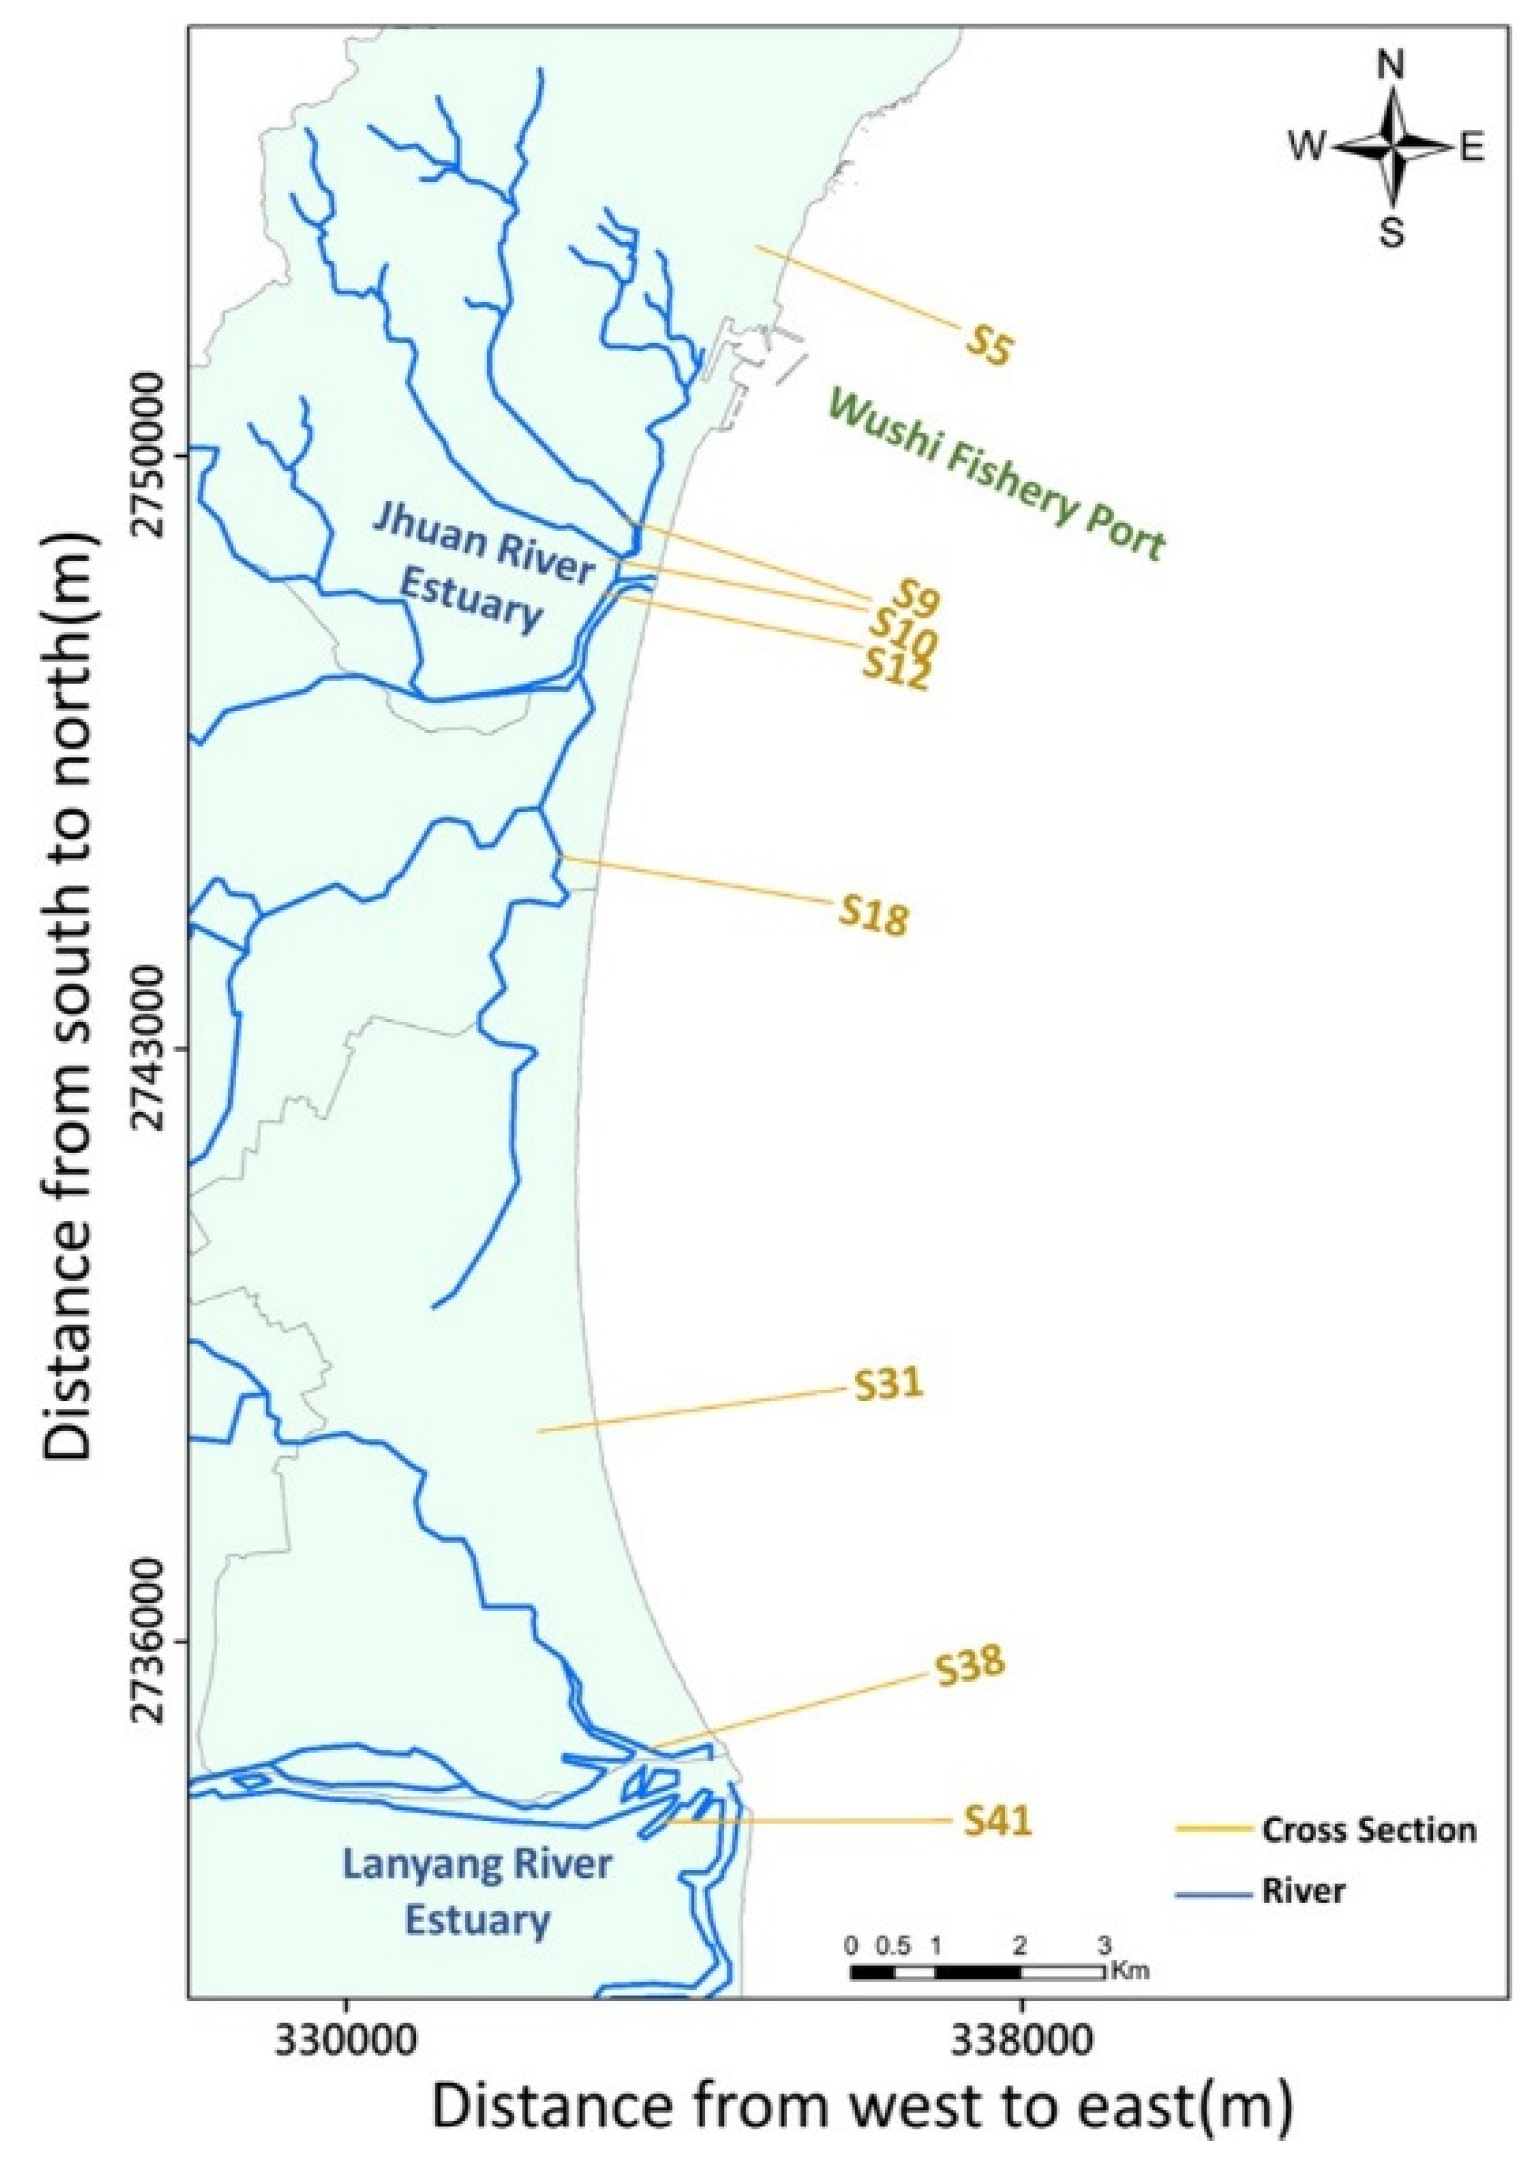
2.1. Description of Study Site
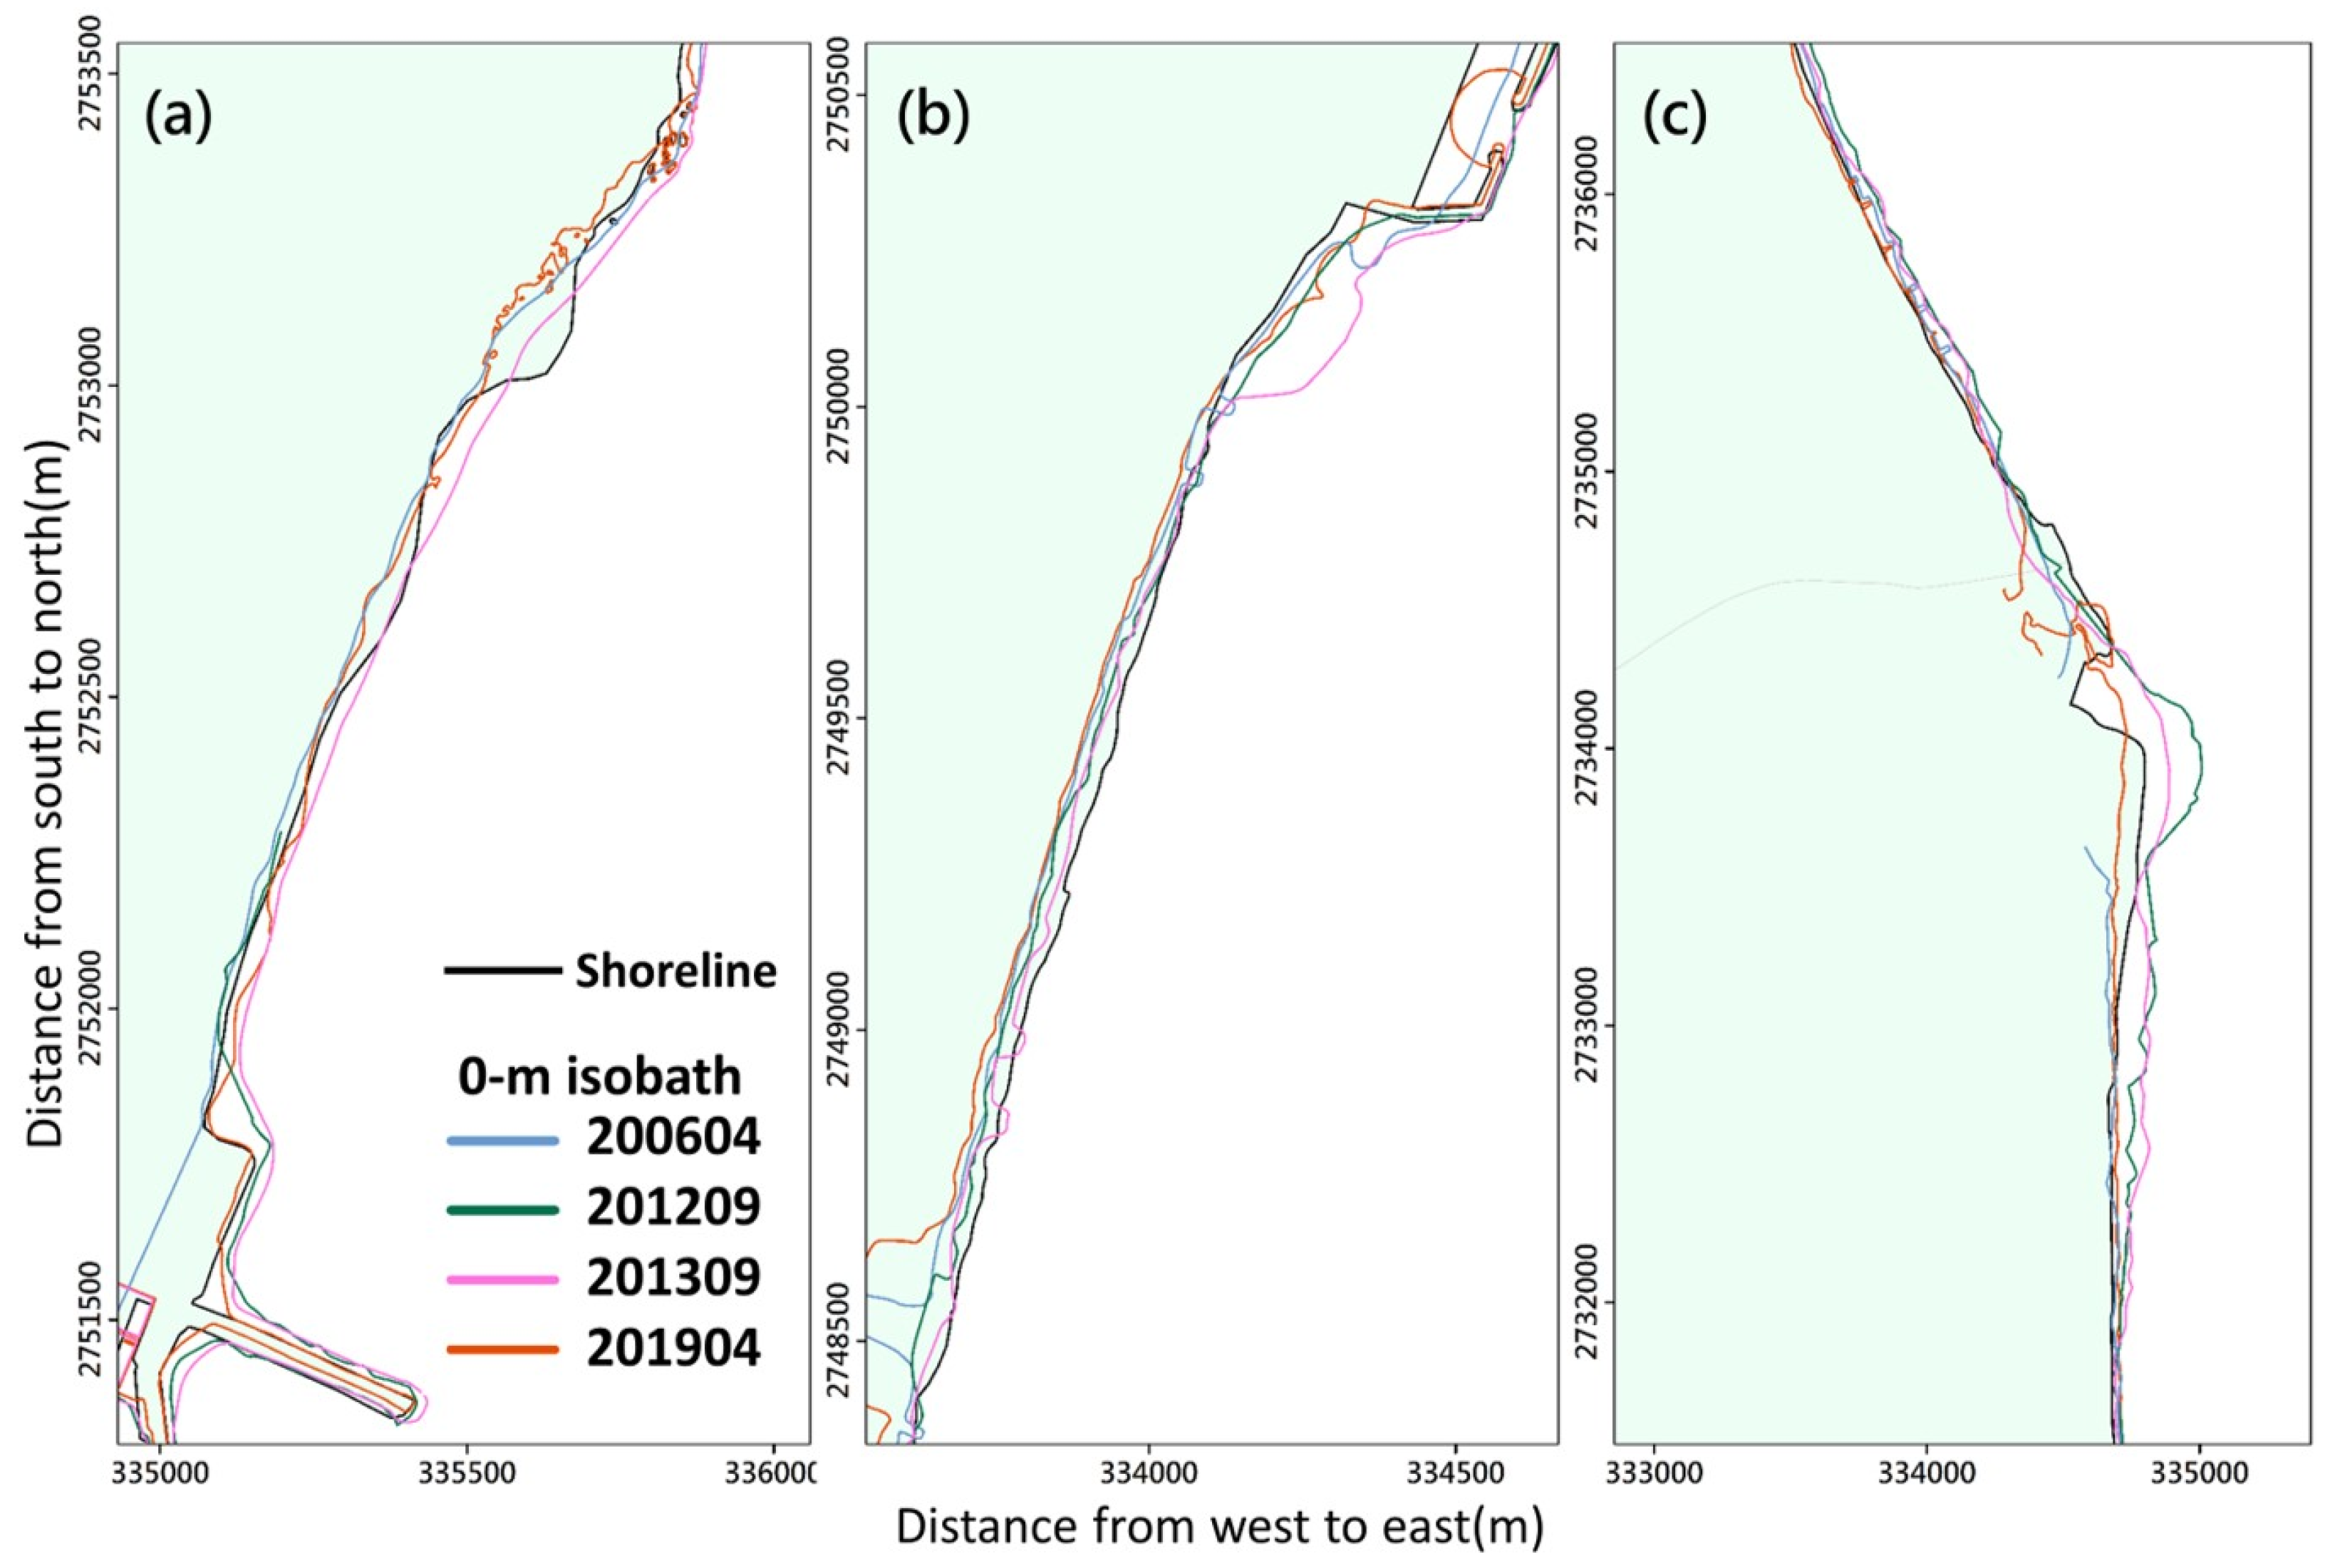
2.2. Evolution of the 0 m Isobath
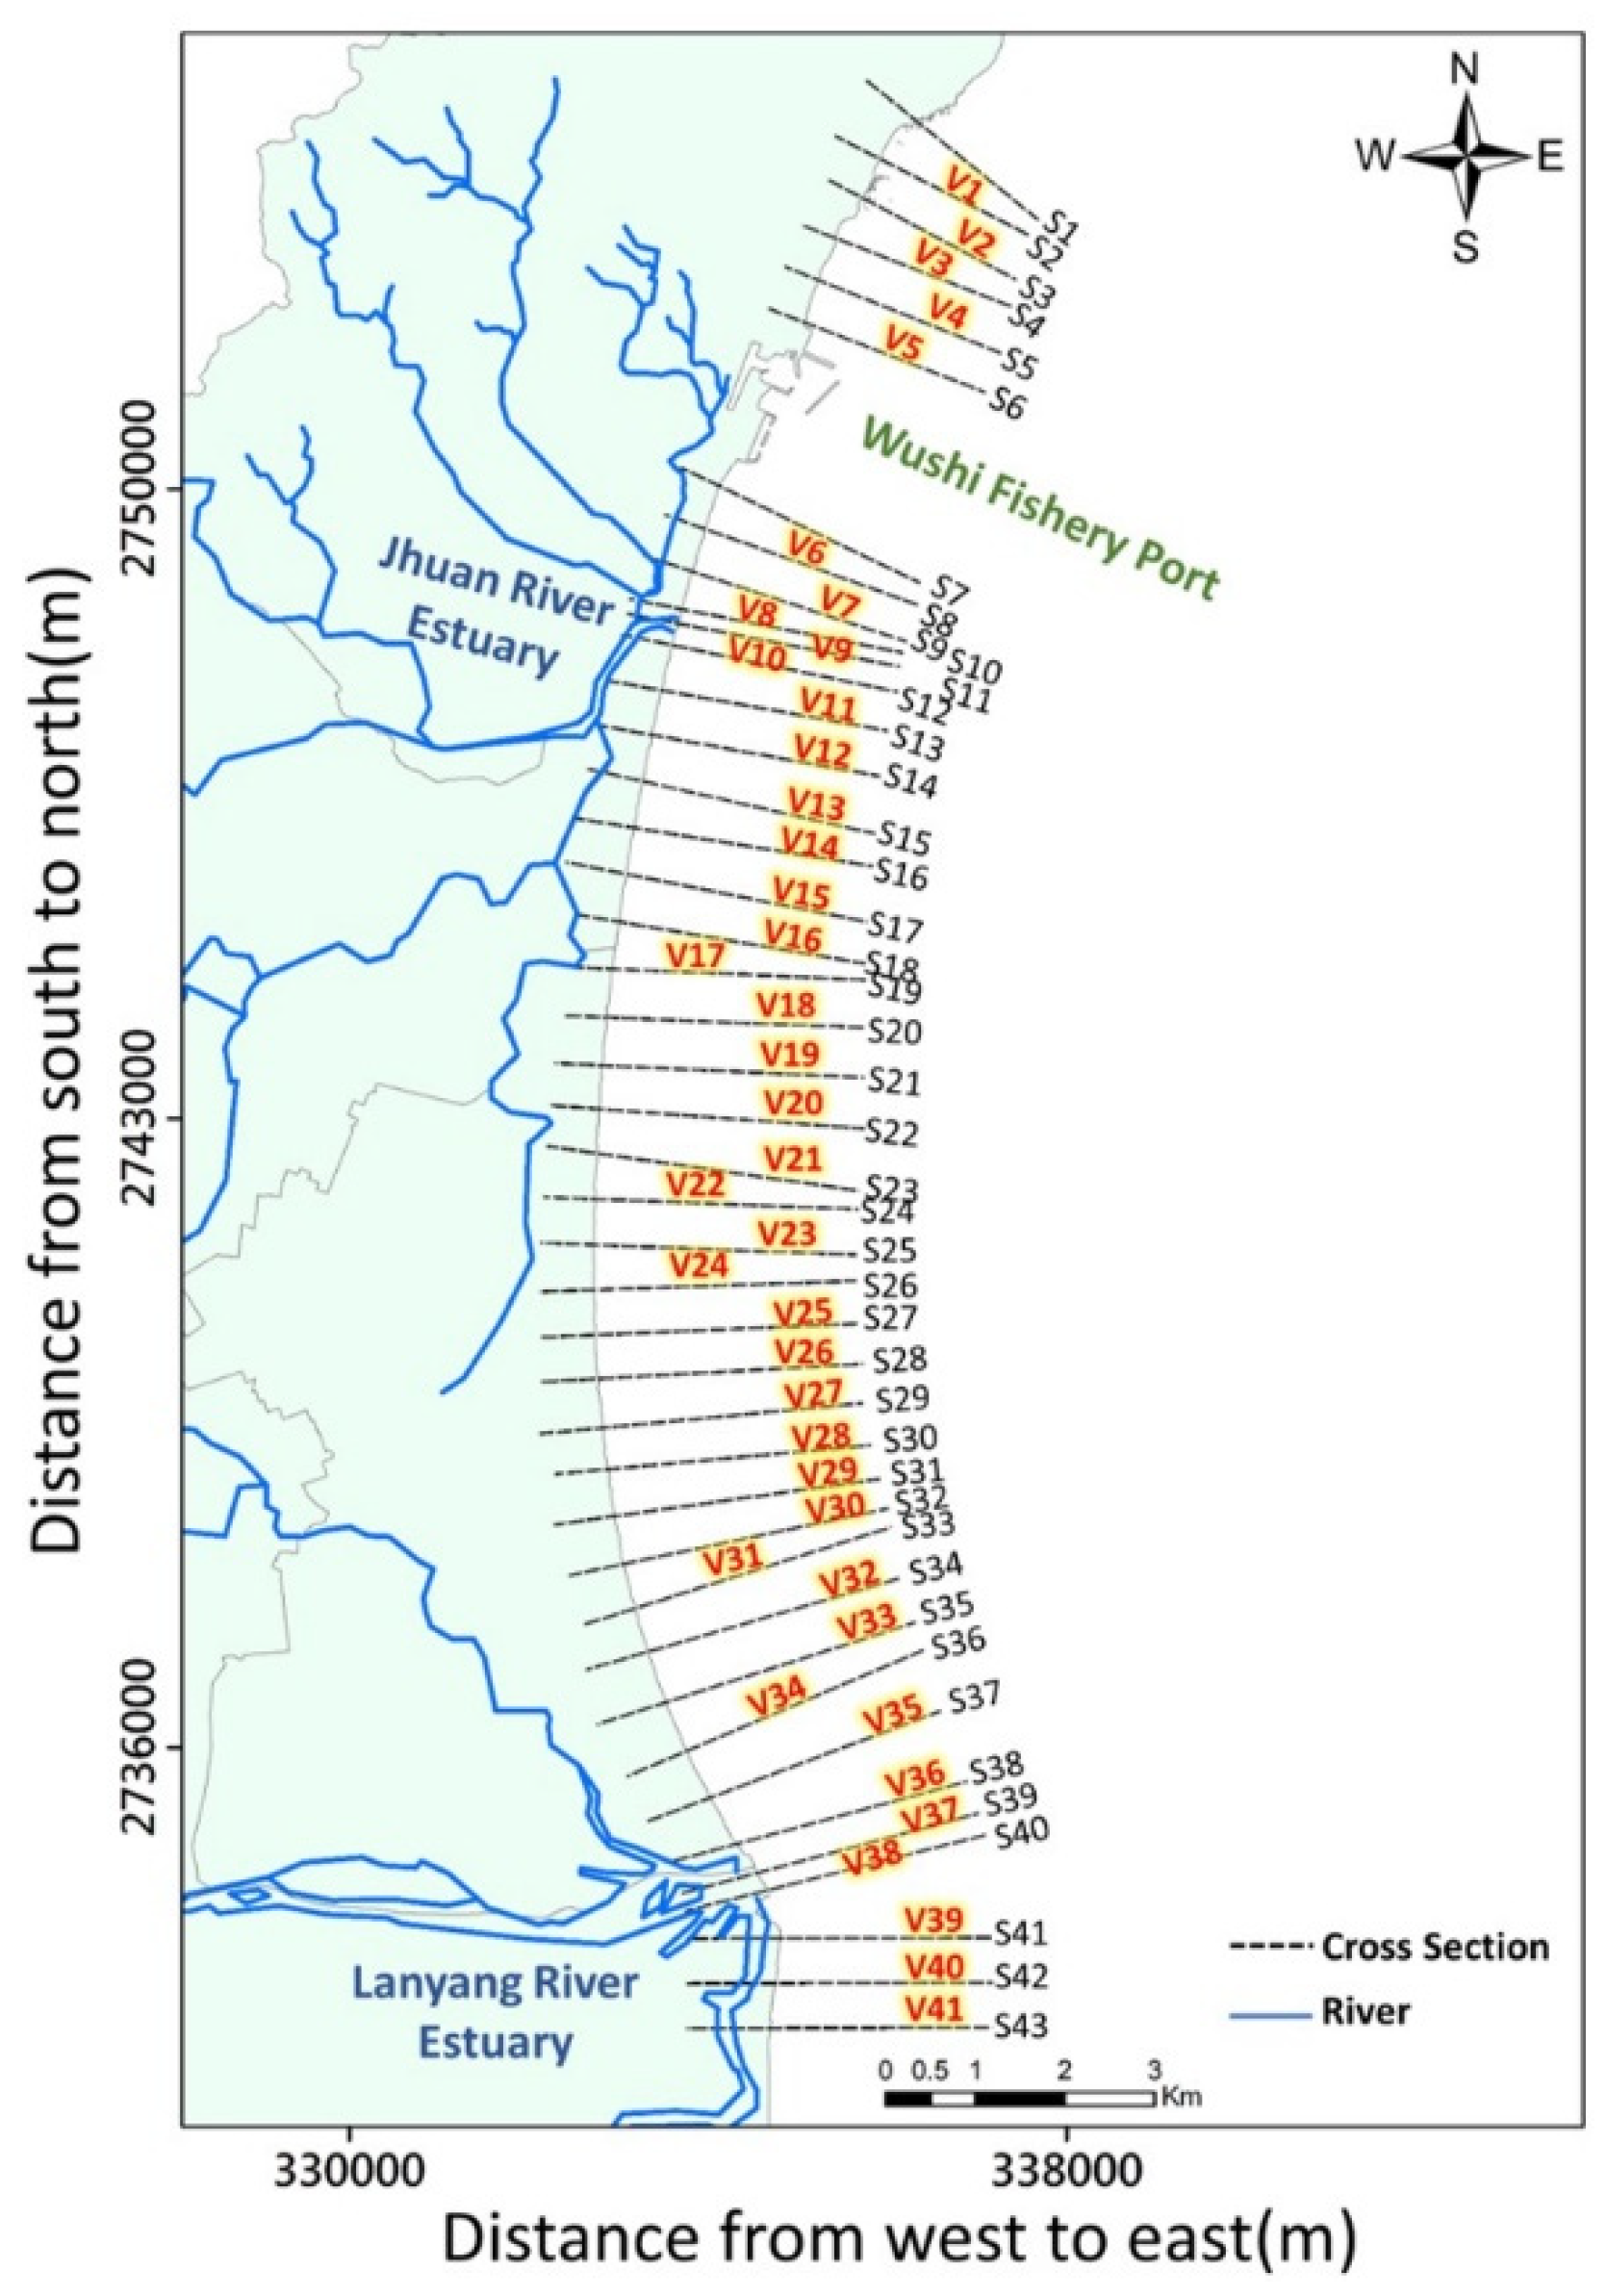
2.3. On-Site Bathymetric and Topographic Surveys
3. Results
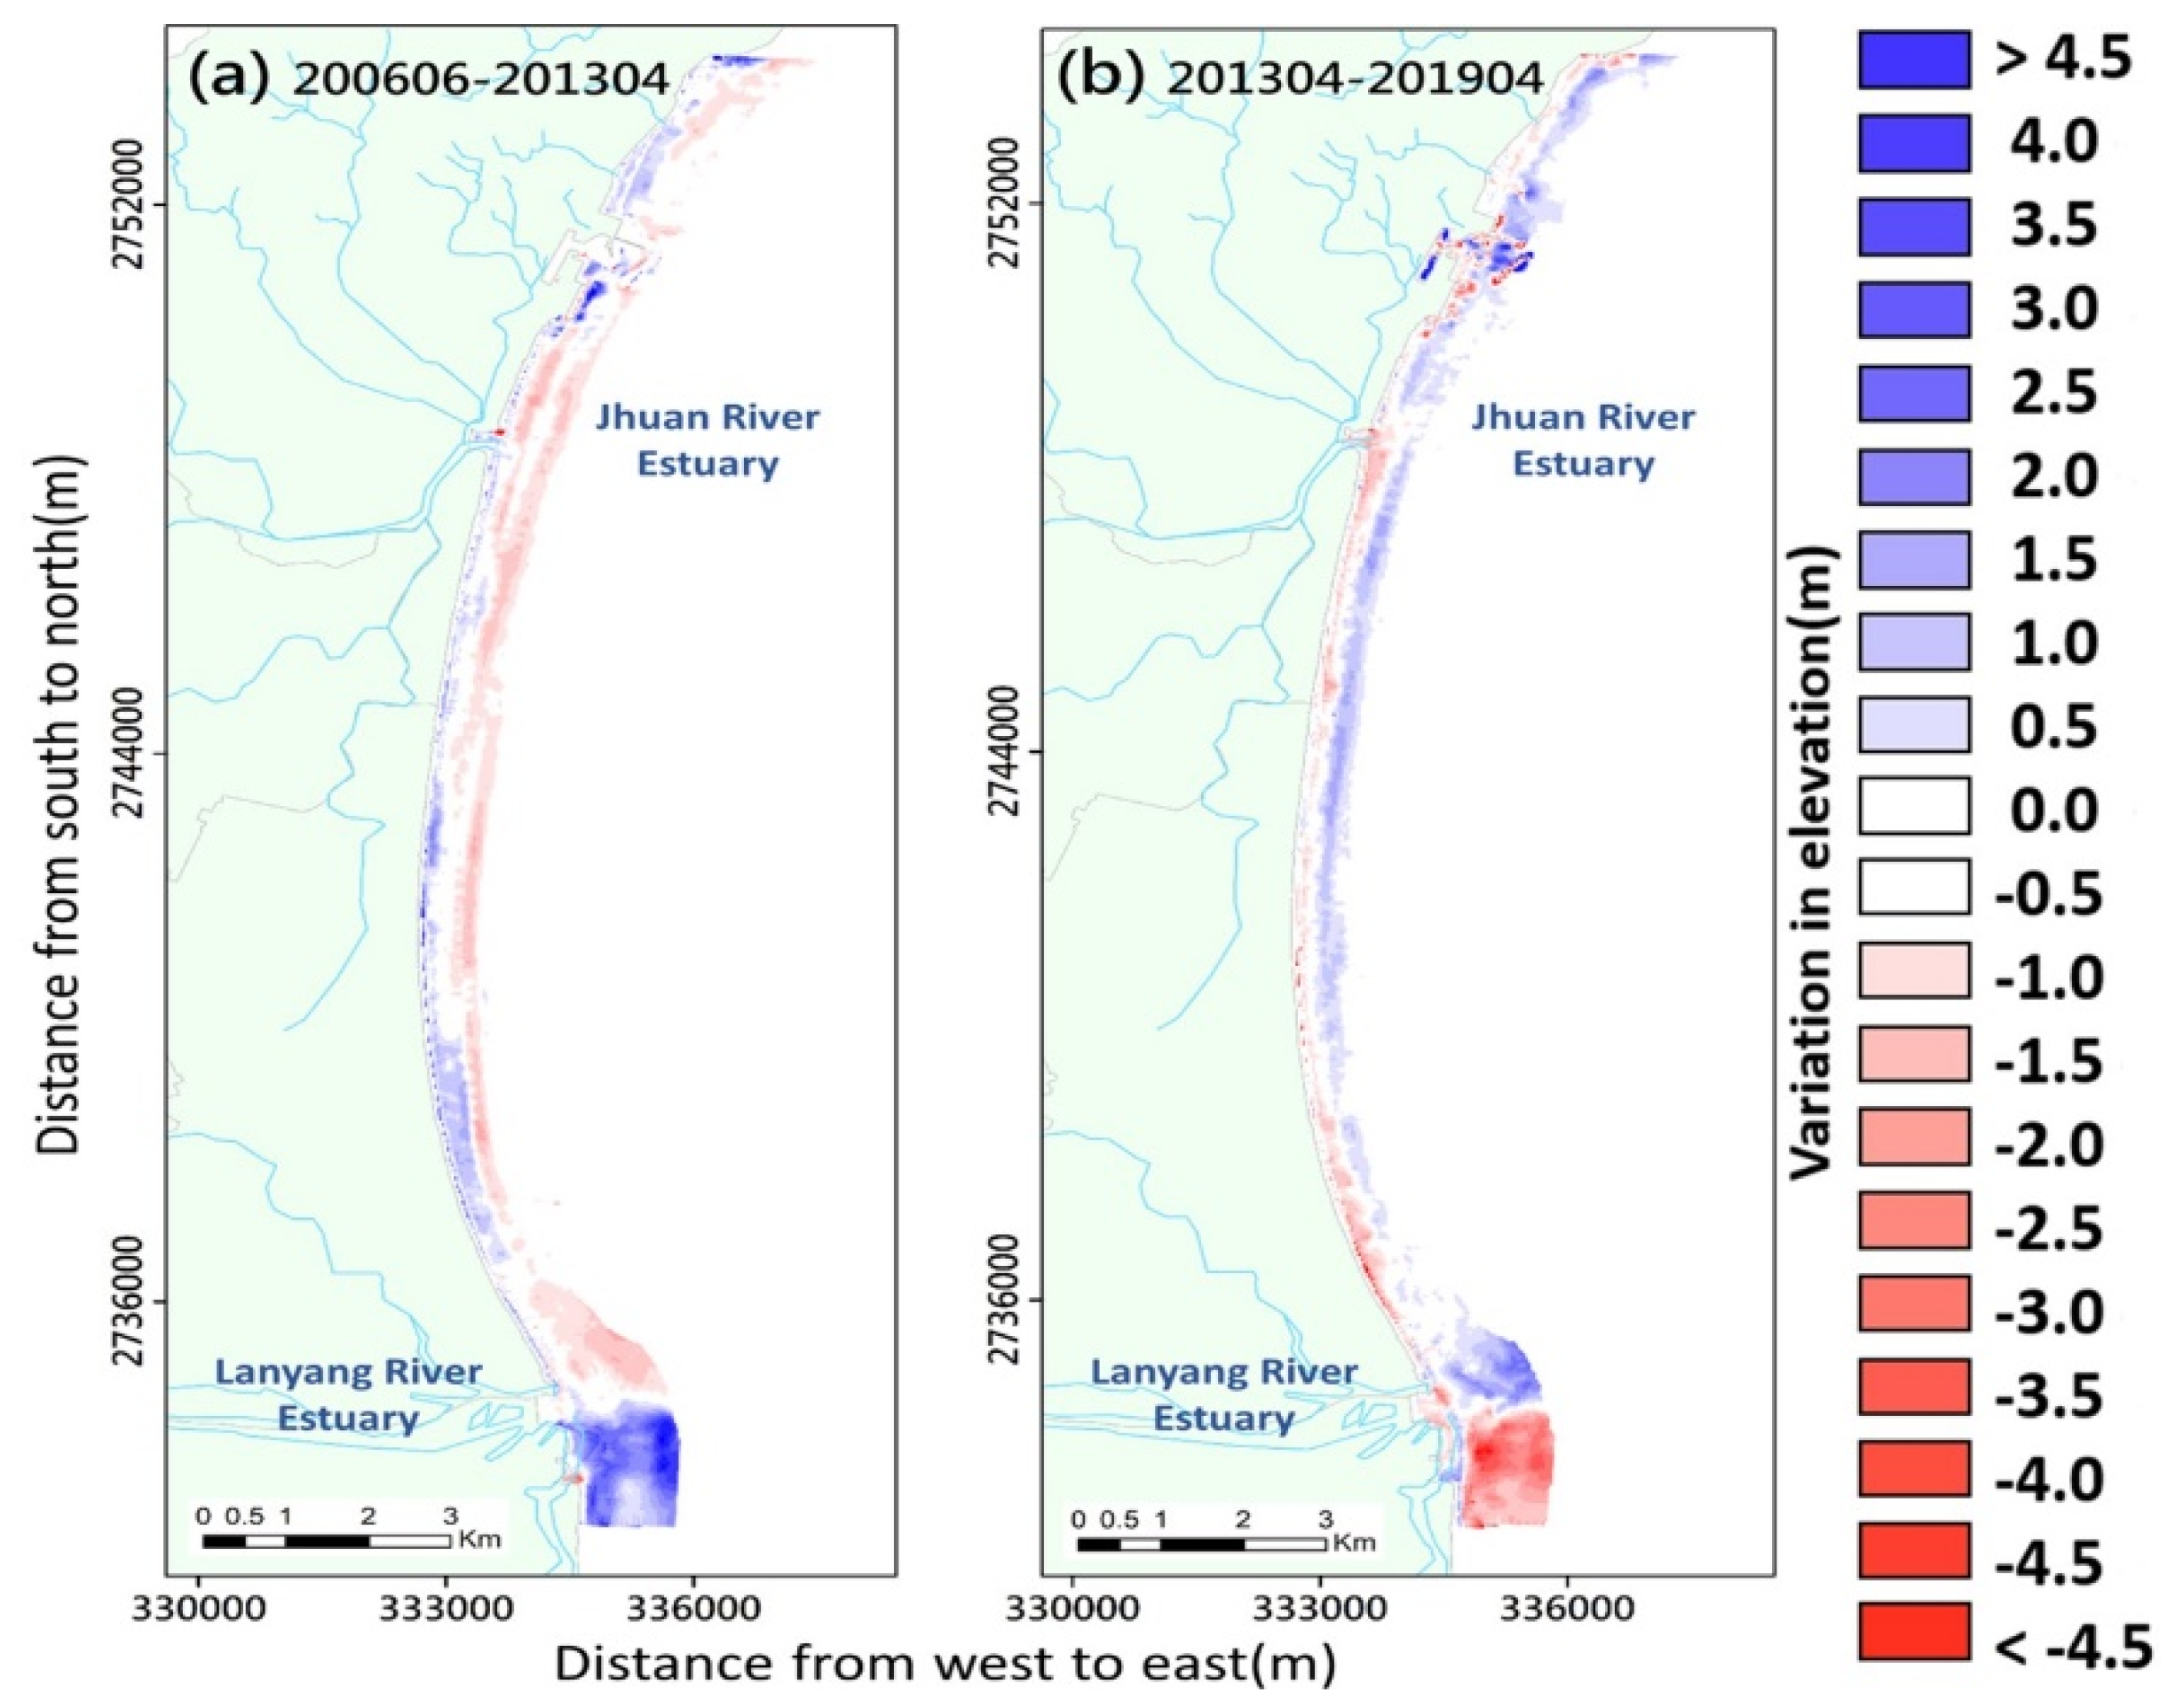
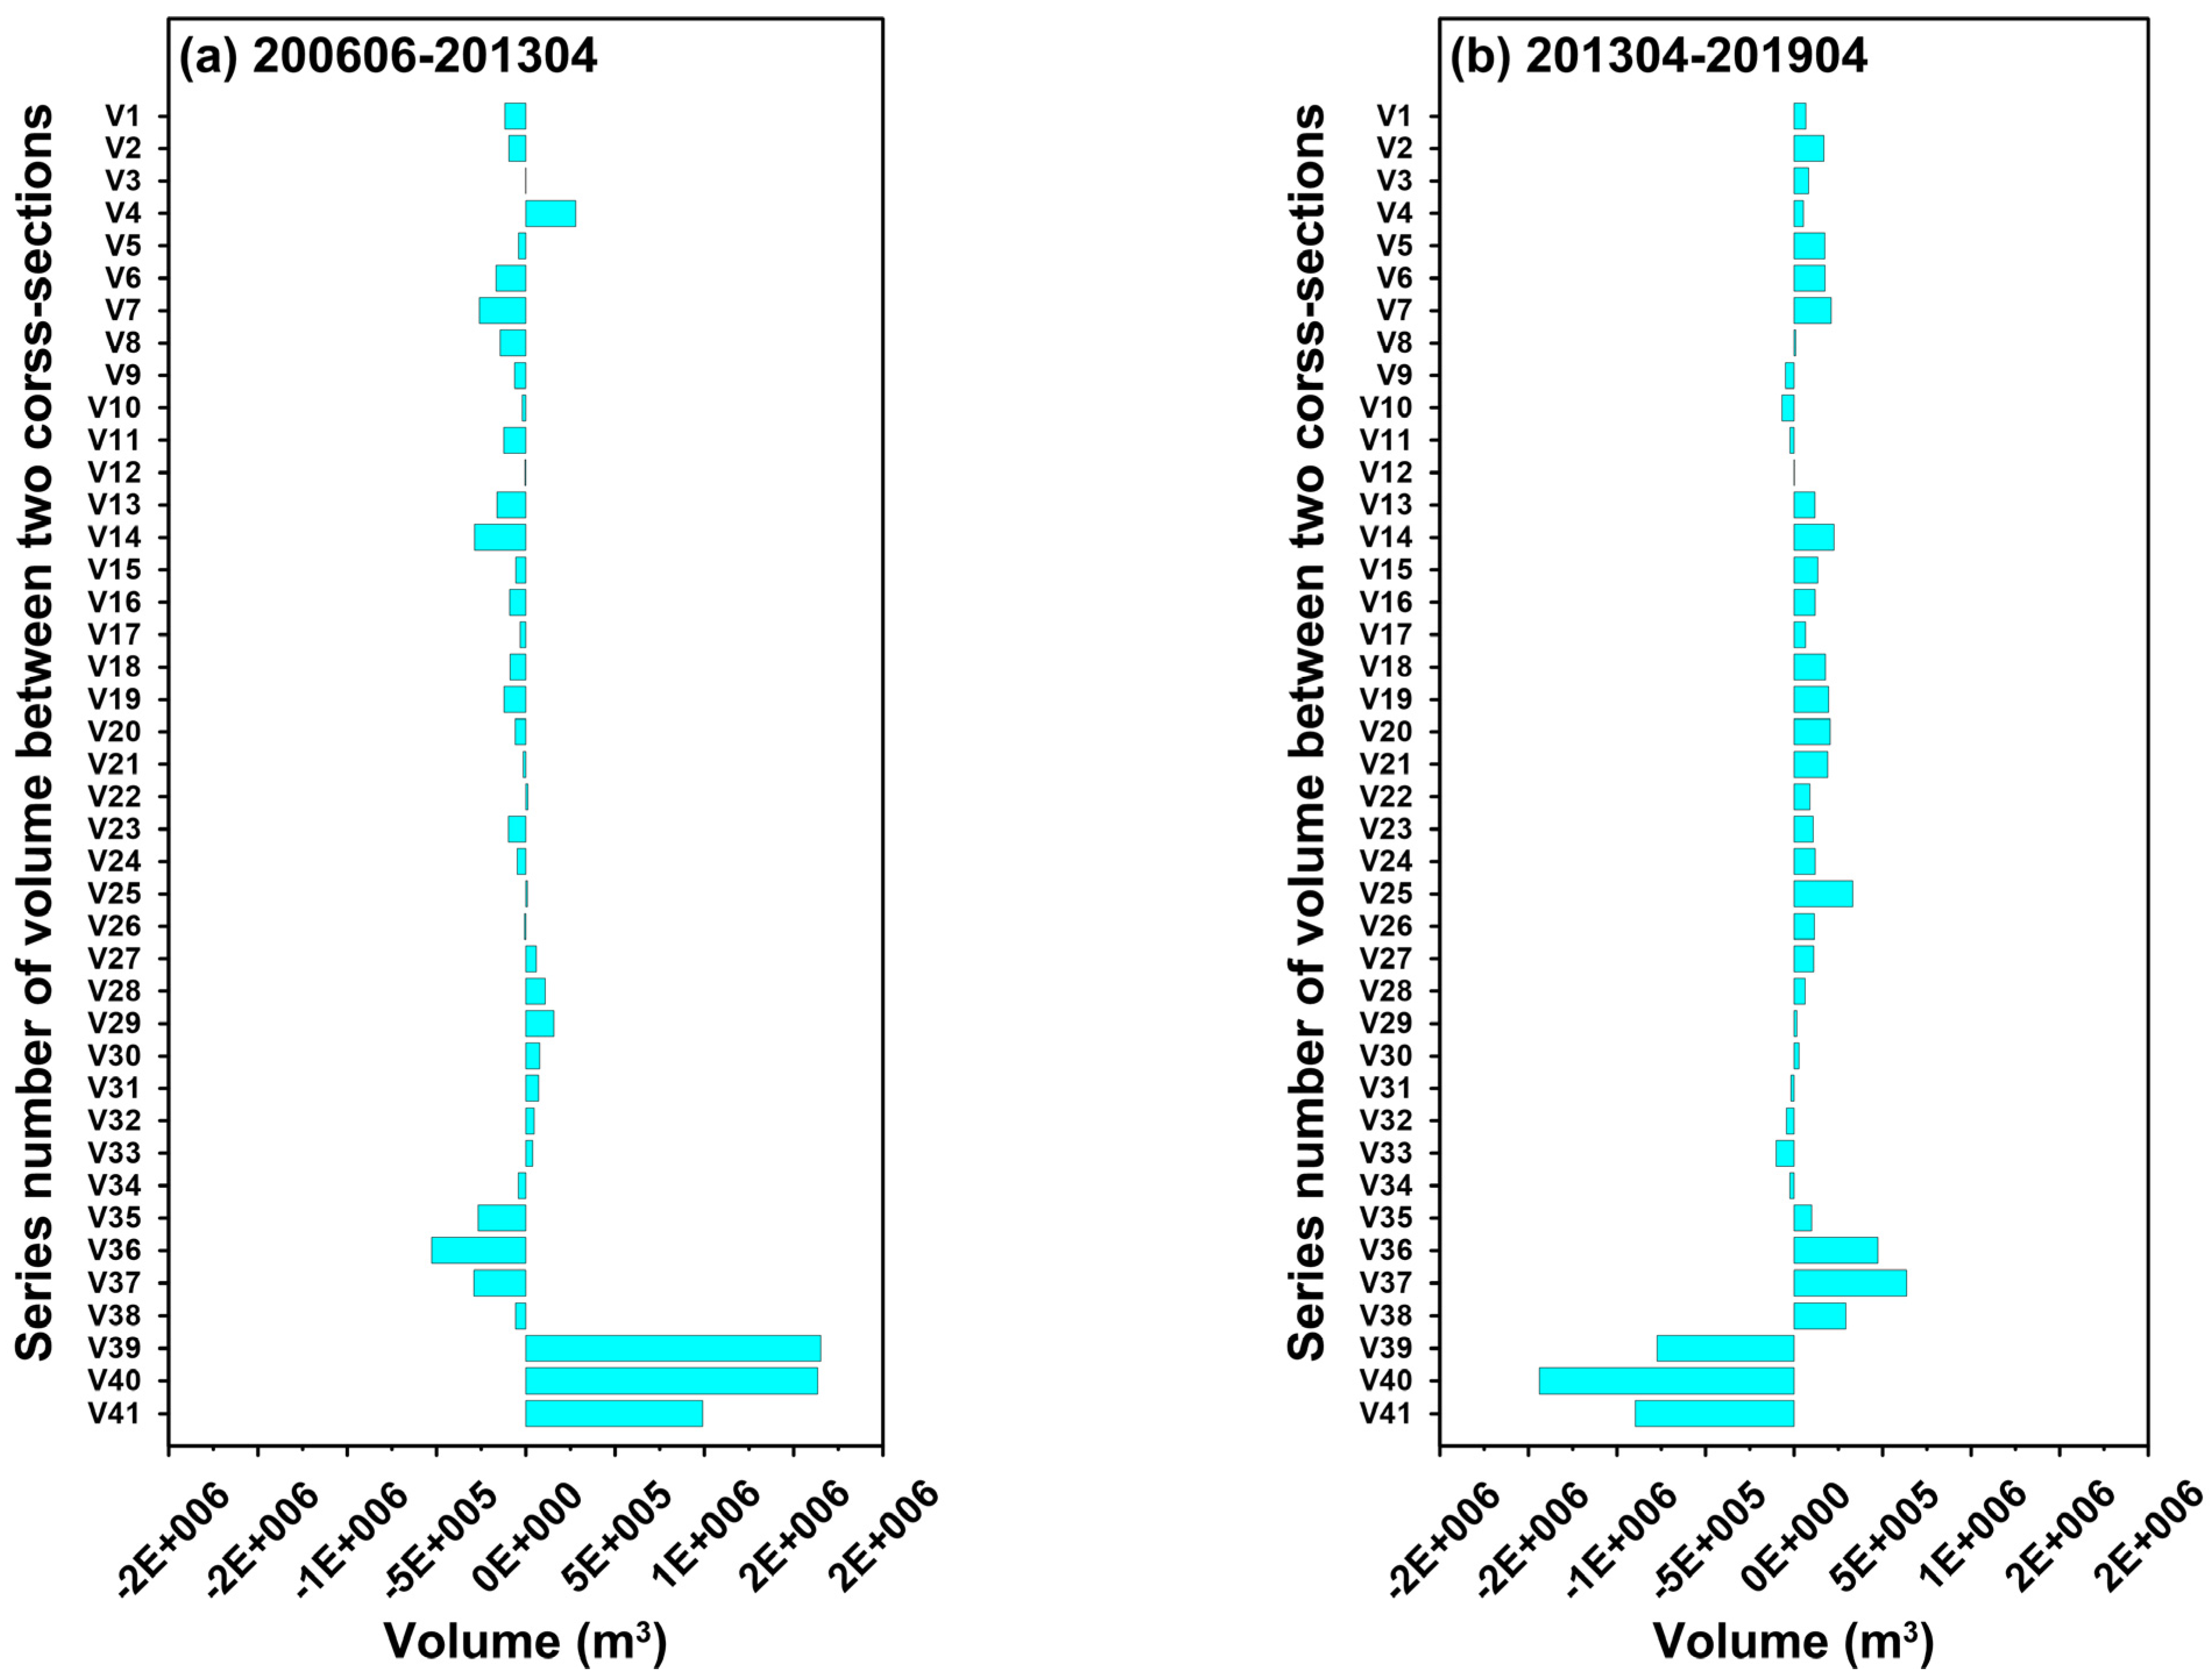
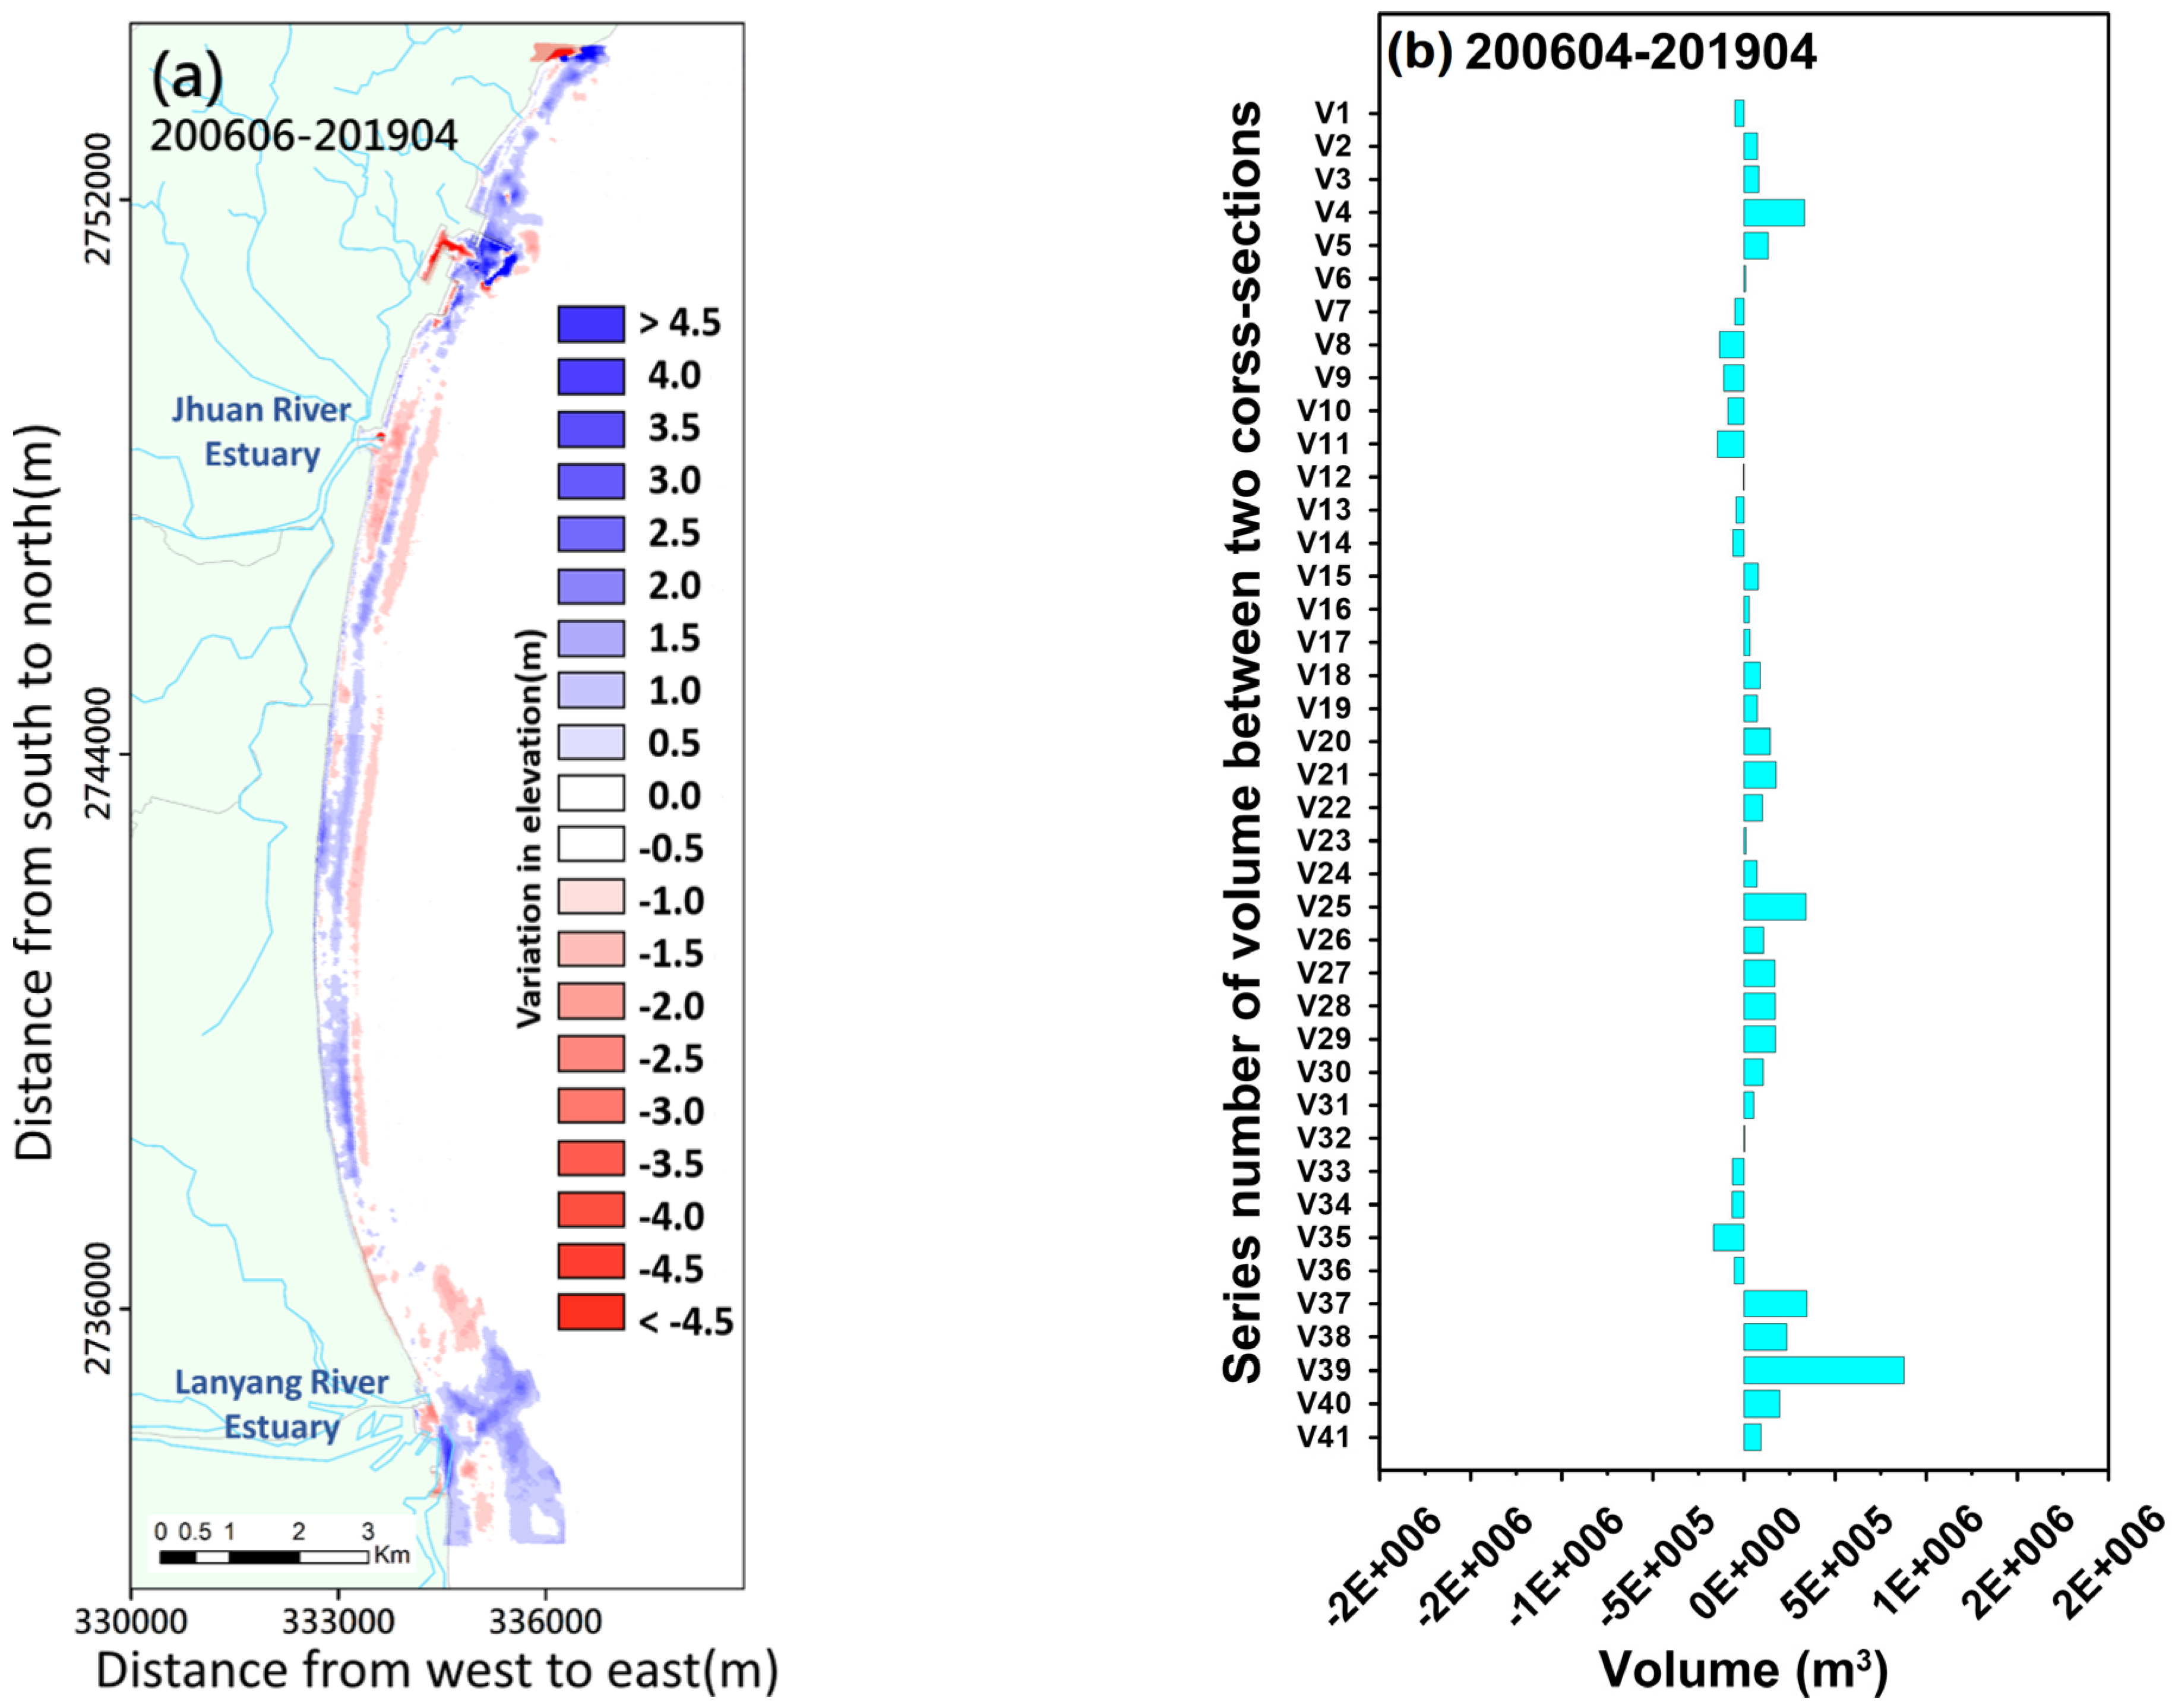
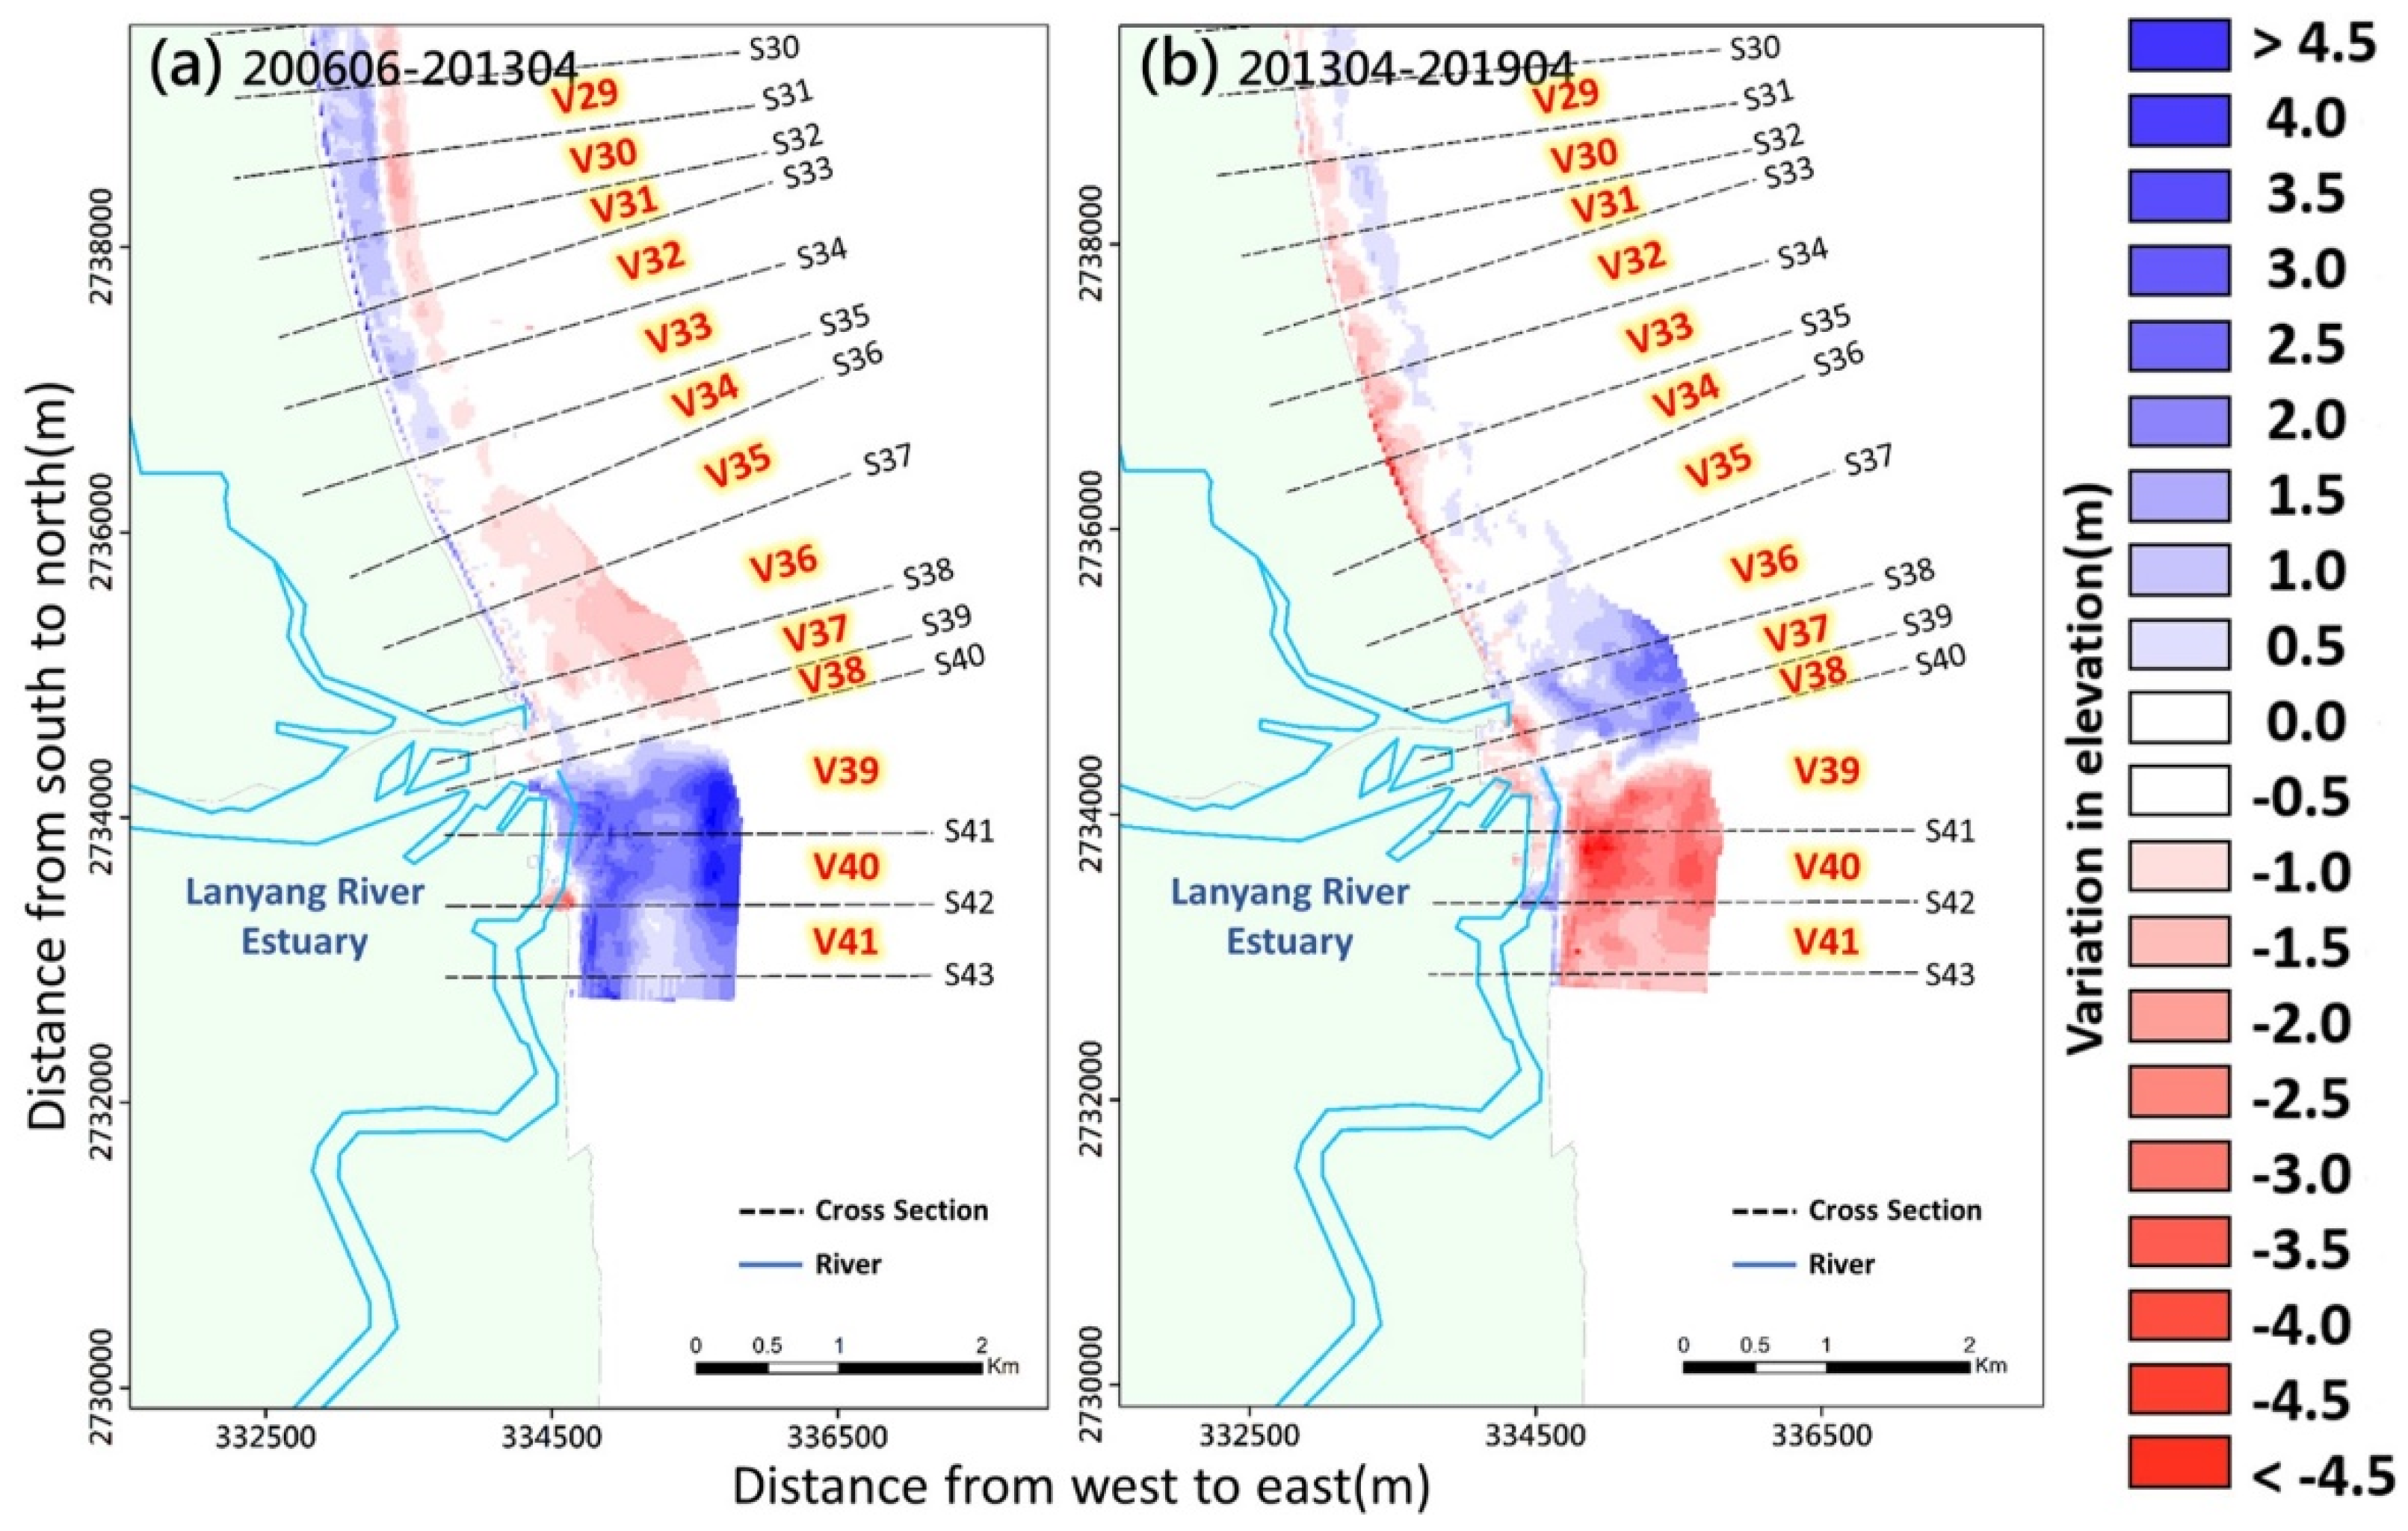
3.1. Interannual Variability of Erosion and Accretion along the Surveyed Shoreline
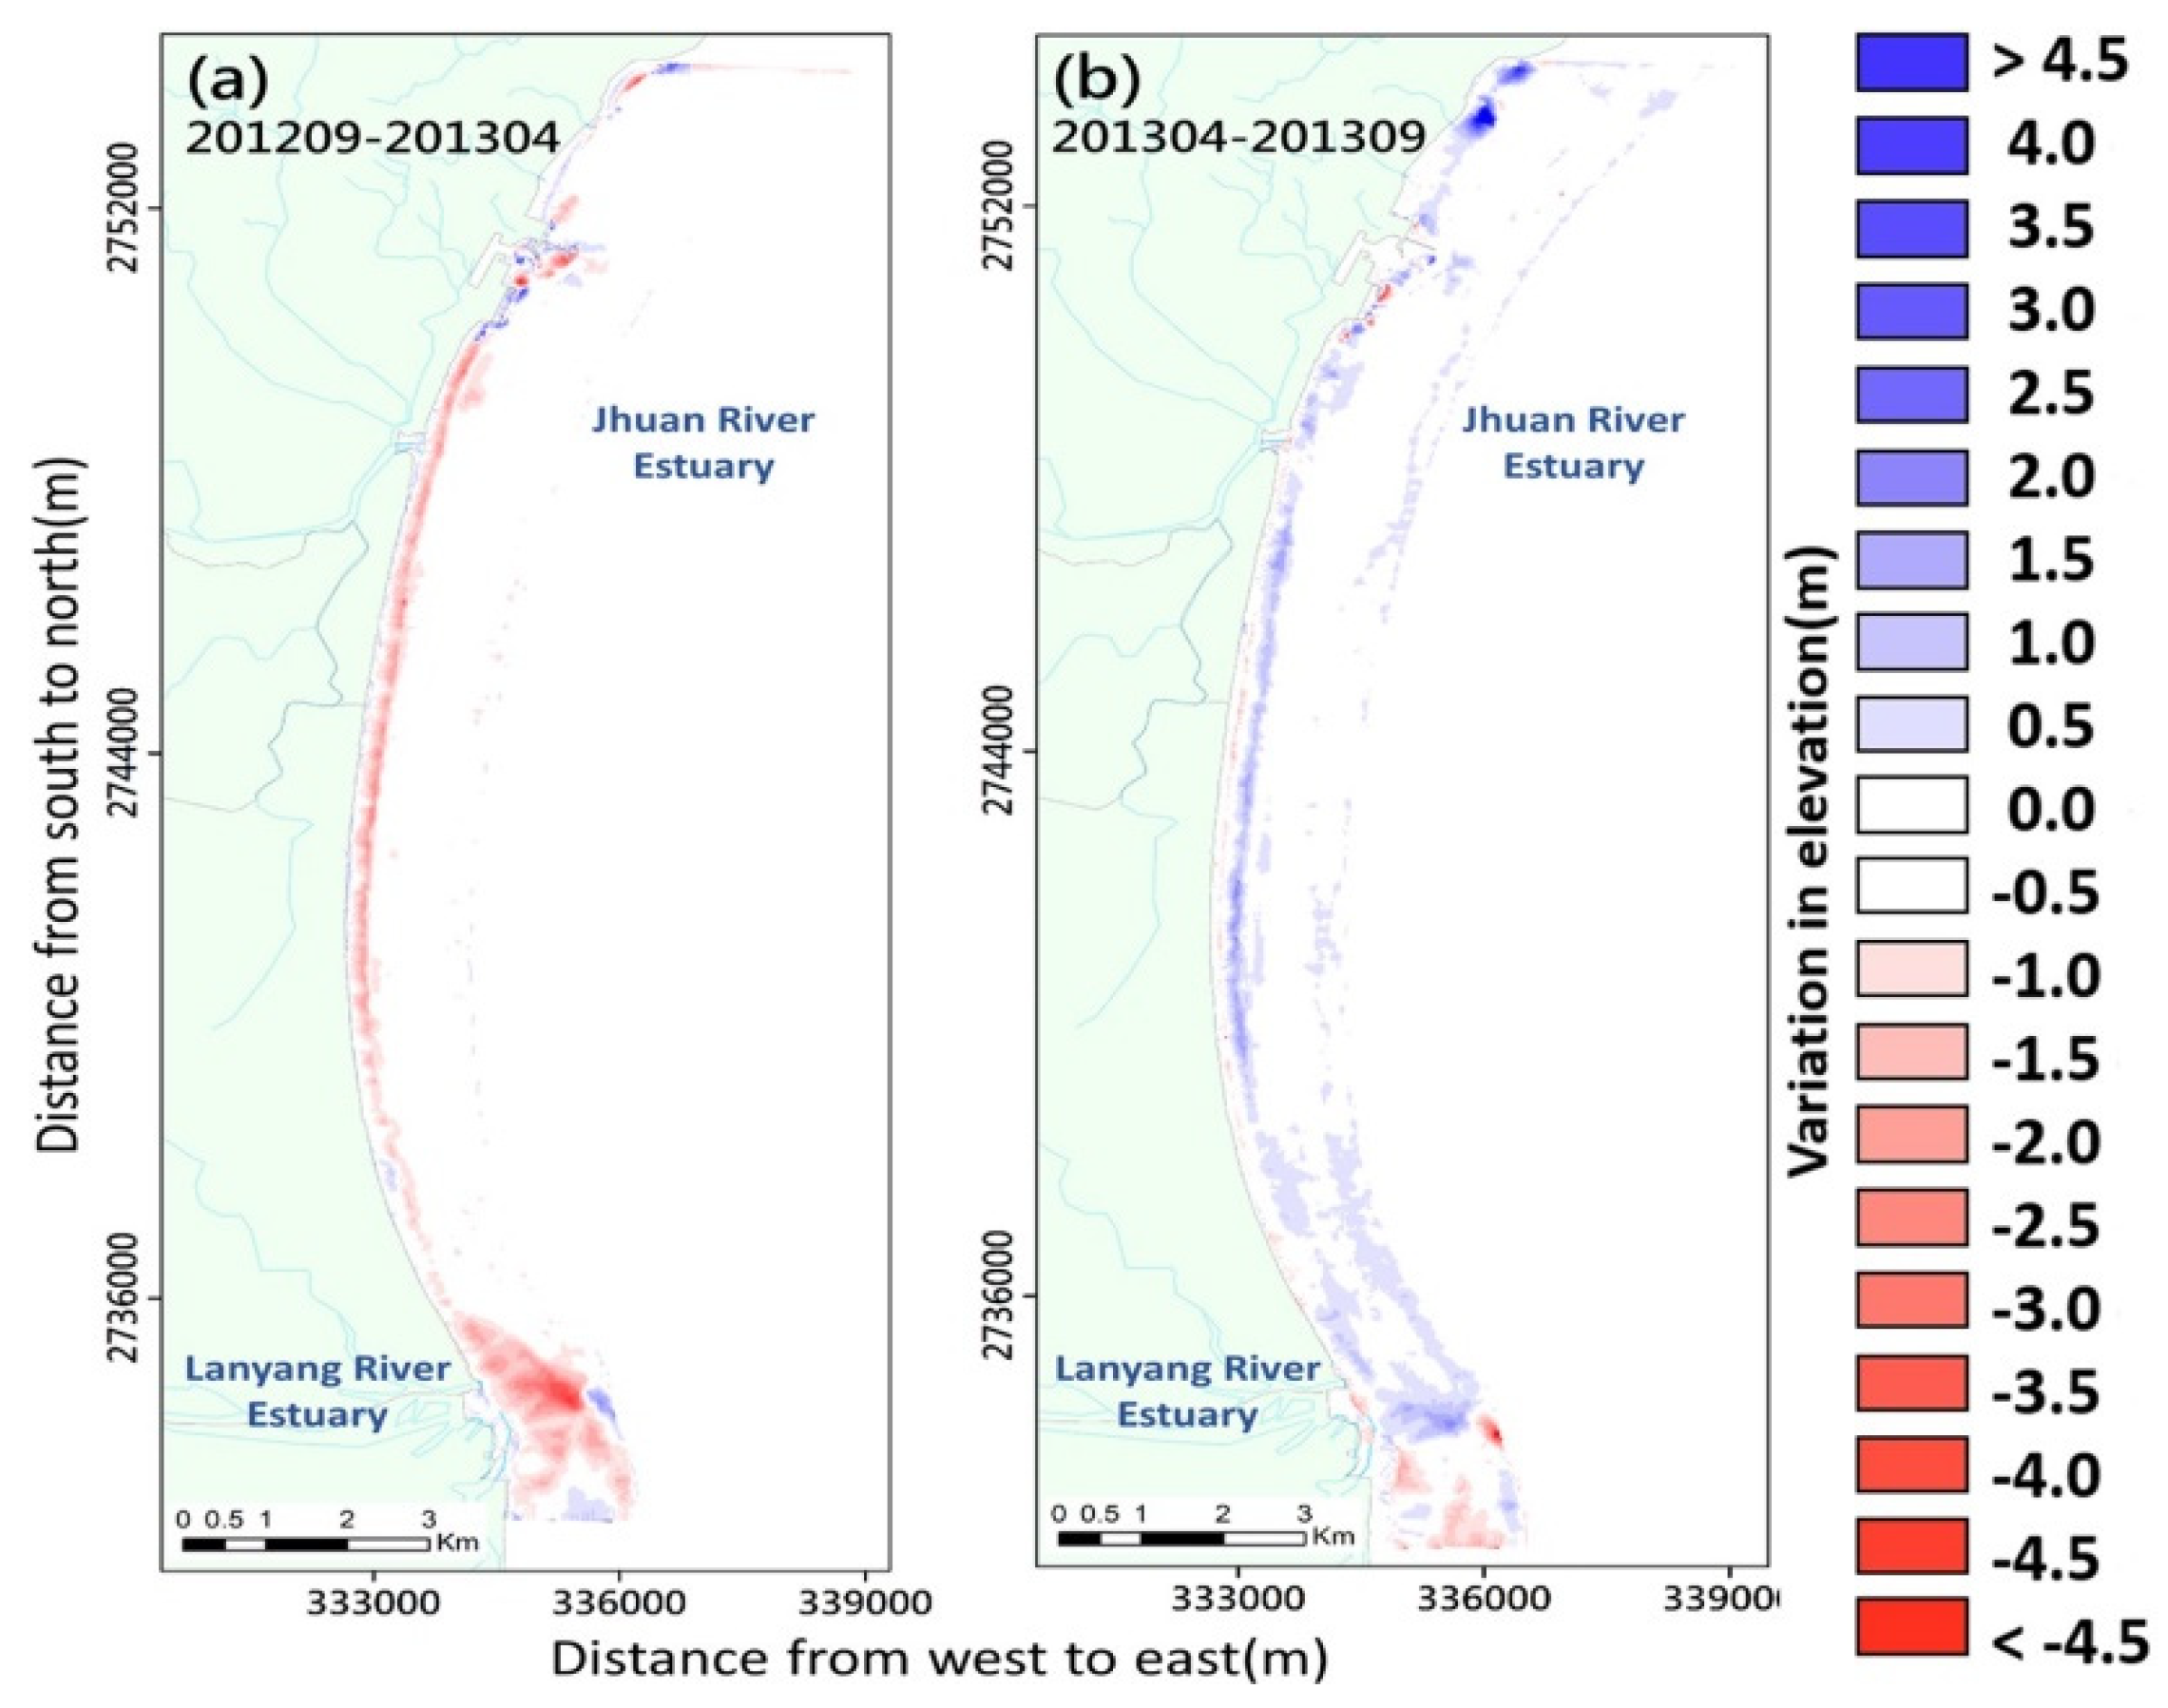
3.2. Seasonal Variability in Erosion and Accretion along the Surveyed Shoreline
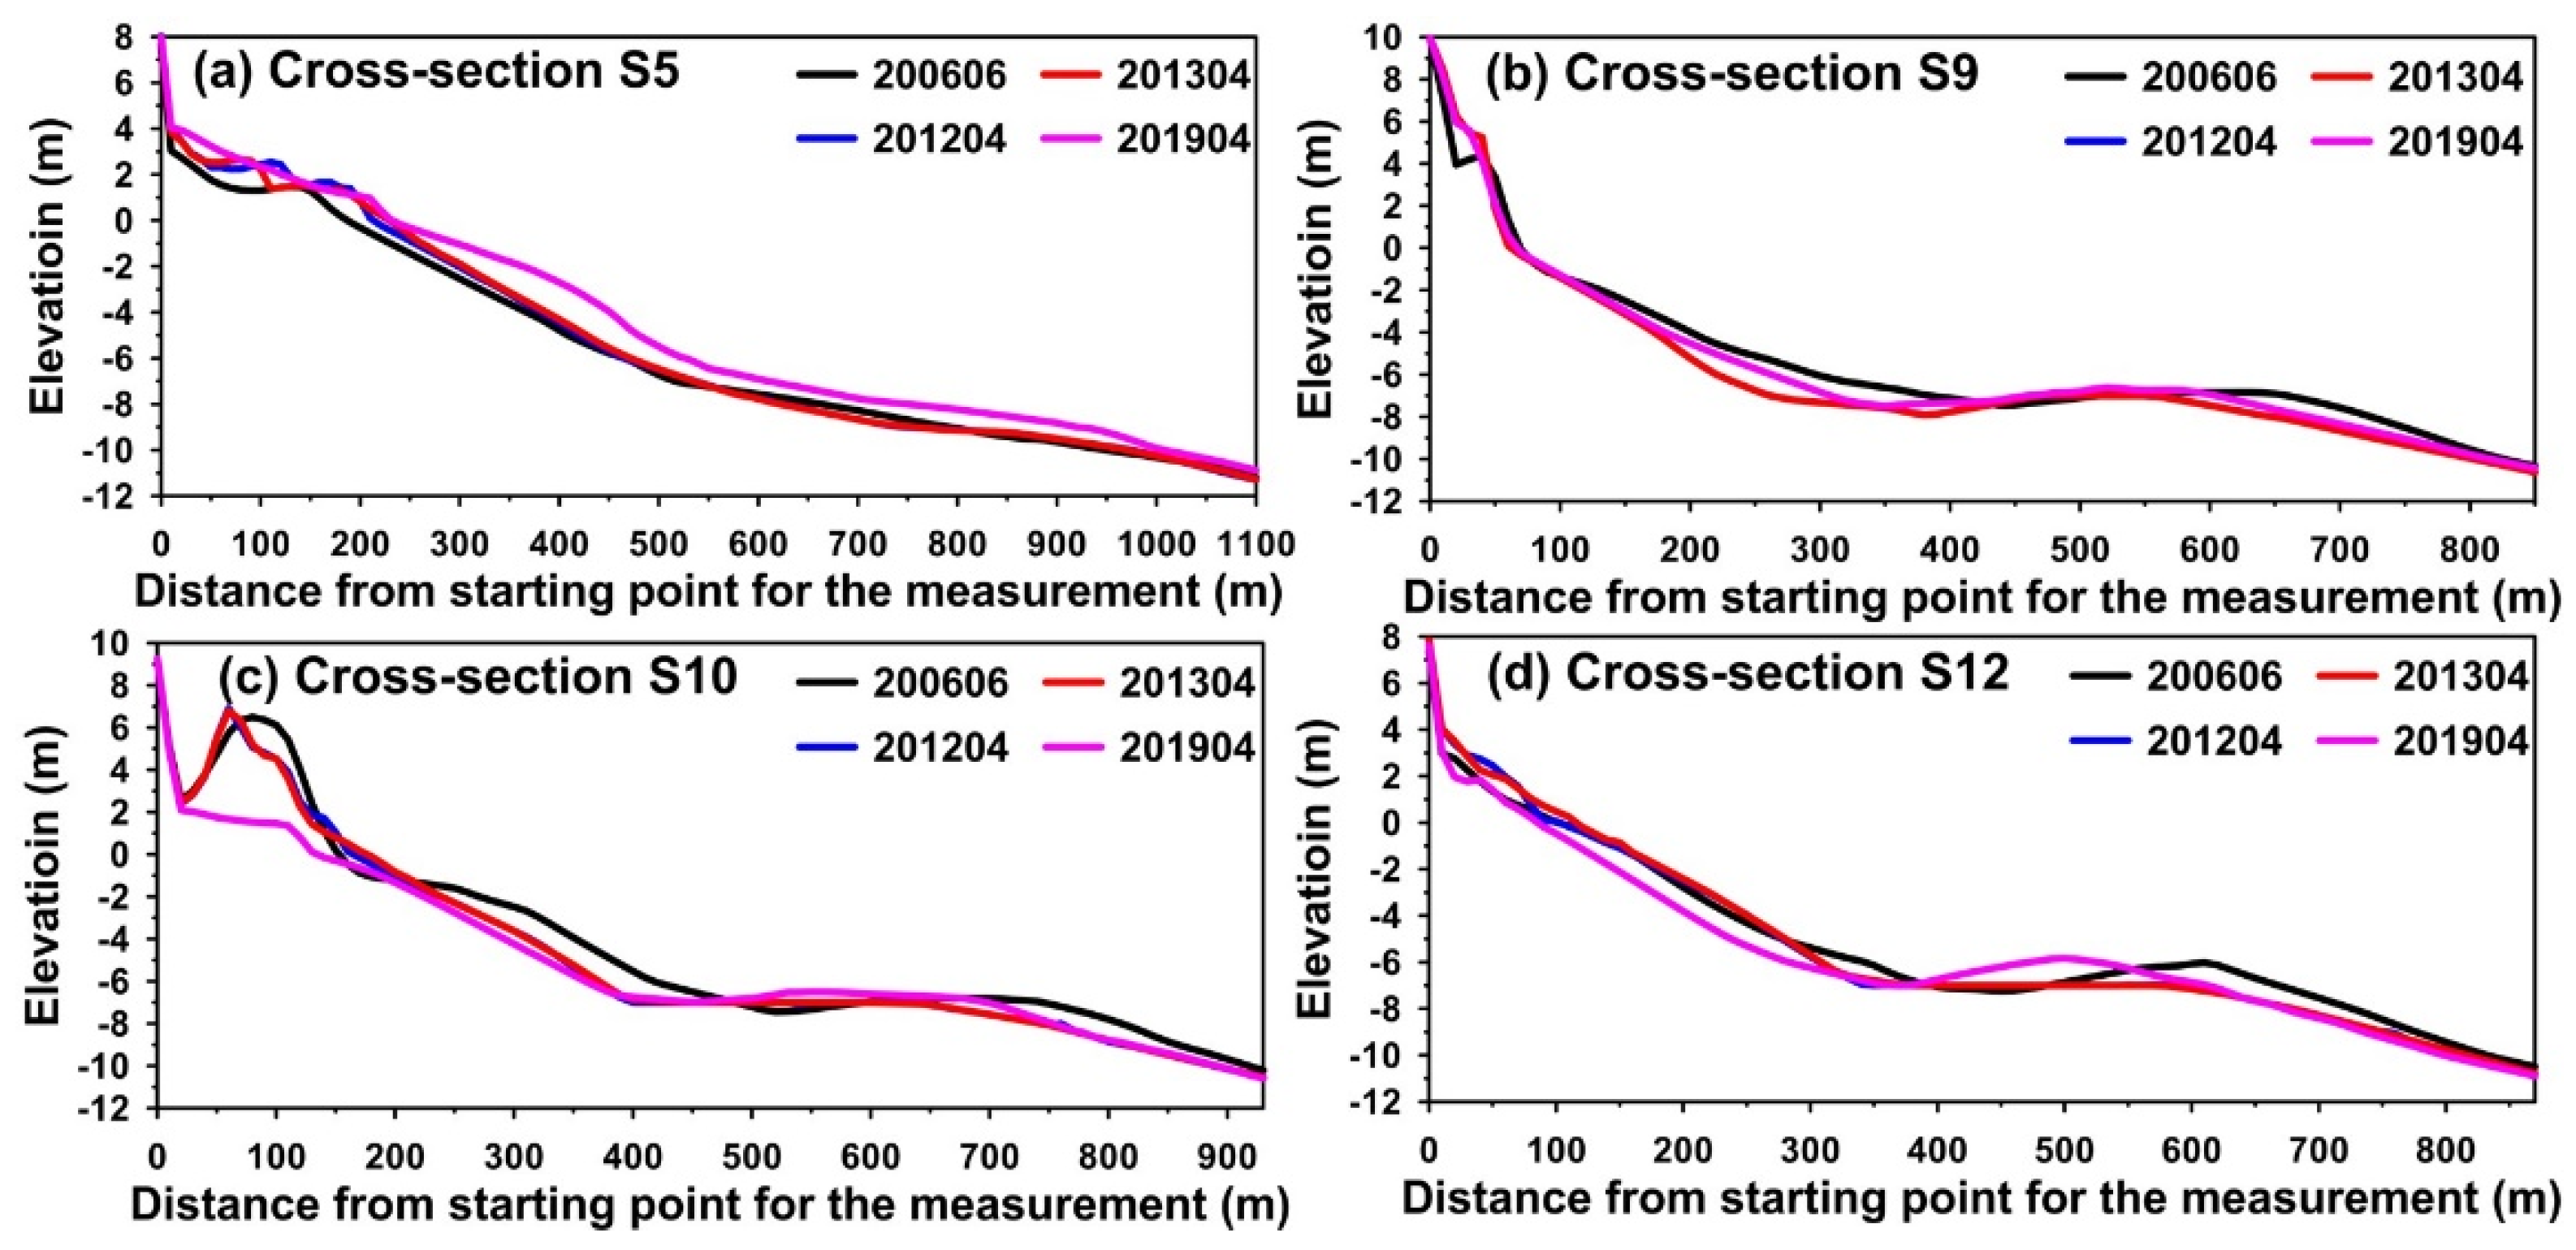
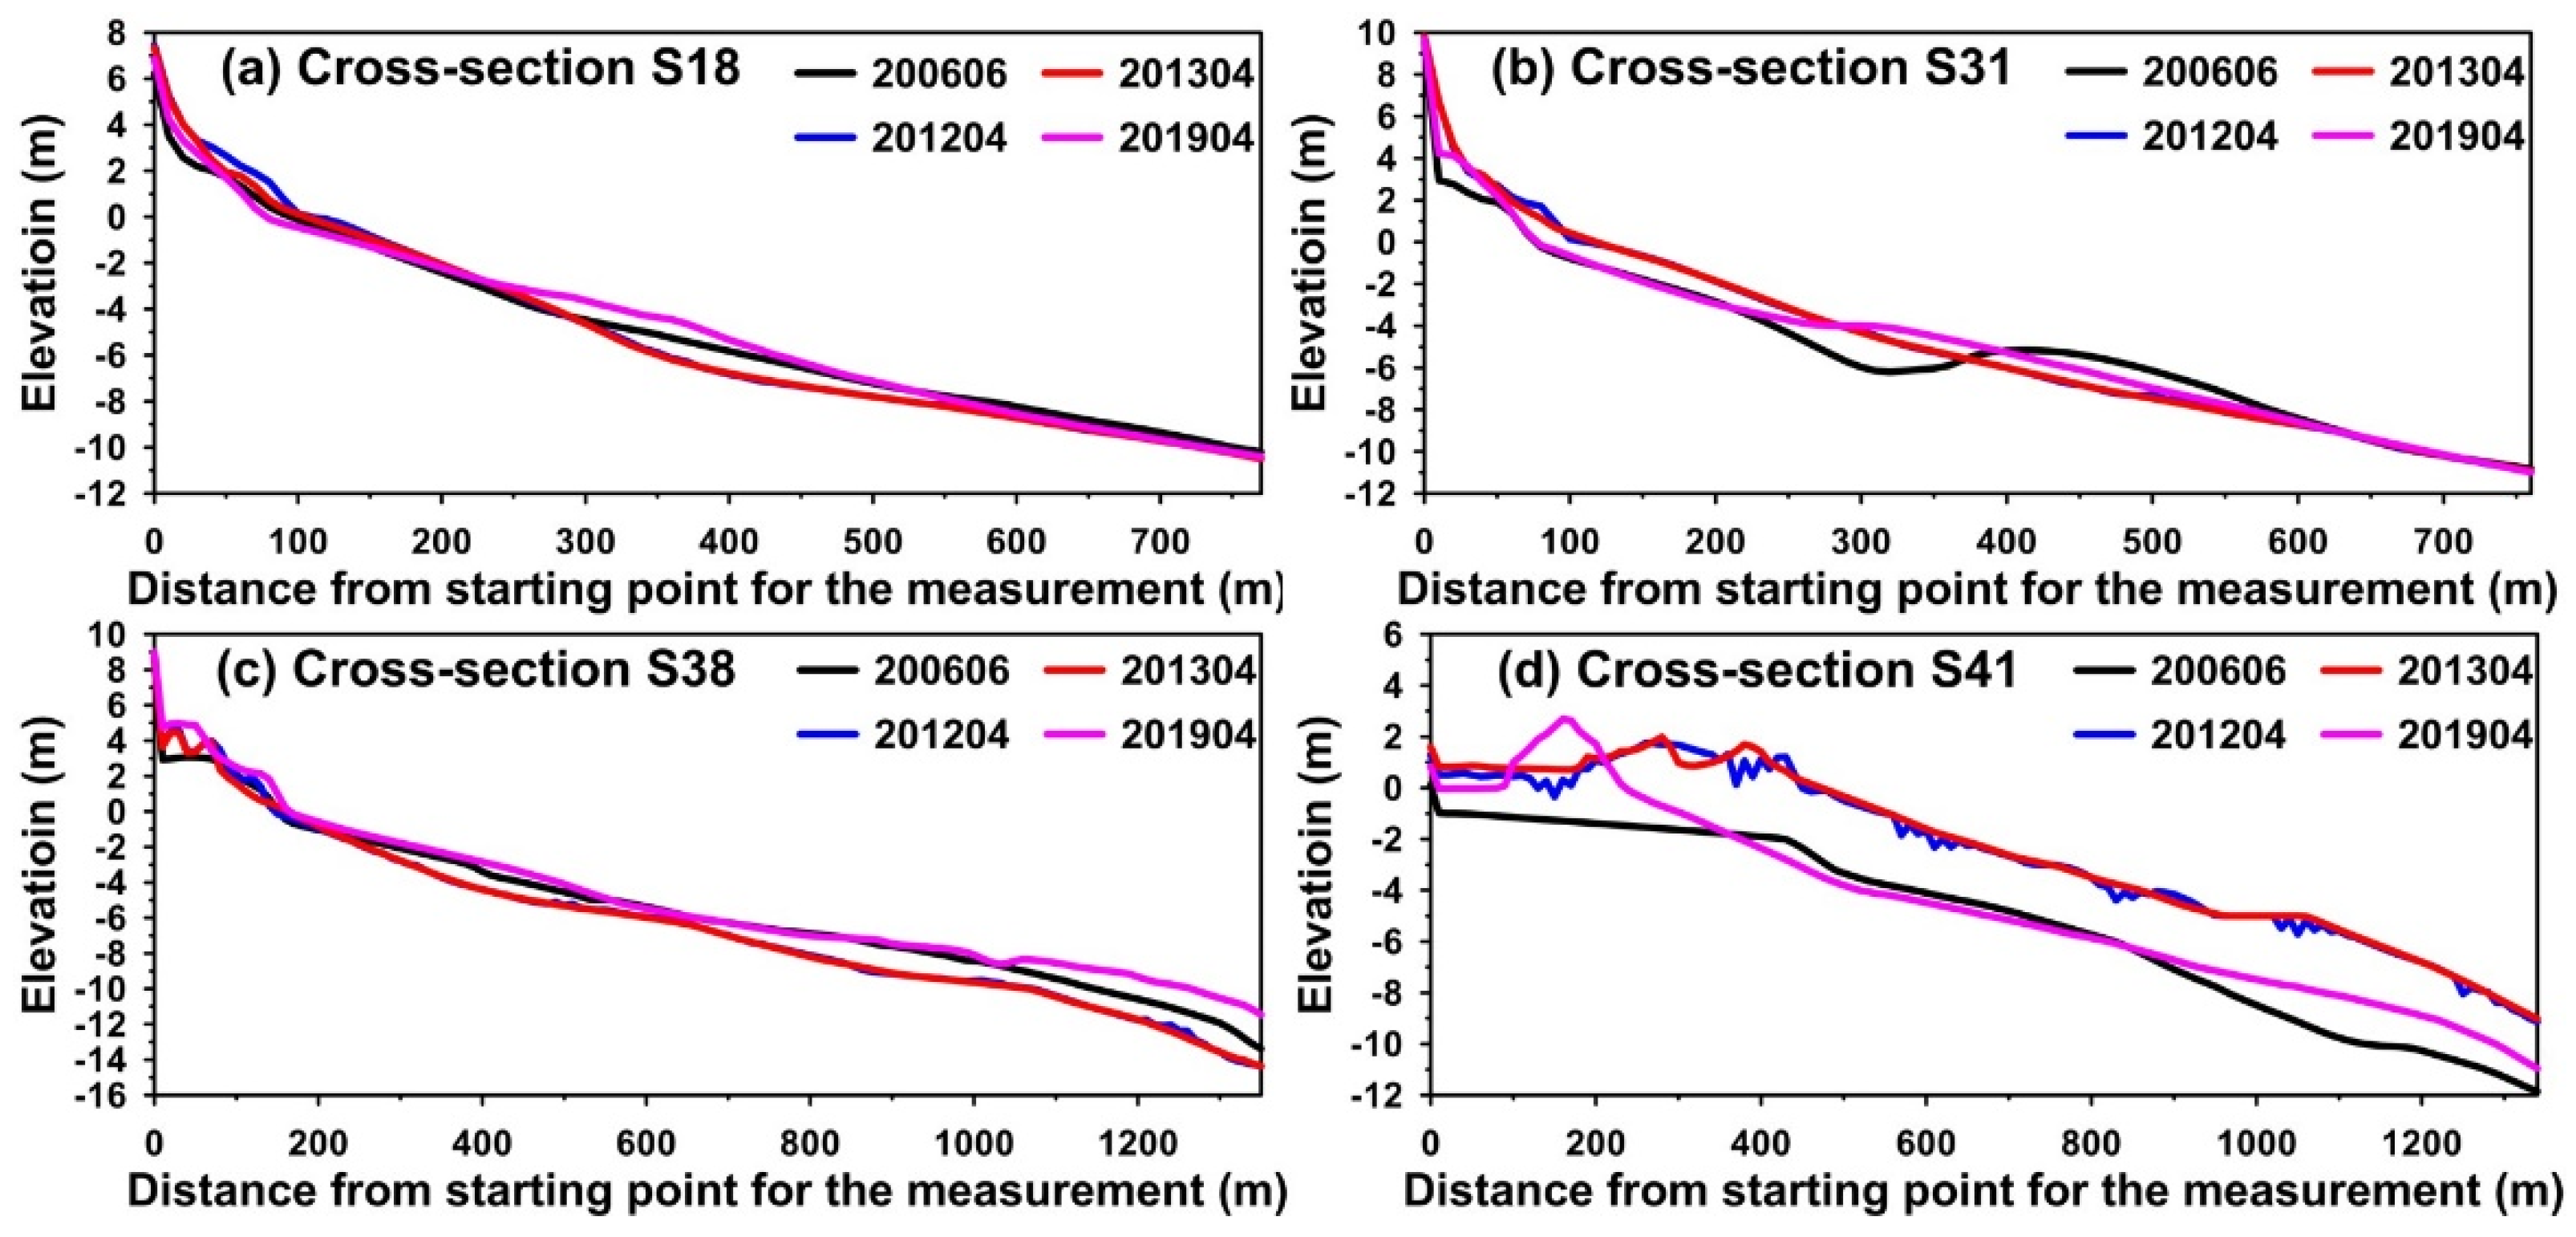
3.3. Analysis of Cross-Shore Profile Evolution
4. Discussion
5. Summary and Conclusions
Author Contributions
Funding
Institutional Review Board Statement
Informed Consent Statement
Data Availability Statement
Acknowledgments
Conflicts of Interest
References
- Rueda, A.; Vitousek, S.; Camus, P.; Tomás, A.; Espejo, A.; Losada, I.J.; Barnard, P.L.; Erikson, L.H.; Ruggiero, P.; Reguero, B.G.; et al. A global classification of coastal flood hazard climates associated with large-scale oceanographic forcing. Sci. Rep. 2017, 7, 5038. [Google Scholar] [CrossRef] [PubMed]
- Mentaschi, L.; Vousdoukas, M.I.; Pekel, J.-F.; Voukouvalas, E.; Feyen, L. Global long-term observations of coastal erosion and accretion. Sci. Rep. 2018, 8, 12876. [Google Scholar] [CrossRef] [PubMed] [Green Version]
- Pang, J.Z.; Si, S.H. Evolution of the Yellow River mouth: I. Historical shifts. Oceanol. Limnol. Sin. 1979, 10, 136–141. [Google Scholar]
- Pang, J.Z.; Jiang, M.X.; Li, F.L. Changes and development trend of runoff, sediment discharge and coastline of the Yellow River Estuary. Trans. Oceanol. Limnol. 2000, 4, 3–6. [Google Scholar]
- Wright, L.D.; Wiseman, W.J.; Bornhold, B.D.; Prior, D.B.; Suhayda, J.N.; Keller, G.H.; Yang, Z.S.; Fan, Y.B. Marine dispersal and deposition of Yellow River silts by gravity-driven underflows. Nature 1988, 332, 629–632. [Google Scholar] [CrossRef]
- Blodget, H.W.; Taylor, P.T.; Roark, J.H. Shoreline changes along the Rosetta-Nile Promontory monitoring with satellite observations. Mar. Geol. 1991, 99, 67–77. [Google Scholar] [CrossRef]
- Frihy, O.E.; Komar, P.D. Long-term shoreline changes and the concentration of heavy minerals in beach sands of the Nile Delta, Egypt. Mar. Geol. 1993, 115, 253–261. [Google Scholar] [CrossRef]
- Huang, H.J.; Li, C.Z.; Guo, J.J. Application of Landsat images to the studies of the shoreline changes of the Huanghe River Delta. Mar. Geol. Quat. Geol. 1994, 14, 29–37. [Google Scholar]
- Huang, H.J.; Wang, Z.Y.; Zhang, R.S. The error analysis of the methods of monitoring the beach changes using digital photogrammetry, satellite images and GIS. Mar. Sci. 2002, 26, 8–10. [Google Scholar]
- Ji, Z.W.; Hu, C.H.; Zeng, Q.H. Analysis of recent evolution of the Yellow River Estuary by Landsat images. J. Sediment. Res. 1994, 3, 12–22. [Google Scholar]
- Xue, C.T. Historical changes in the Yellow River Delta, China. Mar. Geol. 1993, 113, 321–329. [Google Scholar] [CrossRef]
- Xue, C.T. Division and recognition of modern Yellow River Delta lobes. Geogr. Res. 1994, 13, 59–66. [Google Scholar]
- Sun, X.G.; Yang, Z.S. Prediction of modern Huanghe River Delta area increment by using the sediment discharge. Oceannol. Limnol. Sin. 1995, 26, 76–82. [Google Scholar]
- Li, G.X.; Wei, H.L.; Han, Y.S.; Cheng, Y.J. Sedimentation in the Yellow River Delta: Part I. Flow and suspended sediment structure in the upper distributary and the estuary. Mar. Geol. 1998, 149, 93–111. [Google Scholar] [CrossRef]
- Li, F.L.; Pang, J.Z.; Jiang, M.X. Shoreline changes of the Yellow River Delta and its environmental geology effect. Mar. Geol. Quat. Geol. 2000, 20, 17–21. (In Chinese) [Google Scholar]
- White, K.; Asmar, H.M. Monitoring changing position of coastlines using Thematic Mapper imagery, an example from the Nile Delta. Geomorphology 1999, 29, 93–105. [Google Scholar] [CrossRef]
- Dias, J.M.A.; Boski, T.; Rodrigues, A.; Magalhaes, F. Coastline evolution in Portugal since the Last Glacial Maximum until present—A synthesis. Mar. Geol. 2000, 170, 177–186. [Google Scholar] [CrossRef]
- Xu, J.X. A study of thresholds of runoff and sediment for the land accretion of the Yellow River Delta. Geogr. Res. 2002, 21, 163–170. [Google Scholar]
- Yu, L.S. The Huanghe (Yellow) River: A review of its development, characteristics, and future management issues. Cont. Shelf Res. 2002, 22, 389–403. [Google Scholar] [CrossRef]
- Chang, J.; Liu, G.H.; Liu, Q.S. Analysis on spatio-temporal feature of coastline change in the Yellow River Estuary and its relation with runoff and sand-transportation. Geogr. Res. 2004, 23, 339–346. [Google Scholar]
- Syvitski, J.P.M.; Vorosmarty, C.J.; Kettner, A.J.; Green, P. Impact of humans on the flux of terrestrial sediment to the global coastal ocean. Science 2005, 308, 376–380. [Google Scholar] [CrossRef] [PubMed]
- Murray, N.J.; Phinn, S.R.; DeWitt, M.; Ferrari, R.; Johnston, R.; Lyons, M.B.; Clinton, N.; Thau, D.; Fuller, R.A. The global distribution and trajectory of tidal flats. Nature 2019, 565, 222–225. [Google Scholar] [CrossRef] [PubMed]
- Chen, W.-B.; Liu, W.-C.; Hsu, M.-H.; Hwang, C.-C. Modelling investigation of suspended sediment transport in a tidal estuary using a three-dimensional model. Appl. Math. Model. 2015, 39, 2570–2586. [Google Scholar] [CrossRef]
- Nienhuis, J.H.; Ashton, A.D.; Edmonds, D.A.; Hoitink, A.J.F.; Kettner, A.J.; Rowland, J.C.; Törnqvist, T.E. Global-scale human impact on delta morphology has led to net land area gain. Nature 2020, 577, 514–518. [Google Scholar] [CrossRef]
- Dunn, F.; Darby, S.; Nicholls, R.; Cohen, S.; Zarfl, C.; Fekete, B. Projections of declining fluvial sediment delivery to major deltas worldwide in response to climate change and anthropogenic stress. Environ. Res. Lett. 2019, 14, 1–11. [Google Scholar] [CrossRef]
- Warrick, J.A.; Stevens, A.W.; Miller, I.M.; Harrison, S.R.; Ritchie, A.C.; Gelfenbaum, G. World’s largest dam removal reverses coastal erosion. Sci. Rep. 2019, 9, 13968. [Google Scholar] [CrossRef] [PubMed] [Green Version]
- Hapke, C.J.; Kratzmann, M.G.; Himmelstoss, E.A. Geomorphic and human influence on large-scale coastal change. Geomorphology 2013, 199, 160–170. [Google Scholar] [CrossRef]
- Angamuthu, B.; Darby, S.E.; Nicholls, R.J. Impacts of natural and human drivers on the multi-decadal morphological evolution of tidally-influenced deltas. Proc. R. Soc. A 2018, 474, 20180396. [Google Scholar] [CrossRef] [PubMed] [Green Version]
- Hurst, M.D.; Rood, D.H.; Ellis, M.A.; Anderson, R.S.; Dornbusch, U. Recent acceleration in coastal cliff retreat rates on the south coast of Great Britain. Proc. Natl. Acad. Sci. USA 2016, 113, 13336–13341. [Google Scholar] [CrossRef] [PubMed] [Green Version]
- Dadson, S.; Hovius, N.; Chen, H.; Dade, W.B.; Hsieh, M.-L.; Willett, S.D.; Hu, J.-C.; Horng, M.-J.; Chen, M.-C.; Stark, C.P.; et al. Links between erosion, runoff variability and seismicity in the Taiwan orogen. Nature 2003, 426, 648–651. [Google Scholar] [CrossRef] [PubMed]
- United Nations International Strategy for Disaster Reduction (UNISDR). In Global Survey of Early Warning Systems: An Assessment of Capacities, Gaps and Opportunities towards Building a Comprehensive Global Early Warning System for All Natural Hazards; United Nations International Strategy for Disaster Reduction: Geneva, Switzerland, 2006.
- Leaman, C.K.; Harley, M.D.; Splinter, K.D.; Thran, M.C.; Kinsela, M.A.; Turner, I.L. A storm hazard matrix combining coastal flooding and beach erosion. Coast. Eng. 2021, 170, 104001. [Google Scholar] [CrossRef]
- Romagnoli, C.; Sistilli, F.; Cantelli, L.; Aguzzi, M.; De Nigris, N.; Morelli, M.; Gaeta, M.G.; Archetti, R. Beach Monitoring and Morphological Response in the Presence of Coastal Defense Strategies at Riccione (Italy). J. Mar. Sci. Eng. 2021, 9, 851. [Google Scholar] [CrossRef]
- Shih, H.-J.; Chen, H.; Liang, T.-Y.; Fu, H.-S.; Chang, C.-H.; Chen, W.-B.; Su, W.-R.; Lin, L.-Y. Generating potential risk maps for typhoon-induced waves along the coast of Taiwan. Ocean Eng. 2018, 163, 1–14. [Google Scholar] [CrossRef]
- Chang, C.-H.; Shih, H.-J.; Chen, W.-B.; Su, W.-R.; Lin, L.-Y.; Yu, Y.-C.; Jang, J.-H. Hazard Assessment of Typhoon-Driven Storm Waves in the Nearshore Waters of Taiwan. Water 2018, 10, 926. [Google Scholar] [CrossRef] [Green Version]
- Houston, J.R. Simplified Dean’s method for beach-fill design. J. Waterw. Port Coast. Div. 1996, 122, 143–146. [Google Scholar] [CrossRef]
- Hanson, H.; Kraus, N.C. Long-Term Evolution of a Long-Term Evolution Model. J. Coast. Res. 2011, SI 59, 118–129. [Google Scholar] [CrossRef]
- Frey, A.E.; Connell, K.J.; Hanson, H.; Larson, M.; Thomas, R.C.; Munger, S.; Zundel, A. GenCade Version 1 Model Theory and User’s Guide; Technical Report ERDC/CHL TR-12-25; U.S. Army Engineer Research and Development Center: Vicksburg, MS, USA, 2012. [Google Scholar]
- Medellín, G.; Torres-Freyermuth, A.; Tomasicchio, G.R.; Francone, A.; Tereszkiewicz, P.A.; Lusito, L.; Palemón-Arcos, L.; López, J. Field and Numerical Study of Resistance and Resilience on a Sea Breeze Dominated Beach in Yucatan (Mexico). Water 2018, 10, 1806. [Google Scholar] [CrossRef] [Green Version]
- Puleo, J.A.; Cristaudo, D.; Torres-Freyermuth, A.; Masselink, G.; Shi, F. The role of alongshore flows on inner surf and swash zone hydrodynamics on a dissipative beach. Cont. Shelf Res. 2020, 201, 104134. [Google Scholar] [CrossRef]


Publisher’s Note: MDPI stays neutral with regard to jurisdictional claims in published maps and institutional affiliations. |
© 2022 by the authors. Licensee MDPI, Basel, Switzerland. This article is an open access article distributed under the terms and conditions of the Creative Commons Attribution (CC BY) license (https://creativecommons.org/licenses/by/4.0/).
Share and Cite
Liang, T.-Y.; Chang, C.-H.; Hsiao, S.-C.; Huang, W.-P.; Chang, T.-Y.; Guo, W.-D.; Liu, C.-H.; Ho, J.-Y.; Chen, W.-B. On-Site Investigations of Coastal Erosion and Accretion for the Northeast of Taiwan. J. Mar. Sci. Eng. 2022, 10, 282. https://doi.org/10.3390/jmse10020282
Liang T-Y, Chang C-H, Hsiao S-C, Huang W-P, Chang T-Y, Guo W-D, Liu C-H, Ho J-Y, Chen W-B. On-Site Investigations of Coastal Erosion and Accretion for the Northeast of Taiwan. Journal of Marine Science and Engineering. 2022; 10(2):282. https://doi.org/10.3390/jmse10020282
Chicago/Turabian StyleLiang, Ting-Yu, Chih-Hsin Chang, Shih-Chun Hsiao, Wei-Po Huang, Tzu-Yin Chang, Wen-Dar Guo, Che-Hsin Liu, Jui-Yi Ho, and Wei-Bo Chen. 2022. "On-Site Investigations of Coastal Erosion and Accretion for the Northeast of Taiwan" Journal of Marine Science and Engineering 10, no. 2: 282. https://doi.org/10.3390/jmse10020282