
Phylogeography and Genetic Structure of the Swimming Crabs Portunus sanguinolentus (Herbst, 1783) in East Asia

 ,
,
Abstract
:1. Introduction
2. Materials and Methods
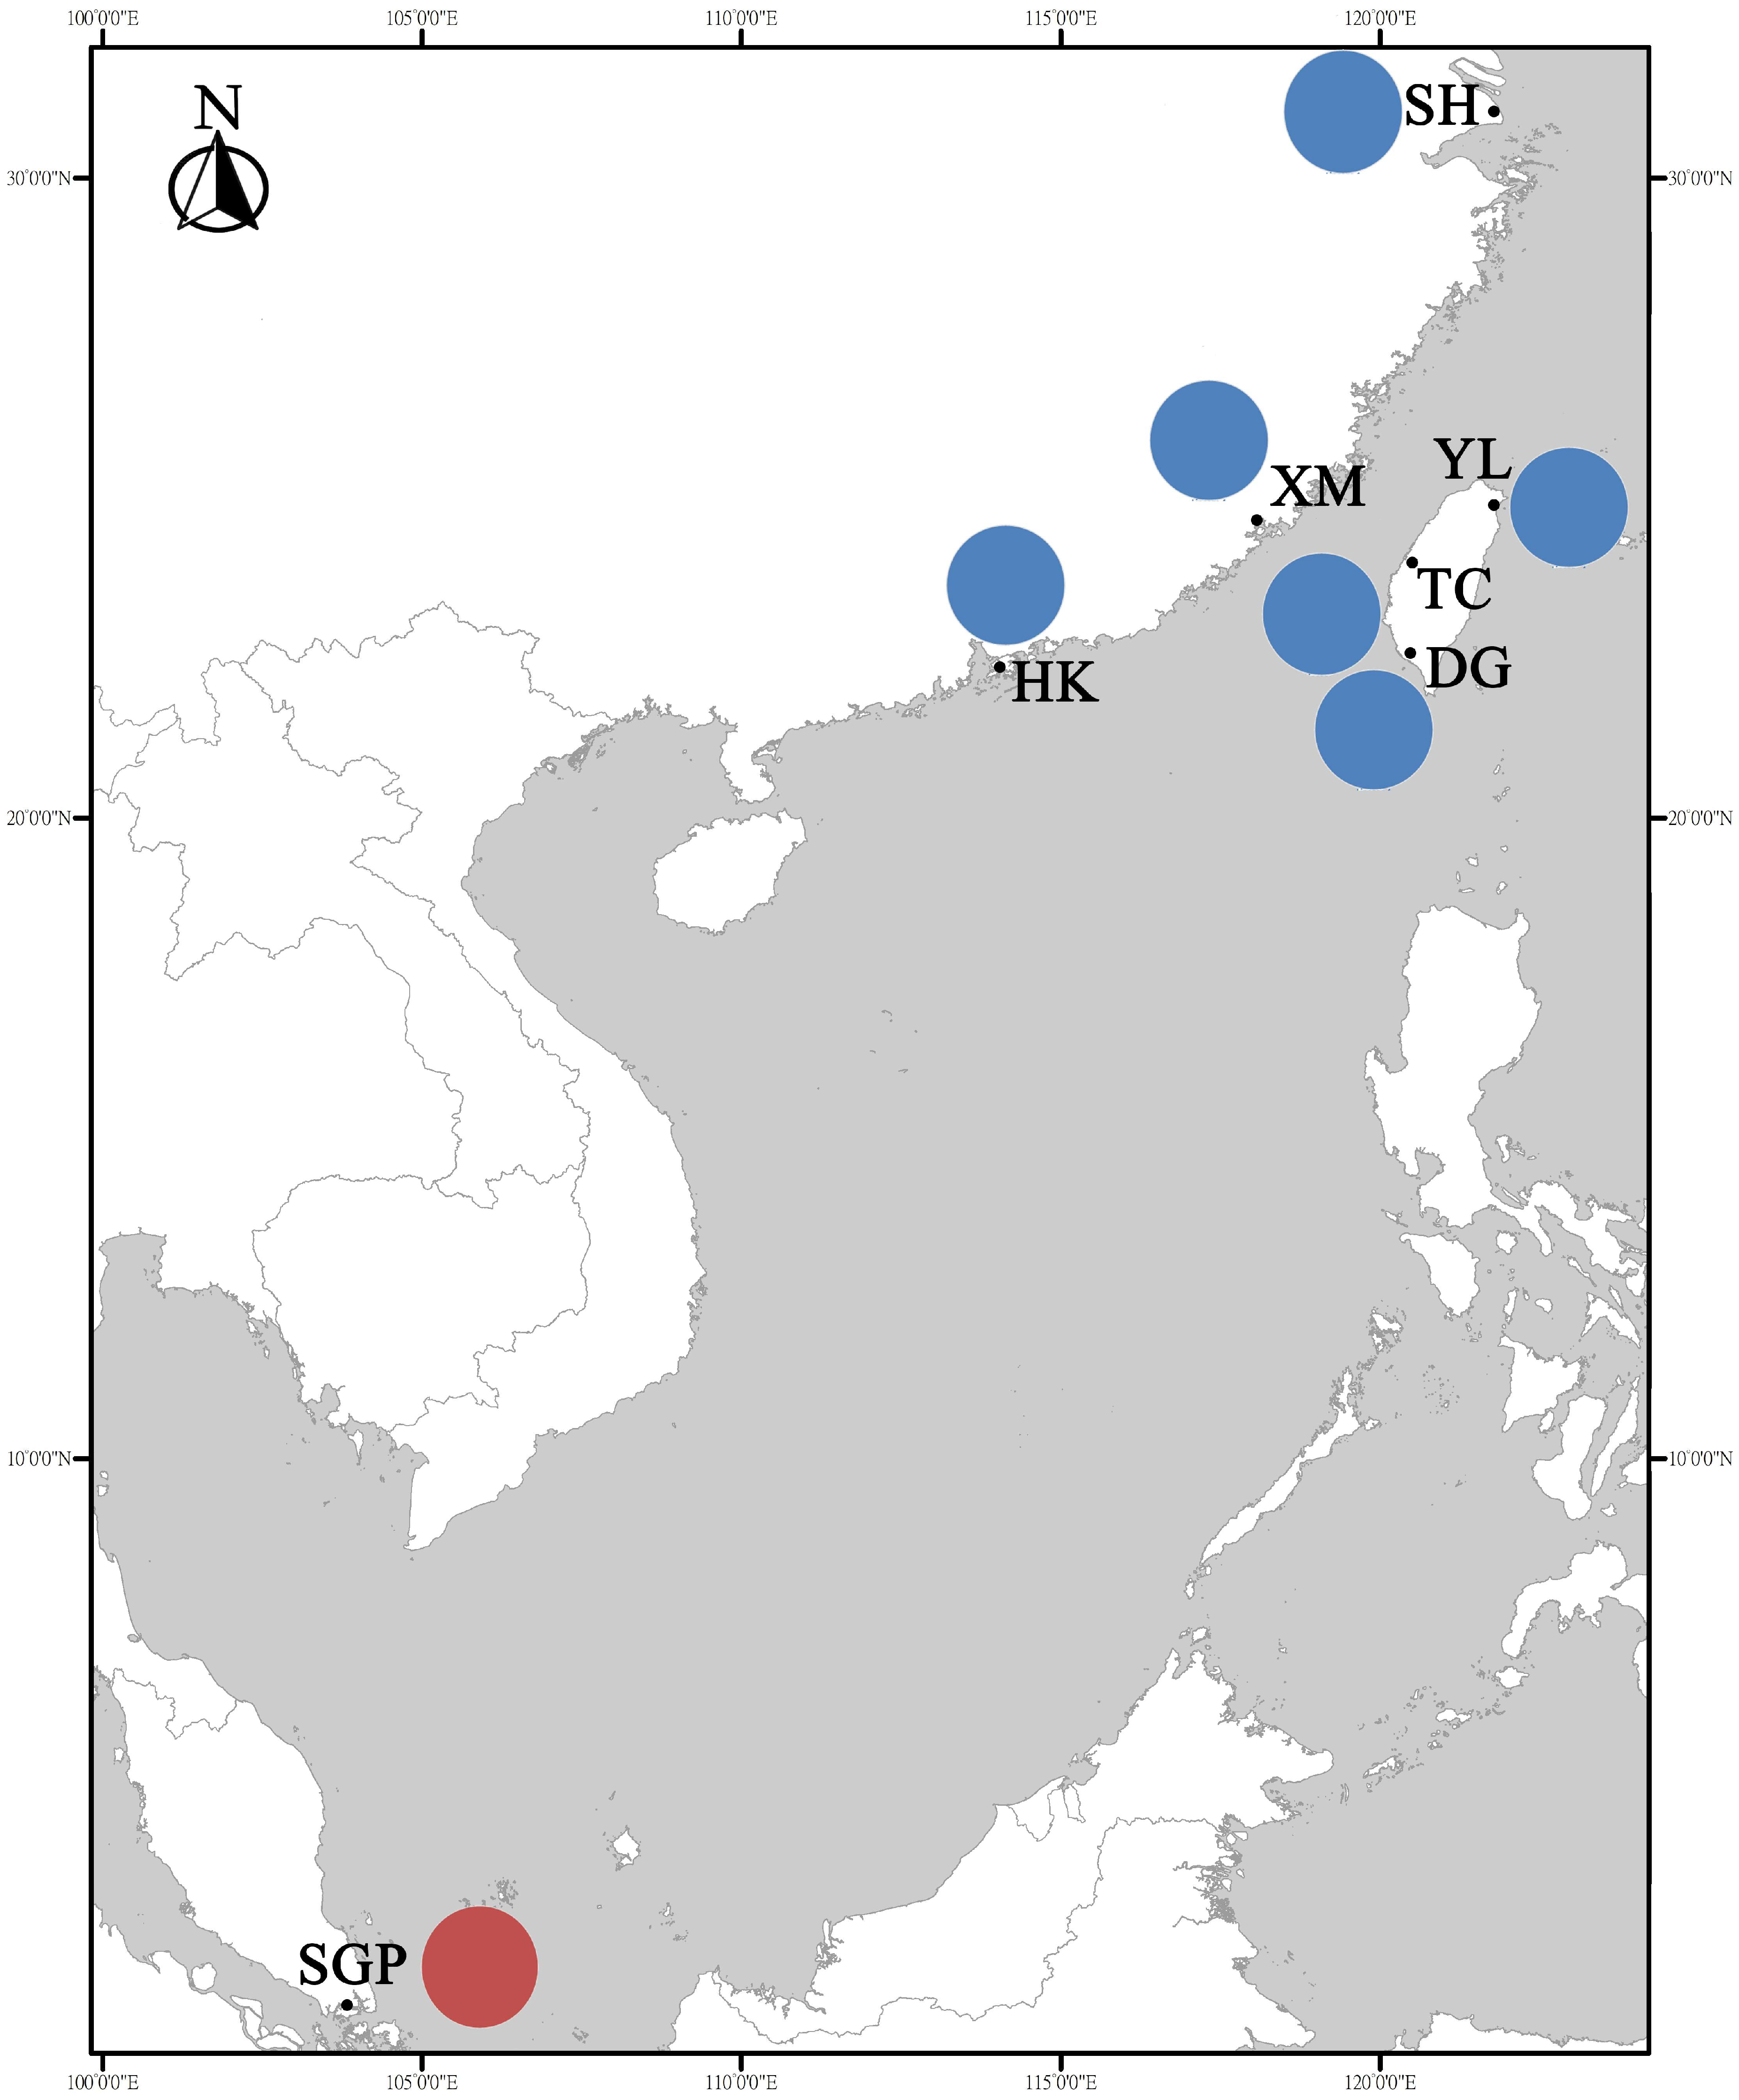
2.1. Sample Collection
2.2. DNA Extraction, PCR and Sequencing
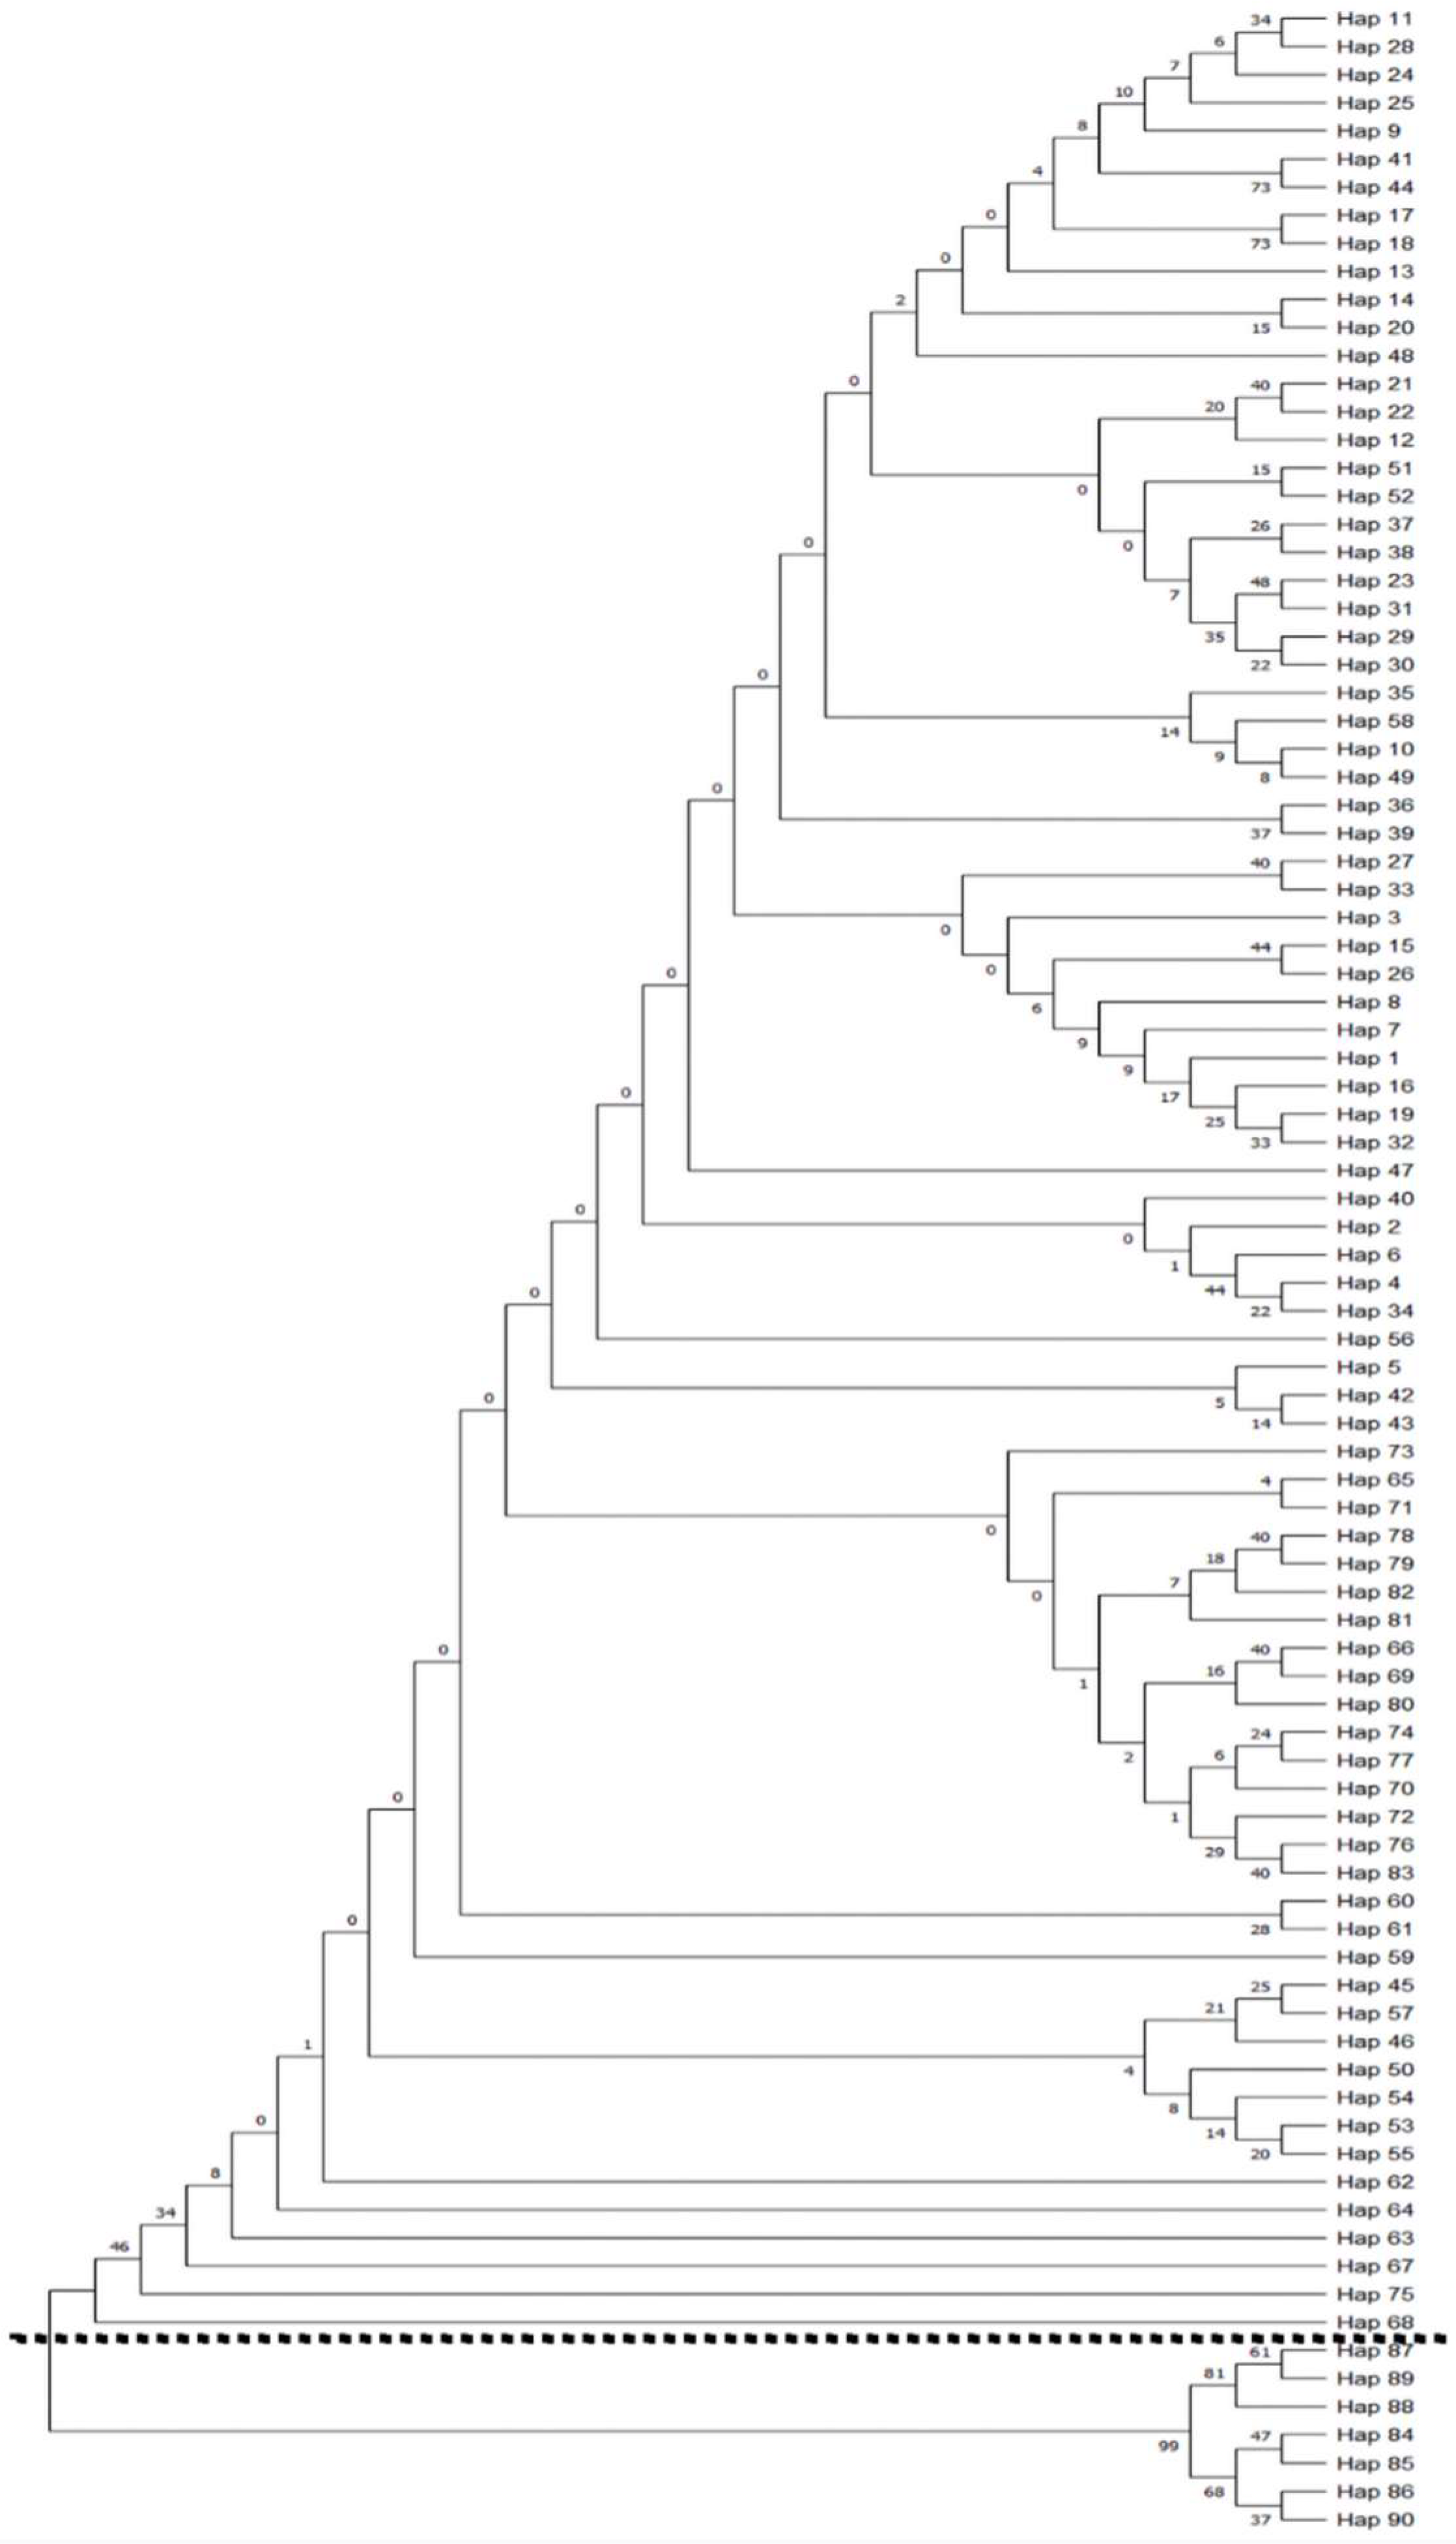
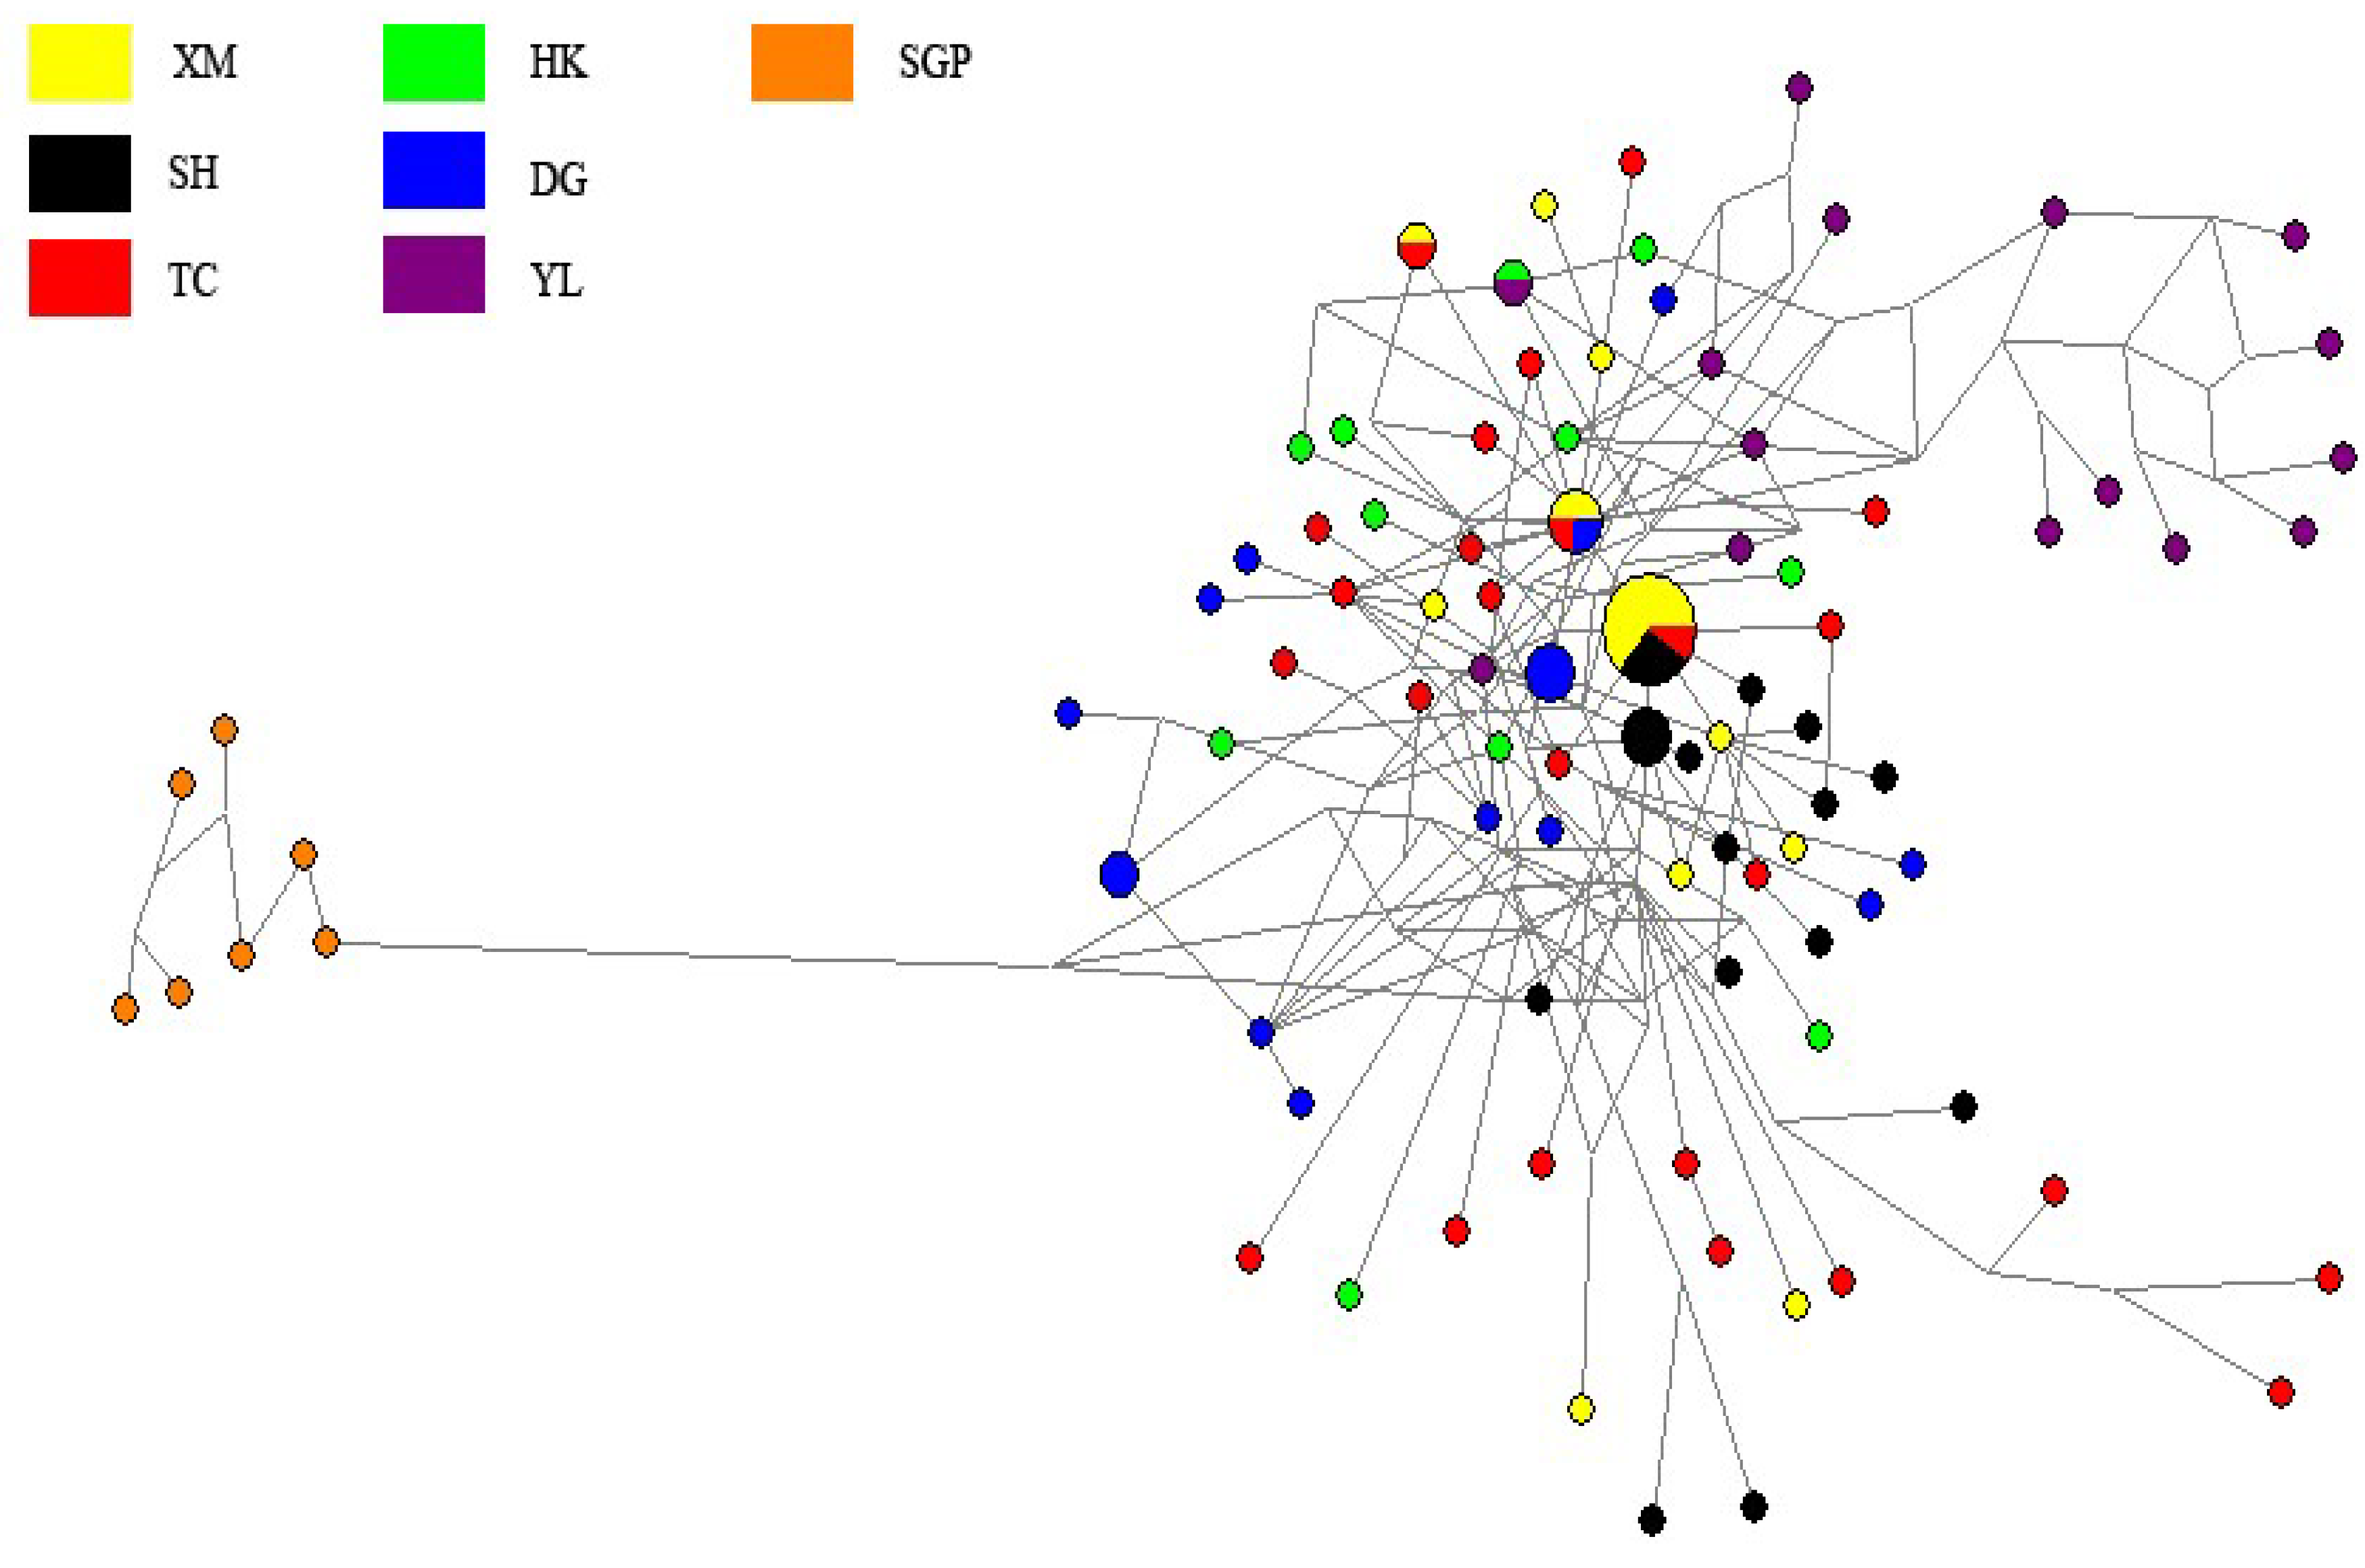
2.3. Analyses of Sequences
3. Results and Discussions
Biological Information and Growth Estimation
4. Discussions
5. Conclusions
Author Contributions
Funding
Institutional Review Board Statement
Informed Consent Statement
Data Availability Statement
Acknowledgments
Conflicts of Interest
References
- Hewitt, G.M. Some genetic consequences of ice ages, and their role in divergence and speciation. Biol. J. Linn. Soc. 1996, 58, 247–276. [Google Scholar] [CrossRef]
- Avise, J.C. Phylogeography: The History and Formation of Species, 3rd ed.; Harvard Publishers Inc.: Cambridge, MA, USA, 2000. [Google Scholar]
- Hewitt, G.M. The genetic legacy of the quaternary ice ages. Nature 2000, 405, 907–913. [Google Scholar] [CrossRef] [PubMed]
- Gallagher, S.J.; Kitamura, A.; Iryu, Y.; Itaki, T.; Koizumi, I.; Hoiles, P.W. The Pliocene to recent history of the Kuroshio and Tsushima Currents: A multi-proxy approach. Prog. Earth Planet. Sci. 2015, 2, 2–17. [Google Scholar] [CrossRef] [Green Version]
- Hansen, J.E.; Sato, M. 2012 Paleoclimate Implications for human-made climate change. In Climate Change: Inferences from Paleoclimate and Regional Aspects; Berger, A., Mesinger, F., Sijacki, D., Eds.; Springer Publishers Inc.: Berlin/Heidelberg, Germany, 2012. [Google Scholar]
- Wang, L.; Sarnthein, M.; Erlenkeuser, H.; Grimalt, J.; Grootes, P.; Heilig, S.; Ivanova, E.; Kienast, M.; Pelejero, C.; Pflaumann, U. East Asian monsoon climate during the late Pleistocene: High-resolution sediment records from the South China Sea. Mar. Geol. 1999, 156, 245–284. [Google Scholar] [CrossRef] [Green Version]
- Chen, P.C.; Shih, C.H.; Chu, T.J.; Wang, D.; Lee, Y.C.; Tzeng, T.D. Population Structure and Historical Demography of the Oriental River Prawn (Macrobrachium nipponense) in Taiwan. PLoS ONE 2015, 10, e0145927. [Google Scholar] [CrossRef] [Green Version]
- Li, Y.; Chen, J.; Jiang, L.; Qiao, G. Islands conserve high species richness and areas of endemism of Hormaphidinae aphids. Curr. Zool. 2017, 63, 623–632. [Google Scholar] [CrossRef] [Green Version]
- Shen, K.N.; Jamandre, B.W.; Hsu, C.C.; Tzeng, W.N.; Durand, J.D. Plio-Pleistocene sea level and temperature fuctuations in the northwestern Pacifc promoted speciation in the globally-distributed fathead mullet Mugil cephalus. BMC Evol. Biol. 2011, 11, 83. [Google Scholar] [CrossRef] [Green Version]
- Xiao, S.; Li, A.; Jiang, F.; Li, T.; Wan, S.; Huang, P. The history of the Yangtze river entering sea since the last glacial maximum: A review and lock forward. J. Coast. Res. 2004, 20, 599–604. [Google Scholar] [CrossRef]
- Liu, M.Y.; Cai, Y.; Tzeng, C.S. Molecular systematics of the freshwater prawn genus Macrobrachium Bate, 1868 (Crustacea: Decapoda: Palaemonidae) inferred from mtDNA sequences, with emphasis on east Asian species. Zool. Stud. 2007, 46, 272–289. [Google Scholar]
- Wang, P.; Sun, X. Last glacial maximum in China: Comparison between land and sea. Catena 1994, 23, 341–353. [Google Scholar]
- Craw, D.; Burridge, C.; Anderson, L.; Waters, J.M. Late Quaternary river drainage and fish evolution, Southland, New Zealand. Geomorphology 2007, 84, 98–110. [Google Scholar] [CrossRef]
- McCartney-Melstad, E.; Shaffer, B.H. Amphibian molecular ecology and how it has informed conservation. Mol. Ecol. 2015, 24, 5084–5109. [Google Scholar] [CrossRef] [PubMed]
- Strugnell, J.M.; Watts, P.C.; Smith, P.J.; Allcock, A.L. Persistent genetic signatures of historic climatic events in an Antarctic octopus. Mol. Ecol. 2012, 21, 2775–2787. [Google Scholar] [CrossRef] [PubMed]
- Pinceel, T.; Vanschoenwinkel, B.; Waterkeyn, A.; Vanhove, M.P.M.; Pinder, A.M.; Timms, B.V. Fairy shrimps in distress: A molecular taxonomic review of the diverse fairy shrimp genus Branchinella (Anostraca: Thamnocephalidae) in Australia in the light of ongoing environmental change. Hydrobiologia. 2013, 700, 313–327. [Google Scholar] [CrossRef]
- Pineros, V.J.; Gutierrez-Rodriguez, C. Population genetic structure and connectivity in the widespread coral-reef fish Abudefduf saxatilis: The role of historic and contemporary factors. Coral Reefs 2017, 36, 877–890. [Google Scholar] [CrossRef]
- Nali, R.C.; Becker, C.G.; Zamudio, K.R.; Prado, C.P.A. Topography, more than land cover, explains genetic diversity in a Neotropical savanna tree frog. Divers. Distrib. 2020, 26, 1798–1812. [Google Scholar] [CrossRef]
- Hoelzel, A.R.; Hancock, J.M.; Dover, G.A. Evolution of the cetacean mitochondrial D-loop region. Mol. Biol. Evol. 1991, 8, 475–493. [Google Scholar]
- Xu, J.; Chan, T.Y.; Tsang, L.M.; Chu, K.H. Phylogeography of the mitten crab Eriocheir sensu stricto in East Asia: Pleistocene isolation, population expansion and secondary contact. Mol. Phylogenet. Evol. 2009, 52, 45–56. [Google Scholar] [CrossRef]
- Apel, M.; Spiridonov, V.A. Taxonomy and zoogeography of the portunid crabs (Crustacea: Decapoda: Brachyura: Portunidae) of the Arabian Gulf and the adjacent waters. Fauna Arabia. 1998, 17, 159–331. [Google Scholar]
- Lai, J.C.Y.; Ng, P.K.L.; Davie, P.J.F. A revision of the Portunus pelagicus (Linnaeus, 1758) species complex (Crustacea: Brachyura: Portunidae), with the recognition of four species. Raffles Bull. Zool. 2010, 58, 199–237. [Google Scholar]
- Huang, Y.H.; Shih, H.T. Diversity in the Taiwanese swimming crabs (Crustacea: Brachyura: Portunidae) estimated through DNA barcodes, with descriptions of 14 new records. Zool. Stud. 2021, 60, 60. [Google Scholar]
- Huang, Z.R. Species composition and quantitative distribution of crabs in the northern continental shelf of South China Sea. J. Dalian Fish Univ. 2009, 24, 553–558. [Google Scholar]
- Yu, C.G.; Song, H.T.; Yao, G.Z.; Lü, H.Q. Composition and distribution of economic crab species in the East China Sea. Oceanol. Limnol. Sin. 2006, 37, 53–60. [Google Scholar]
- Yang, C.P.; Li, H.X.; Li, L.; Xu, J.; Yan, Y. Population structure, morphometric analysis and reproductive biology of Portunus sanguinolentus (Herbst, 1783) (Decapoda: Brachyura: Portunidae) in Honghai Bay, South China Sea. J. Crustacean Biol. 2014, 34, 722–730. [Google Scholar] [CrossRef] [Green Version]
- Ward, R.D. Genetics in fisheries management. Hydrobiologia 2000, 420, 191–201. [Google Scholar] [CrossRef]
- Ortega-Villaizan Romo, M.; Suzuki, S.; Nakajima, M.; Taniguchi, N. Genetic evolution of inter individual relatedness for broodstock management of the rare species barfin flounder Verasper moseri using microsatellite DNA markers. Fish. Sci. 2006, 72, 33–39. [Google Scholar] [CrossRef]
- Rasheed, S.; Mustaquim, J. Size at sexual maturity, breeding season and fecundity of three-spot swimming crab Portunus sanguinolentus (Herbst, 1783) (Decapoda, Brachyura, Portunidae) occurring in the coastal waters of Karachi, Pakistan. Fish Res. 2010, 103, 56–62. [Google Scholar] [CrossRef]
- Lee, H.H.; Hsu, C.C. Population biology of the swimming crab Portunus sanguinolentus in the waters off northern Taiwan. J. Crustacena Biol. 2003, 23, 691–699. [Google Scholar] [CrossRef] [Green Version]
- Song, H.T.; Yu, C.G.; Xue, L.J.; Yao, G.Z. The Economical Shrimp and Crab from East China Sea; Ocean Press: Beijing, China, 2006. [Google Scholar]
- Sambrook, J.; Russell, D.W. Molecular Cloning: A Laboratory Manual, 3rd ed.; Cold Spring Harbor Publishers Inc.: New York, NY, USA, 2001. [Google Scholar]
- Nei, M. Molecular Evolutionary Genetics, 1st ed.; Columbia Publishers Inc.: New York, NY, USA, 1987. [Google Scholar]
- Rozas, J.; Sanchez-Delbarrio, J.C.; Messeguer, X.; Rozas, R. DnaSP, DNA polymorphism analyses by the coalescent and other methods. Bioinformatics 2003, 19, 2496–2497. [Google Scholar] [CrossRef]
- Tamura, K.; Peterson, D.; Peterson, N.; Stecher, G.; Nei, M.; Kumar, S. MEGA6: Molecular evolutionary genetics analysis using maximum likelihood, evolutionary distance, and maximum parsimony methods. Mol. Biol. Evol. 2011, 28, 2731–2739. [Google Scholar] [CrossRef] [Green Version]
- Bandelt, H.J.; Forster, P.; Rohl, A. Median-joining networks for inferring intraspecific phylogenies. Mol. Biol. Evol. 1999, 16, 37–48. [Google Scholar] [CrossRef] [PubMed]
- Chen, P.C.; Shih, C.H.; Chu, T.J.; Lee, Y.C.; Tzeng, T.D. Phylogeography and genetic structure of the oriental river prawn Macrobrachium nipponense (Crustacea: Decapoda: Palaemonidae) in East Asia. PLoS ONE 2017, 2, e0173490. [Google Scholar] [CrossRef] [PubMed] [Green Version]
- Nei, M.; Tajima, F. DNA polymorphism detectable by restriction endonucleases. Genetics 1981, 97, 145–163. [Google Scholar] [CrossRef] [PubMed]
- Rogers, A.R.; Harpending, H. Population growth makes waves in the distribution of pairwise genetic differences. Mol. Biol. Evol. 1992, 9, 552–569. [Google Scholar] [PubMed]
- Aboim, M.A.; Menezes, G.M.; Schlitt, T.; Rogers, A.D. Genetic structure and history of populations of the deep-sea fish Helicolenus dactylopterus (Delaroche, 1809) inferred from mtDNA sequence analysis. Mol. Ecol. 2005, 14, 1343–1354. [Google Scholar] [CrossRef]
- Shen, K.N.; Tzeng, W.N. Reproductive strategy and recruitment dynamics of amphidromous goby Sicyopterus japonicus as revealed by otolith microstructure. J. Fish Biol. 2008, 73, 2497–2512. [Google Scholar] [CrossRef]
- Iida, M.; Watanabe, S.; Shinoda, A.; Tsukamoto, K. Recruitment of the amphidromous goby Sicyopterus japonicus to the estuary of the Ota River, Wakayama, Japan. Environ. Biol. Fish. 2008, 83, 331–341. [Google Scholar] [CrossRef]
- Excoffier, L.; Lischer, H.E. Arlequin suite ver. 3.5: A new series of programs to perform population genetics analyses under Linux and Windows. Mol. Ecol. Resour. 2010, 10, 564–567. [Google Scholar] [CrossRef]
- Excoffier, L.; Smouse, P.E.; Quattro, J.M. Analysis of molecular variance inferred from metric distances among DNA haplotypes: Application to human mitochondrial DNA restriction data. Genetics 1992, 131, 479–491. [Google Scholar] [CrossRef]
- Stanley, H.F.; Casey, S.; Carnahan, J.M.; Goodman, S.; Harwood, J.; Wayne, K. Worldwide patterns of mitochondrial DNA differentiation in the harbor seal (Phoca vitulina). Mol. Biol. Evol. 1996, 13, 368–382. [Google Scholar] [CrossRef] [Green Version]
- Tajima, F. Statistical method for testing the neutral mutation hypothesis by DNA polymorphism. Genetics 1989, 123, 585–595. [Google Scholar] [CrossRef] [PubMed]
- Fu, Y.X. Statistical tests of neutrality of mutations against population growth, hitchhiking and background selection. Genetics 1997, 147, 915–925. [Google Scholar] [CrossRef] [PubMed]
- Mantel, N. The detection of disease clustering and a generalized regression approach. Cancer Res. 1967, 27, 209–220. [Google Scholar]
- Sezmis, E. The Population Genetic Structure of Portunus pelagicus in Australian Waters. Ph.D Thesis, Murdoch University, Perth, Australia, 2004. [Google Scholar]
- Crandall, K.A.; Templeton, A.R. Empirical tests of some predictions from coalescent theory with applications to intraspecific phylogeny reconstruction. Genetics 1993, 134, 959–969. [Google Scholar] [CrossRef] [PubMed]
- Chiang, T.Y.; Schaal, B.A. Phylogeography of North American populations of the moss species Hylocomium splendens based on the nucleotide sequence of internal transcribed spacer 2 of nuclear ribosomal DNA. Mol. Ecol. 1999, 8, 1037–1042. [Google Scholar] [CrossRef]
- Wang, J.P.; Hsu, K.C.; Chiang, T.Y. Mitochondrial DNA phylogeography of Acrossocheilus paradoxus (Cyprinidae) in Taiwan. Mol. Ecol. 2000, 9, 1483–1494. [Google Scholar] [CrossRef]
- Li, N.S.; Zhao, S.; Wasiliev, B. Geology of Marginal Sea in the North West Pacific; Heilongjiang Education Press: Harbin, China, 2000. (In Chinese) [Google Scholar]
- Ren, G.; Ma, H.; Ma, C.; Wang, W.; Chen, W.; Ma, L. Genetic diversity and population structure of Portunus sanguinolentus (Herbst, 1783) revealed by mtDNA COI sequences. Mitochondrial DNA Part A 2017, 28, 740–746. [Google Scholar] [CrossRef]
- Grant, W.S.; Bowen, B.W. Shallow population histories in deep evolutionary lineages of marinefishes: Insights from sardines and anchovies and lessons for conservation. J. Hered. 1998, 89, 415–426. [Google Scholar] [CrossRef]
- Ma, H.Y.; Ma, C.Y.; Li, C.H.; Lu, J.X.; Zou, X.; Gong, Y.Y.; Wang, W.; Chen, W.; Ma, L.; Xia, L.J. First mitochondrial genome for the red crab (Charybdis feriata) with implication of phylogenomics and population genetics. Sci. Rep. 2015, 5, 11524. [Google Scholar] [CrossRef] [Green Version]
- Xu, J.; Chu, K.H. Genome scan of the mitten crab Eriocheir sensu stricto in East Asia: Population differentiation, hybridization and adaptive speciation. Mol. Phylogenet. Evol. 2012, 64, 118–129. [Google Scholar] [CrossRef]
- Abdul Halim, S.A.A.; Othman, A.S.; Akib, N.A.M.; Jamaludin, N.A.; Esa, Y.; Nor, S.A.M. Mitochondrial markers identify a genetic boundary of the Green Tiger Prawn (Penaeus semisulcatus) in the Indo-Pacific Ocean. Zool. Stud. 2021, 60, 8. [Google Scholar]
- Benzie, J.A.H.; Williams, S.T. Genetic structure of giant clam (Tridacna maxima) populations in the West Pacific is not consistent with dispersal by present-day ocean currents. Evolution 1997, 51, 768–783. [Google Scholar]
- Dall, W.; Hill, J.; Rothlisberg, P.C.; Staples, D.J. The Biology of Penaeidae. Advances in Marine Biology 27; Blaxter, J.H.S., Southward, A.J., Eds.; Academic Press: New York, NY, USA, 1990. [Google Scholar]
- Wenner, A.M. Sex ratio as a function of size in marine Crustacea. Am. Nat. 1972, 106, 321–350. [Google Scholar] [CrossRef]
- Campbell, G.R.; Fielder, D.R. Size at sexual maturity and occurrence of ovigerous females in three species of commercially exploited portunid crabs in S.E. Queensland. Proc. R. Soc. Qld. 1986, 97, 79–87. [Google Scholar]
- Kepel, A.A.; Tsareva, L.A. First record of tropical crabs Portunus sanguinolentus (Herbst, 1783) and Plagusia depressatuberculate Lamarck, 1818 in Peter the Great Bay, Sea of Japan. Russ. J. Mar. Biol. 2005, 31, 124–125. [Google Scholar] [CrossRef]
- Chan, B.K.K.; Tsang, L.M.; Chu, K.H. Morphological and genetic differentiation of the acorn barnacle Tetraclita squamosa (Crustacea, Cirripedia) in East Asia and description of a new species of Tetraclita. Zool. Scr. 2007, 36, 79–91. [Google Scholar] [CrossRef]
- Tsang, L.M.; Wu, T.H.; Shih, H.T.; Williams, G.A.; Chu, K.H.B.; Chan, K.K. Genetic and morphological differentiation of the Indo-West Pacific intertidal barnacle Chthamalus malayensis. Integr. Comp. Biol. 2012, 52, 388–409. [Google Scholar] [CrossRef] [Green Version]
- Wong, K.J.H.; Chan, B.K.K.; Shih, H.T. Taxonomy of the sand bubbler crabs Scopimera globosa De Haan, 1835, and S. tuberculata Stimpson, 1858 (Crustacea: Decapoda: Dotillidae) in East Asia with description of a new species from the Ryukyus, Japan. Zootaxa 2010, 2345, 43–59. [Google Scholar] [CrossRef] [Green Version]


| Code | Sample Site | n | nh | Lineage 1 | Lineage 2 | h Diversity | π Diversity | Tajima’s D | Fu’s Fs | ||
|---|---|---|---|---|---|---|---|---|---|---|---|
| SH | Shanghai, China | 18 | 14 | 18 | 0 | 0.961 ± 0.034 | 0.00478 ± 0.00097 | −1.8221 | * | −7.429 | * |
| TC | Taichung, Taiwan | 25 | 25 | 25 | 0 | 1.000 ± 0.011 | 0.00818 ± 0.00818 | −1.6345 | −22.885 | ** | |
| XM | Xiamen, China | 18 | 11 | 18 | 0 | 0.856 ± 0.079 | 0.00372 ± 0.00110 | −1.7473 | −4.134 | ||
| DG | Donggang, Taiwan | 16 | 13 | 16 | 0 | 0.967 ± 0.036 | 0.00596 ± 0.00088 | −0.9149 | −5.639 | * | |
| HK | Hong Kong, China | 11 | 11 | 11 | 0 | 1.000 ± 0.039 | 0.00652 ± 0.00078 | −0.7909 | −6.454 | * | |
| YL | Yilan, Taiwan | 15 | 15 | 15 | 0 | 1.000 ± 0.024 | 0.00909 ± 0.00111 | −0.9552 | −8.867 | ** | |
| SGP | Singapore, Singapore | 7 | 7 | 0 | 7 | 1.000 ± 0.076 | 0.01345 ± 0.00173 | 1.0533 | −1.300 | ||
| Lineage A | 103 | 83 | 0.987 ± 0.006 | 0.00780 ± 0.00054 | −2.1899 | ** | −114.956 | ** | |||
| Lineage B | 7 | 7 | 1.000 ± 0.076 | 0.01345 ± 0.00173 | 1.0533 | −1.300 | |||||
| Total | 110 | 90 | 0.988 ± 0.005 | 0.01149 ± 0.00135 | −2.04282 | * | −105.649 | ** | |||
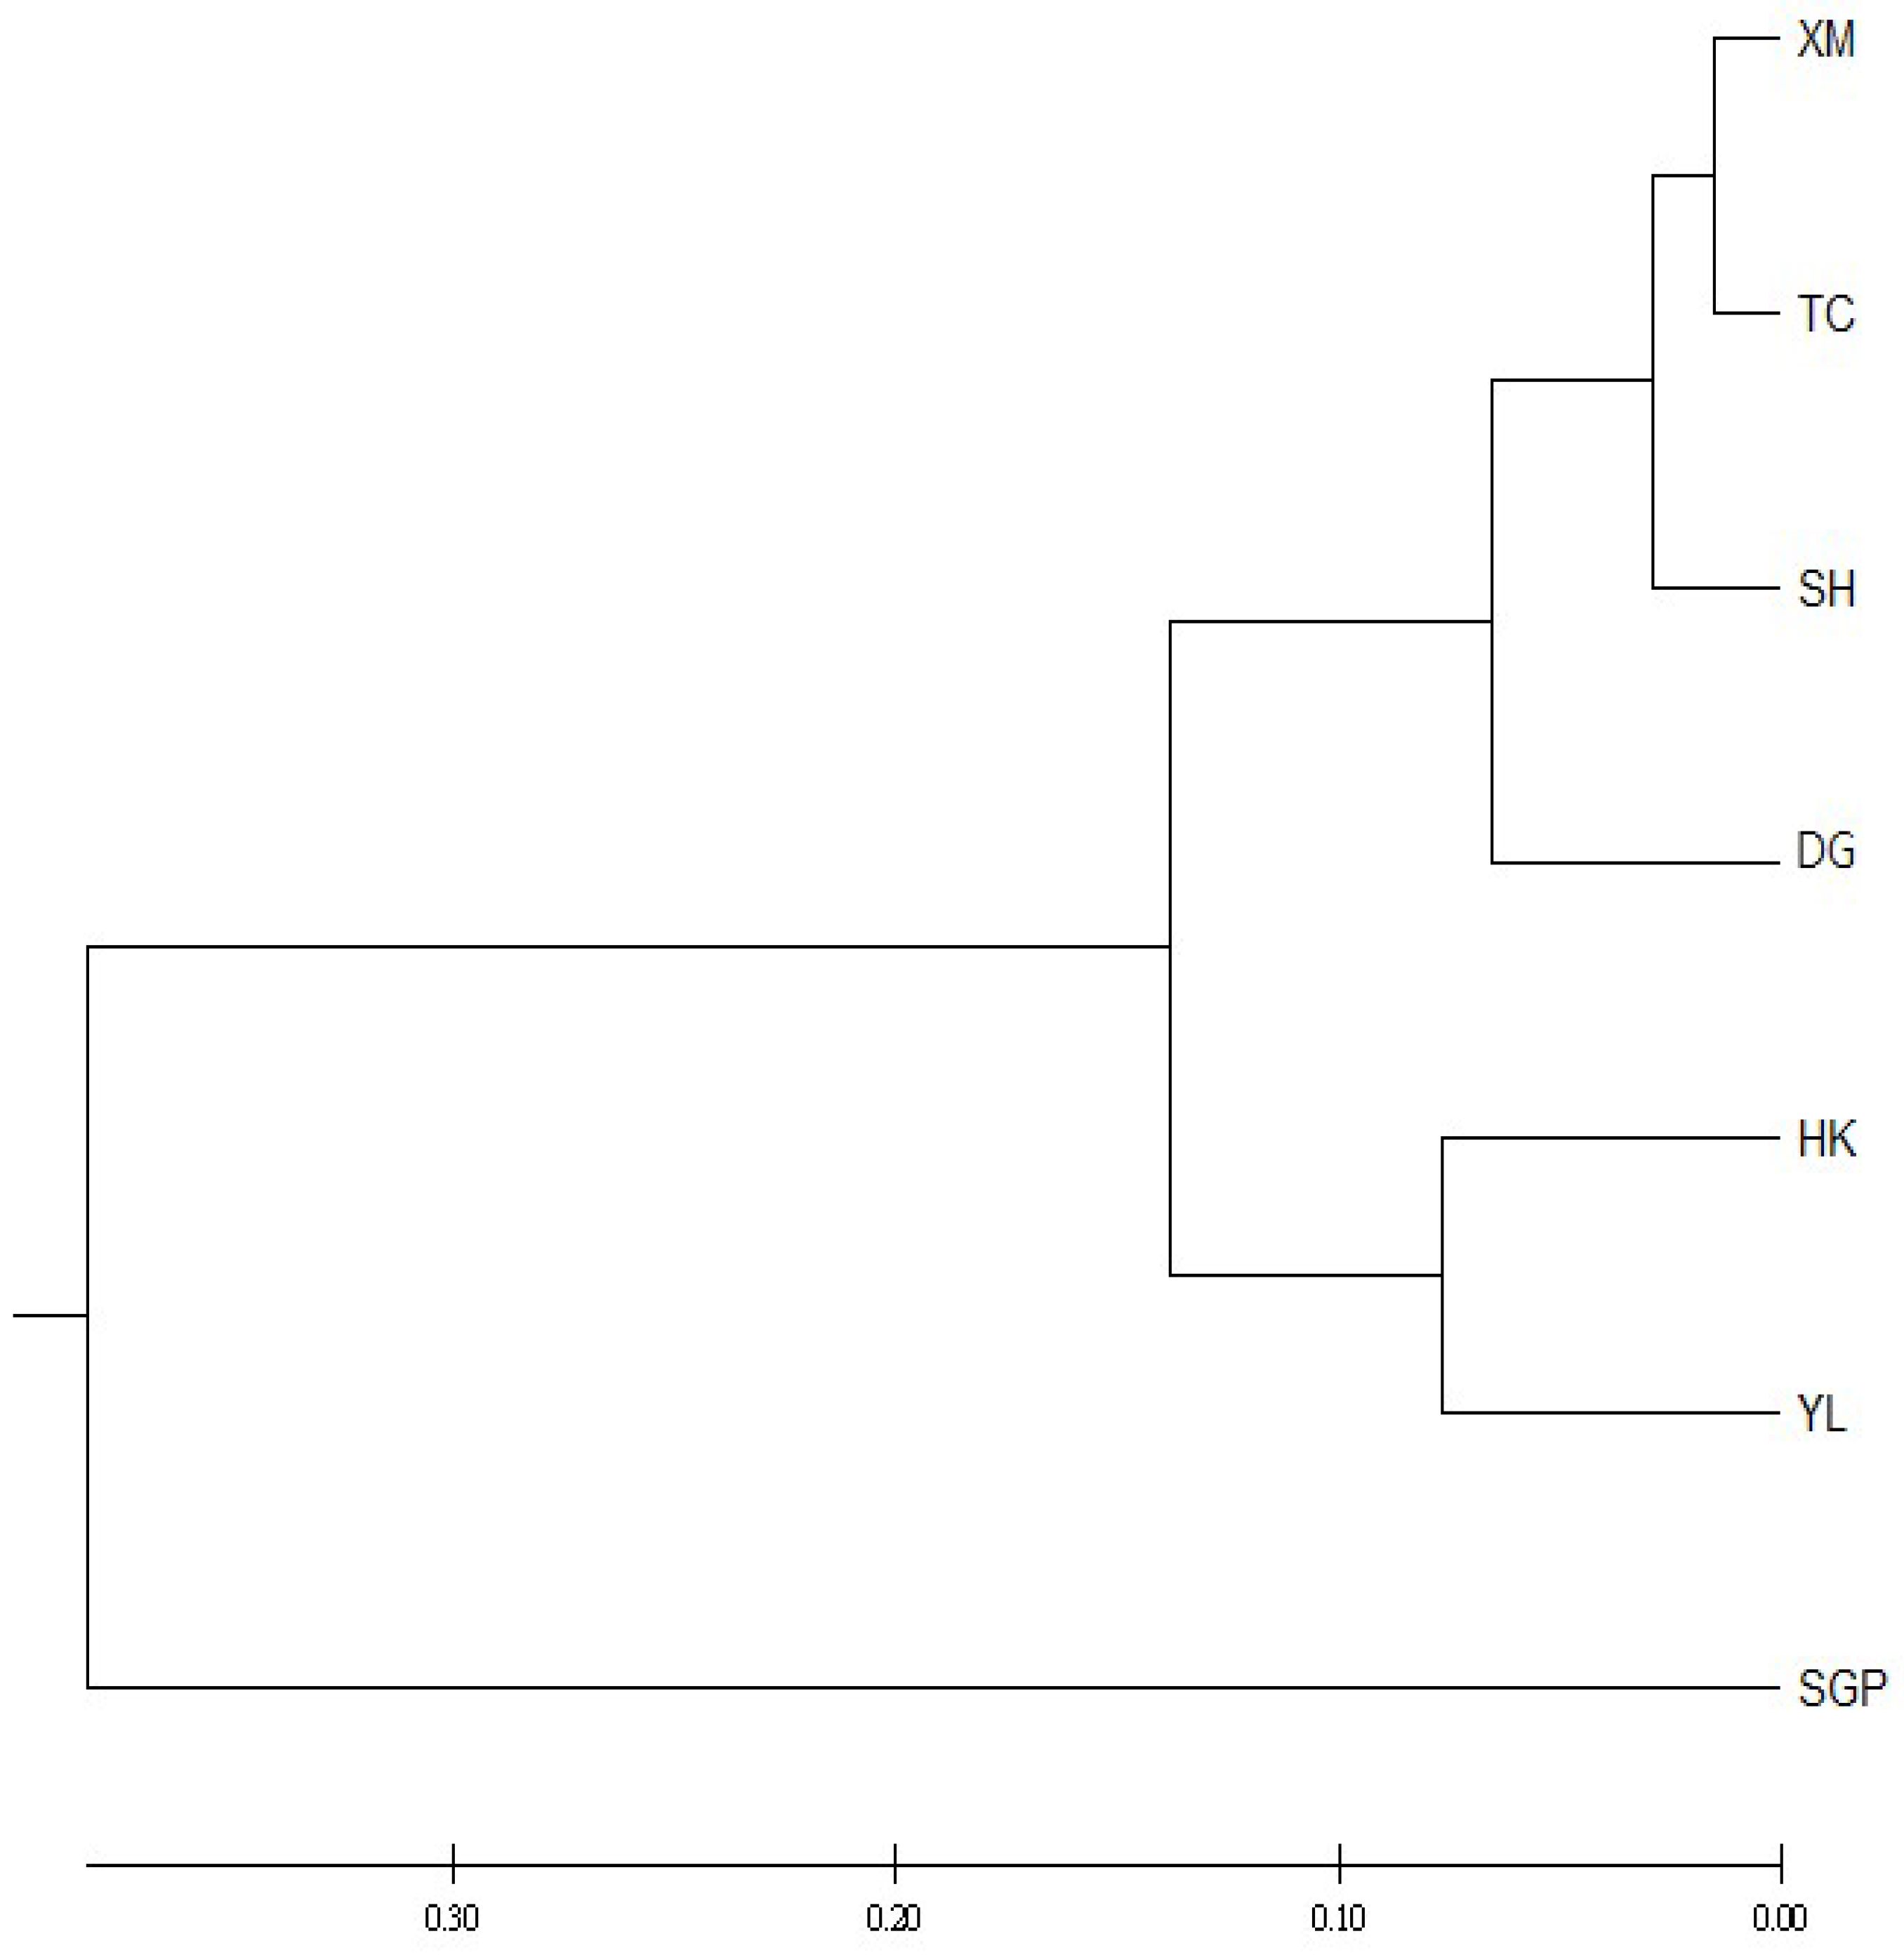
| SH | YL | XM | TC | DG | HK | SGP | |
|---|---|---|---|---|---|---|---|
| SH | - | 0.000 | 0.000 | 0.000 | 0.000 | 0.000 | 0.000 |
| YL | 0.354 | - | 0.000 | 0.000 | 0.000 | 0.000 | 0.000 |
| XM | 0.063 | 0.342 | - | 0.036 | 0.000 | 0.000 | 0.000 |
| TC | 0.055 | 0.242 | 0.030 | - | 0.000 | 0.000 | 0.000 |
| DG | 0.182 | 0.274 | 0.136 | 0.075 | - | 0.000 | 0.000 |
| HK | 0.321 | 0.153 | 0.315 | 0.198 | 0.167 | - | 0.000 |
| SGP | 0.790 | 0.734 | 0.822 | 0.742 | 0.767 | 0.739 | - |
| Population | Grouping | Source of Variation | Percentage of Variation | Φ-Statistics | p (More-Extreme Value) |
|---|---|---|---|---|---|
| One group | Group 1{SH, YL, TC, XM, DG, HK, SGP} | AP | 42.59 | ΦST = 0.42592 | *** |
| WP | 57.41 | ||||
| Two groups | Group 1{SH, YL, TC, XM, DG, HK} | AG | 75.19 | ΦCT =0.75194 | *** |
| Group 2 {SGP} | AP/WG | 4.45 | ΦSC =0.17932 | *** | |
| WP | 20.36 | ΦST = 0.79643 | *** | ||
| Three groups | Group 1 {SH, XM, TC, DG} | AG | 52.28 | ΦCT =0.52277 | *** |
| Group 2 {HK, YL} | AP/WG | 4.27 | ΦSC = 0.08937 | *** | |
| Group 3 {SGP} | WP | 43.46 | ΦST =0.56542 | *** | |
| Four groups | Group 1{SH, XM, TC} | AG | 45.71 | ΦCT = 0.45707 | *** |
| Group 2 {DG} | AP/WG | 4.05 | ΦSC = 0.07457 | *** | |
| Group 3{HK, YL} | WP | 50.24 | ΦST = 0.49755 | *** | |
| Group 4{SGP} | |||||
| Five groups | Group 1{SH} | AG | 40.23 | ΦCT = 0.40227 | *** |
| Group 2 {XM, TC} | AP/WG | 5.16 | ΦSC = 0.08627 | *** | |
| Group 3{DG} | WP | 54.62 | ΦST = 0.45384 | *** | |
| Group 4{HK, YL} | |||||
| Group 5{SGP} |
Publisher’s Note: MDPI stays neutral with regard to jurisdictional claims in published maps and institutional affiliations. |
© 2022 by the authors. Licensee MDPI, Basel, Switzerland. This article is an open access article distributed under the terms and conditions of the Creative Commons Attribution (CC BY) license (https://creativecommons.org/licenses/by/4.0/).
Share and Cite
Lu, Y.-M.; Shih, C.-H.; Chen, P.-C.; Kao, W.-C.; Lee, Y.-C.; Han, Y.-S.; Tzeng, T.-D. Phylogeography and Genetic Structure of the Swimming Crabs Portunus sanguinolentus (Herbst, 1783) in East Asia. J. Mar. Sci. Eng. 2022, 10, 281. https://doi.org/10.3390/jmse10020281
Lu Y-M, Shih C-H, Chen P-C, Kao W-C, Lee Y-C, Han Y-S, Tzeng T-D. Phylogeography and Genetic Structure of the Swimming Crabs Portunus sanguinolentus (Herbst, 1783) in East Asia. Journal of Marine Science and Engineering. 2022; 10(2):281. https://doi.org/10.3390/jmse10020281
Chicago/Turabian StyleLu, Yu-Ming, Chun-Han Shih, Po-Cheng Chen, Wei-Chieh Kao, Ying-Chou Lee, Yu-San Han, and Tzong-Der Tzeng. 2022. "Phylogeography and Genetic Structure of the Swimming Crabs Portunus sanguinolentus (Herbst, 1783) in East Asia" Journal of Marine Science and Engineering 10, no. 2: 281. https://doi.org/10.3390/jmse10020281