
Deriving the 100-Year Total Water Level around the Coast of Corsica by Combining Trivariate Extreme Value Analysis and Coastal Hydrodynamic Models

 ,
,  , , and
Abstract
:1. Introduction
2. Materials and Methods
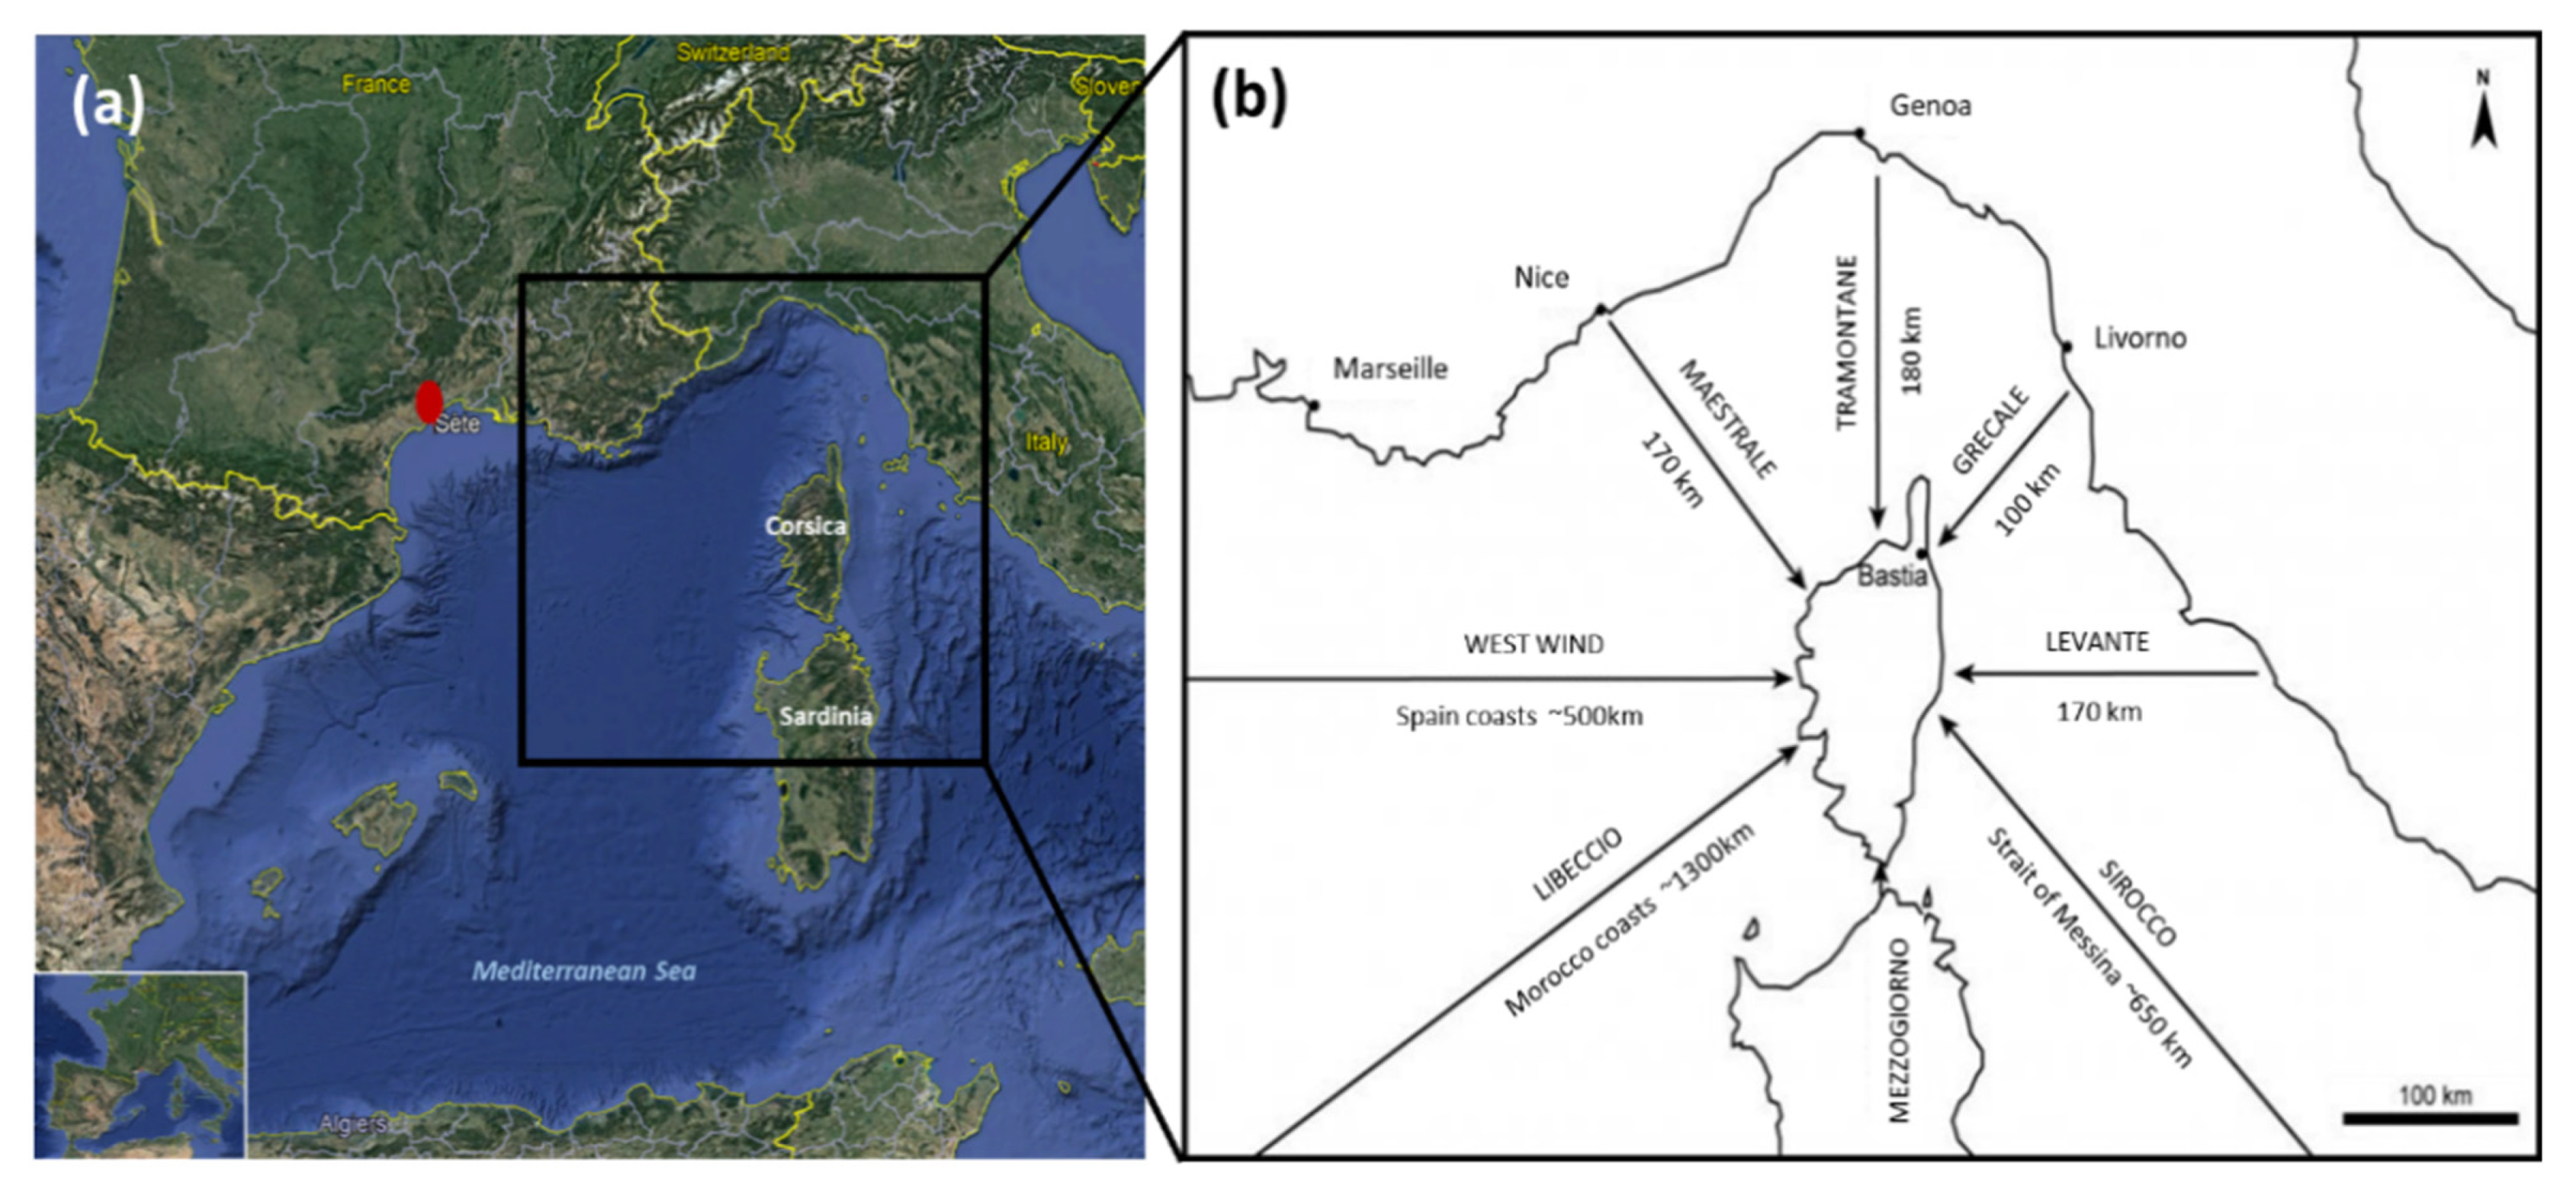
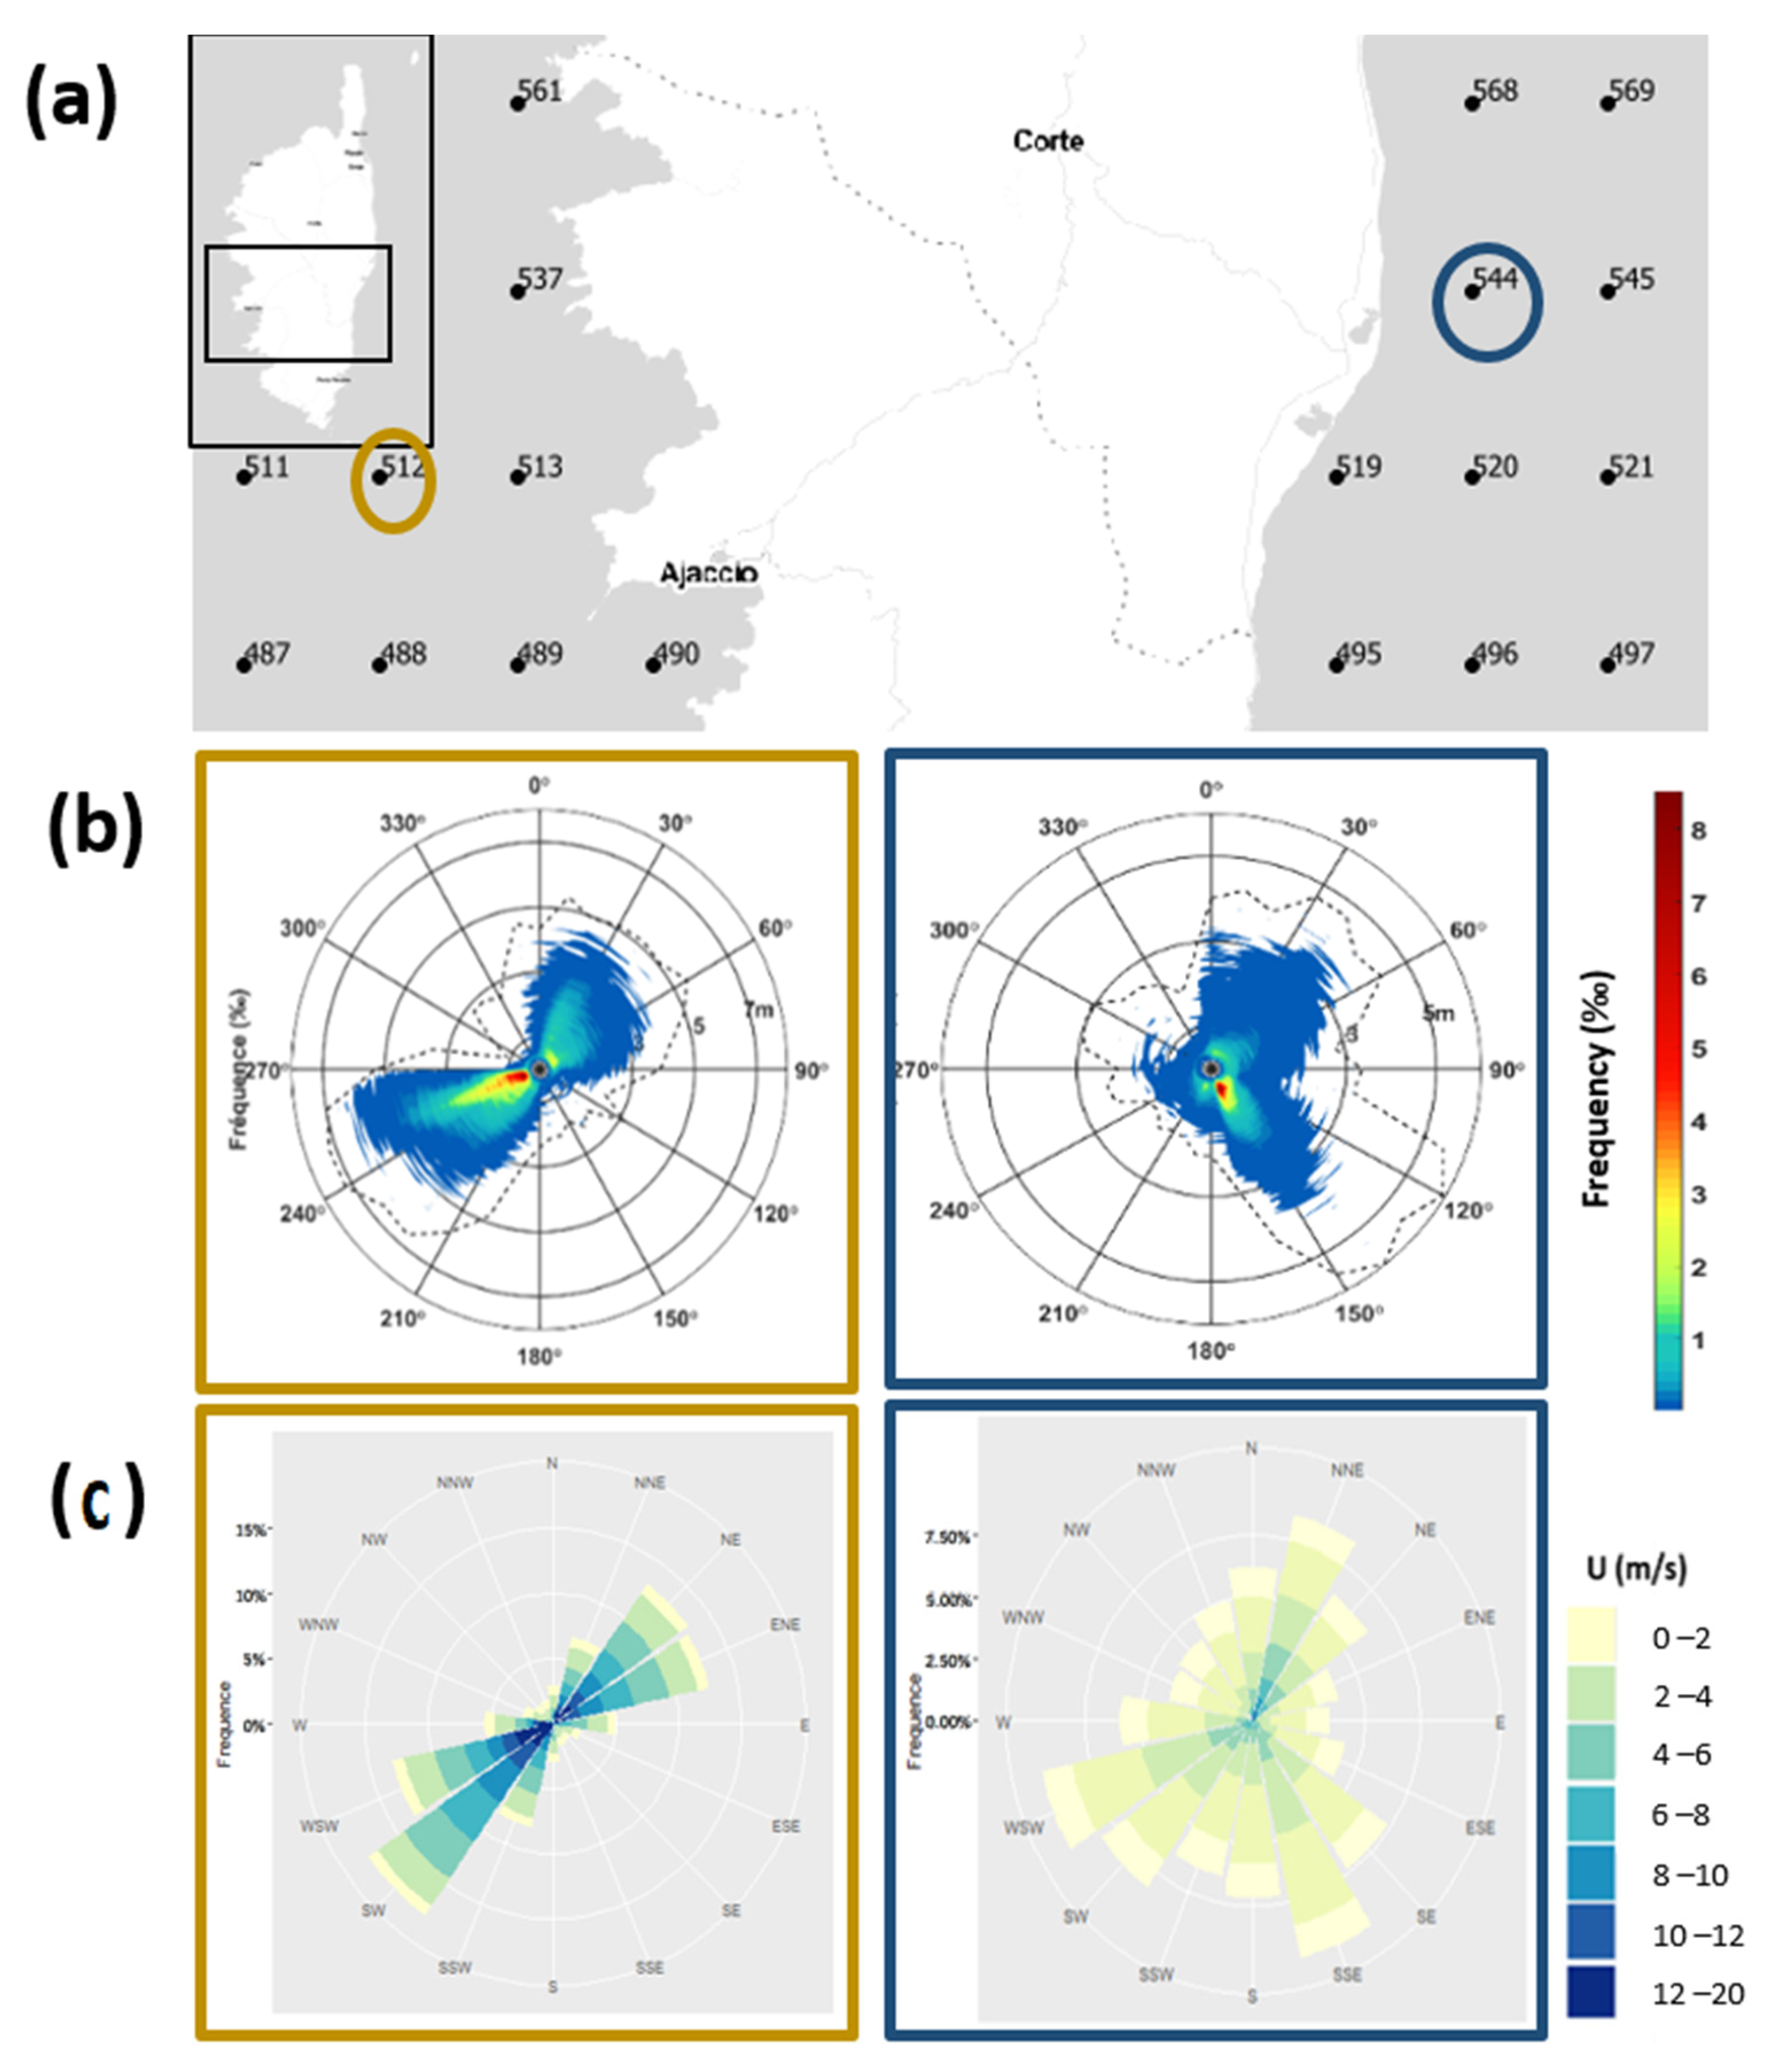
2.1. Site Description and Data Overview
2.2. Statistical and Numerical Strategy
- Selection of events and data set constitution: build a sample with a large number of independent triplets (Hs; SWL; U);
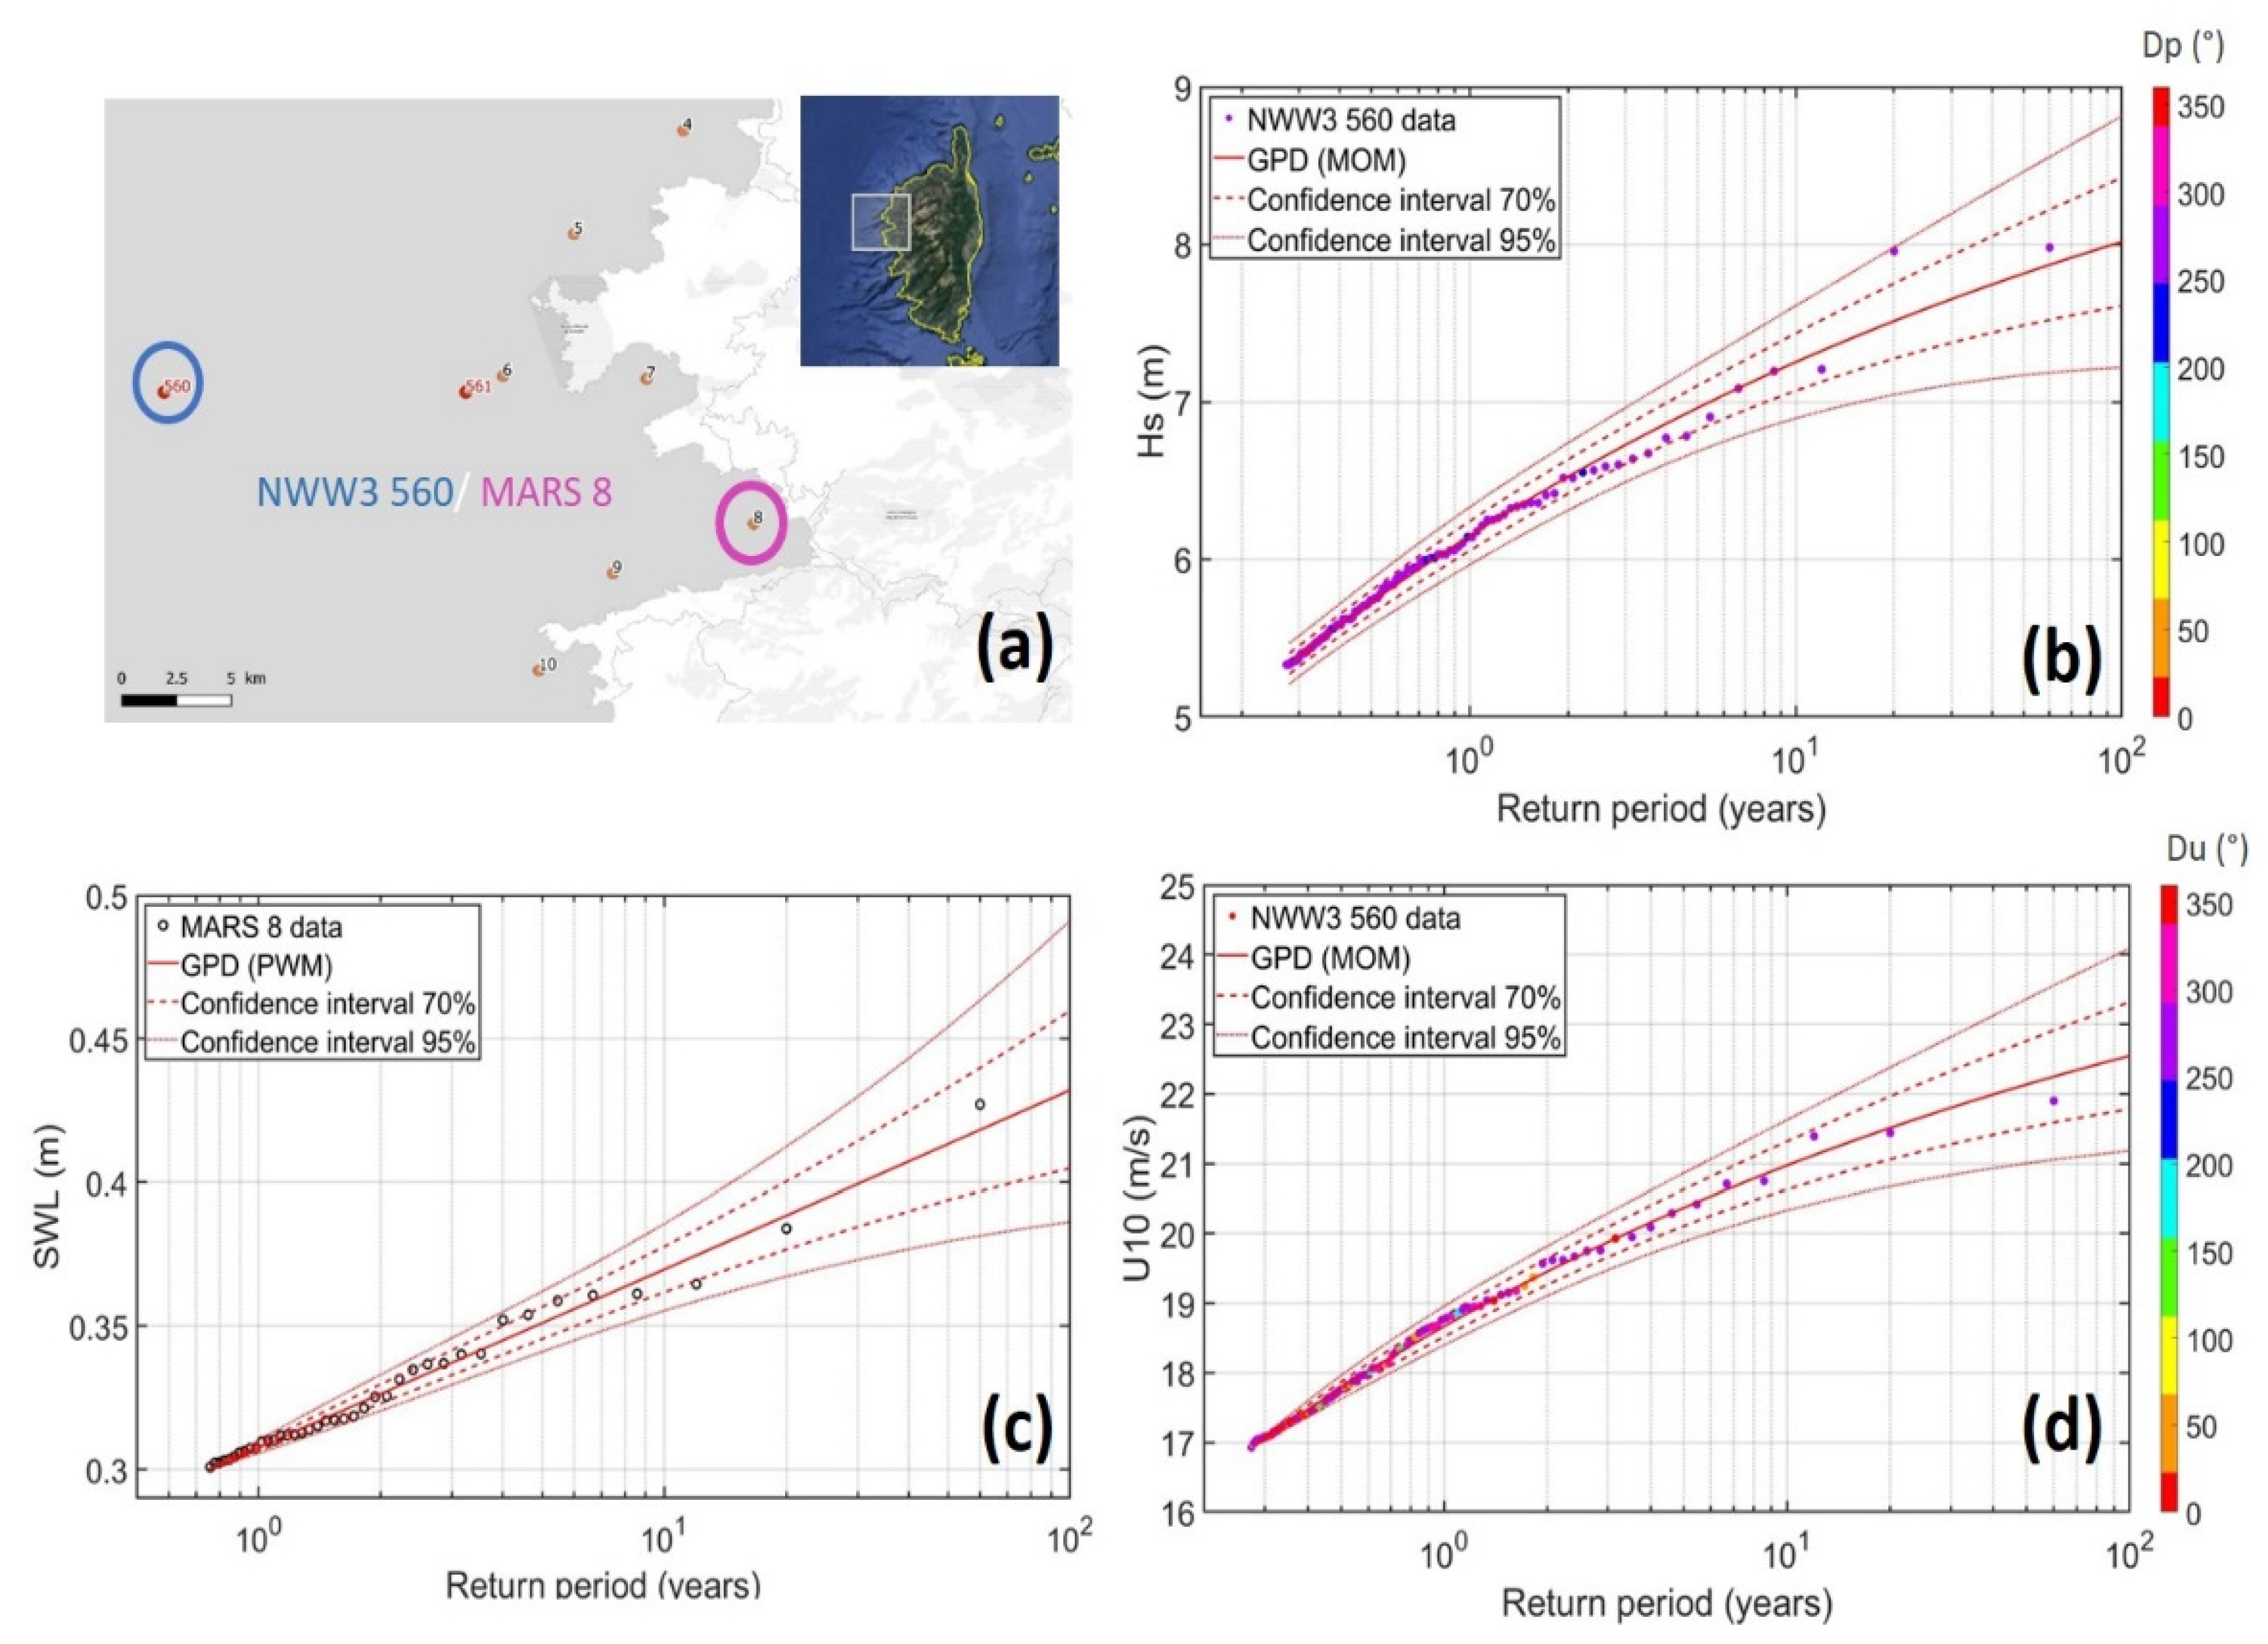
- Fitting of the marginal probability laws for each variable Hs, SWL, and U using the Generalized Pareto Distribution (GPD) with bootstrap simulation for Confidence Interval (CI) [36];
- Dependency model adjustment:
- (a)
- (b)
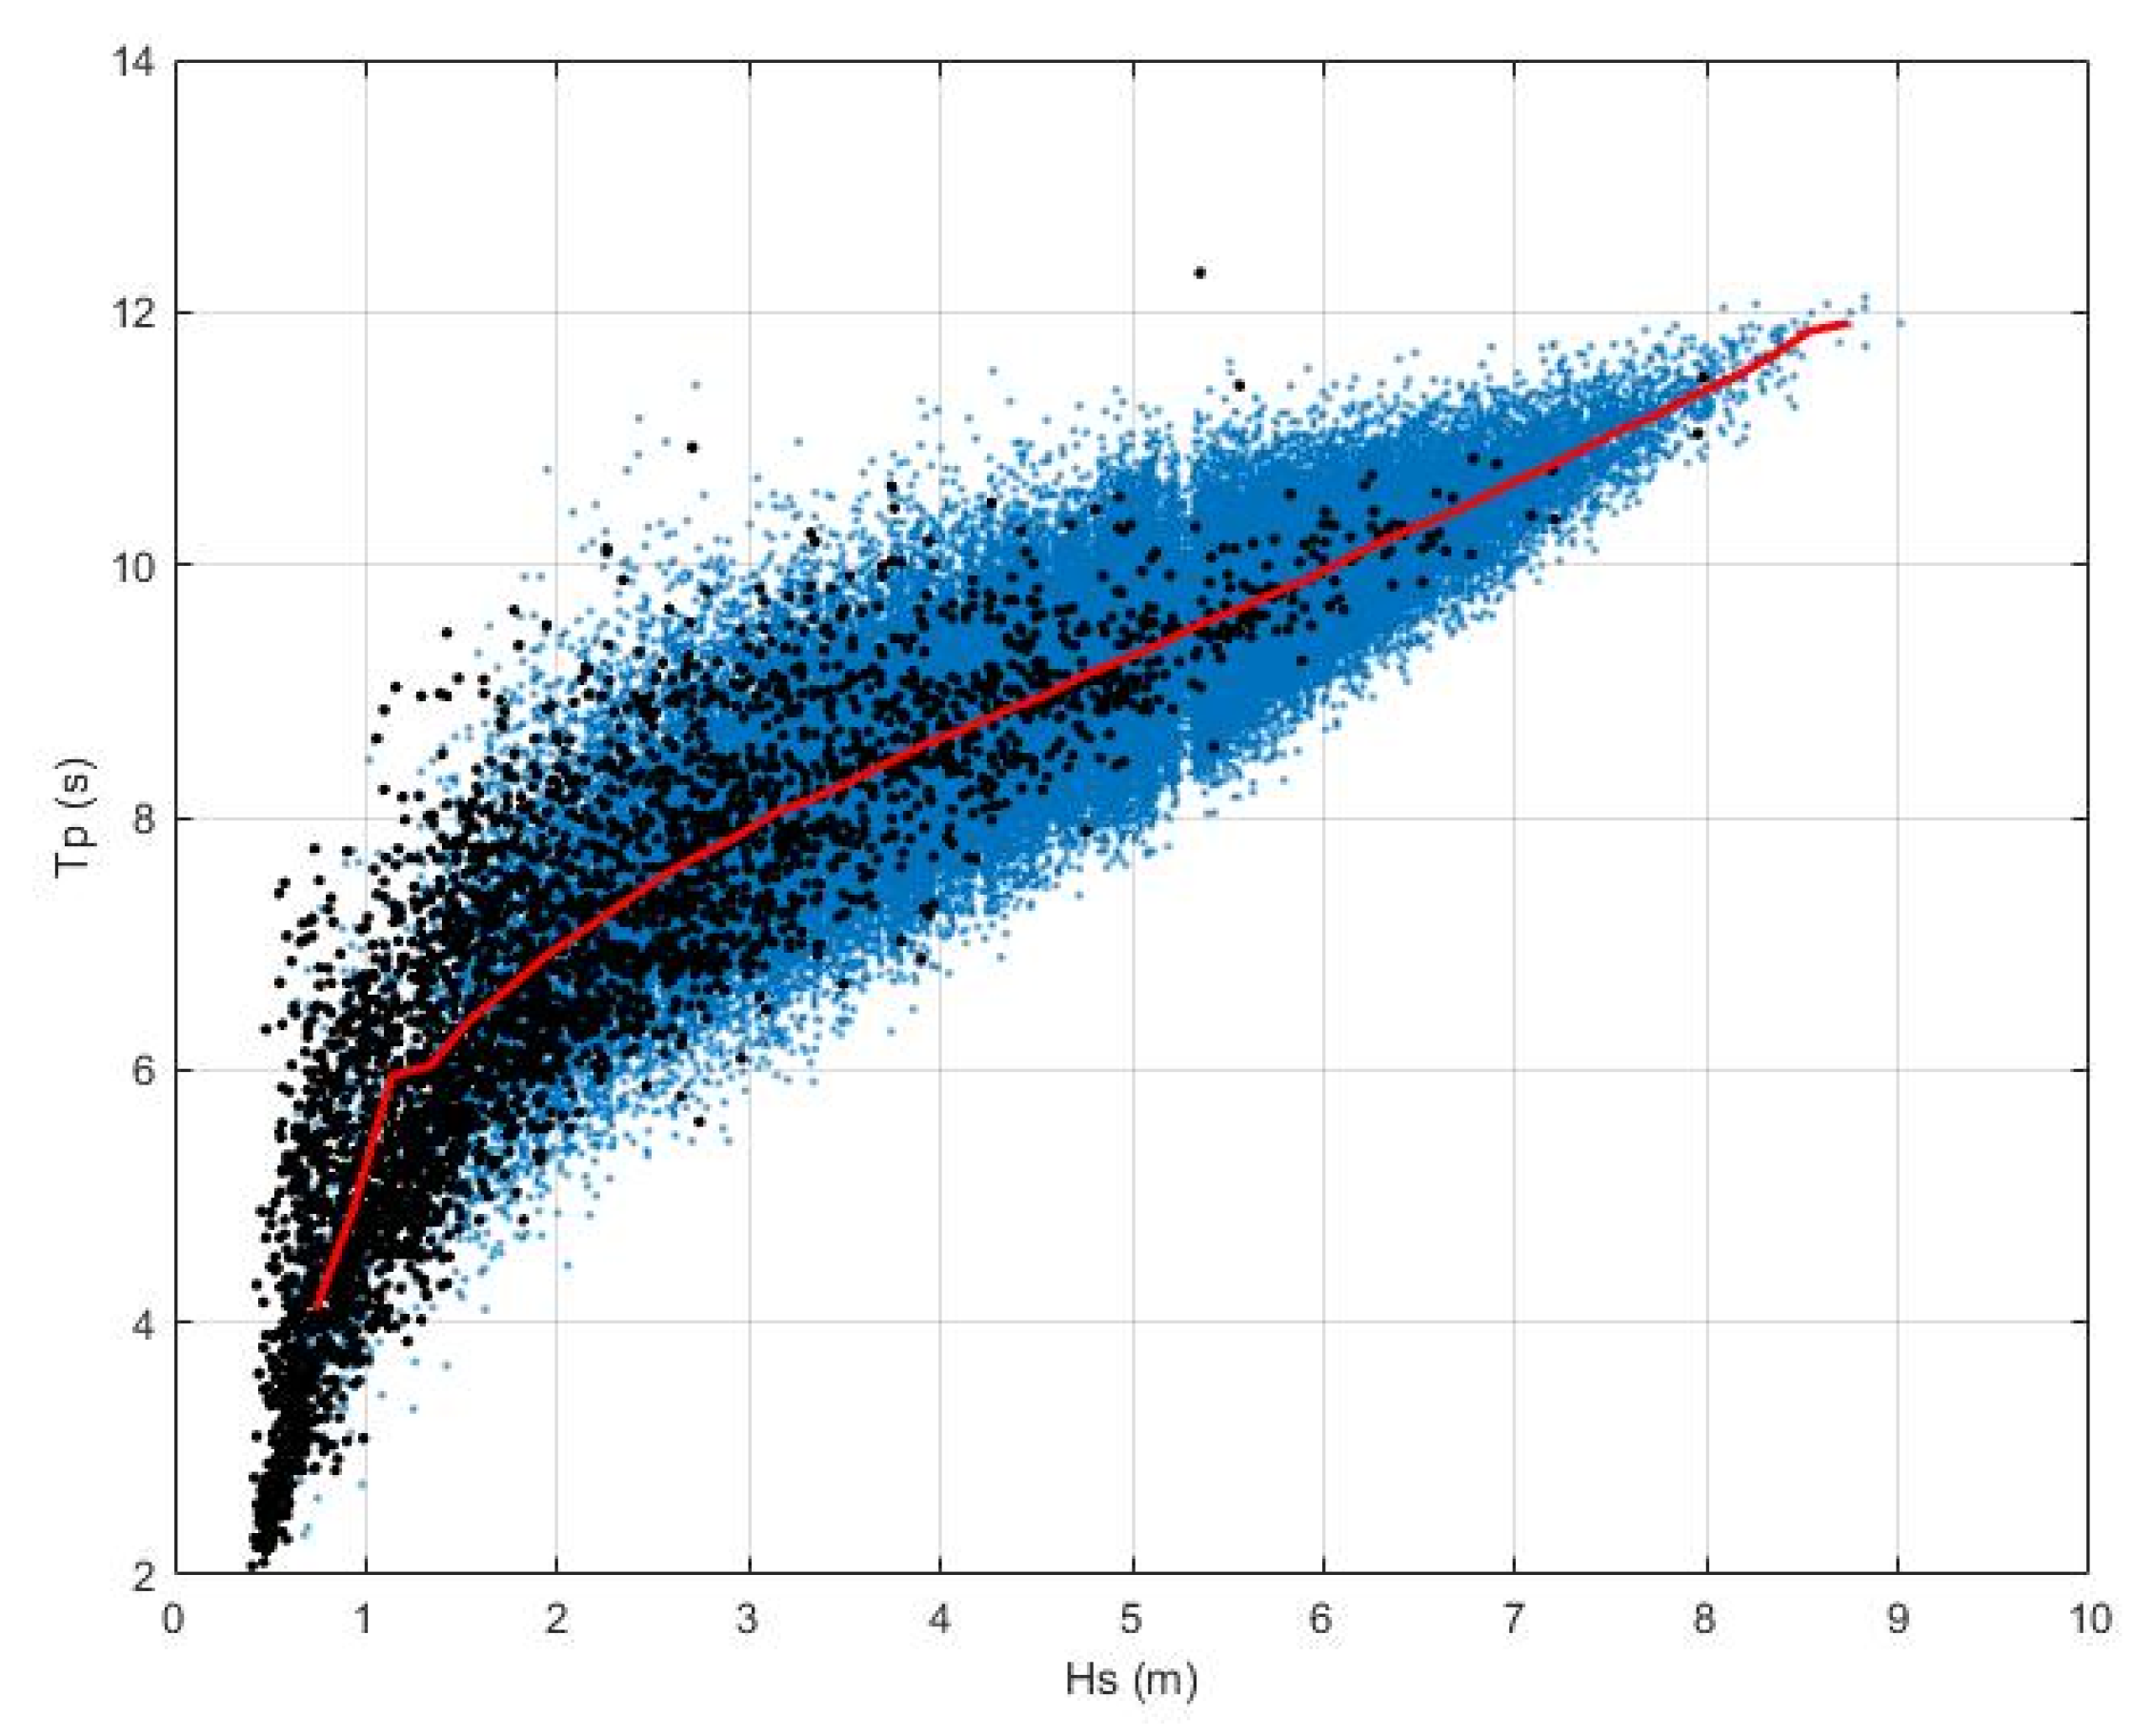
- Between Hs et Tp using the empirical conditional distribution of wave steepness (St) knowing Hs described by [38];
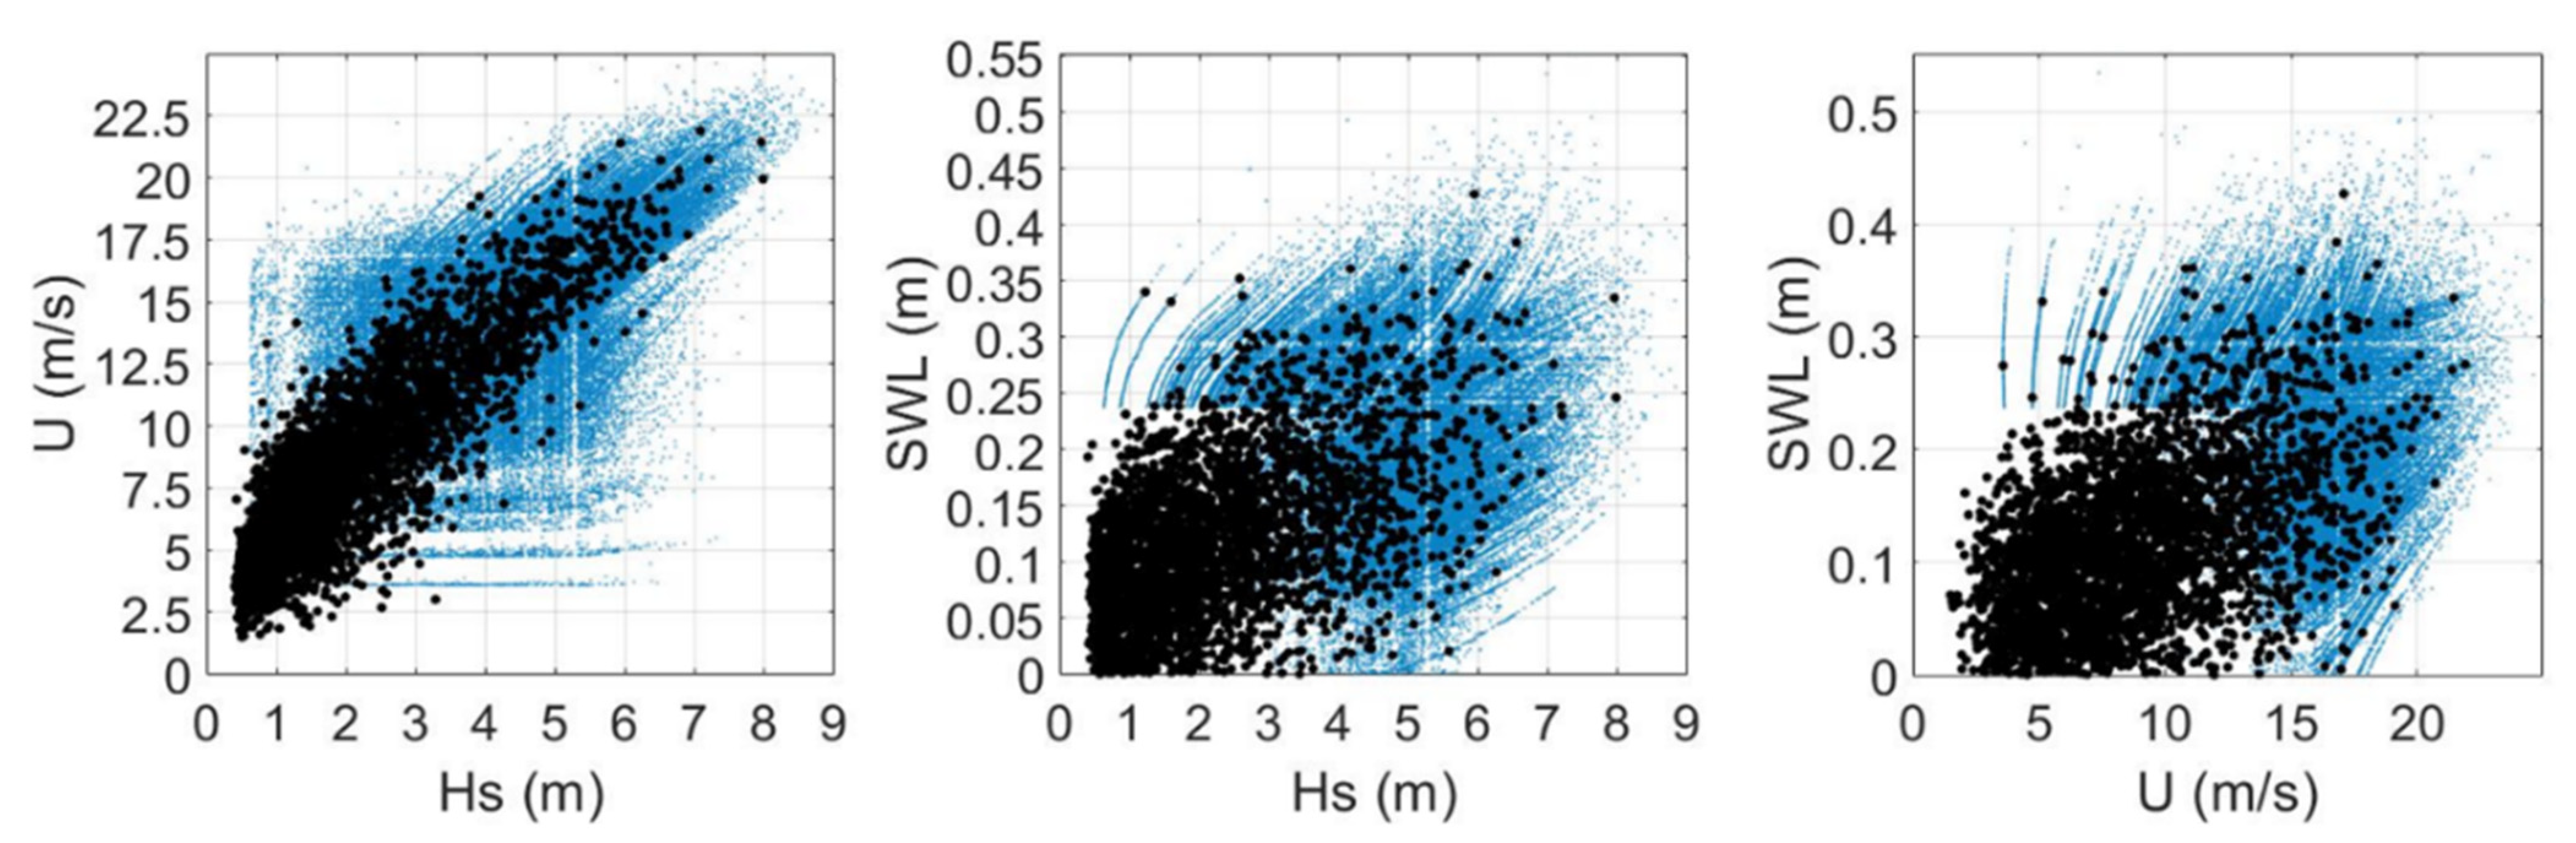
- Running Monte-Carlo simulations using the marginal laws and dependency models of a very large number of combinations (Hs; SWL; U) and their covariates Tp, Dp, Du with the same statistical characteristics as the observed data;
- Determine the triplets (Hs; SWL; U) of the 100-year joint exceedance return period;
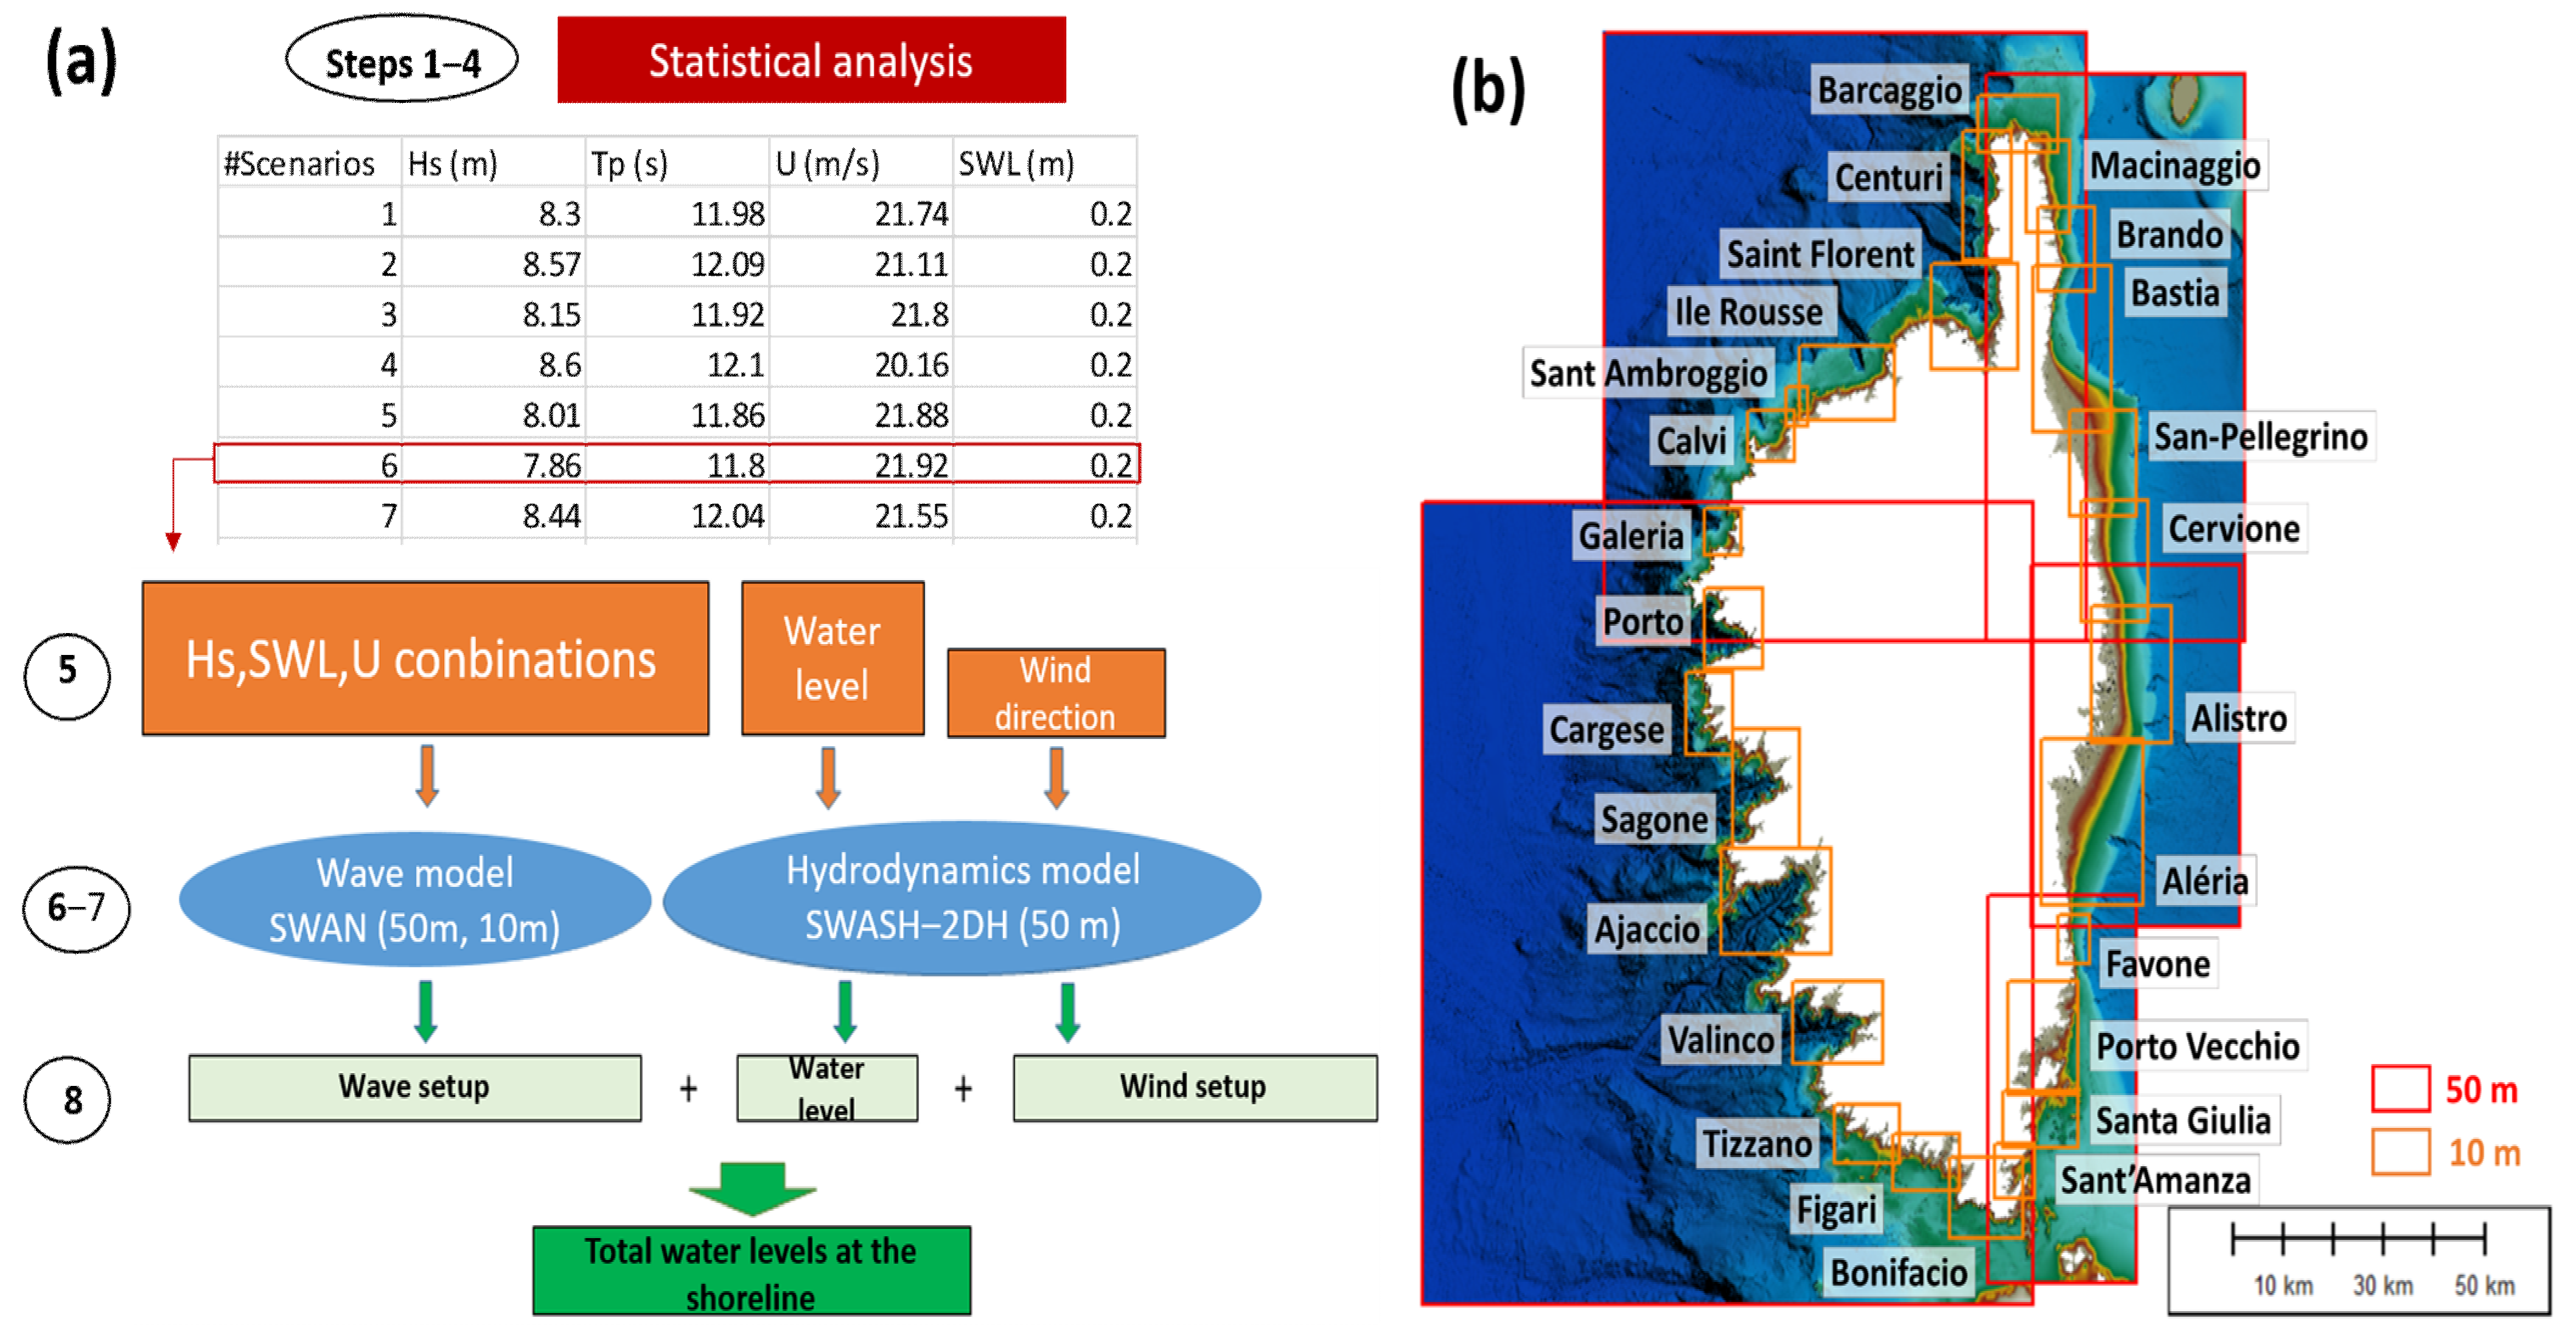
- Running SWAN (Simulating Waves Nearshore) and SWASH-2DH (Simulating WAves till SHore) models for 50 m resolution grids (in red in Figure 2b) forced with 100-year triplets + covariates Tp, Dp, Du + safety margins for water level (i.e., sea level rise SLR + uncertainties);
- Dynamical downscaling by running SWAN model for the 10 m resolution nested boxes (in orange in Figure 2b). SWAN is here forced by the outputs of step 6;
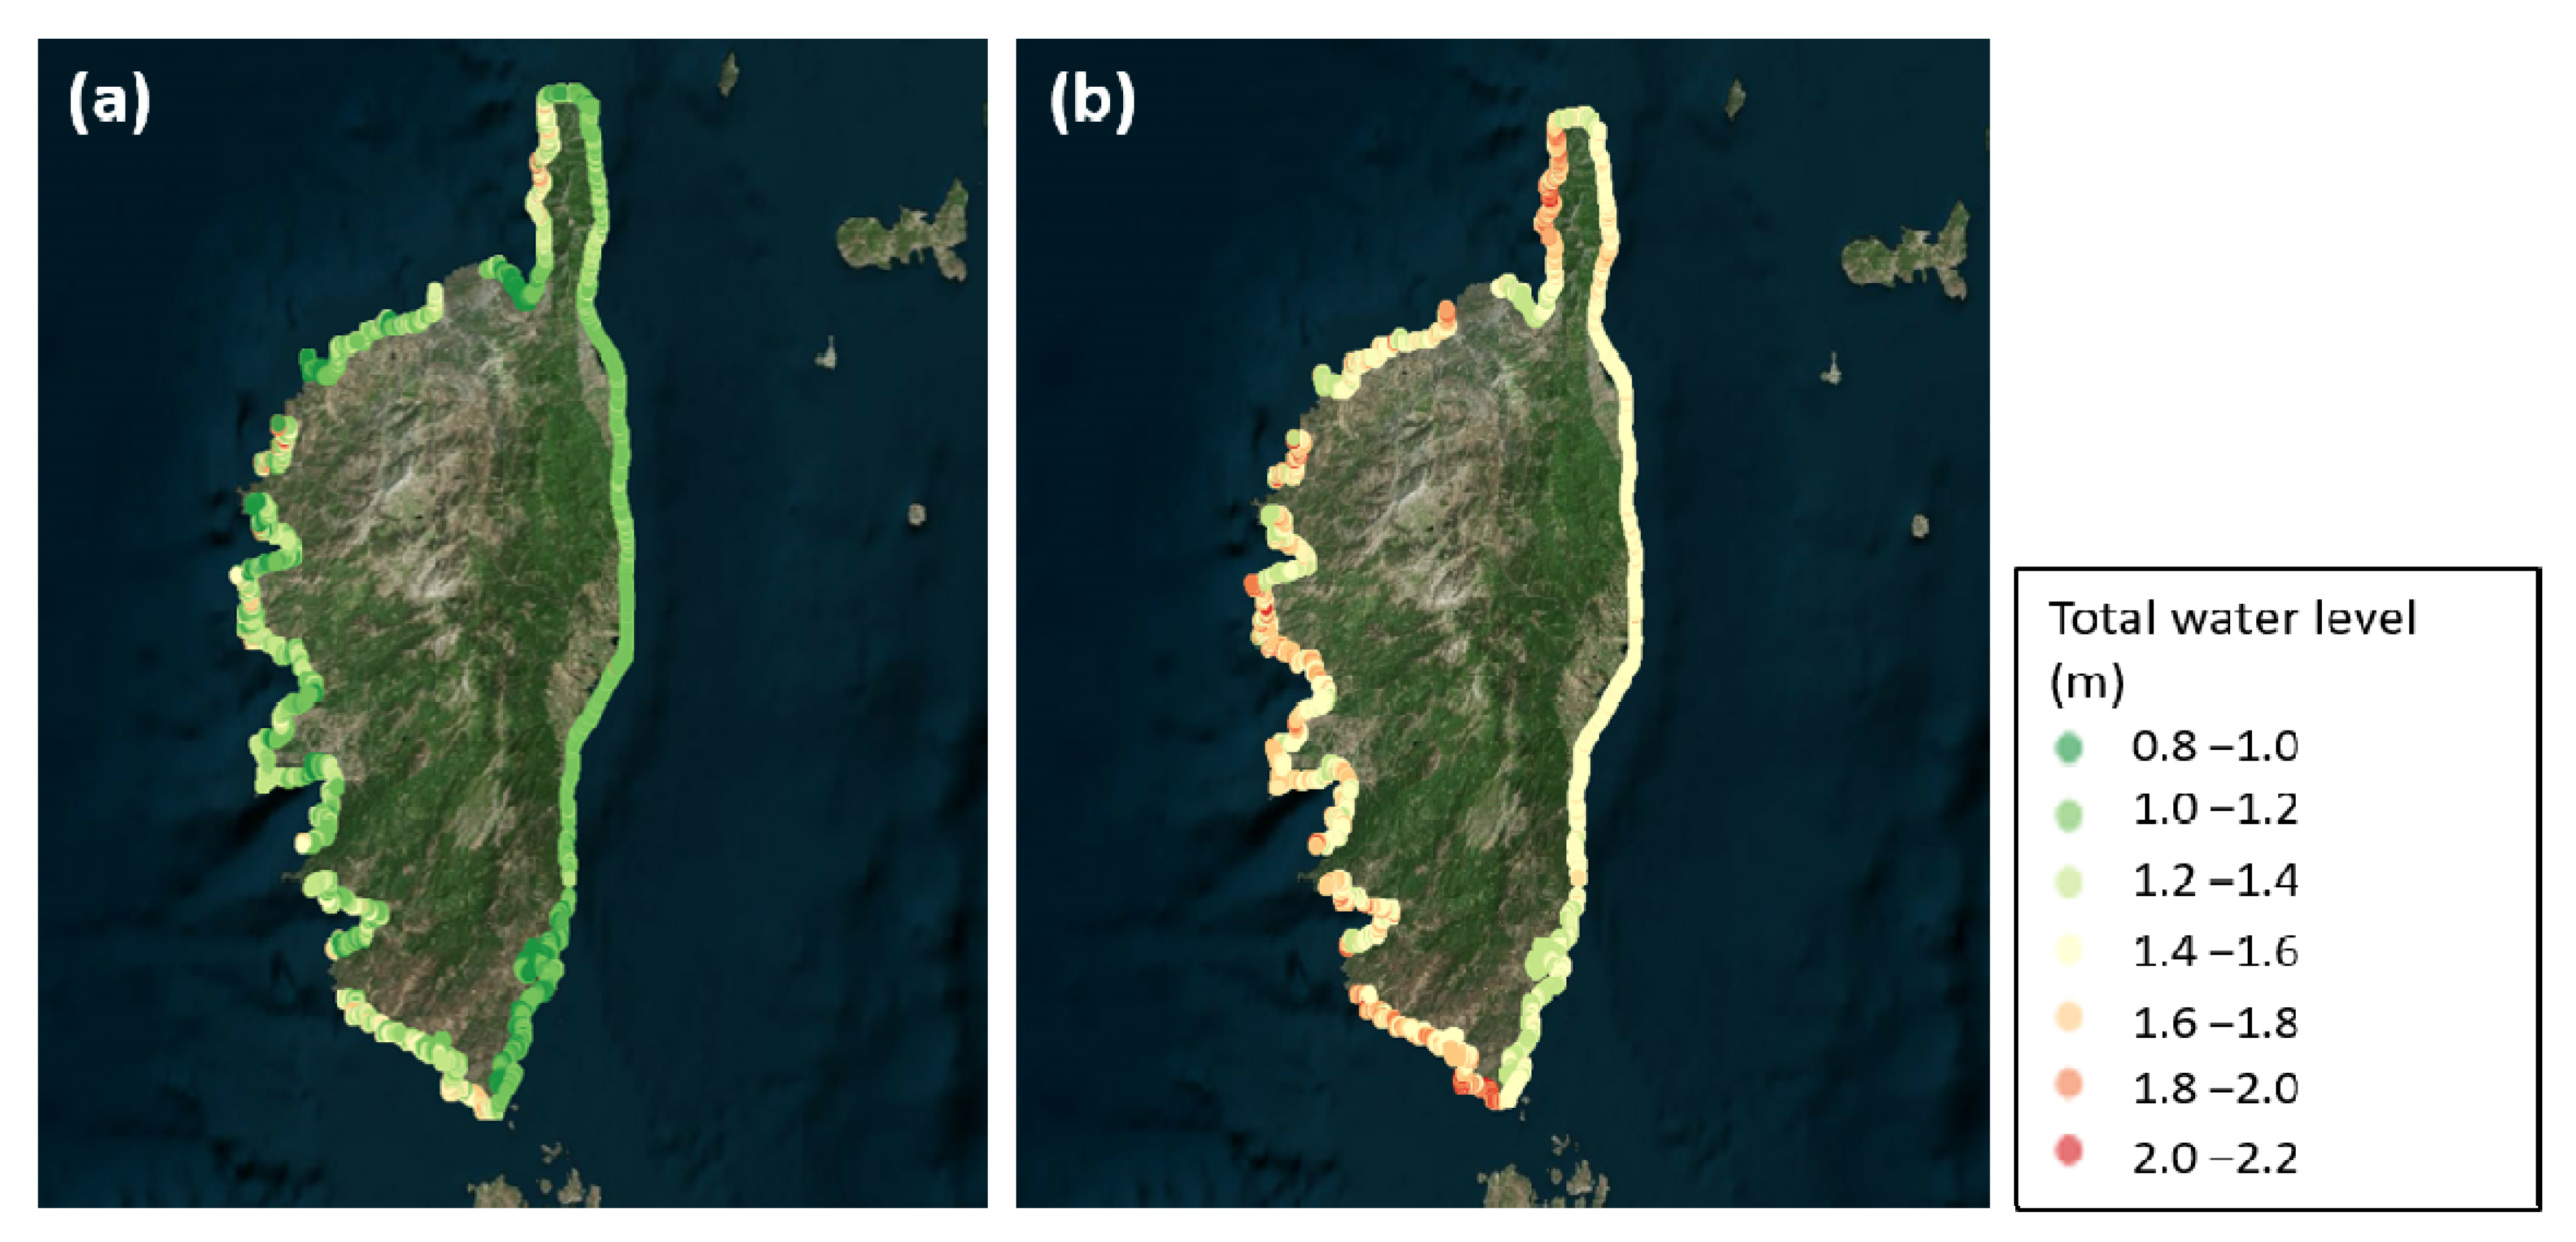
- Assess the total water level (TWL) at the shoreline adding contributions coming from the models: wave setup provided by SWAN and wind setup by SWASH-2DH.
- (i)
- Present-day conditions: 100-year triplets/covariates + 0.2 m SLR + 0.25 m uncertainties;
- (ii)
- “2100” future conditions: 100-year triplets/covariates + 0.6 m SLR + 0.25 m uncertainties.
3. Multivariate Extreme Value Analysis
3.1. Selection of Events and Dataset Set Up (Step 1)
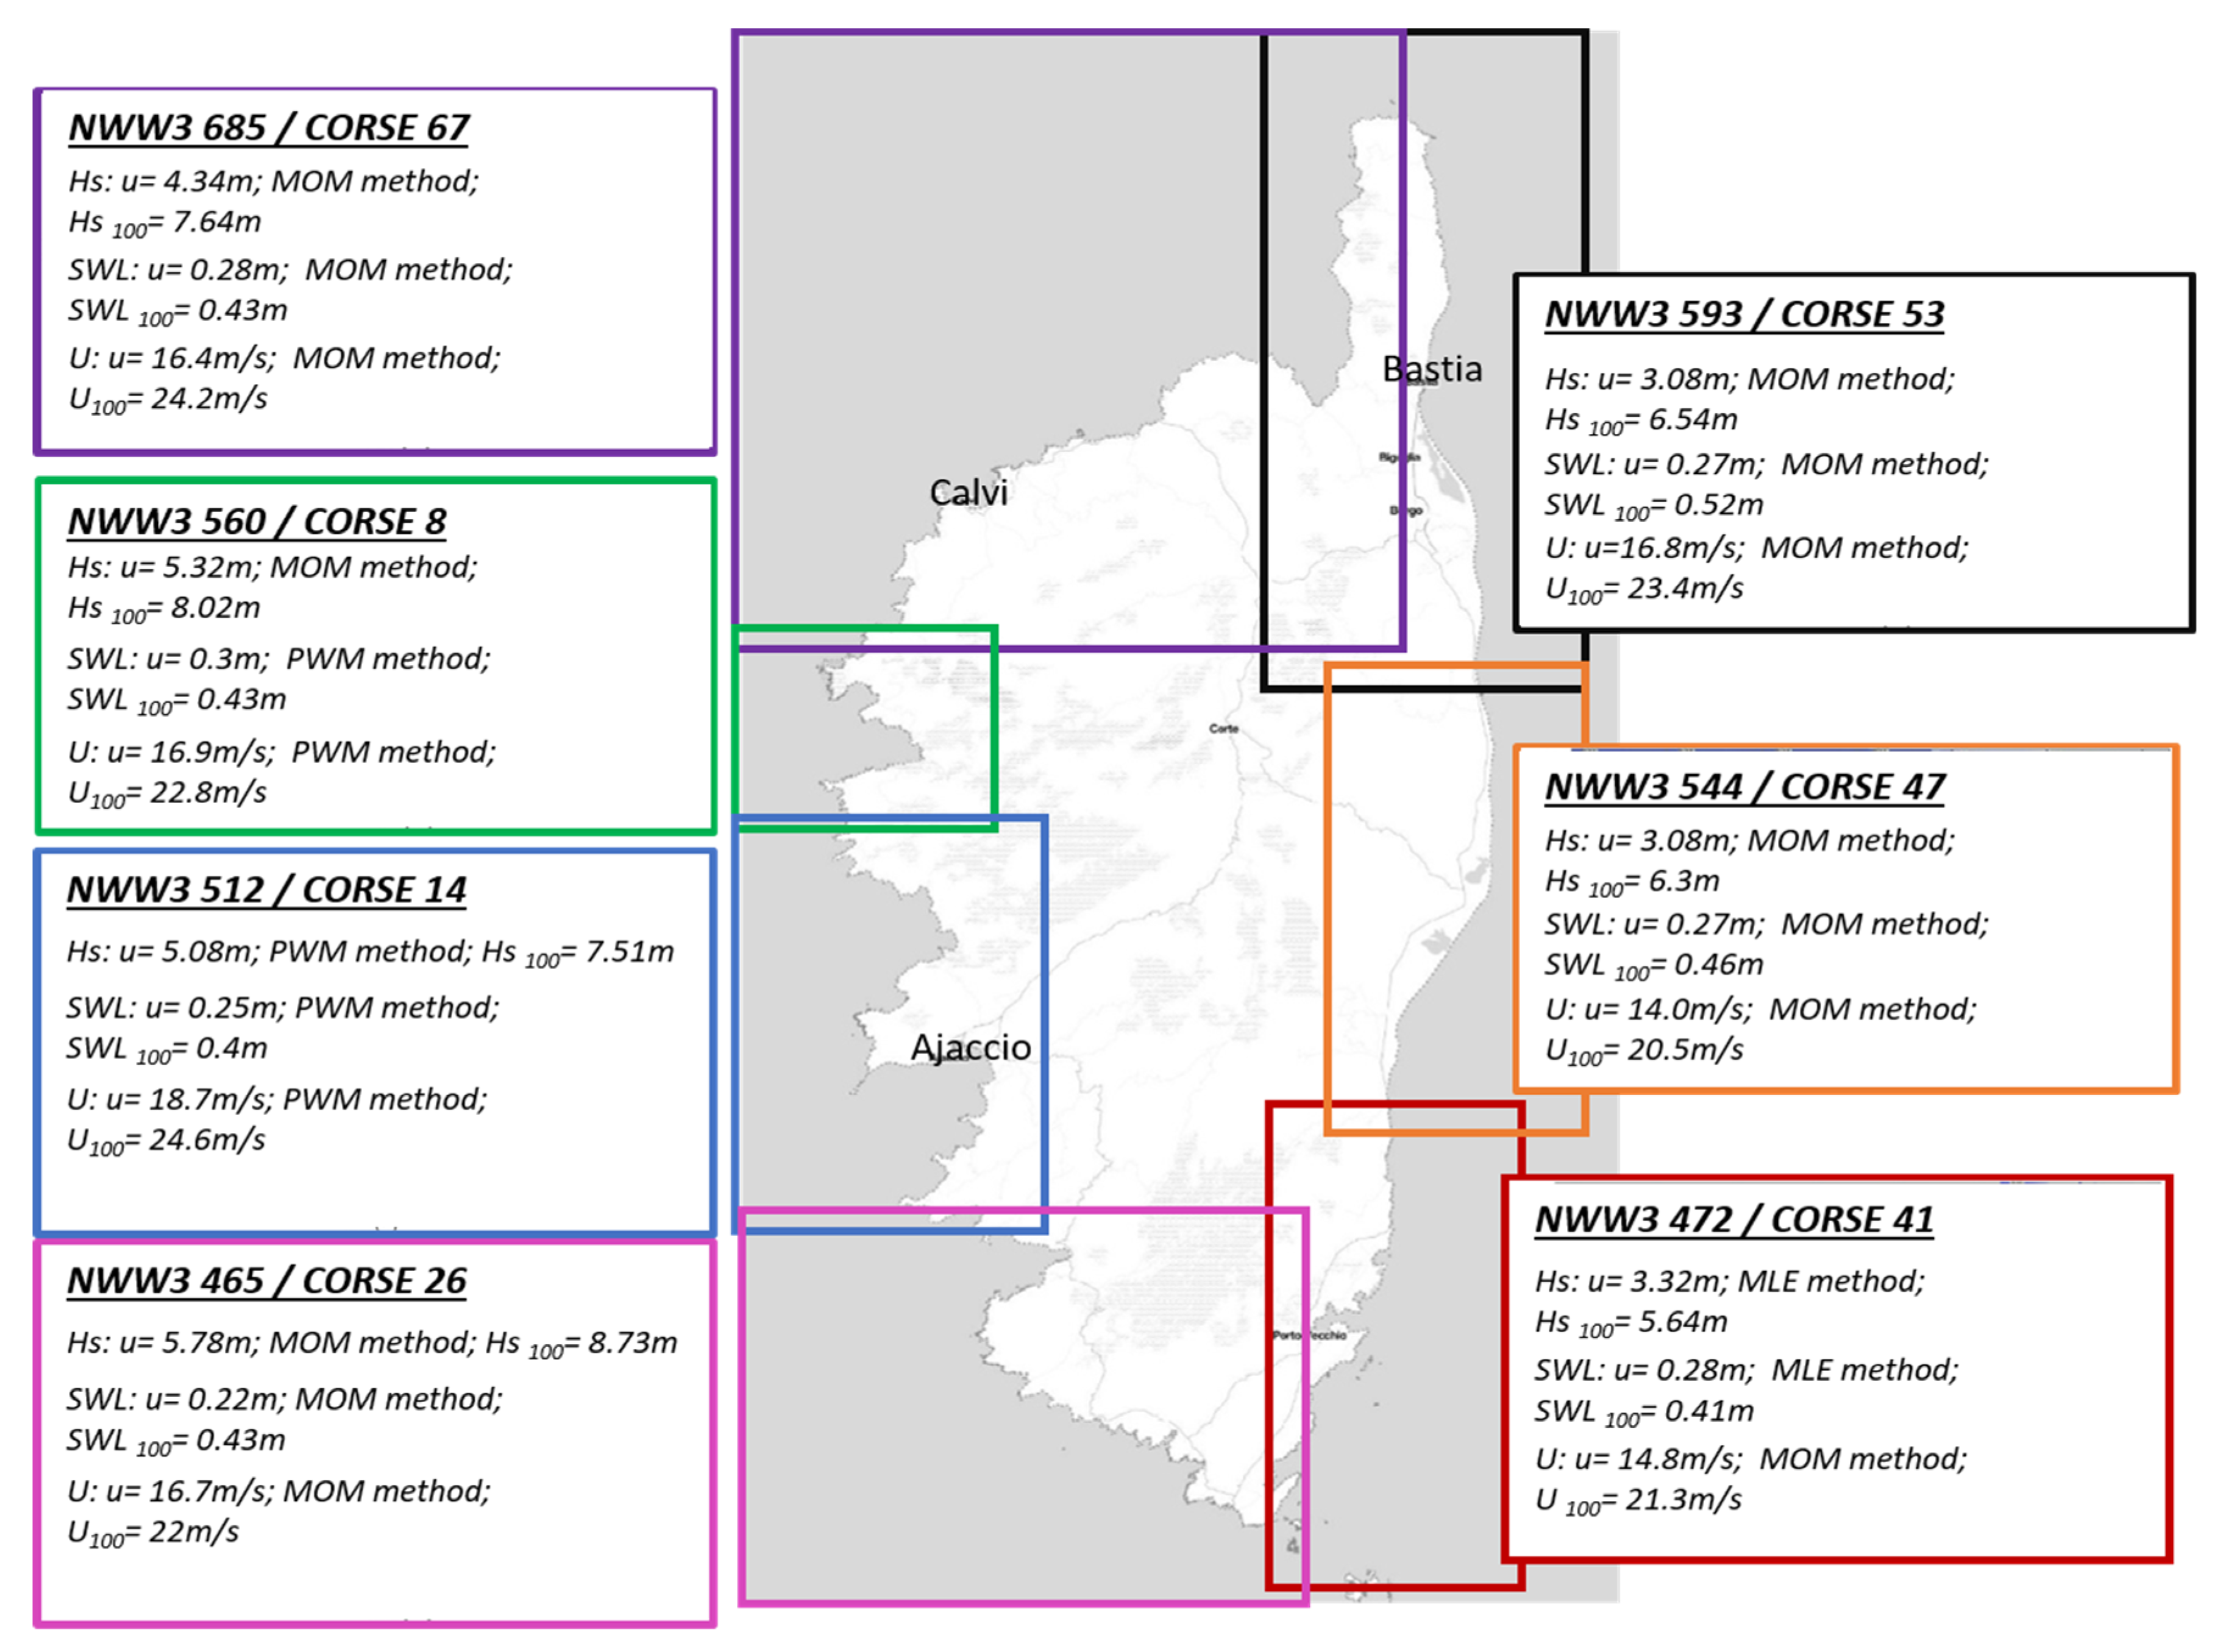
3.2. Marginal Distributions (Step 2)
3.3. Defining the Multivariate Scenarios (Steps 3–5)
3.3.1. Dependency Modeling and Monte Carlo Simulations
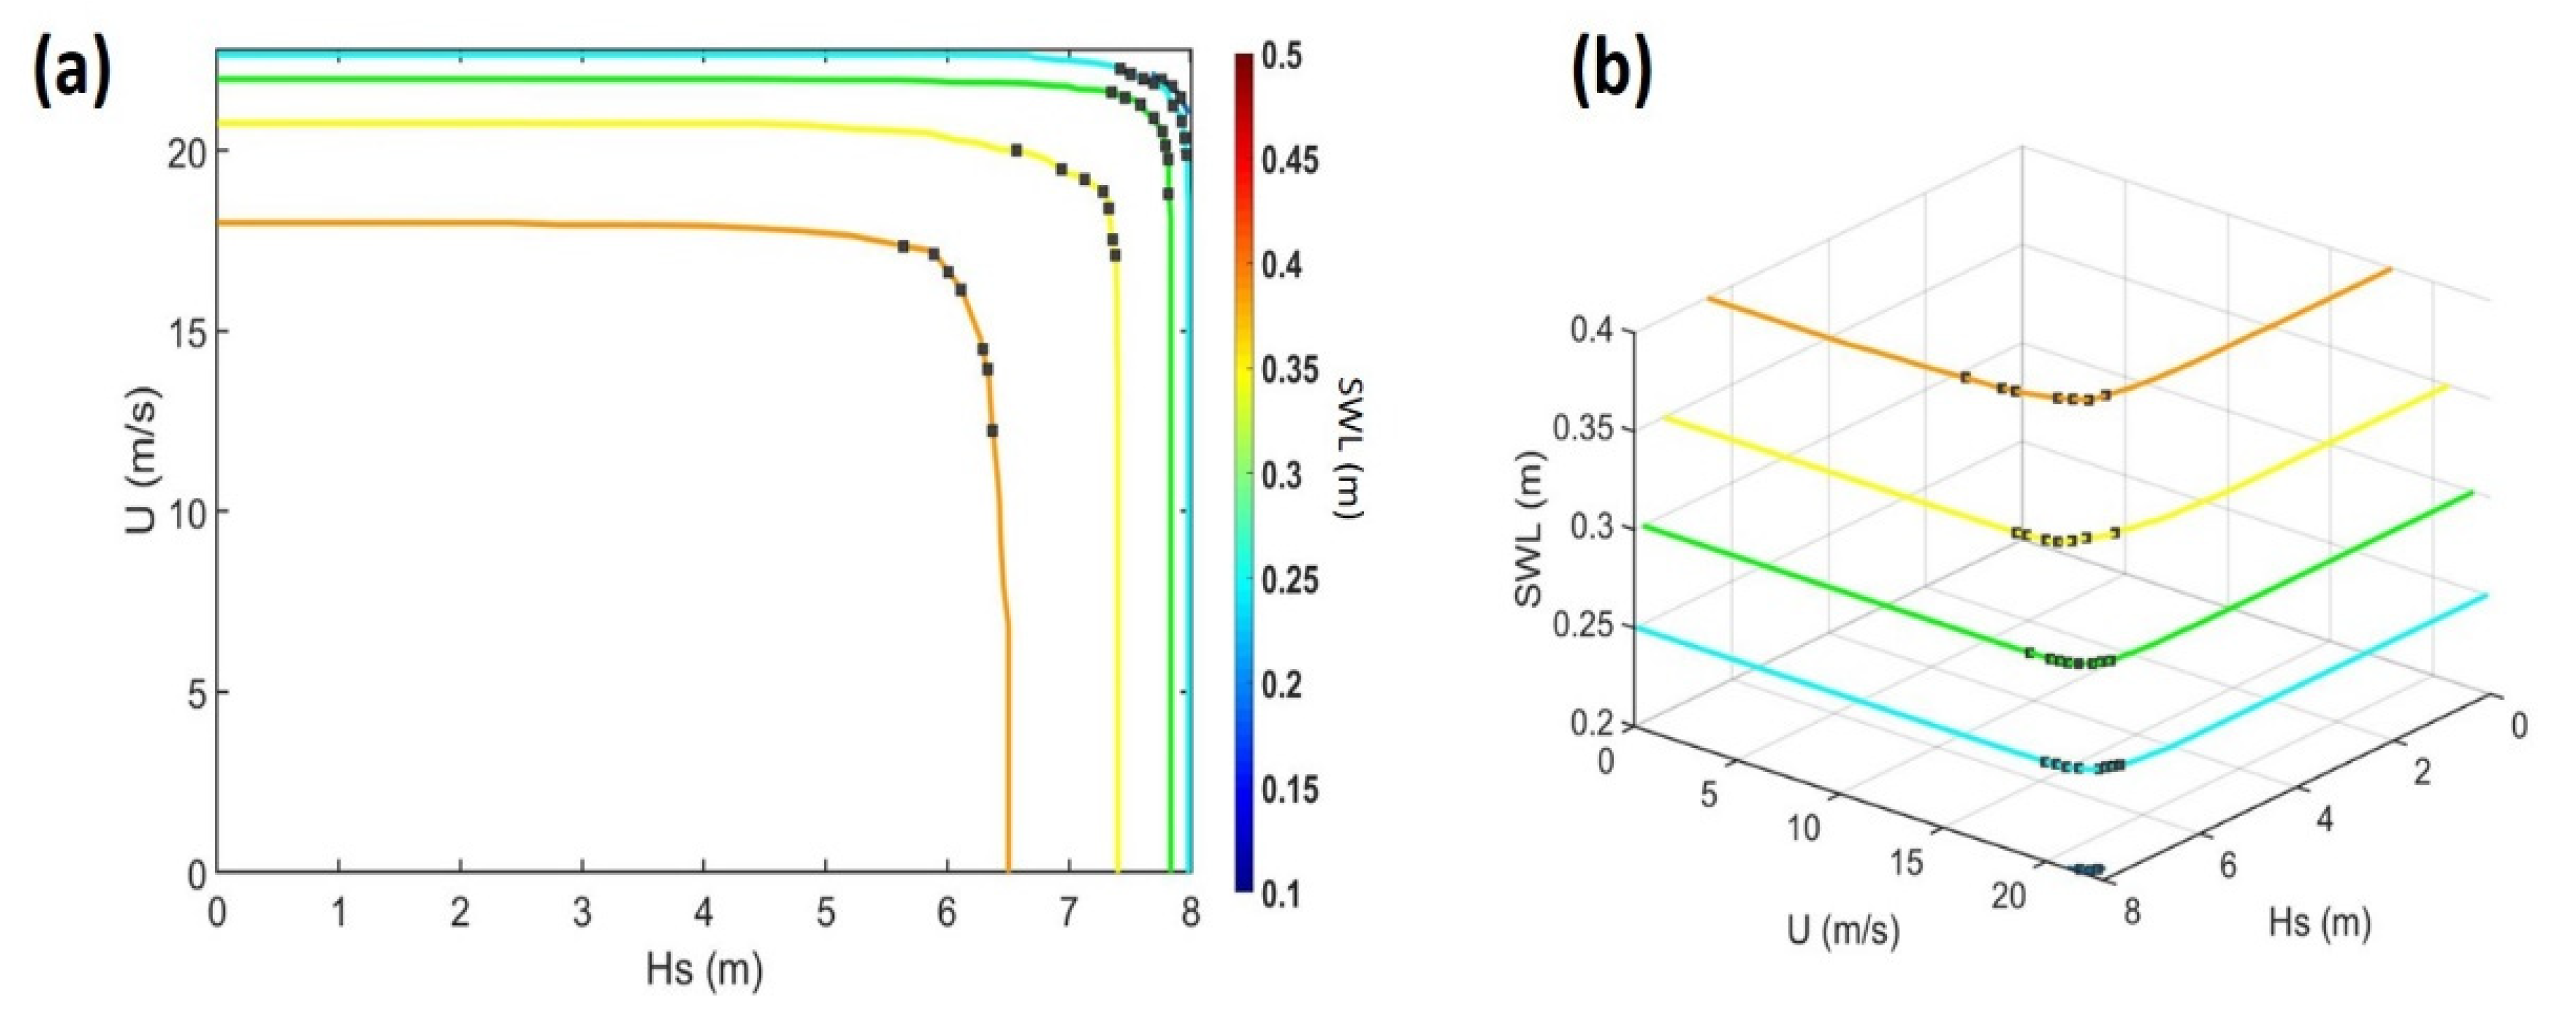
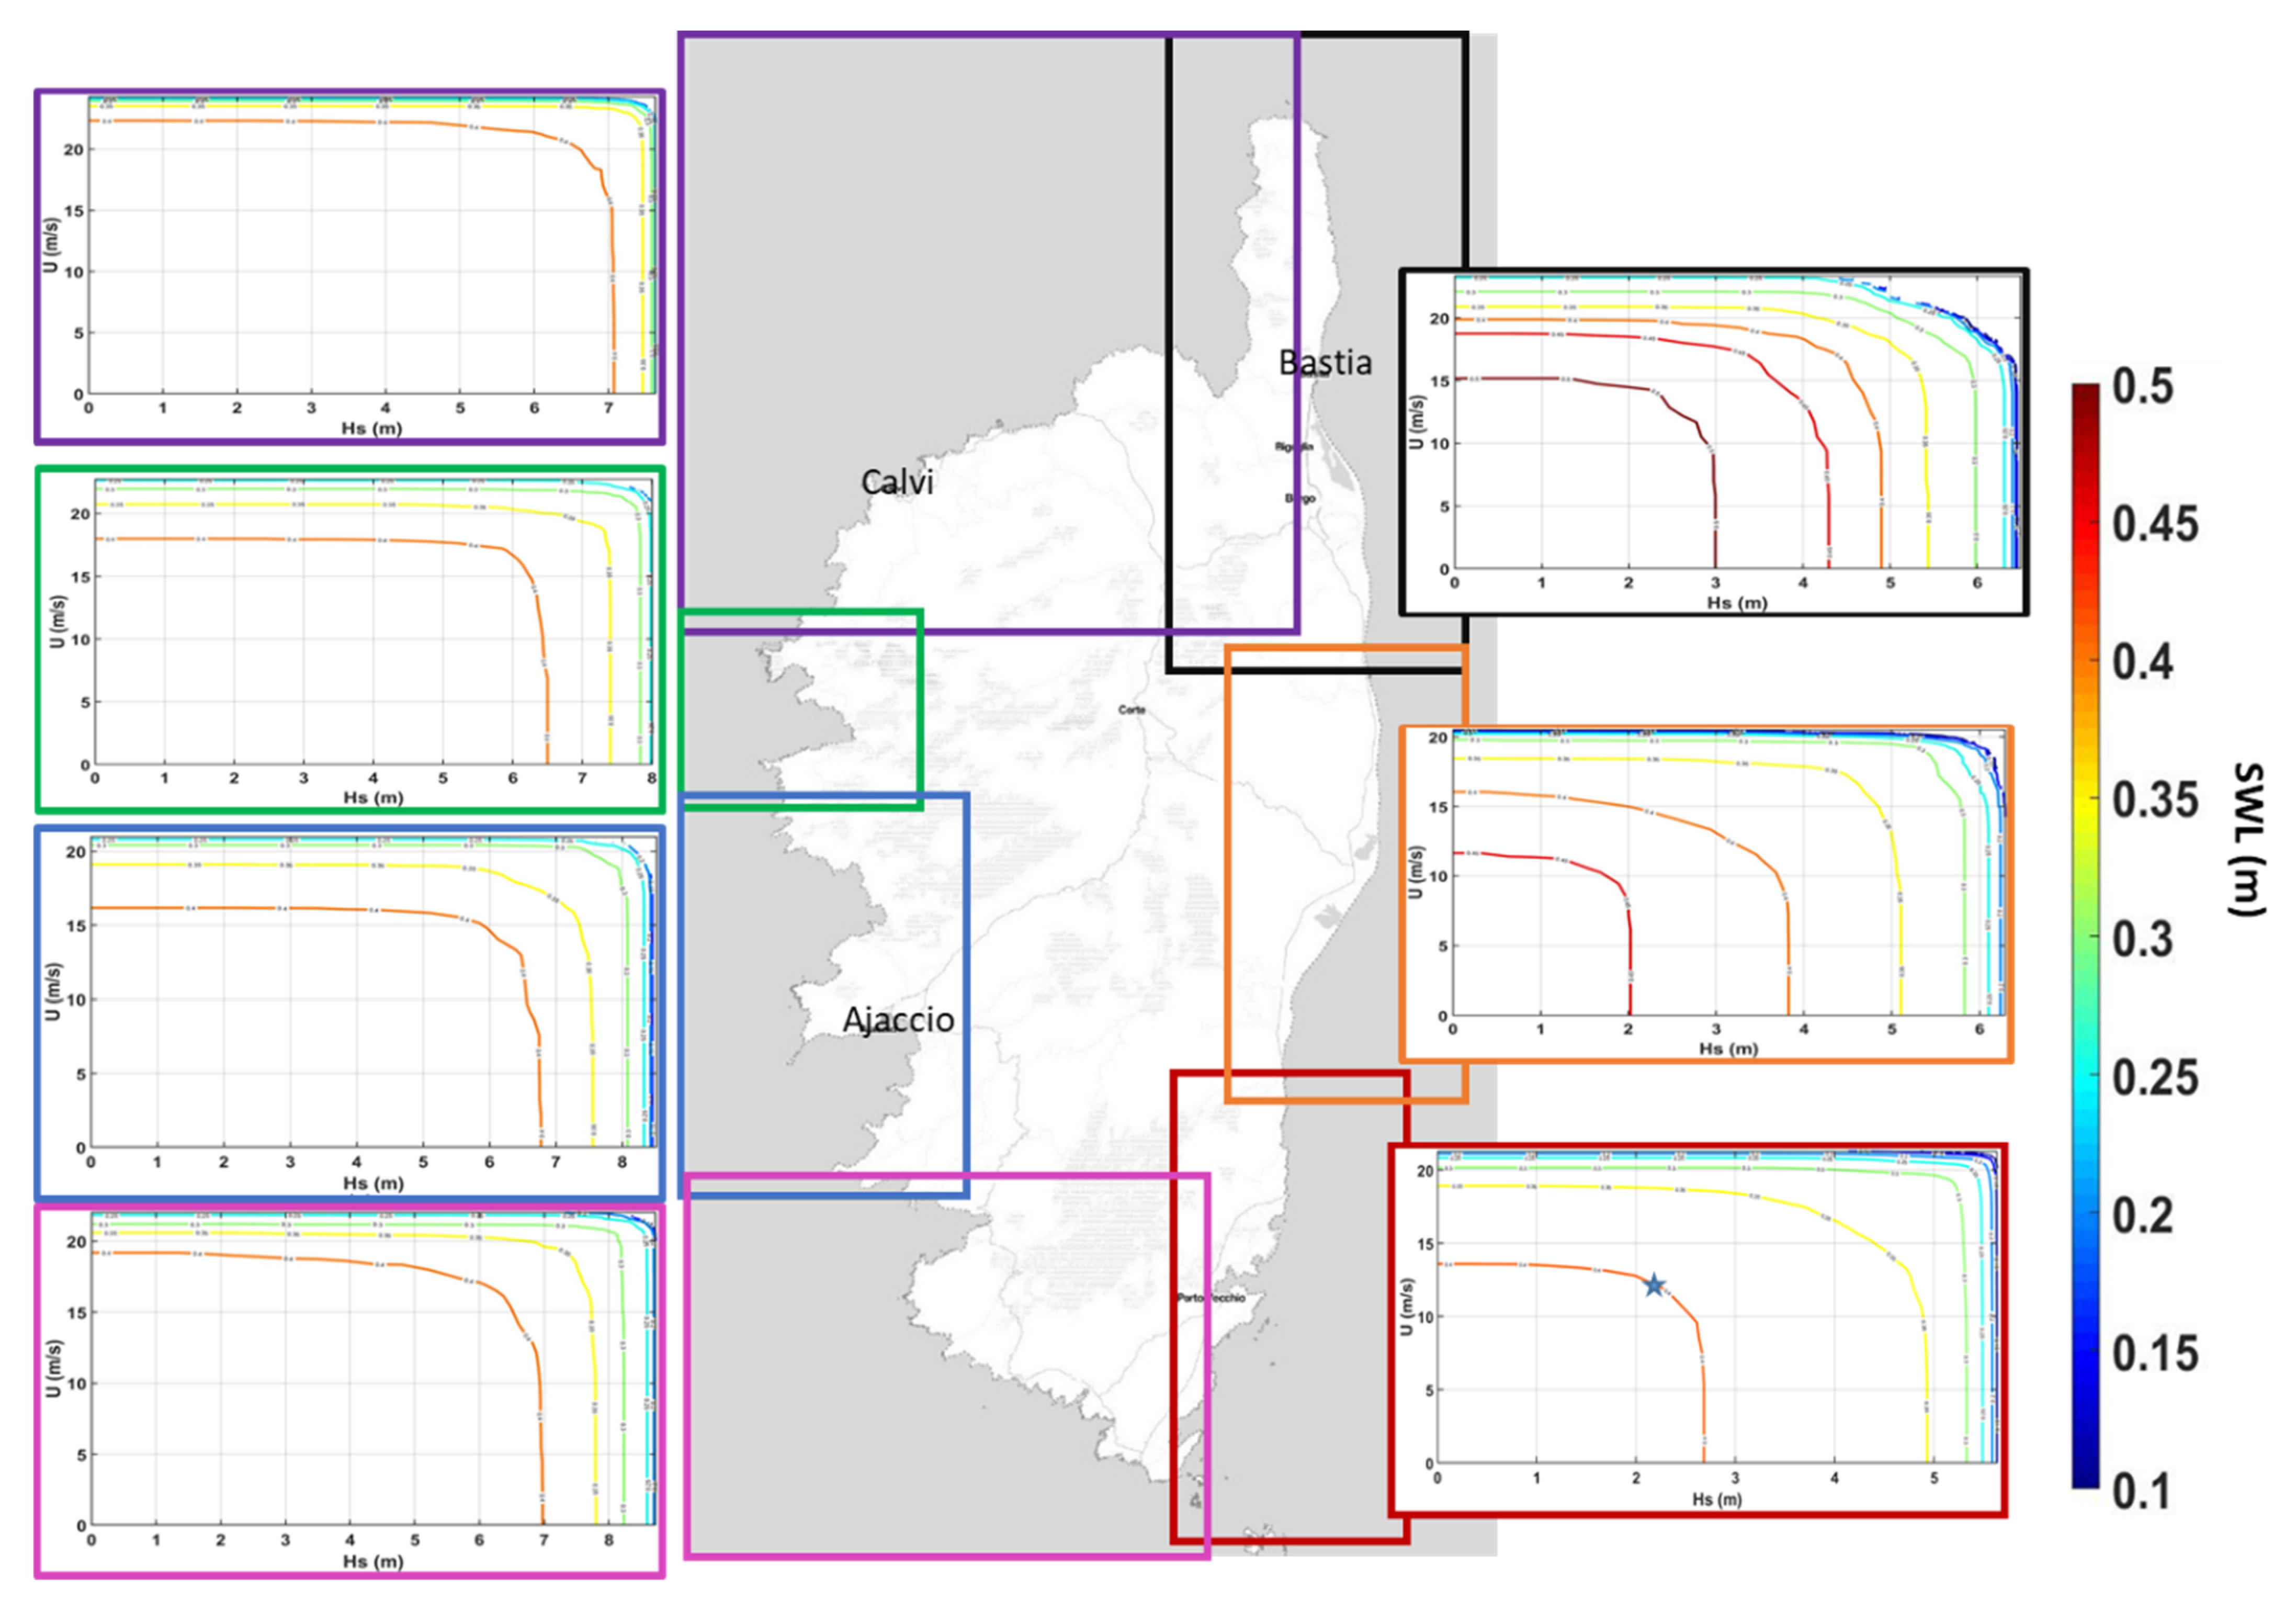
3.3.2. Joint Probability Contours
3.3.3. Covariates
4. Results
5. Discussion and Conclusions
Author Contributions
Funding
Institutional Review Board Statement
Informed Consent Statement
Data Availability Statement
Acknowledgments
Conflicts of Interest
Appendix A. Validation of the Numerical Models


Appendix B. Elements Used for Adjusting Marginal Probability Distributions for Hs, SWL, and U around Corsica

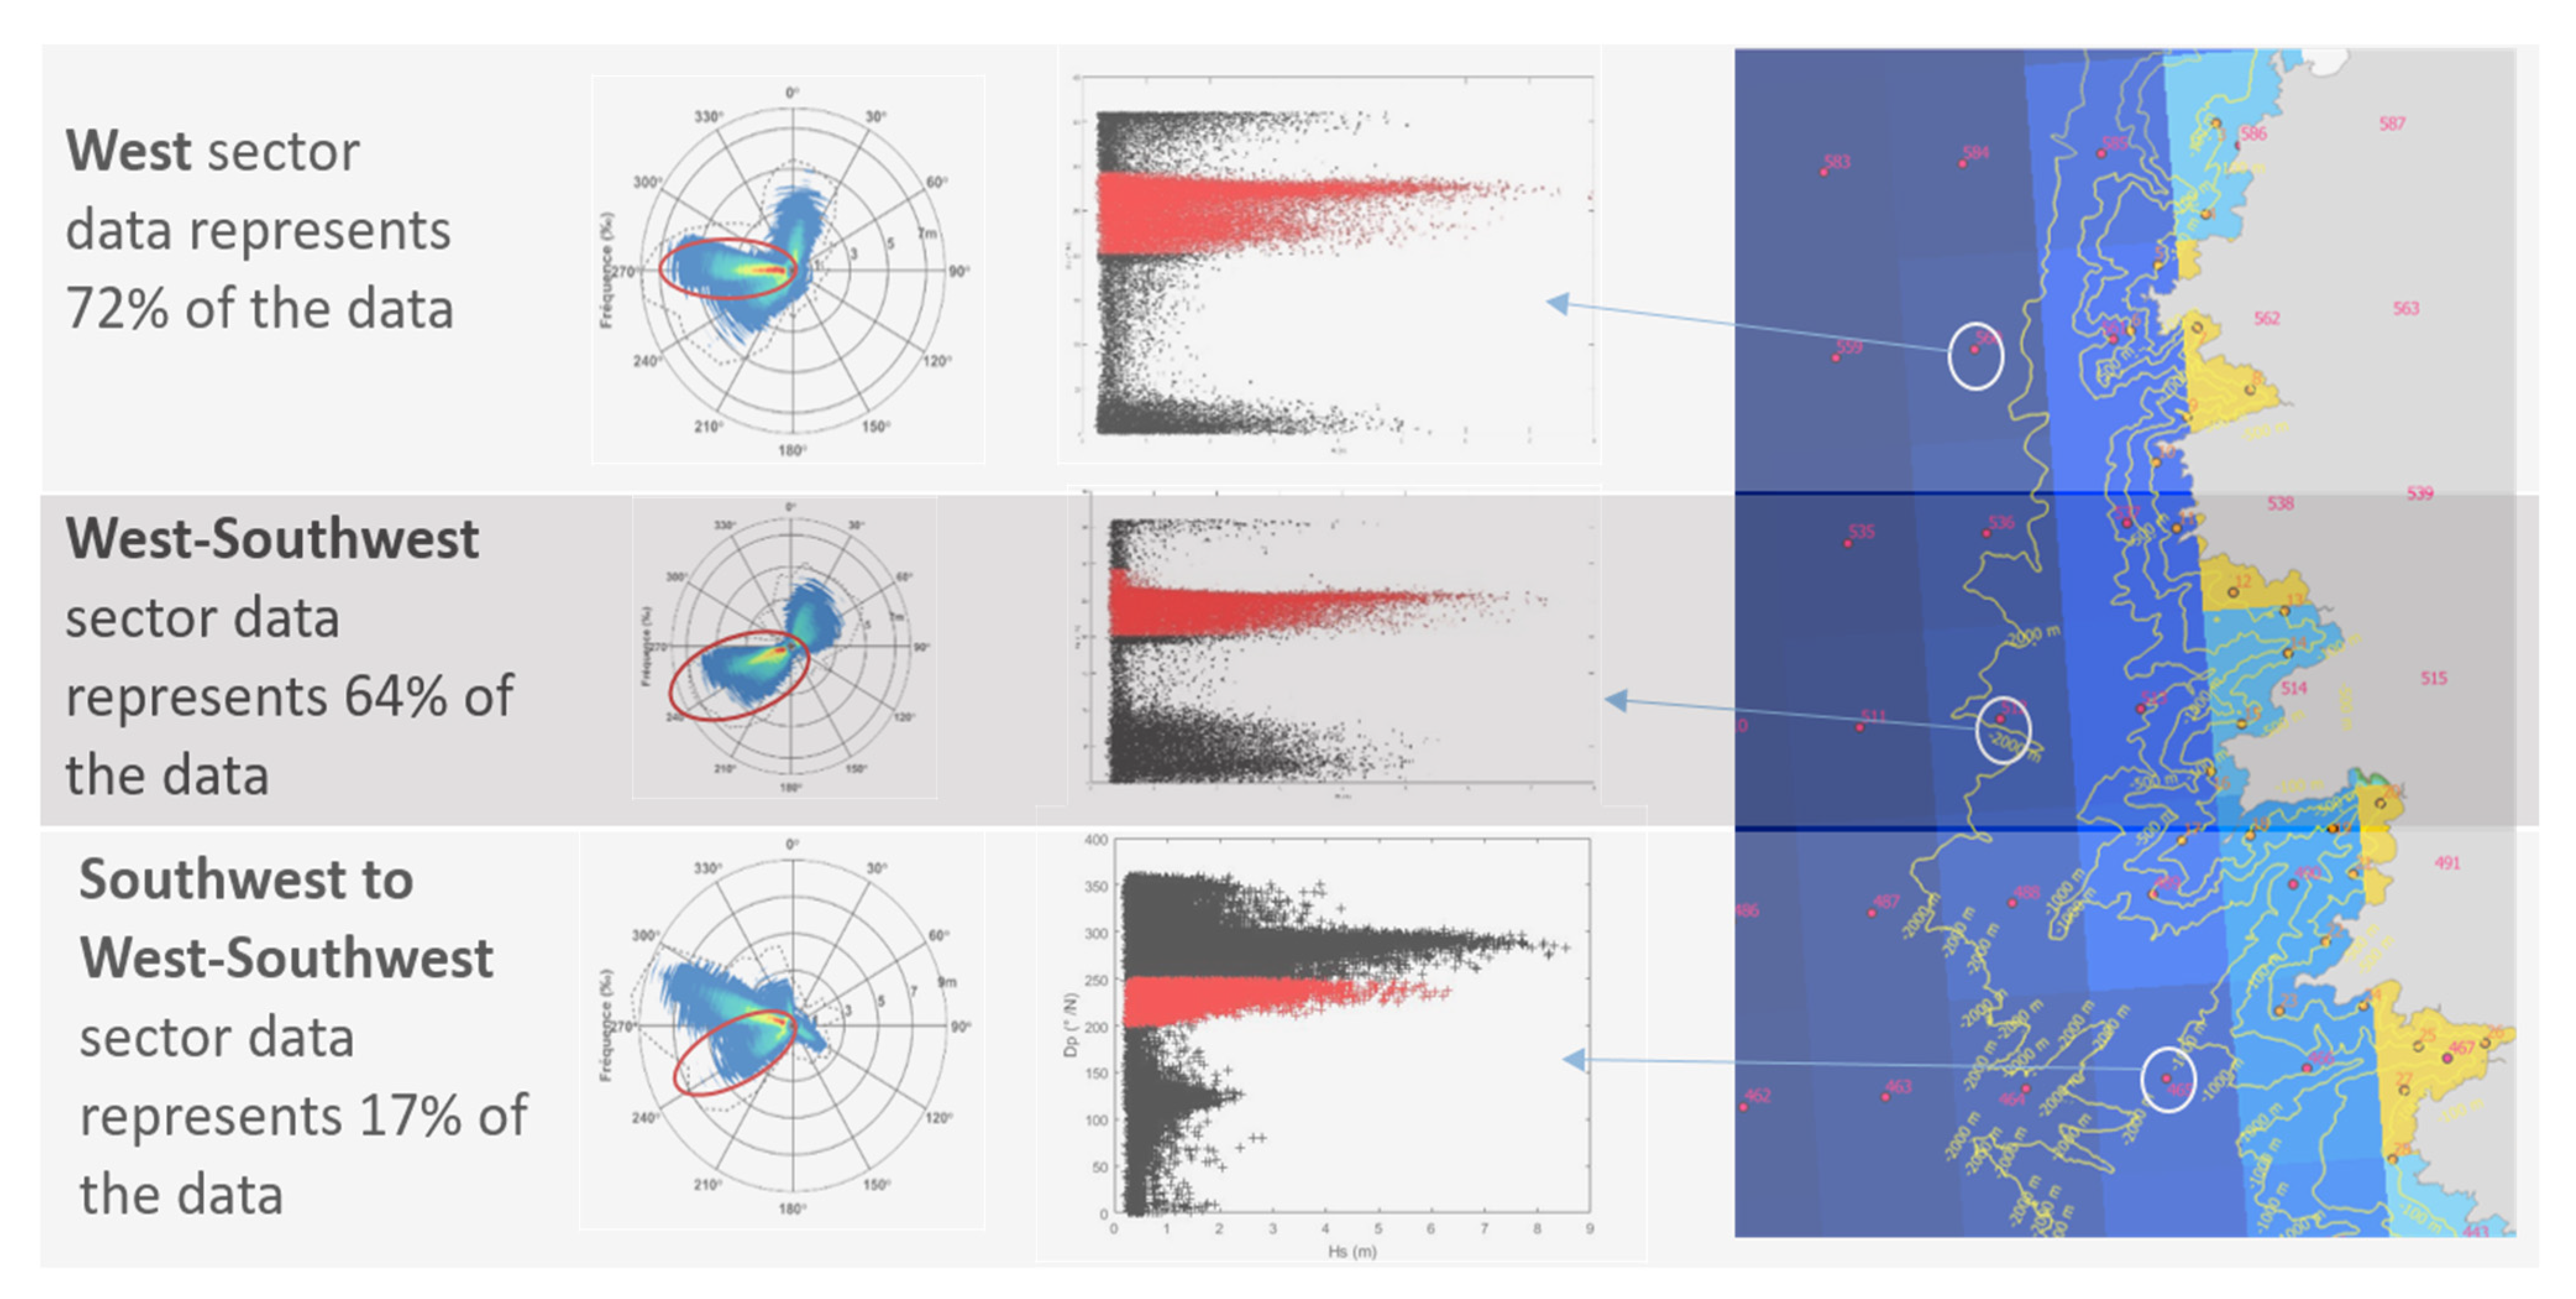
Appendix C. Wave Directions Affecting the Coastline for Extreme Conditions

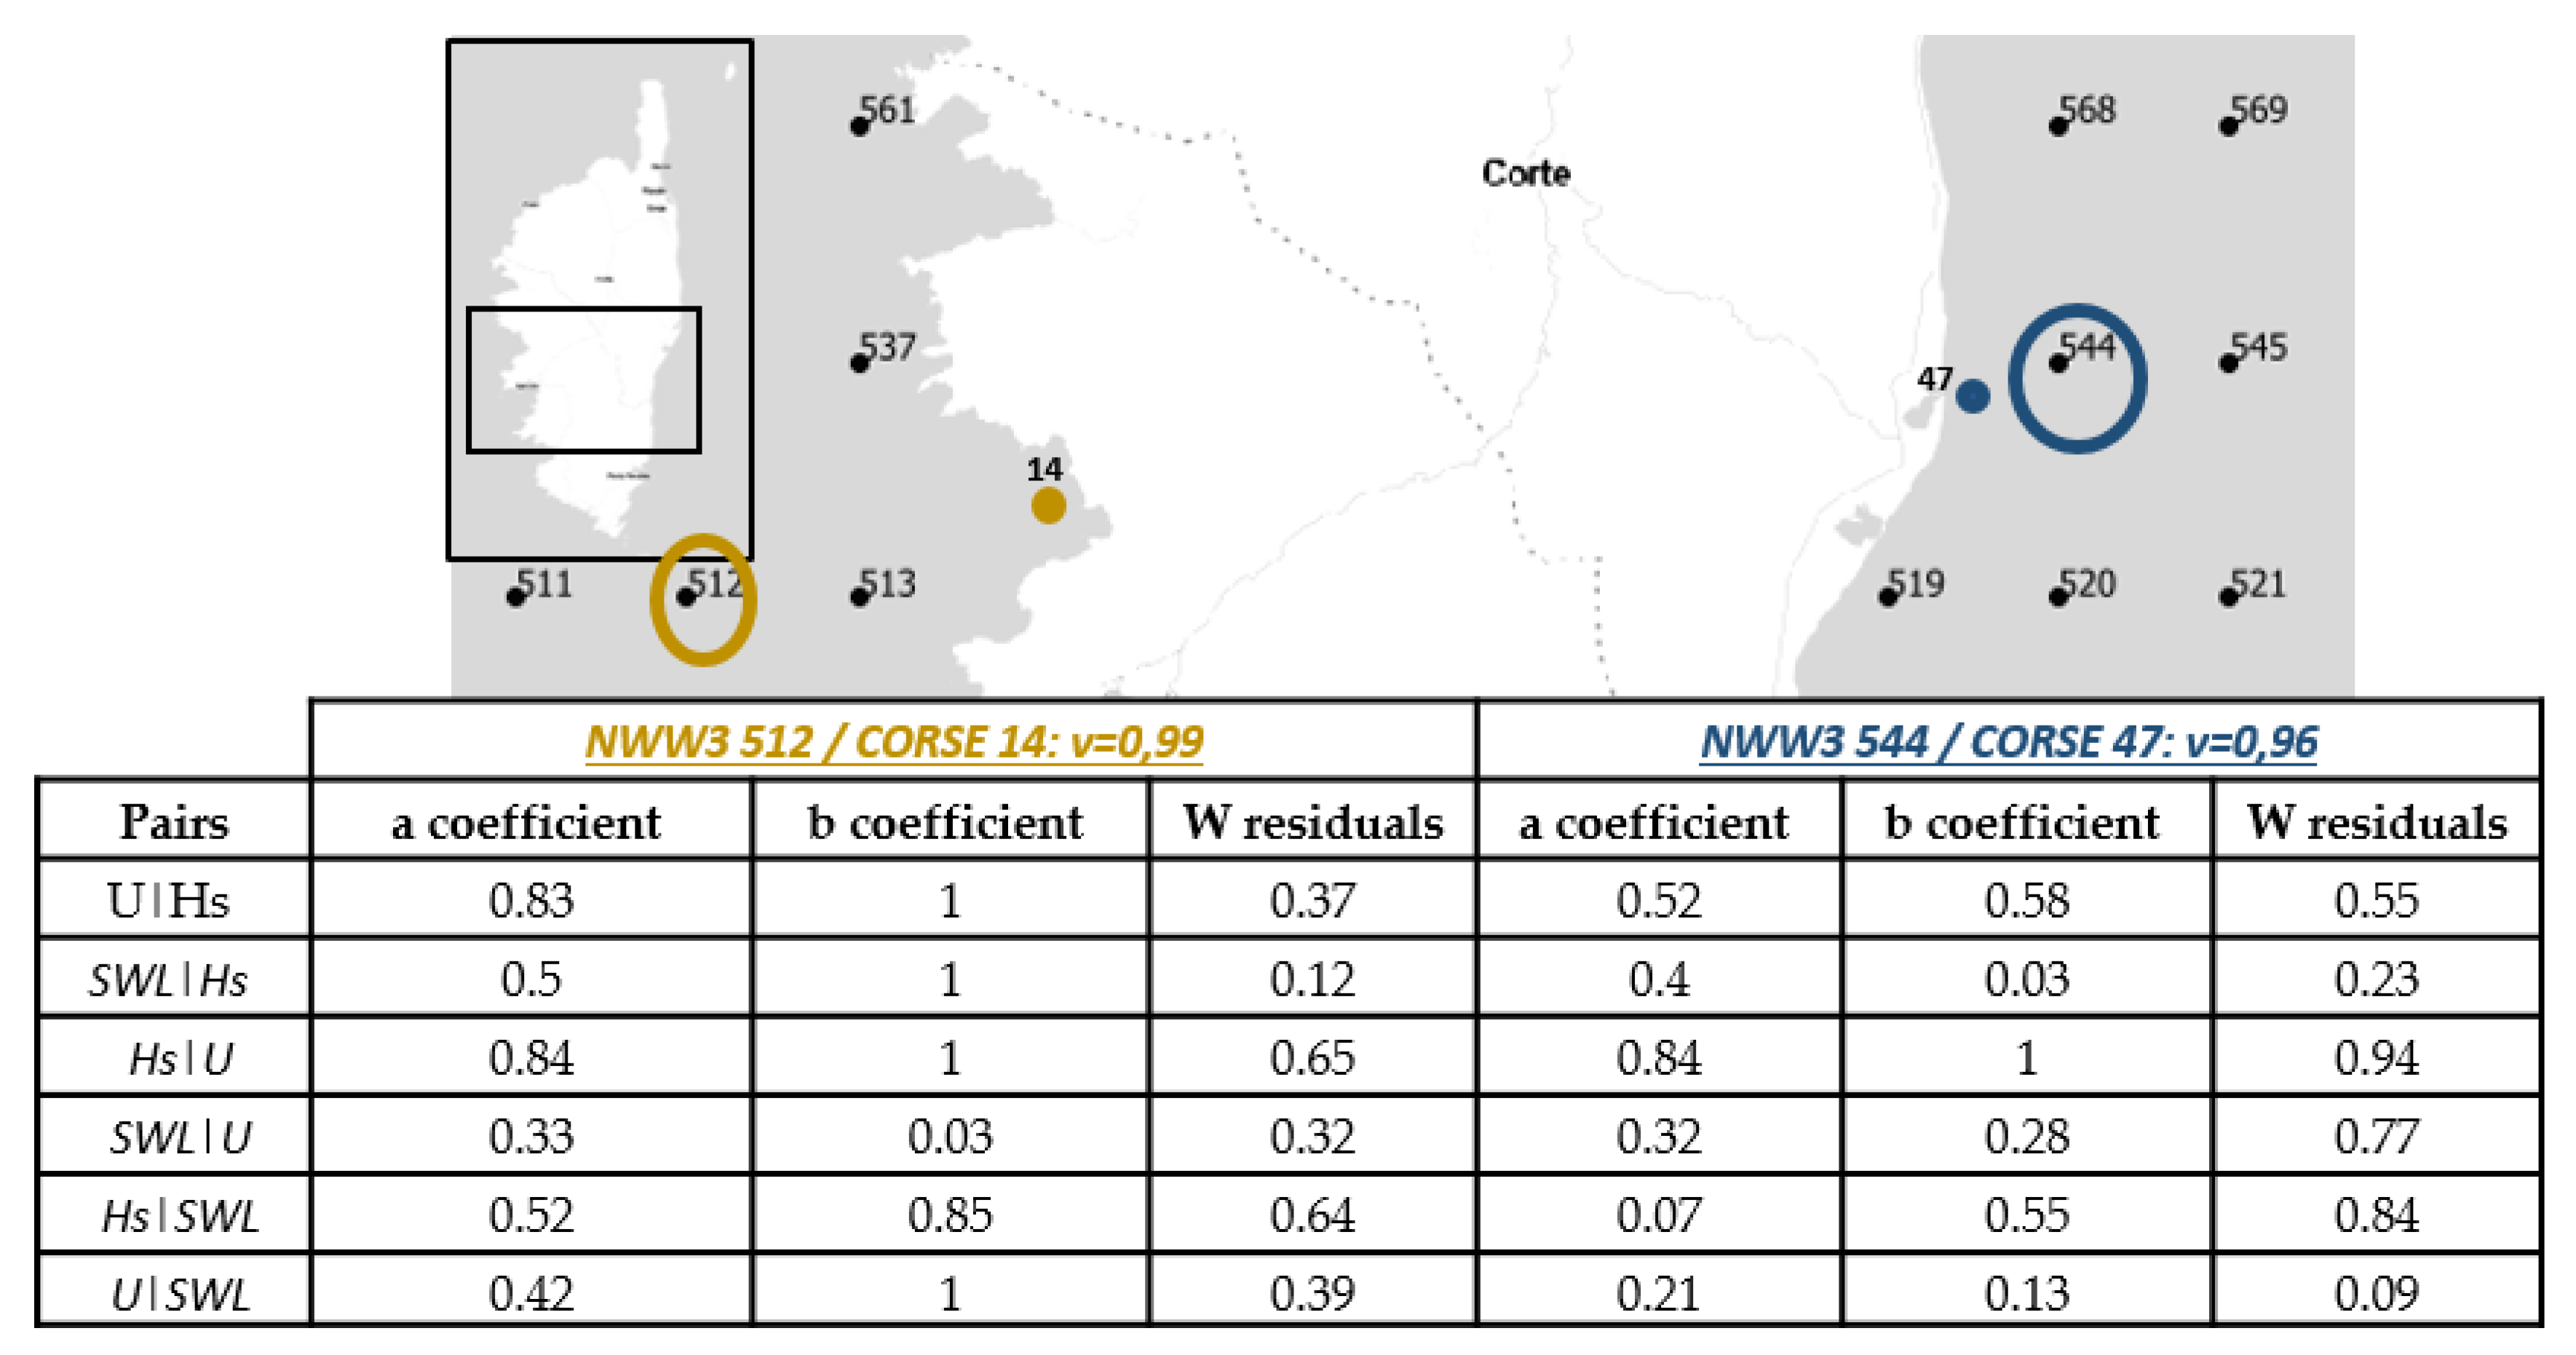
Appendix D. Dependence Coefficients

References
- Cagigal, L.; Rueda, A.; Anderson, D.; Ruggiero, P.; Merrifield, M.A.; Montaño, J.; Coco, G.; Méndez, F.J. A multivariate, stochastic, climate-based wave emulator for shoreline change modelling. Ocean. Model. 2020, 154, 101695. [Google Scholar] [CrossRef]
- Marcos, M.; Rohmer, J.; Vousdoukas, M.I.; Mentaschi, L.; Le Cozannet, G.; Amores, A. Increased Extreme Coastal Water Levels Due to the Combined Action of Storm Surges and Wind Waves. Geophys. Res. Lett. 2019, 46, 4356–4364. [Google Scholar] [CrossRef] [Green Version]
- Galiatsatou, P.; Prinos, P. Estimation of extreme storm surges using a spatial linkage assumption. In Proceedings of the 32nd IAHR Congress, Venice, Italy, 1–6 July 2007. [Google Scholar]
- Zachary, S.; Feld, G.; Ward, G.; Wolfram, J. Multivariate extrapolation in the offshore environment. Appl. Ocean. Res. 1998, 20, 273–295. [Google Scholar] [CrossRef]
- Gouldby, B.; Wyncoll, D.; Panzeri, M.; Franklin, M.; Hunt, T.; Hames, D.; Tozer, N.; Hawkes, P.; Dornbusch, U.; Pullen, T. Multivariate extreme value modelling of sea conditions around the coast of England. Proc. Inst. Civ. Eng. Marit. Eng. 2017, 170, 3–20. [Google Scholar] [CrossRef] [Green Version]
- Corbella, S.; Stretch, D.D. Simulating a multivariate sea storm using Archimedean copulas. Coast. Eng. 2013, 76, 68–78. [Google Scholar] [CrossRef]
- Wahl, T.; Mudersbach, C.; Jensen, J. Assessing the hydrodynamic boundary condi-tions for risk analyses in coastal areas: A multivariate statistical approach based oncopula functions. Nat. Hazards Earth Syst. Sci. 2012, 12, 495–510. [Google Scholar] [CrossRef] [Green Version]
- De Michele, C.; Salvadori, G.; Passoni, G.; Vezzoli, R. A multivariate model of sea storms using copulas. Coast. Eng. 2007, 54, 734–751. [Google Scholar] [CrossRef]
- Soares, C.G.; Cunha, C. Bivariate autoregressive models for the time series of significant wave height and mean period. Coast. Eng. 2000, 40, 297–311. [Google Scholar] [CrossRef]
- Jonathan, P.; Ewans, K. Statistical modelling of extreme ocean environments for marine design: A review. Ocean. Eng. 2013, 62, 91–109. [Google Scholar] [CrossRef]
- Idier, D.; Rohmer, J.; Pedreros, R.; Le Roy, S.; Lambert, J.; Louisor, J.; Le Cozannet, G.; Le Cornec, E. Coastal Flood: A Composite Method for Past Events Characterisation Providing Insights in Past, Present and Future Hazards—Joining Historical, Statistical and Modelling Approaches. Nat. Hazards 2020, 101, 465–501. [Google Scholar] [CrossRef] [Green Version]
- Heffernan, J.E.; Tawn, J.A. A conditional approach for multivariate extreme values (with discussion). J. R. Stat. Soc. Ser. B Statist. Methodol. 2004, 66, 497–546. [Google Scholar] [CrossRef]
- Monbet, V.; Ailliot, P.; Prevosto, M. Survey of stochastic mod-els for wind and sea state time series. Prob. Eng. Mech. 2007, 22, 113–126. [Google Scholar] [CrossRef] [Green Version]
- Ewans, K.; Jonathan, P. Evaluating environmental joint extremes for the offshore industry using the conditional extremes model. J. Mar. Syst. 2013, 130, 124–130. [Google Scholar] [CrossRef]
- Jonathan, P.; Ewans, K.; Randell, D. Joint modelling of extreme ocean environments incorporating covariate effects. Coast. Eng. 2013, 79, 22–31. [Google Scholar] [CrossRef] [Green Version]
- Jonathan, P.; Flynn, J.; Ewans, K. Joint modelling of wave spectral parameters for extreme sea states. Ocean. Eng. 2013, 37, 1070–1080. [Google Scholar] [CrossRef]
- Stepanian, A.; Balouin, Y.; Belon, R.; Bodéré, G. ROL—Etude Complémentaire sur le Littoral de la Plaine Orientale de Corse—Etat des Connaissances sur les Impacts des Tempêtes sur le Littoral. Rapport Final; Rapport BRGM/RP-59046-FR. 2011, p. 137. Available online: http://infoterre.brgm.fr/rapports/RP-59046-FR.pdf (accessed on 23 July 2018).
- Western European Union. Wind and Wave Atlas of the Mediterranean Sea. Technical Note. 2004. Available online: http://users.ntua.gr/mathan/pdf/Pages_from%20_WIND_WAVE_ATLAS_MEDITERRANEAN_SEA_2004.pdf. (accessed on 21 June 2018).
- Krestenitis, Y.; Pytharoulis, I.; Karacostas, T.S.; Androulidakis, Y.; Makris, C.; Kombiadou, K.; Tegoulias, I.; Baltikas, V.; Kotsopoulos, S.; Kartsios, S. Severe Weather Events and Sea Level Variability Over the Mediterranean Sea: The WaveForUs Operational Platform; Springer: Berlin/Heidelberg, Germany, 2017; pp. 63–68. [Google Scholar] [CrossRef]
- Mentaschi, L.; Besio, G.; Cassola, F.; Mazzino, A. Performance evaluation of Wavewatch III in the Mediterranean Sea. Ocean. Model. 2015, 90, 82–94. [Google Scholar] [CrossRef]
- Sanuy, M.; Jiménez, J.A.; Ortego, M.I.; Toimil, A. Differences in assigning probabilities to coastal inundation hazard estimators: Event versus response approaches. J. Flood Risk Manag. 2020, 13. [Google Scholar] [CrossRef] [Green Version]
- Hawkes, P.J.; Gouldby, B.; Tawn, J.A.; Owen, M.W. The joint probability of waves and water levels in coastal engineering design. J. Hydraul. Res. 2002, 40, 241–251. [Google Scholar] [CrossRef]
- Nicolae Lerma, A.; Bulteau, T.; Elineau, S.; Paris, F.; Durand, P.; Anselme, B.; Pedreros, R. High-resolution marine flood modelling coupling overflow and overtopping processes: Framing the hazard based on historical and statistical ap-proaches. Nat. Haz. Earth Syst. Sci. 2018, 18, 207–229. [Google Scholar] [CrossRef] [Green Version]
- Pillet, D.; Renoult, R.; Saillard, M. Audit de Suivi de la Mise en Oeuvre de la Politique de Prévention des Risques Naturels et Technologiques dans la Région Corse. Institutional Report. 2019, pp. 12–13. Available online: https://www.vie-publique.fr/sites/default/files/rapport/pdf/194000570.pdf (accessed on 11 February 2021).
- Shom—Ouvrage de Marée. References Altimétriques Maritimes Ports de France Métropolitaine et d’Outre-Mer. Cotes du Zéro Hydrographique et Niveaux Caractéristiques de la Marée, 2017th ed. 2017, p. 120. Available online: https://diffusion.shom.fr/pro/references-altimetriques-maritimes-ram.html (accessed on 27 March 2018).
- Haigh, I.D.; Nicholls, R.; Wells, N. A comparison of the main methods for estimating probabilities of extreme still water levels. Coast. Eng. 2010, 57, 838–849. [Google Scholar] [CrossRef]
- Kergadallan. Analyse Statistique des Niveaux d’Eau Extrêmes—Environnements Maritime et Estuarien; Technical Note; CETMEF: Paris, France, 2013. [Google Scholar]
- Chawla, A.; Spindler, D.M.; Tolman, H.L. WAVEWATCH III Hindcasts with Reanalysis Winds. Initial Report on Model Setup; Technical Note 291, NOAA/NWS/NCEP/MMAB; U.S. Department of Commerce, National Oceanic and Atmospheric Administration: Camp Springs, MD, USA, 2011; p. 100. [Google Scholar]
- Chawla, A.; Spindler, D.M.; Tolman, H.L. 30 Year Wave Hindcasts Using WAVEWATCH III R with CFSR Winds, Phase 1; Technical Note 302; NOAA/NWS/NCEP/MMAB; U.S. Department of Commerce, National Oceanic and Atmospheric Administration: Camp Springs, MD, USA, 2012; p. 23. [Google Scholar]
- Ardhuin, F.; Rogers, A.E.; Babanin, J.-F.; Filipot, R.; Magne, A.; Roland, A.; van der Westhuysen, P.; Queffeulou, J.-M.; Lefevre, L.; Aouf, F.; et al. Semi-empirical dissipation source functions for wind-wave models: Part I, definition, calibration and validation. J. Phys. Oceanogr. 2010, 40, 1917–1941. [Google Scholar] [CrossRef] [Green Version]
- Lazure, P.; Dumas, F. An external–internal mode coupling for a 3D hydrodynamical model for applications at regional scale (MARS). Adv. Water Res. 2008, 31, 233–250. [Google Scholar] [CrossRef]
- Saha, S.; Moorthi, S.; Pan, H.; Wu, X.; Wang, J.; Nadiga, S.; Tripp, P.; Kistler, R.; Woollen, J.; Behringer, D.; et al. NCEP Climate Forecast. System Reanalysis (CFSR) Selected Hourly Time-Series Products, January 1979 to December 2010; Research Data Archive at the National Center for Atmospheric Research, Computational and Information Systems Laboratory: Boulder, CO, USA, 2010. [Google Scholar] [CrossRef]
- Shom (2015)—MNT Bathymétrique de Façade de la Corse (Projet Homonim). Available online: https://diffusion.shom.fr/pro/risques/bathymetrie/mnt-facade-atl-homonim-264.html (accessed on 14 May 2019).
- Brodtkorb, P.; Johannesson, A.; Lindgren, P.; Rychlik, G.; Rydén, I.; Sjö, J.; Sjö, E. WAFO—A Matlab Toolbox for Analysis of Random Waves And Loads. In Proceedings of the Tenth International Offshore and Polar Engineering Conference, Seattle, WA, USA, 28 May–2 June 2000. [Google Scholar]
- Guanche Garcia, Y.; Prevosto, M.; Maisondieu, C.; Bulteau, T.; Paris, F. Analyses of Environmental Time Series: Extreme Values; Scientific Report; Ifremer: Brest, France, 2015. [Google Scholar] [CrossRef]
- Efron, B. Bootstrap Methods: Another Look at the Jackknife. In Springer Series in Statistics; Springer: Berlin/Heidelberg, Germany, 1992; pp. 569–593. [Google Scholar]
- Wyncoll, D.; Gouldby, B. Integrating a multivariate extreme value method within a system flood risk analysis model. J. Flood Risk Manag. 2015, 8, 145–160. [Google Scholar] [CrossRef] [Green Version]
- Gouldby, B.; Mendez, F.; Guanche, Y.; Rueda, A.; Mínguez, R. A methodology for deriving extreme nearshore sea conditions for structural design and flood risk analysis. Coast. Eng. 2014, 88, 15–26. [Google Scholar] [CrossRef] [Green Version]
- Booij, N.; Ris, R.C.; Holthuijsen, L.H. A third-generation wave model for coastal regions, Part I: Model description and validation. J. Geophys. Res. 1999, 104, 7649–7666. [Google Scholar] [CrossRef] [Green Version]
- Smit, P.; Zijlema, M.; Stelling, G. Depth-induced wave breaking in a non-hydrostatic, near-shore wave model. Coast. Eng. 2013, 76, 1–16. [Google Scholar] [CrossRef]
- Stelling, G.; Zijlema, M. An accurate and efficient finite-difference algorithm for non-hydrostatic free-surface flow with application to wave propagation. Int. J. Num. Methods Fluids 2003, 43, 1–23. [Google Scholar] [CrossRef]
- Stelling, G.S.; Duinmeijer, S.P.A. A staggered conservative scheme for every Froude number in rapidly varied shallow water flows. Int. J. Num. Methods Fluids 2003, 43, 1329–1354. [Google Scholar] [CrossRef]
- Zijlema, M.; Stelling, G.S. Further experiences with computing non-hydrostatic free-surface flows involving water waves. Int. J. Num. Methods Fluids 2005, 48, 169–197. [Google Scholar] [CrossRef]
- Zijlema, M.; Stelling, G. Efficient computation of surf zone waves using the nonlinear shallow water equations with non-hydrostatic pressure. Coast. Eng. 2008, 55, 780–790. [Google Scholar] [CrossRef]
- Zijlema, M.; Stelling, G.; Smit, P. SWASH: An operational public domain code for simulating wave fields and rapidly varied flows in coastal waters. Coast. Eng. 2011, 58, 992–1012. [Google Scholar] [CrossRef]
- MEDDE Guide Méthodologique: Plan de Prévention des Risques Littoraux. 2014, p. 169. Available online: https://www.ecologie.gouv.fr/sites/default/files/Guide%20PPRL%20-%20version%20finale%20mai%202014.pdf (accessed on 22 December 2020).
- Church, J.A.; Clark, P.U.; Cazenave, A.; Gregory, J.M.; Jevrejeva, S.; Levermann, A.; Merrifield, M.A.; Milne, G.A.; Nerem, R.S.; Nunn, P.D.; et al. Sea Level Change. In Climate Change 2013: The Physical Science Basis. Contribution of Working Group I to the Fifth Assessment Report of the Intergovernmental Panel on Climate Change; Stocker, T.F., Qin, D., Plattner, G.-K., Tignor, M., Allen, S.K., Boschung, J., Nauels, A., Xia, Y., Bex, V., Midgley, P.M., Eds.; Cambridge University Press: Cambridge, UK; New York, NY, USA, 2013. [Google Scholar]
- Tebaldi, C.; Kopp, R.E.; Horton, R.M.; Little, C.M.; Mitrovica, J.X.; Oppenheimer, M.; Rasmussen, D.J.; Strauss, B.H. Probabilistic 21st and 22nd century sea-level projections at a global network of tide-gauge sites. Adv. Earth Space Sci. 2014, 2, 383–406. [Google Scholar] [CrossRef]
- Slangen, A.B.A.; Carson, M.; Katsman, C.A.; van de Wal, R.S.W.; Köhl, A.; Vermeersen, L.L.A.; Stammer, D. Projecting twenty-first century regional sea-level changes. Clim. Chang. 2014, 124, 317–332. [Google Scholar] [CrossRef]
- Coles, S.; Bawa, J.; Trenner, L.; Dorazio, P. An Introduction to Statistical Modeling of Extreme Values; Springer: London, UK, 2001; Volume 208. [Google Scholar]
- Ullmann, A.; Pirazzoli, P.; Moron, V. Sea surges around the Gulf of Lions and atmospheric conditions. Glob. Planet. Chang. 2008, 63, 203–214. [Google Scholar] [CrossRef]
- Hosking, J.R.M.; Wallis, J.R. Parameter and quantile estimation for the generalized Pareto distribution. Technometrics 1987, 29, 339–349. [Google Scholar] [CrossRef]
- Mazas, F.; Hamm, L. A multi-distribution approach to POT methods for determining extreme wave heights. Coast. Eng. 2011, 58, 385–394. [Google Scholar] [CrossRef]
- Callaghan, D.; Nielsen, P.; Short, A.; Ranasinghe, R. Statistical simulation of wave climate and extreme beach erosion. Coast. Eng. 2008, 55, 375–390. [Google Scholar] [CrossRef]
- Camus, P.; Haigh, I.D.; Nasr, A.A.; Wahl, T.; Darby, S.E.; Nicholls, R.J. Regional analysis of multivariate compound coastal flooding potential around Europe and environs: Sensitivity analysis and spatial patterns. Nat. Hazards Earth Syst. Sci. 2021, 21, 2021–2040. [Google Scholar] [CrossRef]
- Martzikos, N.T.; Prinos, P.E.; Memos, C.D.; Tsoukala, V.K. Statistical analysis of Mediterranean coastal storms. Oceanologia 2021, 63, 133–148. [Google Scholar] [CrossRef]
- Rohmer, J.; Idier, D. A meta-modelling strategy to identify the critical offshore conditions for coastal flooding. Nat. Hazards Earth Syst. Sci. 2012, 12, 2943–2955. [Google Scholar] [CrossRef]
- McEvoy, S.; Haasnoot, M.; Biesbroek, R. How are European countries planning for sea level rise? Ocean. Coast. Manag. 2021, 203, 105512. [Google Scholar] [CrossRef]
- Thiéblemont, R.; Le Cozannet, G.; Toimil, A.; Meyssignac, B.; Losada, I.J. Likely and High-End Impacts of Regional Sea-Level Rise on the Shoreline Change of European Sandy Coasts Under a High Greenhouse Gas Emissions Scenario. Water 2019, 11, 2607. [Google Scholar] [CrossRef] [Green Version]
- Oppenheimer, M.; Glavovic, B.C.; Hinkel, J.; van de Wal, R.; Magnan, A.K.; Abd-Elgawad, A.; Cai, R.; CifuentesJara, M.; DeConto, R.M.; Ghosh, T.; et al. Sea Level Rise and Implications for Low-Lying Islands, Coasts and Communities. In IPCC Special Report on the Ocean and Cryosphere in a Changing Climate; Pörtner, H.-O., Roberts, D.C., Masson-Delmotte, V., Zhai, P., Tignor, M., Poloczanska, E., Mintenbeck, K., Alegría, A., Nicolai, M., Okem, A., et al., Eds.; Intergovernmental Panel on Climate Change: Geneva, Switzerland, 2019. [Google Scholar]
- IPCC. Climate Change 2021: The Physical Science Basis. Contribution of Working Group I to the Sixth Assessment Report of the Intergovernmental Panel on Climate Change; Masson-Delmotte, V., Zhai, P., Pirani, A., Connors, S.L., Péan, C., Berger, S., Caud, N., Chen, Y., Goldfarb, L., Gomis, M.I., et al., Eds.; Cambridge University Press: Cambridge, UK, 2021. [Google Scholar]
- Tonisson, H.; Suursaar, U.; Kont, A. Maps, aerial photographs, orthophotos and GPS data as a source of information to determine shoreline changes, coastal geomorphic processes and their relation to hydrodynamic conditions on Osmussaar Island, the Baltic Sea. In Proceedings of the 2012 IEEE International Geoscience and Remote Sensing Symposium, Munich, Germany, 22–27 July 2012; pp. 2657–2660. [Google Scholar] [CrossRef]


| Variable | Product | Source | Spatial and Temporal Resolution | |
|---|---|---|---|---|
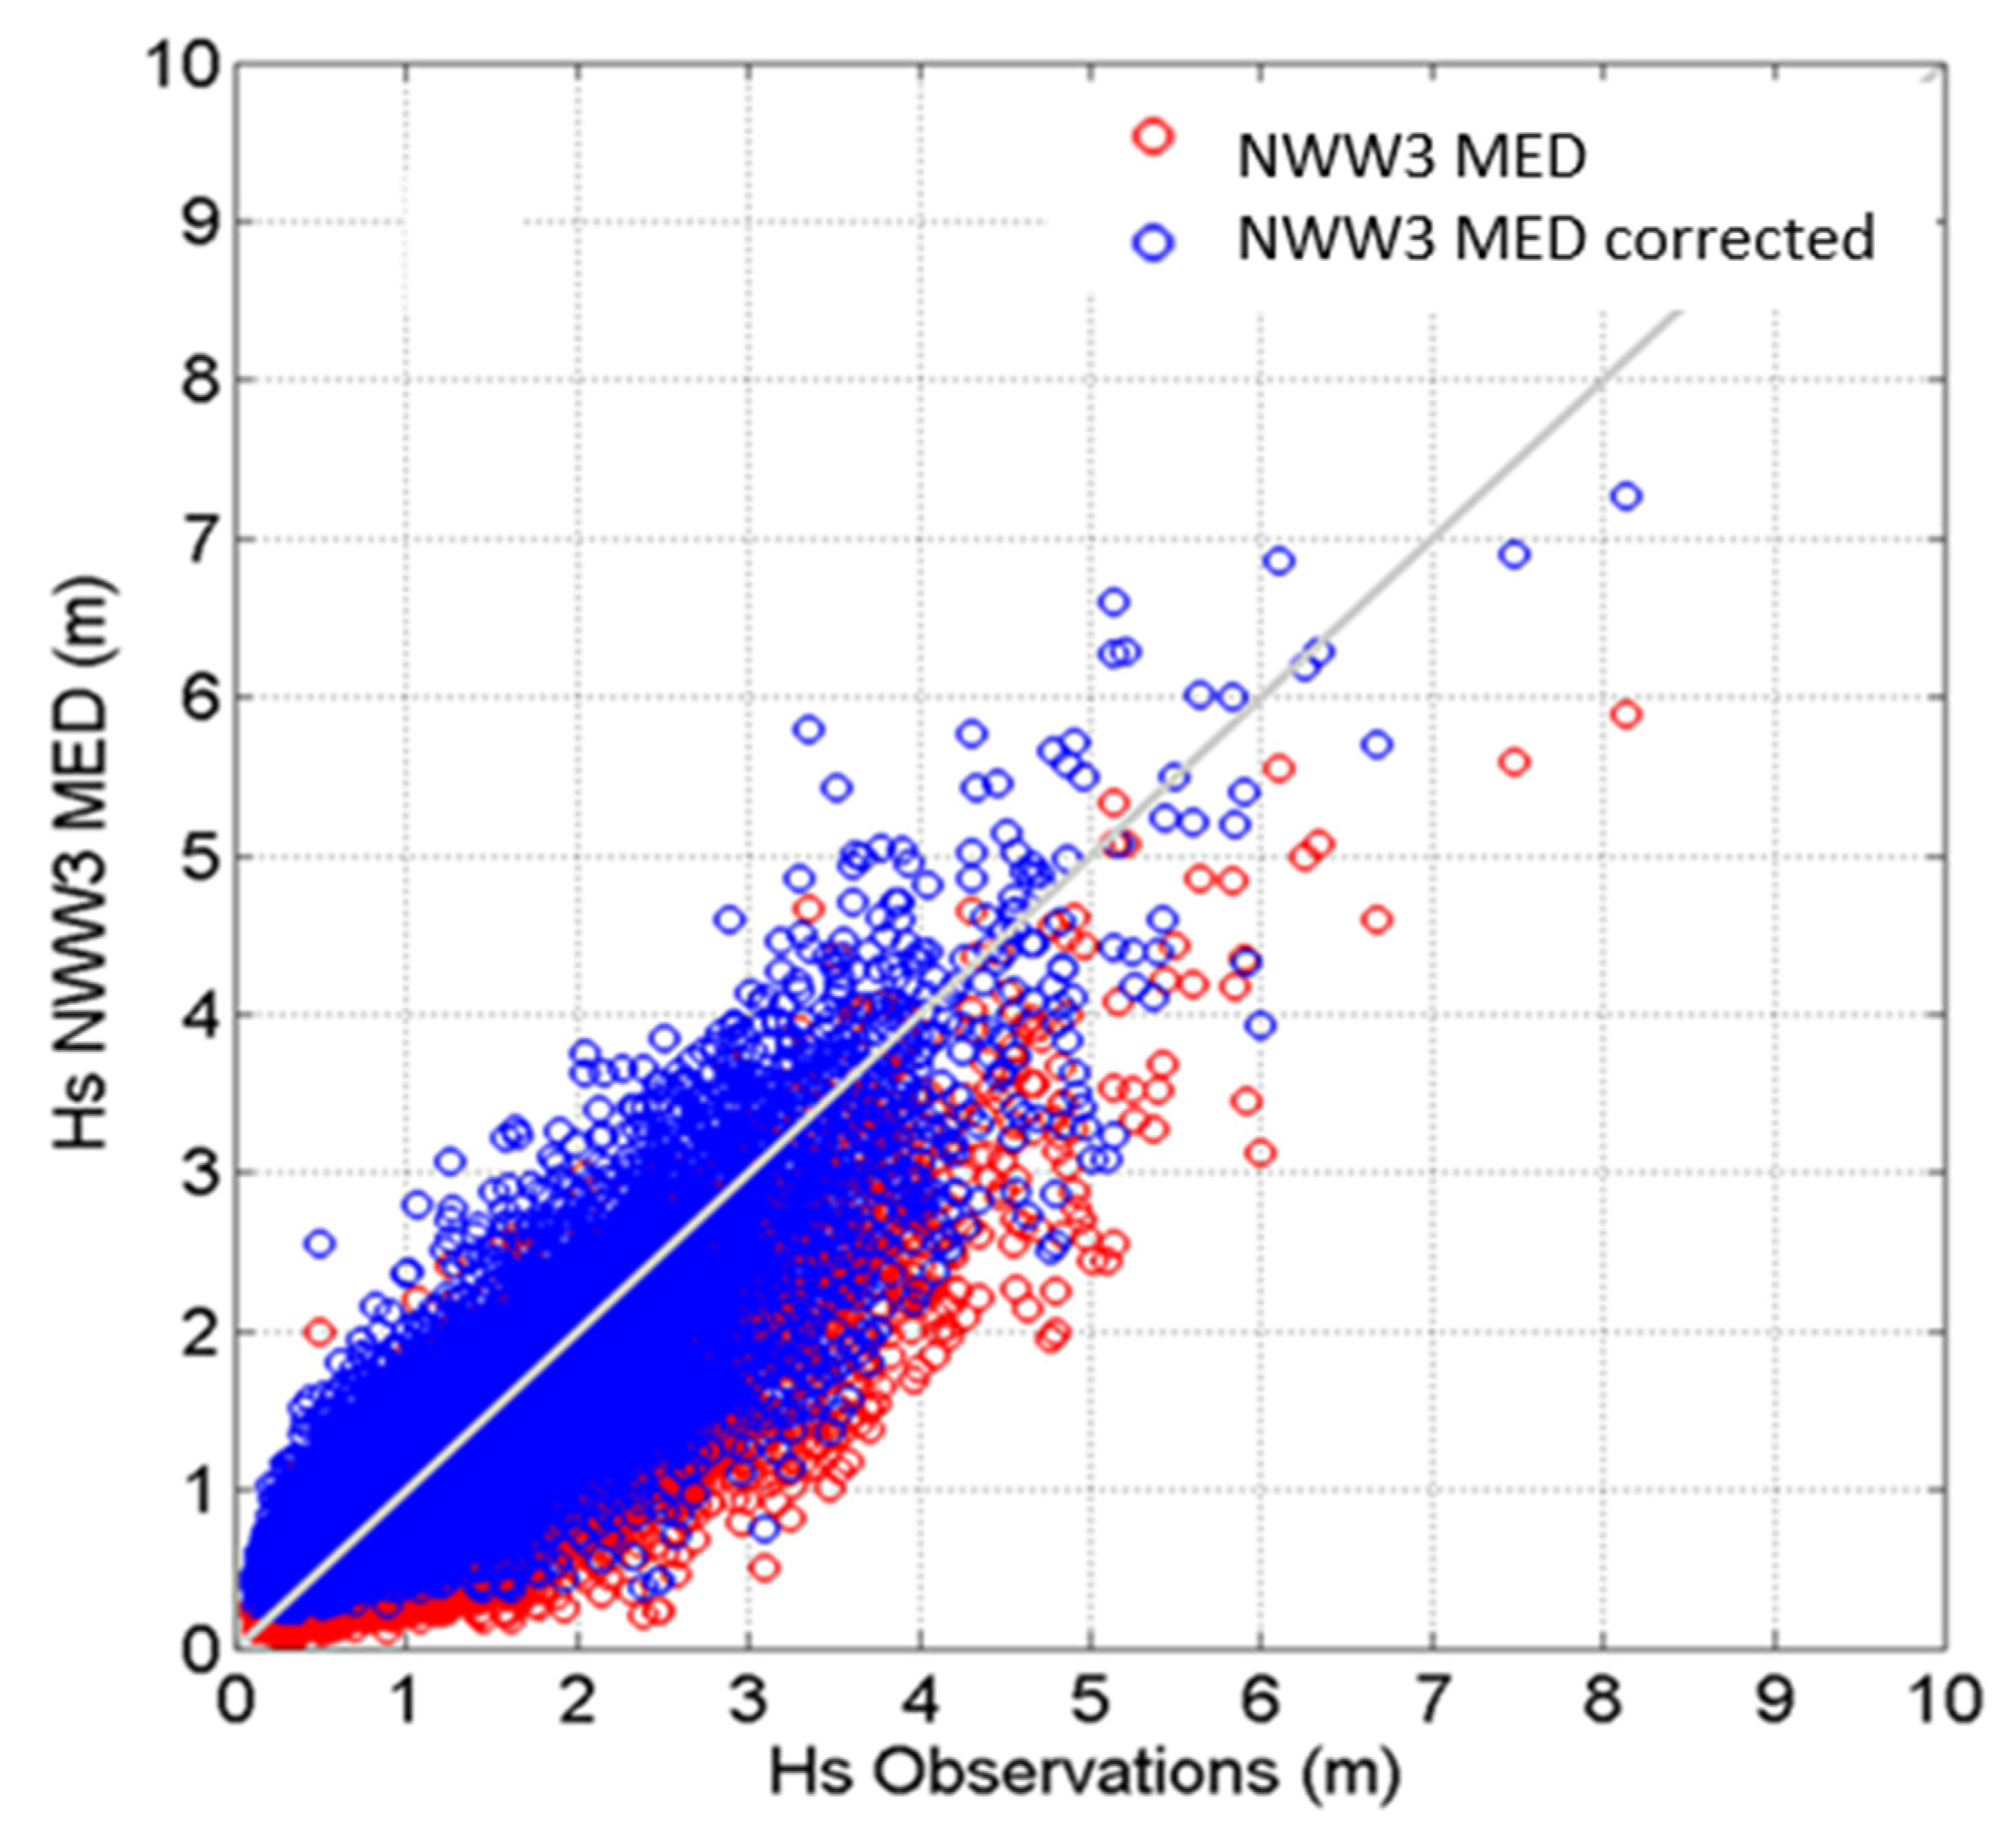
| Offshore conditions for statistical analysis | Sea states: Hs, Tp, Dp | NWW3_MED | NOAA https://polar.ncep.noaa.gov/waves/hindcasts/nopp-phase2/ (accessed on 2 July 2019) | 20 km 3 h |
| Winds: U, DU | NWW3_MED | NOAA | 20 km 3 h | |
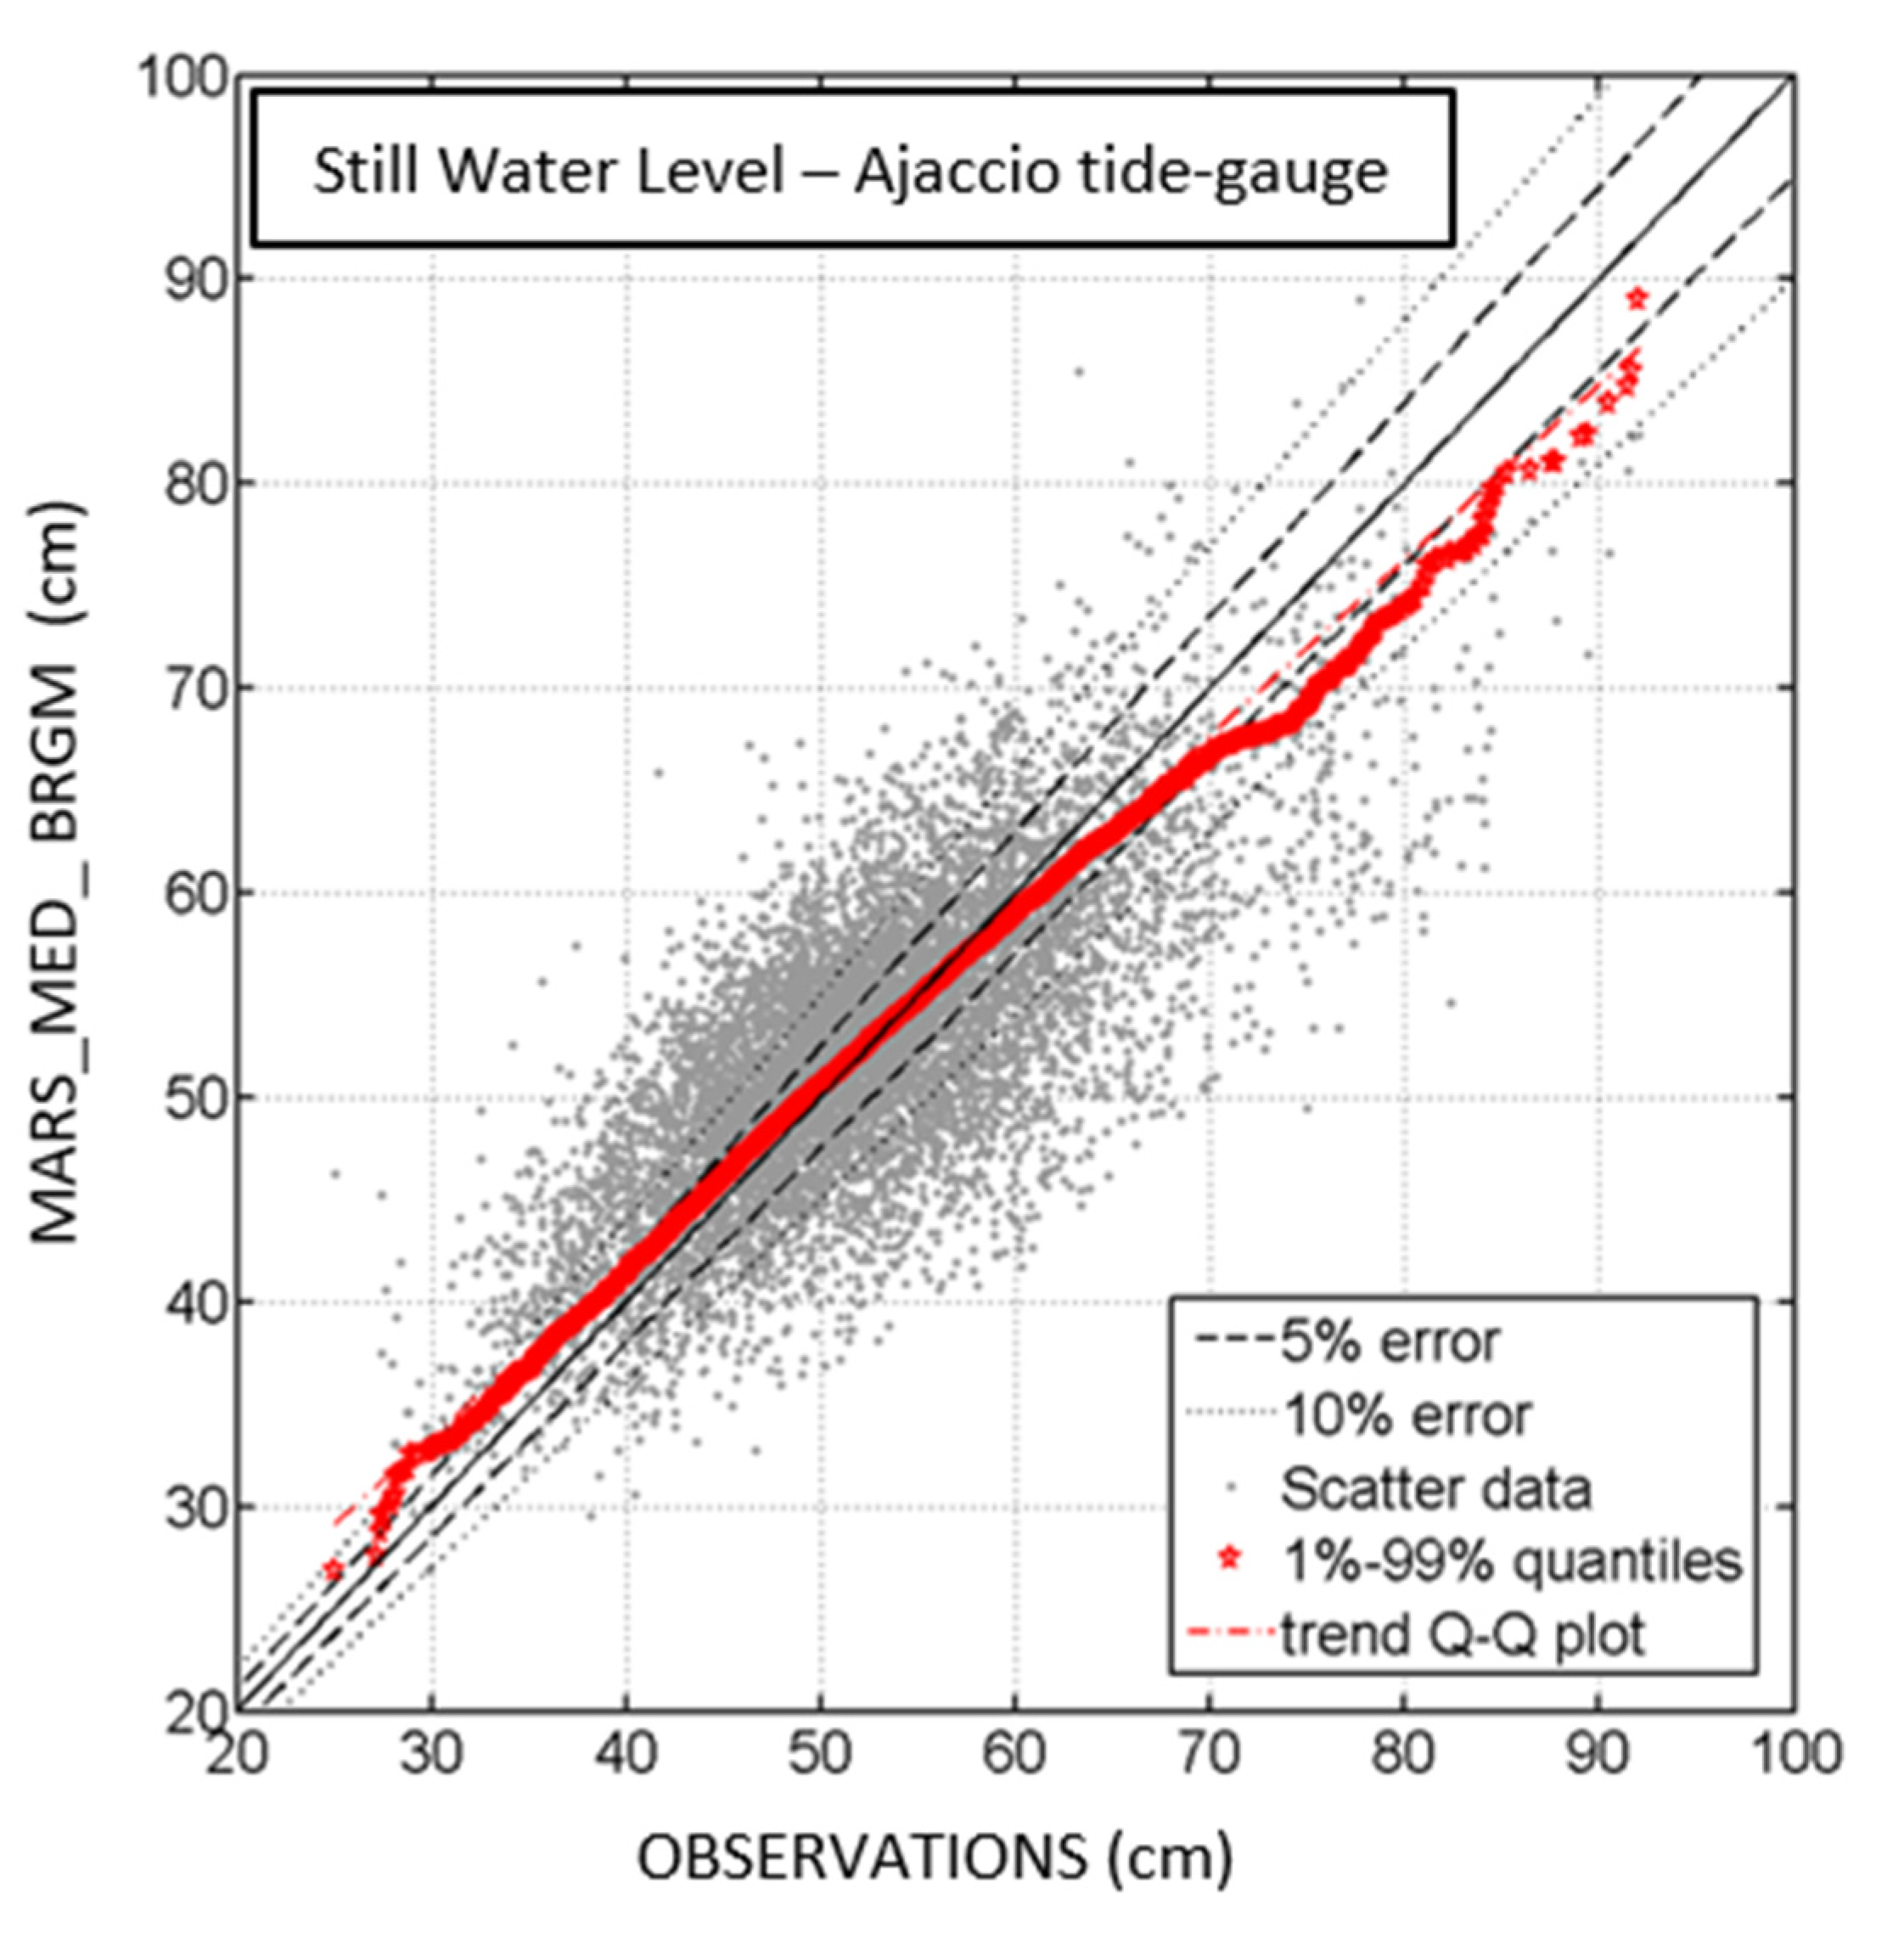
| Still Water Level SWL | MARS_MED_BRGM hindcast | BRGM | 10 km around Corsica 10 min | |
| Topobathymetric data for numerical simulation | Bathymetry | HOMONIM | Shom https://data.shom.fr/ (accessed on 14 May 2019) | 100 m |
| Topography | RGE ALTI and Litto 3D | IGN https://www.geoportail.gouv.fr/donnees/rge-alti-sources (accessed on 14 May 2019) | 1 m | |
| In-situ data used for validation | Hs, Tp, Dp | Buoy time series | Candhis https://candhis.cerema.fr/ (accessed on 1 July 2019) and ISPRA http://dati.isprambiente.it/id/website/ronRmn/html (accessed on 2 July 2019) | 1 h or 30 min |
| U, DU | Station and buoy time series | Météo-France https://donneespubliques.meteofrance.fr/ (accessed on 3 July 2019) and ISPRA | 10 min | |
| SWL | Tide gauge time series | Shom and CNES https://www.aviso.altimetry.fr/en/data/products/in-situ-products/tide-gauge.html (accessed on 1 July 2019) | 10 min |
| Scenarios | Hs (m) | Tp (s) | U (m/s) | SWL (m) |
|---|---|---|---|---|
| 1 | 7.85 | 11.22 | 21.76 | 0.2 |
| 2 | 7.76 | 11.09 | 21.95 | 0.2 |
| 3 | 7.92 | 11.39 | 21.45 | 0.2 |
| 4 | 7.7 | 11.22 | 21.85 | 0.25 |
| 5 | 7.61 | 10.79 | 21.98 | 0.25 |
| 6 | 7.51 | 10.91 | 22.1 | 0.25 |
| 7 | 7.42 | 10.71 | 22.25 | 0.25 |
| 8 | 7.86 | 11.53 | 21.25 | 0.25 |
| 9 | 7.93 | 11.27 | 20.81 | 0.25 |
| 10 | 7.95 | 11.32 | 20.35 | 0.25 |
| 11 | 7.97 | 11.3 | 19.89 | 0.25 |
| 13 | 7.59 | 11.04 | 21.27 | 0.3 |
| 14 | 7.46 | 11.14 | 21.44 | 0.3 |
| 15 | 7.35 | 11.05 | 21.61 | 0.3 |
| 16 | 7.7 | 10.9 | 20.9 | 0.3 |
| 17 | 7.77 | 11.48 | 20.52 | 0.3 |
| 18 | 7.79 | 11.18 | 20.13 | 0.3 |
| 19 | 7.82 | 11.31 | 19.75 | 0.3 |
| 20 | 7.82 | 11.15 | 18.79 | 0.3 |
| 21 | 6.94 | 10.58 | 19.46 | 0.35 |
| 22 | 6.57 | 10.39 | 20 | 0.35 |
| 23 | 7.13 | 11.01 | 19.19 | 0.35 |
| 24 | 7.28 | 10.59 | 18.85 | 0.35 |
| 25 | 7.33 | 11.07 | 18.4 | 0.35 |
| 26 | 7.36 | 10.77 | 17.52 | 0.35 |
| 27 | 7.38 | 11.13 | 17.1 | 0.35 |
| 28 | 6.01 | 9.55 | 16.63 | 0.4 |
| 29 | 5.89 | 9.65 | 17.12 | 0.4 |
| 30 | 5.64 | 9.91 | 17.35 | 0.4 |
| 31 | 6.11 | 10.41 | 16.12 | 0.4 |
| 32 | 6.29 | 10.08 | 14.49 | 0.4 |
| 33 | 6.33 | 9.91 | 13.94 | 0.4 |
| 34 | 6.37 | 9.9 | 12.24 | 0.4 |
Publisher’s Note: MDPI stays neutral with regard to jurisdictional claims in published maps and institutional affiliations. |
© 2021 by the authors. Licensee MDPI, Basel, Switzerland. This article is an open access article distributed under the terms and conditions of the Creative Commons Attribution (CC BY) license (https://creativecommons.org/licenses/by/4.0/).
Share and Cite
Louisor, J.; Rohmer, J.; Bulteau, T.; Boulahya, F.; Pedreros, R.; Maspataud, A.; Mugica, J. Deriving the 100-Year Total Water Level around the Coast of Corsica by Combining Trivariate Extreme Value Analysis and Coastal Hydrodynamic Models. J. Mar. Sci. Eng. 2021, 9, 1347. https://doi.org/10.3390/jmse9121347
Louisor J, Rohmer J, Bulteau T, Boulahya F, Pedreros R, Maspataud A, Mugica J. Deriving the 100-Year Total Water Level around the Coast of Corsica by Combining Trivariate Extreme Value Analysis and Coastal Hydrodynamic Models. Journal of Marine Science and Engineering. 2021; 9(12):1347. https://doi.org/10.3390/jmse9121347
Chicago/Turabian StyleLouisor, Jessie, Jérémy Rohmer, Thomas Bulteau, Faïza Boulahya, Rodrigo Pedreros, Aurélie Maspataud, and Julie Mugica. 2021. "Deriving the 100-Year Total Water Level around the Coast of Corsica by Combining Trivariate Extreme Value Analysis and Coastal Hydrodynamic Models" Journal of Marine Science and Engineering 9, no. 12: 1347. https://doi.org/10.3390/jmse9121347