
Climate Change Threats to Two Breakwaters
Principal, William Allsop Consulting Ltd., Abingdon OX12 0AR, Oxon, UK
J. Mar. Sci. Eng. 2022, 10(11), 1613; https://doi.org/10.3390/jmse10111613
Submission received: 8 September 2022
/
Revised: 17 October 2022
/
Accepted: 24 October 2022
/
Published: 1 November 2022
(This article belongs to the Special Issue Advanced Studies in Breakwaters and Coastal Protection)
Abstract
:This paper illustrates by practical examples how designers/owners can analyse the potential effects of climate change on coastal structures. It presents two example structures: at Brighton Marina (Sussex, England) and La Collette reclamation (St Helier, Jersey). In both instances the results of Joint Probability Analysis are used to define test conditions, noting that these will be different for different responses. Whilst the solutions for climate change challenges to each structure are different, the paper illustrates example solutions that may be relatively easily deployed.
1. Introduction
1.1. How May Climate Change Influence the Performance of Existing Structures?
The primary mechanisms by which climate change may affect breakwaters and seawalls is by elevated water levels increasing wave overtopping. The increased water depths will also reduce the influence of depth-limiting, in turn increasing incident (near structure) wave heights. Increased wave heights will not only increase overtopping but may also increase armour movement (damage) on the front face, and movement/loads to the crest and/or rear armour driven by that increased overtopping. Another (potential) failure mode that might be influenced by climate change could be toe scour, a process that can undermine an armoured slope and vertical wall sections.
Sea levels change over many time scales, some short, some much longer. Some changes are predictable, others are much more difficult to quantify. However, where we or our predecessors have built harbours or sea defences, we need those structures to continue to provide protection without attracting significant costs to resist climate change effects. Our solutions must therefore be sustainable, with an appropriately long structure life, and should be easily adaptable to resist climate change effects.
It is now appreciated that sea levels will continue to rise. Various sources are available for predicting sea level. There are however markedly fewer data on changes to wave conditions, although it is generally expected that climate changes may increase severe storm wind speeds and hence increase wave heights.
In general, the rates of most climate changes are anticipated to be slow, so changes are most likely to be significant over a typical economic life of 30 years. However, some breakwaters (including the two discussed here) defend infrastructure that requires a much longer life, perhaps longer than 100 years, and must provide protection even at the end of that duration to an annual recurrence interval equivalent to a 1:200 year return period.
When considering existing infrastructure, it is noted that any breakwater or sea defence will embody historical carbon emissions. The pursuit of ‘zero-carbon’ targets therefore suggest that the useful life of existing infrastructure should be extended as far as possible with minimal further carbon emissions.
1.2. Outline of This Paper
This paper describes example climate change threats (primarily increased water levels and/or wave conditions) to coastal structures in general, and then illustrates these for two sites in UK with measures recommended to resist or mitigate those threats [1,2].
The paper starts with a general introduction to the potential effects of climate change as perceived by owners of existing infrastructure and reviews guidance at the time of the analysis projects on climate change ‘agents’ for coastal developments in the UK. The paper then describes how climate change threats projected in 2008–2010 were simulated for structures in Brighton (Sussex) [1] then in St Helier (Jersey) [2] and identifies the mitigation measures accepted by the owners of those structures.
CAVEAT
The base studies discussed in this paper were conducted around 2006 to 2009. The guidance on climate change used in the studies reported here were those available around two to three years prior to those studies. Increases in wave conditions and water levels discussed here are therefore not necessarily those that are currently advised.
It is also noted that neither scheme required UK public funding, so the project owners were free to adopt estimates of climate change effects that they deemed appropriate for their own needs.
2. Future Climate Change Scenarios
The climate change scenarios discussed here are not the latest guidance but do summarise advice available to coastal infrastructure owners at the times of the analysis discussed in the paper. More recent discussions on sea level changes are given for the UK [3,4].
2.1. Introduction
In these projects, we distinguish between predictions, projections and precautionary practice. Predictions are typically based on measurements, analysis and extrapolation beyond the period of the data. Examples are that sea level will continue to rise in the future, based on the measurement of mean sea level rise in the recent past. Similarly, a 1:100 year return period wave condition may be extrapolated from (say) 10 or 20 years of wave measurements. Projections are typically based on measurements, coupled with assumptions (perhaps of statistical stationarity) and sometimes modelling. Examples are quantification of future temperature rise and mean sea level rise, based on validated numerical models, rerun for a range of assumed social and political scenarios, and for given relationships between physical variables. Precautionary practice may be based on a mixture of predictions and projections, the value and design life of a project, and the degree of risk to people and property that is acceptable. Examples are the choice of the return period for which to design and the future climate change allowances used, both of which are often prescribed in national best practice guidelines.
One can also distinguish between climate change allowances being built into the design and the sensitivity and future adaptability of the design based on present day conditions to changes that might occur in the future.
Both future climate change projections and guidelines for precautionary practice are updated from time to time, typically at about seven-year intervals in the UK. This section of the paper explores the different allowances for possible future changes in sea level, surge and waves that would have been appropriate under different projections and guidelines.
The Inter-Governmental Panel on Climate Change is the global scientific authority on past and projected future climate change. Below that there may be national scientific authorities, for example the UK Climate Impacts Programme. Below that there may be both country-specific and industry-specific projections and guidelines, for example adaptation to UK flood risks (https://www.ukcip.org.uk/preparing-society-for-future-weather-impacts/ (accessed on 1 November 2017)). In the context of the documents discussed in the remainder of this section, the UK Department for the Environment, Food and Rural Affairs (Defra) has the policy-making role in England and Wales and the Environment Agency the regulatory role.
2.2. Recent Observations
To put the predictions discussed below into context [3,4] provide recent data on sea level measurements around the UK.
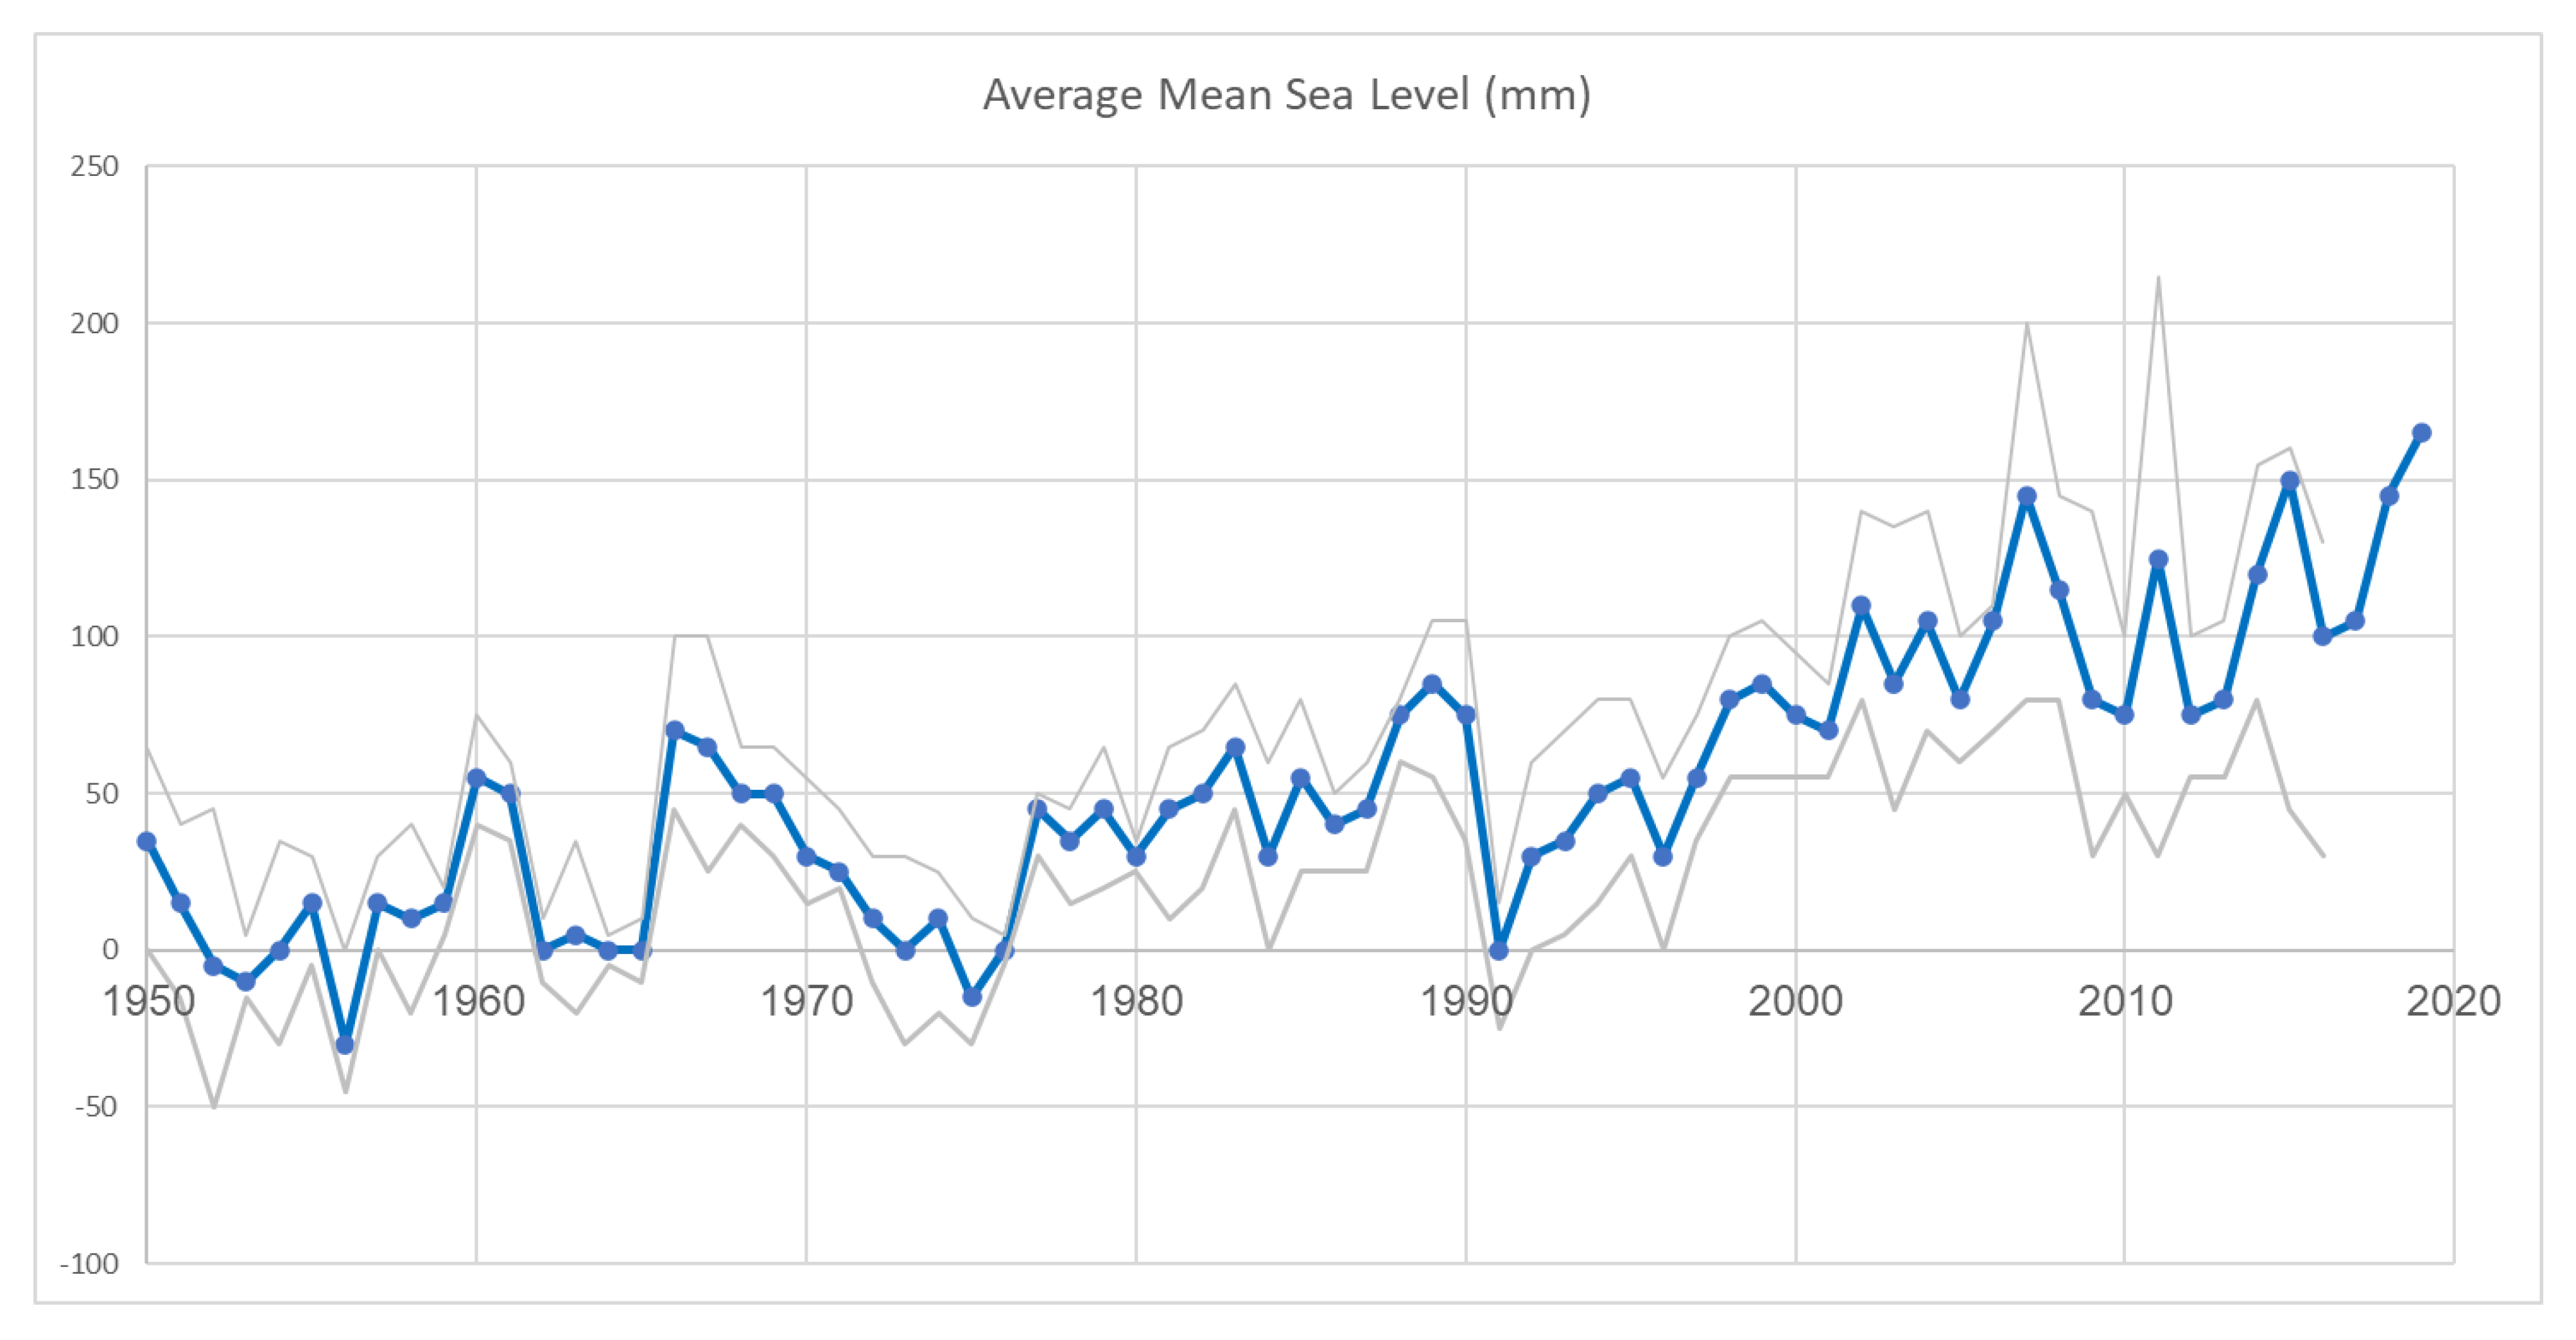
Sea level data for five UK stations (Aberdeen, North Shields, Sheerness, Newlyn and Liverpool) have been plotted in Figure 1, (mean values in heavy blue, one standard of deviation errors in light grey) using data from Kendon et al. (2021) [3]. Sea level trends have not been simple linear increases, with the trends rising from 1.8 mm/year (1958–2018), through 2.4 mm/year to 3.6 mm/year (1993–2019) [3].
Example spatial variations of net sea level rise around UK (adjusted for land movement) [4] are summarised in Table 1. As might be expected, the ~4 mm/year rises shown in Table 1 reasonably match the recommended value of 4 mm/year recommended for use up to 2025 in Section 2.4 and Section 2.5.
2.3. Guidance from IPCC (2007)
In the absence of national or local climate change projections or guidelines, appropriate future climate change allowances might be derived from the IPCC Inter-Governmental Panel’s physical science basis report [5].
The global projections from IPCC might be tempered by the recent rate of mean sea level changes measured by tide gauges local to the project sites. Long term tide gauge data from southern England and northern France, show that the area would be well represented by the globally averaged rates of mean sea level change [6]. The recent rate of rise for St. Helier on Jersey is 2.30 ± 1.37 mm/year and for Newhaven (the nearest long term tide gauge to Brighton) is 2.27 ± 0.27 mm/year.
2.4. Guidance from UKCIP (2009)
The United Kingdom Climate Impacts Programme’s UKCP09 marine and coastal projections [7] provided the projections of future mean sea level rise for three modelled scenarios, namely low emissions, medium emissions and high emissions, and one desk study scenario called H++, representing a plausible upper limit to future changes. Its mean sea level rise projections, averaged over the whole of the UK between 1980–1999 and 2090–2099, are summarised in Table 2 [7].
Time-based graphs by UKCIP project an accelerating rate of rise, with about 40% of the rise summarised in Table 2, occurring in the first half of the period and 60% in the second half [7]. For the relative (that is relative to the local land level) mean sea level rise in London and on the south coast of England, UKCIP adds a further 0.075 m per century based on a current land level fall rate for SE England of 0.75 mm/year.
UKCIP also model changes in surges and waves for the low, medium and high emissions scenarios, but projected changes are minimal for the south coast of England and the English Channel (the sea area between England and France). Any allowance for change in wave conditions in coastal studies would therefore be precautionary.
2.5. Guidance from UK Government, Defra (2006)
UK Government Department for the Environment, Food and Rural Affairs (Defra) provided guidelines on future climate change allowances starting from about 2007 to 2011 [8], giving precautionary allowances for mean sea level rise for coastal defence projects seeking national government funding in England, Scotland and Wales.
The mean sea level rise allowance is given, relative to present day levels, as:
- add 4.0 mm/year to 2025;
- and add 8.5 mm/year from 2025 to 2055;
- and add 12.0 mm/year from 2055 to 2085;
- and add 15.0 mm/year from 2085 to 2115.
The wave condition allowance is given, relative to present day conditions, as:
- either add 5% to offshore wave height to 2055;
- or add 10% to offshore wave height from 2055 to 2115.
The Defra guidelines [8] were simple to be applied, offered users very little discretion, and assisted the comparison on an equal basis of projects competing for limited funding.
2.6. Guidance from the UK Environment Agency (2011)
The Environment Agency provides guidelines on future climate change allowances for coastal defence projects seeking national government funding in England [9]. It expects that a wider range of scenarios will be considered, demands more of users and permits them rather more discretion than Defra [8]. The four scenarios for future mean sea level rise described by Environment Agency are:
Lower end, based on the 50th percentile projection for the UKCP09 low emissions scenario;
Change factor, based on the 95th percentile projection for the UKCP09 medium emissions scenario.
Upper end, relative to present day levels:
- add 4 mm/year to 2025;
- and add 7 mm/year from 2026 to 2050;
- and add 11 mm/year from 2051 to 2080;
- and add 15 mm/year from 2081 to 2115.
High++, relative to present day values:
- add 6 mm/year to 2025;
- and add 12.5 mm/year from 2026 to 2050;
- and add 24 mm/year from 2051 to 2080;
- and add 33 mm/year from 2081 to 2115.
Possible future changes in surges and waves conclude that best estimates are for minimal changes. However, for the upper end and high++ scenarios, it recommends an additional allowance for change in surge when estimating future extreme sea levels:
- either add 0.20 m to extreme sea levels by 2020s;
- or add 0.35 m to extreme sea levels by 2050s;
- or add 0.70 m to extreme sea levels by 2080s.
3. Brighton Marina Breakwaters, Sussex, UK
3.1. Background
The Brighton Marina to the east of Brighton, on an open coastline marked by shingle beaches backed by chalk cliffs, was first conceived around 1840. The harbour idea was then revived in 1963, and the current harbour was constructed in 1972–1977 [10].
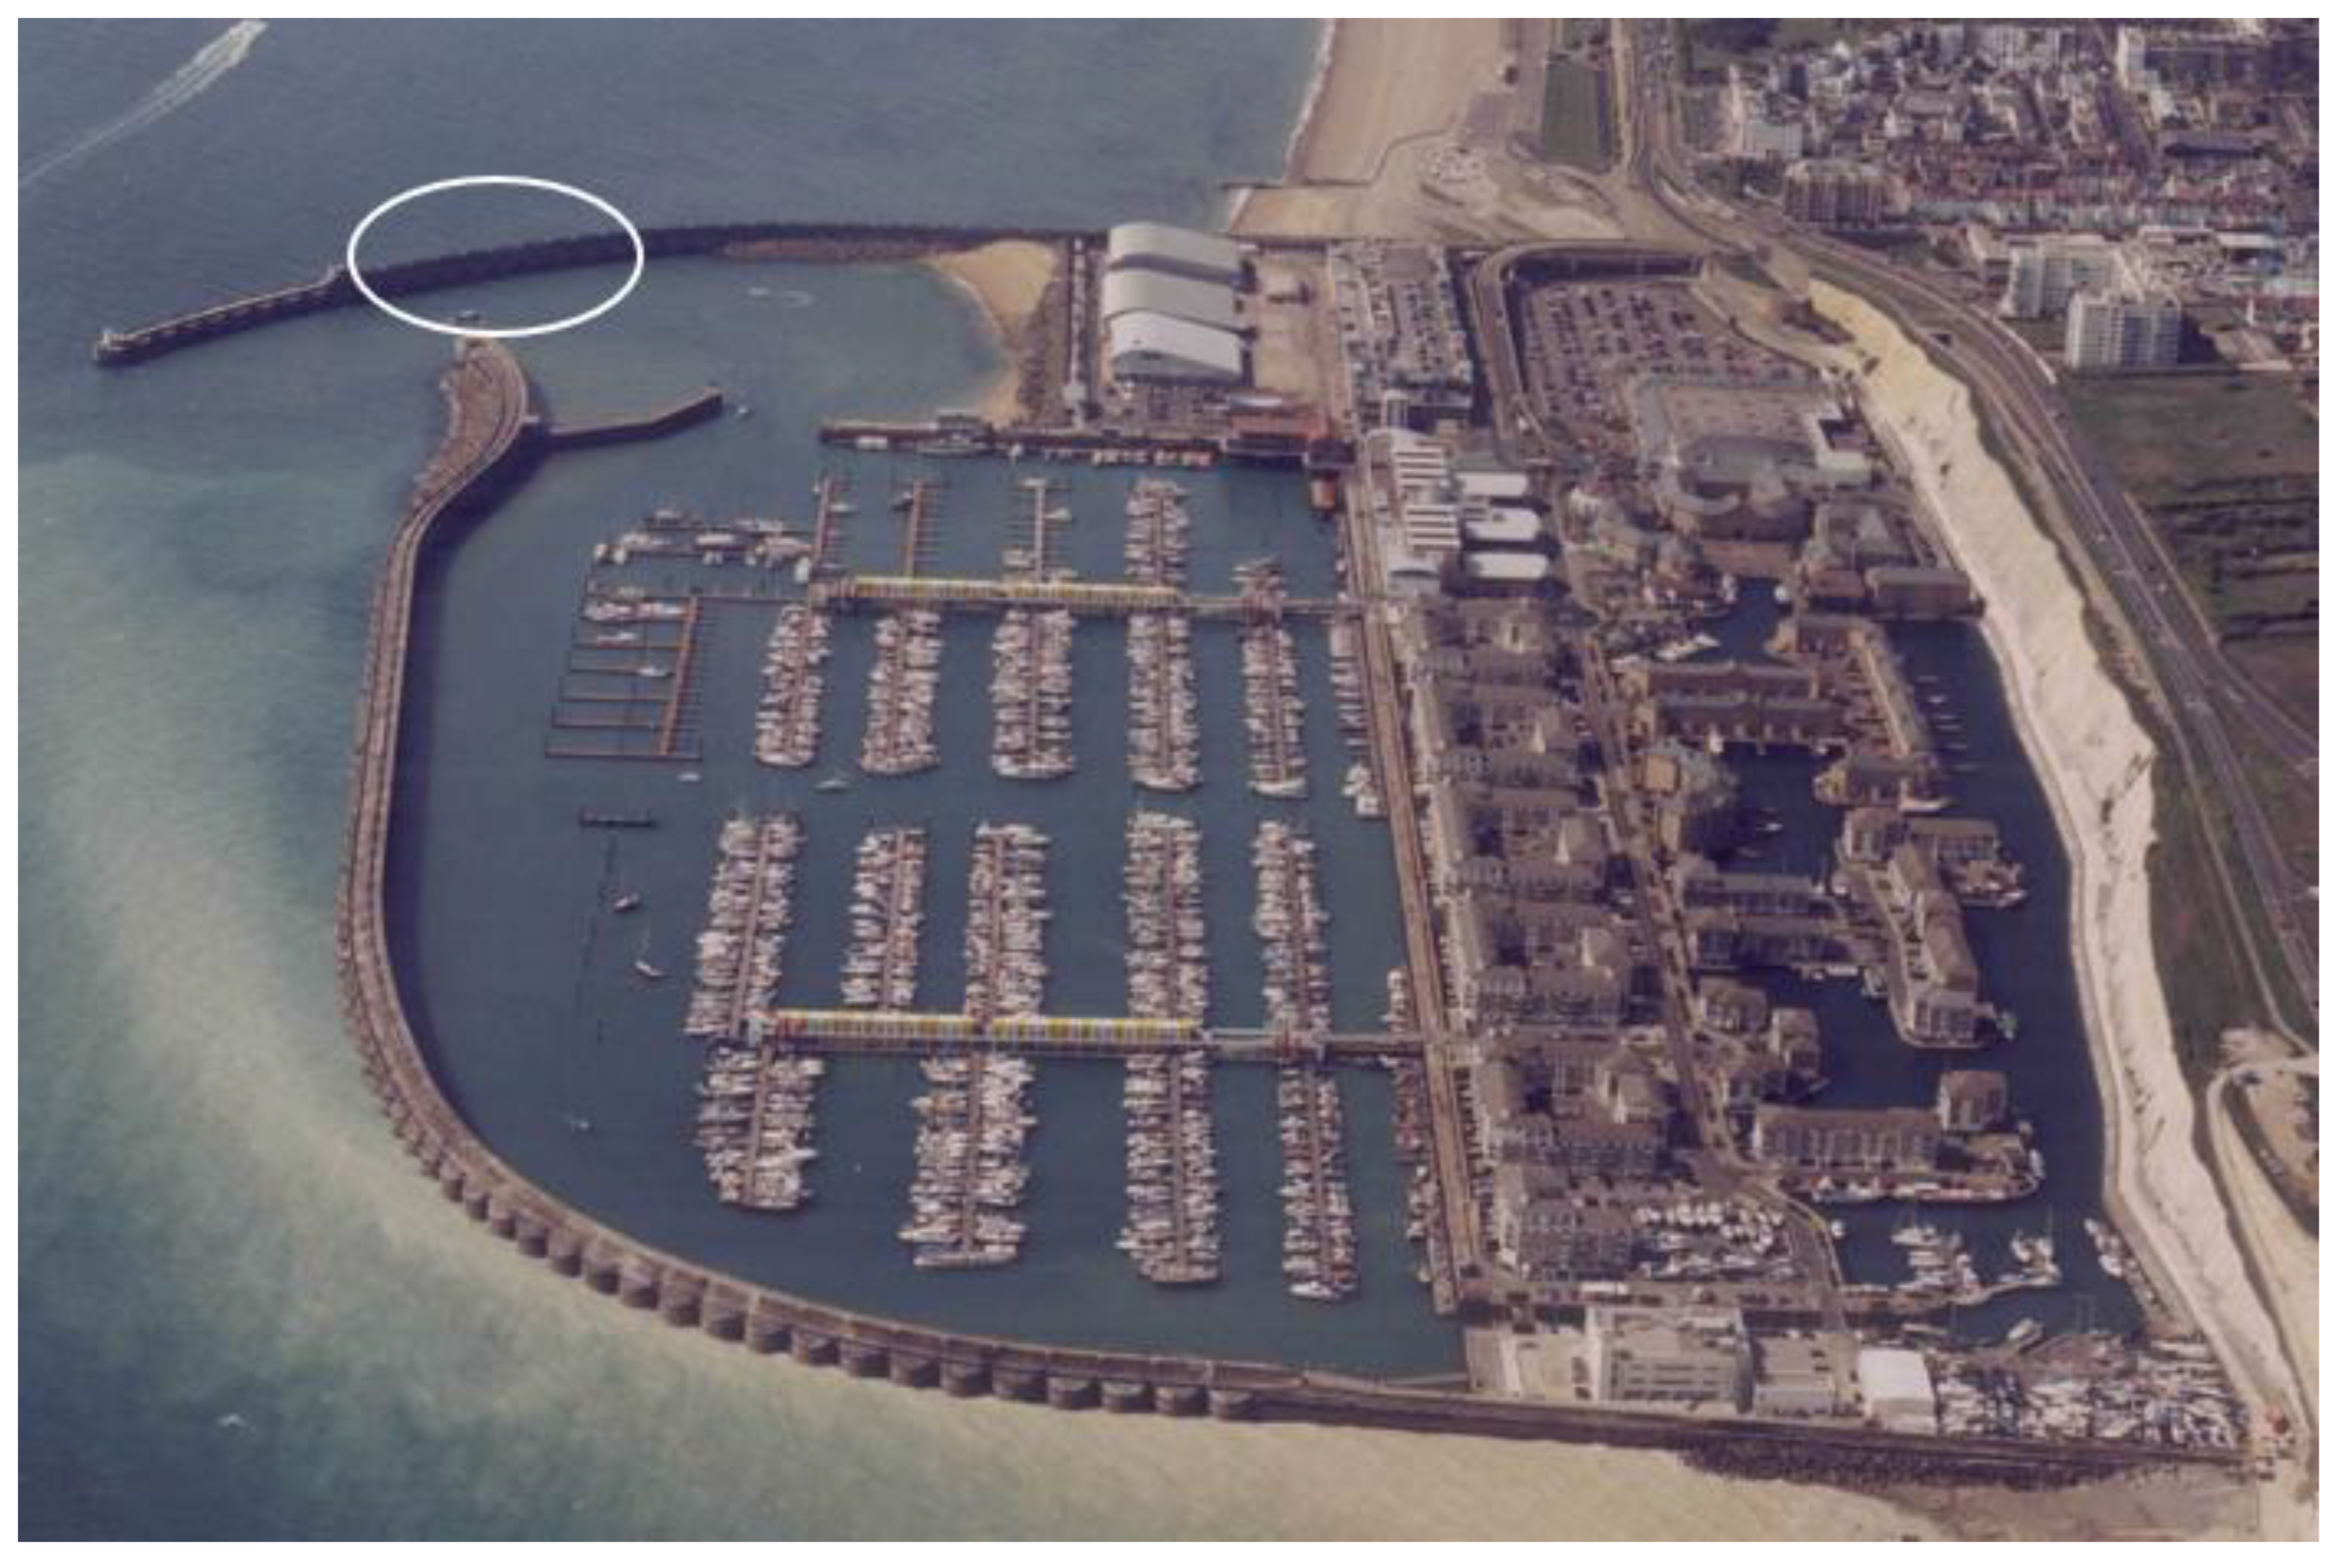
The harbour area is protected from waves of Hs ≈ 5 m by two breakwaters formed by circular caissons placed end-over-end. The harbour is divided into the Outer Harbour, Inner Harbour and the Tidal Harbour, see Figure 2.
Over the 30+ years since its original construction, the selected lengths of the breakwater foundation have required repair to enhance and extend toe protection. The sections of the concrete superstructure have needed repair to degraded concrete. The integrity of the West and East Breakwaters is essential to the safety and operation of infrastructure around both Inner and Outer Harbours. Whilst some damage or settlement (even the loss of a single caisson) might be tolerated from the perspective of hydraulic performance, structural damage would undermine public confidence in the safety of the harbour so could not be tolerated.
The long-term strategy study by HR Wallingford for Brighton Marina Estate Management (BMEM) assessed key hydraulic and structural responses under various present and future climate change scenarios. The study [1] was conducted in five main stages:
- Stage 0—Wave conditions and water levels.
- Stage 1—Local scour/bed condition.
- Stage 2—Wave loadings and overtopping.
- Stage 3—Option analysis using results of Stages 0–2.
- Stage 4—Physical model to measure overtopping and loading responses.
There was naturally a degree of circularity in the studies as the Stage 4 model testing did require some revisiting of results from earlier stages. In particular, the options analysis in Stage 3 was revisited during and after the physical model tests in Stage 4.
For convenience, the breakwaters were divided into five lengths, each assigned a representative orientation, toe level and approach bed slope. This paper discusses the outer part of the West Breakwater (ringed in Figure 2) where wave forces and overtopping are likely to be greatest.
3.2. Wave Conditions and Water Levels
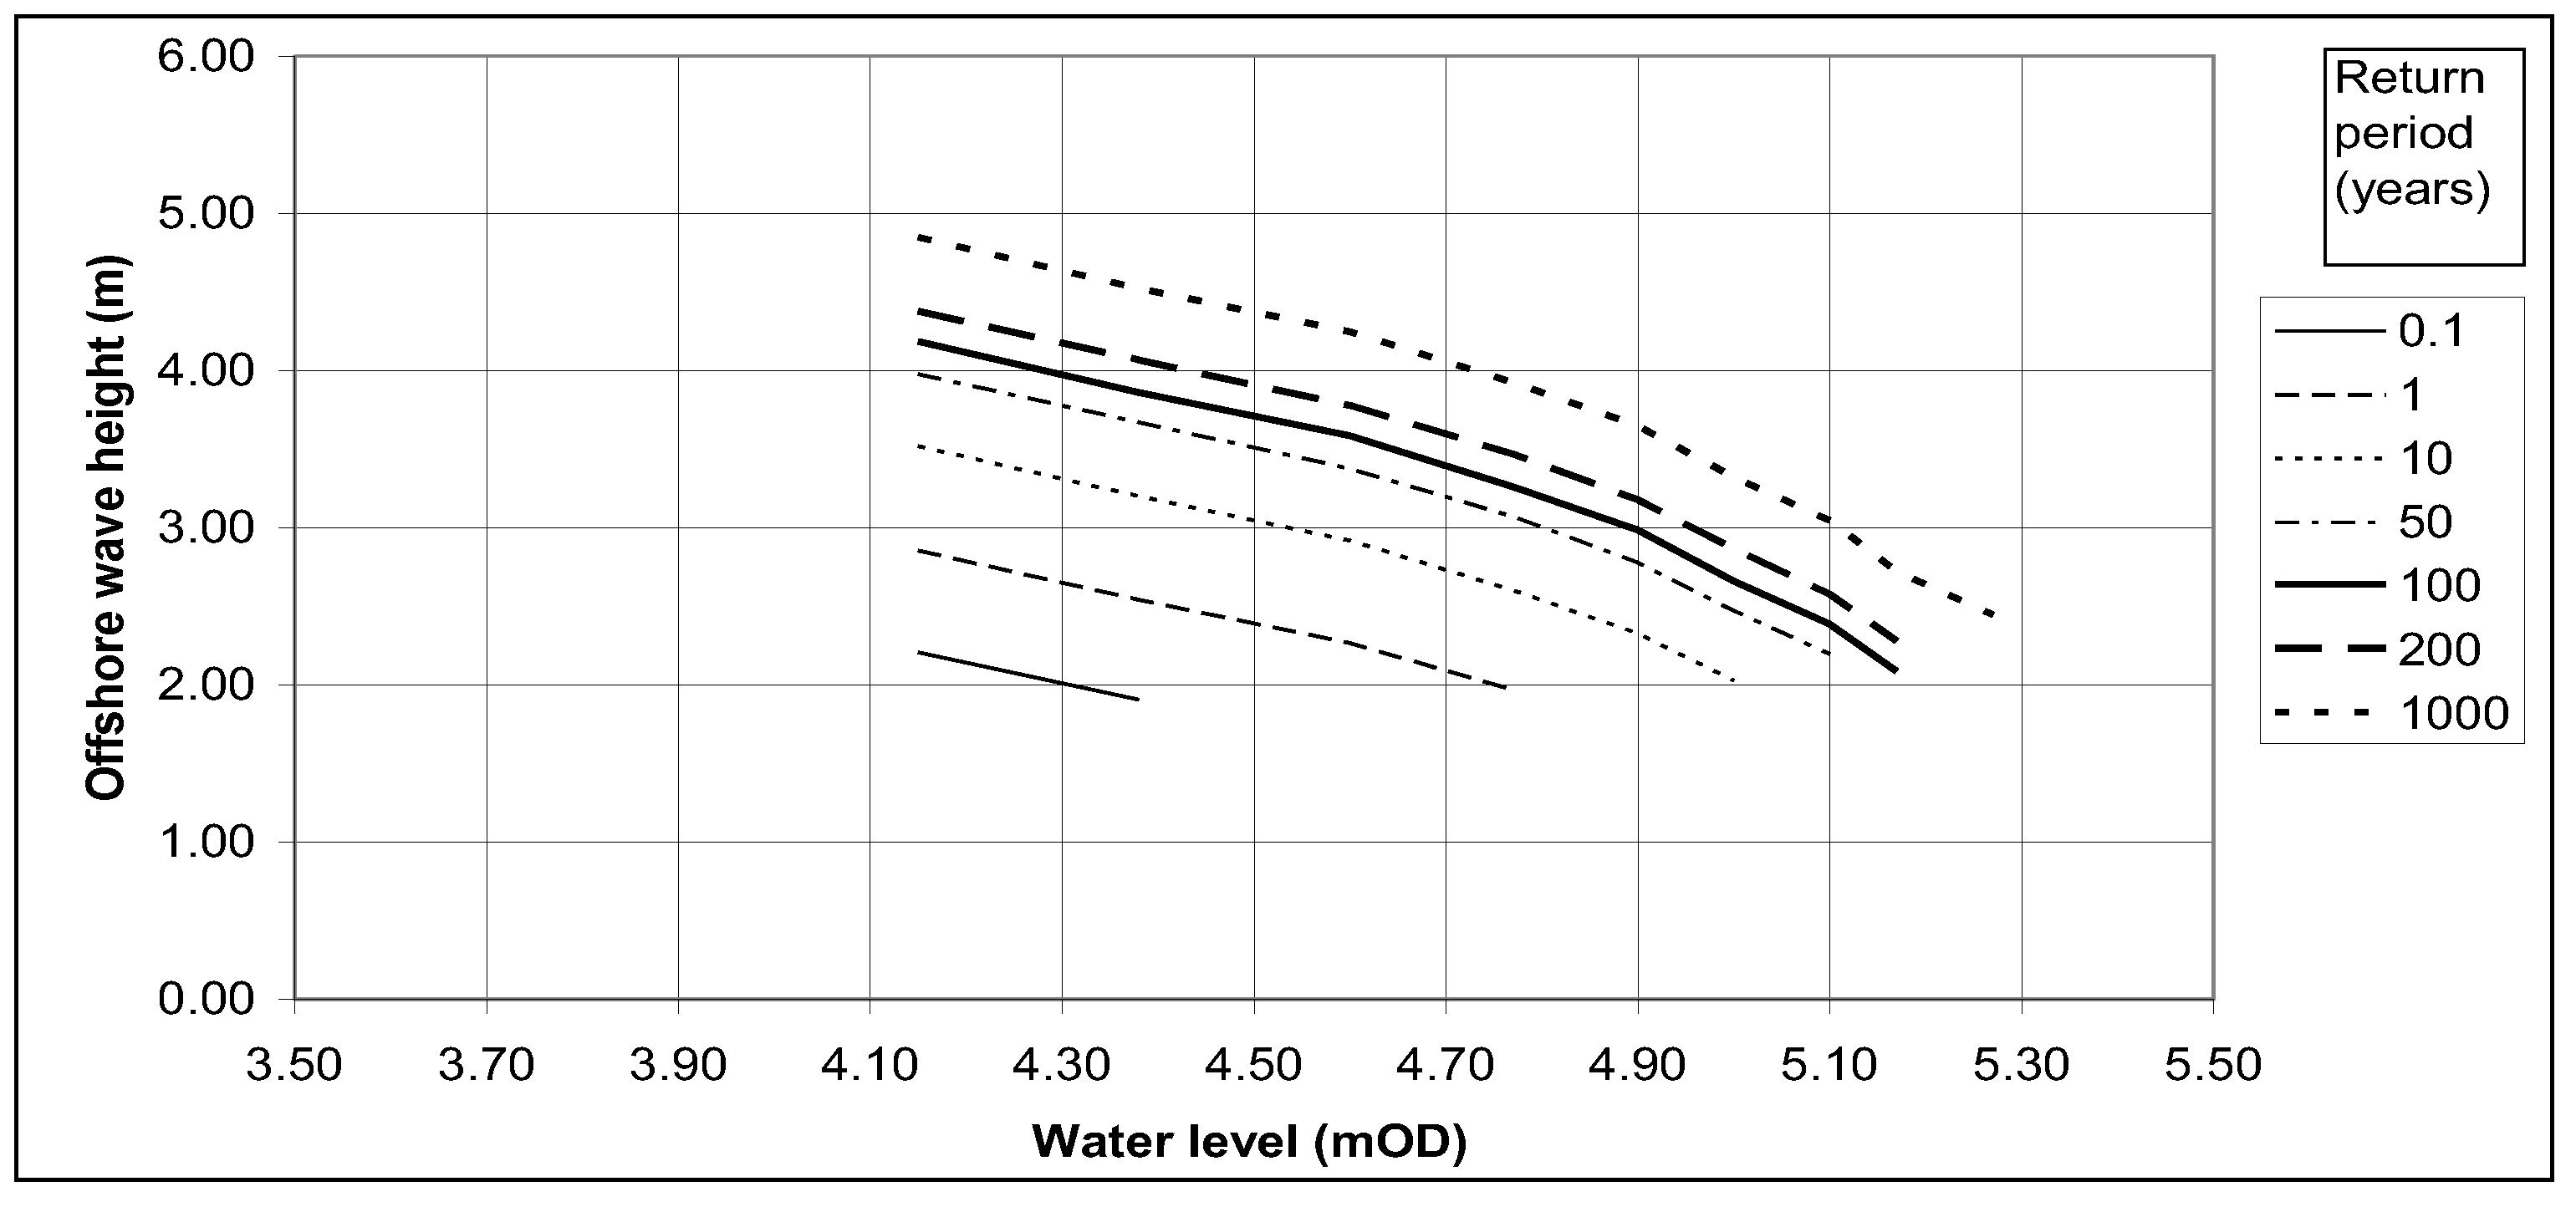
The analysis of waves and water levels in Stage 0 focussed on setting appropriate water level and wave conditions to be used in the ‘futures’ analysis. The main outputs from Stage 0 were presented as joint probability analysis (JPA) curves derived by the method of Hawkes [11] showing wave height and sea level combinations for specified total or overall return periods (see example in Figure 3). One present day and three future scenarios were used to represent potential climate change scenarios: present day; two projections based on Defra guidance taken to 2057 or to 2107; and UKCIP medium-low projection taken to 2057. Each future scenario increased water levels and wave heights. Waves were modelled from 170° N and 210° N, directions likely to cause the most response.
The use of the JPA curves emphasises that there is no single ‘worst case’ combination, so the analysis of different responses needs to explore each response over a range of wave and water level combinations. For instance, with the overtopping of the quay areas within the Inner Harbour, the main threat would be very high water levels but probably small wave heights. Contrarily, the wave overtopping of the breakwaters may be greatest under combined high water level and moderate to high wave conditions.
Bed scour may, however, reach a maximum for lower water levels and high wave conditions. The various different combinations of wave height and water levels (at the same return periods) were therefore tested to identify response maxima.
The author’s experience of applying JPA curves to example structures is that wave forces generally reach their maxima when wave heights are maximised, but overtopping is low, so water levels are below maxima and coincide with none of the simple combinations above.
3.3. Scour
The analysis of scour/erosion of the chalk bed in front of the breakwaters used the original bed levels and then compared them with levels measured 30 years later. The potential for bed scour was assessed using bed shear stresses calculated by Soulsby’s method [12] for 1:50 year return conditions. Historical data on bed scour at Brighton had already suggested that the chalk might erode once shear stresses exceed 20 N/m2.
Each futures scenario envisaged increases in water levels and of wave heights and period. By reducing bed velocities, increases in water levels on their own would reduce scour potential. Increasing wave heights might partly reverse this effect but this is complicated where waves are depth-limited because higher water levels permit larger incident waves. Taken overall, the analysis suggested that scour will not increase significantly, indeed might possibly reduce, although some areas may continue to experience scour at rates equivalent to those seen over the last 30 years.
3.4. Wave Overtopping
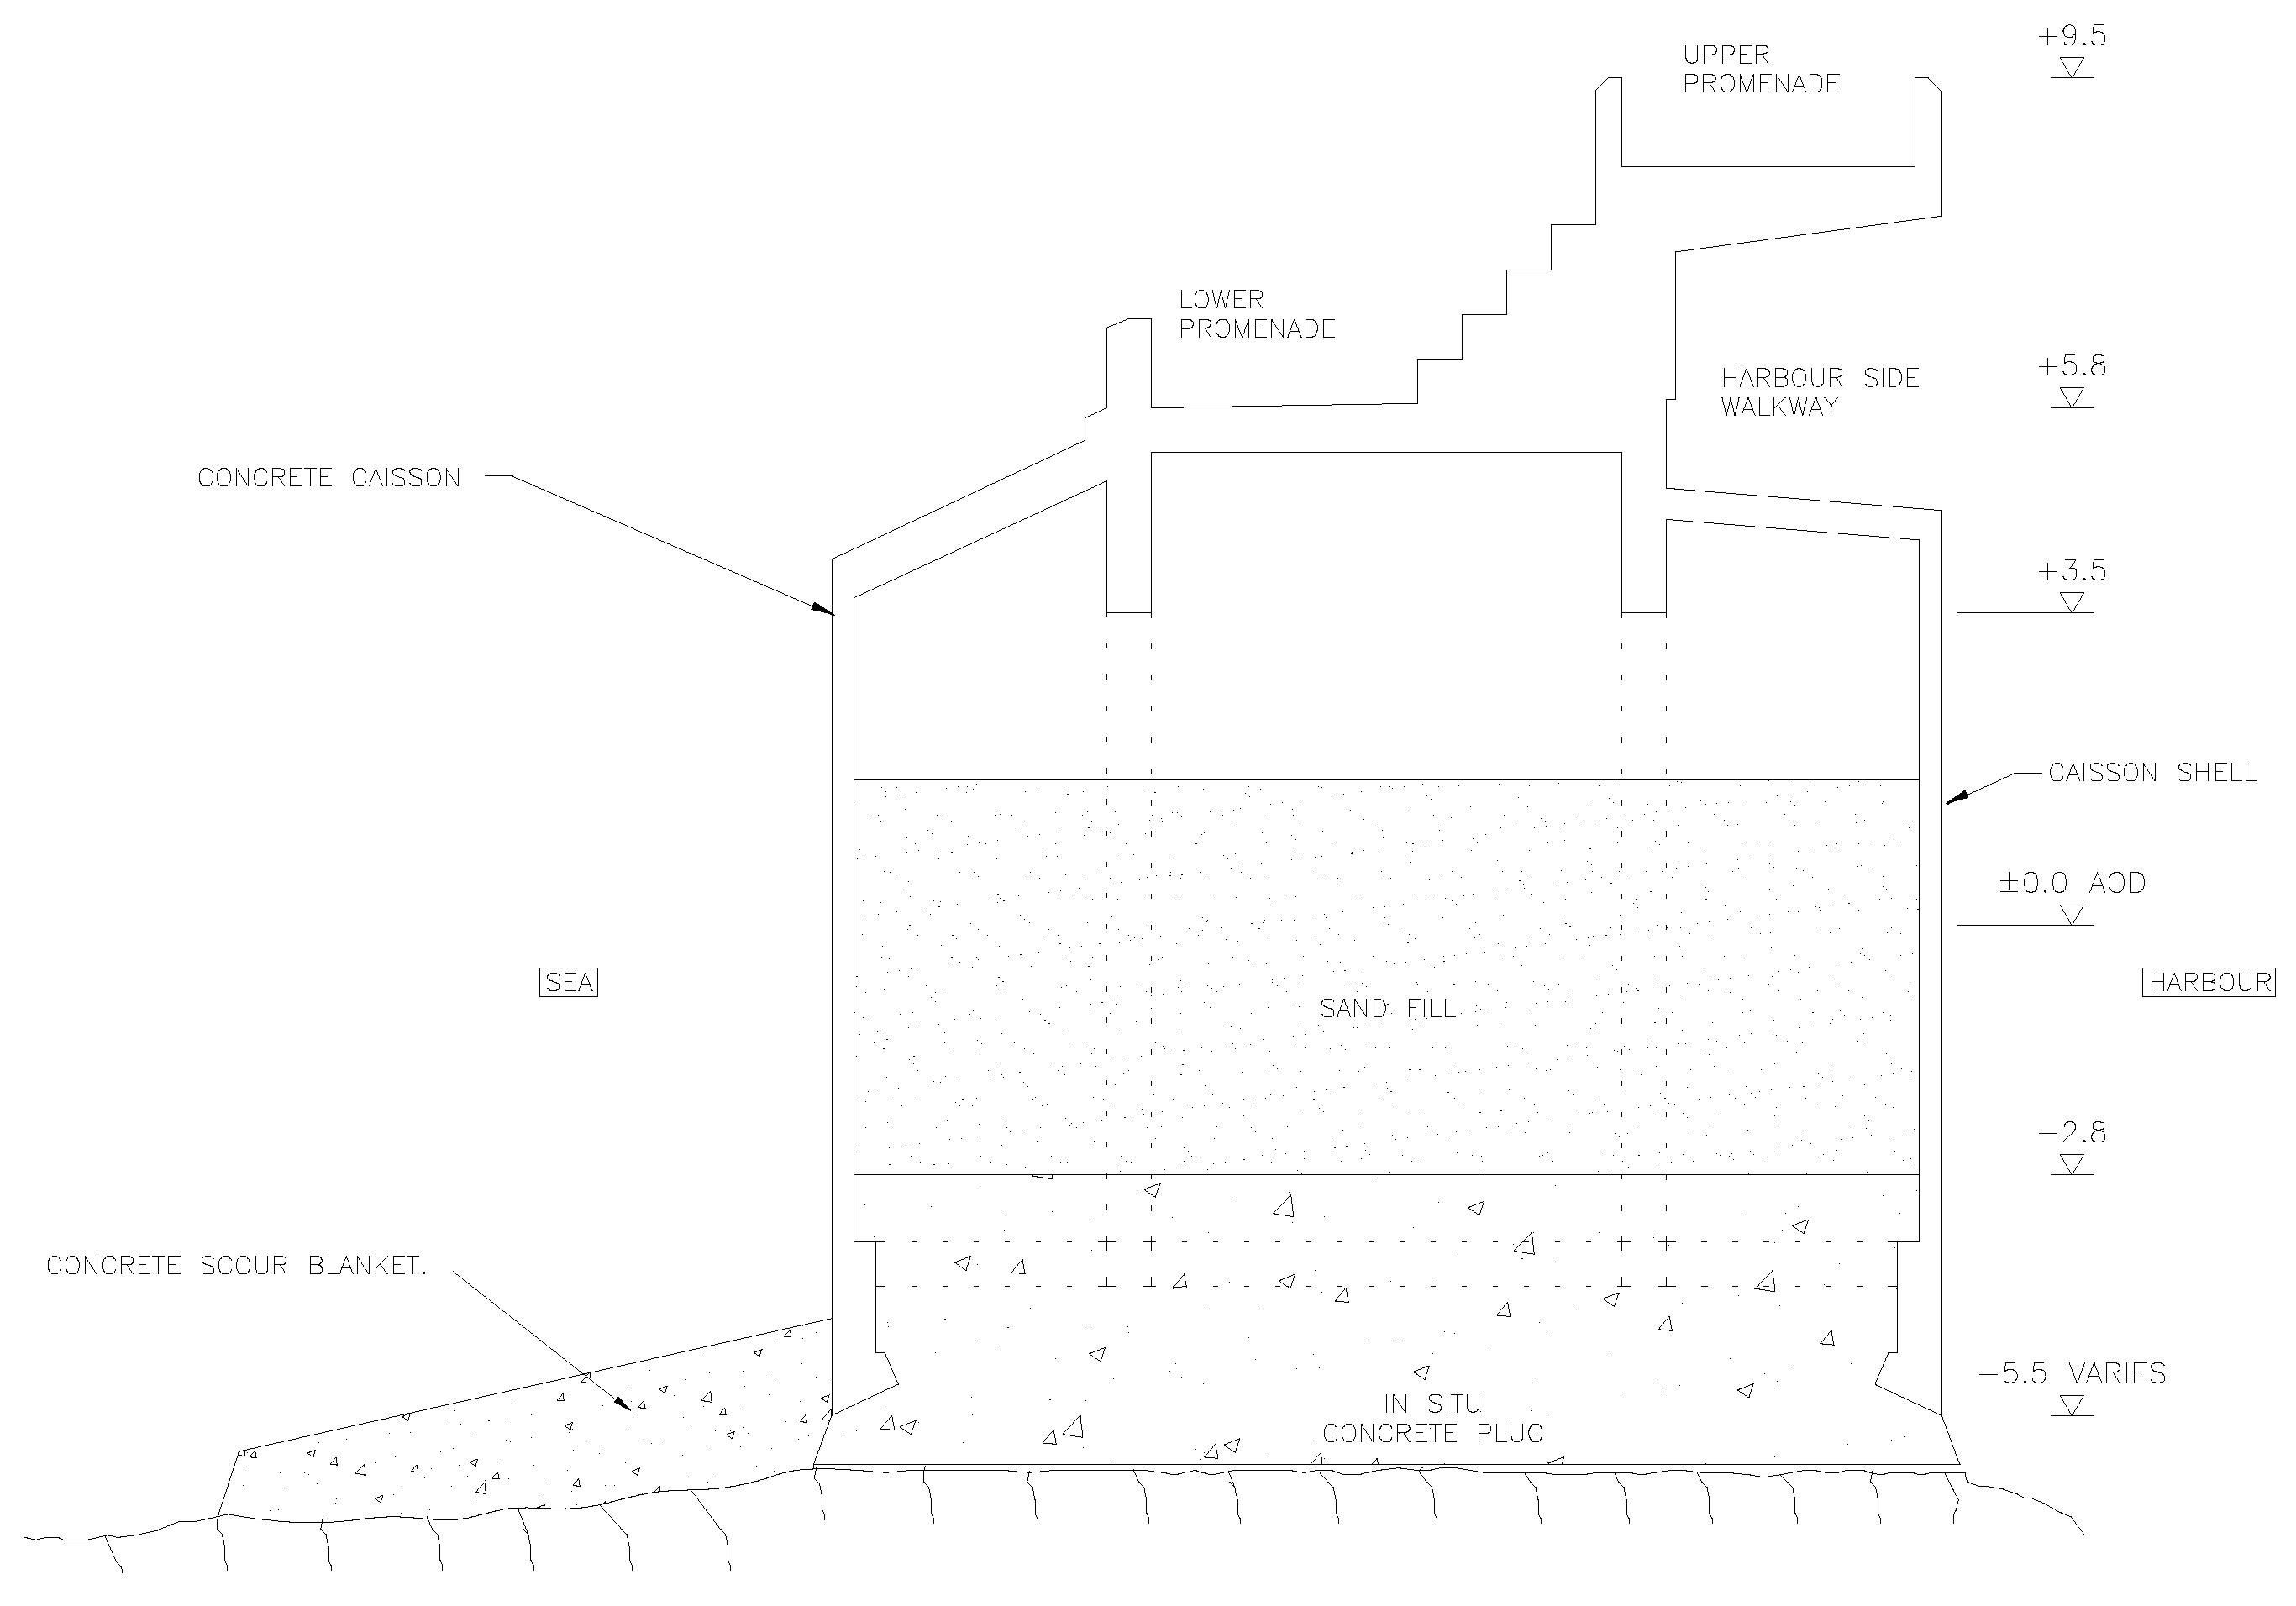
Overtopping for a breakwater as complex in plan and elevation as these caissons (see Figure 4) cannot easily be predicted by simple empirical methods, nor were overtopping measurements available from the original modelling. The problem therefore needed to be simplified for the initial analysis but those simplifications would need to be validated (later) against the Stage 4 model test data. In analysing the overtopping, we judged that the plan-shaped indents and caisson crest/promenade features to be small in relation to wave heights and wave lengths. As with many vertical walls, a critical step was to distinguish between ‘impacting’ or ‘pulsating’ conditions using EurOtop [13,14].
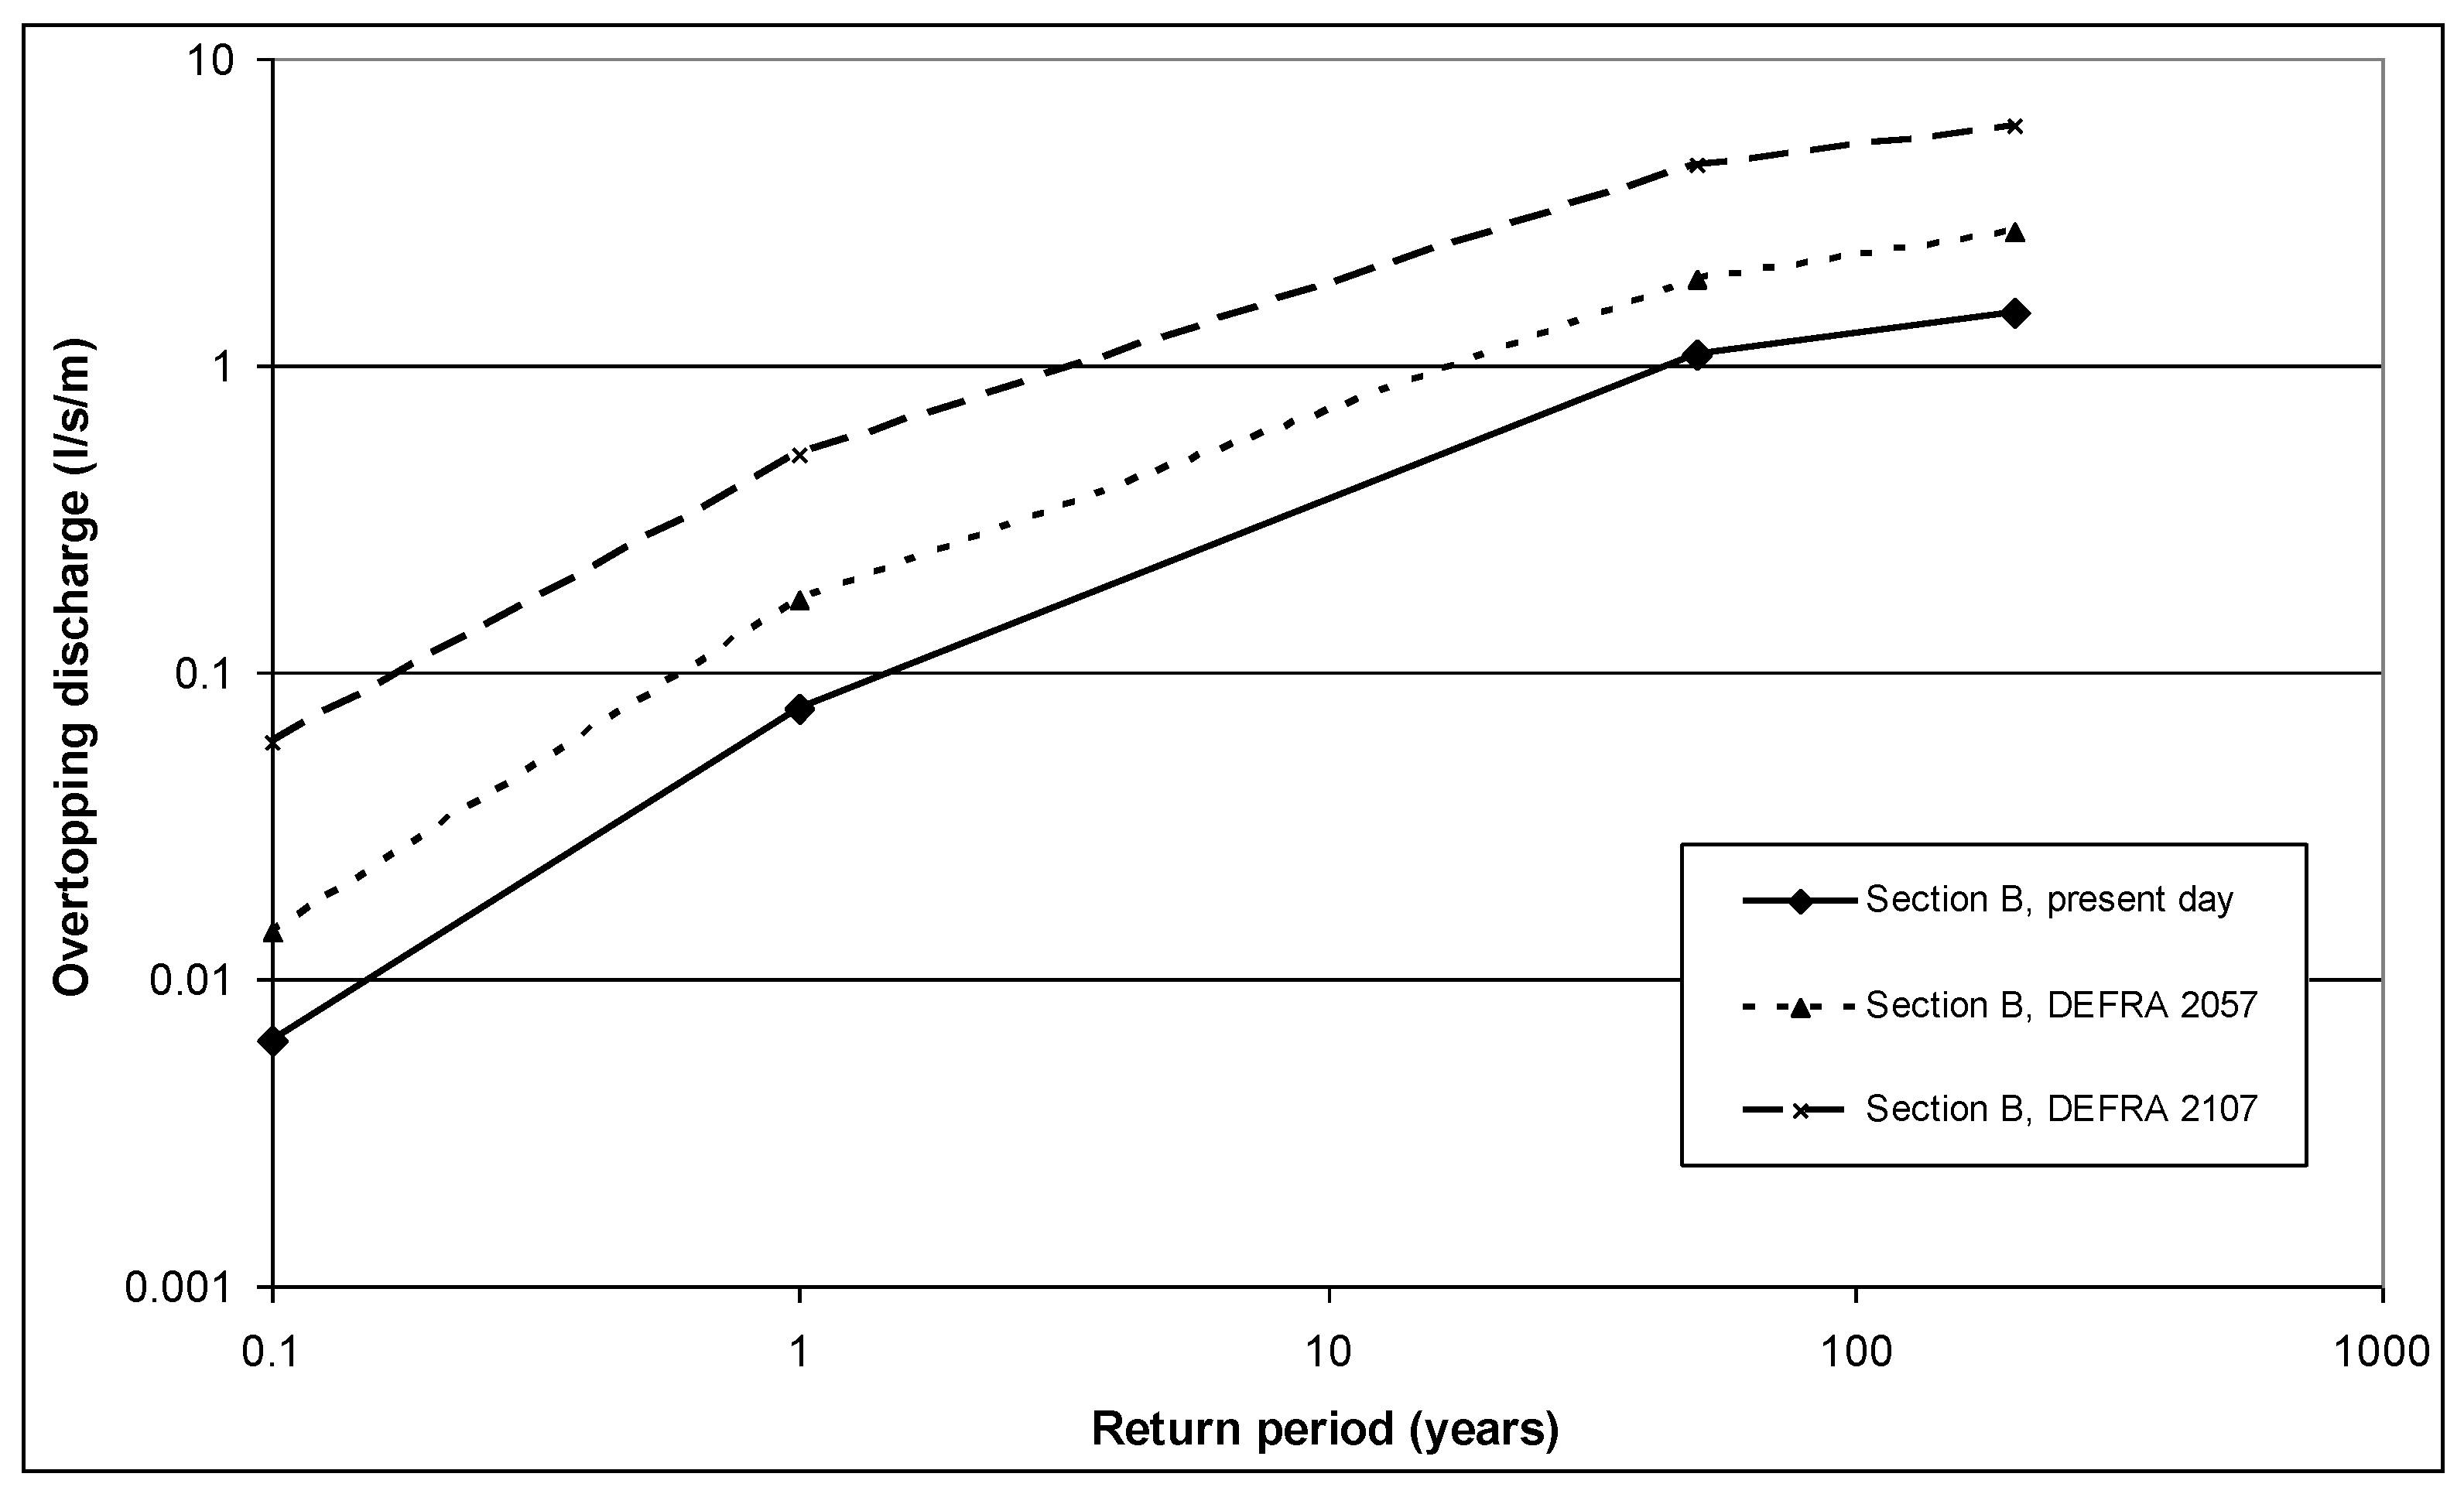
Calculations using the EurOtop methods demonstrated that overtopping discharges were always greatest for the Defra 2107 condition, see example in Figure 5, when overtopping might increase by factors of 4 to 12× from present day conditions. Rerunning the overtopping simulations for the revised crest levels, however, showed that these increases might easily be countered by raising the crest by little more than 0.75 m.
3.5. Wave Loadings
The main prediction method for wave loads by Goda [15,16] can be used to give predictions of quasi-static wave loads. The Brighton caissons are in close contact with the chalk seabed, so wave uplift forces (Fu) were not included. The physical model measurements of wave pressures on selected caissons in Stage 4 were then used to adjust the hypothetical pressures predicted by this simple method.
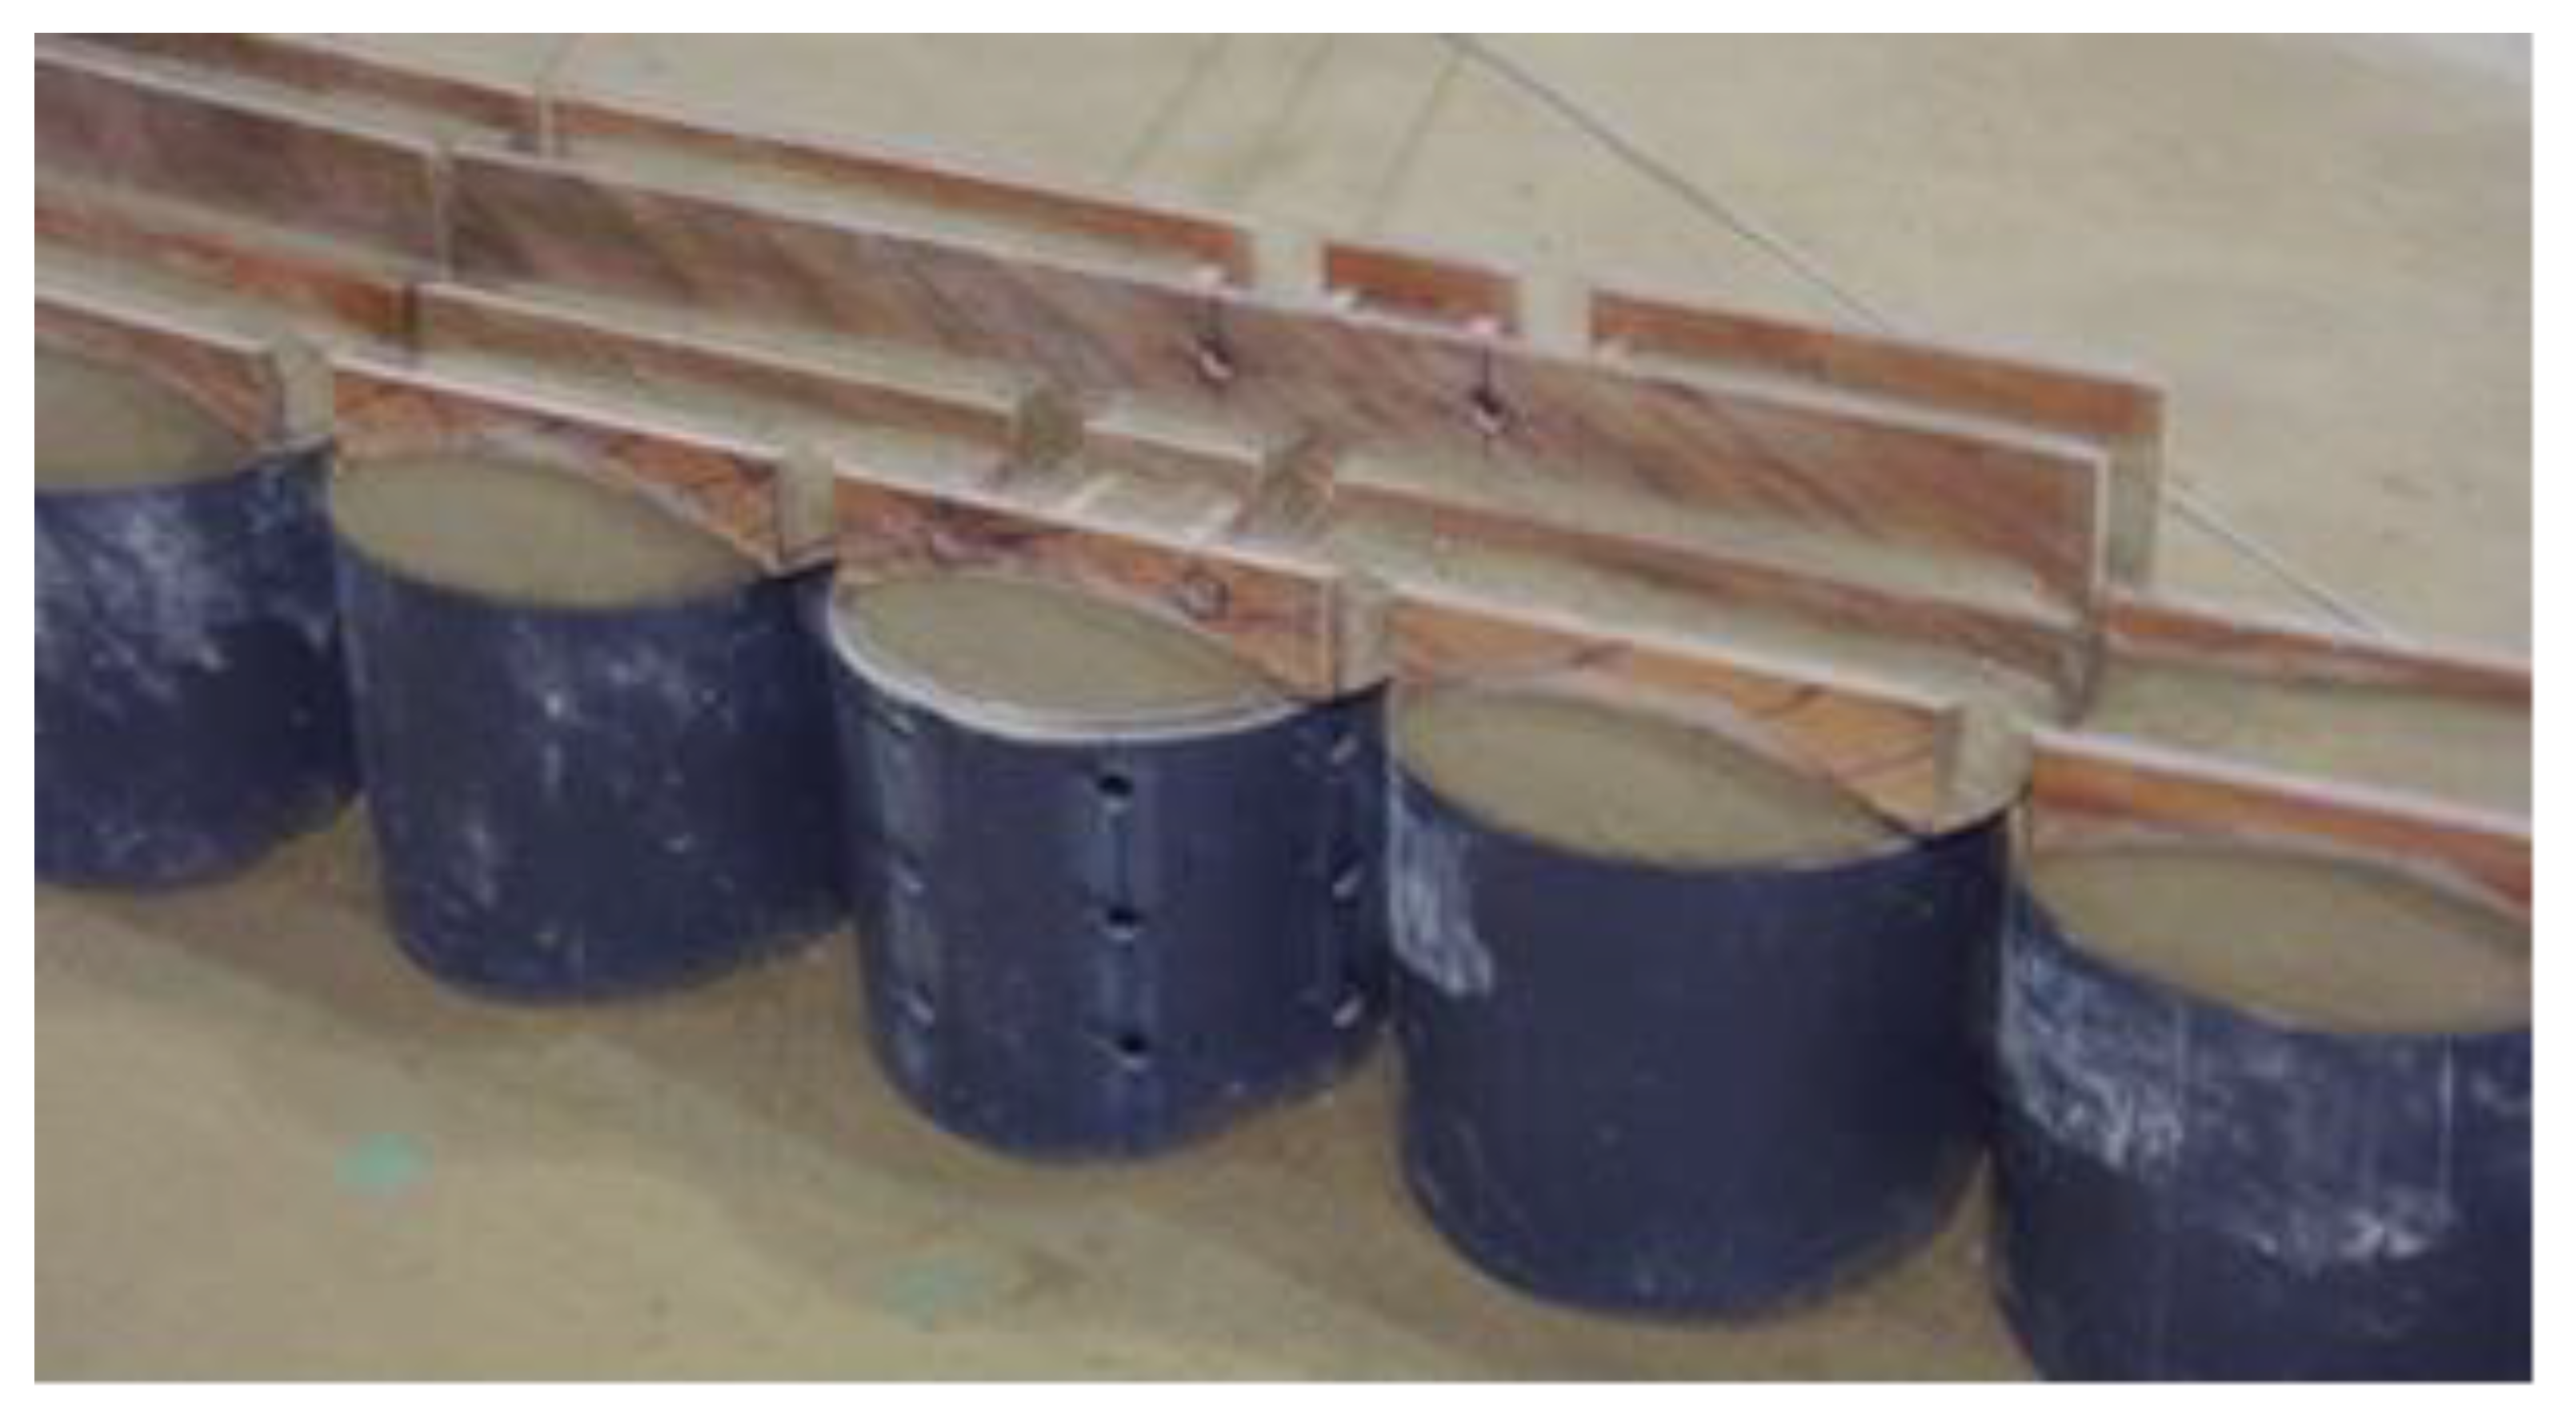
In the physical model tests at a scale of 1:40, a 3D section of seabed bathymetry was constructed using a cement mortar overlay on compacted fill. A representative section of the West Breakwater centred on caisson W26 was reproduced using cylindrical pipe sections to represent the caissons, see Figure 6.
The upper wave walls were simplified from four to two steps between lower and upper walkways. The up-stand walls were formed in plywood, with cement mortar used to form the caisson crest and to provide mass against wave forces. Waves from 170° N and 210° N were calibrated, based on the wave analysis in Stages 0–3, for the return periods of 10:1 year, 1:1 year, 1:50 year and 1:200 year.
Overtopping discharges were measured behind caisson W26 at crest level +9.5 mOD. Overtopping volumes were collected over the width of one caisson then converted to discharge rates in l/s/m width. Pressures from transducers in caisson W26 were summed to give overall forces for tests of 1000 waves logged at 790 Hz (5000 Hz model) converted to pressure (kPa) for each time step. Horizontal force (Fh) and overturning moment (Mt) were calculated at each timestep using the projected area corresponding to each transducer. Forces and moments at 1/250 exceedance (Fh1/250 and Mt1/250) were defined using the average of the top four events.
The first conclusions from the wave force measurements were that loadings under existing conditions did indeed closely match the Goda loads calculated in Stage 2. This reinforced confidence in the use of those earlier calculations.
Using those loads, the sliding analysis, however, gave Factors of Safety that fell below desired levels under present and future 1:200 year conditions (FoS < 1.2, for 1:50 year return conditions). This suggested that individual caissons might already have approached their stability limit at some time over the life so far.
The assumption that each caisson acts independently is, however, pessimistic, as the structural connections between caissons should allow significant load transfer. The main area of uncertainty was then geotechnical restraint against sliding. Using a simple friction relationship only, and assuming no structural attachment to the chalk, caisson stability might be under-estimated. Taken as a whole, it was, however, apparent that measures might be needed to improve restraint.
3.6. Remediation Options
Options were considered to ameliorate one or more of the key potential problems:
- Reduce scour potential, perhaps by protecting the chalk against erosion;
- Reduce wave overtopping under extreme and/or frequent conditions;
- Reduce wave loadings on the caissons, thus improving overall stability and potential for structural damage;
- Improve caisson stability by increasing resistance to loads.
Having discussed the options above with the client, possible modifications tested in the Stage 4 physical model were:
- Existing structure—baseline for the comparison of other options.
- Cusp infills to reduce local overtopping between caissons affecting boats in the harbour during frequent (>1:1 year) storms.
- A recurved wave return wall to reduce overtopping, acknowledging that this could increase wave loadings.
- Low level berm to protect against scour in front of the breakwaters, noting that overtopping and wave loads might be adversely affected.
- Armoured slopes—the most expensive option, but with the potential to eliminate scour, reduce overtopping and reduce loading on the caissons.
Since these studies, aside from repairs to the upper concrete superstructure, and local scour repairs where required, the main remedial action has been to increase caisson weight by infilling selected caissons with inert fill, increasing their weight and improving the Factor of Safety.
Taking a longer look (50 years), a possible long-term solution to both scour and stability problems could be to construct an armoured mound against the front of the existing breakwaters. An armoured mound to a moderate crest level (+4.1 mODN) provided scour protection and slightly reduced horizontal loads but did not significantly increase overtopping under extreme conditions.
A high mound (perhaps to +9.5 mODN) would give greater reductions in wave forces and overtopping for both frequent and extreme conditions, but would naturally be expensive. Large concrete armour units against the top of the caissons have the potential to impose high local bearing stresses and the armour/underlayer/caisson junction will be difficult to detail. If future developments were to be built on or behind the breakwaters, those changes of use might, however, require the lower overtopping given by this solution.
4. La Collette Breakwater, St Helier, Jersey
4.1. Background
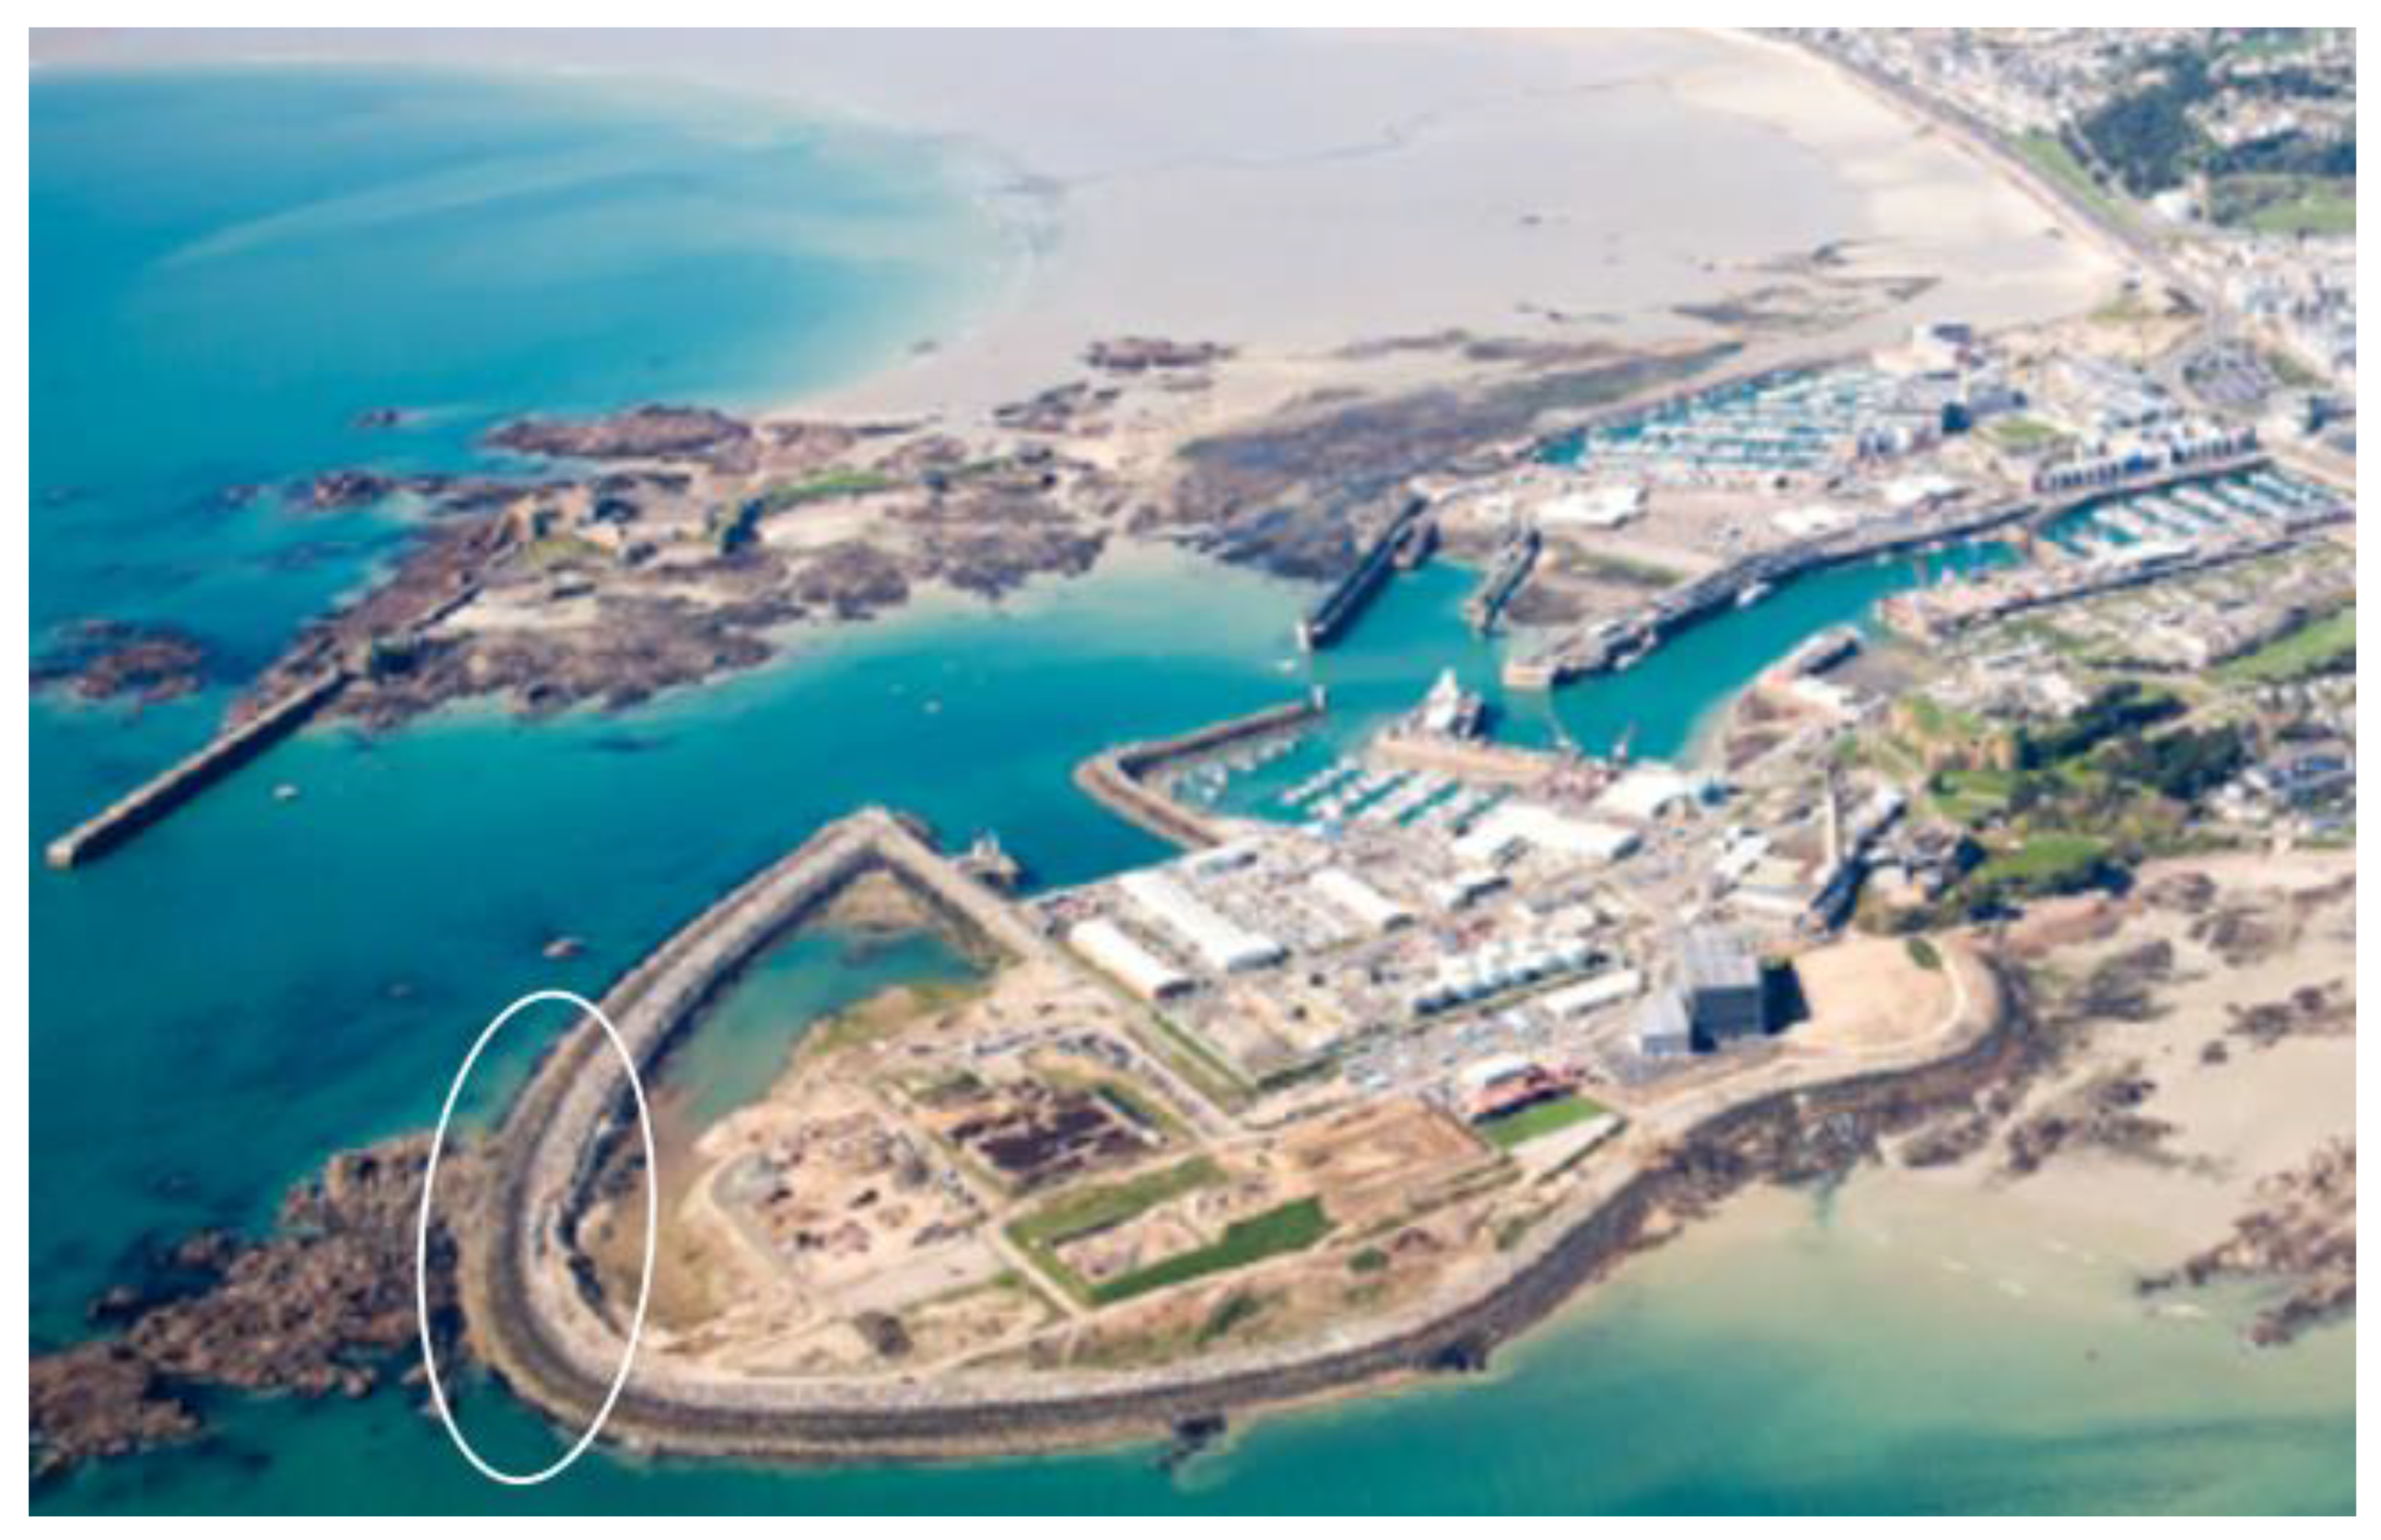
The reclamation breakwater at La Collette, Jersey (Figure 7), was constructed during 1994–1995 for a lagoon to be filled by dry waste, and (later) to be reclaimed for port and power station users [2]. The site at St Helier is exposed to a tidal range of approximately 12 m and to wave attack along the exposed southern part of the breakwater, reaching Hso ≈ 8 m at 1:200 year return. Wave heights at the breakwater are reduced by refraction and depth-limiting and (at a given return period) by the conditional probability of occurring at particular water levels.
Since 1995, this breakwater has suffered damage, although perhaps not through conventional armour damage by direct wave attack or overtopping processes [2]. The users of the reclaimed area behind the breakwater now need to be able to plan their land use for the next 100 years.
This section will describe the breakwater and the damage observations. The results of a JPA of waves and water levels will be presented, including near-structure depth-limiting, then overtopping predictions for both present and future conditions, leading to the development of refurbishment/enhancement options for wave conditions and water levels some 70–100 years ahead.
Wave conditions were calculated at selected points along the breakwater/revetment for a range of water levels for each of 1:10 year, 1:200 year and 1:200 year + climate change. At each location point and water level, a check was made on depth-limiting, taking particular account of the local bed levels and slope. Using these JPA conditions projected forward, wave overtopping was simulated for present day (and future) conditions, allowing future crest levels to be derived for higher levels of protection, as discussed later in the paper. These calculations were then refined to take account of the conditional probabilities of different wave directions, and thus the effect of local wave obliquity.
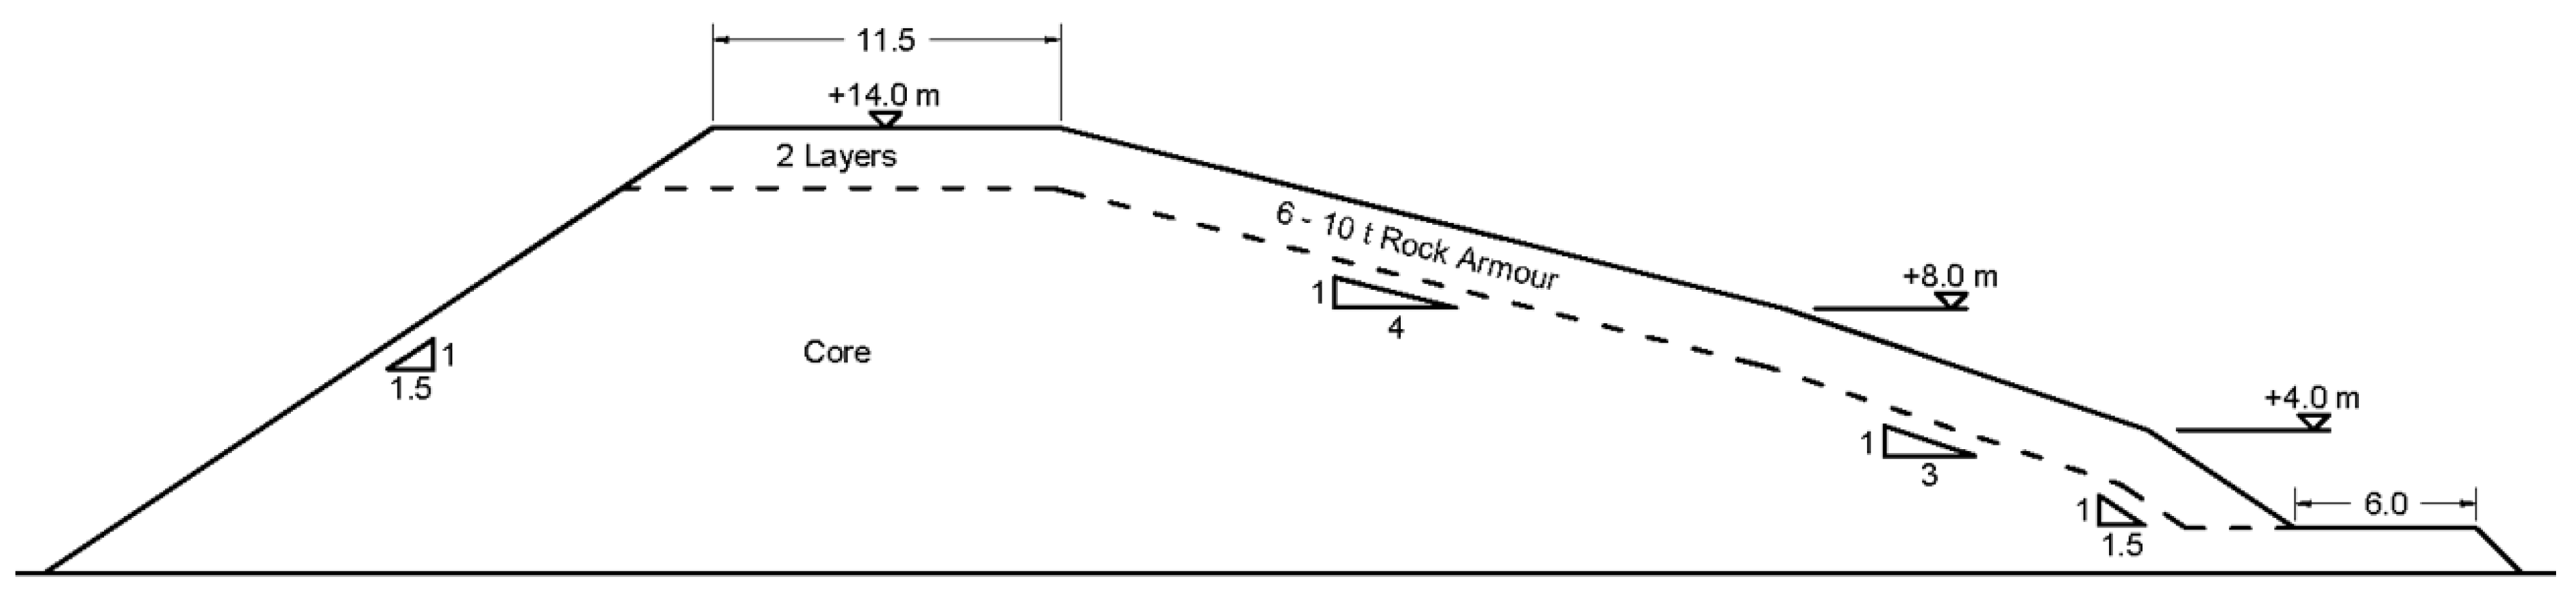
The breakwater had been designed by Coode & Partners (now WSP) and modelled by HR Wallingford in 1993 for armour stability and wave overtopping. The design used core material up to +11 mCD with side slopes from 1:1.5, through 1:3, and up to 1:4 on the upper part, Figure 8. The steeper slopes at the lower elevations can be sustained as depth-limiting reduces wave heights at lower tide levels. The designers probably anticipated that the core material (50 kg–2 t) would act as a filter for the 6–10 t armour. Photographs taken on site however suggest that the core grading may actually have been wider than specified for the model testing. With hindsight, it is probable that significantly more fine material was included in the core than implied by the 50 kg lower limit.
The filling of the lagoon started during 1995 but was slower than anticipated by the designers. By 2008, most of the lagoon had been reclaimed, and some areas had already been adopted for industrial/commercial uses. A single lagoon area remained at the time of this study, adjacent to the most wave-exposed (south-western) section of the breakwater (ringed in Figure 7).
4.2. Damage to the Breakwater
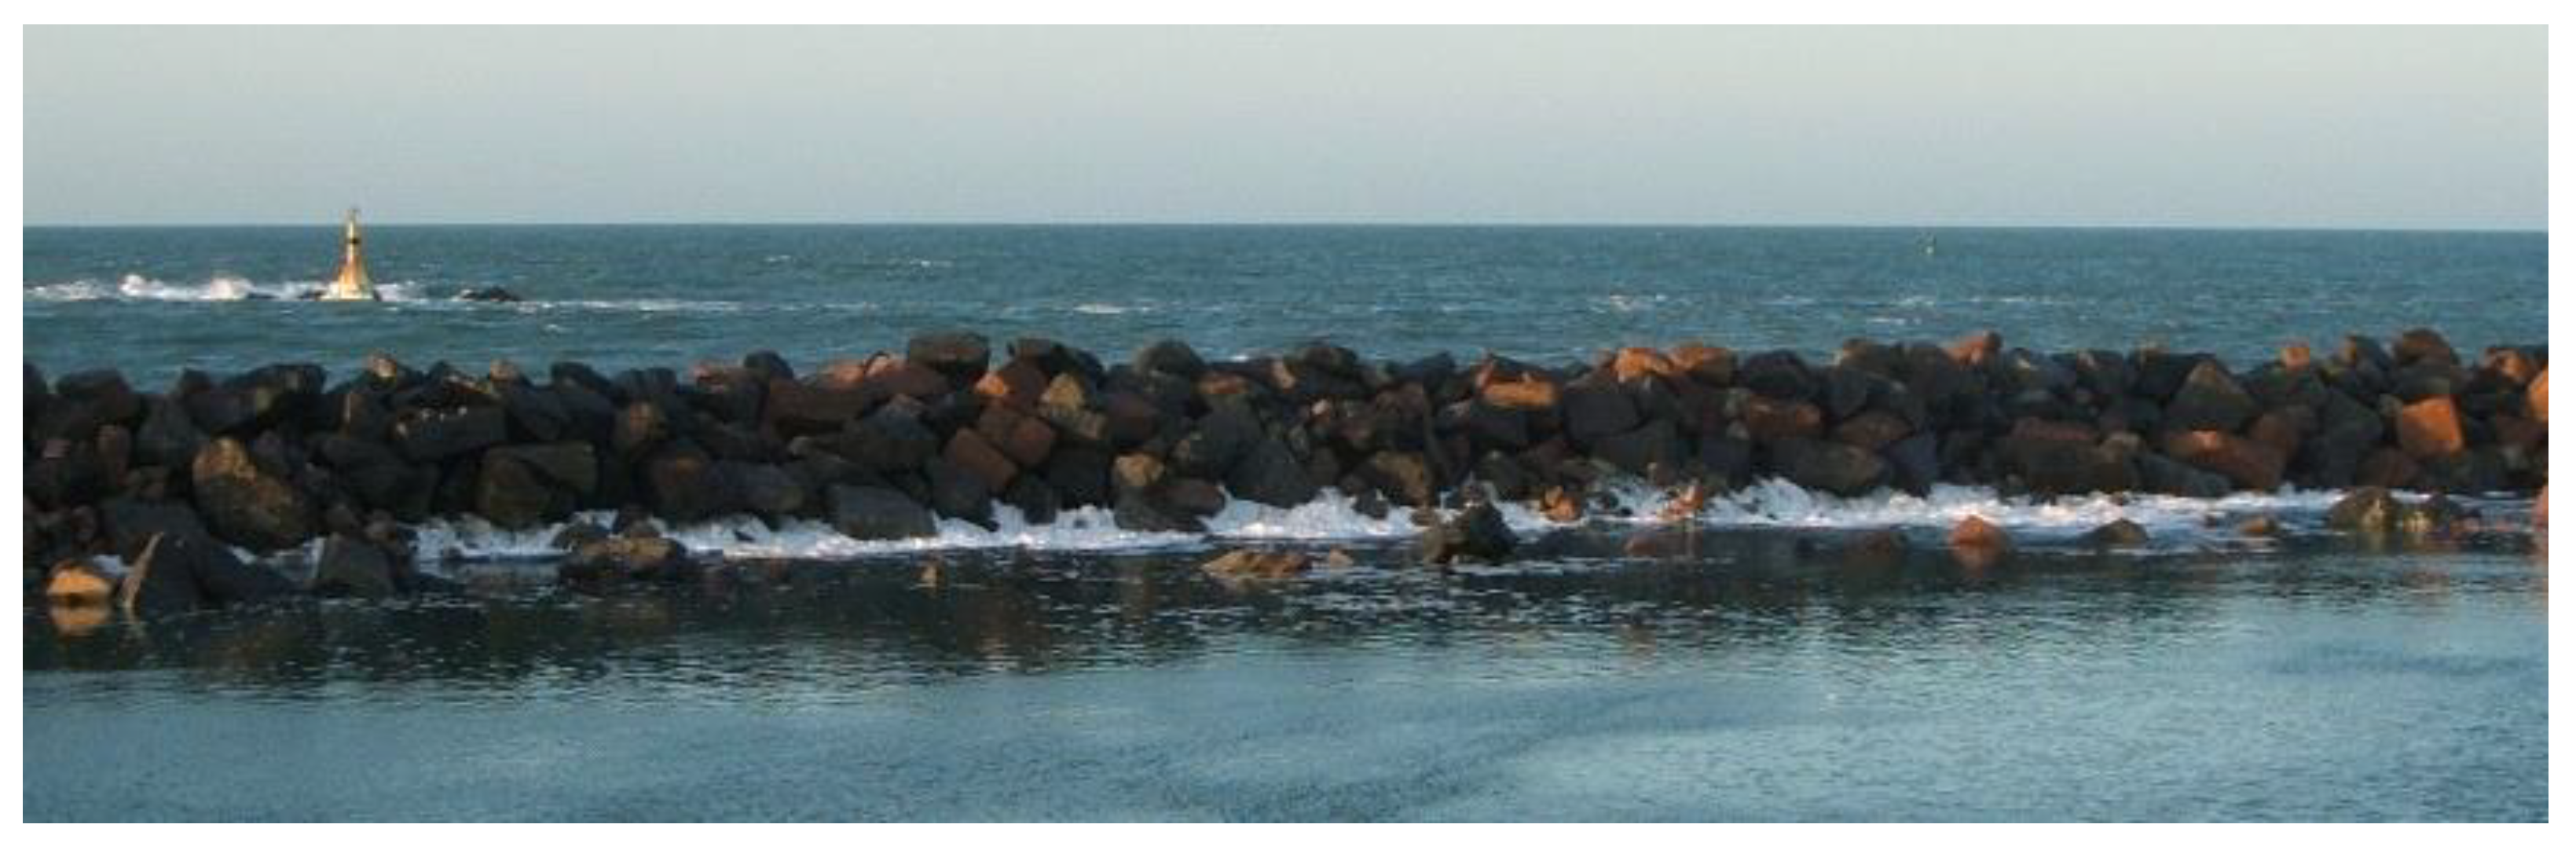
This southerly section of the breakwater is difficult to access, being backed by the tidal lagoon, accessed through a controlled tip area and having no roadway along its crest (see Figure 7 and Figure 8). Damage to crest armour on the section behind the Dogs Nest rocks along the S/SSW section of the breakwater (Figure 9) only became apparent in aerial photos taken in 2003.
The analysis of those photographs [2] suggested that the crest armour might have settled by perhaps 2–3 m along approximately 250 m where the crest width reduces from the 11.5 m on the western facing frontage to ~3.5 m on the southerly facing frontage. It was initially assumed that crest damage had been driven by wave overtopping, so initial analysis concentrated on calculating overtopping. It was, however, noted that the crest level measurements indicated that the landward part of the crest had settled the most, perhaps through the loss of supporting material. This suggested that the damage might be caused by suffusion of fine material from the core driven by intermittent flows along the core/armour interface.
This initial conclusion was supported by evidence of such flows on that interface (see Figure 9 taken by the author) and by the absence of any obvious loss of armour from the seaward face. Little or no evidence was noted of the same type or degree of damage along sections of the breakwater with the wider crest and none on those sections where the lagoon behind had been filled. This suggested that the simplest remedy to the suffusion problem would be to bring up fill material against the rear face up to crest level, removing the potential for substantial flows along the core/armour interface. The challenge then remained as to how the crest details might be configured to resist future wave events.
4.3. Water Levels and Wave Conditions
Prior to this study, a model of wave action around the island of Jersey had been set-up and calibrated using 40 years of wind data. New tide gauge data were used to refine estimates of extreme sea levels and allowed the analysis of the correlations of large waves with high water levels for various positions and wave directions to be developed in the JPA.
Separately, Jersey had previously adopted allowances for climate change to wind speed, wave height, sea level, etc., which were then used in this analysis:
- sea levels will be 0.5 m higher than present by the 2080s;
- waves will increase by 10% in terms of offshore wave height and period.
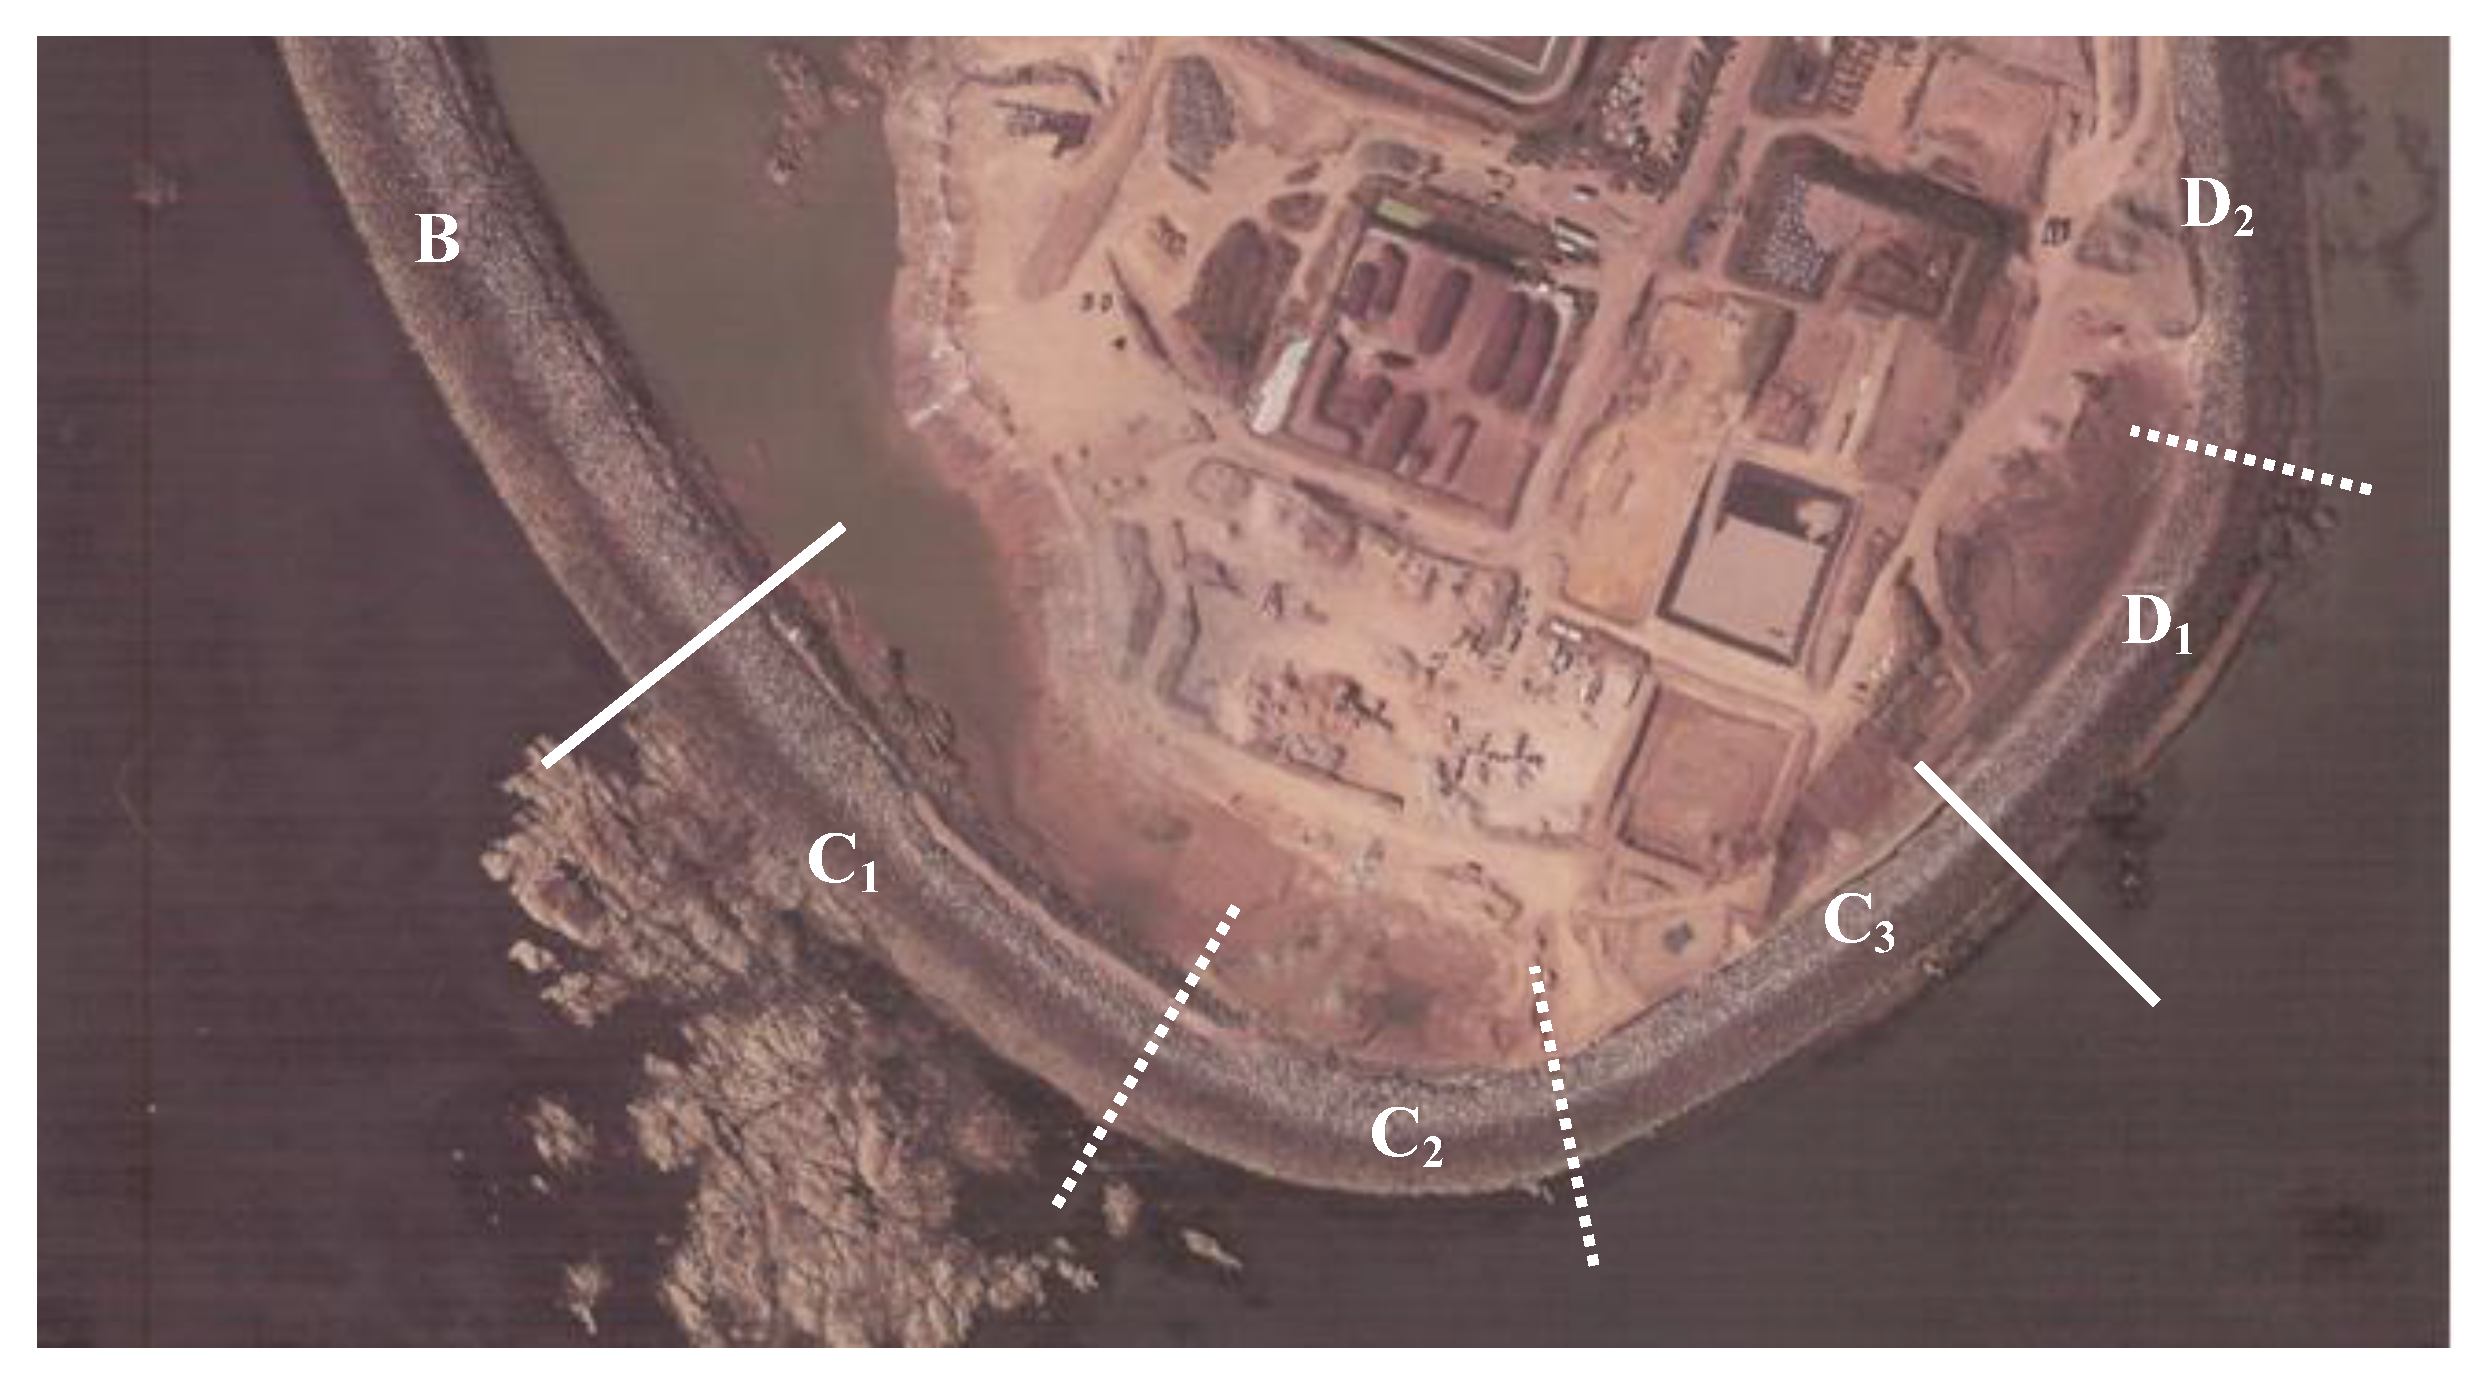
Combined wave conditions and water levels were derived around the reclamation and were then checked for local shoaling/depth-limiting. At the location of damage behind the Dog’s Nest (Position C), waves track across rocks averaging +4 mCD, but bed slopes are steep at 1:10. Local depth limiting should therefore reduce wave heights for water levels below 10.5–12 mCD but less so than for shallower bed slopes.
The approach bathymetry and the relative orientation of the breakwater change significantly around section C, so it was sub-divided into sections C1, C2 and C3 (see Figure 10). Similar analysis was conducted for Sections B, D1, and D2, but are not discussed in this paper.
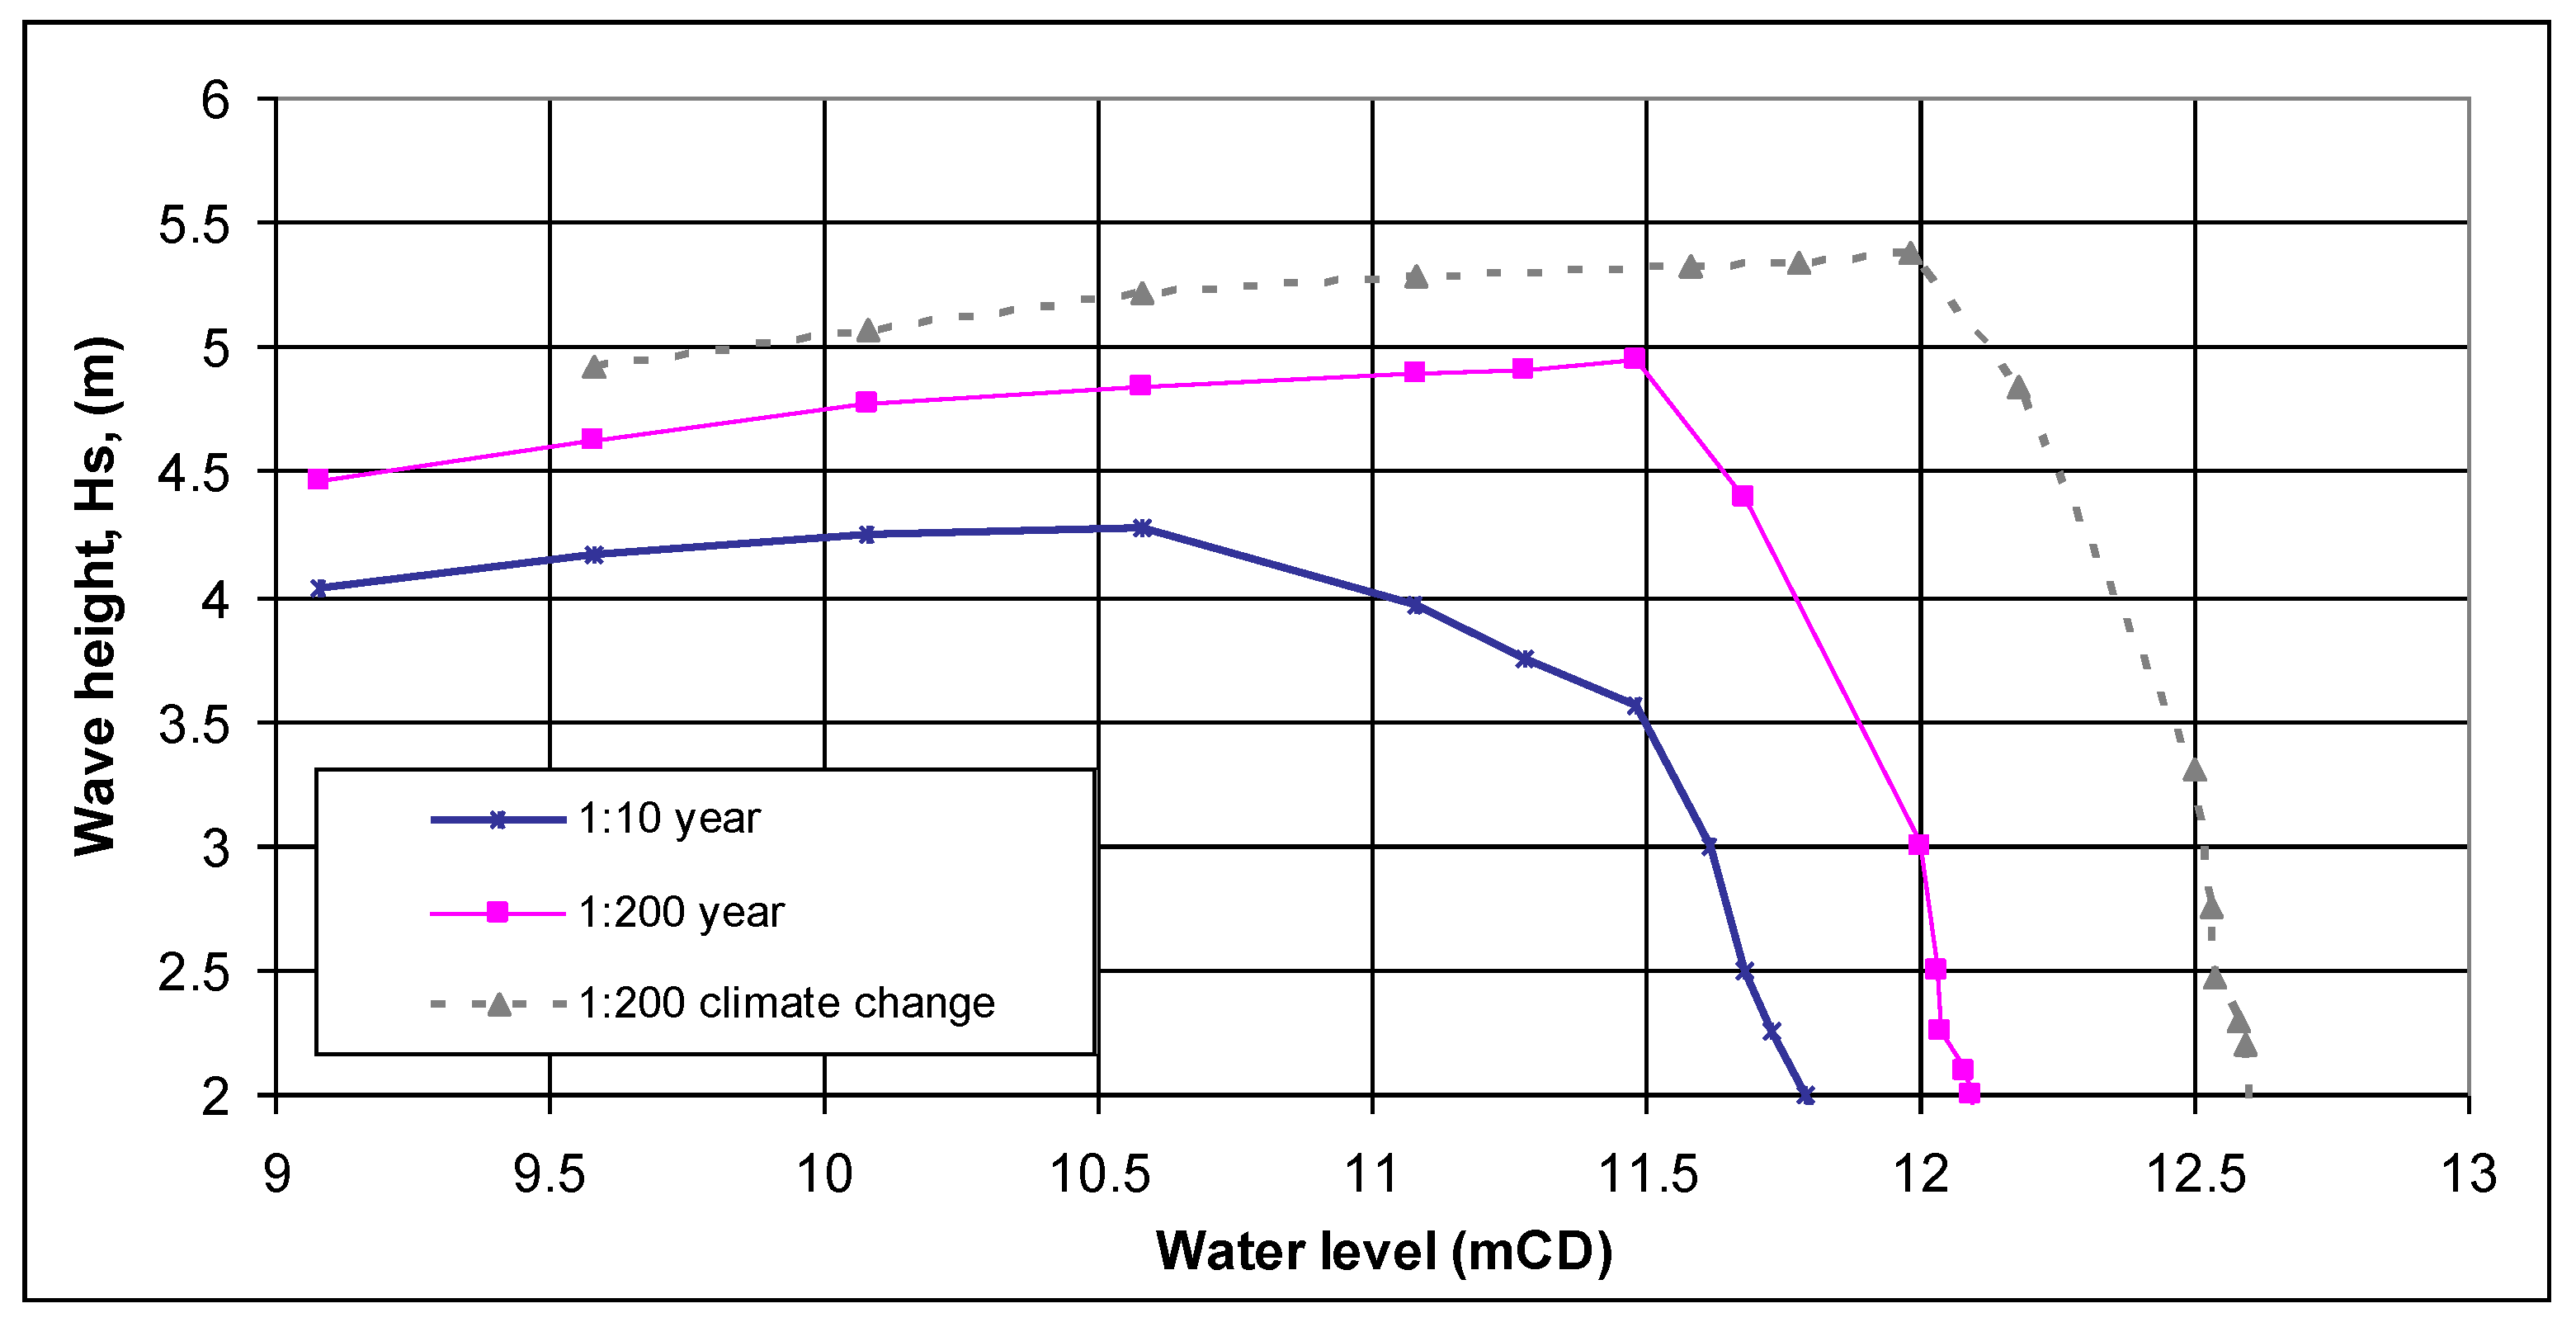
Water level and wave conditions derived in the first overtopping calculations in Figure 11 were then refined to take increased account of local shoaling, depth-limiting and obliquity. Local wave generation was also included for easterly sectors.
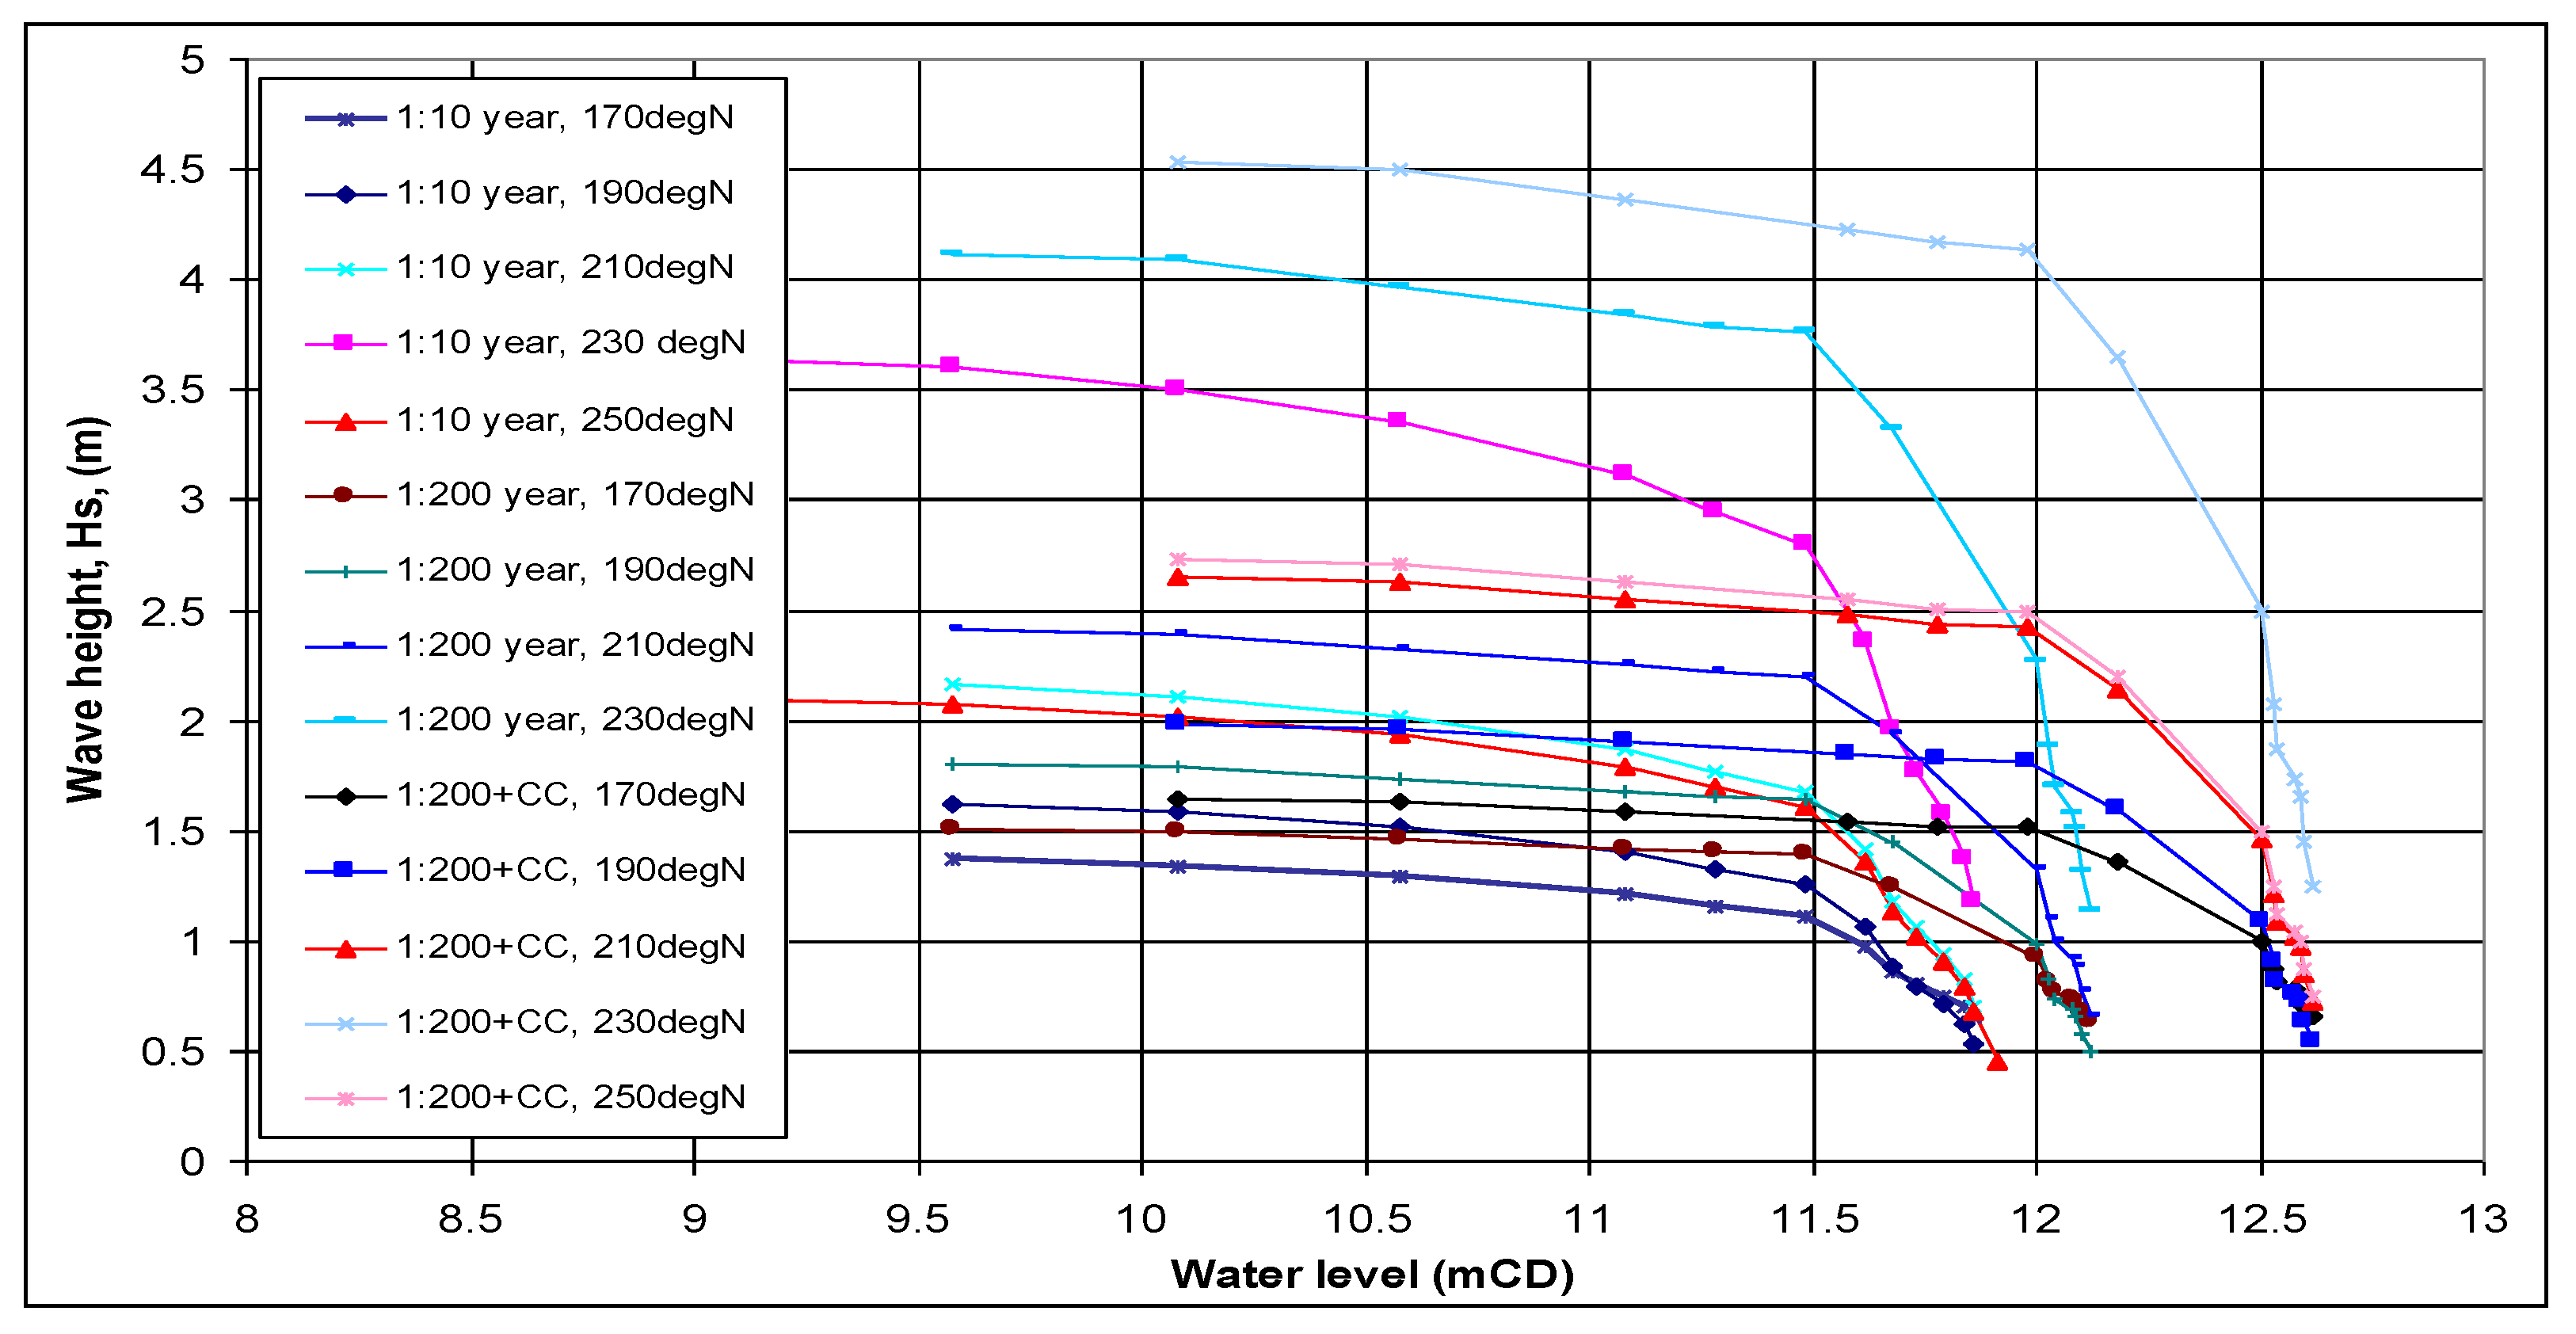
Wave conditions and water levels for the sub-section of defence labelled C3 are shown for each wave direction in Figure 12. These follow the general form seen previously, although wave heights at C3 are reduced relative to adjoining positions. These conditions were then used as input into refined overtopping calculations.
4.4. Wave Overtopping
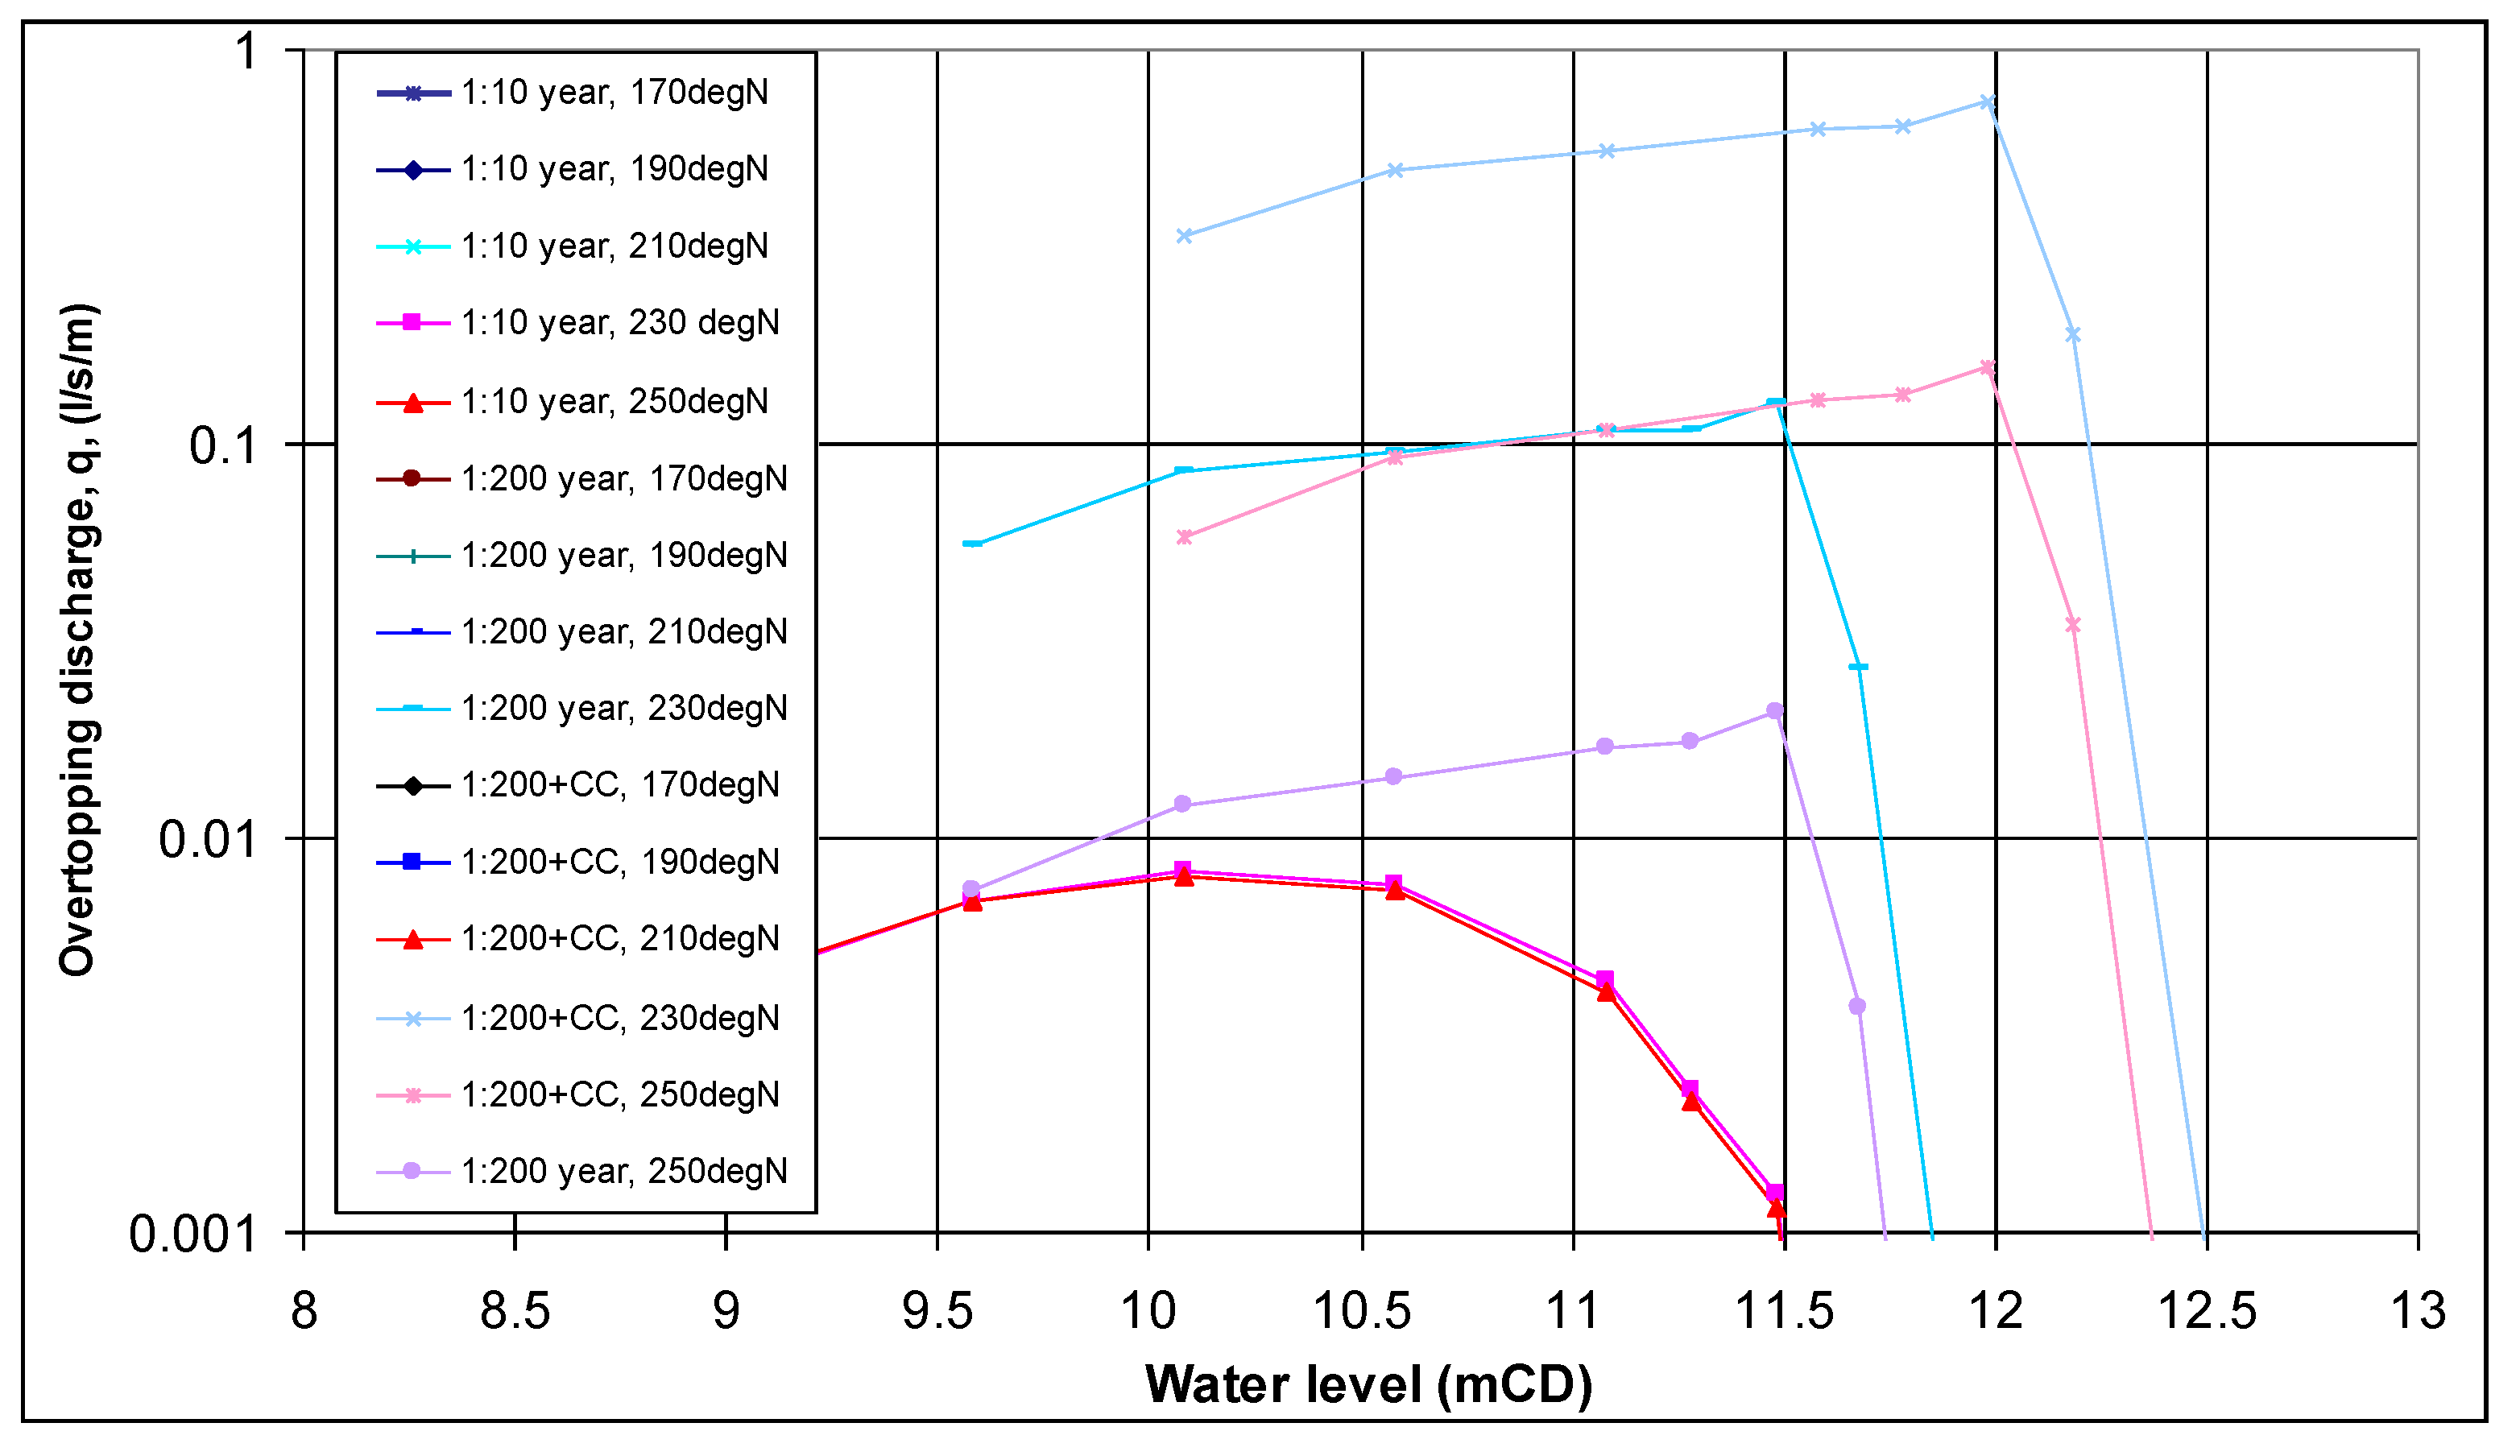
It can be appreciated that it was not possible to predict beforehand which combination of water level, wave height and direction would maximise overtopping. Overtopping discharges were therefore calculated for each combination of wave direction, JPA water levels and wave conditions at 1:10, 1:200 and 1:200 year + climate change.
These calculations were then repeated using different refurbishment options and land-use scenarios:
- Phase 1a—a near future conditions where land use continues as present, tested against 1:10 year combinations of water level and waves;
- Phase 1b—a future condition where there would be no sensitive use close to the defence, but it would be assessed against 1:200 year and 1:200 year + climate change conditions;
- Phase 2—possible future uses with industrial or similar developments close to the defences to be assessed against 1:200 year and 1:200 year + climate change conditions.
At C1, overtopping with the refined conditions was greater, but it was found that raising the crest from +14 mCD to +19 mCD would restore overtopping under the 1:200 year + climate change case to below q ≤ 1 l/s/m, see Figure 13.
In contrast, at C3, refining the wave conditions as in Figure 11 had substantially reduced the calculated overtopping, so much that it would be possible to lower the (wide) crest back down to +14 mCD and still yield q ≤ 1 l/s/m under the 1:200 year + climate change case.
The overtopping calculated in Figure 13 demonstrated that the most exposed parts of the reclamation would need increased protection before more sensitive users could safely use the reclamation land close to the revetment. The refined directional analysis however allowed the spatial extent of those enhancements to be limited, even under the full range of the 1:200 year conditions modelled.
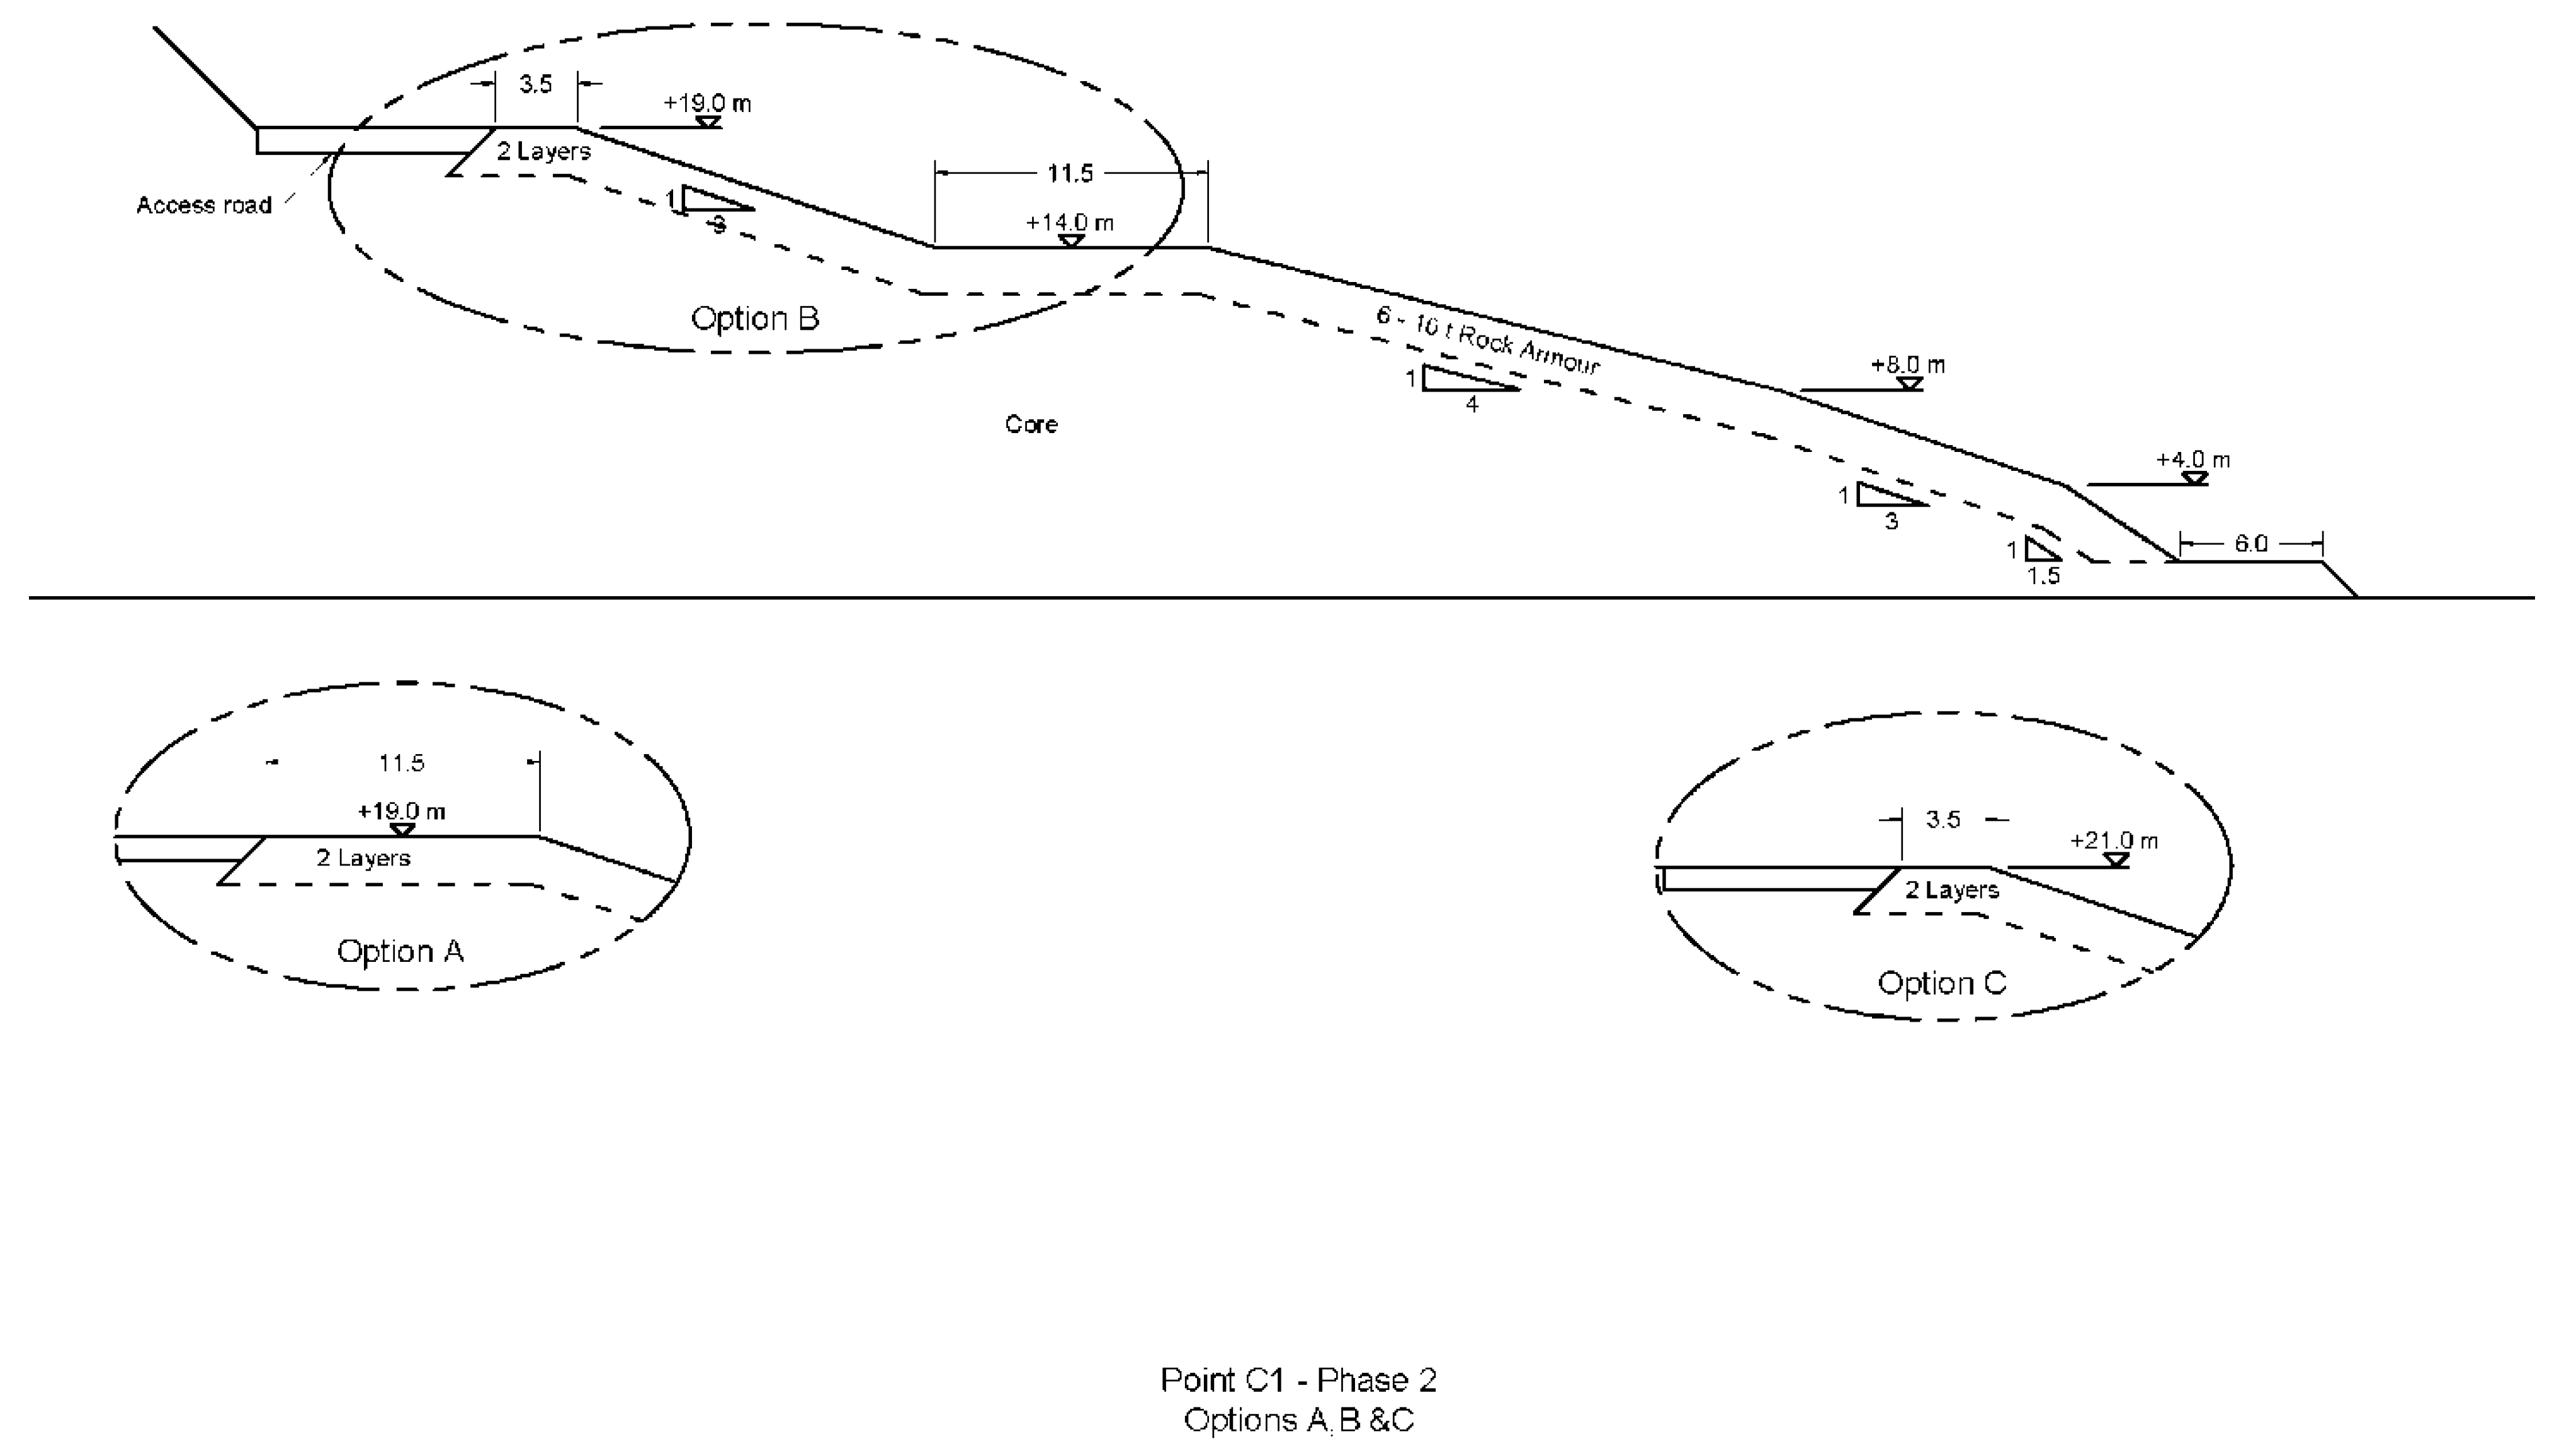
In Phase 2, developments on reclaimed land behind the defence may need to be protected against larger threats. The defence crest might then need to be elevated. For defences at C1 and C2, the crest should be extended up to +19 mCD with an armoured slope at 1:3. This slope should end in a horizontal crest, typically three armour stones wide, backed by the access road. Example suggestions are sketched in Figure 14. If space were at a premium, it might be possible to refine these sections, perhaps using a recurved wave wall or if crest levels lower than +19 mCD were required, say for visibility.
The overtopping analysis for length C3, however, showed that the defence could be significantly reduced with a simple (wide) crest at +14 mCD. Similarly, no modifications are required for the eastern section where waves are smaller and/or generally oblique to the revetment. Along those lengths, overtopping requirements were satisfied even by a narrow crest (~2 m) under future 1:200 year conditions; indeed, the crest could (theoretically) be lowered to +13 mCD, although this was not recommended.
5. Design Exercise, Rubble Revetment
The two site specific exercises discussed above might be contrasted by a hypothetical exercise by Burcharth [17], who considered that upgrading might be required for a simple rock-armoured revetment on a sandy coastline. The research under the European research project THESEUS explored the use of enhancements to the front face and/or crest and, in a few instances, the addition of new toe berms or a submerged advance rubble mound. The simple rock-armoured rubble mound chosen for the exercise faces (offshore) waves of Hso = 4.0 m at the 1:100 year return, and SWL = +2.3 mMWL under present conditions. Under the climate change conditions considered, the 1:100 year return wave condition increased to Hso = 4.2 m, and SWL = +2.87 mMWL. Unfortunately, these researchers do not seem to have conducted a joint probability analysis, so by this omission they imply that this single combination of water level and wave condition will give the ‘worst cases’ for each response. This is most unlikely, as is graphically illustrated in Section 3 and Section 4 above.
The researchers considered possible client requirements for no change to the crest level or allow crest raising and explored the effectiveness of adding armour to the front face, extending the crest upwards by adding a new toe berm, or constructing a submerged advance mound. They also added a more challenging condition where morphological change steepened the approach slope from a 1:100 to 1:30 slope to simulate the effect of an eroding coastline. As might be expected, this change alone dramatically increased wave effects and would have substantially increased costs of upgrading.
However, for coastlines of unchanged bed slope, the upgrades required to resist climate change effects are relatively mild and the authors conclude that “the anticipated climate change does not impose a big problem as the structure can be easily upgraded at moderate cost”.
6. General Conclusions
Breakwater and coastal structures are generally designed for 20–30 years of life but are often required to provide protection for much longer, e.g., for 100–120 years, when protecting dwellings or high value infrastructure.
The predictions of climate change effects, ‘central estimates’ or ‘precautionary’, have been developed by the IPCC, from which Regional Climate Models have been used to assist develop ‘local guidance’ by local governments or agencies. For scenarios of differing severities, these give advice on sea level increases, surges, and wave-height enhancements that should be applied to publicly funded projects or those requiring public approval. This guidance can be applied by or on behalf of any owner of coastal structures: to analyse potential threats and/or to test the efficacy of planned remediation options.
In Section 5, the study briefly reviewed various options for improving idealised (rubble mound) defence structures. This paper illustrated the development of improvement measures for a couple of (slightly) unconventional breakwaters. The key lessons are that, even for more complex structures, anticipated climate change effects can be applied over the usual 20–30 years of life of coastal structures. Climate change effects will, however, be more severe and therefore more impactful when applied to those structures expected to provide protection for extended lives for dwellings, public access or important infrastructure.
Devising appropriate measures to manage or resist increased wave overtopping is relatively routine for experienced coastal engineers. The most important aspect is always to anticipate changes in loadings and/or of usage and therefore to always anticipate the need for future adaptation.
Funding
Writing this paper was supported by William Allsop Consulting Ltd.
Institutional Review Board Statement
Not applicable.
Informed Consent Statement
Not applicable.
Data Availability Statement
Not applicable.
Acknowledgments
This paper arises from a concept originally developed by the author with Peter Hawkes at HR Wallingford and is illustrated by case studies performed by the author and colleagues at HR Wallingford. The analysis for Brighton Marina was assisted by Amanda Chapman, Katy Hooper, Alex Orbell, and Dave Baldock at Wallingford. John Scatchard (Helmsley Orrell Partnership) and John Davey (Brighton Marina Estates Management) contributed significantly to the studies [1]. The work on La Collette was again assisted by a Joint Probability Analysis by Peter Hawkes (HRW); input from Quintin Murfin, Chris Sampson, and Nigel Johnstone (Technical Services, Jersey); and colleagues from the Jersey Met Office and Jersey Harbours [2]. The writing of this paper was supported by William Allsop Consulting Ltd. without any external funding. All co-authors of the original studies have been acknowledged.
Conflicts of Interest
The author declares no conflict of interest.
References
- Allsop, N.W.H.; Chapman, A.C.; Scatchard, J.; Davey, J. Extending the life of a coastal harbour from 30 to 150 years. In Proceedings of the International Conference on Coastal Engineering 2008, ASCE/World Scientific, Hamburg, Germany, 31 August–5 September 2008. [Google Scholar]
- Allsop, W.; Murfin, Q.; Sampson, C. Analysis and design of refurbishment for unusual damage to a rubble mound breakwater stability of rubble mound breakwaters under wave action. In Proceedings of the Conference Coastal Structures 2011, Yokohama, Japan, 6–8 September 2011. [Google Scholar]
- Kendon, M.; McCarthy, M.; Jevrejeva, S.; Matthews, A.; Sparks, T.; Garforth, J. State of the UK Climate 2020. Int. J. Climatol. 2021, 41 (Suppl. S2), 1–76. [Google Scholar] [CrossRef]
- Kendon, M.; McCarthy, M.; Jevrejeva, S.; Matthews, A.; Sparks, T.; Garforth, J.; Kennedy, J. State of the UK Climate 2022. Int. J. Climatol. 2022, 42 (Suppl. S1), 1–80. [Google Scholar] [CrossRef]
- IPCC. Climate Change 2007: The Physical Science Basis. Contribution of Working Group I to the Fourth Assessment Report of the Intergovernmental Panel on Climate Change; Solomon, S., Qin, D., Manning, M., Chen, Z., Marquis, M., Averyt, K.B., Tignor, M., Miller, H.L., Eds.; Cambridge University Press: Cambridge, UK; New York, NY, USA, 2007. [Google Scholar]
- Haigh, I.; Nicholls, R.; Wells, N. Rising sea levels in the English Channel 1900 to 2100. In Proceedings of the Institution of Civil Engineers—Maritime Engineering 164, June 2011; pp. 81–92. Available online: https://www.icevirtuallibrary.com/doi/full/10.1680/maen.2011.164.2.81 (accessed on 7 September 2022).
- UKCIP09. UK climate projections: Marine & coastal projections. In United Kingdom Climate Impacts Programme Report; 2009; ISBN 978-1-906360-04-7. Available online: http://cedadocs.ceda.ac.uk/1322/1/marine_and_costal_projections_full_report.pdf (accessed on 7 September 2022).
- Defra. Flood and coastal defence appraisal guidance: FCDPAG3 Economic appraisal: Supplementary note to operating authorities: Climate change impacts, October 2006. In Defra Guidance Note; UK Department of Environment, Food and Rural Affairs: 2006. Available online: https://gat04-live-1517c8a4486c41609369c68f30c8-aa81074.divio-media.org/M4-Newport/C%20-%20Core%20Documents/17.%20Road%20Drainage%20and%20the%20Water%20Environment/17.2.20.pdf (accessed on 7 September 2022).
- Environment Agency. Adapting to climate change: Advice for flood and coastal erosion risk management authorities. In Environment Agency Guidance Note; 2011. Available online: https://assets.publishing.service.gov.uk/government/uploads/system/uploads/attachment_data/file/902978/LIT_5707_withdrawn.pdf (accessed on 7 September 2022).
- Terrett, F.L.; Ganly, P.; Stubbs, S.B. Harbour works at Brighton Marina: Investigations and design. Proc. Inst. Civ. Eng. 1979, 66 Pt 1, 191–208. [Google Scholar] [CrossRef]
- Hawkes, P.J. Use of Joint Probability Methods in Flood Management: A Guide to Best Practice, R&D Technical Report FD2308/TR2, Defra/Environment Agency Flood and Coastal Defence R&D Programme; Environment Agency: Bristol, UK, 2005. [Google Scholar]
- Soulsby, R.L. Dynamics of Marine Sands; Thomas Telford Publications, Thomas Telford: London, UK, 1997; ISBN 0-7277-2584-X. [Google Scholar]
- EurOtop. EurOtop: Wave Overtopping of Sea Defences and Related Structures: Assessment Manual; Pullen, T., Allsop, N.W.H., Bruce, T., Kortenhaus, A., Schüttrumpf, H., van der Meer, J.W., Eds.; 2007; Available online: https://www.researchgate.net/publication/256197945_EurOtop_Wave_Overtopping_of_Sea_Defences_and_Related_Structures_Assessment_Manual (accessed on 1 July 2022).
- EurOtop; van der Meer, J.W.; Allsop, N.W.H.; Bruce, T.; De Rouck, J.; Kortenhaus, A.; Pullen, T.; Schüttrumpf, H.; Troch, P.; Zanuttigh, B. Manual on Wave Overtopping of Sea Defences and Related Structures. 2018. Available online: www.overtopping-manual.com (accessed on 1 July 2022).
- Goda, Y. Random Seas and Design of Maritime Structures; University of Tokyo Press: Tokyo, Japan, 1985. [Google Scholar]
- Goda, Y. Random Seas and Maritime Structures, 2nd ed.; World Scientific Publishing: Singapore, 2000; ISBN 981-02-3256-X. [Google Scholar]
- Burcharth, H.F.; Andersen, T.L.; Lara, J.L. Upgrade of Coastal Defence Structures against Increased Loadings Caused by Climate Change: A First Methodological Approach; Coastal Engineering 87; Elsevier: Amsterdam, The Netherlands, 2014; pp. 112–121. [Google Scholar] [CrossRef]
Figure 1.
UK sea level indices, after Kendon et al. (2021) [3]. (Mean trend in blue, standard deviations shown in grey).
Figure 1.
UK sea level indices, after Kendon et al. (2021) [3]. (Mean trend in blue, standard deviations shown in grey).

Figure 2.
Outer Harbour, Inner Harbour and Tidal Harbour of Brighton Marina viewed from the east (outer part of West Breakwater modelled in this study is ringed) (courtesy of Brighton Marina Estates Management).
Figure 2.
Outer Harbour, Inner Harbour and Tidal Harbour of Brighton Marina viewed from the east (outer part of West Breakwater modelled in this study is ringed) (courtesy of Brighton Marina Estates Management).

Figure 3.
Joint Probability curves for 210° N, DEFRA 2107 future scenarios.

Figure 4.
Example breakwater caisson.

Figure 5.
Wave overtopping projections.

Figure 6.
Model caissons made from UPVC pipe sections, plywood and mortar.

Figure 7.
La Collette reclamation, view towards North-West.

Figure 8.
La Collette reclamation breakwater section, as model tested in 1993.

Figure 9.
Wave transmission flow along core/armour interface (the author, January 2008).

Figure 10.
Locations of sub-sections C1–C3, D1 and D2.

Figure 11.
Initial JPA conditions for Position C.

Figure 12.
Refined JPA conditions for Position C3.

Figure 13.
Overtopping at Position C1, wide crest at +19 mCD.

Figure 14.
Suggested future defences at Positions C1 and C2.


Table 1.
Trends in sea level (linear, 1991–2020), adjusted for land movement, after [4].
Table 1.
Trends in sea level (linear, 1991–2020), adjusted for land movement, after [4].
| Location | Central Estimate mm/year | Confidence Band mm/year |
|---|---|---|
| Wick | 3.5 | ±0.6 |
| Stornoway | 5.2 | ±0.9 |
| Tobermory | 4.0 | ±0.6 |
| Leith (Edinburgh) | 3.6 | ±0.8 |
| North Sheilds | 3.0 | ±0.9 |
| Lowestoft | 3.9 | ±0.9 |
| Newhaven | 4.2 | ±0.8 |
| Hinkley point | 4.1 | ±0.6 |
| Newlyn | 3.6 | ±0.8 |
Table 2.
UKCIP sea level rise projections averaged over the UK (1980–1999 and 2090–2099), after [7].
Table 2.
UKCIP sea level rise projections averaged over the UK (1980–1999 and 2090–2099), after [7].
| Scenario | Mean Sea Level Rise (m) | ||
|---|---|---|---|
| 5th Percentile | Central Estimate | 95th Percentile | |
| High emissions | 0.15 | 0.46 | 0.76 |
| Medium emissions | 0.13 | 0.37 | 0.61 |
| Low emissions | 0.12 | 0.30 | 0.48 |
| High++ | between 0.93 and 1.90 | ||
Publisher’s Note: MDPI stays neutral with regard to jurisdictional claims in published maps and institutional affiliations. |
© 2022 by the author. Licensee MDPI, Basel, Switzerland. This article is an open access article distributed under the terms and conditions of the Creative Commons Attribution (CC BY) license (https://creativecommons.org/licenses/by/4.0/).
Share and Cite
MDPI and ACS Style
Allsop, W. Climate Change Threats to Two Breakwaters. J. Mar. Sci. Eng. 2022, 10, 1613. https://doi.org/10.3390/jmse10111613
AMA Style
Allsop W. Climate Change Threats to Two Breakwaters. Journal of Marine Science and Engineering. 2022; 10(11):1613. https://doi.org/10.3390/jmse10111613
Chicago/Turabian StyleAllsop, William. 2022. "Climate Change Threats to Two Breakwaters" Journal of Marine Science and Engineering 10, no. 11: 1613. https://doi.org/10.3390/jmse10111613
Note that from the first issue of 2016, this journal uses article numbers instead of page numbers. See further details here.