Article

Anthropogenic Pressure on Hydrographic Basin and Coastal Erosion in the Delta of Paraíba do Sul River, Southeast Brazil

1
Department of Geography, Institute of Geosciences, University of Campinas (UNICAMP), Campinas 13083-855, Brazil
2
Department of Earth Sciences, Environment and Resources, University of Naples Federico II, Via Vicinale Cupa Cintia 21, 80126 Naples, Italy
3
Department of Chemical Sciences, University of Naples Federico II, Via Vicinale Cupa Cintia 21, 80126 Naples, Italy
4
Department of Geology and Natural Resources, Institute of Geosciences, University of Campinas (UNICAMP), Campinas 13083-855, Brazil
5
Center for the Humanities, Federal University of Western Bahia (UFOB), Barreiras 47805-100, Brazil
*
Author to whom correspondence should be addressed.
J. Mar. Sci. Eng. 2022, 10(11), 1585; https://doi.org/10.3390/jmse10111585
Submission received: 1 October 2022 / Revised: 19 October 2022 / Accepted: 21 October 2022 / Published: 26 October 2022
(This article belongs to the Special Issue Coastal Systems: Monitoring, Protection and Adaptation Approaches)

Abstract

:
Coastal erosion affects several beaches worldwide in association with natural and human pressures. In recent decades, the coastland located on the Paraíba do Sul River mouth has been recognized as one of the main areas that suffer from this geomorphological dynamic. Furthermore, the scientific literature, even if scarce, has pointed out that these dynamics are causing negative socio-environmental responses and making the area less resilient. In the last few decades, hundreds of homes and other urban structures have become debris due to erosion caused by sea ingression, triggered by the coupling of environmental processes and dynamics occurring at different spatial and temporal scales. Thus, the present research aimed to analyze how the anthropic changes carried out in the Paraíba do Sul hydrographic basin are related to the intense coastal erosion at the mouth. Variations in fluvial–marine hydrosedimentary dynamics triggered this due to the construction of dams to supply large cities and for agricultural purposes. Water and sediment samples were collected and analyzed in different sectors of the main channel and on the adjacent coast, mapping land use in the basin area and surveying socioeconomic data. The results suggest that human pressures on the hydrographic basin during the last century are directly associated with the imbalance of the environmental system and, consequently, the progression of coastal erosion on the Paraíba do Sul delta shoreline.

1. Introduction

Transitional environments, such as deltas and estuaries, are sensitive to the different anthropic and/or natural stressors induced by the coupling of continental and ocean processes [1,2,3,4,5,6]. Furthermore, these environments perform highly valuable functions as habitats, recreation sites, and storm protection along the world’s coasts [7,8,9,10]. In the Brazilian littoral, these environments are associated with high ecosystem diversity (e.g., dunes, restingas, and mangroves), presenting linkages with many climatic, fluvial, geological, geomorphological, and pedological settings [11,12,13]. Consequently, the complexity [14,15,16] of processes responsible for the configurations and transformations of these environments has been investigated for a long time, contributing to considerable methodological advances [17,18,19,20,21]. Notably, in the delta environments, these complex dynamics depend on the multi-scalar couplings between fluvial and marine processes [22,23,24,25].
The deltas, such as the Paraíba do Sul mouth, are built up where fluvial sediments supply the coastal and continental shelf more efficiently than their removal and reworking by waves, ocean currents, or tides [26,27,28]. In turn, the connectivity between fluvial and coastal environments represents a framework for conducting the development and evolution of both wave- and tide-dominated deltas in different climate contexts [2,29,30,31,32,33]. From this perspective, deltas respond to the sediment budget (supplies, losses, and exchanges of sediment) and natural or human-induced changes in the sedimentary fluvial–marine features, largely affecting the shoreline position and delta morphology [10,34,35,36,37,38,39].
As suggested by many recent studies [40,41,42,43,44], delta morphodynamics is a scale-dependent geomorphic process. Therefore, the natural or anthropic changes at the basin scale—i.e., construction and removal of dams, discharge variations associated with climate change trends, land-use intensifications, and river channel/discharge diversion—can result in coastal erosion intensifications [45,46,47]. On the other hand, dynamic alterations occurring on the local scale also have important implications for the environmental health of the littorals. Many studies have shown the direct dependency of the ecological and environmental effects caused by port structure construction, the opening of artificial channels, and urban irregular occupations on the coastline [48,49,50].
Coastal erosion is defined as a negative sedimentary balance in a coastline segment during a given time interval, and, in river mouth areas, this dynamic is particularly important since the sedimentary balance depends directly on material transport efficiencies along the hydrographic basin [51]. Particularly in the Paraíba do Sul River delta (PSRD), coastal erosion emerges as an issue of international relevance due to the onsite and offsite impacts resulting from the intensity and large spatial dimension of erosion processes [52,53,54] that lead to losses of thousands of dollars annually to the public and private sectors due to damages. Between 1975 and 2004, coastal erosion had already destroyed or damaged 183 buildings along 14 urban blocks in the village of Atafona (a district from the São João da Barra city) [55]. Mello et al. [56] found that the erosion advanced over another seven urban blocks, destroying 40 buildings, between 2005 and 2016. Recently, Lämmle and Bulhões [18] identified coastline alterations induced by the new port complex in consonance with other studies showing similar processes in different parts of the world [1,57,58,59,60].
The human-induced alterations occurring at the catchment area scale also constitute an important element to analyze the coastal erosions since they may induce (dis)connectivities among different hydrographic basins’ compartments [61,62,63]. From this perspective, the Paraíba do Sul basin (PSB) encompasses the most populated region of Brazil and has suffered from intense processes of land use and cover change (LUCC) since the 1950s, with the multiple uses of its water for domestic and rural consumption, animal consumption, electricity generation, industry, agriculture, and mining [64,65,66].
According to Paiva et al. [66], the PSB is responsible for supplying water to the entire Paraíba Valley, and approximately 75% of the total water consumption for 13 million inhabitants of the Rio de Janeiro and São Paulo metropolitan areas, the two most populated cities in Brazil. Therefore, human stressors have been causing negative impacts on the basin’s environmental health through dam constructions, land use, hydrological transposition, and irregular human occupation [40]. Additionally, these negative impacts on the basin (e.g., fluvial discharge decrease, deforestation, and water pollution) have been transferred to the Paraíba do Sul River mouth and changed the social context [67].
In particular, anthropogenic actions have effects capable of producing relevant changes in the fluvial and coastal systems and spatial organizations, triggering the need for multi-scalar studies that offer support for the planning and management of these regions. Although works on coastal erosion in the region are not uncommon, the intense processes are, for the first time, assessed by the systematic analysis of the hydrographic basin as a whole. From this perspective, the main objectives of this research are (1) to identify the main anthropic interferences associated with use in the hydrographic basin, (2) to relate them to the hydrosedimentary changes, and (3) to discuss the process of intense coastal erosion and loss of environmental quality, suggesting possible measures of mitigation. For this, orbital and non-orbital images, fieldwork, water sediment analysis, and hydrological data analysis are used.

Study Area

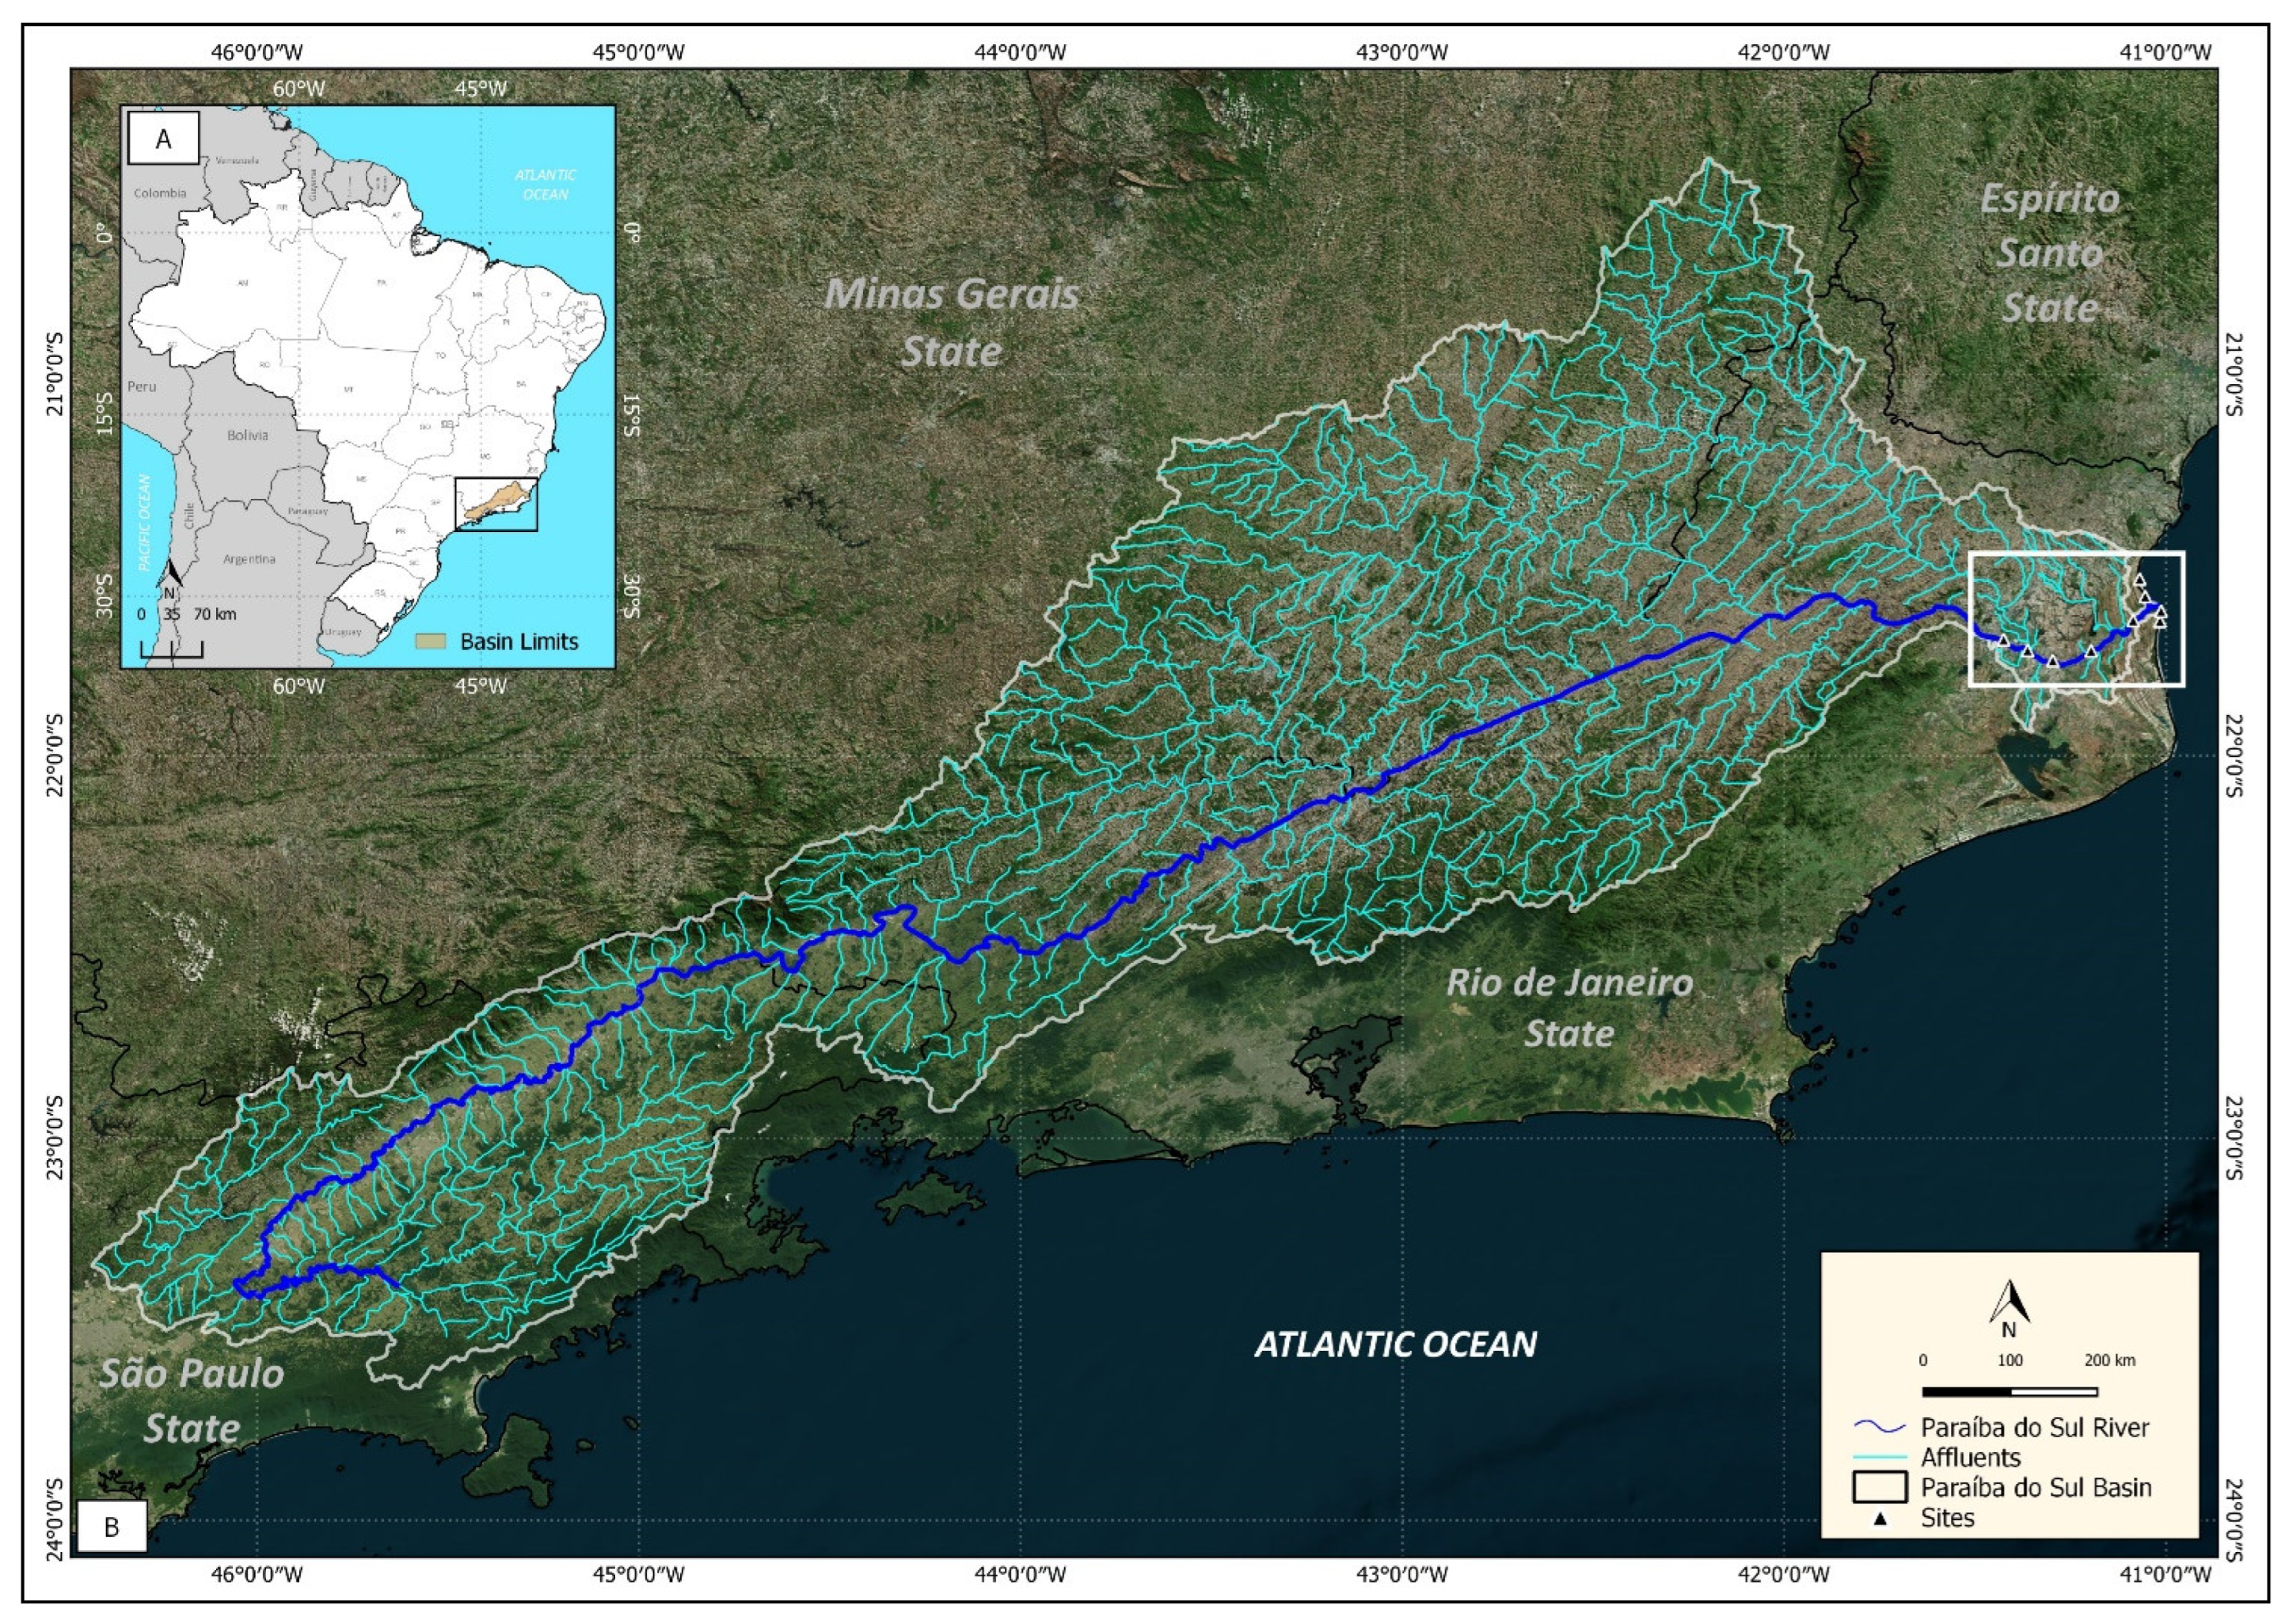
The Paraíba do Sul hydrographic basin, PSHB, drains ~55.5 km2, encompassing parts of São Paulo (13.9 km2), Rio de Janeiro (20.9 km2), and Minas Gerais (20.7 km2) states, the most populated region of Brazil (Figure 1). The channel length exceeds 1 km and the average discharge ranges from Qm > 100 m3 s−1 (December–April) to ~0.250 m3 s−1 (June–October) [68]. In detail, four notable dams are present along the whole mainstem, namely Funil, Jaguari, Paraibuna-Paraitinga, and Santa Branca, and countless minor dams in its affluents.
The coastal plain is a natural system located in the northern sector of Rio de Janeiro state that resulted from the Holocene marine regression [44,70] and where predominate unconsolidated sedimentary rocks outcrop, while the slope angle and topography do not exceed 6° and 10 m a.s.l. Previous studies associated the developments of these environments leading to geomorphological transformations taking place during transgressive and regressive phases that occurred in the Late Pleistocene and Holocene [70,71,72,73,74,75]. Additionally, it is noteworthy that the area has a geographic fetch >7000 km (7800 km NE and 7300 km SE) with an angle of around 120°. In this sense, the orthogonal wave-current interaction is a factor that must be considered in order to understand the dynamics of the studied area [76].
Dominguez et al. [72] pointed out that the Paraíba do Sul delta has evolved since the Pleistocene into eight stages: the last stages (VII and VIII) are related to the intra-lagoon delta built up and Holocene marine terrace development. Considering the above-quoted authors, the terraces and their sediments analyzed in the present research correspond to units deposited after 3000 yr BP. Soils of the order of cambisols, argisols, spodosols, neosols, gleysols, and organosols (Brazilian classification [77]) were found in the area. The Holocene surficial cover in the coastal plain [65] is related to strand plains, mangrove deposits, and sandy sediments (current beach). In the littoral regions, the residual longshore drift is predominant from the south to north and, similarly to fluvial sedimentation, has a key role in the coastline dynamics [78]. The waves are frequently from the NE and E, while the waves, more energetic from SSE, S, and SSW, are less frequent in the area [79].
According to Nautical Chart CN1550, surveys carried out between 2012 and 2016 [80], the tides reach 1.3 m and characterize the area as micro-tidal, and the bathymetry of the submerged beach shows morphological variation down to a 12 m depth [18]. On the beach morphologies, Bastos and Silva [74] pointed out that the beach profile has an average width of 100 m, with a flat and gently sloping backshore, an elevated beach berm, a steep foreshore (8°), and a coarse sand composition (0.670 mm). The PSHB is located in the Tropical Zone, where the rainfall precipitation is influenced by the South American Monsoon System (SASM) and South Atlantic Convergence Zone (SACZ) [81,82,83,84]. In detail, the average temperature ranges from 24 °C to 27 °C during summer, and between 21 °C and 24 °C during winter. In the coastal region, the High South Atlantic Subtropical (HSAS) induces dominant winds blowing from the northeast direction, which reach the examined region under cold fronts. Furthermore, the south, southeast, and southwest winds also cross the area during the autumn and winter [85]. Nonetheless, the South Atlantic Subtropical Anticyclone (SASA) also influences the delta dynamics [86,87].

2. Materials and Methods

2.1. Fluvial Discharge Analysis

Data referring to river discharges cover historical series from 1950 to 2020 and were obtained from the rainfall station “Ponte municipal” (code: 02141002) of the National Water Agency of Brazil (ANA), which is located in the Campos dos Goytacazes municipality, Rio de Janeiro state. However, we used only data from 1950 to 2019 as the data from 2020 were incomplete. Subsequently, the data were subdivided into a 10-year time series, organized into a database, and analyzed by calculating the maximum decadal discharge (Qmax), minimum decadal discharge (Qmin), decadal mean discharge (Qmed), standard deviation, and variance index population for a 10-year time series. Statistical procedures were performed using Microsoft Excel 2021 software.
The fluviometric data from several stations in the region were preliminarily analyzed, with the objective of choosing those whose data would be more complete (smaller gap and greater temporal space) in determining the water availability associated with flow, quota, and rainfall. In this sense, for the reference station, in addition to being positioned closer to the mouth area (where the erosive processes are triggered with greater intensity), the available measurement period successfully meets the objectives of the work, offering a hydrological panorama of the low course that allows us to understand the hydrosedimentary behavior before and during the main anthropic interventions along the river basin.

2.2. Land Use and Land Cover (LULC)

The data were obtained from the MAPBIOMAS v 6.0 dataset [88]. The MapBiomas is a multidisciplinary network aiming to reveal the Brazilian territory transformations and making knowledge about land use accessible. The project has produced annual mapping of LULC since 1985, with validations and reports for each deforestation event detected in Brazil since January 2019, as well as having monitored the water surface and fires monthly since 1985.
In our study, we used data referring to the years 1985, 1990, 2000, 2010, and 2020, which were classified into four main groups: Forest and Non-Forest Natural Formation (Forest Formation, Savanna Formation, Mangrove, Wooded Restinga, Wetlands, Grassland, Salt Flat, Rocky Outcrop, Other Non-Forest Formations), Farming (Pasture, Agriculture, Temporary Crops, Soybean, Sugar Cane, Rice, Other Temporary Crops, Perennial Crops, Coffee, Citrus, Other Perennial Crops, Forest Plantation, Mosaic Agriculture, and Pasture), Non-Vegetated Areas (Beach, Dune and Sand Spot, Urban Area, Mining, Other Non-Vegetated Areas), Water (River, Lake and Ocean, Aquaculture), and Non-Observed. After, we performed the calculation of areas, proportional areas in relation to the PSHB area, and 10-year (except for the 1985–1990 period) change rates. The calculations were performed using the ArcGIS v.10.6 software and Microsoft Excel 2021.

2.3. Sediment and Water Chemical Analysis

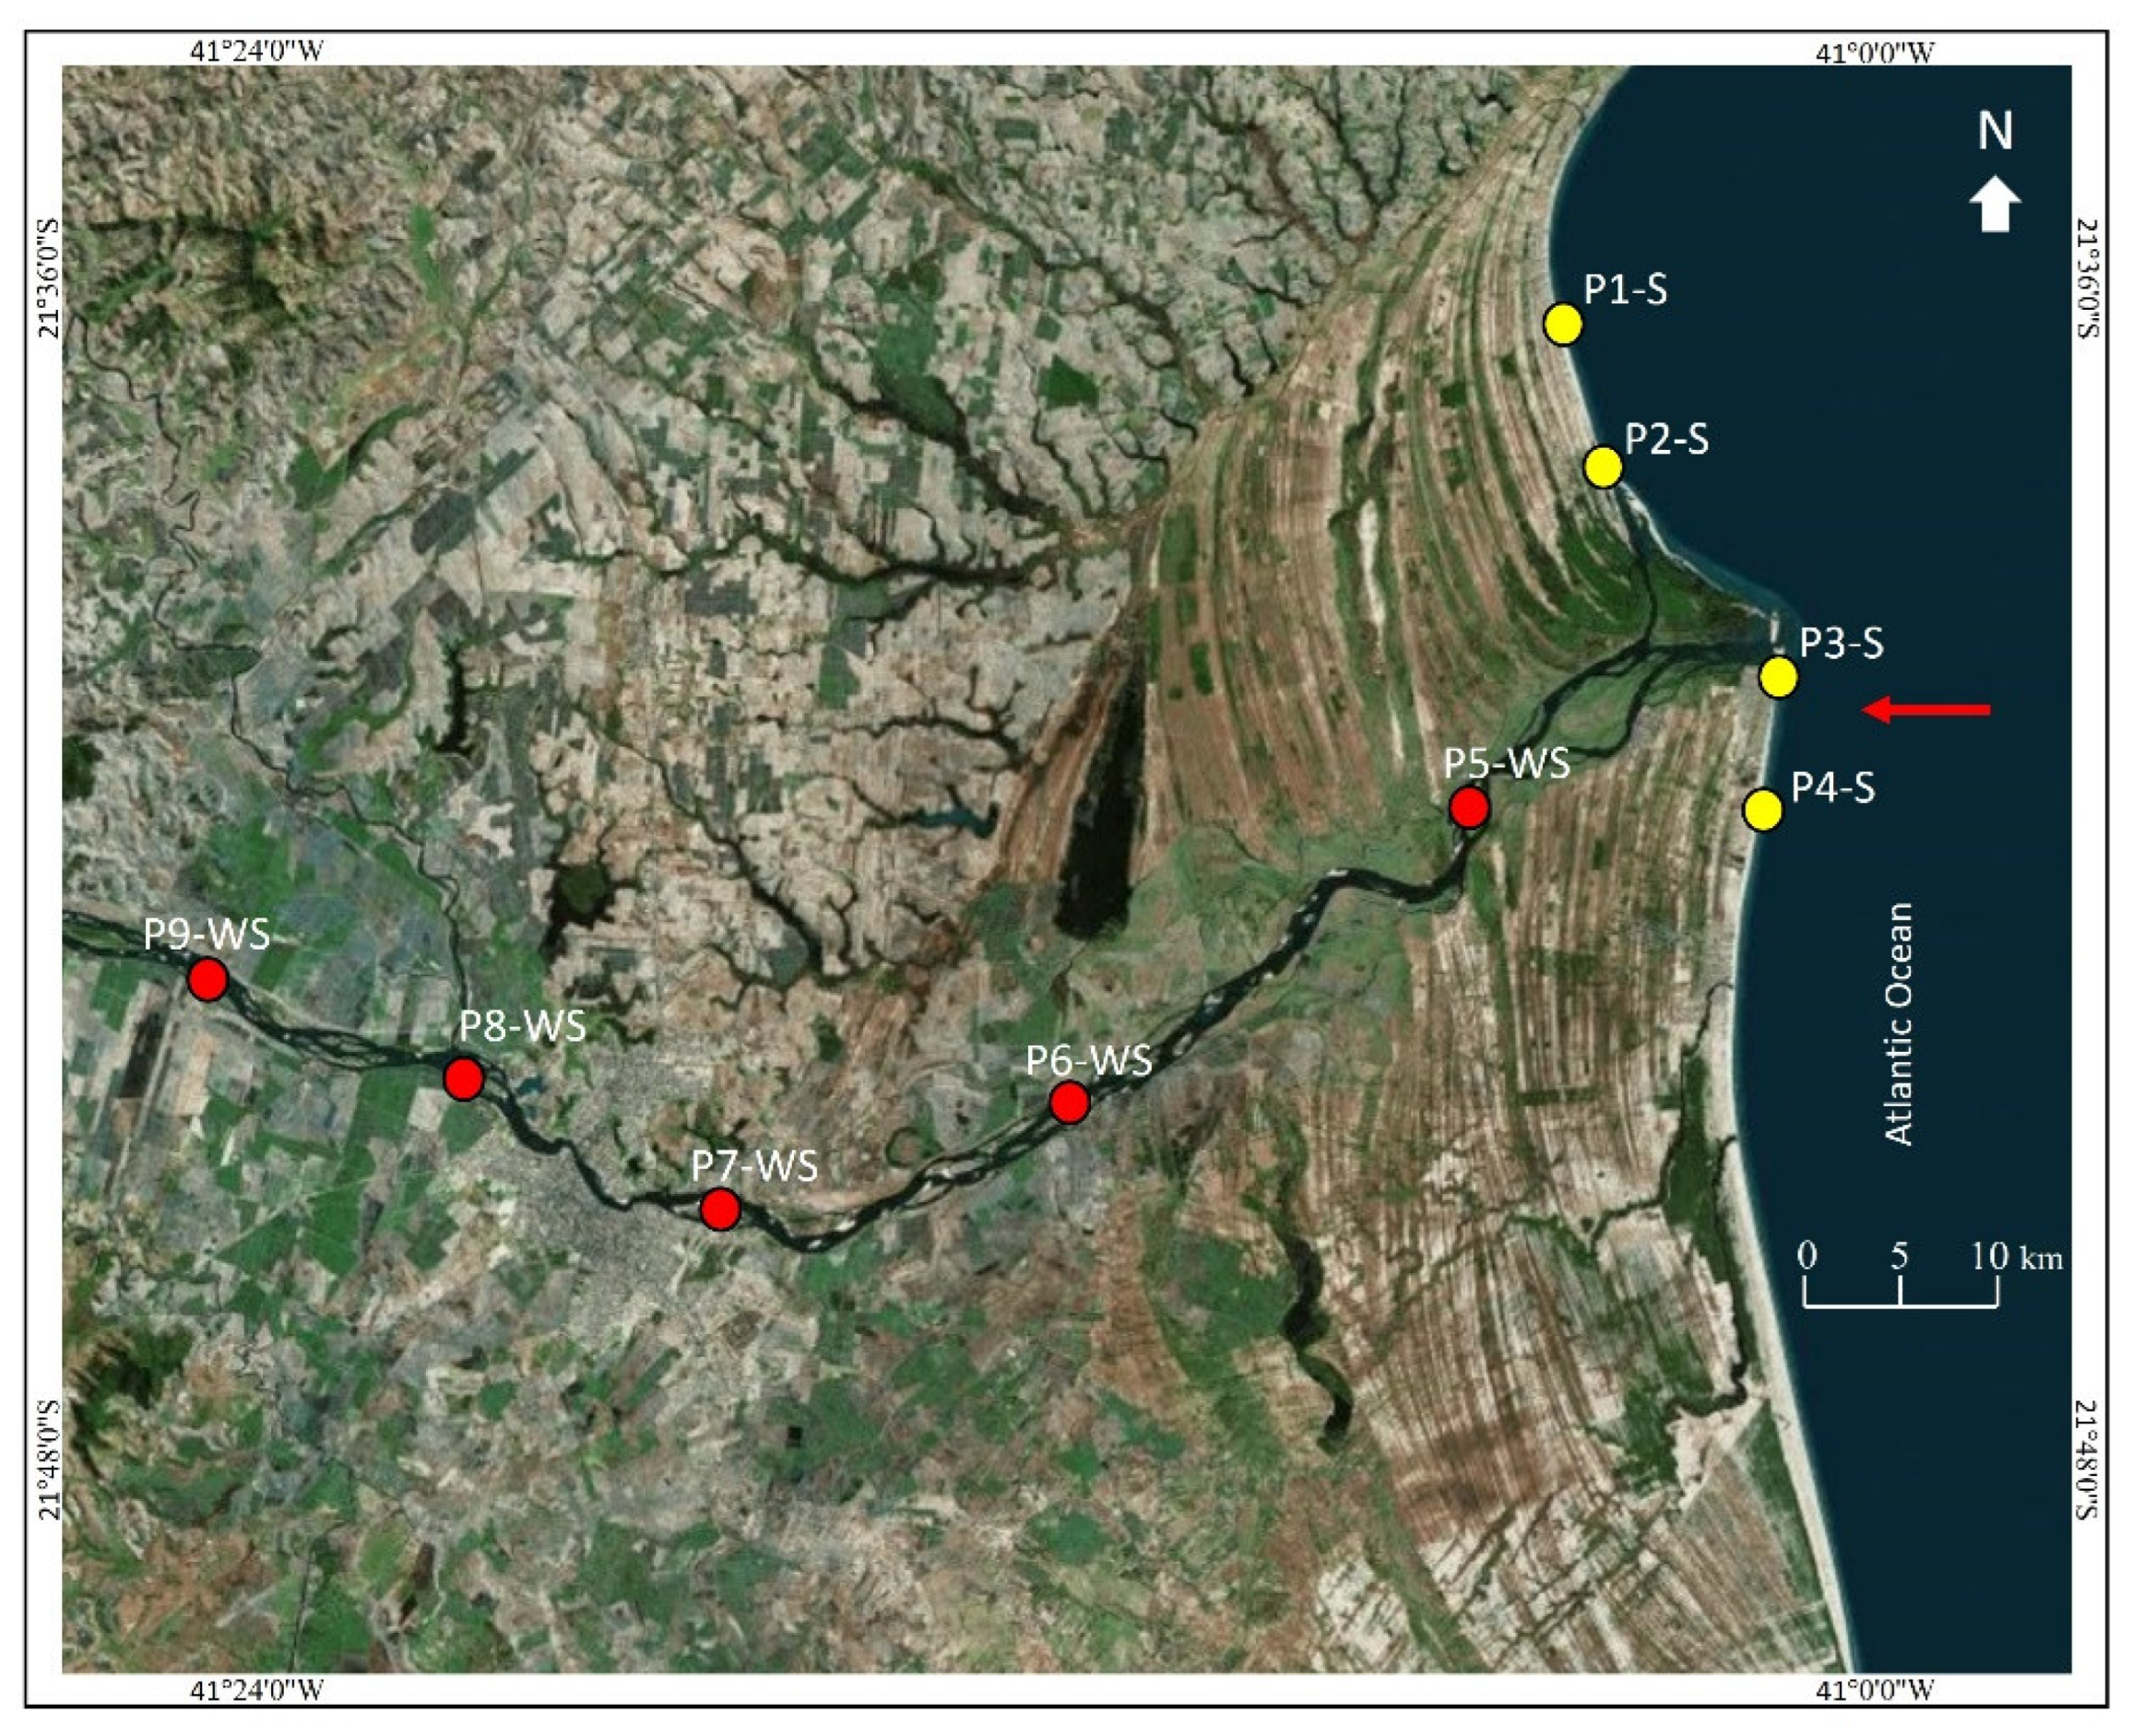
Nine samples were taken along specific sectors in the lower course of the PDS, as shown in Figure 1 and Figure 2. All nine samples were characterized for sediment chemical features, P1-S, P2-S, P3-S, P4-S, P5-WS, P6-WS, P7-WS, P8-WS, and P9-WS, whereas selected sites, P5-WS, P6-WS, P7-WS, P8-WS, and P9-WS, were assayed for water chemical properties. In more detail, samples were taken in the perimeter that preceded the coastal plain, in its transition and final course to the mouth, and along the coast, to the north and south of the delta. The sampling design was based on land use, distance from the coastal erosion area, and intensity of the erosion process, much more significant in the southern delta than in the northern part. On the left flank, S5 and W5, and S9 and W9, are from sugarcane fields and pasture areas; S7 and W7 are from urban settling on the right bank; S8 and W8 are nearby industrial settlements associated with dredging, and S6 and W6 are close to the urbanized area of the municipality of Campos dos Goytacazes. Along the coastline, S1, S2, S3, and S4 are from the locations placed at the north and south of the mouth.
Granulometric analysis was determined according to the standard procedure. After washing and oven drying at 80 °C for 72 h, mechanically quartered samples were weighed with an analytical balance and sieved by a series of stacked sieves up to 63 μm with a 1/2 ϕ class interval, in a mechanical sieve shaker for 15′. Fractions from 63 to 2 μm were analyzed through sedimentation in distilled water with 10% sodium oxalate at specific temperatures [89]. The geographic coordinates of samples, granulometric fraction percentages, and sediment classification [90] are shown in the Section 3.4.
Sediment samples were analyzed for Cu, K, Na, Fe, P, Mn, and Zn, by the Mehlich 1 method [91]. Ca, Mg, and Al concentrations were determined by a KCl extractor. Sediments were collected at a depth of 20 cm, according to the Brazilian Agricultural Research Corporation (EMBRAPA) [91]. Water samples were performed in 500 mL sterilized polyethylene containers at a depth of 25 cm, following the methodology of the Environmental Protection Authority (EPA) [92], whereas sulfur by phosphate ion extraction of 500 mg of P L/1. To measure the hydrogenic potential (pH), a sensor and an electrode capable of capturing the difference in electrical potential were used [93]. The determination of TOC was performed by an elemental analyzer, PrimacsSNC-100 Skalar (Breda, The Netherlands); 0.5 g of ≤2000 μm dry sediment was weighed in ceramic vessels and combusted at a high-temperature range of 900–1100 °C in a chamber in the presence of oxygen. The gases of carbon dioxide were separated and measured with a non-dispersive infrared detector (NDIR) and thermal conductivity detector (TCD). Total organic carbon was determined by the difference between total carbon (TC) and inorganic carbon (IC) concentration. TC was determined by catalytic oxidation of the sample at 1100 °C, converting the carbon to CO2, which was detected by the NDIR detector.

2.4. Shoreline Changes and Coastal Erosion

The definition of coastline used in this research considers the dry/wet border, as proposed by Kraus and Rosati [94]. This definition is highly dependent on the beach profile, sea level, swell, wind, and tide regime, not related to a specific vertical datum and derived from the differentiation of tonalities visible through aerial photographs. In this way, the coastlines (vectors) of different satellite images was traced in Google Earth Pro v. 7.3.4.8642 at a scale of 1:5000, using a mosaic of images for 1985 and 2022. The limits followed the methodology used by Lämmle and Bulhões [18] and sought to consist of the maximum range of the sprawling waves and visual distinction of how far the sprawling waves reached, considering the difference in surface reflectance (dry sand × wet sand) on images in RGB color composites.
Considering the beach morphology and the fact that it has a microtidal regime, the use of this definition and methodology proves to be effective for the objective of the work, since the small oscillation is not capable of invalidating the interpretation of the results. This fact occurs because the area consumed by coastal erosion is significantly large, and the possible margin of error in the tidal oscillation in the coastline scanning procedure becomes insignificant compared to the eroded area.
The coastline vectorization procedure in vector files of the intense coastal erosion zone was initially performed in Google Earth Pro and later transformed from the .kmz format to the .shp one. Subsequently, the vectors were interpreted in a GIS environment using the QuantumGIS v. 3.16.10 (Hannover, Germany) software, performing the superposition of the 1985 coastline on the current one, obtaining the horizontal spatial differentiation in the period considered with the elaboration of a polygon built from the closing of the ends between the two coastlines in the zone of intense coastal erosion. To better identify the measured area, transects with an equidistance of 40 m were inserted along the calculated sand polygon.

3. Results and Discussion

3.1. Land Use and Anthropic Pressure on the Hydrographic Basin

The Paraíba do Sul hydrographic basin has a complex history of occupation and land use has intensified since the early 19th century, when natural vegetation was replaced by coffee plantations (Figure 3). From the decline of the coffee economy, population growth in Vale do Paraíba do Sul occurred in conjunction with the construction of roads economically integrating the states of Rio de Janeiro and São Paulo, as well as industrial development in these states [66].
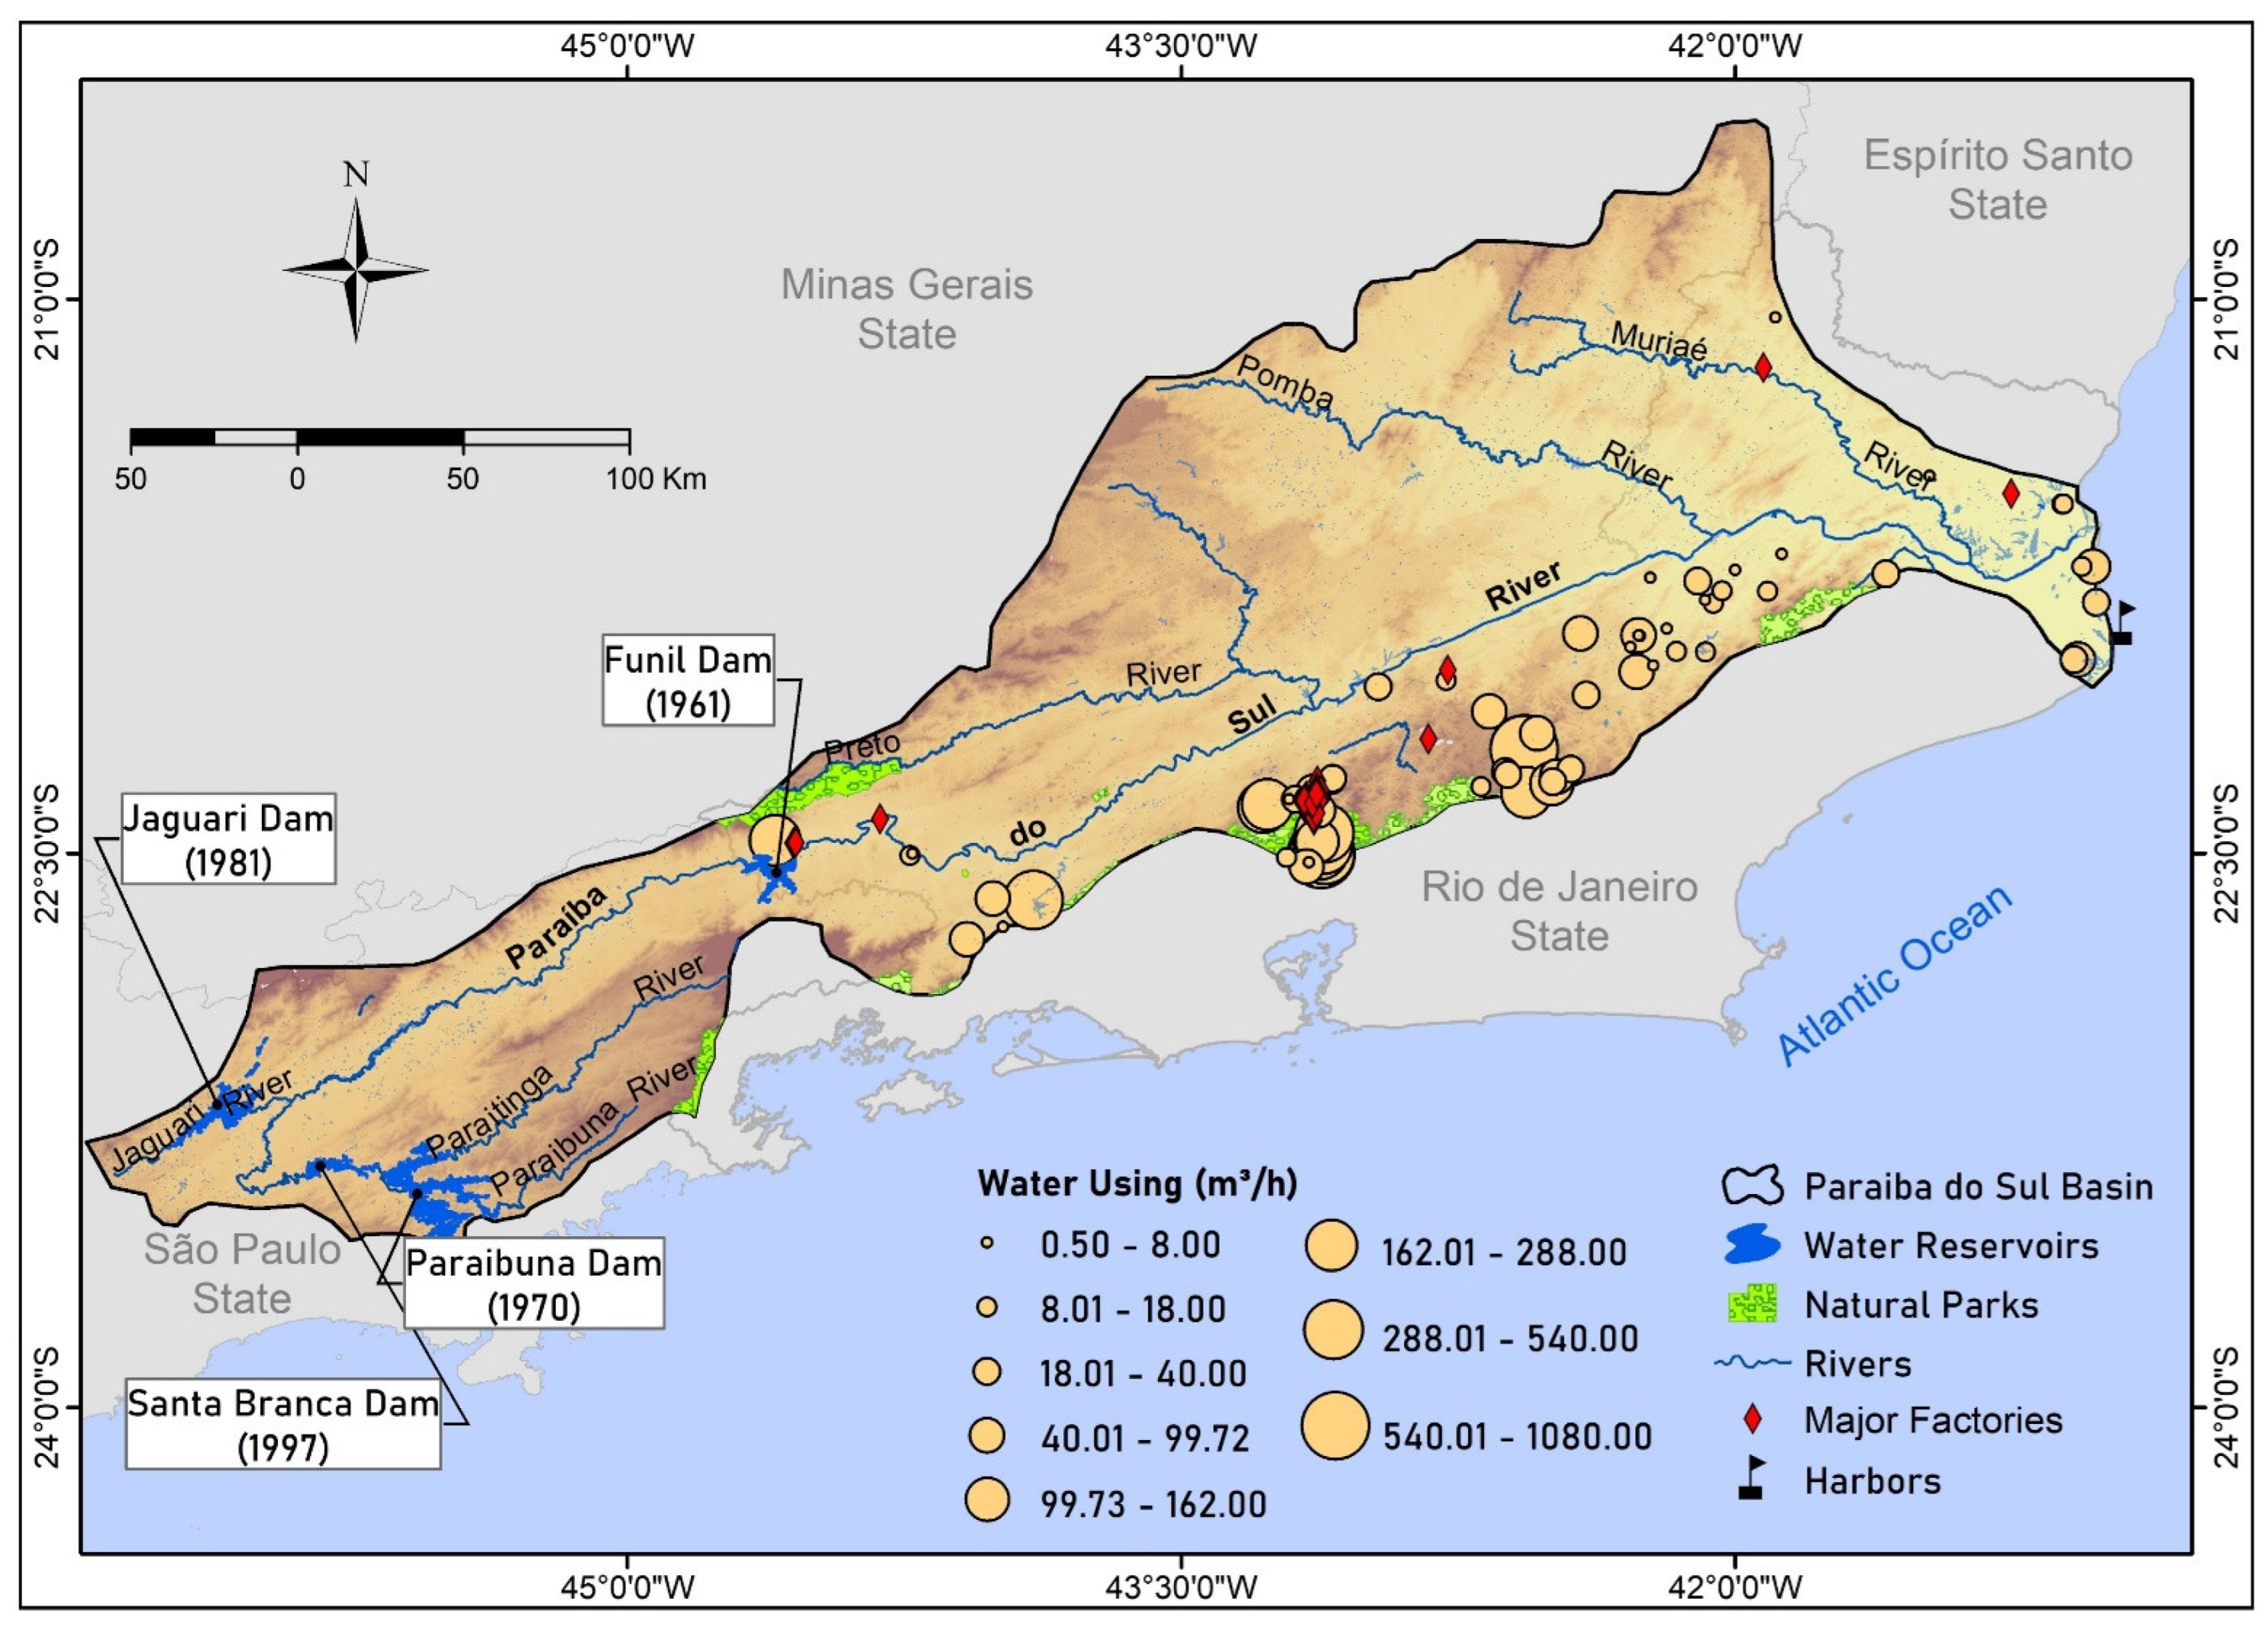
Currently, the basin has suffered from several anthropic stressors that include four large water reservoirs (Jaguari, Funil, Paraibuna, Santa Branca), and the extraction of water from aquifers for various uses that include high-technology industries and port structures close to the Paraíba do Sul delta. As for the use of water, according to data [65], the amount varies from 0.50 m3/h to 1080.00 m3/h, which is designated mainly for mining, industries, and population supply. Public supply is also provided by the Jaguari, Paraibuna, Funil, and Santa Branca reservoirs, which constitute approximately 1300 km2 of the artificially flooded area. In addition, some of these reservoirs are part of a water transfer system from the drainage of the Paraíba do Sul River to another public supply system called the Cantareira System, which is responsible for supplying the Metropolitan Region of São Paulo (>10 million inhabitants).
It is likely that these human stressors in the PSHB led to the development of blockages that impacted the sedimentary conveyor belts due to sedimentary delivery switch-off (partial or total) toward the river mouth [12,96,97]. These processes can be understood from a conceptual framework on the (dis)connectivity of catchment sediment cascades, as the degree to which human and/or natural limiting factors constrain the efficiency of sediment transfer relationships. According to Brunsden and Thornes [98], a disturbance in a geomorphological system can be classified into pulsed and ramped types of inputs. The first types of inputs are typically extreme and episodic events, while the second one is associated with sustained changes that result in persistent shifts in the controlling variables or boundary conditions [97]. From this framework, the MapBiomas data show that the PSHB has been transformed since 1985 by the intense and sustained replacement of natural cover vegetation to a more anthropized context (Table 1). Therefore, a ramped disturbance can be considered the main driver of negative impacts on the sedimentary transmissions in the PSHB.
However, the LULC changes in the 10-year interval occurred at different rates and this can be noted in Table 2. The results highlighted that, between 1990 and 2000, the non-vegetated areas increased from 1099.32 to 1259.19 km2, corresponding to a variation of 16.61%, the highest value for this class. This high value is associated with the growing urbanized area that increased from 1063.78 km2 (1990) to 1278.43 km2 (2000), corresponding to an expansion of 20.18% in the urban areas. Nonetheless, between 1990 and 2000, the water class also registered significant variation, with an area reduction of 8.87%.
The impacts of different LULC classes’ rate changes rates on the water and sedimentary connectivity in the PSHB are considerably complex to determine, from the perspective of both their impacts on the environmental system and the factors triggering these variations (e.g., economy, cult, legislation). Consequently, the predominance of the water class decreases in the time series analyzed, in contrast with its positive variation in 2010, indicating a possible relationship with the forest/non-forest class increment.
Furthermore, our analyses support that the entire hydrographic network has been modified by urbanization and environmental changes since 1990 (e.g., hydroelectric dams, aquifer exploitation, stream diversions, channelization, and deforestation). These modifications impacted the transmission of water and sediments, resulting in a decrease in sediment delivered to the Paraíba do Sul River mouth. Furthermore, our analyses contribute to understanding the impact of anthropic pressures on the continent–ocean sedimentary balance, according to other studies [99]. For instance, in Greece [100,101], it is pointed out that, during the 19th century, the water/sediment fluxes were modified extensively by human activities, resulting in a dramatic reduction in river sediment supply to the coastal zone. Recent studies also showed that over ~150 years, the variations in fluvial sediment supply to the coast from the Pearl River (China) were dominated by human activities, and the increases in river flow projected to be driven by climate change in the 21st century will only compensate for around 1% of the human-induced deficit in sediment load [102]. Similarly, in the Entella River floodplain (Northern Italy), the reduction in sediment supply produced due to human intervention caused the regression of the coastline in the river mouth [103].

3.2. Paraíba do Sul River Discharge

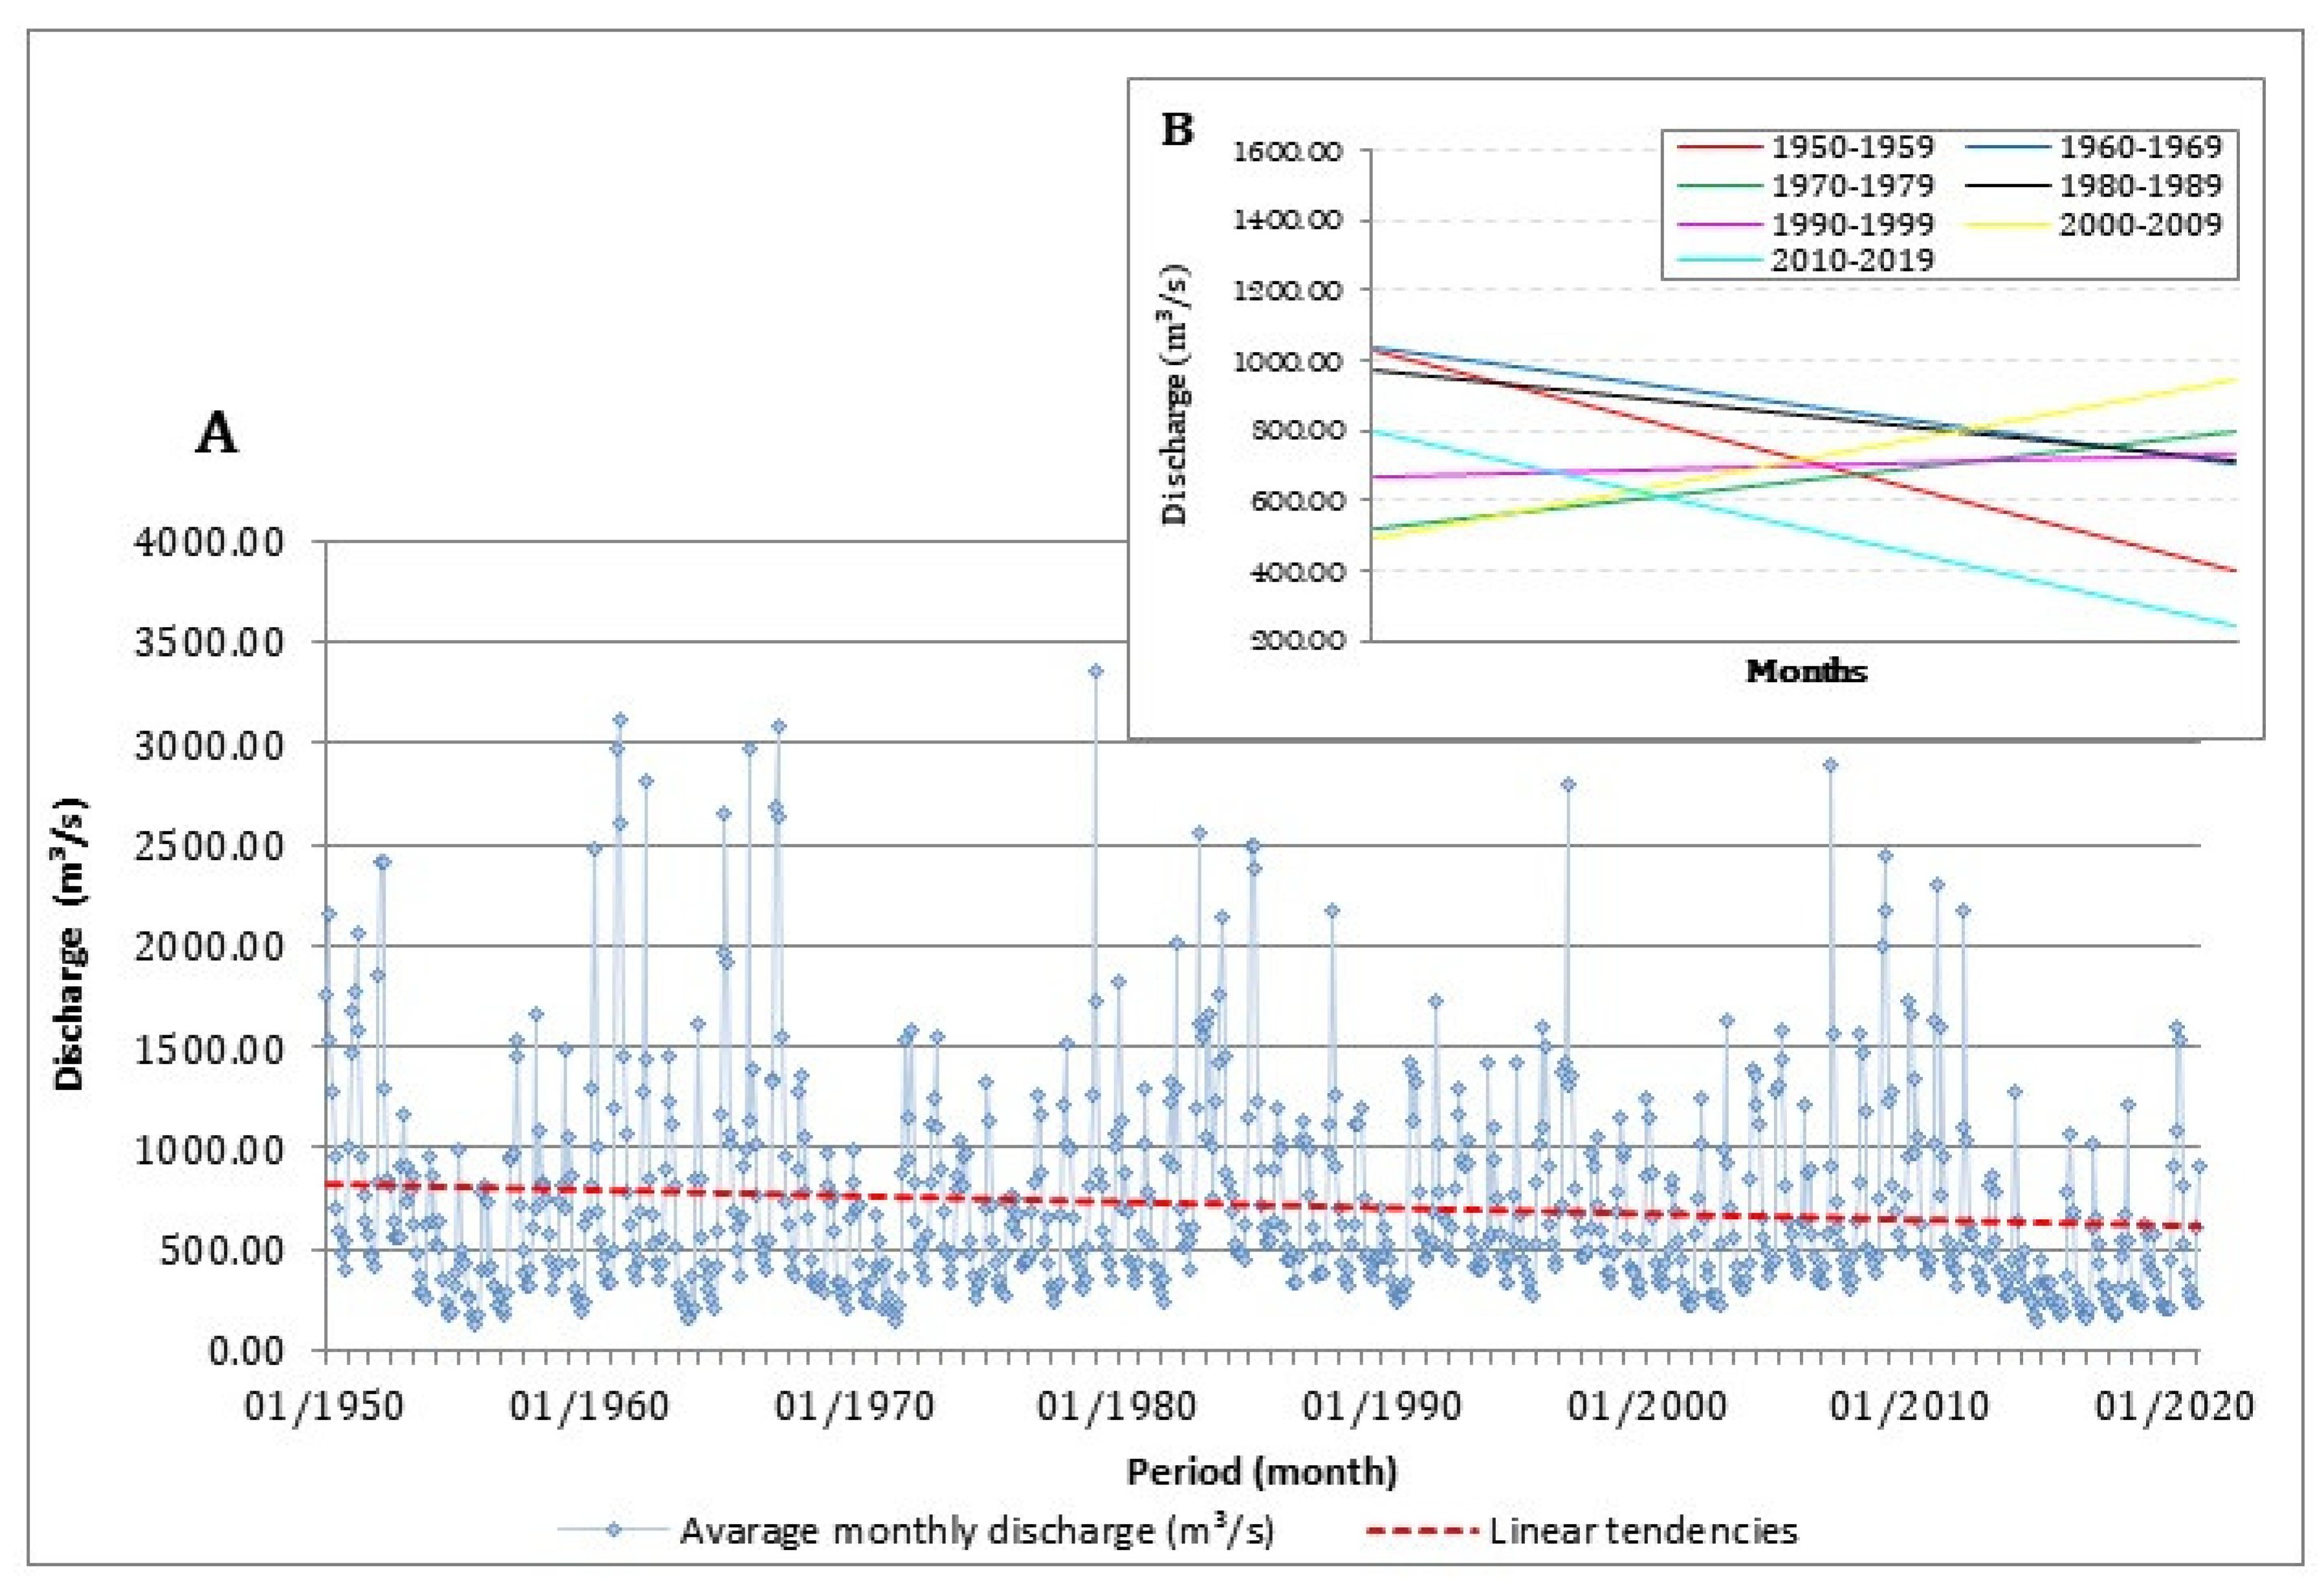
The discussions about the negative impact triggered by the complex LULC since the 1980s are consistent with the variations in the fluvial discharge. From this perspective, a 70-year historical dataset (1950–2020) on the average monthly discharge of the Paraíba do Sul River has shown a downward trend since 1950 (Figure 4A). However, the fluvial discharges showed different tendencies on a decadal scale, indicating that the periods 1950–1959, 1960–1969, 1980–1989, and 2010–2019 registered decreases in the flow (Figure 4B). On the other hand, in the periods 1970–1979, 1990–1999, and 2000–2009, the opposite tendencies were observed.
Table 3 shows that the maximum and minimum discharges have varied since 1950. Concerning the maximum discharge values, the time periods that presented the highest and lowest standard deviation values were 1960–1969 and 2010–2019, respectively. The interval with highest variance corresponds to the building of the Paraíbuna dam, and the standard deviation and variance values in the period 1980–1989 seem to reflect influences from the construction of the Jaguari dam system, which is responsible for the water diversion from the PSHB to the Cantareira System, which is responsible for the water supply of the metropolitan region of São Paulo city.
The variations in the Paraíba do Sul River discharge have presented correspondences with the Mapbiomas data, which show intensive deforestation since 1985. Therefore, our study identified that, in almost 40 years, the area occupied by the water class declined by 7.90% (1985–2009) and the non-vegetated class (42.83%) increased significantly, with an emphasis on the urbanized areas. The Qmed = 699.68 m3/s (1990–1999), indicating that the fluvial discharge decreased, in contrast with the past decade’s values, consistent with 20.18% growth in urbanized areas.
Therefore, the main offsite impacts resulting from the coupling between LULC and fluvial discharges in the PSHB are associated with the erosion in the coastal system located near the Paraíba do Sul mouth. From this perspective, we consider that the fluvial discharge decrease in recent decades did not supply sediments to the coastal region, resulting in the continent–ocean sedimentary balance. In turn, the coupling between the basin-scale and the local-scale (e.g., ports, coastal defense structures) human-induced processes contributed to the intensification of the coastal erosion in Atafona village, a district of the São João da Barra city, near the Paraíba do Sul River delta (Figure 5 and Figure 6).

3.3. Hydrographic Basin Changes and Coastal Erosion in the Delta System Shoreline

The anthropic stressors in the basin scale have impacted the cascade of processes in the PSHB. Consequently, the environmental changes should be interpreted from a multi-scalar perspective, including those involving the coastal erosion in the river mouth and littoral region. In the southern river mouth, in the actual context, the morphology is associated with the presence of a sandy barrier due to the coastline retreat, partially submerged (Figure 4). In recent years, this dynamic has been linked mainly to a sedimentary deficit due to anthropogenic interventions in the hydrographic basin. Consequently, the urban buildings in Atafona village (a district of the São João da Barra city, Rio de Janeiro state) have suffered impacts of this process due to its relationships with the morphosedimentary aspects.
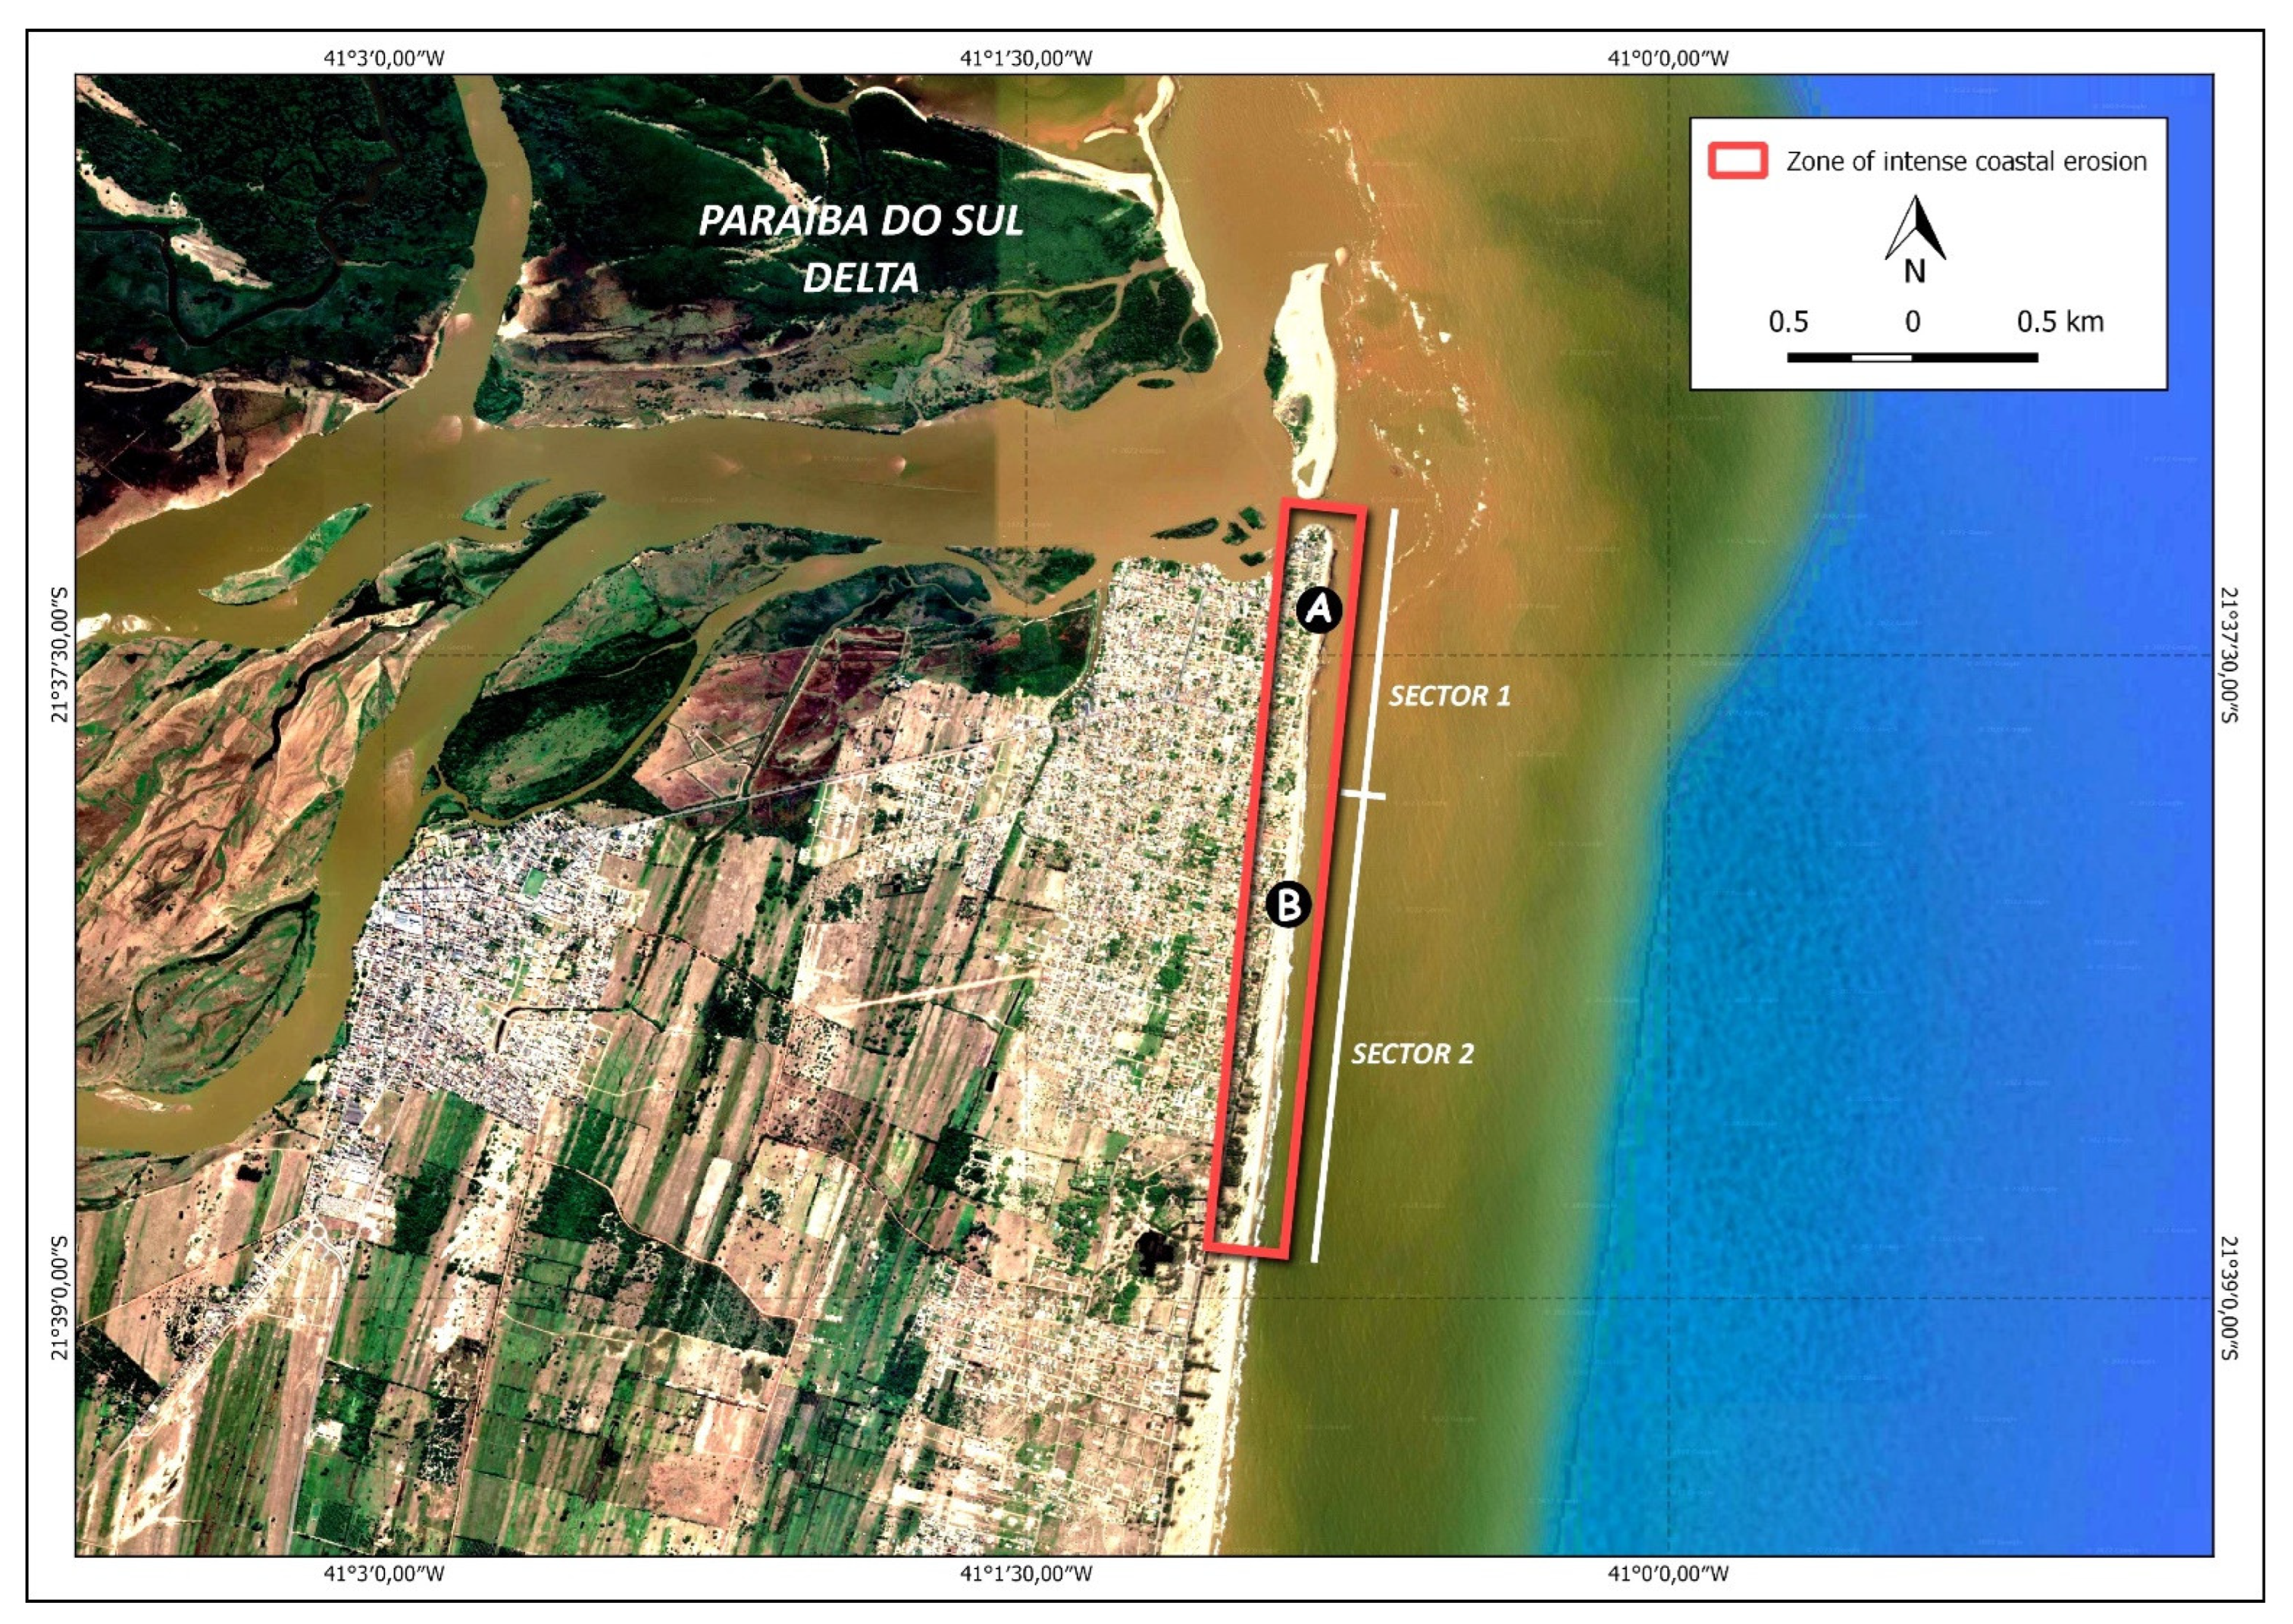
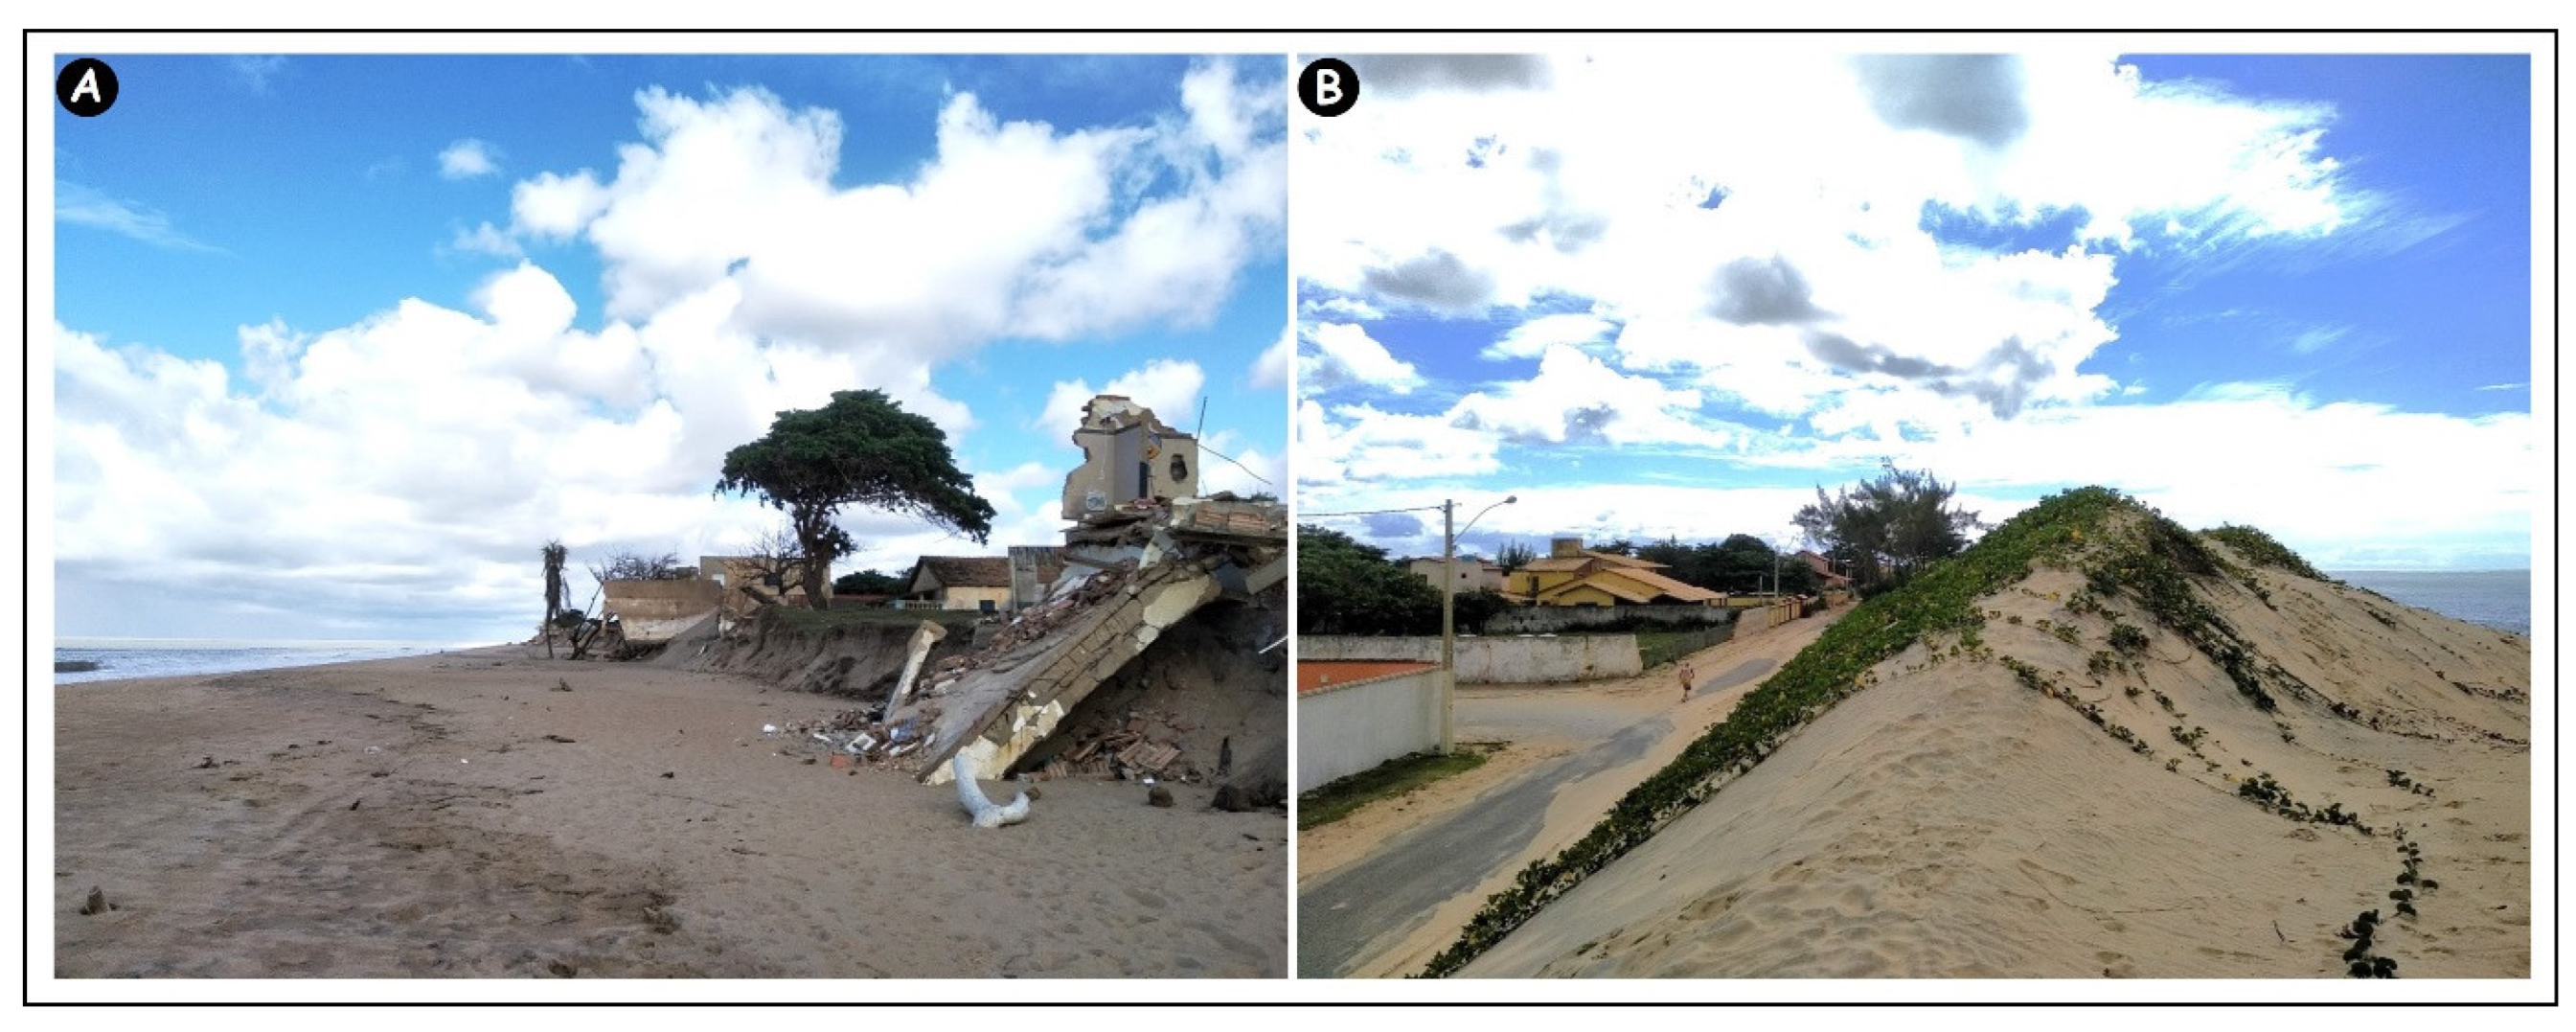
The zone of intense coastal erosion delimited in Figure 5 can be understood in two sectors, where sector 1 is closer to the mouth and characterized by direct contact between the waves and the urban structures, which continuously turn into debris and add to the fluvial–marine sediments. Sector 2 is characterized by the presence of foredunes that vary from 5 to 7 m a.s.l. [44], which prograde over the continent in line with the advancement of the sea, causing urban losses initially due to burial by the migration of dunes, since these are a form of natural protection from the action of sea waves. 
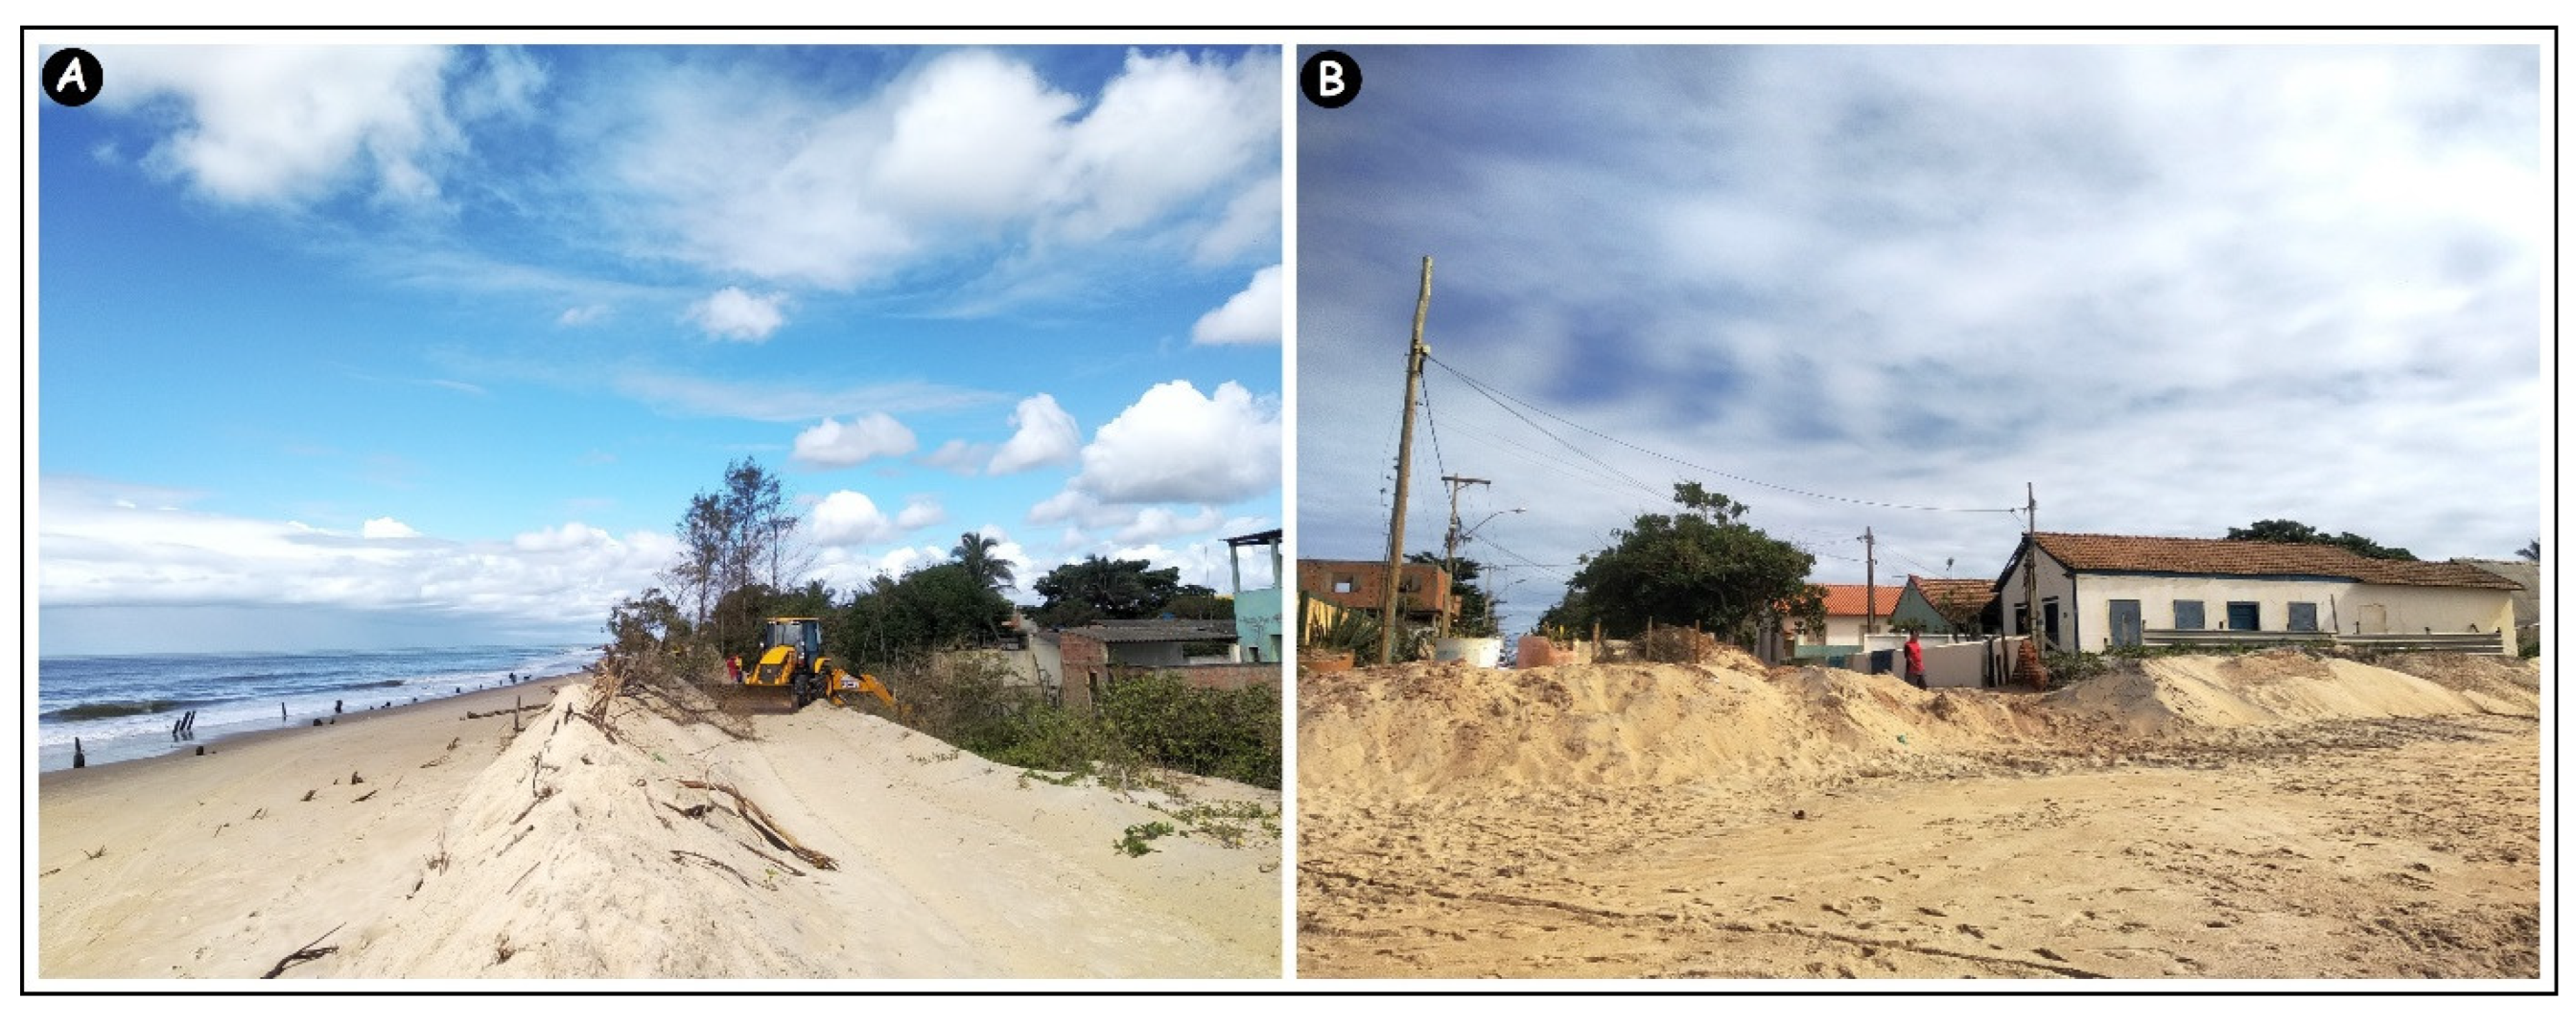
Figure 6 presents pictures taken during the fieldwork.
In this sense, over the years, this process has intensified, due to local factors and in the context of the river basin. At the local level, urban structures have significantly penetrated the vicinity of the ocean, making them susceptible to eventual erosive processes. In the context of the hydrographic basin, several factors associated with its use have intensified in recent decades, such as the growth of cities where the Paraíba do Sul River passes and, consequently, greater water abstraction from the basin. Additionally, the process of disorderly occupation in various sectors of the river ended up occupying active areas of the river dynamics itself, and the extraction of sand for civil construction purposes has become relatively common. Thus, the sum of factors associated with anthropic activities contributed to the reduction in the flow and transport of sediments, contrasting the increase in anthropization with the decrease in the resilience of the basin.
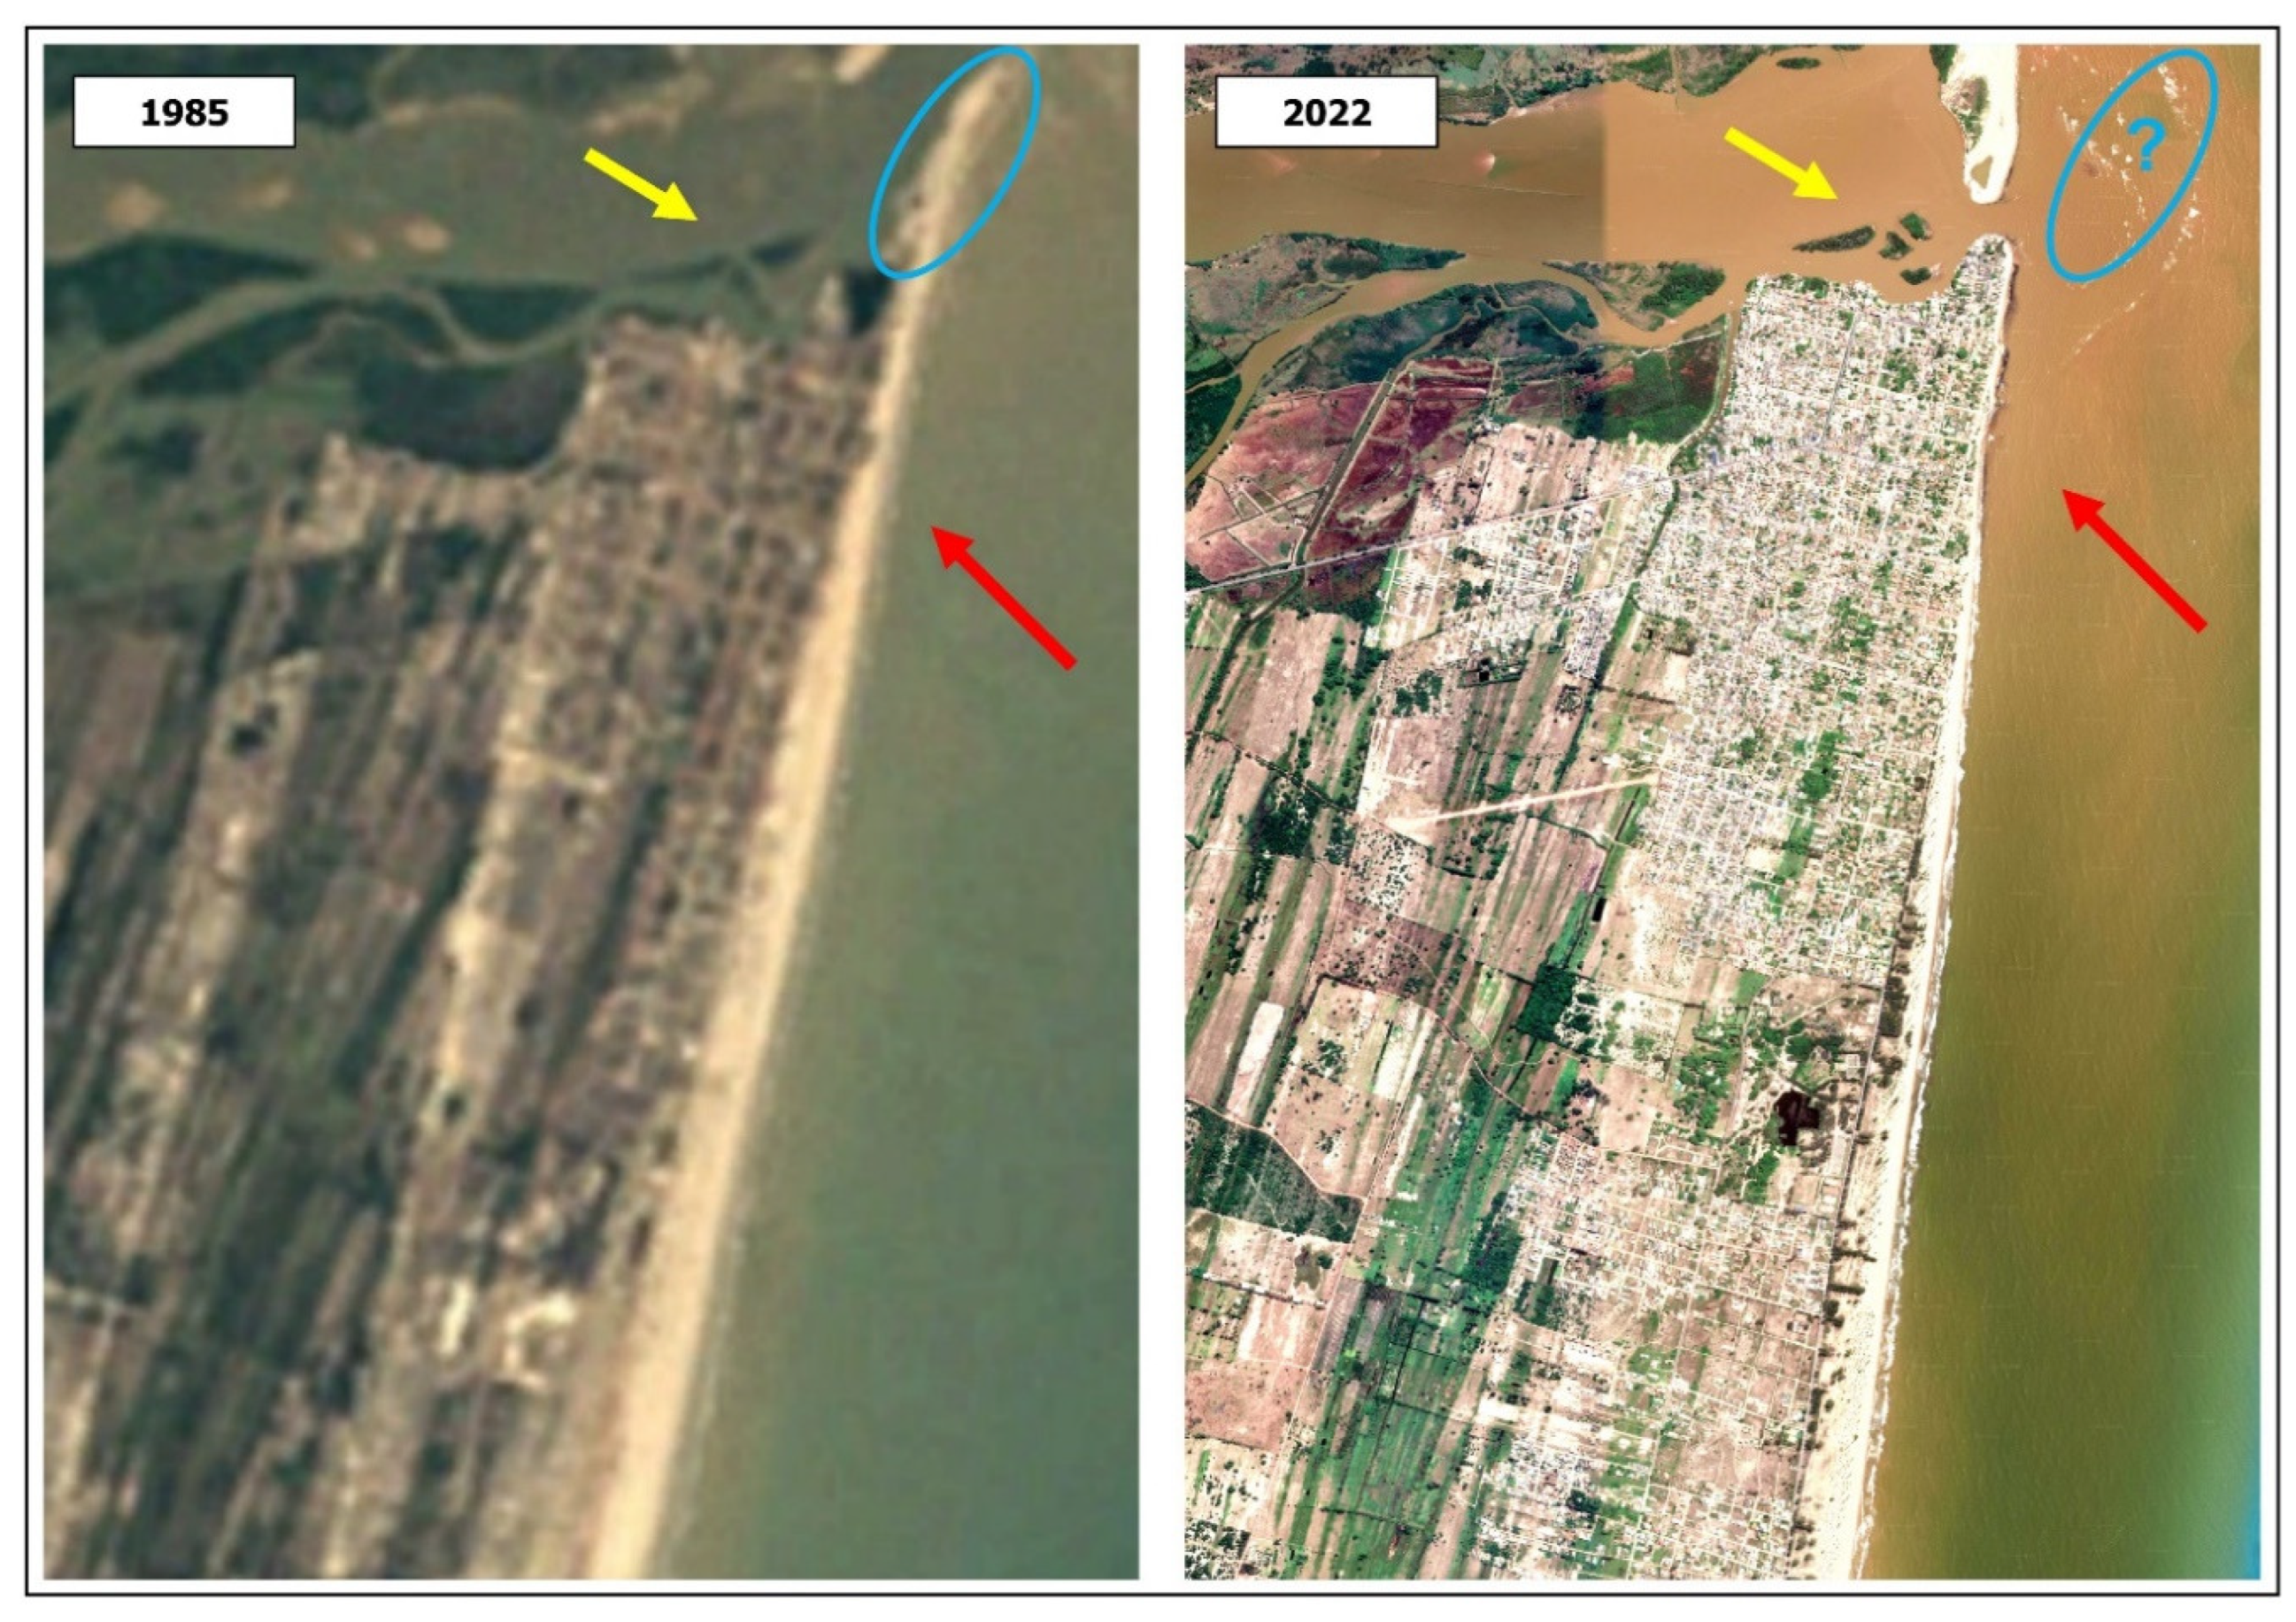
Figure 7 shows images from 1985 and 2022, in which it is possible to notice the significant retreat of the coastline in the area indicated by the red arrow, also detectable by the difference in the thickness of the sand strip in the two scenarios. Another important morphosedimentary aspect to be highlighted is the continuity of the coastline in the form of a sandy point present in 1985, highlighted with a blue circle. In the 2022 image, it is possible to observe a landward inflection and the absence of sandy outcrops due to the advancement of the sea at the local level. Another significant aspect to highlight is the presence of river islands and bars, indicated with the yellow arrow, which were more robust and located relatively far from the sea, while, in 2022, they are less robust and in direct contact with the coast. However, it is important to highlight that the foredunes located in sector 2 (see Figure 6) of the intense coastal erosion zone have a fundamental role in delaying the erosive processes.
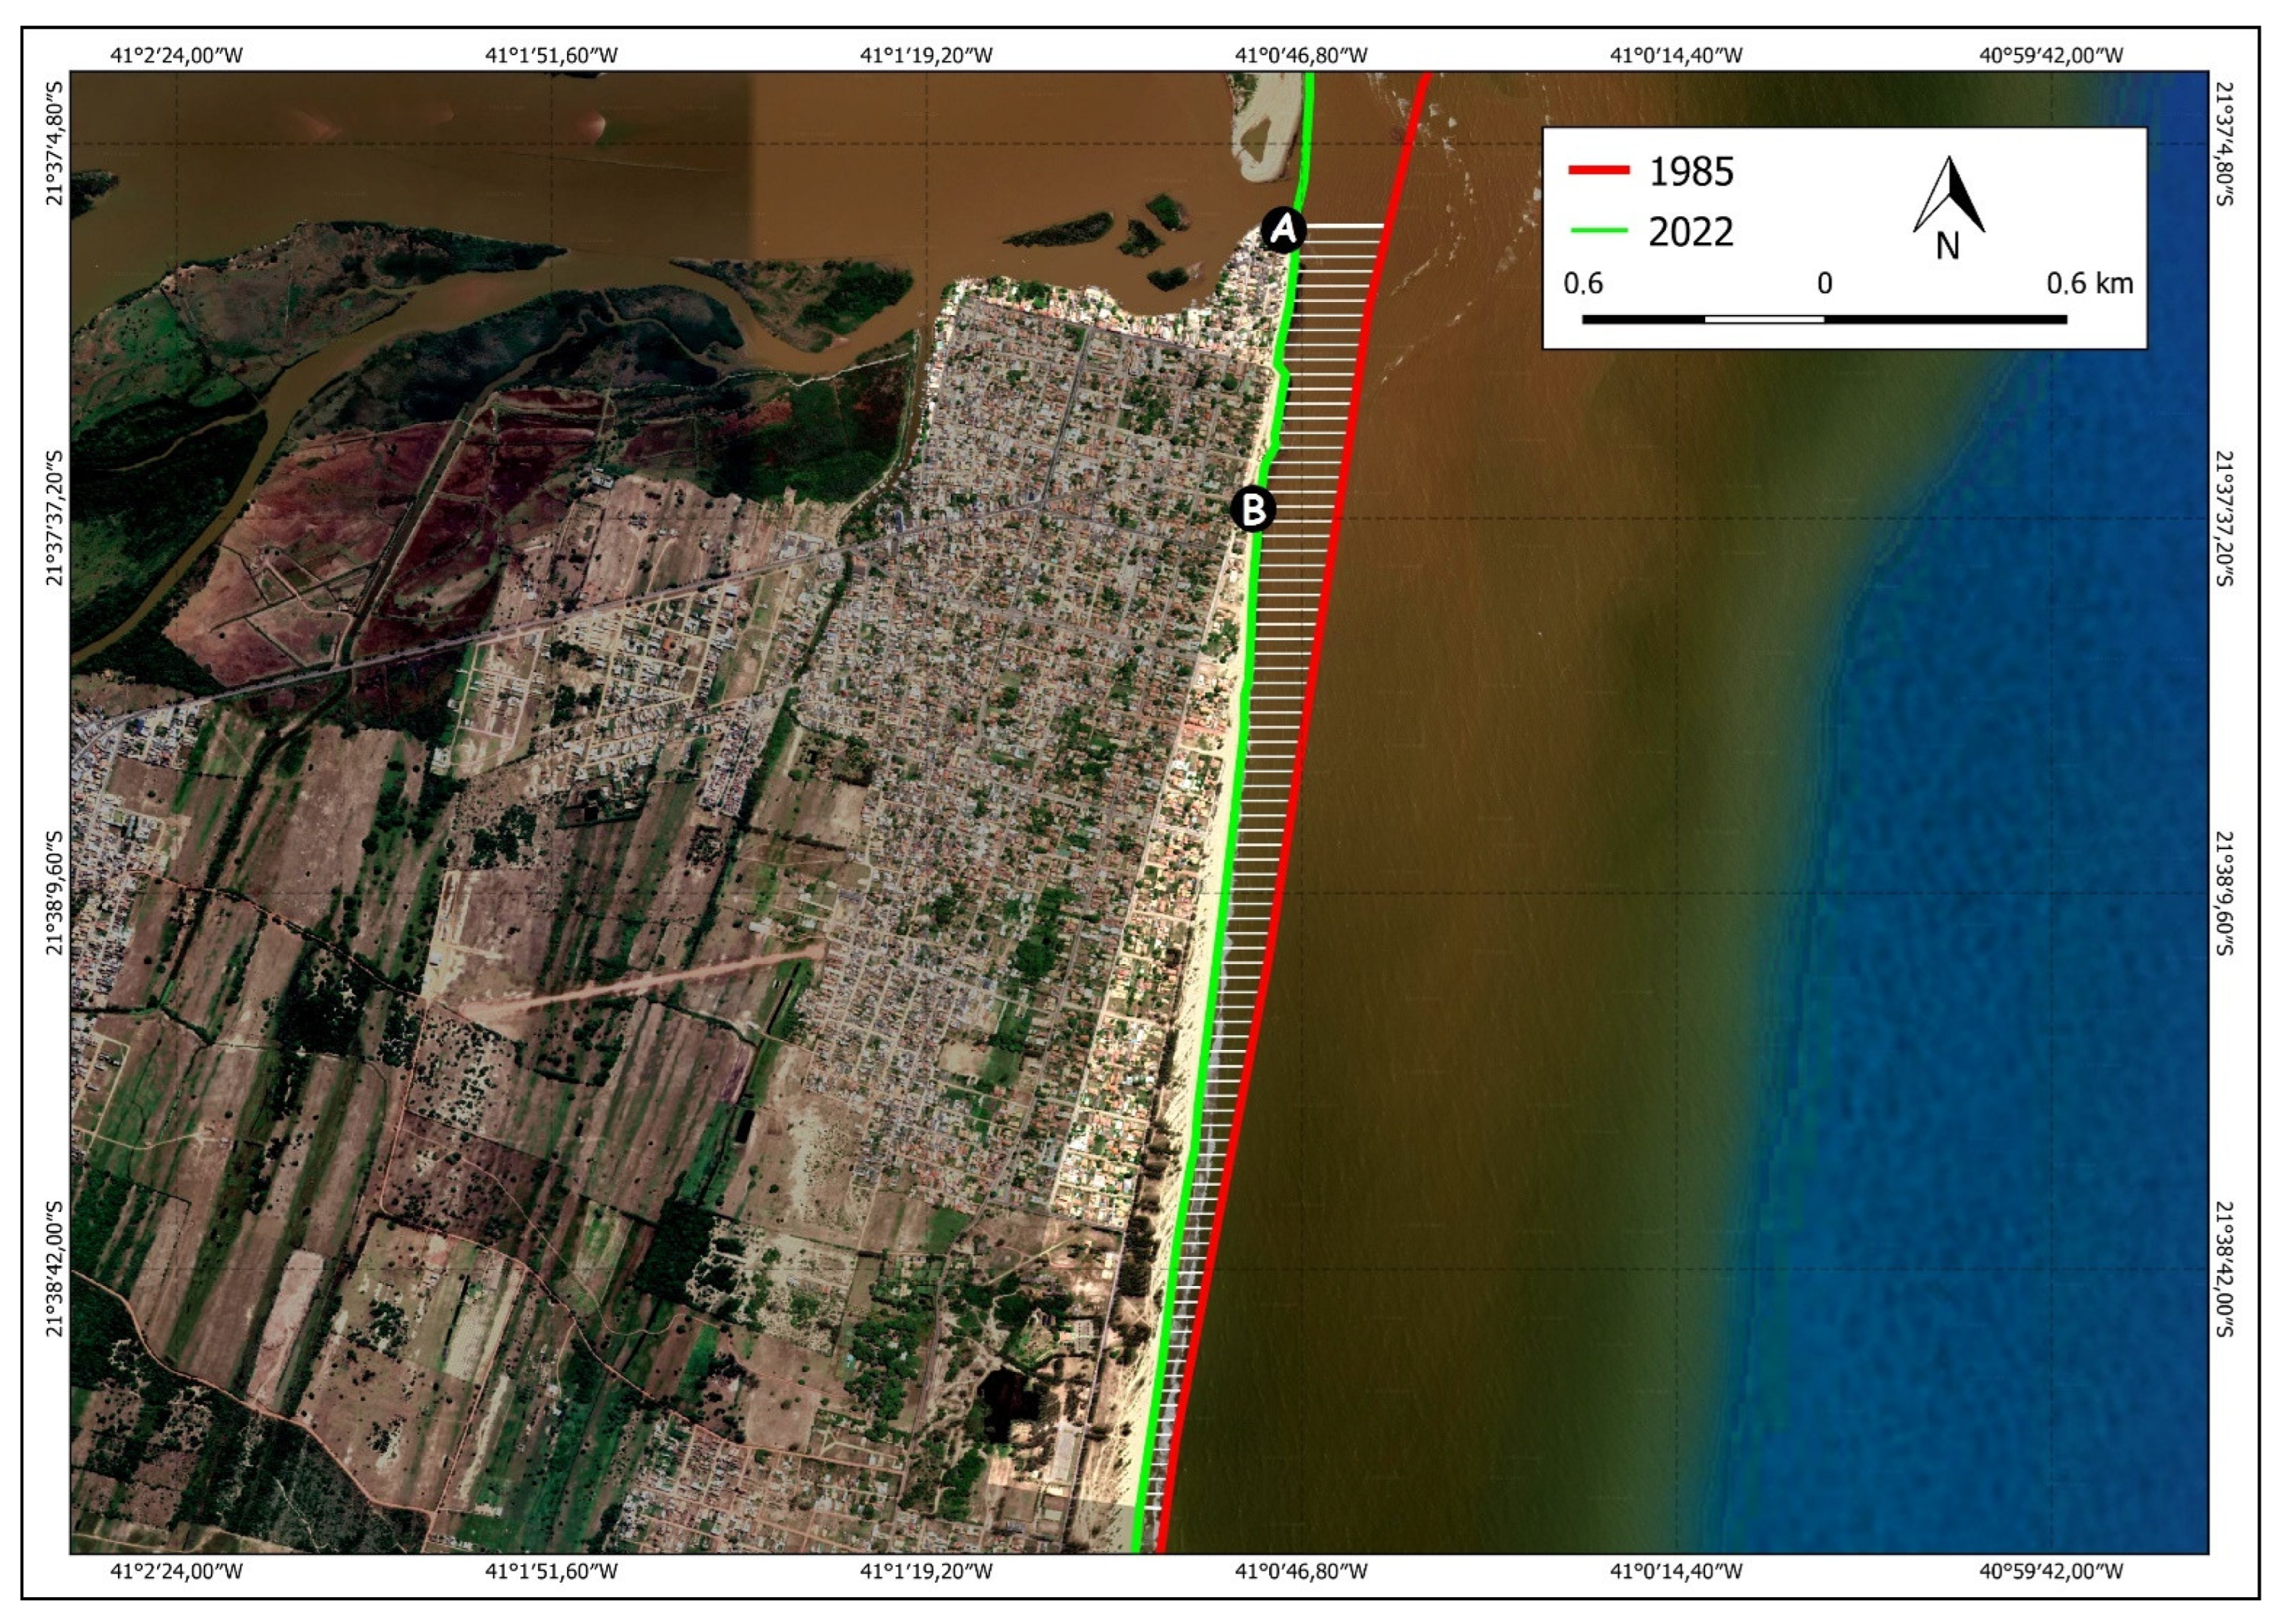
In this way, quantitatively, the vectorized results presented in Figure 8, from the images of 1985 and 2022, indicated that in the area delimited as a zone of intense coastal erosion, in that period, there was a total area of 458,124.65 m2 consumed by coastal erosion, and in the northern portion (first N-S transect). In this sense, it is possible to infer that in the period of 37 years, the sea advanced an average of 12,381.74 m2 over the continent in the locality, which is a significant loss when compared to other areas of the Brazilian coast (mouth of the Jequitinhonha River, mouth of the San Francisco River, among others).
The horizontal displacement was also calculated from the transects plotted every 40 m along the coastline between 1985 and 2022. This fact occurs because the portion of the coastline that is in contact with the mouth depends on and is directly affected by the sedimentary deficit, while, on the southern coast, the intensity of this process gradually reduces as a result of the greater distance from the mouth. Thus, the sector that most changed in this period is represented by the first transect (N-S direction), with a coastline setback of 236.04 m, while the smallest (last transect located to the south) presented a value of 65.8 m. It is noteworthy that they show decreasing values in the N-S direction, indicating a tendency whereby the further away from the mouth, the less susceptible to erosive processes and consequently less influenced by the sediments that arrive (or not) at the mouth.
Another important aspect represented in Figure 9 is the highlighting related to the greater brightness (contrast) in the area adjacent to the vectors representing the coastline from 1985 (red) and 2022 (green) in the village of Atafona, which was cut by the 2022 coastline. Additionally, with respect to the 1985 coast, the segmentation of urban blocks followed a relatively symmetrical format, shown by the red line parallel to the urban structures, which was cut transversally by the continuous progression of coastal erosion. The urban road used as a boundary to apply a higher level of brightness and make visible the urban asymmetry parallel to the coast caused by erosion is registered as Feliciano Sodré Street. Thus, to slow down the process, palliative measures are often carried out in the area, as shown in Figure 9.
In particular, such measures consist of remobilizing the material deposited by the sea with excavators, creating artificial “dunes” that momentarily serve as a natural protective barrier, easily erased during storm events. Given this context, such actions are becoming increasingly common, given that measures considered effective and long-term for the area seem unfeasible for the local reality. In this sense, it is considered essential to adopt effective measures to defend the coast—through engineering, among which underwater barriers or preferably even nature-like and sustainable measures are considered too—such as the artificial renourishment of the sand or dewatering of the emerged beach [105]. For this, a specific feasibility study would be necessary to identify which could be the most appropriate and economically viable intervention. Thus, it would increase the resilience of the natural and anthropic systems associated with this context.

3.4. Sediment and Water Chemical Features

Regarding the sediments, their granulometry varies from very coarse sand with percentages of sand up to 98.5–99.1% in the delta area, P1-S and P2-S, to silty sand, sandy clay, or clayey sand in the inner part of the studied area at sites P7-WS, P8-Ws, and P-WS, respectively, and where the clay content averages 31.8%. By contrast, clay content appears low at the delta area, with levels from 0.1 to 2.9%. The silt is mainly absent in the delta and increases up to 31.6% in the inner locations, P7-WS. As is evident from Table 4, land use is also very variable, from fishing and housing in the outer part to pasture and agriculture in the inner one. Only at site P7-WS, placed inside the urban setting of Campos dos Goytacazes city, soils appear also destined for industrial usage, resulting in this being the area under the highest anthropic pressure. Thus, the data reveal that the delta represents an environment affected by littoral erosion with a poor supply of fine river sediments.
Sediment chemical data are reported in Table 5. The mean pH value is 7.13, with an evident spatial trend: in fact, the pH tends to be more basic at the delta, with a mean pH of 8.55, and more acidic in the inner part, with an average value of 6.0 and a minimum value of 5.1 at P7-WS. The mean level of TOC, 0.39%, varies with a regular pattern, with a wide range of variation that seems linked to land use, since TOC is rather low in the delta locations and much higher in the inner area, with a peak of 1.6% at P9-WS. This implies that anthropogenic input influences the accumulation of organic matter in surface sediments. Other explaining factors of this pattern are climatic ones, due to washout and transport effects of the rainfall, the rate of sediment deposition, tidal effects, and microbial degradation [106], affecting the sorption capacity for organic compounds [107]. The concentrations of trace elements such as Cu and Zn do not exceed legal limits at all sites (Regulation of Brazil—ordinance no. 2.914/2011, Ministry of Health). However, a common tendency of all the studied elements is that levels shift toward higher values in the inner part due to the greater influence of multiple emissions of wastewater discharging sources.
Water chemical data are shown in Table 6. The average pH of the water is 7.34, with small differences among sites. EC was revealed to be quite similar in all the sampled areas, with a mean of 0.08 dS/m. Cations are detected in the following order: Ca> Na > Mg > K. The mean values are 16.83, 3.27, 3.16 and 2.38 mg/L.
Ca, Mg, Na, and K mean concentrations show spatial fluctuations, with standard deviations ranging between 0.20 and 0.89, indicating inputs from human activities [
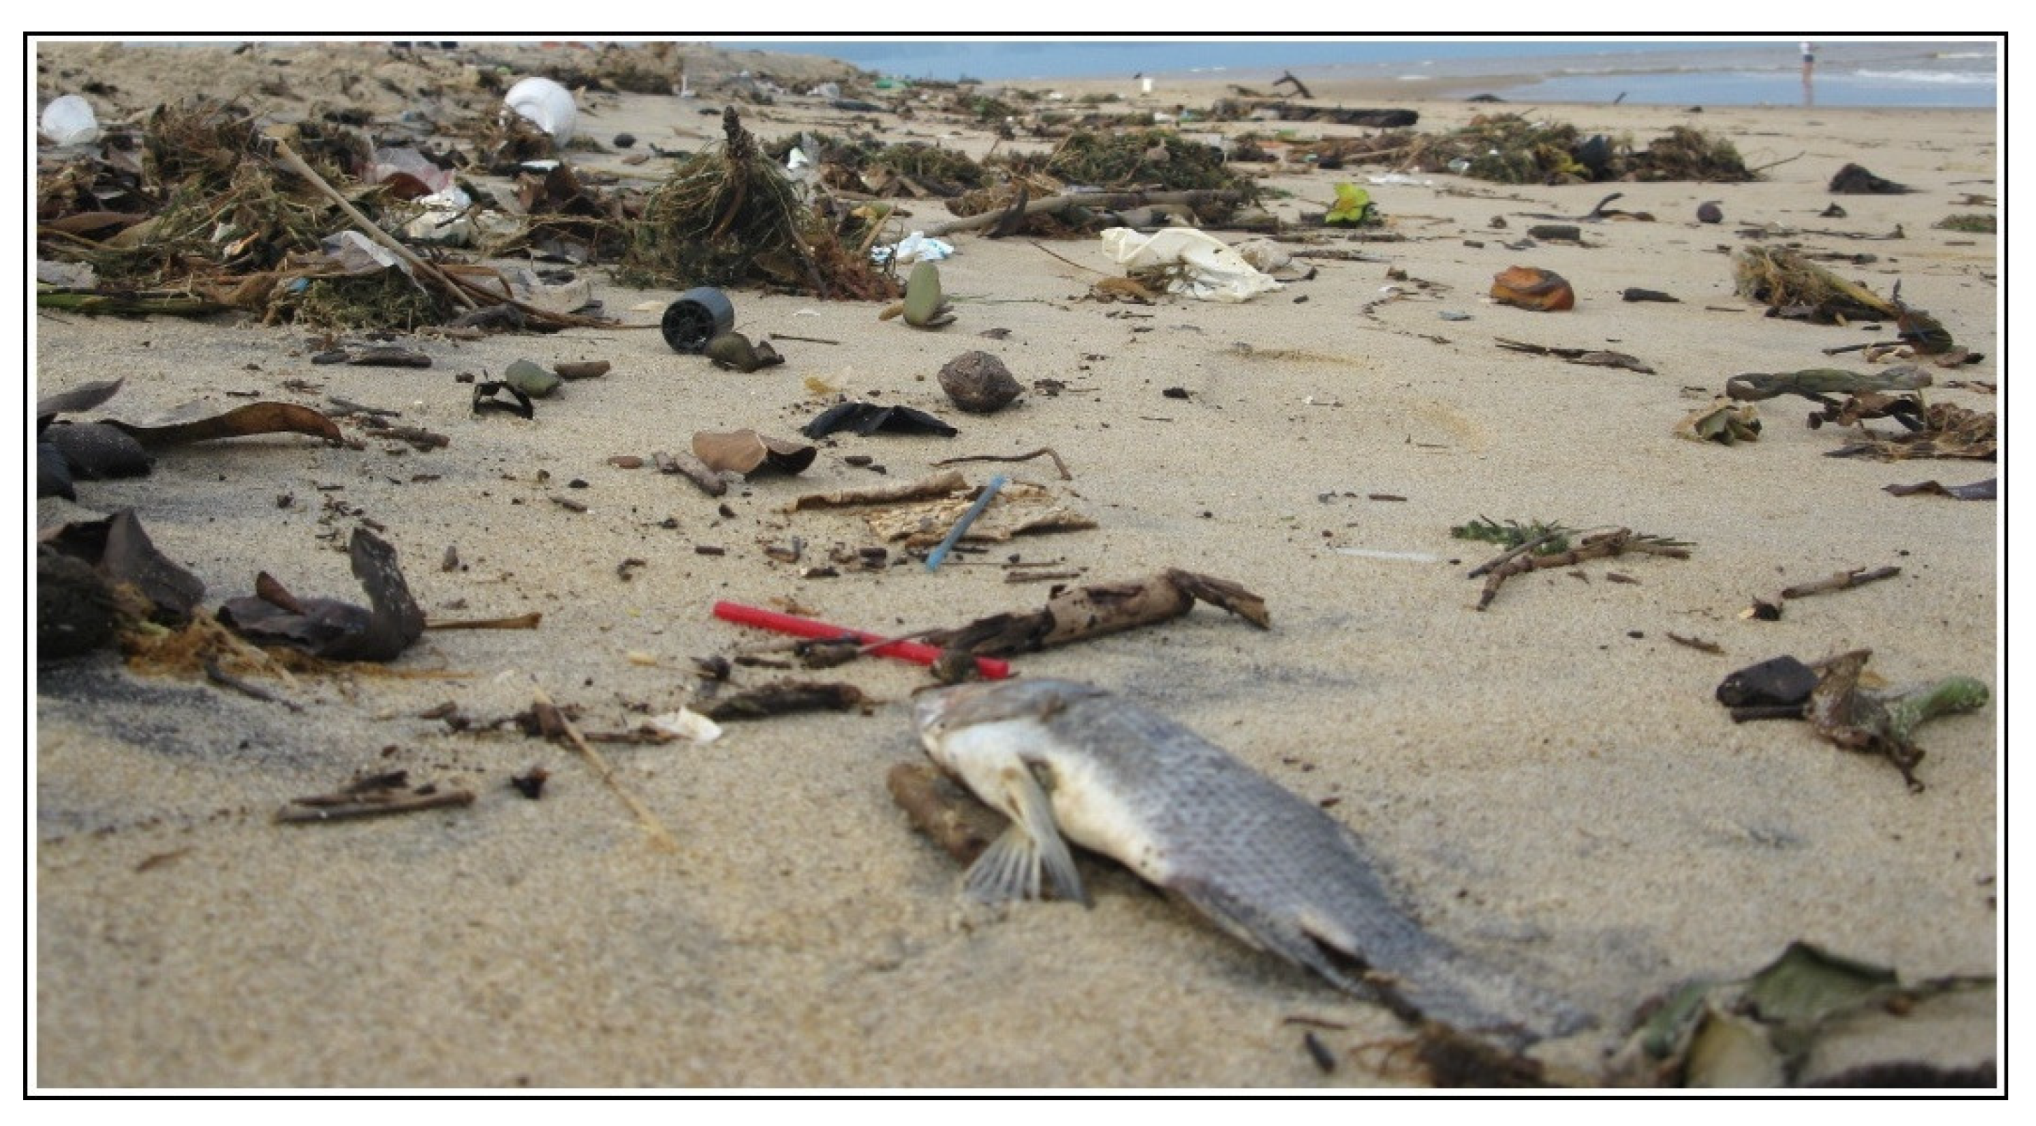
108]. The analyses of trace elements found a sporadic presence in concentrations below the fixed regulatory limit (SQA). In this way, the results presented in this section and the observations carried out in the fieldwork suggest that the negative impacts go beyond the morphological changes associated with the coastal erosion process, but also in the worsening of the environmental quality. Figure 10 shows the presence of dead fish among urban garbage, plastic, and debris in an area close to the contact of the river with the sea.

4. Conclusions

The transitional environment of the Paraíba do Sul River delta is directly affected by interferences associated with human activities throughout the river basin. It is considered that the four dams, even located relatively far from the deltaic area, are the main elements responsible for sediment capture, triggering the coastal erosion process and consequently morphological changes in the river mouth, causing the energy balance in the mouth system to be significantly altered. The growth of urban areas in the area that comprises the basin area should also be considered as a determining factor, given that most of these cities are supplied with water from the Paraíba do Sul River, and the increase in population has resulted in greater dependence on water resources.
Within the scope of chemical analysis, the overall data reveal how the studied delta presents two well-defined areas, an outer and inner part, with different degrees of pollution. It is evident how the anthropic pressure is higher in the inner part of the estuary, with higher accumulation of TOC and TN. The spatial variations in TOC, TN, and C/N evidence that organic matter from anthropogenic activities has a more significant influence than from natural processes. The high TN concentrations correspond well with high TOC in fluvial sediments, which serves as the main pathway for urban runoff, sewage, and industrial wastewater discharge. There is also a high correlation between chemical data, wastewater discharges, and morphological delta characteristics, such as low depth and low hydrodynamic energy. The data indicate that the delta is affected by significant geomorphological alterations due to erosion processes, as well as by a conspicuous anthropic influence threatening the overall ecosystem. Data outline the urgency of integrated coastal management and marine spatial planning actions, involving the state and municipalities, especially the large ones, which cause a greater impact and at the same time have more resources to invest in planning.

Author Contributions

Writing—original draft preparation, L.L.; conceptualization and review, A.P.F. and C.D.; chemical analysis interpretation, M.A., L.F. and C.d.J.S.; writing—review and editing, A.O.S. All authors have read and agreed to the published version of the manuscript.

Funding

This research was funded by São Paulo Research Foundation (FAPESP), grants 2017/26876-0, 2021/09333-9; and the National Scientific and Technological Development Council (CNPq), grant No. 40463620217.

Institutional Review Board Statement

Not applicable.

Informed Consent Statement

Informed consent was obtained from all subjects involved in the study.

Data Availability Statement

The data presented in this study are available on request from the corresponding author.

Acknowledgments

The authors are grateful for the institutional support of the universities involved and the scientific cooperation agreement between the University of Campinas and University of Naples Federico II, organized by Luca Lämmle and coordinated by Carlo Donadio and Archimedes Perez Filho.

Conflicts of Interest

The authors declare no conflict of interest.

References

  1. Arnaud-Fassetta, G. Quatre mille ans d’histoire hydrologique dans le delta du Rhône. De l’âge du Bronze au siècle du nucléaire. In Collection Mémoires et Documents; PRODIG: Paris, France, 2000; 230p. [Google Scholar]
  2. Kondolf, G.M.; Piégay, H. Tools in Fluvial Geomorphology; John Wiley & Sons Ltd.: Chichester, UK, 2003. [Google Scholar]
  3. Huggett, R. Fundamentals of Geomorphology, 4th ed.; Routledge: London, UK, 2017. [Google Scholar]
  4. Penna, N.; D’Alessandro, F.; Gaudio, R.; Tomasicchio, G.R. Three-dimensional analysis of local scouring induced by a rotating ship propeller. Ocean Eng. 2019, 188, 106294. [Google Scholar] [CrossRef]
  5. Arienzo, M.; Bolinesi, F.; Aiello, G.; Barra, D.; Donadio, C.; Stanislao, C.; Ferrara, L.; Mangoni, O.; Toscanesi, M.; Giarra, A.; et al. The environmental assessment of an estuarine transitional environment, southern Italy. J. Mar. Sci. Eng. 2020, 8, 628. [Google Scholar] [CrossRef]
  6. Souza, A.O.; Perez Filho, A.; Lämmle, L.; Souza, D.H. Holocene climate pulses and structural controls on the geomorphological estuarine evolution of The Iguape River, São Paulo, Brazil. Cont. Shelf Res. 2020, 205, 104168. [Google Scholar] [CrossRef]
  7. Carniel, S.; Benetazzo, A.; Bonaldo, D.; Falcieri, F.M.; Miglietta, M.M.; Ricchi, A.; Sclavo, M. Scratching beneath the surface while coupling atmosphere, ocean and waves: Analysis of a dense water formation event. Ocean Model 2016, 101, 101–112. [Google Scholar] [CrossRef]
  8. Arns, A.; Dangendorf, S.; Jensen, J.; Talke, S.; Bender, J.; Pattiaratchi, C. Sea-level rise induced amplification of coastal protection design heights. Sci. Rep. 2017, 7, 40171. [Google Scholar] [CrossRef]
  9. Del-Rosal-Salido, J.; Folgueras, P.; Ortega-Sanchez, M.; Losada, M.A. Beyond flood probability assessment: An integrated approach for characterizing extreme water levels along transitional environments. Coast. Eng. 2019, 152, 103512. [Google Scholar] [CrossRef]
  10. Warrick, J.A. Littoral sediment from Rivers: Patterns, rates and processes of River mouth morphodynamics. Front. Earth Sci. 2020, 8, 355. [Google Scholar] [CrossRef]
  11. Tamura, T.; Bateman, M.D.; Kodama, Y.; Saitoh, Y.; Watanabe, K.; Yamaguchi, N.; Matsumoto, D. Building of shore-oblique transverse dune ridges revealed by ground-penetrating radar and optical dating over the last 500 years on Tottori coast, Japan Sea. Geomorphology 2011, 132, 153–166. [Google Scholar] [CrossRef]
  12. Fryirs, K.A. River sensitivity: A lost foundation concept in fluvial geomorphology. Earth Surf. Process. Landf. 2017, 42, 55–70. [Google Scholar] [CrossRef]
  13. Lama, G.F.C.; Rillo Migliorini Giovannini, M.; Errico, A.; Mirzaei, S.; Padulano, R.; Chirico, G.B.; Preti, F. Hydraulic Efficiency of Green-Blue Flood Control Scenarios for Vegetated Rivers: 1D and 2D Unsteady Simulations. Water 2021, 13, 2620. [Google Scholar] [CrossRef]
  14. Morin, E. O Método: A Natureza da Natureza, 3rd ed.; Publicações Europa-América: Lisboa, Portugal, 1997. [Google Scholar]
  15. Mattos, S.H.V.L.; Perez Filho, A. Complexidade e estabilidade em sistemas geomorfológicos: Uma introdução ao tema. Rev. Bras. Geomorfol. 2004, 5, 11–18. [Google Scholar] [CrossRef] [Green Version]
  16. Perez Filho, A.; Moreira, V.B.; Lämmle, L.; Souza, A.O.; Torres, B.A.; Aderaldo, P.I.C.; Valezio, É.V.; Machado, D.O.B.F.; Prebianca, M.M.; Mazoni, A.F.; et al. Genesis and Distribution of Low Fluvial Terraces Formed by Holocene Climate Pulses in Brazil. Water 2022, 14, 2977. [Google Scholar] [CrossRef]
  17. Fernandez, G.B.; Pereira, T.G.; Rocha, T.B.; Maluf, V.; Moulton, M.; Oliveira Filho, S.R. Classificação Morfológica das dunas costeiras entre o Cabo Frio E o Cabo Búzios, litoral do estado do Rio De Janeiro. Rev. Bras. De Geomorfol. 2017, 18, 595–622. [Google Scholar] [CrossRef] [Green Version]
  18. Lämmle, L.; Bulhões, E.M.R. Impactos de obras costeiras na linha de costa: O Caso do Porto do Açu, Município de São João da Barra, RJ. Bol. Obs. Ambient. Alberto Ribeiro Lamego 2019, 13, 131–152. [Google Scholar] [CrossRef]
  19. Donadio, C.; Vigliotti, M.; Valente, R.; Stanislao, C.; Ivaldi, R.; Ruberti, D. Anthropic vs. natural shoreline changes along the northern Campania coast, Italy. J Coast Conserv 2018, 22, 939–955. [Google Scholar] [CrossRef]
  20. Evelpidou, N.; Petropoulos, A.; Karkani, A.; Saitis, G. Evidence of Coastal Changes in the West Coast of Naxos Island, Cyclades, Greece. J. Mar. Sci. Eng. 2021, 9, 1427. [Google Scholar] [CrossRef]
  21. Khan, M.A.; Sharma, N.; Lama, G.F.C.; Hasan, M.; Garg, R.; Busico, G.; Alharbi, R.S. Three-Dimensional Hole Size (3DHS) Approach for Water Flow Turbulence Analysis over Emerging Sand Bars: Flume-Scale Experiments. Water 2022, 14, 1889. [Google Scholar] [CrossRef]
  22. Wu, X.; Bi, N.; Syvitski, J.; Saito, Y.; Xu, J.; Nittrouer, J.A.; Bianchi, T.S.; Yang, Z.; Wang, H. Can reservoir regulation along the Yellow River be a sustainable way to save a sinking delta? Earth’s Future 2020, 8, e2020EF001587. [Google Scholar] [CrossRef]
  23. Chen, D.; Li, X.; Saito, Y.; Liu, J.P.; Duan, Y.; Zhang, L. Recent evolution of the Irrawaddy (Ayeyarwady) Delta and the impacts of anthropogenic activities: A review and remote sensing survey. Geomorphology 2020, 365, 107231. [Google Scholar] [CrossRef]
  24. Edmonds, D.A.; Caldwell, R.L.; Brondizio, E.S.; Siani, S.M.O. Coastal flooding will disproportionately impact people on river deltas. Nat. Commun. 2020, 11, 4741. [Google Scholar] [CrossRef]
  25. Martínez-Pérez, L.; Luquot, L.; Carrera, J.; Marazuela, M.A.; Goyetche, T.; Pool, M.; Palacios, A.; Bellmunt, F.; Ledo, J.; Ferrer, N.; et al. A multidisciplinary approach to characterizing coastal alluvial aquifers to improve understanding of seawater intrusion and submarine groundwater discharge. J. Hydrol. 2022, 607, 127510. [Google Scholar] [CrossRef]
  26. Dalrymple, R.W.; Zaitlin, B.A.; Boyd, R. Estuarine Facies Models: Conceptual Basis and Stratigraphic Implications. J. Sediment. Petrol. 1992, 62, 1130–1146. [Google Scholar] [CrossRef]
  27. Breda, A.; Mellere, D.; Massari, F. Facies and processes in a Gilbert–delta–filled incised valley (Pliocene of Ventimiglia, NW Italy). Sediment. Geol. 2007, 200, 31–55. [Google Scholar] [CrossRef]
  28. Huggett, R. Fundamentals of Geomorphology, 3rd ed.; Routledge: London, UK; New York, NY, USA, 2012. [Google Scholar]
  29. Sadeghifar, T.; Lama, G.F.C.; Sihag, P.; Bayram, A.; Kisi, O. Wave height predictions in complex sea flows through soft computing models: Case study of Persian gulf. Ocean Eng. 2022, 245, 110467. [Google Scholar] [CrossRef]
  30. Bijkerk, J.F.; Ten Veen, J.; Postma, G.; Mikeš, D.; Van Strlen, W.; De Vrles, J. The role of climate variation in delta architecture: Lessons from analogue modelling. Basin Res. 2014, 26, 351–368. [Google Scholar] [CrossRef]
  31. Gobo, K.; Ghinassi, M.; Nemec, W. Gilbert-type deltas recording short-term base-level changes: Delta-brink morphodynamics and related foreset facies. Sedimentology 2015, 62, 1923–1949. [Google Scholar] [CrossRef]
  32. Magdaleno, F.; Donadio, C.; Kondolf, G.M. 30-year response to damming of a Mediterranean river in California, USA. Phys. Geogr. 2018, 39, 197–215. [Google Scholar] [CrossRef]
  33. Guo, L.; Su, N.; Townend, I.; Wang, Z.B.; Zhu, C.; Wang, X.; Zhang, Y.; He, Q. From the headwater to the delta: A synthesis of the basin-scale sediment load regime in the Changjiang River. Earth-Sci. Rev. 2019, 197, 102900. [Google Scholar] [CrossRef]
  34. Swenson, J.B.; Paola, C.; Pratson, L.; Voller, V.R.; Murray, A.B. Fluvial and marine controls on combined subaerial and subaqueous delta progradation: Morphodynamic modeling of compound-clinoform development. J. Geophys. Res. 2005, 110, F02013. [Google Scholar] [CrossRef] [Green Version]
  35. De Santis, V.; Caldara, M.; Marsico, A.; Capalongo, D.; Pennetta, L. Evolution of the ofanto river delta from the ‘little ice age’ to modern times: Implications of large-scale synoptic patterns. Holocene 2018, 28, 1948–1967. [Google Scholar] [CrossRef]
  36. Darby, S.E.; Appeaning Addo, K.; Hazra, S.; Rahman, M.M.; Nicholls, R.J. Deltas in the Anthropocene. In Fluvial Sediment Supply and Relative Sea-Level Rise; Nicholls, R., Adger, W., Hutton, C., Hanson, S., Eds.; Palgrave Macmillan: Cham, Switzerland, 2020. [Google Scholar]
  37. Brandolini, P.; Cappadonia, C.; Luberti, G.M.; Donadio, C.; Stamatopoulos, L.; Di Maggio, C.; Faccini, F.; Stanislao, C.; Vergari, F.; Pagliaga, G.; et al. Geomorphology of the Anthropocene in Mediterranean urban areas. Prog. Phys. Geogr. 2020, 44, 461–494. [Google Scholar] [CrossRef]
  38. Zhang, J.; Wu, S.; Hu, G.; Yue, D.; Xu, Z.; Chen, C.; Zhang, K.; Wang, J.; Wen, S. Role of shale deformation in the structural development of a deepwater gravitational system in the Niger Delta. Tectonics 2021, 40, e2020TC006491. [Google Scholar] [CrossRef]
  39. Falqués, A.; Ribas, F.; Mujal-Colilles, A.; Puig-Polo, C. A new morphodynamic instability associated with cross-shore transport in the nearshore. Geophys. Res. Lett. 2021, 48, e2020GL091722. [Google Scholar] [CrossRef]
  40. Syvitski, J.P.M.; Saito, Y. Morphodynamics of deltas under the influence of humans. Glob. Planet. Change 2007, 57, 261–282. [Google Scholar] [CrossRef]
  41. Guimarães-Costa, A.J.; Machado, F.S.; Oliveira, R.R.; Silva-Costa, V.; Andrade, M.C.; Giarrizzo, T.; Saint-Paul, U.; Sampaio, I.; Schneider, H. Fish diversity of the largest deltaic formation in the Americas-a description of the fish fauna of the Parnaíba Delta using DNA Barcoding. Sci. Rep. 2019, 9, 7450. [Google Scholar] [CrossRef] [Green Version]
  42. Coleman, J.M.; Roberts, H.H.; Murray, S.P.; Salama, M. Morphology and Dynamic Sedimentology of the Eastern Nile Delta Shelf. Dev. Sedimentol. 1981, 32, 301–326. [Google Scholar]
  43. Wang, D.; Bai, J.; Gu, C.; Gao, W.; Zhang, C.; Gong, Z.; Cui, B. Scale-dependent biogeomorphic feedbacks control the tidal marsh evolution under Spartina alterniflora invasion. Sci. Total Environ. 2021, 776, 146495. [Google Scholar] [CrossRef]
  44. Souza, A.O.; Lämmle, L.; Perez Filho, A.; Donadio, C. Recent geomorphological changes in the Paraiba do Sul delta, South America East Coast. Prog. Phys. Geogr. 2022, 46, 566–588. [Google Scholar] [CrossRef]
  45. Zhou, Y.; Huang, H.Q.; Nanson, G.C.; Huang, C.; Liu, G. Progradation of the Yellow (Huanghe) River delta in response to the implementation of a basin-scale water regulation program. Geomorphology 2015, 243, 65–74. [Google Scholar] [CrossRef]
  46. Toimil, A.; Losada, I.J.; Camus, P.; Díaz-Simal, P. Managing coastal erosion under climate change at the regional scale. Coast. Eng. 2017, 128, 106–122. [Google Scholar] [CrossRef]
  47. Mentaschi, L.; Vousdoukas, M.I.; Pekel, J.F.; Voukouvalas, E.; Feyen, L. Global long-term observations of coastal erosion and accretion. Sci. Rep. 2018, 8, 12876. [Google Scholar] [CrossRef] [PubMed]
  48. Nicolodi, J.L.; Petermann, R.M. Vulnerability of the Brazilian Coastal Zone in its Environmental, Social, and Technological Aspects. J. Coast. Res. 2011, SI 64, 1372–1379. [Google Scholar]
  49. Funk, A.; Martínez-López, J.; Borgwardt, F.; Trauner, D.; Bagstad, K.J.; Balbi, S.; Magrach, A.; Villa, F.; Hein, T. Identification of conservation and restoration priority areas in the Danube River based on the multi-functionality of river-floodplain systems. Sci. Total Environ. 2019, 654, 763–777. [Google Scholar] [CrossRef] [PubMed]
  50. Zhai, T.; Wang, J.; Fang, Y.; Qin, Y.; Huang, L.; Chen, Y. Assessing ecological risks caused by human activities in rapid urbanization coastal areas: Towards an integrated approach to determining key areas of terrestrial-oceanic ecosystems preservation and restoration. Sci. Total Environ. 2020, 708, 135153. [Google Scholar] [CrossRef] [PubMed]
  51. Bulhões, E. Geografia Marinha: Oceanos e costas na perspectiva de geógrafos. In Erosão Costeira e Soluções Para a Defesa do Litoral; Muehe, D., Lins De Barros, F.M., Pinheiro, L., Eds.; PGGM: Rio de Janeiro, Brazil, 2020; pp. 655–688. ISBN 978-65-992571-0-0. [Google Scholar]
  52. Luijendijk, A.; Hagenaars, G.; Ranasinghe, R.; Baart, F.; Donchyts, G.; Aarninkhof, S. The State of the World’s Beaches. Sci. Rep. 2018, 8, 6641. [Google Scholar] [CrossRef]
  53. Muehe, D. A geomorfologia costeira e seu desdobramento para a geografia costeira e marinha. Rev. Bras. De Geogr. 2018, 63, 29–59. [Google Scholar] [CrossRef] [Green Version]
  54. Silva, V.A.; Lämmle, L.; Perez Filho, A. Alterações no baixo curso do rio Jequitinhonha e seus impactos geomorfológicos no delta: O caso da Usina Hidrelétrica de Itapebi, Bahia, Brasil. Rev. Bras. De Geogr. Física 2021, 14, 2840–2850. [Google Scholar] [CrossRef]
  55. Azevedo, M.V.H. Atafona, Patrimônio Mar Adentro: Formação, Planejamento e Destruição do Balneário de Atafona—RJ; Dissertação de Mestrado em Planejamento Regional e Gestão de Cidades; Universidade Cândido Mendes: Rio de Janeiro, Brazil, 2004; 107p. [Google Scholar]
  56. Mello, G.S.; Machado, B.A.; Rocha, T.B. Avaliação dos Impactos da Erosão Costeira no Distrito de Atafona (RJ), Entre os anos de 2005 e 2016; Simpósio Nacional de Geomorfologia: Belo Horizonte, Brazil, 2018; Volume 12, Available online: http://www.sinageo.org.br/2018/trabalhos/2/2-298-1803.html#:~:text=Dentro%20deste%20pol%C3%ADgono%20encontram%2Dse,distrito%20de%202005%20at%C3%A9%202016 (accessed on 19 October 2021).
  57. Gambolati, G.; Teatini, P.; Tomasi, L.; Gonella, M. Coastline regression of the Romagna Region, Italy, due to natural and anthropogenic land subsidence and sea level rise. Water Resour. Res. 1999, 35, 163–184. [Google Scholar] [CrossRef]
  58. Besset, B.; Anthony, E.J.; Sabatier, F. River delta shoreline reworking and erosion in the Mediterranean and Black Seas: The potential roles of fluvial sediment starvation and other factors. Elem. Sci. Anthr. 2017, 5, 54. [Google Scholar] [CrossRef] [Green Version]
  59. Ninfo, A.; Ciavola, P.; Billi, P. The Po Delta is restarting progradation: Geomorphological evolution based on a 47-years Earth Observation dataset. Sci. Rep. 2018, 8, 3457. [Google Scholar] [CrossRef] [Green Version]
  60. Silva, V.A.; Perez Filho, A.; Moreira, V.B.; Lämmle, L.; Torres, B.A.; Ayer, J.E.B.; Spalevic, V.; Mincato, R.L. Characterization and geochronology of the deltaic system from Jequitinhonha River, Brazil. Agric. For. 2021, 67, 121–134. [Google Scholar]
  61. Yuhi, M. Impact of Anthropogenic Modifications of a River Basin on Neighboring Coasts: Case Study. J. Waterw. Port Coast. Ocean Eng. 2008, 134, 336–344. [Google Scholar] [CrossRef]
  62. Berkun, M.; Aras, E. River sediment transport and coastal erosion in the southeastern Black Sea rivers. J. Hydrol. Hydromech. 2012, 60, 299–308. [Google Scholar] [CrossRef]
  63. Foti, G.; Barbaro, G.; Bombino, G.; Fiamma, V.; Puntorieri, P.; Minniti, F.; Pezzimenti, C. Shoreline changes near river mouth: Case study of Sant’Agata River (Reggio Calabria, Italy). Eur. J. Remote Sens. 2019, 52 (Suppl. S4), 102–112. [Google Scholar] [CrossRef]
  64. Kumler, L.M.; Lemos, M.C. Managing waters of the Paraíba do Sul river basin, Brazil: A case study in institutional change and social learning. Ecol. Soc. 2008, 13, 22. [Google Scholar] [CrossRef] [Green Version]
  65. Instituto Estadual do Ambiente—INEA. O Estado do Ambiente: Indicadores Ambientais do Rio de Janeiro; SEA/INEA: Rio de Janeiro, Brazil, 2011. [Google Scholar]
  66. Paiva, A.C.E.; Nascimento, N.; Rodriguez, D.A.; Tomasella, J.; Carriello, F.; Rezende, F.S. Urban expansion and its impact on water security: The case of the Paraíba do Sul River Basin, São Paulo, Brazil. Sci. Total Environ. 2020, 720, 137509. [Google Scholar] [CrossRef]
  67. Firmino, L.A.C.; Alves, L.D. Percepção socioambiental da população sobre eventos de erosão costeira no litoral de Atafona, Rio de Janeiro, Brasil. Rev. Do Dep. De Geogr. 2021, 41, e173598. [Google Scholar] [CrossRef]
  68. HidroWeb. Sistema de Informações Hidrológicas. 2021. Available online: http://www.snirh.gov.br/hidroweb/ (accessed on 19 October 2021).
  69. Instituto Brasileiro de Geografia e Estatística, IBGE. Geoscience Database. 2015. Available online: http://downloads.ibge.gov.br/downloads_geociencias.htm (accessed on 15 September 2020).
  70. Lämmle, L.; Perez Filho, A.; Donadio, C.; Moreira, V.B.; Santos, C.J.; Souza, A.O. Baixos terraços marinhos associados às transgressões e regressões marinhas holocênicas na Planície Costeira do rio Paraíba do Sul, Rio de Janeiro, Brasil. Rev. Bras. De Geomorfol. 2022, 23, 1285–1303. [Google Scholar] [CrossRef]
  71. Dias, G.T.M.; Gorini, M.A.A. Anais do XXXI Congresso Brasileiro de Geologia. In Baixada Campista: Estudo Morfológico dos Ambientes Litorâneos; Sociedade Brasileira de Geologia: Camboriú, Brazil, 1980; Volume 1, pp. 588–602. [Google Scholar]
  72. Dominguez, J.M.L.; Bittencourt, A.C.S.P.; Martin, L. Esquema evolutivo da sedimentação Quaternária nas feições deltaicas dos rios São Francisco (SE/ AL), Jequitinhonha (BA), Doce (ES) e Paraíba do Sul (RJ). Rev. Bras. De Geociências 1981, 11, 227–237. [Google Scholar] [CrossRef] [Green Version]
  73. Martin, L.; Suguio, K.; Dominguez, J.; Flexor, J.M.; Azevedo, A. Evolução da Planície Costeira do Rio Paraíba do Sul (RJ) Durante o Quaternário: Influência das Flutuações do Nível do Mar. In Anais do XXXIII Congresso Brasileiro de Geologia, Rio de Janeiro, 1984; Anais: Crato, Brazil, 1984. [Google Scholar]
  74. Bastos, A.C.; Silva, C.G. Caracterização Morfodinâmica do Litoral Norte Fluminense. Rev. Bras. De Oceanogr. 2000, 48, 41–60. [Google Scholar] [CrossRef]
  75. Rocha, T.B.; Vasconcelos, S.C.; Pereira, T.G.; Fernandez, G.B. Datação por Luminescência Opticamente Estimulada (LOE) nas cristas de praia do delta do rio Paraíba do Sul (RJ): Considerações sobre a evolução geomorfológica entre o pleistoceno superior e o Holoceno. Rev. Bras. Geomorfol. 2019, 20, 563. [Google Scholar] [CrossRef]
  76. Faraci, C.; Musumeci, R.E.; Marino, M.; Ruggeri, A.; Carlo, L.; Jensen, B.; Foti, E.; Barbaro, G.; Elsaßer, B. Wave- and current-dominated combined orthogonal flows over fixed rough beds. Cont. Shelf Res. 2021, 220, 104403. [Google Scholar] [CrossRef]
  77. CPRM-Geological Survey of Brazil. Mapa de Geodiversidade do Estado do rio de Janeiro. 2017. Available online: http://rigeo.cprm.gov.br/jspui/handle/doc/20479 (accessed on 12 February 2021).
  78. Cassar, J.C.M.; Neves, C.F. Aplicação das rosas de transporte litorâneo à costa fluminense. Rev. Bras. De Eng. 1993, 11, 81–106. [Google Scholar]
  79. Muehe, D.; Corrêa, C.H.T. Coastlines of Brazil. In The Coastline between Rio de Janeiro and Cabo Frio; Neves, C., Ed.; American Society of Civil Engineers (ASCE): New York, NY, USA, 1989; pp. 110–123. ISBN 978-0872627079. [Google Scholar]
  80. Brazilian Navy. Carta Náutica Bacia de Campos 1550, 2nd ed. Rio de Janeiro, Brazil, 2016. Available online: https://www.marinha.mil.br/chm/dados-do-segnav-cartas-raster-46 (accessed on 12 February 2021).
  81. Mendes, V.R.; Giannini, P.C.F. Coastal dunefields of south Brazil as a record of climatic changes in the South American Monsoon System. Geomorphology 2015, 246, 22–34. [Google Scholar] [CrossRef]
  82. Novello, V.F.; Cruz, F.W.; Moquet, J.S.; Vuille, M.; De Paula, M.S.; Nunes, D.; Edwards, R.L.; Cheng, H.; Karmann, I.; Utida, G.; et al. Two millennia of South Atlantic Convergence Zone variability reconstructed from isotopic proxies. Geophys. Res. Lett. 2018, 45, 5045–5051. [Google Scholar] [CrossRef] [Green Version]
  83. Campos, J.L.P.S.; Cruz, F.W.; Ambrizzi, T.; Deininger, M.; Vuille, M.; Novello, V.F.; Stríkis, N.M. Coherent South American Monsoon variability during the last millennium revealed through high-resolution proxy records. Geophys. Res. Lett. 2019, 46, 8261–8270. [Google Scholar] [CrossRef] [Green Version]
  84. Rodrigues, R.R.; Taschetto, A.S.; Sen Gupta, A.; Foltz, G.R. Common cause for severe droughts in South America and marine heatwaves in the South Atlantic. Nat. Geosci. 2019, 12, 620–626. [Google Scholar] [CrossRef]
  85. Dereczynski, C.P.; Lopes, Í.R.; Carvalho, N.O.; Silva, M.G.A.J.; Grossmann, K.S.; Martins, R.P. Climatology of espírito santo and the Northern Campos Basin, Offshore Southeast Brazil. Anuário Do Inst. De Geociências 2019, 42, 386–401. [Google Scholar] [CrossRef]
  86. Cabos, W.; Sein, D.V.; Pinto, J.G.; Fink, A.G.; Koldunov, N.V.; Alvarez, F.; Izquierdo, A.; Keenlyside, N.; Jacob, D. The South Atlantic Anticyclone as a key player for the representation of the tropical Atlantic climate in coupled climate models. Clim. Dyn. 2017, 48, 4051–4069. [Google Scholar] [CrossRef] [Green Version]
  87. Reboita, M.S.; Ambrizzi, T.; Silva, B.A.; Pinheiro, R.F.; Da Rocha, R.P. The South Atlantic subtropical anticyclone: Present and future climate. Front. Earth Sci. 2019, 7, 8. [Google Scholar] [CrossRef] [Green Version]
  88. Souza, C.M., Jr.; Shimbo, J.Z.; Rosa, M.R.; Parente, L.L.; Alencar, A.A.; Rudorff, B.F.T.; Hasenack, H.; Matsumoto, M.; G. Ferreira, L.; Souza-Filho, P.W.M.; et al. Reconstructing Three Decades of Land Use and Land Cover Changes in Brazilian Biomes with Landsat Archive and Earth Engine. Remote Sens. 2020, 12, 2735. [Google Scholar] [CrossRef]
  89. Belloni, S. Una tabella universale per eseguire granulometrie col metodo della sedimentazione unica o col metodo del densimetro di Casagrande modificato. Geol. Tec. 1969, 16, 1281–1289. [Google Scholar]
  90. Folk, R.L.; Ward, W.C. Brazos River bar: A study in the significance of grain size parameters. J. Sediment. Pet. 1957, 27, 3–26. [Google Scholar] [CrossRef]
  91. Teixeira, P.C.; Donagemma, G.K.; Fontana, A.; Teixeira, W.G. Manual de Métodos de Análise de Solo, 3rd ed.; DF: Embrapa: Brasília, Brazil, 2017. [Google Scholar]
  92. Duncan, D.; Harvey, F.; Walker, M. EPA Guidelines: Regulatory monitoring and testing Water and wastewater sampling. In Environment Protection Authority; Australian Water Quality Centre: Adelaide, Australia, 2007; 35p, ISBN 978-1-921125-47-8. [Google Scholar]
  93. Moreira, E.H.S.; Borges, B.B.; Paula, C.A.S.; Pelá, A. Anais da Semana de Ciências Agrárias e Jornada da Pós-graduação em Produção Vegetal. In Teores de S-SO4 em Solo Submetido à Elevadas Doses de Gesso Agrícola e Calagem Superficial; Universidade Estadual de Goiás: Goiás, Brazil, 2018; Volume 15. [Google Scholar]
  94. Kraus, N.C.; Rosati, J.D. Interpretation of Shoreline—Position Data for Coastal Engineering Analysis; Coastal Engineering Technical Note; CETN II-39. U.S. Army, Engineer Research and Development Centre: Vicksburg, MS, USA, 1997. [Google Scholar]
  95. Agência Nacional das Águas—ANA. Sala de Situação, Bacia hidrográfica do rio Paraiba do Sul. 2019. Available online: https://www.ana.gov.br/sala-de-situacao/paraiba-do-sul/paraiba-do-sul-saiba-mais (accessed on 14 December 2021).
  96. Willis, C.M.; Griggs, G.B. Reductions in fluvial sediment discharge by coastal dams in California and implications for beach sustainability. J. Geol. 2003, 111, 167–182. [Google Scholar] [CrossRef]
  97. Poeppl, R.E.; Fryirs, K.A.; Tunnicliffe, J.; Brierley, G.J. Managing sediment (dis)connectivity in fluvial systems. Sci. Total Environ. 2020, 736, 139627. [Google Scholar] [CrossRef]
  98. Brunsden, D.; Thornes, J.B. Transactions of the Institute of British Geographers. In Landscape Sensitivity and Change; Royal Geographical Society: London, UK, 1979; Volume 4, pp. 463–484. [Google Scholar]
  99. Nienhuis, J.H.; Ashton, A.D.; Edmonds, D.A.; Hoitink, A.J.F.; Kettner, A.J.; Rowland, J.C.; Törnqvist, T.E. Global-scale human impact on delta morphology has led to net land area gain. Nature 2020, 577, 514–518. [Google Scholar] [CrossRef]
  100. Poulos, S.E.; Chronis, G. The Importance of the River Systems in the Evolution of the Greek Coastline; L’Institut Océanographique de Monaco: Monaco City, Monaco, 1997; pp. 75–96. Available online: https://www.researchgate.net/publication/284058756_The_importance_of_the_river_systems_in_the_evolution_of_the_Greek_coastline (accessed on 12 February 2021).
  101. Poulos, S.E.; Chronis, G.T.; Collins, M.B.; Lykousis, V. Thermaikos Gulf coastal system, NW Aegean Sea: An overview of water/sediment fluxes in relation to air–land–ocean interactions and human activities. J. Mar. Syst. 2000, 25, 47–76. [Google Scholar] [CrossRef]
  102. Ranasinghe, R.; Wu, C.S.; Conallin, J.; Duong, T.M.; Anthony, E.J. Disentangling the relative impacts of climate change and human activities on fluvial sediment supply to the coast by the world’s large rivers: Pearl River Basin, China. Sci. Rep. 2019, 9, 9236. [Google Scholar] [CrossRef] [Green Version]
  103. Roccati, A.; Faccini, F.; Luino, F.; De Graff, J.V.; Turconi, L. Morphological changes and human impact in the Entella River floodplain (Northern Italy) from the 17th century. Catena 2019, 182, 104122. [Google Scholar] [CrossRef]
  104. Agência Nacional de Águas—ANA. Hidroweb: Sistemas de Informações Hidrológicas. 2022. Available online: http://hidroweb.ana.gov.br/ (accessed on 13 January 2022).
  105. Donadio, C.; Valente, R. Beach drainage technologies for coastal landscape environmental recovery. In Proceedings of the Medcoast 2007—The Eighth International Conference on The Mediterranean Coastal Environment, Alexandria, Egypt, 13–17 November 2007; Özhan, E., Ed.; MEDCOAST Secretariat Middle East Technical University: Ankara, Turkey, 2007; Volume 2, pp. 1093–1104. [Google Scholar]
  106. Antizar-Ladislao, B.; Mondal, P.; Mitra, S.; Sarkar, S.K. Assessment of trace metal contamination level and toxicity in sediments from coastal regions of West Bengal, eastern part of India. Mar. Pollut. Bull. 2015, 101, 886–894. [Google Scholar] [CrossRef]
  107. Chatterejee, M.; Silva Filho, E.V.; Sarkar, S.K.; Sella, S.M.; Bhattacharya, A.; Satpathy, K.K. Distribution and possible source of trace elements in the sediment cores of a tropical macrotidal estuary and their ecotoxicological significance. Environ. Intern. 2007, 33, 346–356. [Google Scholar] [CrossRef] [PubMed]
  108. Vaisanen, U.; Misund, A.; Chekushin, V. Ecogeochemical investigation: Stream water quality as an indicator of pollution in the border areas of Finland, Norway and Russia. Water Air Soil Pollut. 1998, 104, 205–219. [Google Scholar] [CrossRef]
Figure 1. Location of the study area. (A) Location in Brazilian territory. (B) Paraíba do Sul hydrographic basin (PSHB). The study area is highlighted by the white square at the river mouth. For details, see Figure 2. The geographic coordinate system is UTM Sirgas 2000 [68,69].
Jmse 10 01585 g001
Figure 2. The sampling sites along the river (red circle) and littoral (yellow circle). The coastal erosion zone is indicated by the red arrow, and the extended area is represented in Figure 1. The geographic coordinate system is UTM Sirgas 2000.
Jmse 10 01585 g002
Figure 3. Anthropization map of the hydrographic basin. The number below the name of each dam represents the year in which it started to operate. Sources: [65,69,95]. Coordinate System: UTM. Datum: SIRGAS, 2000.
Jmse 10 01585 g003
Figure 4. Average monthly discharge in the Paraíba do Sul River. (A) Fluvial discharge (m3/s) from 1950 to 2020. (B) Linear tendencies of discharge on the decadal scale [104].
Jmse 10 01585 g004
Figure 5. Zone of intense coastal erosion located south of the Paraíba do Sul River delta. Sector 1 of the red rectangle is characterized by the progressive loss of eroded urban structures that turned into emerged and submerged debris, while the central and lower sectors are characterized by the migration of foredunes over the continent. See Figure 6 for the photos related to A and B (black circles).
Jmse 10 01585 g005
Figure 6. Example of erosive processes in the intense erosion zone. (A) Area located in sector 1 with active erosion processes in urban structures (NW-SE view); (B) area located in sector 2 showing direct contact of the foredunes with the ocean and their advancement over roads and residences (S-N view). For the locations of the photos, see Figure 5. Photo by: L. Lämmle, 2021.
Jmse 10 01585 g006
Figure 7. Comparison of the intense coastal erosion zone to the south of the river delta between 1985 and 2022 (after Google Earth Pro 2022). The red arrow is the significant narrowing of the sand strip on the coast near the mouth; the blue circle shows the presence of a sandy point that does not currently exist, and the yellow arrow indicates small river islands and bars that were distant from the coast and are now exposed to wave action.
Jmse 10 01585 g007
Figure 8. Image of 1985 coastline overlapped with the current one, showing the areal gap due to erosion. The image brightness enhancement applied in the intense coastal erosion zone was performed following a vertical urban road in the S-N direction, allowing the visualization of the loss of urban blocks caused by the horizontal displacement of the coast. See Figure 9 for the photos related to A and B (black circles).
Jmse 10 01585 g008
Figure 9. Example of temporary containment to delay the contact of waves with the dwellings. (A) Excavator creating a protective barrier using sediments from the beach itself (N-S view); (B) artificially created sediment barrier to protect houses that are on the front lines of the erosive process (SE-NW view). For the locations of the photos, see Figure 8. Photo by: L. Lämmle, 2021.
Jmse 10 01585 g009
Figure 10. Dead fish among garbage, plastic, and urban debris remobilized by the waves in an area near the mouth (21°37′15.22″ S, 41°0′47.62″ W, SW-NE view). Photo by: L. Lämmle, 2021.
Jmse 10 01585 g010
Table 1. Areas of land use and land cover (LULC) classes in the Paraíba do Sul hydrographic basin (PSHB). The percentage data indicate the area classes concerning the PSHB area [88].
LULC Classes (km²)
YearForest/Non-Forest Farming Non-VegetatedWater
198514,653.6741,549.001099.32701.42
199014,695.4641,391.521259.19657.33
200014,683.6841,153.961468.30599.00
201015,602.0040,195.111562.95656.25
202015,936.6539,780.751644.82641.20
LULC Classes (%)
YearForest/Non-ForestFarmingNon VegetatedWater
198525.2671.641.901.21
199025.3471.362.171.13
200025.3270.962.531.03
201026.9069.302.691.13
202027.4868.592.841.11
Table 2. Land use and land cover (LULC) variations in the Paraíba do Sul hydrographic basin (PSHB) for 10-year interval [88].
Decadal-Scale Variations (%)
YearForest/Non-ForestFarmingNon-VegetatedWater
19900.29−0.3814.54−6.29
2000−0.08−0.5716.61−8.87
20106.25−2.336.459.56
20202.14−1.035.24−2.29
Table 3. Fluvial discharge in the Paraíba do Sul River (1950–2019). Qmax: maximum discharge. Qmin: minimum discharge. Qmed: average discharge. Std: standard deviation. VI: variance index [103].
PeriodQmax (m3/s)Qmin (m3/s)Qmed (m3/s)StdVI
1950–19593817.35100.68712.56565.31324,051.54
1960–19696446.01124.20868.58781.3861,559.45
1970–19795387.0097.34655.76503.43253,437.75
1980–19895459.47198.94842.65608.30370,024.18
1990–19995594.76184.28699.68487.25237,414.00
2000–20096181.56198.09717.58573.97329,438.70
2010–20194877.3789.40521.10470.31221,191.08
Table 4. Localization of sampling stations, particle size distribution, granulometric classification, and land use.
SampleCoordinatesGrain Size (%)Classification (Folk and Ward, 1957)Land Use (Field Survey)
Latitude (s)Longitude (w)SandSiltClay
P1-S21°32′11.36″41° 4′7.37″99.10.10.8Coarse sandFishing and housing
P2-S21°34′57.72″41° 3′16.04″98.50.11.4Coarse sandFishing and housing
P3-S21°37′15.30″41° 0′45.82″97.60.12.3Very coarse sandWind farm and housing
P4-S21°38′49.75″41° 0′55.95″98.40.11.5Very coarse sandFishing, housing, and wind farm
P5-WS21°38′43.21″41° 5′9.55″98.80.11.1Medium SandPasture, agriculture, and dredging
P6-WS21°43′30.61″41°11′45.29″95.71.42.9Very fine sandPasture and agriculture
P7-WS21°45′2.45″41°17′47.51″38.131.630.3Silty sandIndustry and housing
P8-WS21°43′26.50″41°21′44.77″37.623.938.5Sandy claySugar cane plant and agriculture
P9-WS21°41′44.99″41°25′30.37″48.524.826.7Clayey sandAgriculture
Table 5. Main chemical features of sediment samples of Paraíba do Sul River.
SampleSediment
pHK+Ca2+Mg2+Na+TOCCEC *BCuFeMnZn
mg/kgg%mmol/kgmg/kg
P9-WS6.25125.51316193.240.71.666.90.215.55920.6328.515.32
P8-WS5.8528.15246.2103.318.80.231.20.120.99502.579.013.78
P7-WS5.187.91489251.640.81.4105.20.125.851532475.216.25
P6-WS6.15260.11250272.360.51.570.20.246.721350504.521.2
P5-WS6.6517.284.932.87.731.37.650.120.49249.115.54.43
P4-S8.570.4228.5303.9875.20.0359.60.380.18109.614.90.95
P3-S8.458.7172.3206.6705.00.0346.30.440.43158.517.341.34
P2-S8.8521.5196.552.129.80.66.350.190.07284.112.11.41
P1-S8.4568.03173.2289.3826.50.655.30.370.35141.820.71.25
Mean7.1381.94561.8189.5289.40.3948.860.242.29583.1163.17.33
Min5.117.284.932.87.730.036.350.120.07109.612.10.95
Max8.45260.11489303.8875.11.3105.20.446.721532504.521.2
* Electric conductivity.
Table 6. Main chemical features of water samples of Paraíba do Sul River.
SampleWater
pHE.C. *Ca2+Mg2+Na+K+ClHCO3SO42−CuFeMnZnTotal SolidsSAR
dS/mmg/L
P9-WS7.520.07116.42.922.872.522.1110.928.502.450.060.0140.10.25
P8-WS7.350.0817.22.923.312.524.6512.819.502.950.05043.10.28
P7-WS7.250.07215.63.163.312.522.2210.331.5011.20049.80.29
P6-WS7.250.07818.03.403.312.163.1112.834.504.550.030.1248.10.28
P5-WS7.320.08716.83.403.532.162.1112.832.50.023.2500.0245.40.32
Mean7.340.0816.83.163.272.382.8411.929.30.004.880.030.0345.30.28
Min7.250.07115.62.912.872.162.1110.319.502.450040.10.25
Max7.520.08718.03.403.532.524.6512.834.50.0211.20.060.1249.80.32
* Electric conductivity.
Publisher’s Note: MDPI stays neutral with regard to jurisdictional claims in published maps and institutional affiliations.

