
Coastal Vulnerability Assessment for Future Sea Level Rise and a Comparative Study of Two Pocket Beaches in Seasonal Scale, Ios Island, Cyclades, Greece
 , ,
, ,  ,
,
Abstract
:1. Introduction
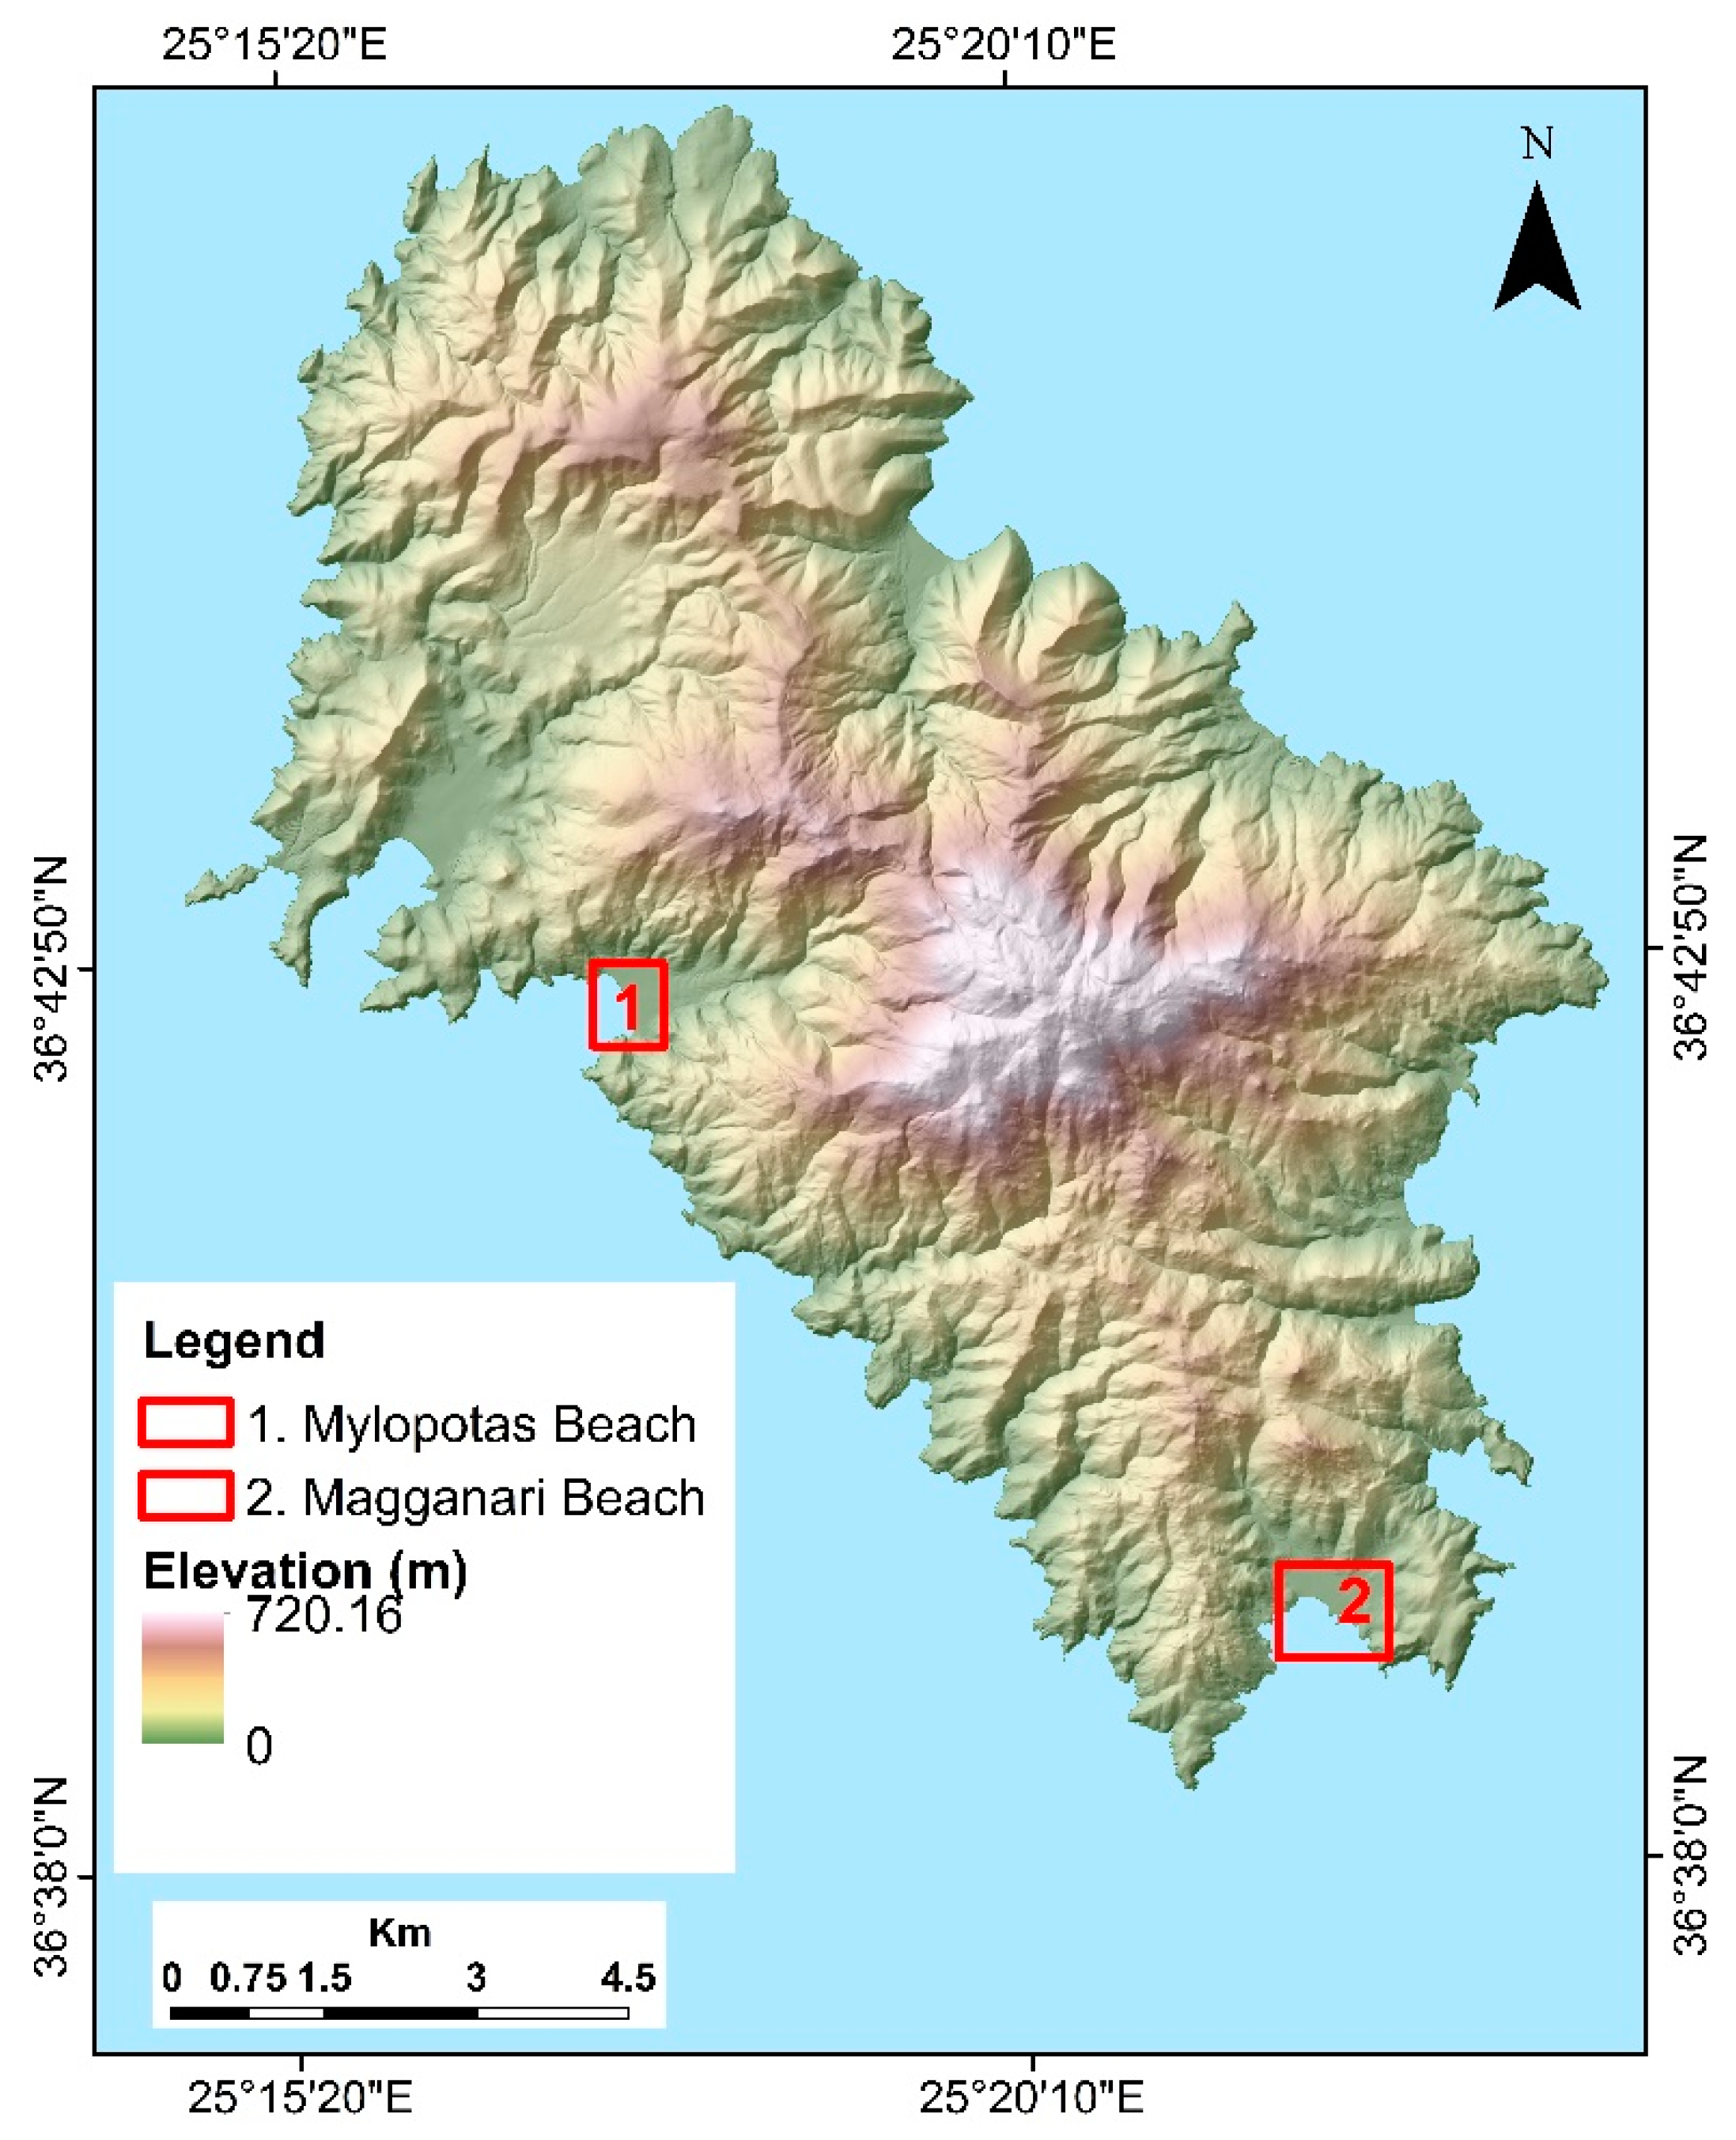
2. Geographical and Geological Setting
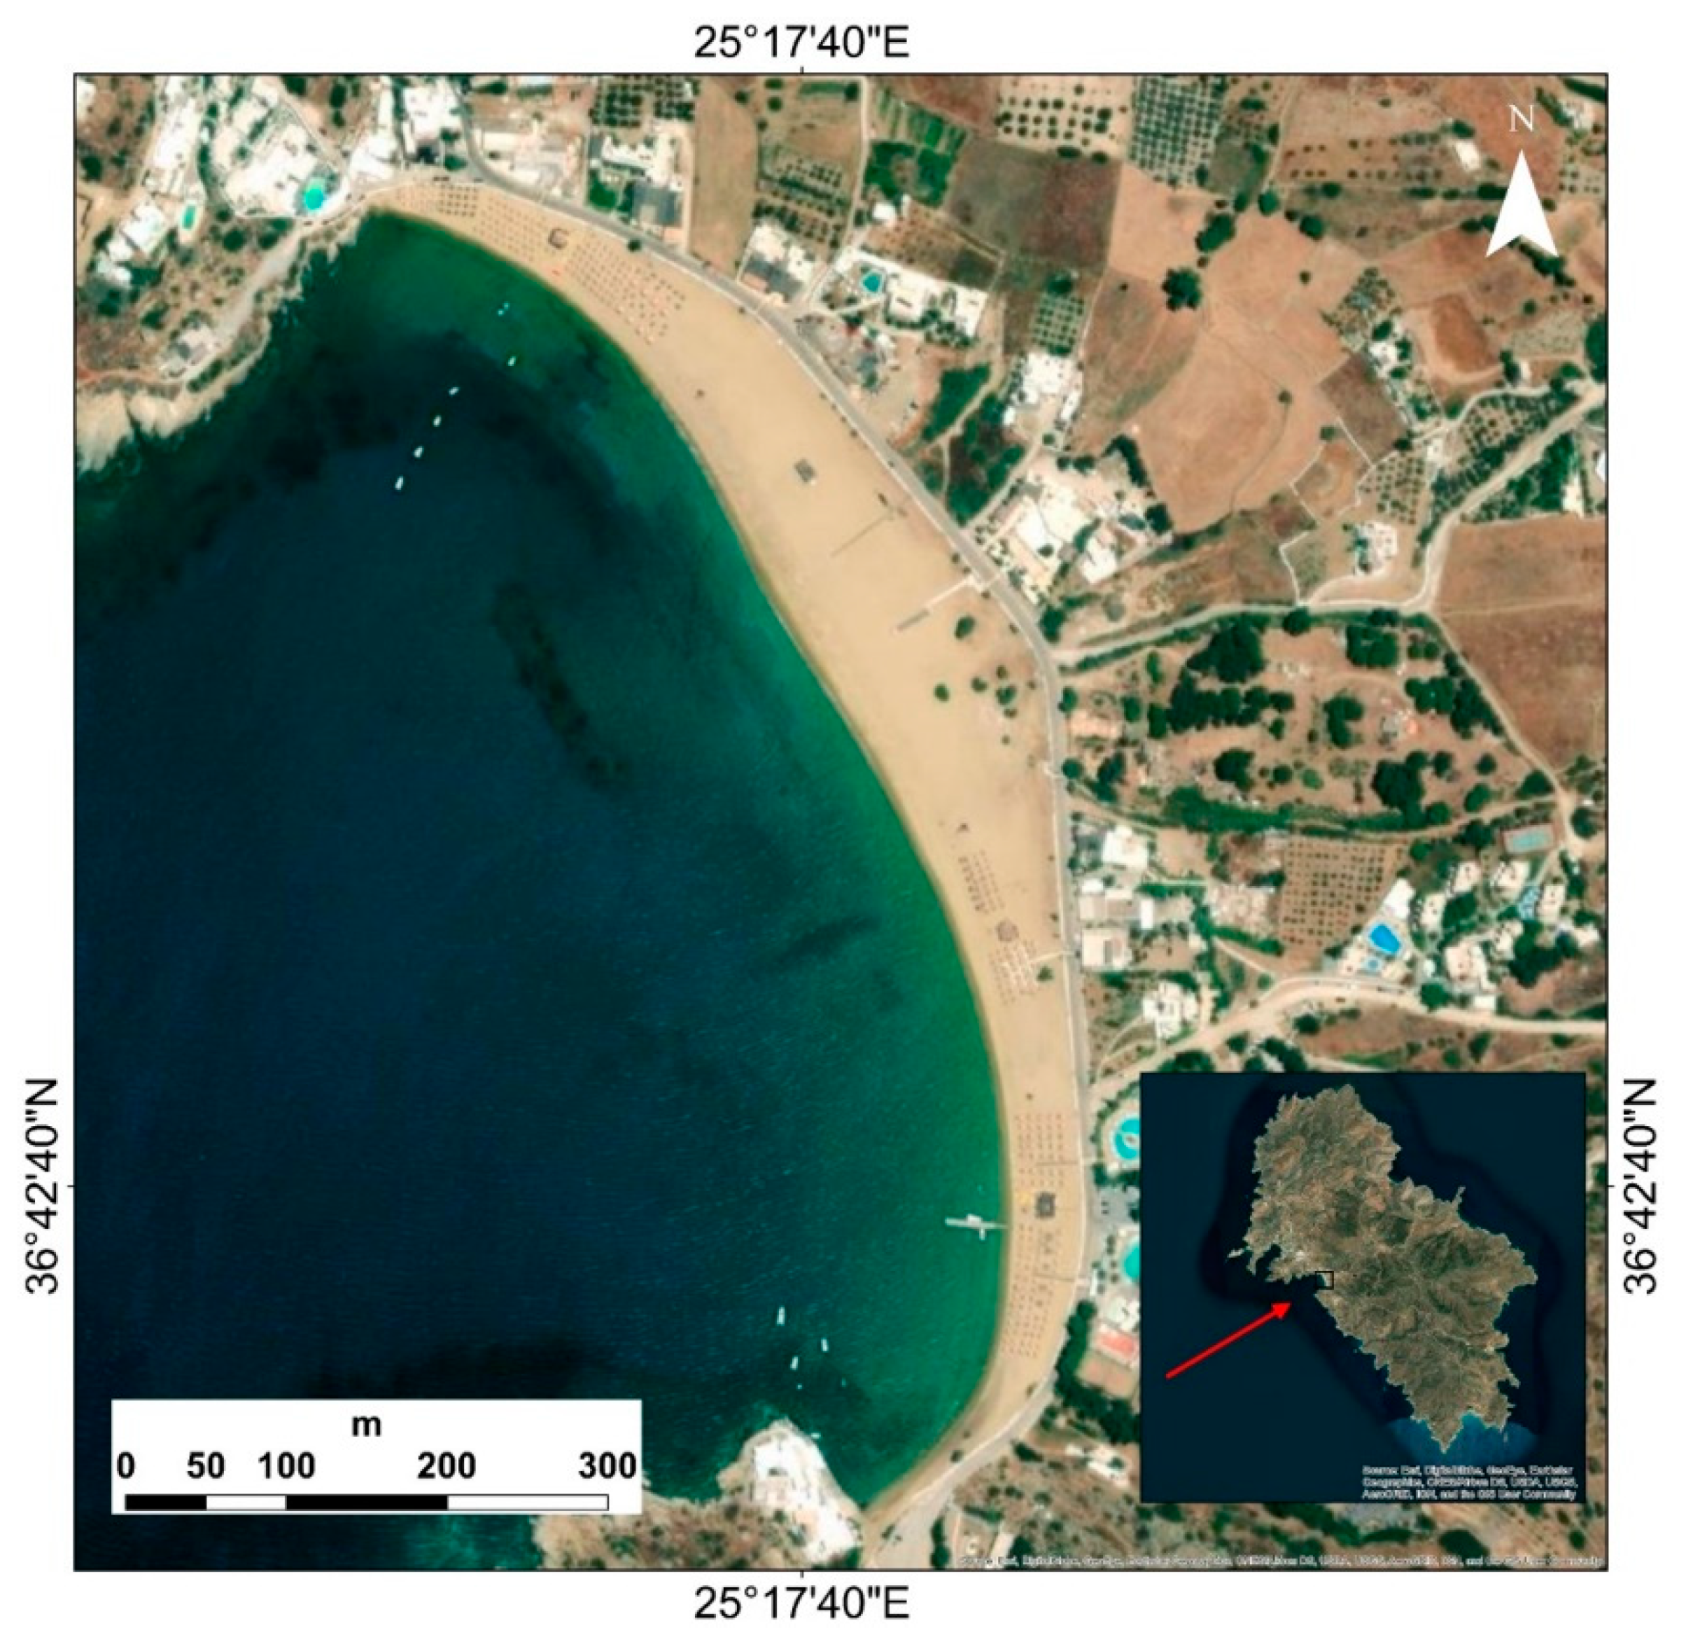
2.1. Geographical Features of Mylopotas Beach
2.2. Geographical Features of Magganari Beach
3. Materials and Methods
3.1. Calculation of the Costal Vulnerability Index
CVI Variables and Data
3.2. Fieldwork Investigation
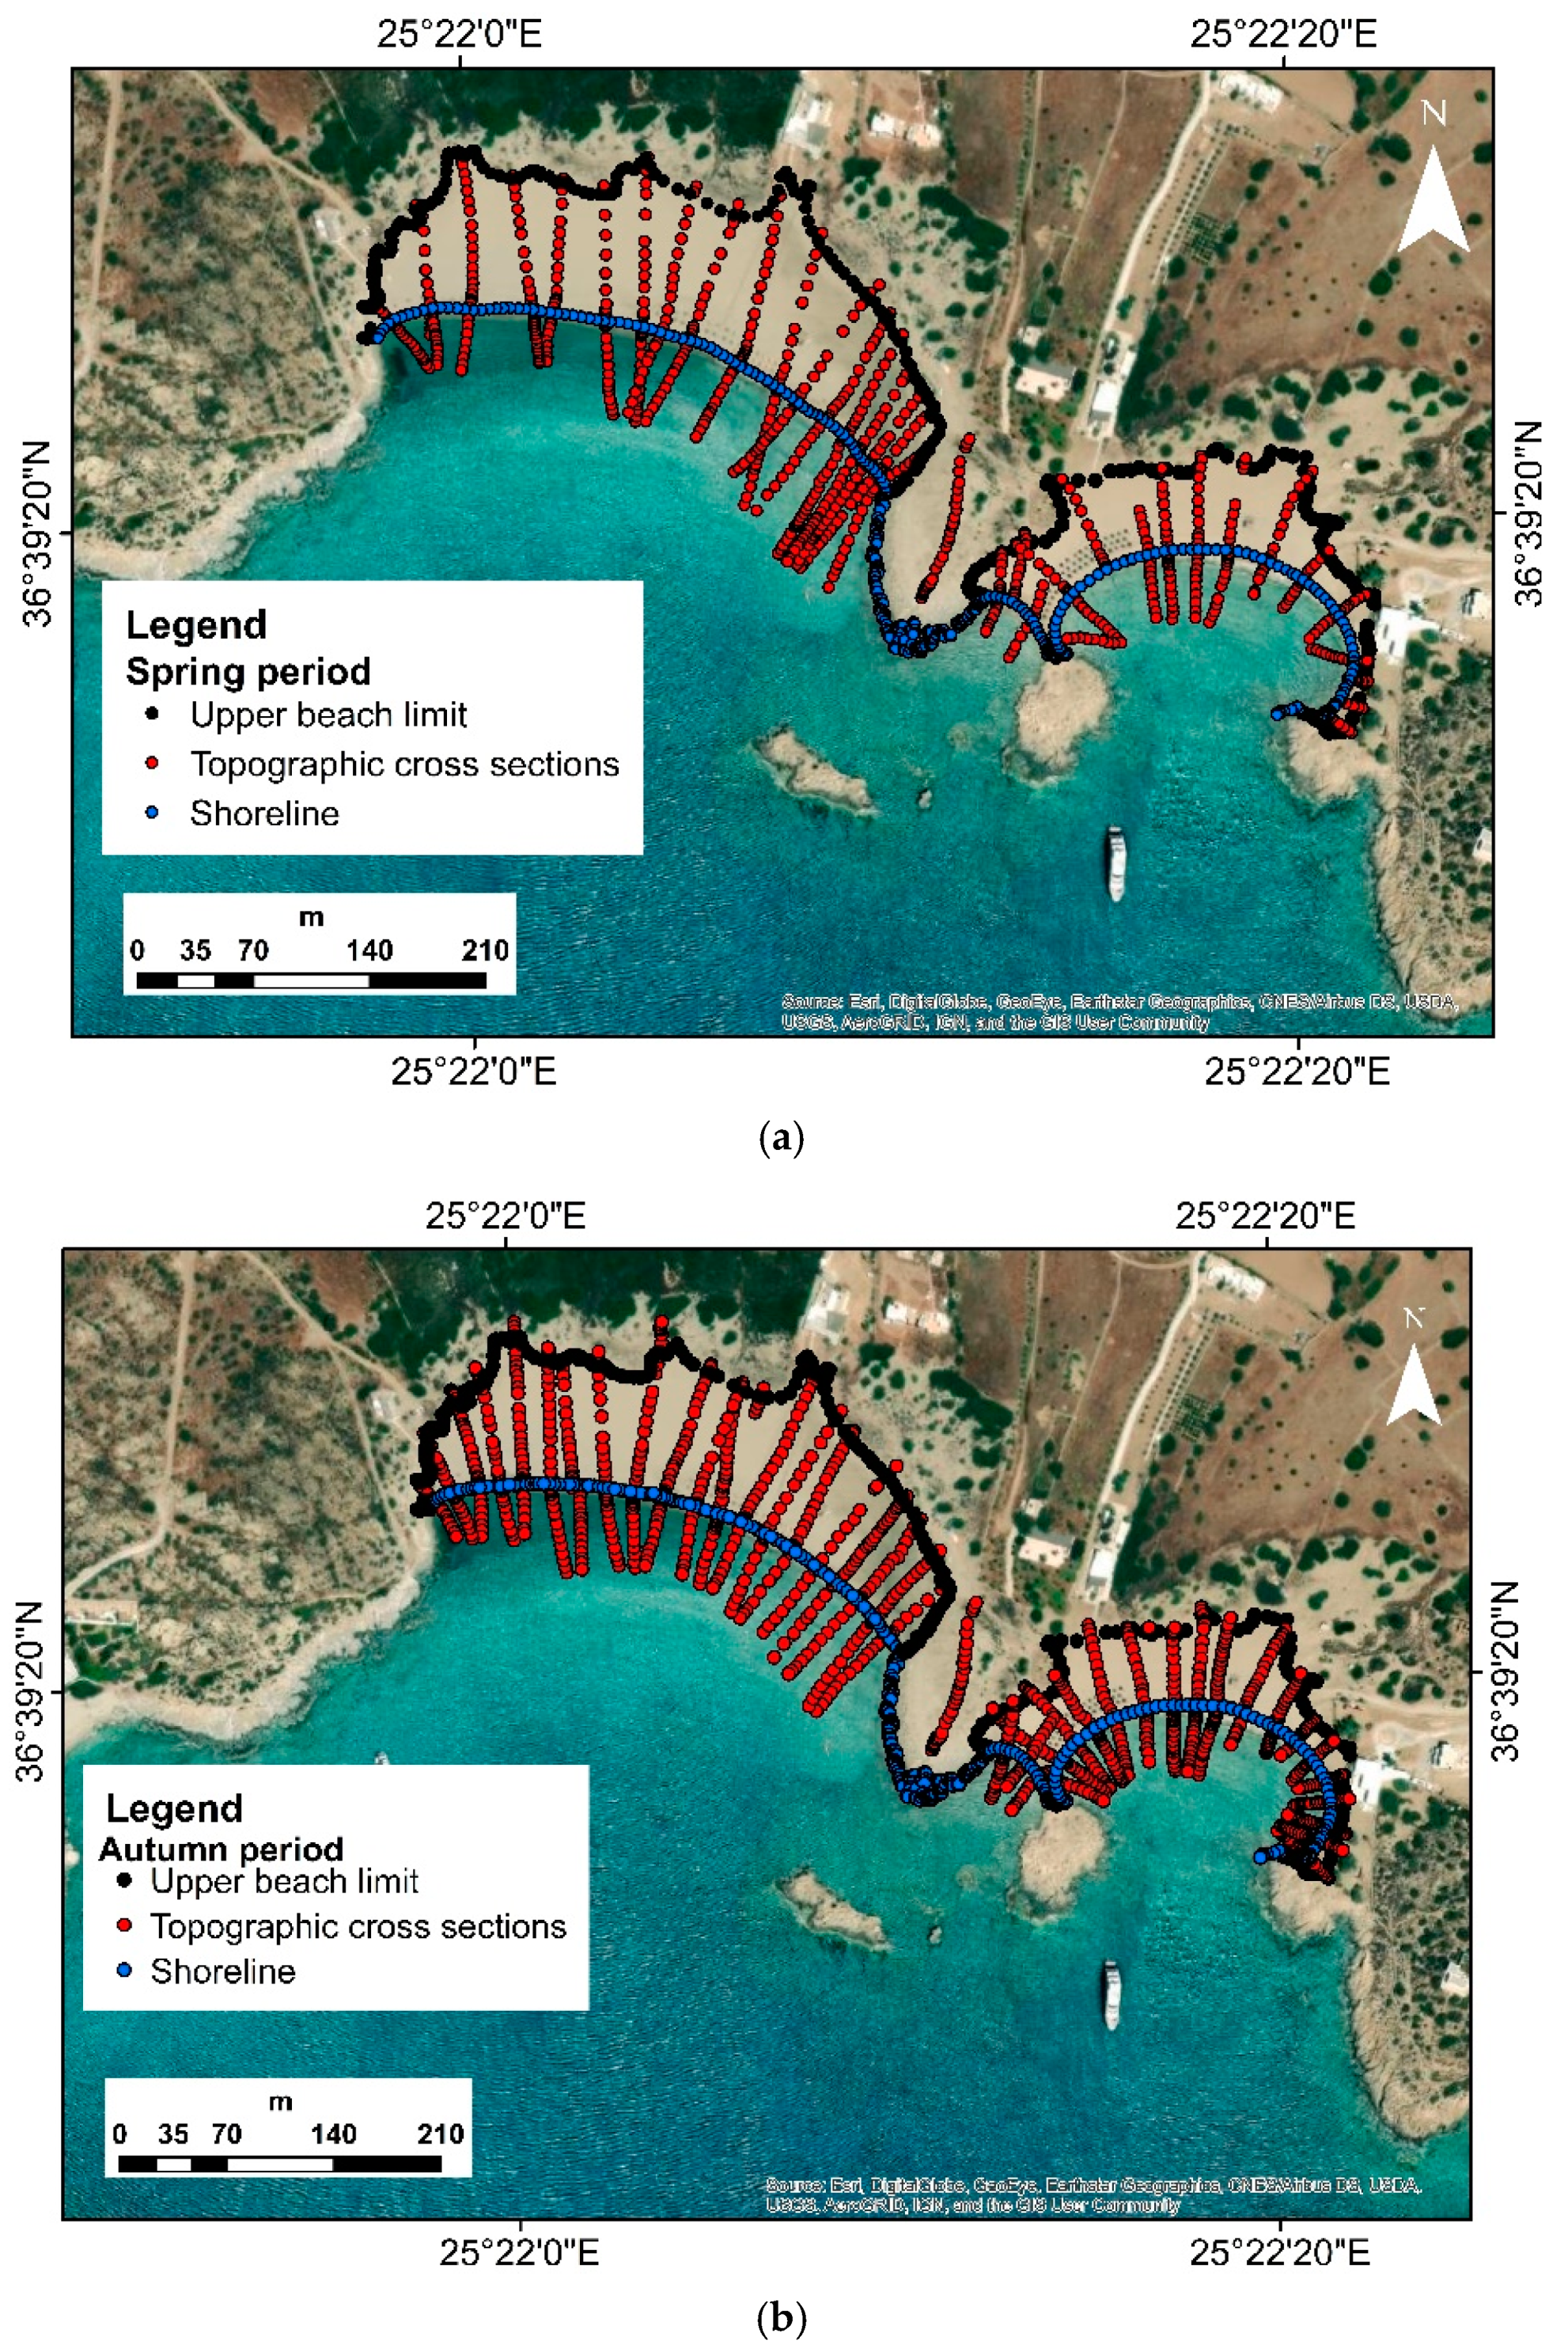
3.2.1. Topographic-Geomorphological Mapping of Study Beaches
3.2.2. Sediments Sampling
3.3. Laboratory Analyses
3.4. Calculation of Shoreline Displacement Rate
4. Results
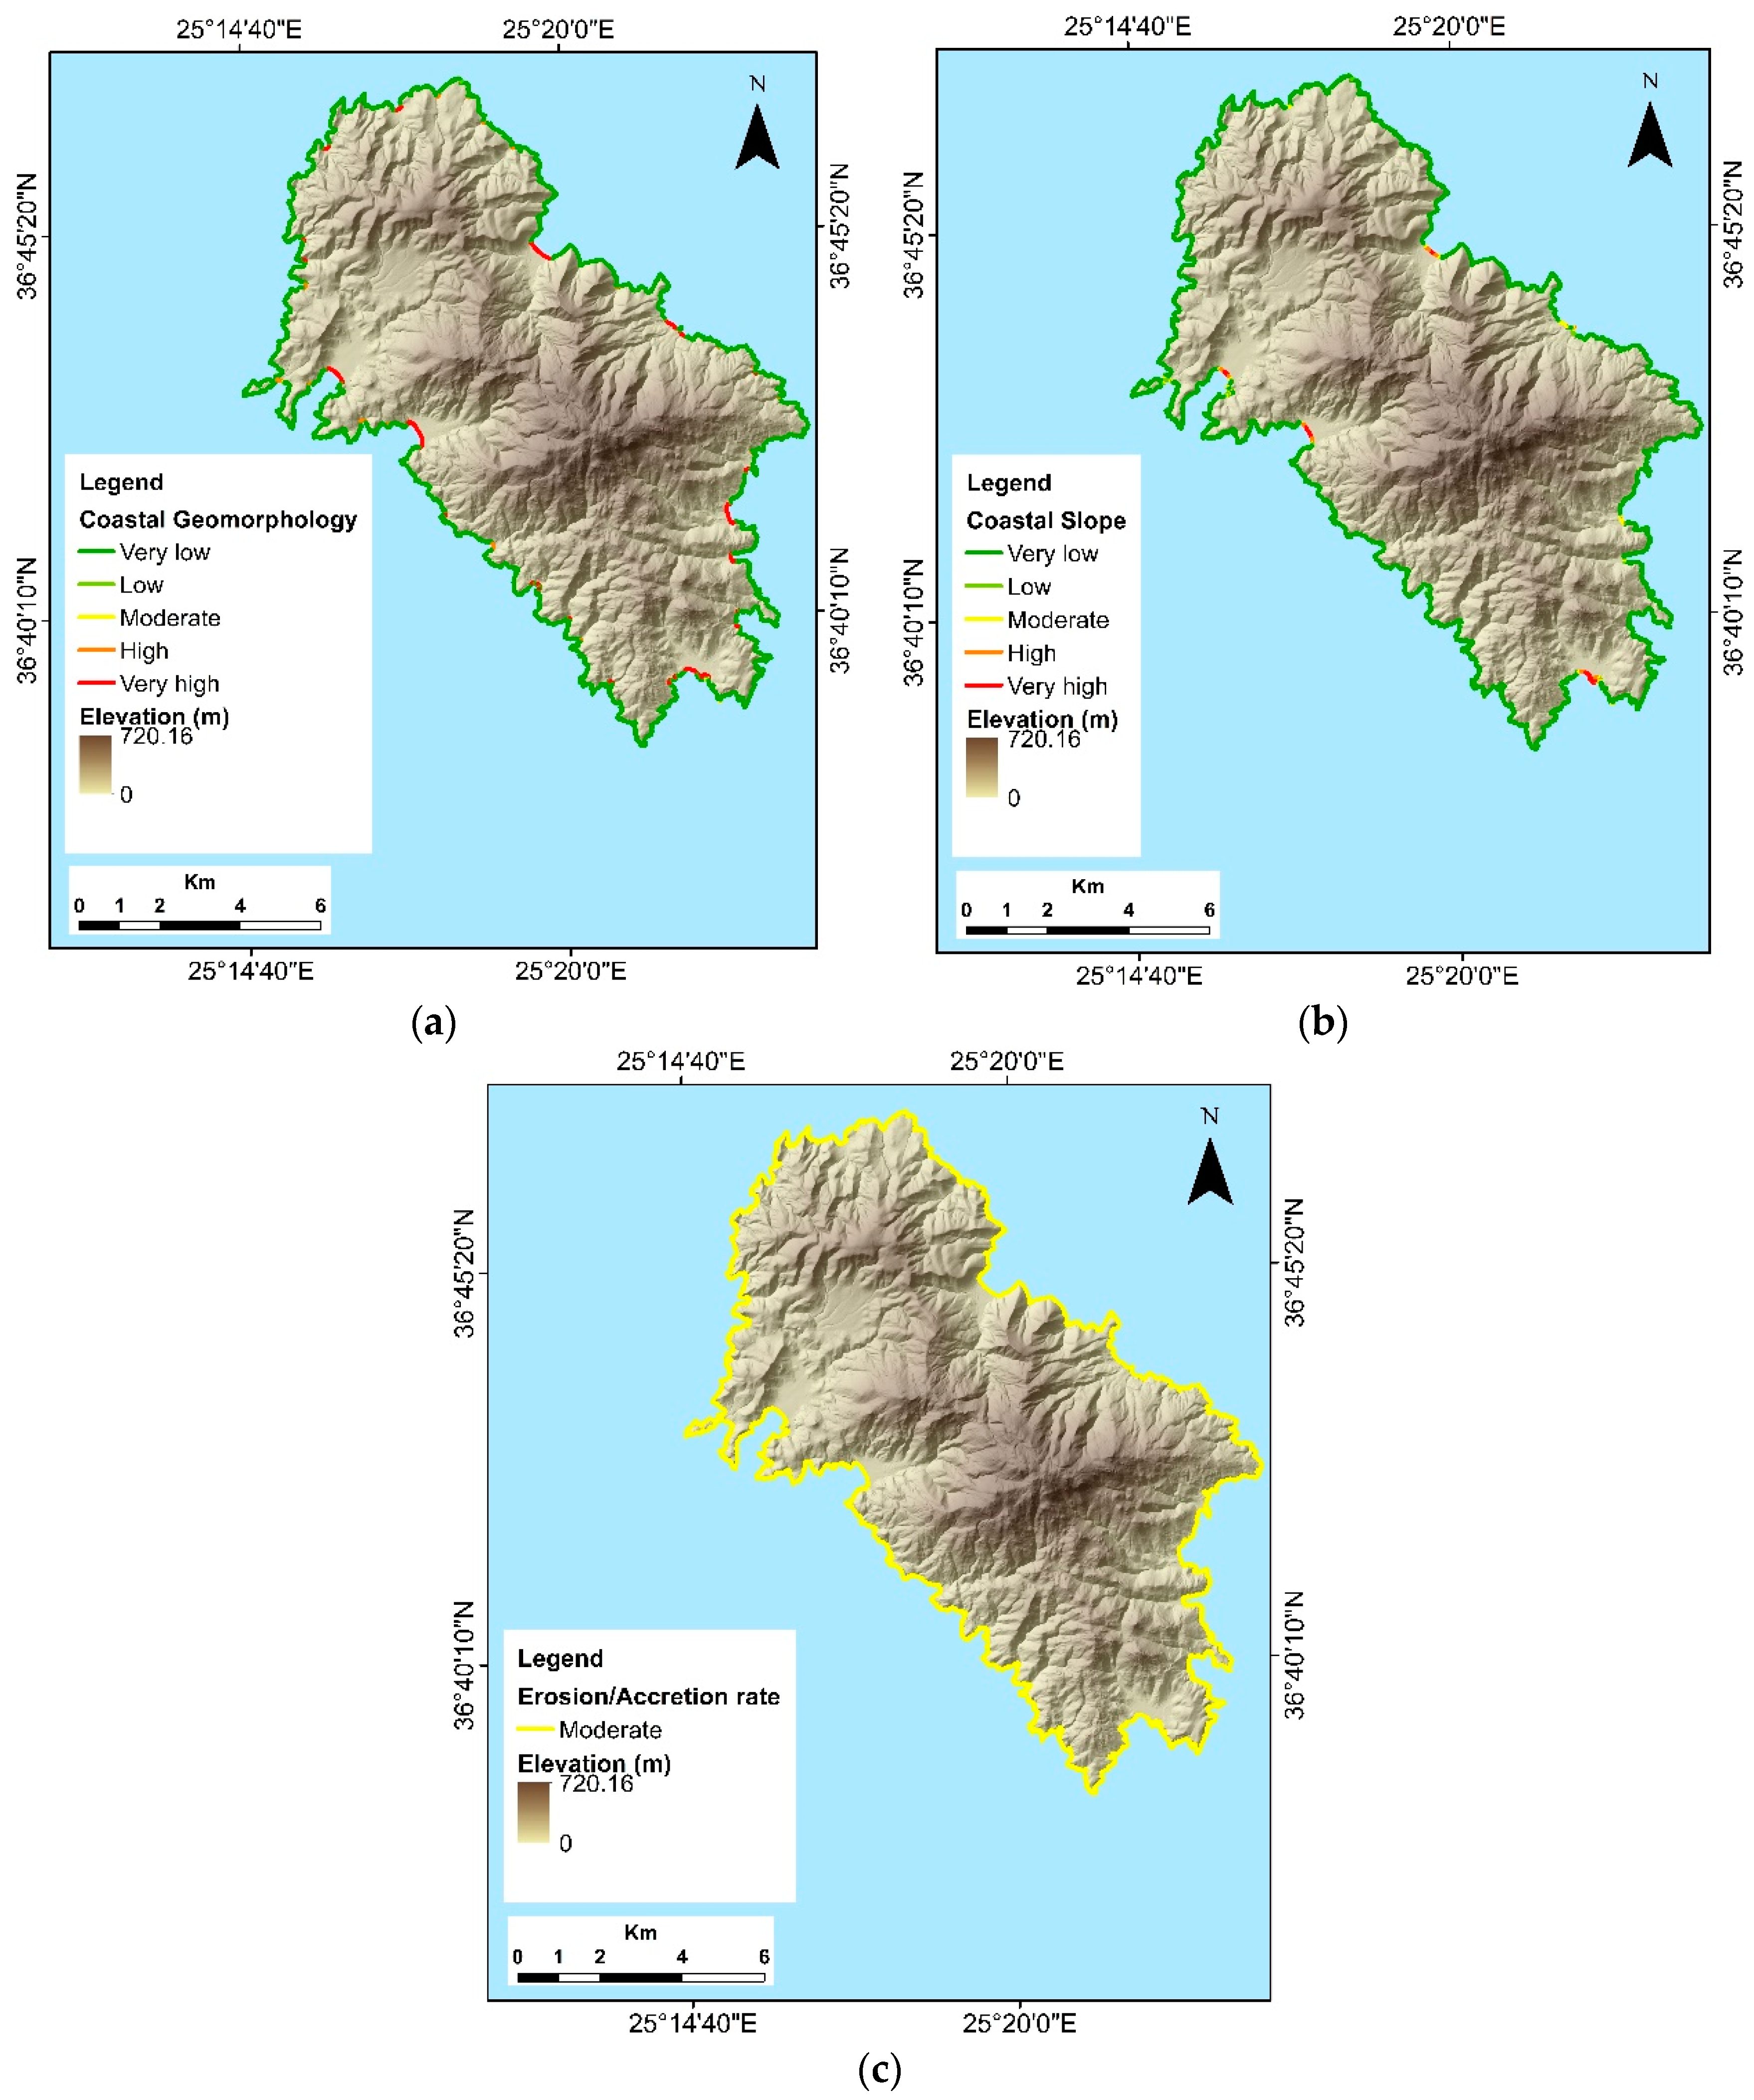
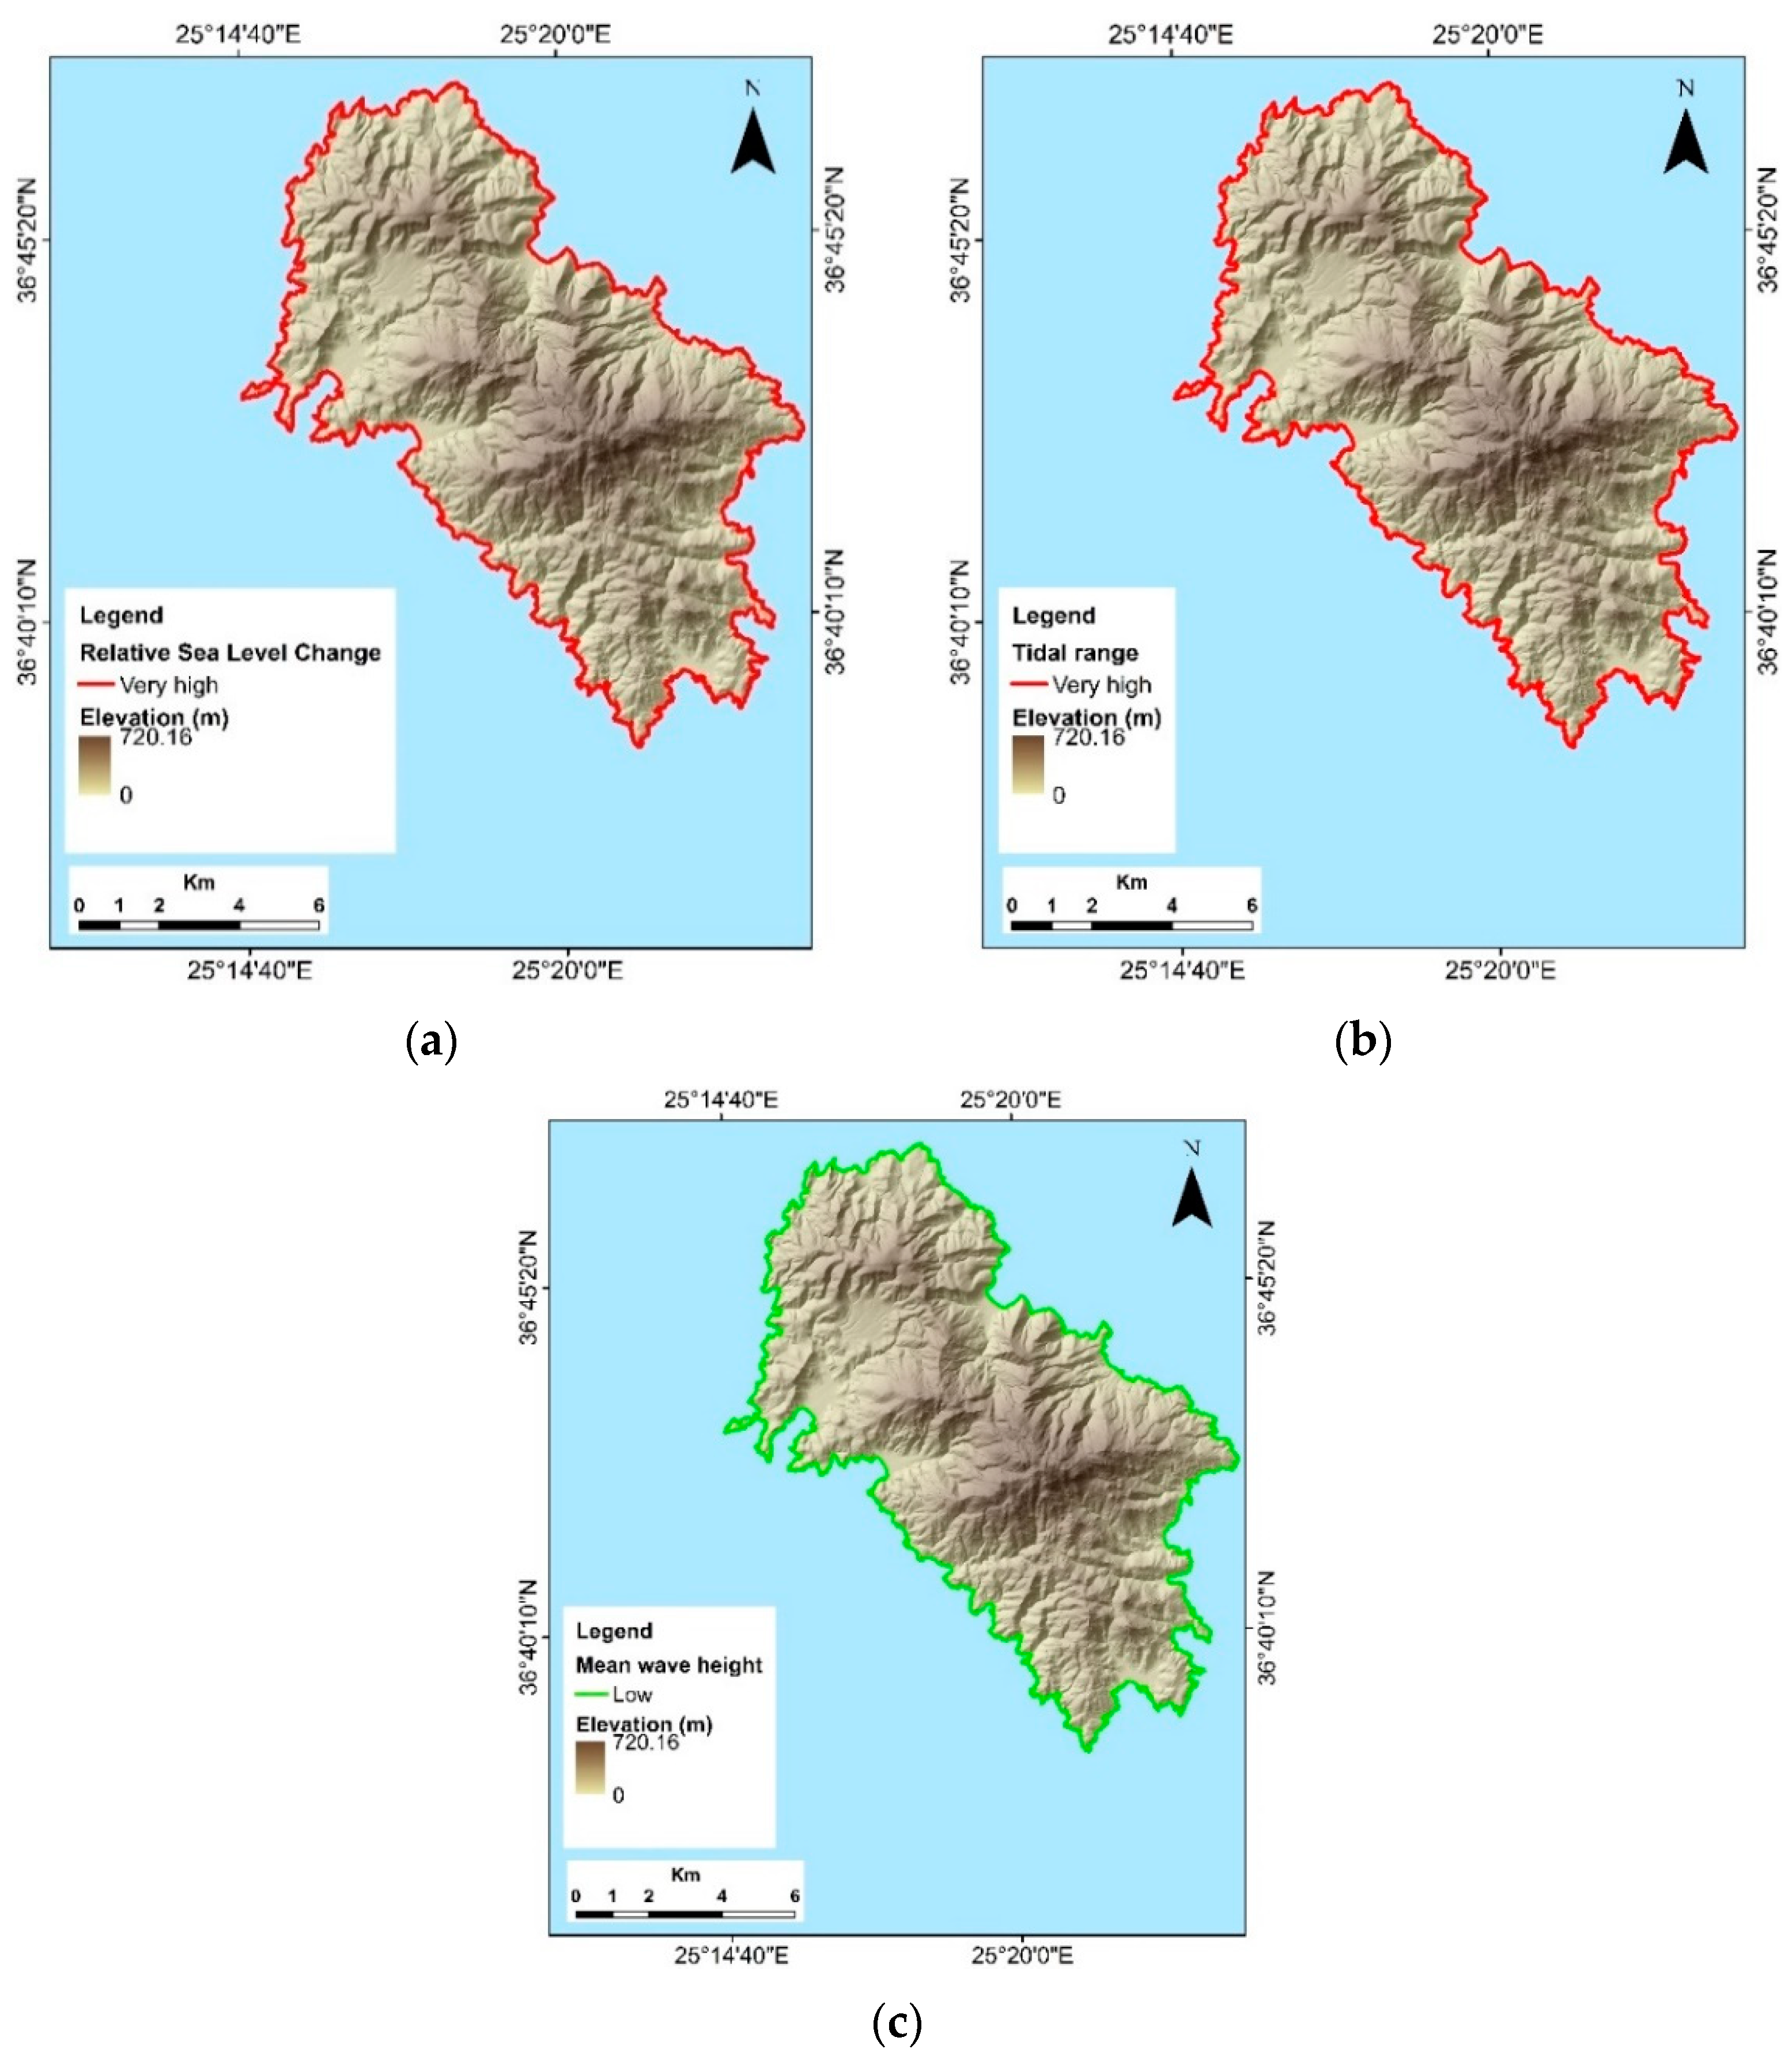
4.1. CVI Results
4.2. Geomorphological Characteristics of Mylopotas and Magganari Beach
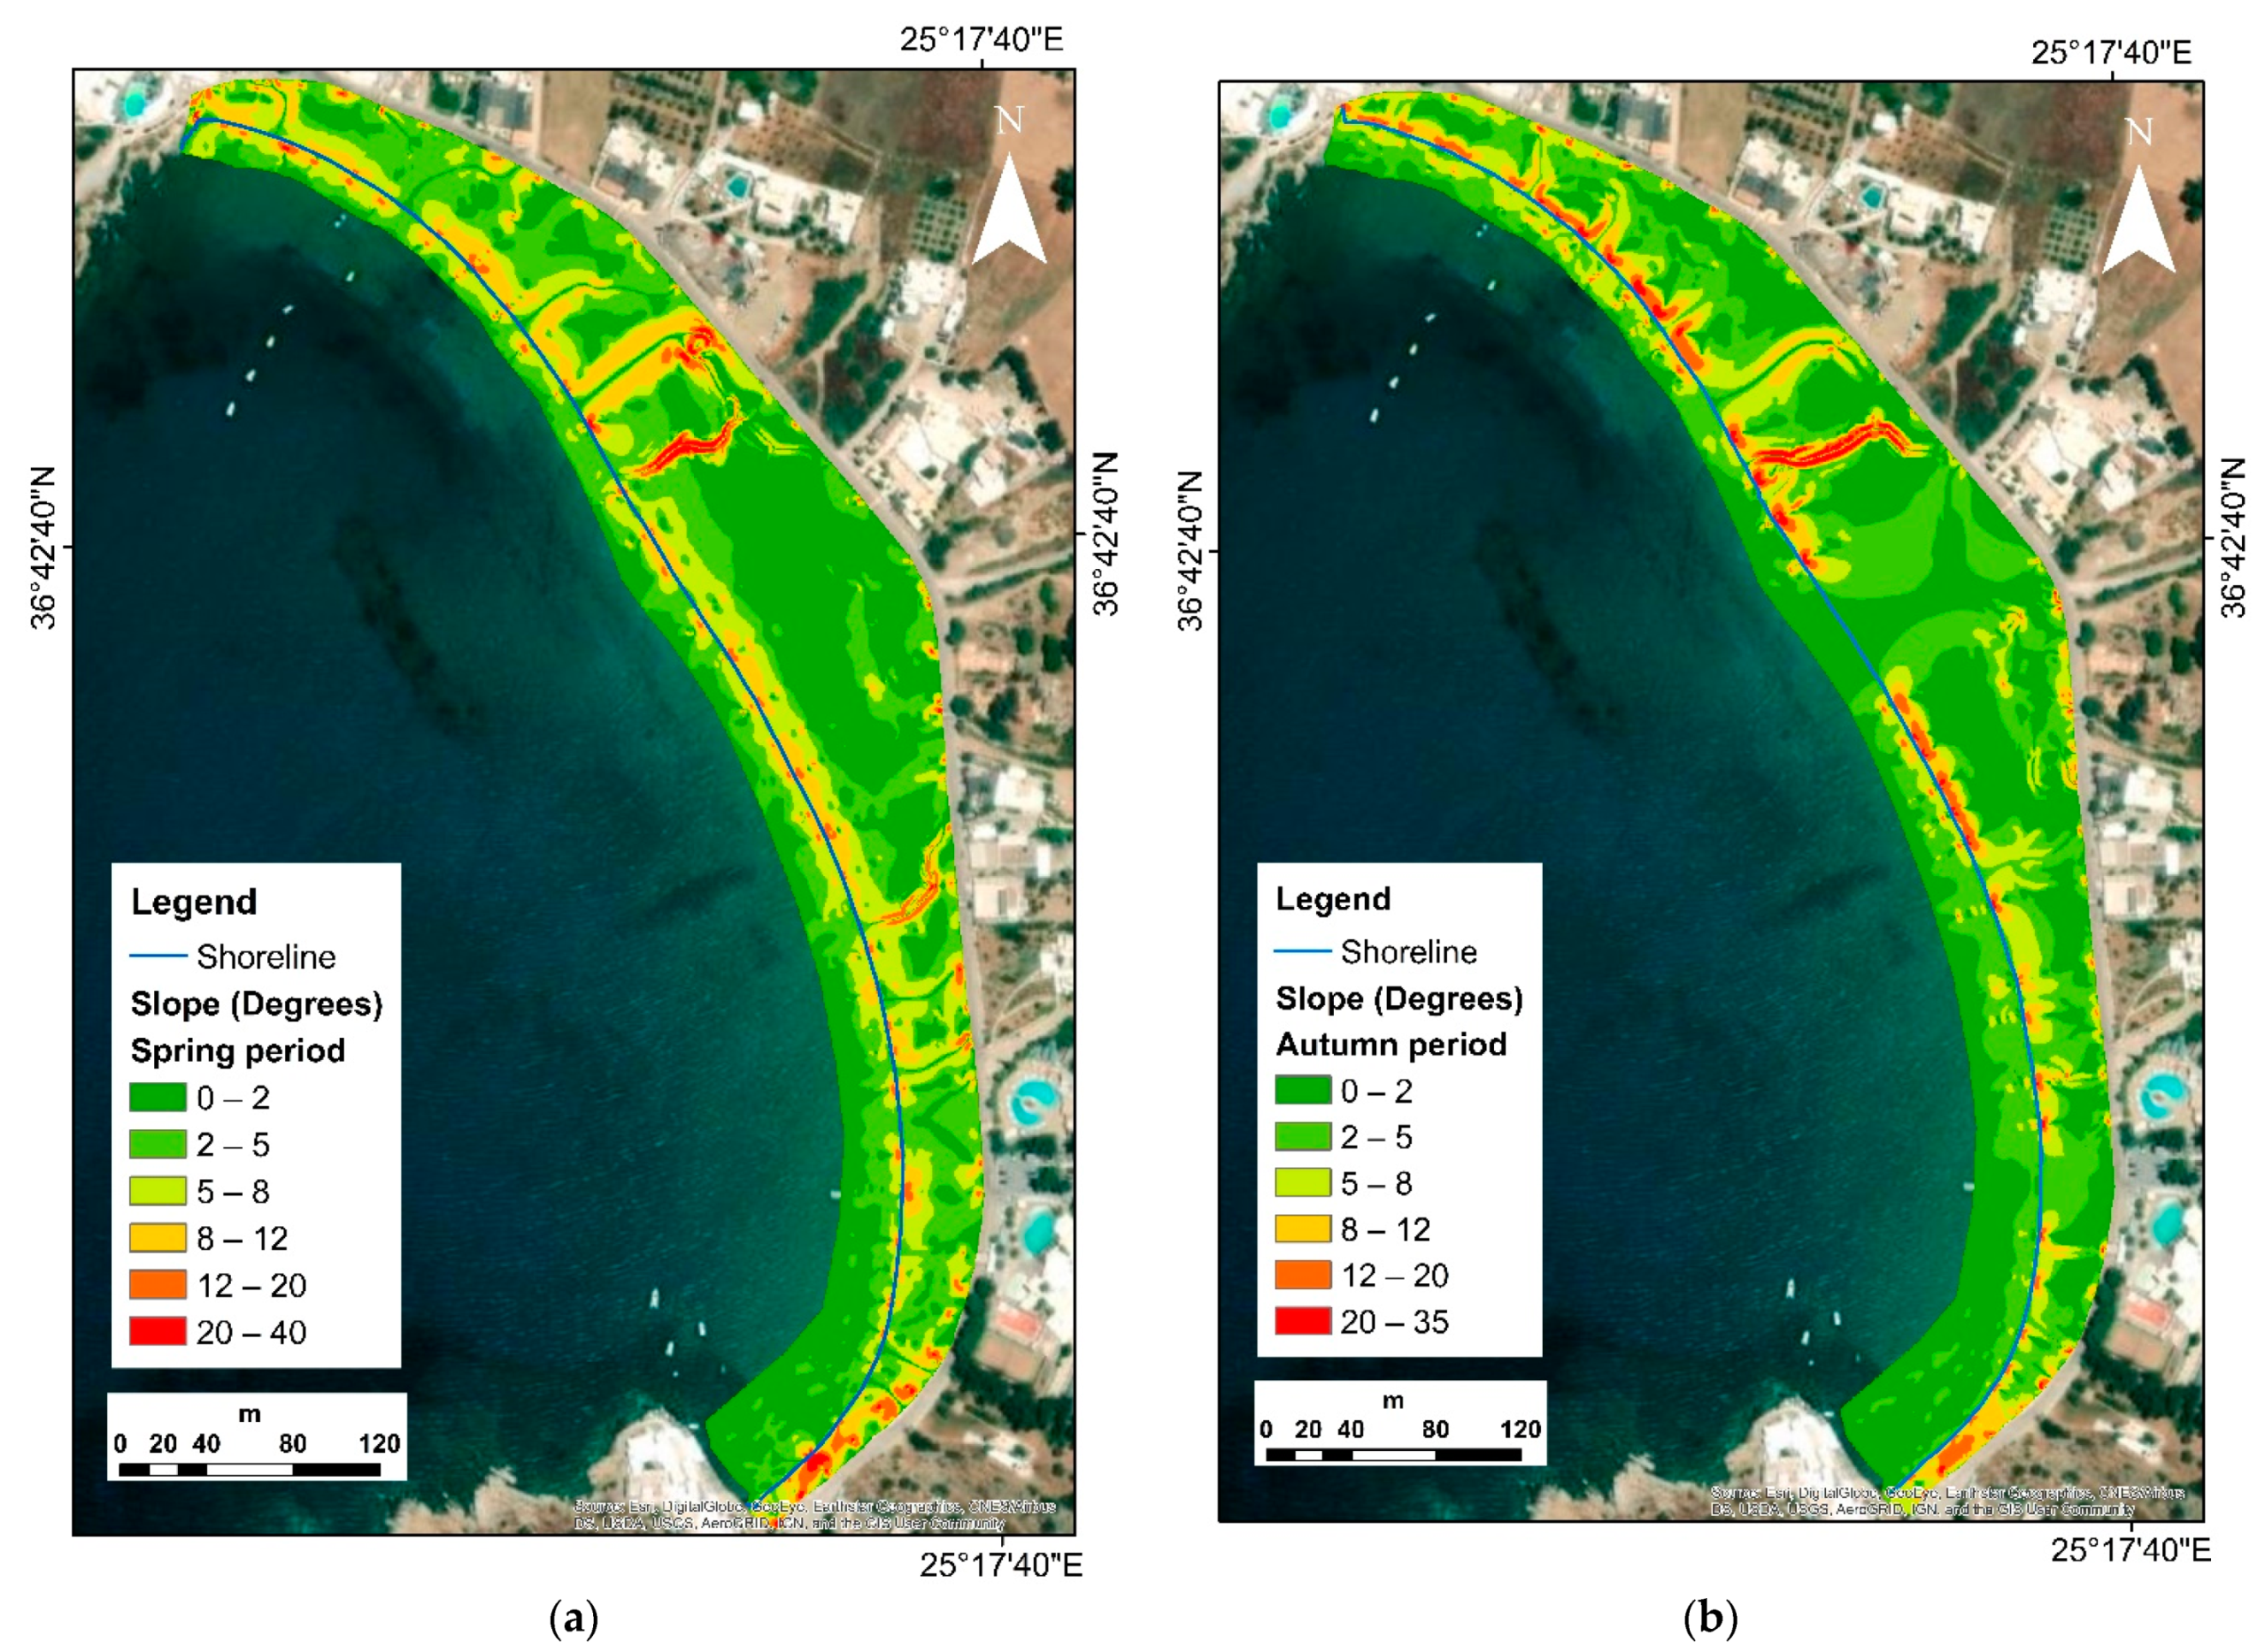
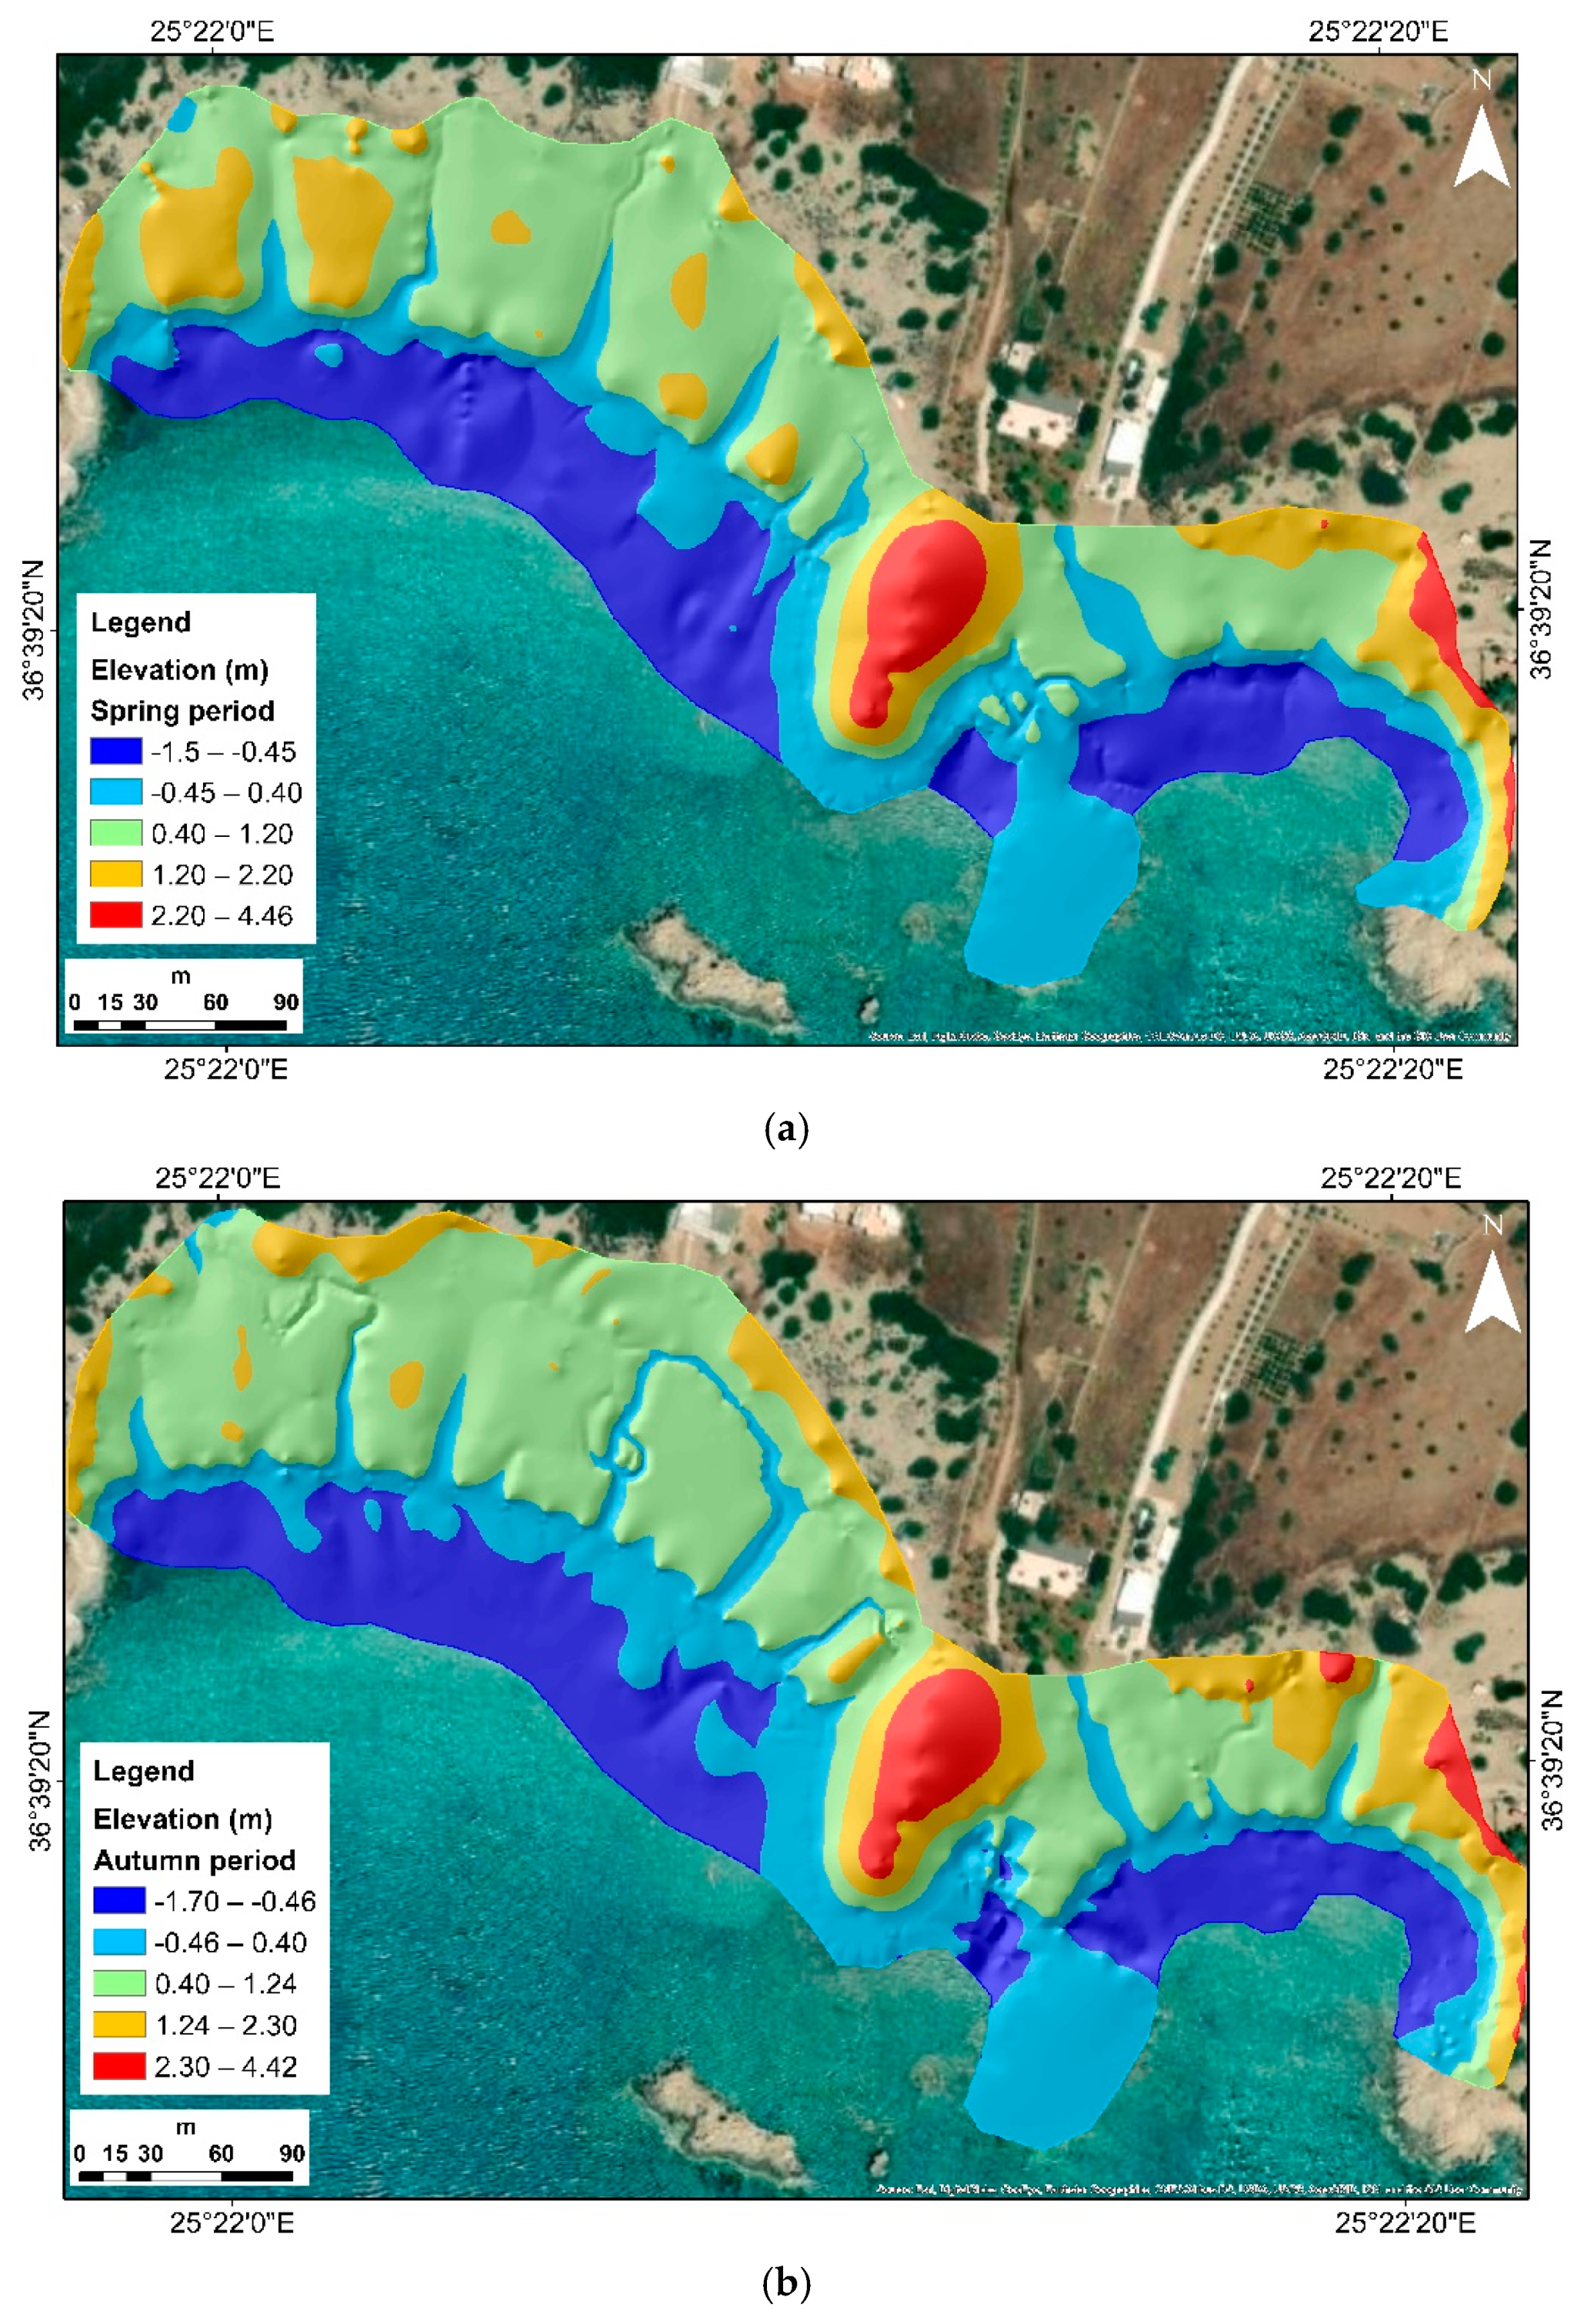
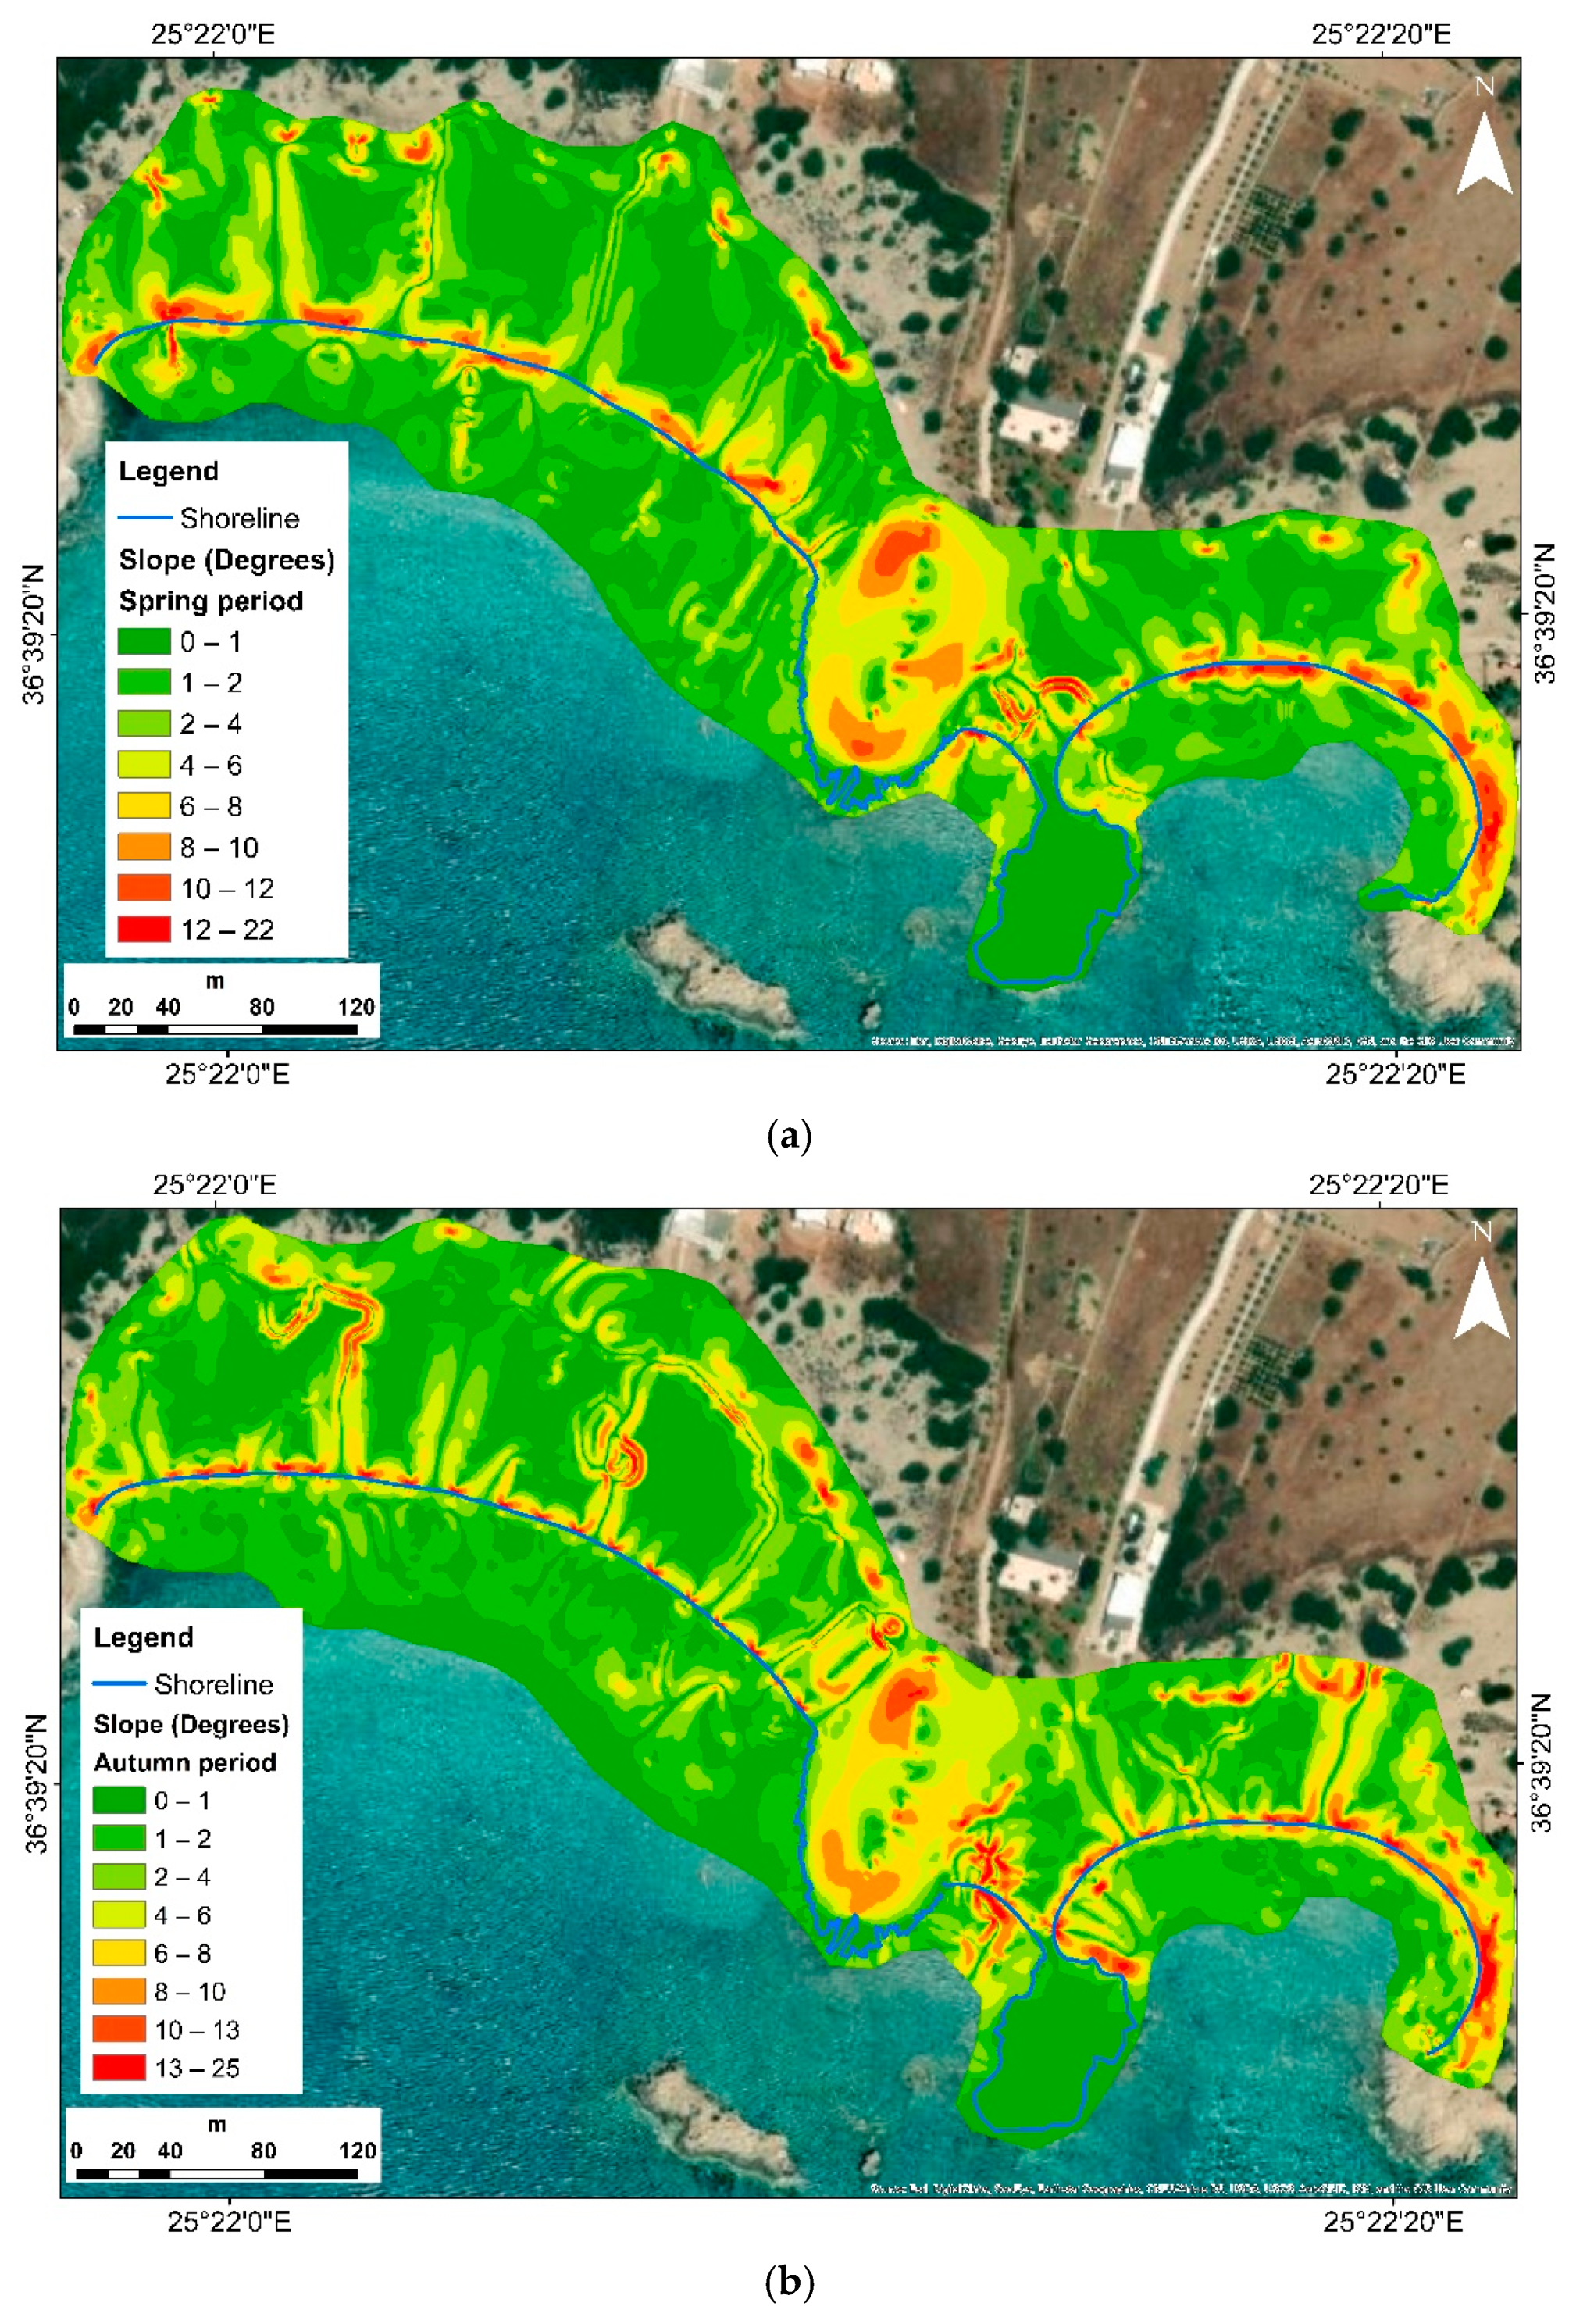
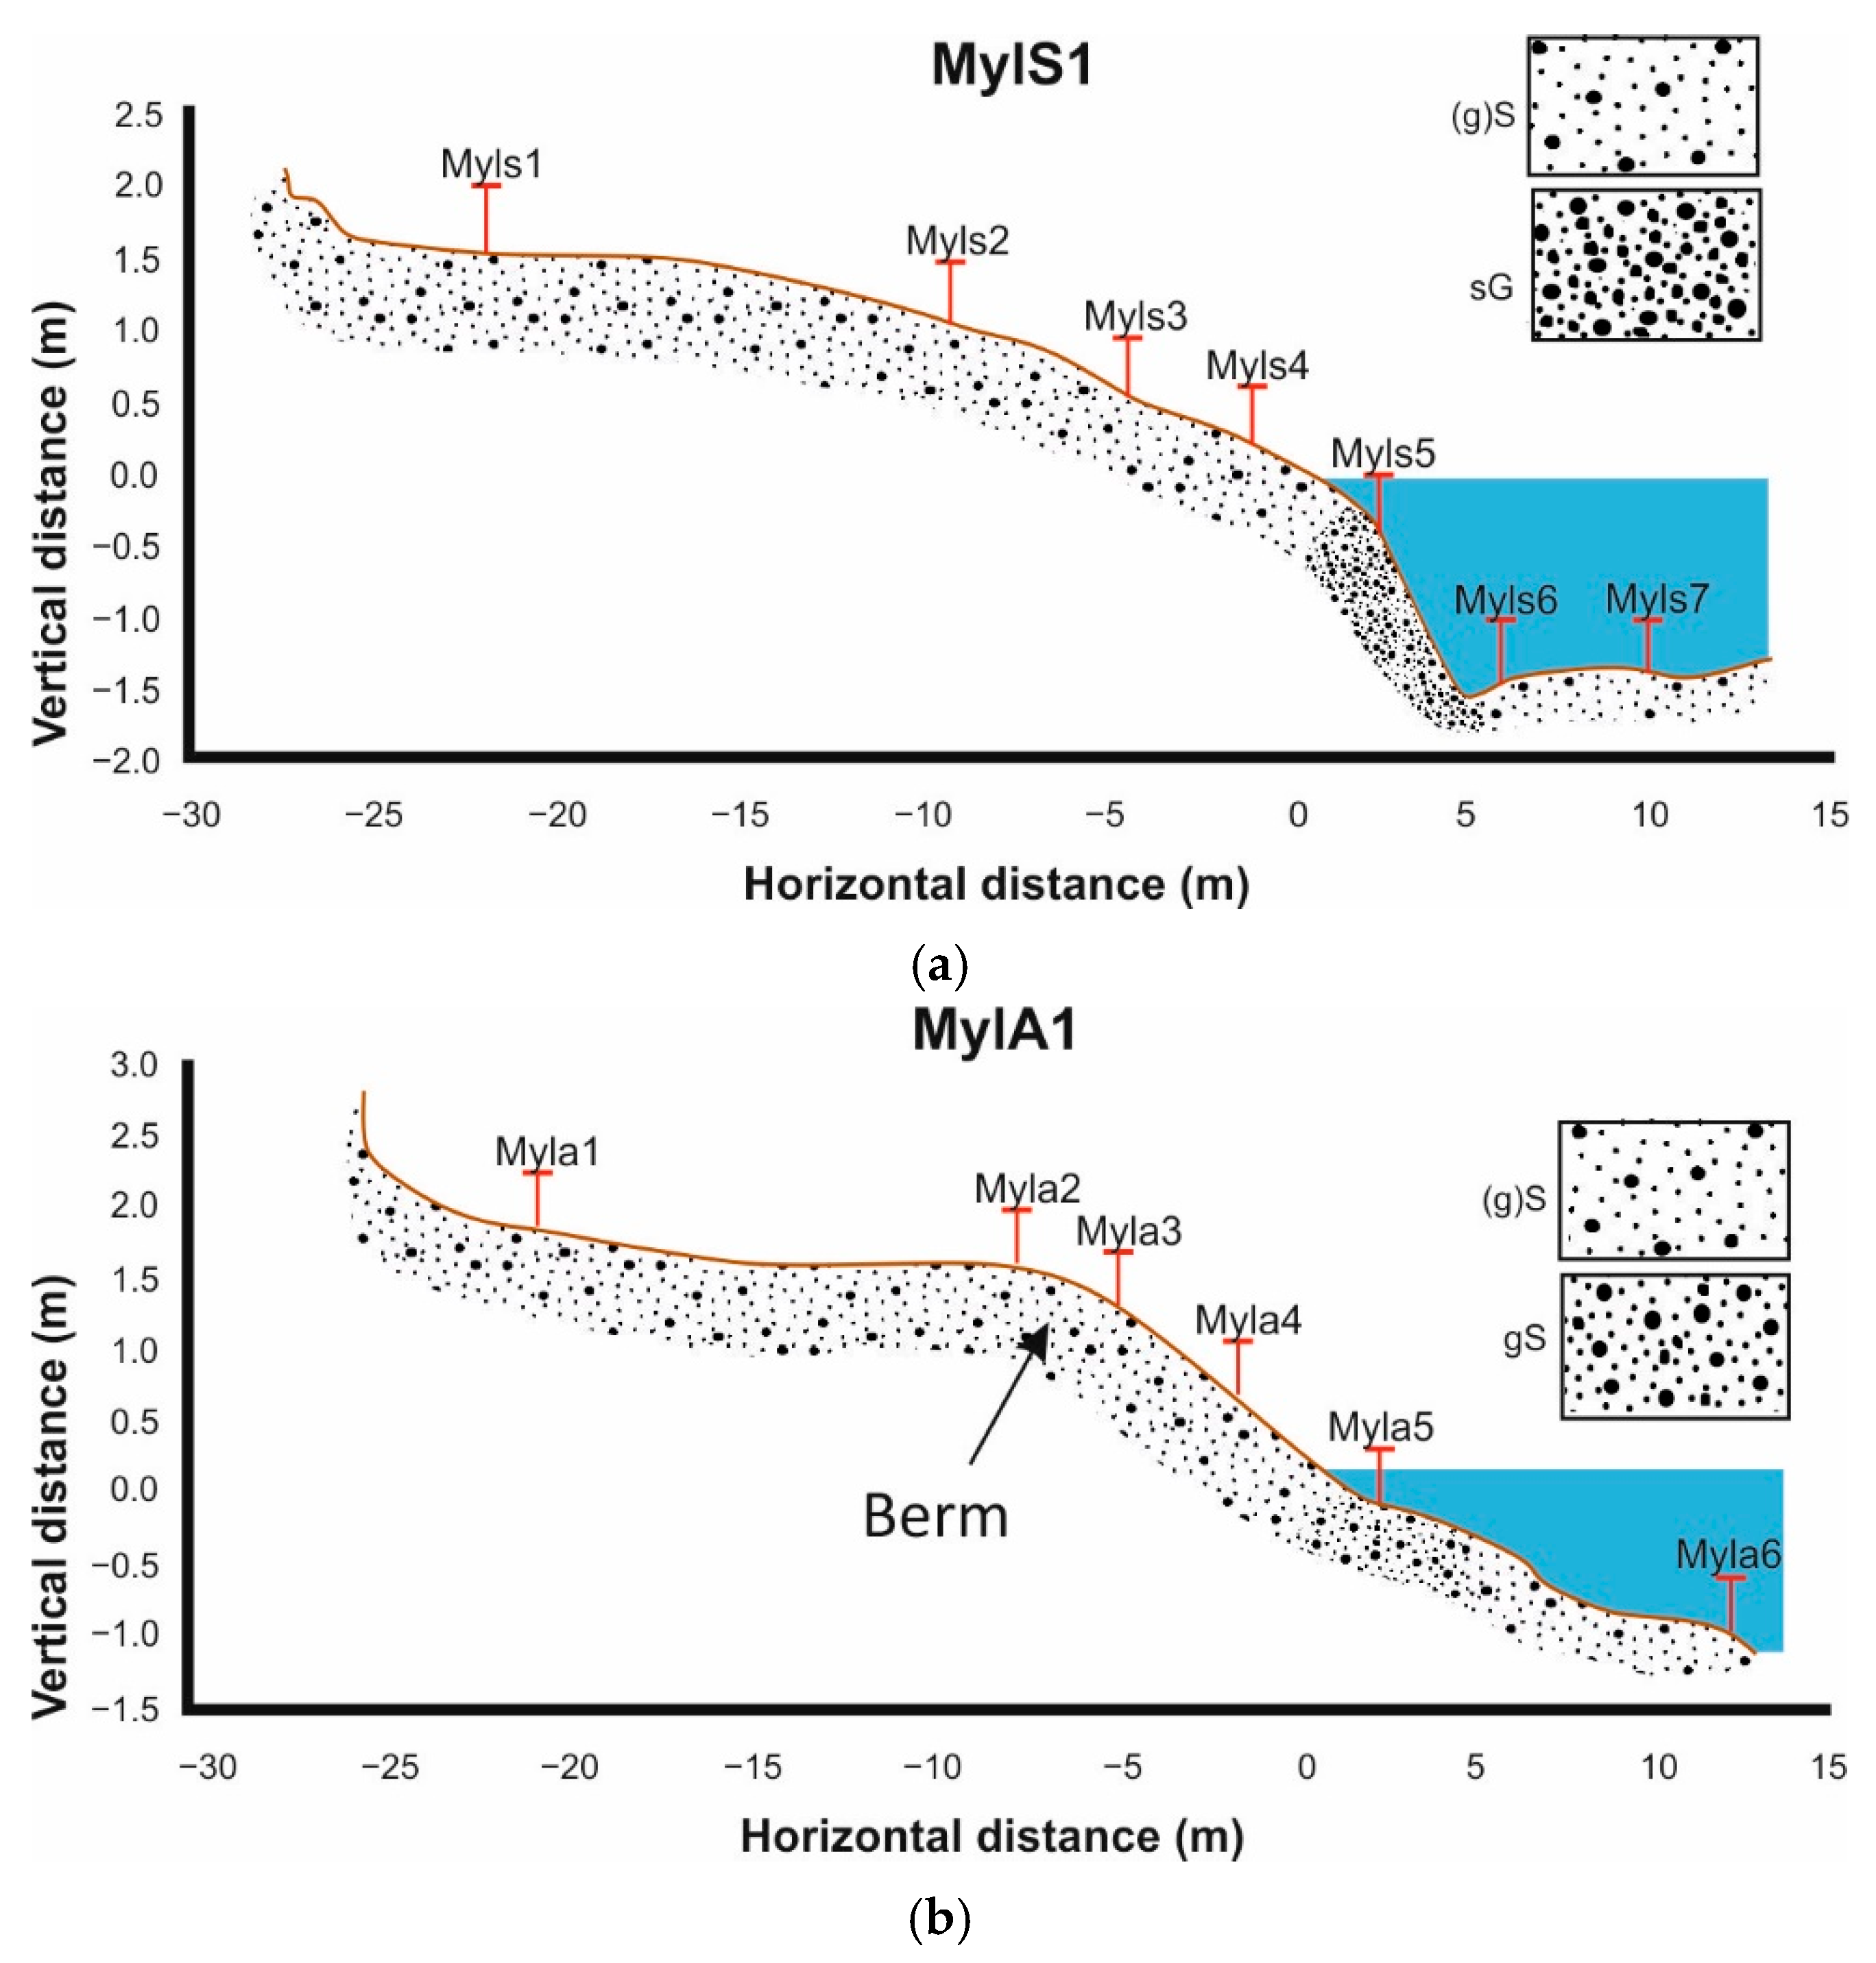
4.3. Topographic and Sedimentological Characteristics
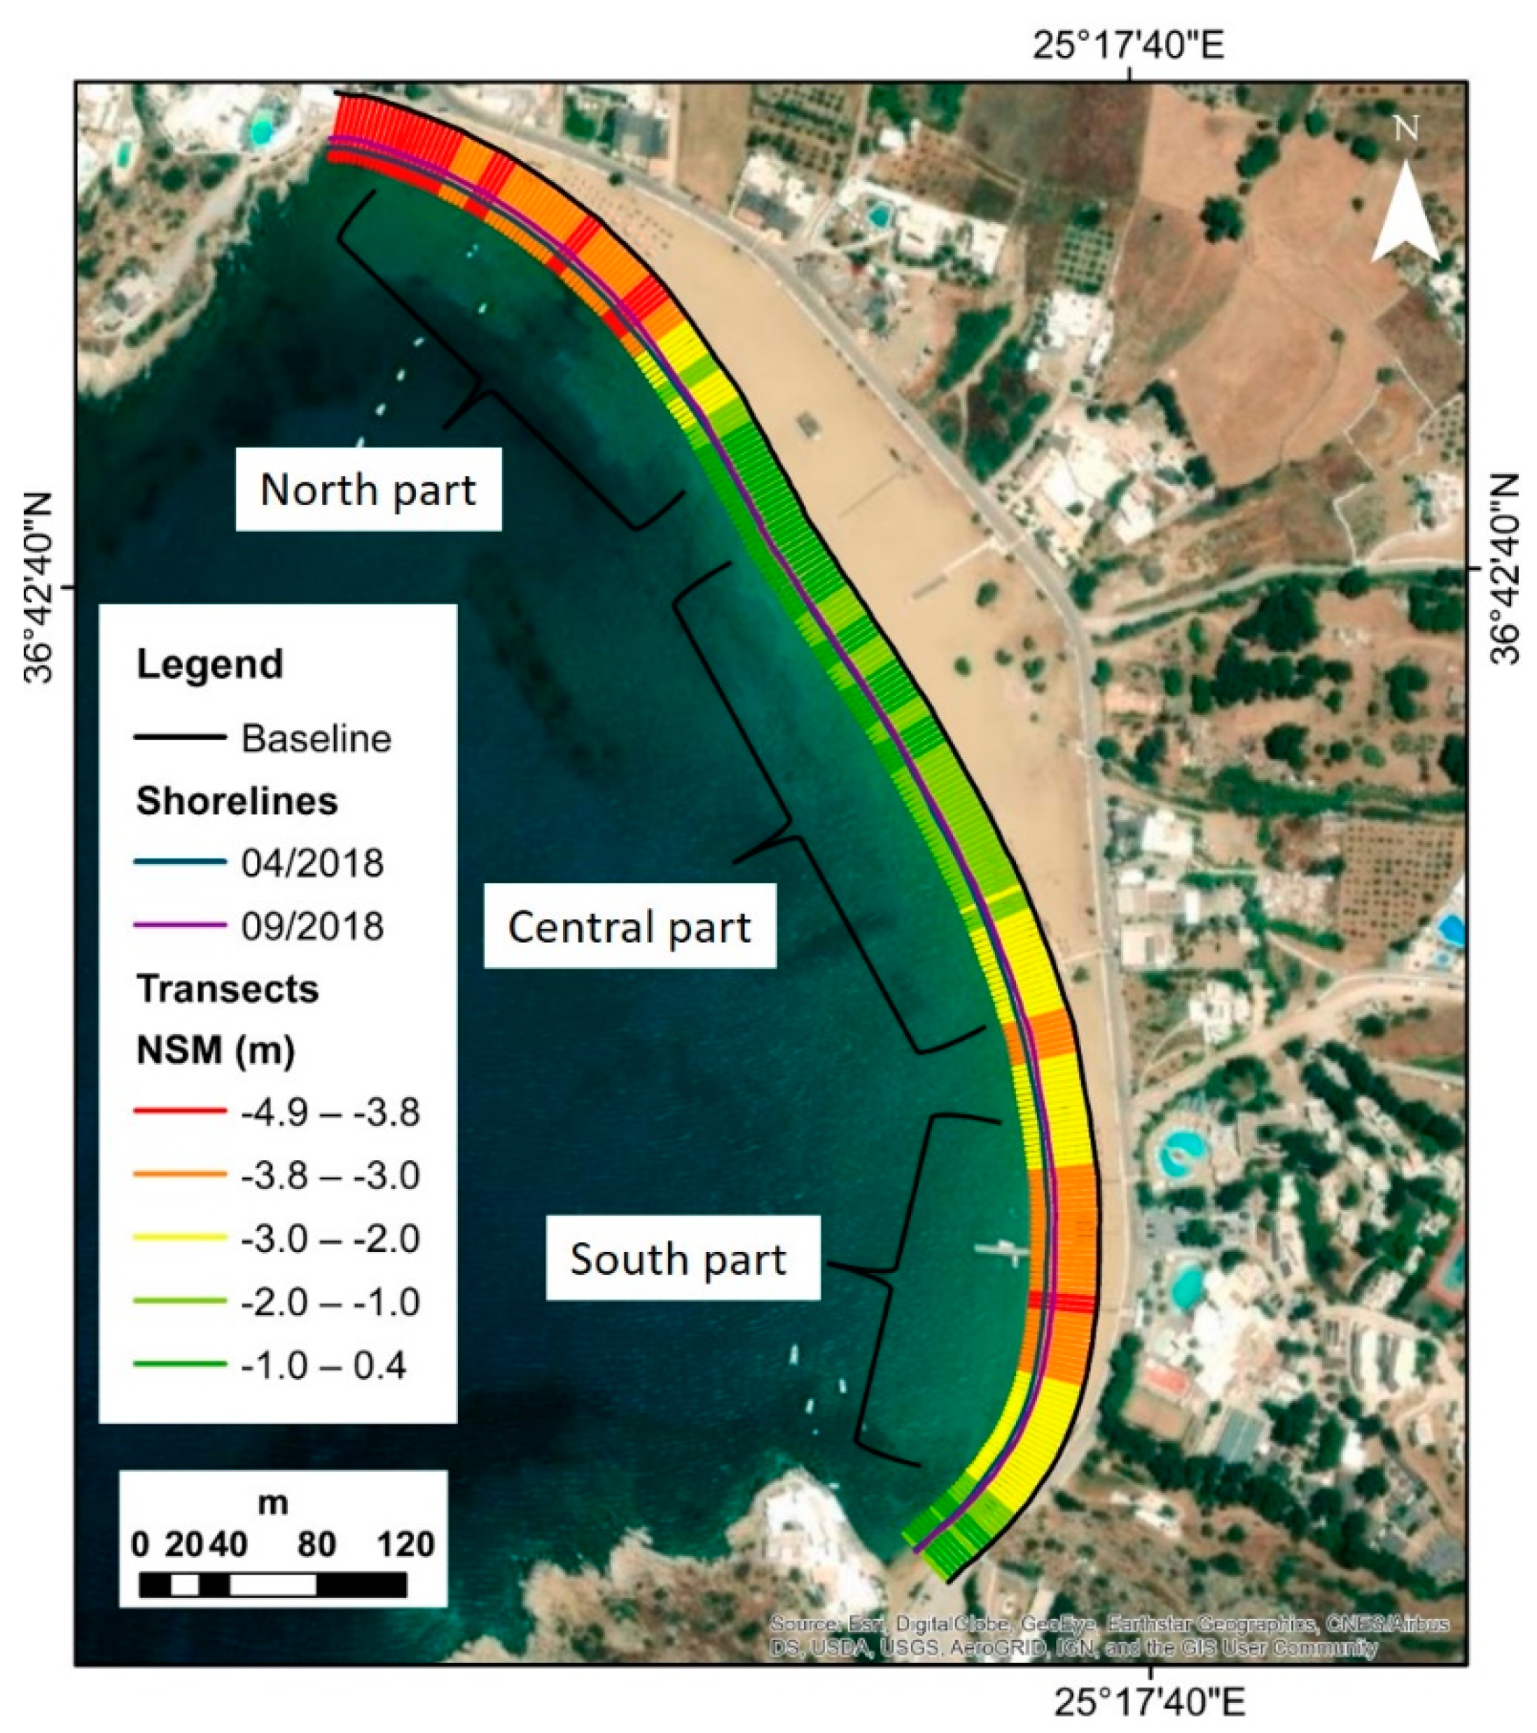
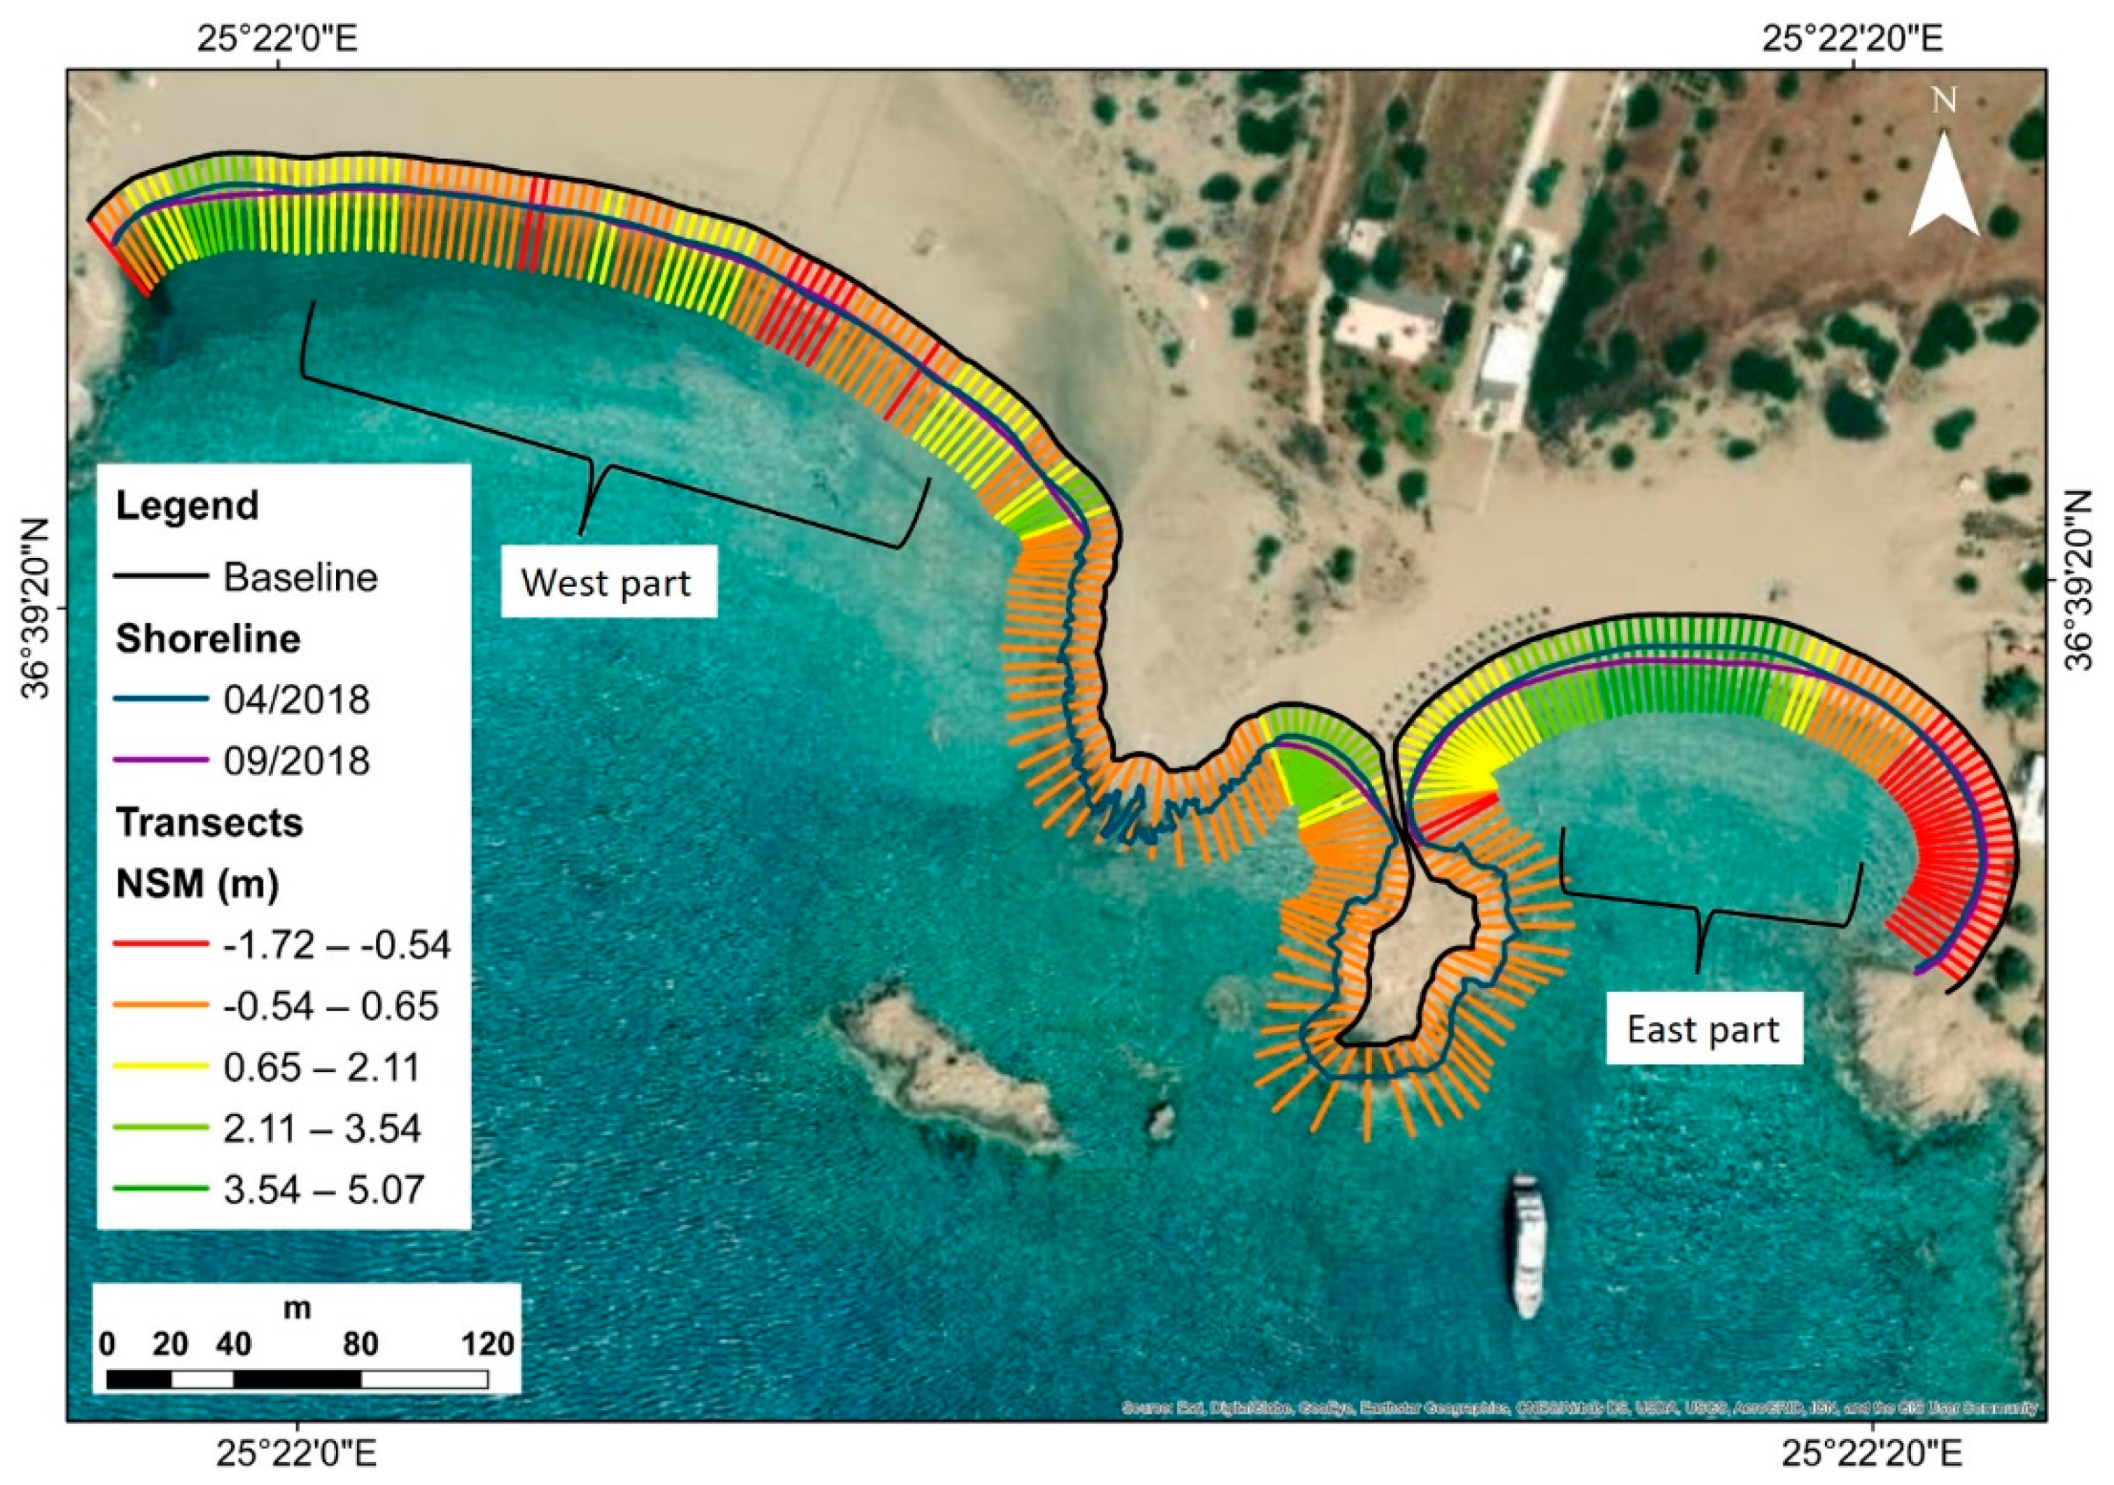
4.4. Seasonal Shoreline Displacement
5. Discussion
6. Conclusions
Supplementary Materials
Author Contributions
Funding
Institutional Review Board Statement
Informed Consent Statement
Data Availability Statement
Acknowledgments
Conflicts of Interest
References
- Collet, I.; Engelbert, A. Coastal Regions: People Living along the Coastline, Integration of NUTS 2010 and Latest Population Grid. EUROSTAT Stat. Focus 2013, 30. [Google Scholar]
- Davenport, J.; Davenport, J.L. The Impact of Tourism and Personal Leisure Transport on Coastal Environments: A Review. Estuar. Coast. Shelf Sci. 2006, 67, 280–292. [Google Scholar] [CrossRef]
- Vousdoukas, M.I.; Ranasinghe, R.; Mentaschi, L.; Plomaritis, T.A.; Athanasiou, P.; Luijendijk, A.; Feyen, L. Sandy Coastlines under Threat of Erosion. Nat. Clim. Chang. 2020, 10, 260–263. [Google Scholar] [CrossRef]
- Mentaschi, L.; Vousdoukas, M.I.; Pekel, J.-F.; Voukouvalas, E.; Feyen, L. Global Long-Term Observations of Coastal Erosion and Accretion. Sci. Rep. 2018, 8, 12876. [Google Scholar] [CrossRef] [Green Version]
- Aiello, A.; Canora, F.; Pasquariello, G.; Spilotro, G. Shoreline Variations and Coastal Dynamics: A Space–Time Data Analysis of the Jonian Littoral, Italy. Estuar. Coast. Shelf Sci. 2013, 129, 124–135. [Google Scholar] [CrossRef]
- Petropoulos, A.; Kapsimalis, V.; Evelpidou, N.; Karkani, A.; Giannikopoulou, K. Simulation of the Nearshore Sediment Transport Pattern and Beach Morphodynamics in the Semi-Enclosed Bay of Myrtos, Cephalonia Island, Ionian Sea. J. Mar. Sci. Eng. 2022, 10, 1015. [Google Scholar] [CrossRef]
- Psomiadis, E.; Parcharidis, I.; Poulos, S.; Stamatis, G.; Migiros, G.; Pavlopoulos, A. Earth Observation Data in Seasonal and Long Term Coastline Changes Monitoring the Case of Sperchios River Delta (Central Greece). Zeitschrift fur Geomorphol. Suppl. 2005, 137, 159–175. [Google Scholar]
- Ruggiero, P.; Kaminsky, G.M.; Gelfenbaum, G.; Voigt, B. Seasonal to Interannual Morphodynamics along a High-Energy Dissipative Littoral Cell. J. Coast. Res. 2005, 21, 553–578. [Google Scholar] [CrossRef]
- Norcross, Z.M.; Fletcher, C.H.; Merrifield, M. Annual and Interannual Changes on a Reef-Fringed Pocket Beach: Kailua Bay, Hawaii. Mar. Geol. 2002, 190, 553–580. [Google Scholar] [CrossRef]
- Bombino, G.; Barbaro, G.; D’Agostino, D.; Denisi, P.; Foti, G.; Labate, A.; Zimbone, S.M. Shoreline Change and Coastal Erosion: The Role of Check Dams. First Indications from a Case Study in Calabria, Southern Italy. CATENA 2022, 217, 106494. [Google Scholar] [CrossRef]
- Poulos, S.E.; Chronis, G. The Importance of the River Systems in the Evolution of the Greek Coastline. In CIESM Science Series; CIESM: Cambados, Spain, 1997; pp. 75–96. [Google Scholar]
- Alexandrakis, G.; Karditsa, A.; Poulos, S.; Ghionis, G.K.N.A. An Assessment of the Vulnerability to Erosion of the Coastal Zone Due to a Potential Rise of Sea Level: The Case of the Hellenic Aegean Coast. In Environmental Systems –Volume III.; Achim, S., Ed.; Eolss: Oxford, UK, 2010; p. 324. [Google Scholar]
- Bowman, D.; Guillén, J.; López, L.; Pellegrino, V. Planview Geometry and Morphological Characteristics of Pocket Beaches on the Catalan Coast (Spain). Geomorphology 2009, 108, 191–199. [Google Scholar] [CrossRef]
- Klein, A.H.F.; Ferreira, Ó.; Dias, J.M.A.; Tessler, M.G.; Silveira, L.F.; Benedet, L.; de Menezes, J.T.; de Abreu, J.G.N. Morphodynamics of Structurally Controlled Headland-Bay Beaches in Southeastern Brazil: A Review. Coast. Eng. 2010, 57, 98–111. [Google Scholar] [CrossRef]
- Church, J.A.; White, N.J. Sea-Level Rise from the Late 19th to the Early 21st Century. Surv. Geophys. 2011, 32, 585–602. [Google Scholar] [CrossRef] [Green Version]
- Kemp, A.C.; Horton, B.P.; Donnelly, J.P.; Mann, M.E.; Vermeer, M.; Rahmstorf, S. Climate Related Sea-Level Variations over the Past Two Millennia. Proc. Natl. Acad. Sci. USA 2011, 108, 11017–11022. [Google Scholar] [CrossRef] [PubMed] [Green Version]
- Portner, H.O.; Roberts, D.C.; Masson-Delmotte, V.; Zhai, P.; Tignor, M.; Poloczanska, E.; Mintebeck, K.; Nicolai, M.; Okem, A.; Petzold, J.; et al. IPCC The Ocean and Cryosphere in a Changing Climate Summary for Policmakers. IPCC Spec. Rep. Ocean Cryosph. a Chang. Clim. 2019, 42. [Google Scholar]
- Oppenheimer, M.; Glavovic, B.C.; Hinkel, J.; van de Wal, R.; Magnan, A.K.; Abd-Elgawad, A.; Cai, R.; Cifuentes-Jara, M.; DeConto, R.M.; Ghosh, T.; et al. Sea Level Rise and Implications for Low-Lying Islands, Coasts and Communities. In IPCC Special Report on the Ocean and Cryosphere in a Changing Climate; The Intergovernmental Panel on Climate Change: Geneva, Switzerland, 2019. [Google Scholar]
- Gornitz, V.; White, T.W.; Cushman, R.M. Vulnerability of the US to Future Sea Level Rise. In Proceedings of the Symposium on Coastal and Ocean Management, Long Beach, CA, USA, 8–12 July 1991. [Google Scholar]
- Gornitz, V.M.; Daniels, R.C.; White, T.W.K.R. Birdwell The Development of a Coastal Vulnerability Assessment Database, Vulnerability to Sea-Level Rise in the U.S. Southeast. J. Coast. Res. 1994, 12, 327–338. [Google Scholar]
- Thieler, E.R.; Hammar-Klose, E.S. National Assessment of Coastal Vulnerability to Sea-Level Rise, U.S. Atlantic Coast; USGS: Reston, VA, USA, 1999; Volume 1, pp. 99–593. [Google Scholar]
- Shaw, J.; Taylor, R.B.; Forbes, D.L.; Ruz, M.H. Sensitivity of the Canadian Coast to Sea-Level Rise. Geol. Surv. Canada Bull. 1998, 505, 114. [Google Scholar]
- Rao, K.N.; Subraelu, P.; Rao, T.V.; Malini, B.H.; Ratheesh, R.; Bhattacharya, S.; Rajawat, A.S. Ajai Sea-Level Rise and Coastal Vulnerability: An Assessment of Andhra Pradesh Coast, India through Remote Sensing and GIS. J. Coast. Conserv. 2009, 12, 195–207. [Google Scholar] [CrossRef]
- Karymbalis, E.; Chalkias, C.; Chalkias, G.; Grigoropoulou, E.; Manthos, G.; Ferentinou, M. Assessment of the Sensitivity of the Southern Coast of the Gulf of Corinth (Peloponnese, Greece) to Sea-Level Rise. Cent. Eur. J. Geosci. 2012, 4. [Google Scholar] [CrossRef]
- EC, [European Commission] Living with Coastal Erosion in Europe—Sediment and Space for Sustainability. OPOCE, Luxembourg. 2004. Available online: http://www.eurosion.org/project/eurosion_en.pdf (accessed on 1 July 2016).
- Mohanty, P.C.; Mahendra, R.S.; Nayak, R.K.; Kumar, T.S. Impact of Sea Level Rise and Coastal Slope on Shoreline Change along the Indian Coast. Nat. Hazards 2017, 89, 1227–1238. [Google Scholar] [CrossRef]
- Pendleton, E.A.; Thieler, E.R.; Williams, S.J. Coastal Vulnerability Assessment of Golden Gate National Recreation Area to Sea-Level Rise; US Geological Survey: Woods Hole, MA, USA, 2005; pp. 1–23. [Google Scholar]
- Pendleton, E.A.; Thieler, E.R.; Williams, S.J. Importance of Coastal Change Variables in Determining Vulnerability to Sea- and Lake-Level Change. J. Coast. Res. 2010, 26, 176–183. [Google Scholar] [CrossRef]
- Alexandrakis, G.; Karditsa, A.; Poulos, S.E.; Ghionis, G.; Kampanis, N.A. Environmental Systems-Vol. III—An Assessment of the Vulnerability to Erosion of the Coastal Zone due to a Potential Rise of Sea Level: The Case of the Hellenic Aegean Coast. Environ. Syst. 2014, 3, 1–14. [Google Scholar]
- Gaki-Papanastassiou, K.; Karymbalis, E.; Poulos, S.E.; Seni, A.; Zouva, C. Coastal Vulnerability Assessment to Sea-Level Rise Bαsed on Geomorphological and Oceanographical Parameters: The Case OfArgolikos Gulf, Peloponnese, Greece. Hell. J. Geosci. 2010, 45, 109–122. [Google Scholar]
- Boumboulis, V.; Apostolopoulos, D.; Depountis, N.; Nikolakopoulos, K. The Importance of Geotechnical Evaluation and Shoreline Evolution in Coastal Vulnerability Index Calculations. J. Mar. Sci. Eng. 2021, 9, 423. [Google Scholar] [CrossRef]
- Dimou, A.; Vassilakis, E.; Antoniou, V.E.N. An Assessment of the Coastal Erosion at Marathon East Attica (Greece). In Proceedings of the Panhellenic and International Geographical Conferences, Collection of Proceedings, Thessaloniki, Greece, 22–24 October 2015; pp. 1579–1587. [Google Scholar]
- Faour, G.; Fayad, A.; Mhawej, M. GIS-Based Approach to the Assessment of Coastal Vulnerability to Sea Level Rise: Case Study on the Eastern Mediterranean. J. Surv. Mapp. Eng. 2013, 1, 41–48. [Google Scholar]
- Flansburg, M.E.; Stockli, D.F.; Poulaki, E.M.; Soukis, K. Tectono-Magmatic and Stratigraphic Evolution of the Cycladic Basement, Ios Tectono - Magmatic and Stratigraphic Evolution of the Cycladic Basement, Ios Island, Greece. Tectonics 2019, 38, 2291–2316. [Google Scholar] [CrossRef]
- Climatic Data for Selected Stations in Greece. Available online: http://www.emy.gr/emy/el/ (accessed on 8 October 2022).
- Soukisian, T.; Hatzinaki, M.; Korres, G.; Papadopoulos, A.; Kallos, G.; Anadranistakis, E. Wind and Wave Atlas of the Hellenic Seas, 1st ed.; Hellenic Centre for Marine Research: Athens, Greece, 2007; ISBN 987 960 86651 9-4. [Google Scholar]
- CORINE Land Cover. Available online: https://land.copernicus.eu/pan-european/corine-land-cover/clc2018. (accessed on 8 October 2022).
- Thieler, E.R.; Himmelstoss, E.A.; Zichichi, J.L.; Ergul, A. The Digital Shoreline Analysis System (DSAS) Version 4.0-an ArcGIS Extension for Calculating Shoreline Change (No. 2008-1278); US Geological Survey: Woods Hole, MA, USA, 2009. [Google Scholar]
- Hellenic Navy Hydrographic Service. Sea Level Statistics of Greek Ports; Hellenic Navy Hydrographic Service: Athens, Greece, 2015. [Google Scholar]
- Folk, R.L.; Ward, W.C. Brazos River Bar: A Study in the Significance of Grain Size Parameters. J. Sediment. Petrol. 1957, 27, 3–36. [Google Scholar] [CrossRef]


| Variables/Ranking | Very Low 1 | Low 2 | Moderate 3 | High 4 | Very High 5 |
|---|---|---|---|---|---|
| Geomorphology | Rocky-cliffed coasts, Fjords | Medium cliffs, Indented coasts | Low cliffs, Glacial drift, Alluvial plains | Cobble Beaches, Estuary, Lagoon | Barrier beaches, Sand beaches, Salt marsh, Mud flats, Deltas, Mangrove, Coral reefs |
| Coastal Slope (%) | >12 | 12–9 | 9–6 | 6–3 | <3 |
| Relative Sea Level Change (mm/yr) | <1.80 | 1.80–2.50 | 2.50–3 | 3–3.40 | >3.40 |
| Shoreline displacement rate (Erosion/Accretion) (m/yr) | >2 | 1–2 | −1–+1 | −1.10–−2 | <−2 |
| Mean Tidal Range (m) | >6. | 4–6 | 2–4 | 1–2 | <1 |
| Mean Wave Height (m) | <0.55 | 0.55–0.85 | 0.85–1.05 | 1.05–1.25 | >1.25 |
| Vulnerability Ranking | Very Low (1) | Low (2) | Moderate (3) | High (4) | Very High (5) | Total |
|---|---|---|---|---|---|---|
| Coastal Geomorphology | Rocky, cliffed coasts Artificial constructions | Medium Cliffs | Low Cliffs | Cobble, pebble beaches Estuary | Sandy beaches, sandy pocket beaches | |
| Length (%) | 93.29 | 0.24 | 0.18 | 1.16 | 5.13 | 100 |
| Length (km) | 102.77 | 0.27 | 0.20 | 1.27 | 5.65 | 110.10 |
| Coastal Slope (%) | >12 | 12–9 | 9–6 | 6–3 | <3 | |
| Length (%) | 95.07 | 1.36 | 1.47 | 0.92 | 1.18 | 100 |
| Length (km) | 104.74 | 1.50 | 1.61 | 0.92 | 1.30 | 110.10 |
| Erosion/Accretion rate (m/yr) | >2 | 1–2 | −1–1 | −2–−1 | <−2 | |
| Length (%) | 100 | 100 | ||||
| Length (km) | 110.10 | 110.10 |
| Vulnerability Ranking | Very Low (1) | Low (2) | Moderate (3) | High (4) | Very High (5) | Total |
|---|---|---|---|---|---|---|
| Relative sea level change (mm/yr) | <1.80 | 1.80–2.50 | 2.50–3 | 3–3.40 | >3.40 | |
| Length (%) | 100 | 100 | ||||
| Length (km) | 110.10 | 110.10 | ||||
| Tidal range (m) | >6 | 4–6 | 2–4 | 1– 2 | <1 | |
| Length (%) | 100 | 100 | ||||
| Length (km) | 110.10 | 110.10 | ||||
| Mean Wave Height (m) | <0.55 | 0.55–0.85 | 0.85–1.05 | 1.05–1.25 | >1.25 | |
| Length (%) | 100 | 100 | ||||
| Length (km) | 110.10 | 110.10 |
| Vulnerability Ranking | Very Low (1) | Low (2) | Moderate (3) | High (4) | Very High (5) | Total |
|---|---|---|---|---|---|---|
| CVI | 5–7.07 | 7.07–10 | 10–11.18 | 11.18–19.36 | 19.36–25 | |
| Length (%) | 92.37 | 1.69 | 2.64 | 1.74 | 1.56 | 100 |
| Length (km) | 101.74 | 1.86 | 2.91 | 1.91 | 1.72 | 110.10 |
Publisher’s Note: MDPI stays neutral with regard to jurisdictional claims in published maps and institutional affiliations. |
© 2022 by the authors. Licensee MDPI, Basel, Switzerland. This article is an open access article distributed under the terms and conditions of the Creative Commons Attribution (CC BY) license (https://creativecommons.org/licenses/by/4.0/).
Share and Cite
Komi, A.; Petropoulos, A.; Evelpidou, N.; Poulos, S.; Kapsimalis, V. Coastal Vulnerability Assessment for Future Sea Level Rise and a Comparative Study of Two Pocket Beaches in Seasonal Scale, Ios Island, Cyclades, Greece. J. Mar. Sci. Eng. 2022, 10, 1673. https://doi.org/10.3390/jmse10111673
Komi A, Petropoulos A, Evelpidou N, Poulos S, Kapsimalis V. Coastal Vulnerability Assessment for Future Sea Level Rise and a Comparative Study of Two Pocket Beaches in Seasonal Scale, Ios Island, Cyclades, Greece. Journal of Marine Science and Engineering. 2022; 10(11):1673. https://doi.org/10.3390/jmse10111673
Chicago/Turabian StyleKomi, Apostolia, Alexandros Petropoulos, Niki Evelpidou, Serafeim Poulos, and Vasilios Kapsimalis. 2022. "Coastal Vulnerability Assessment for Future Sea Level Rise and a Comparative Study of Two Pocket Beaches in Seasonal Scale, Ios Island, Cyclades, Greece" Journal of Marine Science and Engineering 10, no. 11: 1673. https://doi.org/10.3390/jmse10111673