Article

Hydrodynamic Performance of a Floating Offshore Oscillating Water Column Wave Energy Converter

1
School of Engineering, Design and Built Environment, Western Sydney University, Penrith, NSW 2751, Australia
2
Department of Mechanical Engineering, Dhaka University of Engineering and Technology (DUET), Gazipur 1700, Bangladesh
*
Author to whom correspondence should be addressed.
J. Mar. Sci. Eng. 2022, 10(10), 1551; https://doi.org/10.3390/jmse10101551
Submission received: 10 September 2022 / Revised: 14 October 2022 / Accepted: 17 October 2022 / Published: 20 October 2022
(This article belongs to the Special Issue CFD Analysis in Ocean Engineering)

Abstract

:
A floating oscillating water column (OWC) wave energy converter (WEC) supported by mooring lines can be modelled as an elastically supported OWC. The main objective of this paper is to investigate the effects of the frequency ratio on the performance of floating OWC (oscillating water column) devices that oscillate either vertically or horizontally at two different mass ratios (m = 2 and 3) through two-dimensional computational fluid dynamics simulations. The frequency ratio is the ratio of the natural frequency of the system to the wave frequency. Simulations are conducted for nine frequency ratios in the range between 1 and 10. The hydrodynamic efficiency achieves its maximum at the smallest frequency ratio of 1 if the OWC oscillates horizontally and at the largest frequency ratio of 10 if the OWC oscillates vertically. The frequency ratio affects the hydraulic efficiency of the vertical oscillating OWC significantly stronger than that of the horizontal oscillating OWC, especially when it is small. The air pressure and the volume oscillation in OWC is not affected much by the horizontal motion of the OWC but is significantly affected by the vertical motion, especially at small frequency ratios.

1. Introduction

The consumption of energy is increasing alarmingly to meet modern needs [1,2]. Wave energy in the ocean has a high energy density and a negligible environmental impact when it is harvested [3,4,5,6]. Oscillating water column devices (OWC) have gained significant theoretical interest among numerous classes of technologies proposed for wave energy conversion [7,8,9]. One of the most effective wave energy devices is an oscillating water column (OWC) [1,10,11,12]. OWCs are hollow structures where wave action compresses and decompresses the trapped air, forcing airflow through a turbine that runs a generator and generates electricity [13,14]. In a system with oscillating water columns, the turbine rotates in the same direction regardless of the direction of airflow. Most of the research on the OWC device has been focused on onshore or nearshore deployed devices installed on the seabed [15,16,17]. This type of OWC is called a land-fixed OWC. These devices offer advantages over offshore ones in terms of engineering deployment and maintenance costs [18,19,20]. The use of offshore OWC devices can harvest more wave energy in the deep ocean but the research on this is rare [21,22,23,24,25].
Land-fixed OWC devices for wave energy harvesting have been investigated analytically, experimentally, and numerically [26,27,28]. Rapaka et al. [29] found that for any floating energy device operating on the oscillating column principle, the heave motion should be enhanced while the sway motion should be reduced in order to achieve high efficiency. Sphaier et al. [30] achieved a vertical water velocity reduction by altering the entry shape in their experimental study. Sheng et al. [31] conducted numerical simulation to improve the performance of OWC by optimised design. He and Huang [32] used piles to support the OWC structure and demonstrated the structure capacity to capture wave energy. Zhou et al. [24] investigated the optimisation of a floating OWC. They found the mooring system affected the hydrodynamic performance of the OWC significantly, which was also reported by Xu et al. [33].
With the ability to simulate complicated viscous and non-linear effects of wave motion, computational fluid dynamics (CFD) models are an efficient way to further boost the accuracy of predictions of the hydrodynamic characteristics of OWC devices. Luo, et al. [34] examined the hydrodynamic performance of a heave-only floating OWC device using a two-dimensional CFD model. They discovered that the efficiency of the device was significantly influenced by the mooring line stiffness and power take-off (PTO) dampening. The maximum and minimum device efficiencies were discovered for fixed and free-to-heave floating devices, respectively. The numerical results of Elhanafi et al. [35] showed that the surging motion of an OWC device can improve the performance. A floating OWC wave power device was numerically estimated by Hong et al. [36] using linear wave theory. Toyota et al. [37] conducted a detailed numerical simulation to evaluate the performance of floating wave energy converters under the influence of wave-induced movements, air pressures in air chambers, elevations of the free surfaces in the chambers, as well as mooring and turbine characteristics.
Gubesch et al. [38] conducted experiments to study three mooring configurations—a tension leg, a taut mooring with 45° tendons, and a catenary mooring with heavy chains. The results showed that the 45° taut mooring performed the best, followed by the vertical taut and catenary mooring. Rezanejad et al. [39] investigated the effectiveness of a unique floating dual-chamber oscillating water column wave energy converter system through experiments. Their mutual interactions between fore and rear chambers have a significant effect on the enhancement of the overall hydrodynamic performance. By conducting experiments on the hydrodynamics and movements of a unique dual-chamber floating oscillating water column apparatus, Gadelho et al. [40] demonstrated that the natural frequency of surge motion is significantly lower than the produced waves, and that in some situations, the initial negative drift forces cause the device to move in the opposite direction of the incident waves. The experiments by Wu et al. [23] demonstrated that the PTO damping has an effect on the water surface elevation inside the OWC chamber but not on the OWC WEC motion. According to Howey et al. [41], the separately moored WEC, under harsh circumstances, suffered lower mooring stresses than the interconnected arrays, which regularly faced snap loads.
Although research on floating, moored OWCs has been published, many research articles only take one mooring configuration into account [35,38,42,43]. The main aim of this paper is to investigate the effect of the stiffness of the mooring system on floating OWCs on the hydrodynamic performance through numerical simulations of two mass ratios (m). In the numerical simulations, the elastically supported OWC moved either horizontally or vertically. The rest of the paper is arranged as follows. The numerical model is described in Section 2, the numerical results are discussed in detail in Section 3, and finally, conclusions and recommendations are summarised in Section 4.

2. Numerical Method

Figure 1a,b show the computational domain for simulating the interaction between waves and OWC devices that oscillate in the horizontal and vertical directions, respectively. A coordinate system is defined with its origin located at the centre of the OWC on the still water surface level. The OWC includes a solid chamber structure and a volume of water that oscillates in the chamber. The vertical motion of the water column in the chamber drives the air flow through the turbine. In this study, we employed a linear turbine, where the pressure drop is a linear function of the flow rate through the turbine. Wells turbines are preferable turbines for harvesting wave energy through OWC devices, and it has been shown that the pressure drop and flow rate have a nearly linear relationship for a given rotating speed [44,45]. In this section, the wave model and aerodynamic model are described in Section 2.1 and Section 2.2, respectively.

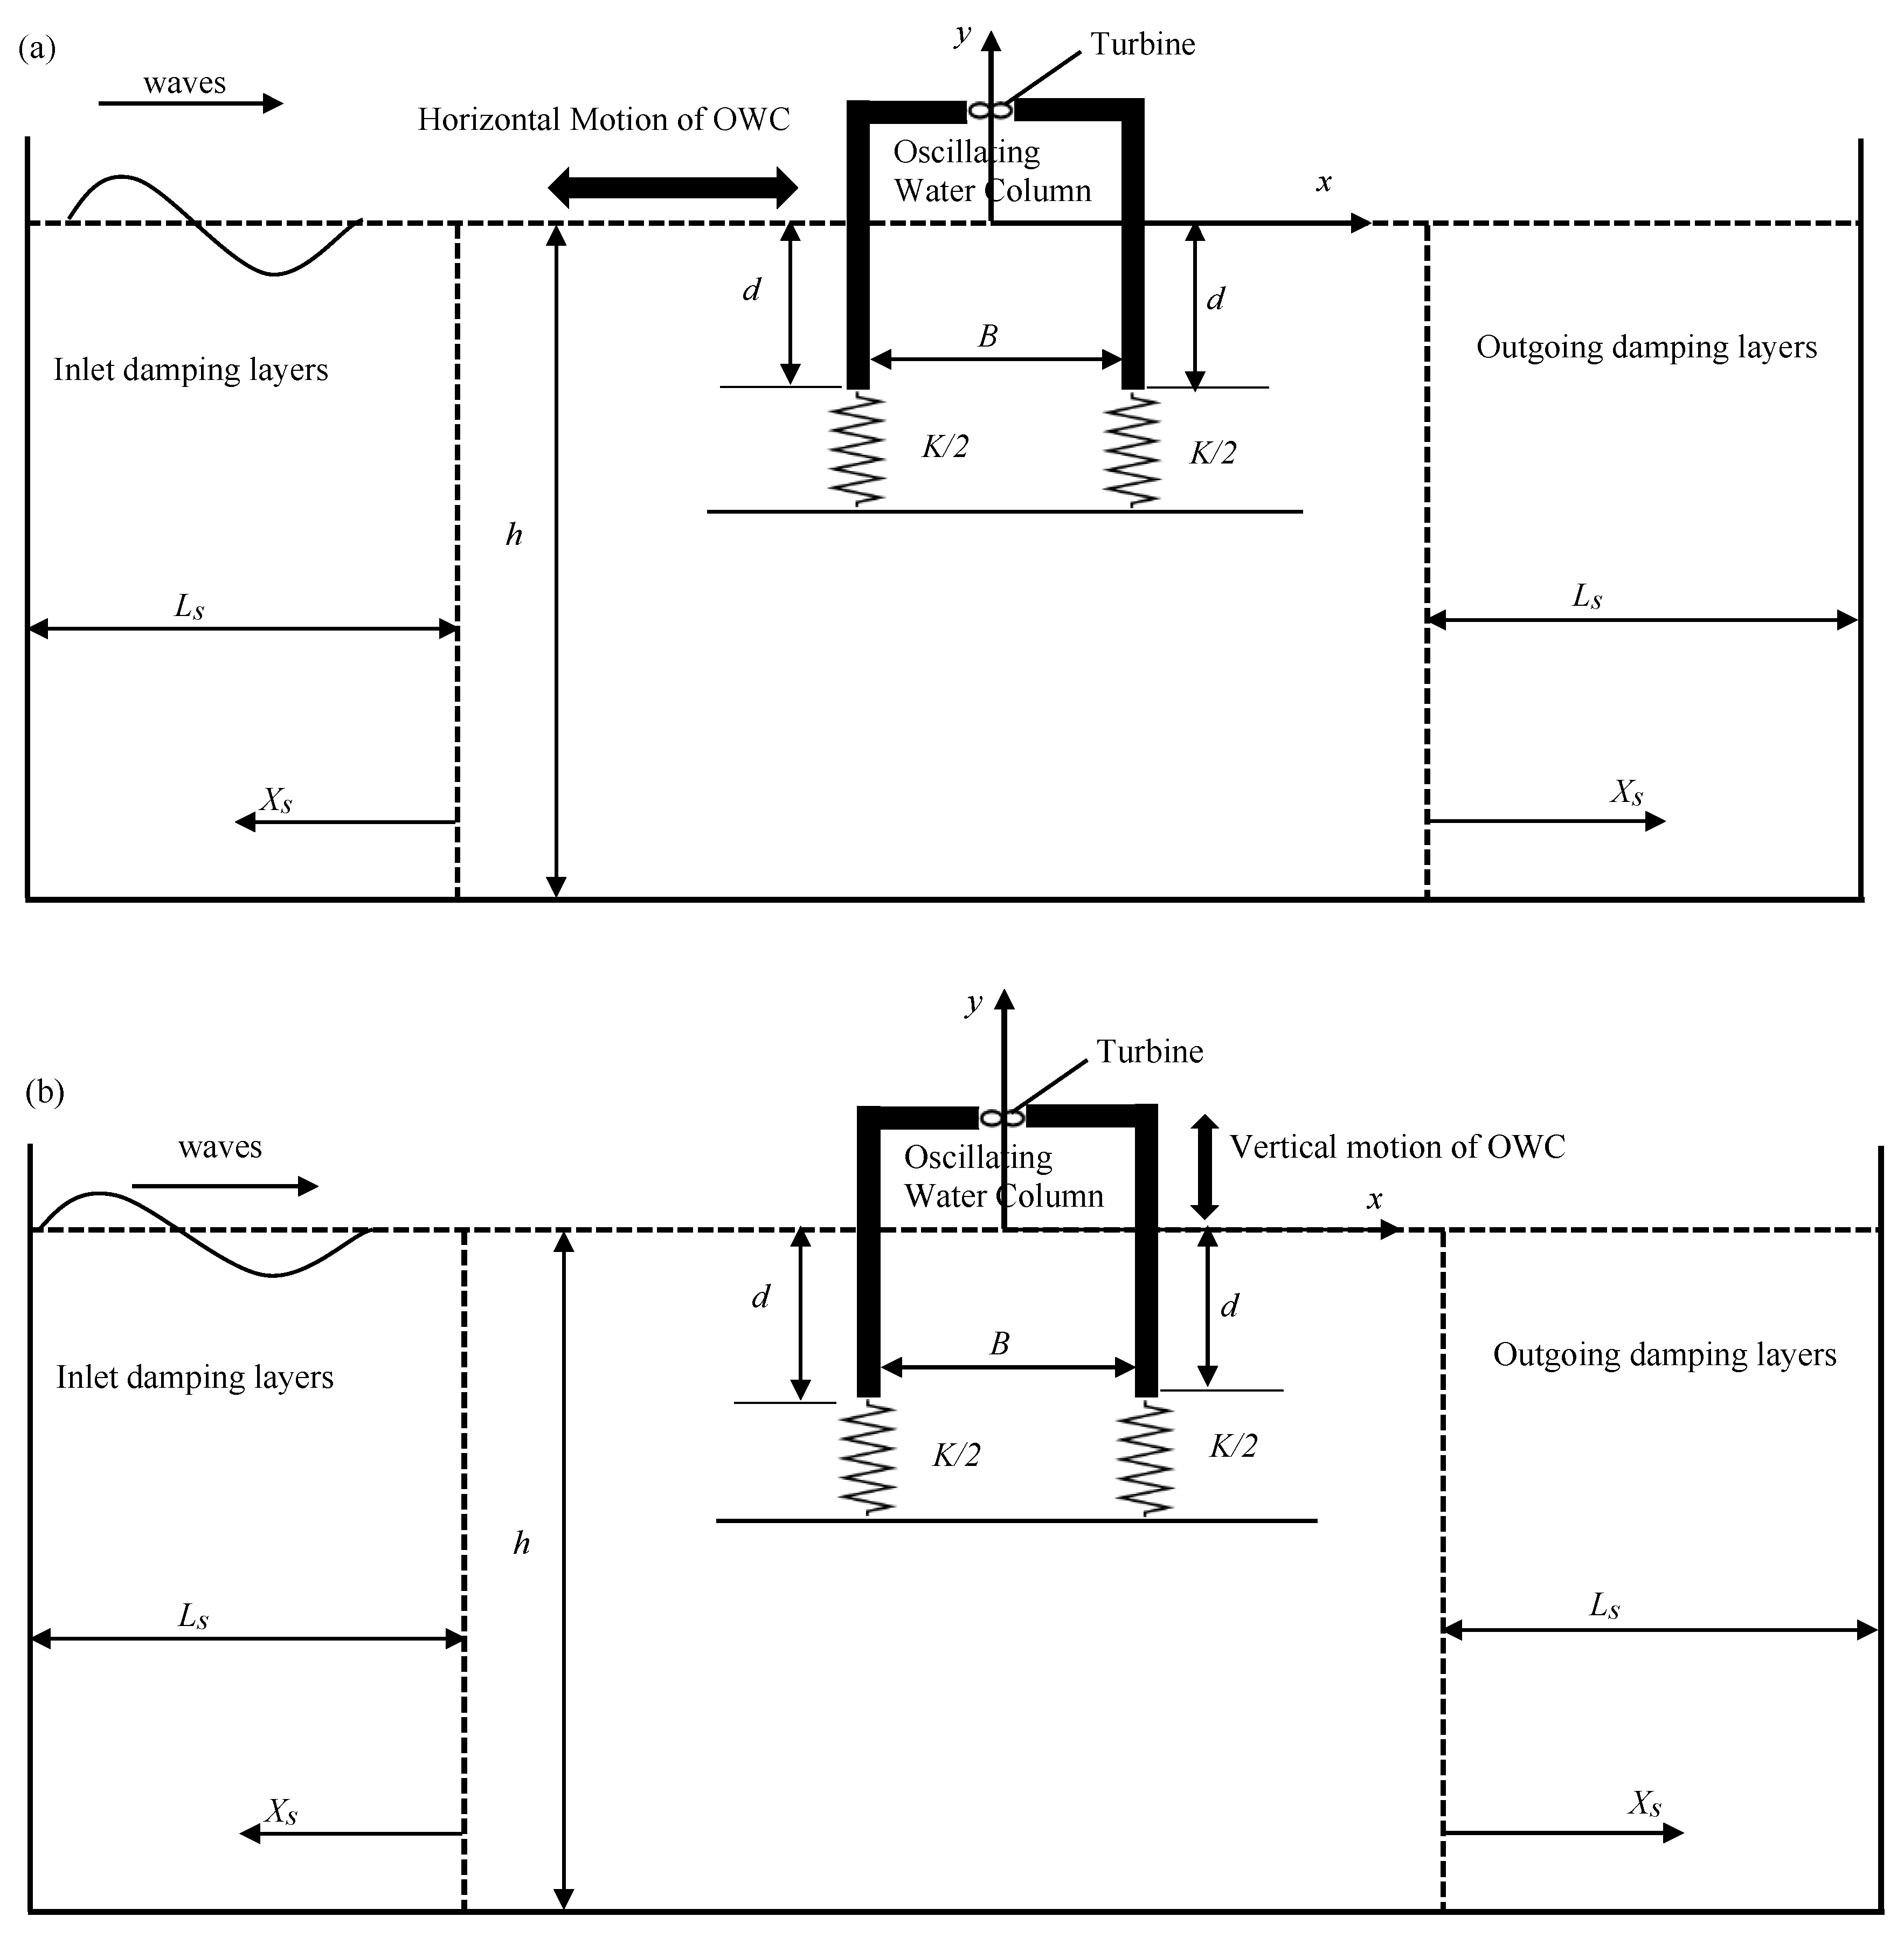
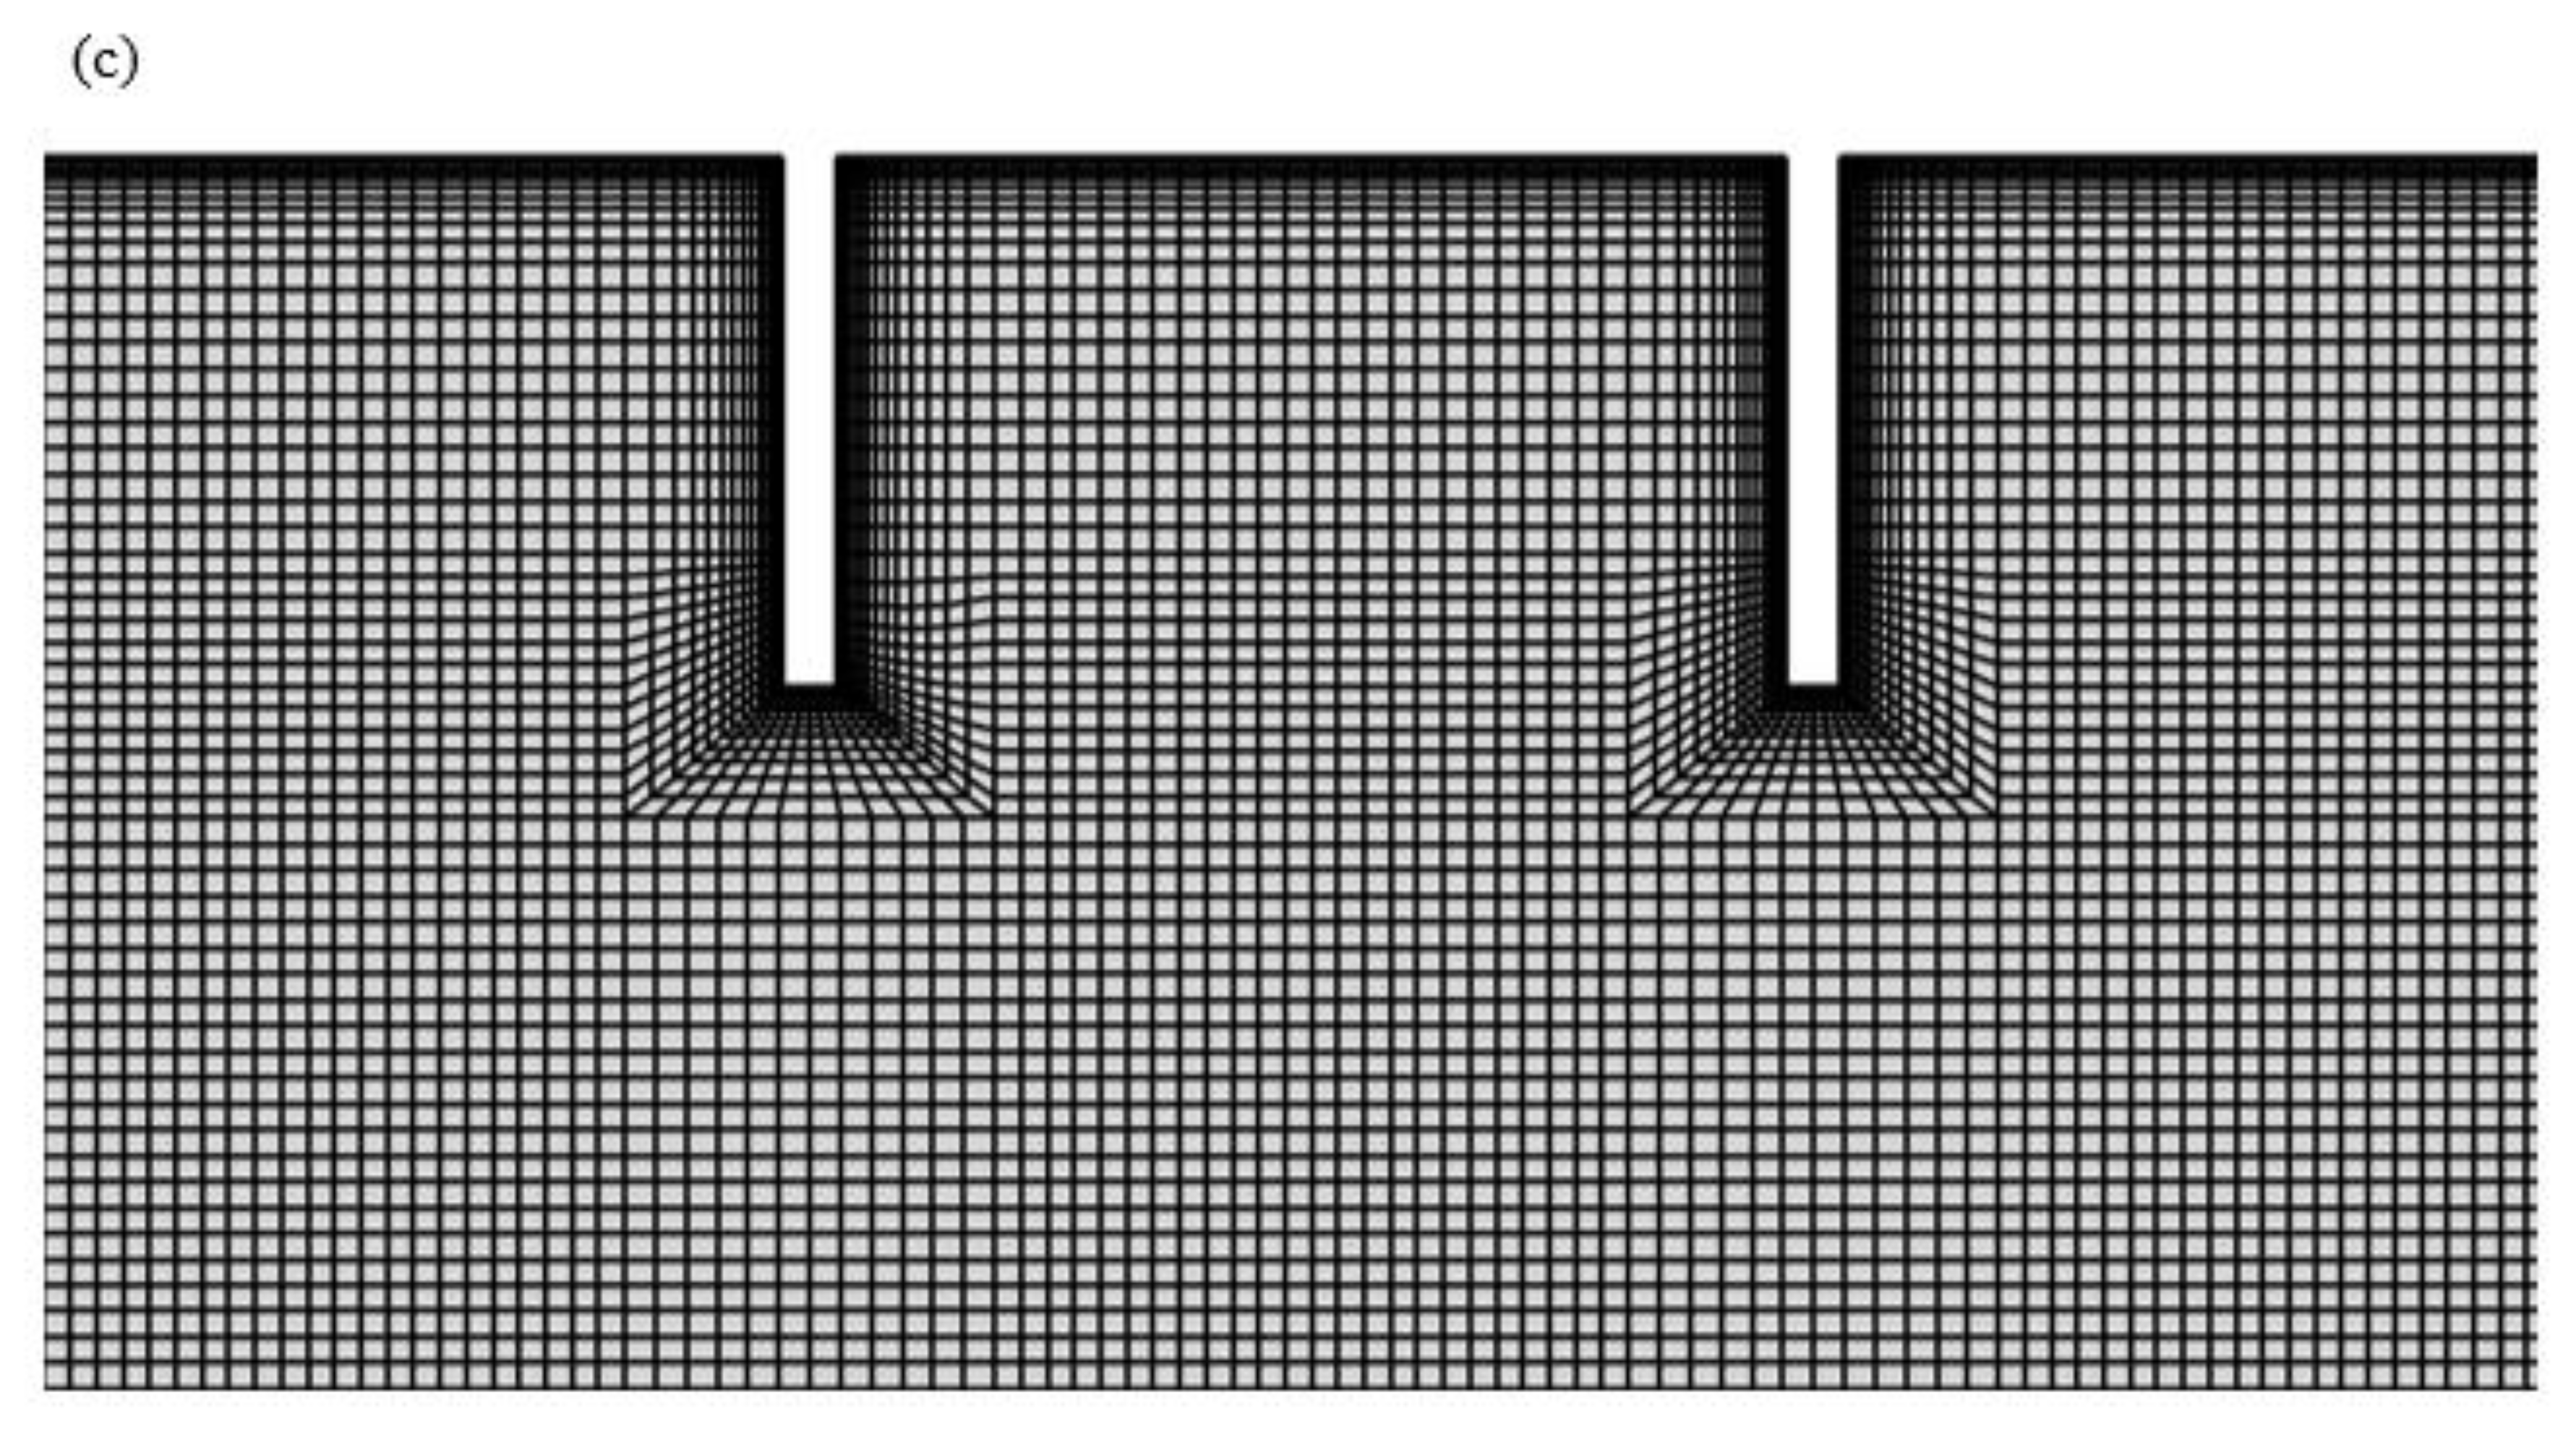
2.1. Computational Fluid Dynamic and Aerodynamic Wave Model

The numerical model used in this study is the same as the one used by Mia, et al. [46]. This section will present the models briefly and the details can be found in Mia, Zhao, Wu and Munir [46]. In the wave model, the Reynolds-Averaged Navier–Stokes (RANS) equations are solved using the Arbitrary Lagrangian–Eulerian (ALE) method, whose accuracy has been proved in wave simulations [47,48,49]. The Shear Stress Transport (SST) k-ω turbulence model, first established by Menter [50], is used to simulate the turbulence. This study solves the modified SST k-ω equations developed [51], which uses stress limiting to avoid an overprediction of turbulence levels under the waves, for forecasting turbulence viscosity. Regular waves are generated in the numerical simulation. The second order Stokes wave theory is used to compute the incoming wave surface elevation and water flow velocity on the inlet boundary, i.e., the left boundary in Figure 1. On the OWC walls and the bottom and right boundaries of the domain, non-slip boundary conditions are used. The wave surface motion equation solves the motion of the wave surface [52]. Outside the OWC chamber, the pressure on the wave surface is equal to the atmospheric pressure. The pressure on the wave surface inside the OWC chamber is correlated with the air volume of the OWC chamber and the air flow rate through the turbine using an aerodynamics model that considers the compressibility of the air. For the detailed formulae for the aerodynamics model calculating the air pressure in the chamber, please refer to [53] and [52]. The turbulent energy k = 0 on the wave surface, and the vertical gradient of the particular dissipation rate of turbulence is zero. Two damping layers on the left and right boundaries of the computational domain in Figure 1 are used to absorb the reflected and transmitted waves, respectively. In Figure 1, Ls and Xs are the length and distance from the starting point of the damping layers, respectively. The Petrov–Galerkin Finite Element Method (PG-FEM) code, originally developed by Zhao, et al. [54] and later extended for modelling waves, was utilised in this investigation to solve the RANS equations [47,49].
In two-dimensional simulations, the volume change rate of the OWC device V ˙ ( t ) is calculated by integrating the vertical water velocity (v) throughout the inner chamber’s length in the direction of wave propagation:
V ˙ ( t ) = W B v d x
where B denotes the inner chamber length, and W denotes the width of the chamber (in the wave crest direction), which in experimental studies corresponds to the width of the water flume. The width of the wave flume is unit width in this study because it uses a two-dimensional numerical simulation, or 1 m in the International System of Units (SI). Wells turbines, which can rotate in the same direction regardless of the direction of air flow [44,45,55,56,57], are the most popular type of air turbines. A linear relationship between the pressure drop and flow rate was used in numerical studies of OWCs with Wells turbines by Wiener, et al. [58]:
Q t ( t ) = p a ( t ) p a 0 K t
where pa (t) is the air pressure in the OWC chamber, pa0 is the atmospheric pressure, and Kt is the turbine coefficient. The instantaneous power generated by the turbine PT is:
P T ( t ) = Q t | p a ( t ) p a 0 |
The hydrodynamic efficiency ( ε ) is defined as:
ε = P ¯ T / P w
where P ¯ T is the time-averaged power harvested by the turbine, and Pw is the energy of the incoming waves calculated using the second order Stokes wave theory [59]:
P w = ρ g H i 2 16 ω k ( 1 + 2 k h sinh ( 2 k h ) ) W
where Hi is the incident wave height, ω is the angular frequency of the waves, k is the wave number, and h is the water depth.

2.2. Wave-Induced Heave and Horizontal Motion

Wave-induced motion is calculated by solving the equations of motion:
Y ¨ + 4 π ζ Y ˙ + 4 π f n 2 Y = F y
X ¨ + 4 π ζ X ˙ + 4 π f n 2 X = F x
where X , X ˙ , X ¨ and Y , Y ˙ , Y ¨ are the horizontal and vertical displacement, velocity, and acceleration of the OWC, respectively, fn is the natural frequency measured in a vacuum, ζ is the damping ratio, and F x ,   Fy are the fluid force in the horizontal and vertical direction. The natural frequency is related to the stiffness of the mounting spring as f n = 1 2 π K / m , where K and m are the stiffness of the mounting spring and the mass of the OWC structure, respectively. The vertical fluid force includes two components: the hydraulic force on the submerged walls of the OWC and the force on the ceiling of the OWC chamber caused by the air pressure.
Within each computational time step, the procedure of the OWC simulation is summarised as follows. The RANS equations and the SST k-ω equations are solved to obtain the velocity and pressure in the fluid domain. Then, the aerodynamics model is implemented to calculate the air pressure in the OWC chamber as the pressure boundary condition on the wave surface. Then, the wave surface elevation is updated by solving the wave surface equation and the equation of motion; Equations (6) and (7) are solved using the fourth-order Runge–Kutta method. Finally, the mesh is updated according to the updated wave surface profile and the displacement of the OWC.

3. Numerical Results

The performance of single chamber OWC devices was simulated with vertical and horizontal motion using the following parameters. In our previous study [52], we used the same parameters and the numerical model has been validated. The water depth (h) = 0.4 m, the wave height (Hi) = 0.04 m, the thickness of the OWC walls = 0.01 m, the draught of the front and rear walls is d = 0.1 m, i.e., d/h = 0.25, and the chamber length B = 0.18 m for both the vertical and horizontal motion of the OWC device. For a two-dimensional simulation, the width of the chambers is unit width, i.e., W = 1 m. The turbine coefficient is Kt = 3000 Pa·m−3·s except in Figure 2, where a series of turbine coefficients are studied. The computational mesh used in this study has the same density as the one used by Mia et al. [52], who conducted a systematic mesh dependency study to prove that the mesh was sufficiently dense for converged results. Figure 1c shows the computational mesh near the OWC. The mesh is refined near the water surface and the surface of the OWC walls. The mesh dependency study will not be repeated here.
In addition of the turbine coefficient Kt, the chamber width to wavelength ratio (B/L) has a significant impact on the performance of the OWC, where L is the wavelength. To determine the best Kt and B/L for the highest power, a stationary OWC device, without any motion, is first simulated, with a draught height d = 0.1 m, B/L in the range of 0.095   B L 0.318 , and 15 turbine coefficients. Figure 2 shows that, for all turbine coefficients, there is a consistent pattern in the variation of the efficiency with B/L. For all Kt values, the efficiency increases with an increase in B/L until they reach its maximum value. Further increase in the B/L results in a decrease in the efficiency. The maximum efficiency over the whole range of the B/L is defined as the best efficiency ( ε best ) for a particular turbine coefficient, as illustrated in Figure 2. (B/L)best is the value of B/L at which the best efficiency occurs. The best efficiency ε best is 0.215, and the best (B/L)best is 0.16 at the lowest Kt = 1000 Pa·m−3·s. The best efficiency ε best is 0.069, and (B/L)best is reduced to 0.095, when the turbine coefficient is increased to 36,000 Pa·m−3·s. By using a trial-and-error method, it was discovered that the turbine coefficient Kt = 3000 Pa·m−3·s has a maximum ε best , that occurs at B/L = 0.16.
When an elastically supported OWC is investigated, the frequency ratio is defined as the ratio of the natural frequency of the system to the wave frequency, i.e., R f = f n / f w , where f w is the wave frequency. The OWC is allowed to move in one-degree-of-freedom in either the horizontal or vertical direction. Simulations are conducted for natural frequencies ratio ( R f ) in the range between 1 and 10. An elastically mounted OWC device is simulated for turbine coefficients: Kt = 3000 Pa·m−3·s and d/h = 0.25 for the horizontal and vertical motion of the OWC chamber at m = 2 and 3. Kt = 3000 Pa·m−3·s has the best performance for a fixed OWC as discussed in above.
Figure 3 shows the variation of the energy extraction efficiency versus B/L for nine various frequency ratios ( R f ). Figure 3a,b show the variation of the efficiency ε with the B / L for m = 2 for the horizontal and vertical motion OWCs, respectively, and Figure 3c,d show the corresponding cases for m = 3. The numerical outcomes demonstrate a consistent pattern of the variation of efficiency with B/L for both mass ratios m = 2 and 3, although the frequency ratio has a considerable impact on ε best . The best efficiency for m = 2 at the horizontal motion is found at B/L = 0.159 and R f = 1, and the best efficiency for m = 2 at the vertical motion is found at B/L = 0.159 and R f = 10. In Figure 3a, the maximum hydraulic efficiency of the horizontal motion at m = 2 is 0.291 found at B/L = 0.159 and R f   = 1, and in Figure 3b, the maximum hydraulic efficiency of vertical (m = 2) is 0.270, found at B/L = 0.159 and   R f = 10, and which is 7.52% greater than that in the case of horizontal motion (m = 2). The maximum efficiency occurs at the lowest frequency ratio of R f   = 1 for the horizontal motion but at the highest frequency ratio of R f   = 10 for the vertical motion. In Figure 3c, the maximum hydraulic efficiency of the horizontal motion at m = 3 is 0.292 found at B/L = 0.159 and R f   = 1, and in Figure 3d, the maximum hydraulic efficiency of the vertical motion (m = 3) is 0.266 found at B/L = 0.143 and R f = 10. The maximum efficiency at m = 3 for the horizontal motion is 9.77% greater than that in the case of the vertical motion.
It can be seen in Figure 3a,c that in the range of 2 R f 10 , the variation trend of energy with the B / L does not significantly change with the change of R f , with the best performance of the OWC being achieved at the smallest frequency ratio of 1. The effect of R f on the efficiency of the vertically oscillatory OWC is very small, in the range of 3 R f 10 . Figure 3b,d show a similar trend for the heave motion as was found in [34]. However, the efficiency reduces with the decrease of R f , with a big rate as R f   < 3. Increasing the mass ratio from 2 to 3 does not result in a significant change in efficiency. The variations of ε with B/L at m = 2 in Figure 3a,b at every R f are very similar to those at m = 3 in Figure 3c,d, respectively.
When 0.095 B / L 0.16 , the best efficiency ε best increases with the increase of B / L by a very big rate. When B/L > 0.16, the efficiency decreases with an increase of B / L by a very big rate as seen in Figure 3a–d. The best efficiency at R f = 1 is 12% greater than that at R f = 10 for m = 2 if the OWC oscillates horizontally. However, if the OWC oscillates vertically, the best efficiency at R f = 1 is significantly reduced by 74% of the best efficiency at R f =10 for m = 2. From the above discussion, it is concluded that at both mass ratios, with R f = 1 and 1.5, the horizontal motion of OWCs improves the efficiency slightly but that the vertical motion reduces the efficiency significantly.
Figure 4a–d display the variation of the air pressure amplitude in the OWC chamber, with B/L for Kt = 3000 Pa·m−3·s. Figure 5a–d show the variations of the amplitude of the oscillatory air volume of the OWC chamber with B/L for the same cases for Figure 4. The non-dimensional amplitude of air pressure is defined as p * = ( p max p min ) / ρ g H i , where p max and p min are the maximum and minimum air pressure in the OWC chamber within one wave period, respectively. The amplitude of the air volume is defined as V * = ( V max V min ) / B W H i , where V max and V min are the maximum and minimum air volume in the OWC chamber within one wave period, respectively. It can be seen from Figure 4a,c that the horizontal motion does not affect the variation of the amplitude of air pressure with B/L much. On the other hand, as shown in Figure 4b,d, the vertical motion of the OWC has a huge impact on the air pressure at the frequency ratios R f = 1 and 1.5, and the pressure is increased with an increase of the frequency ratio for the vertical motion.
For vertical motion, with R f 1 and m = 2 and 3, both p * and V * increase with the increase of R f and reach their maximum values at very similar values of B/L. When the R f is greater than 1 for the vertical motion, both p * and V * continue increasing with the increase of R f in Figure 4, so does the efficiency, as shown in Figure 3. It can be seen in Figure 3, Figure 4 and Figure 5 that for a specific R f , the maximum efficiency, the maximum p * , and the maximum V * do not occur at a same value of B/L.
Figure 6a–d show the variation of the non-dimensional oscillatory amplitude for the horizontal (AX/Ai) and vertical motion (AY/Ai) of OWCs, where AX,AY and Ai are the oscillatory amplitudes in the x- and y-directions, respectively, and Ai = Hi/2 is the incoming wave amplitude. It is shown that at the highest frequency ratio ( R f = 10), the non-dimensional oscillatory amplitude is almost zero. For both the horizontal and vertical OWC oscillation, the non-dimensional oscillatory amplitude increases with the reduction of R f . Figure 7a–d show the variation of the non-dimensional water surface elevation at the centre of the OWC chamber for both the horizonal and vertical oscillation. The non-dimensional wave surface in the centre of a chamber is defined as η * = η max η min H i , where η max and η min are the maximum and minimum values of the surface elevation of the chamber, respectively. In Figure 7a,c, the frequency ratio R f does not have much effect on the surface elevation at the OWC chamber for all frequency ratios ( R f ) for the horizontal motions of OWCs at two different mass ratios (m). It is noted that the gauge may not be fixed at the OWC chamber, as the OWC moves horizontally. Figure 7b,d show that R f has a significant effect on the wave surface elevation for the vertical oscillation of the OWC.
If the OWC oscillates vertically, the phase difference between the vertical motions of the OWC and the water surface motion, which is defined as φ, affects the volume change and the efficiency. Figure 8 shows the variation of the phase difference φ with B/L for Kt = 3000 Pa·m−3·s for the vertical motion of the OWC device. The value of φ is found to continuously increase with the increase of R f until R f = 10 for the vertical motion of OWC device. Both AY and η* increase if R f decreases, but the largest amplitudes of oscillation and wave surface elevation at R f = 0 produce the smallest power, as shown in Figure 3, because the very small phase φ difference between them creates a very small change in the OWC volume or air flow rate. With the increase of R f , the increase in φ is in favour of power generation, but the decreases in A Y and η* cause the reduction in power generation. The combination effects of φ , A Y , and η* make the maximum best efficiency occurring at R f = 10, Kt = 3000 Pa·m−3·s, and d/h = 0.25.
From the explanation above, it is further established that a mounting system’s natural frequency must be sufficiently high to provide high efficiency for the vertical motion. When the OWC moves vertically with a very soft mounting system, the OWC motion and wave surface elevation have big amplitudes, but the efficiency is low. However, the horizontal motion shows opposite results, and a soft mounting system (small R f ) provides a slightly higher efficiency as shown in Figure 3a,c.
The performance of the OWC is significantly impacted by the water’s viscosity [26,60,61,62,63,64]. Vortices that are generated as water flows past the vertical walls’ edges contribute to the loss of energy. Figure 9 shows the contours of vorticity and streamlines at four instants for Kt = 3000 Pa·m−3·s, R f = 1, and B/L = 0.159 at the horizontal motion of the OWC device. The vorticity ω z is defined as ω z = v / x u / y . Near the bottom of each wall, two vortices with opposing directions are generated by water flowing both into and out of the OWC chamber at the highest velocities in Figure 9. The vortices are found to be in pairs, and pairs near the positive x-side wall are stronger than those near the negative x-side wall. A new pair of vortices forms when each pair of vortices moves away and dissipates. Figure 10 shows the contours of vorticity for the vertical motion of the OWC device under the same parameters for Figure 9, except R f = 10. By observation, the vortices in Figure 10 appear to have stronger vortices than that in Figure 9.

4. Conclusions

The impacts of the natural frequency of an elastically supported floating OWC device on its hydrodynamic efficiency are numerically evaluated using two-dimensional simulations. We examined floating OWC devices with natural-to-wave frequency ratios between R f = 1 and 10. The simulations were conducted for h = 0.4 m, Hi = 0.04 m, B = 0.18 m, Kt = 3000 Pa·m−3·s, d/h = 0.25, and two mass ratios (m = 2 and 3). A wide range of B/L values were simulated for each value of the frequency ratio ( R f ), and the best efficiency and the B/L where the highest efficiency occurs were defined. First, 15 values of Kt in the range of 1000 Pa·m−3·s to 36,000 Pa·m−3·s were simulated for a fixed OWC, and it was found that the Kt = 3000 Pa·m−3·s had the greatest performance.
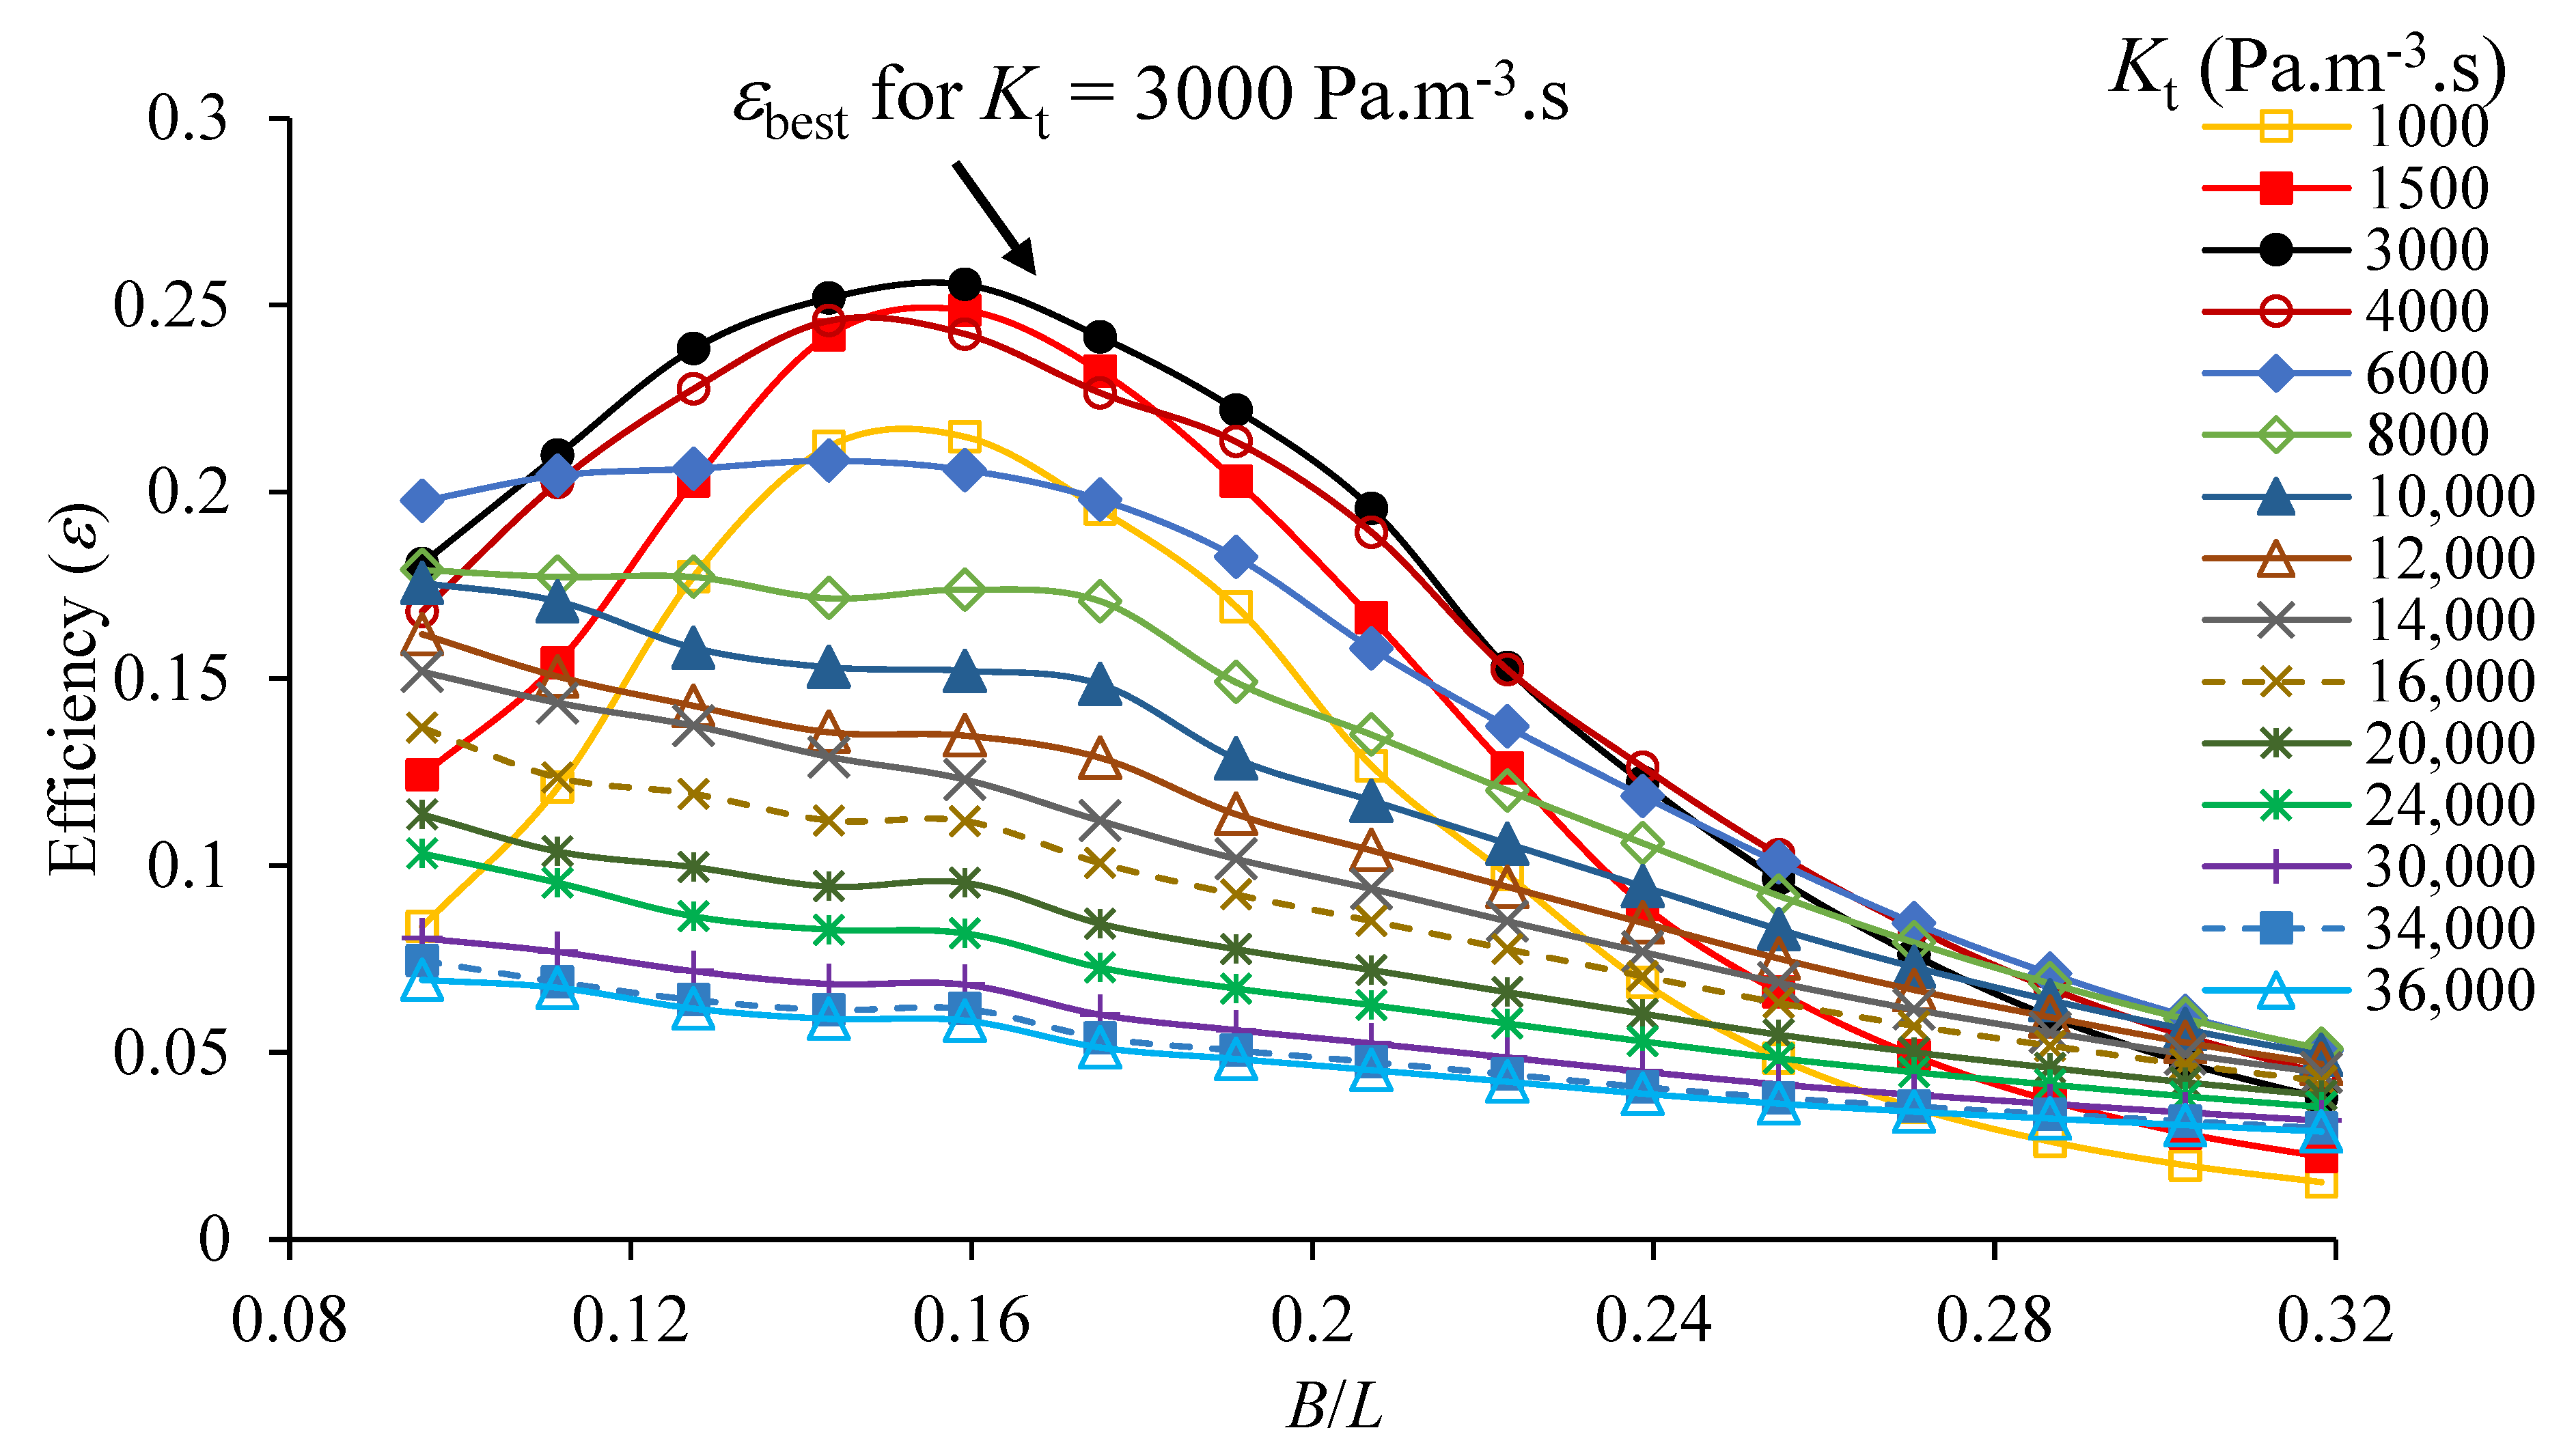
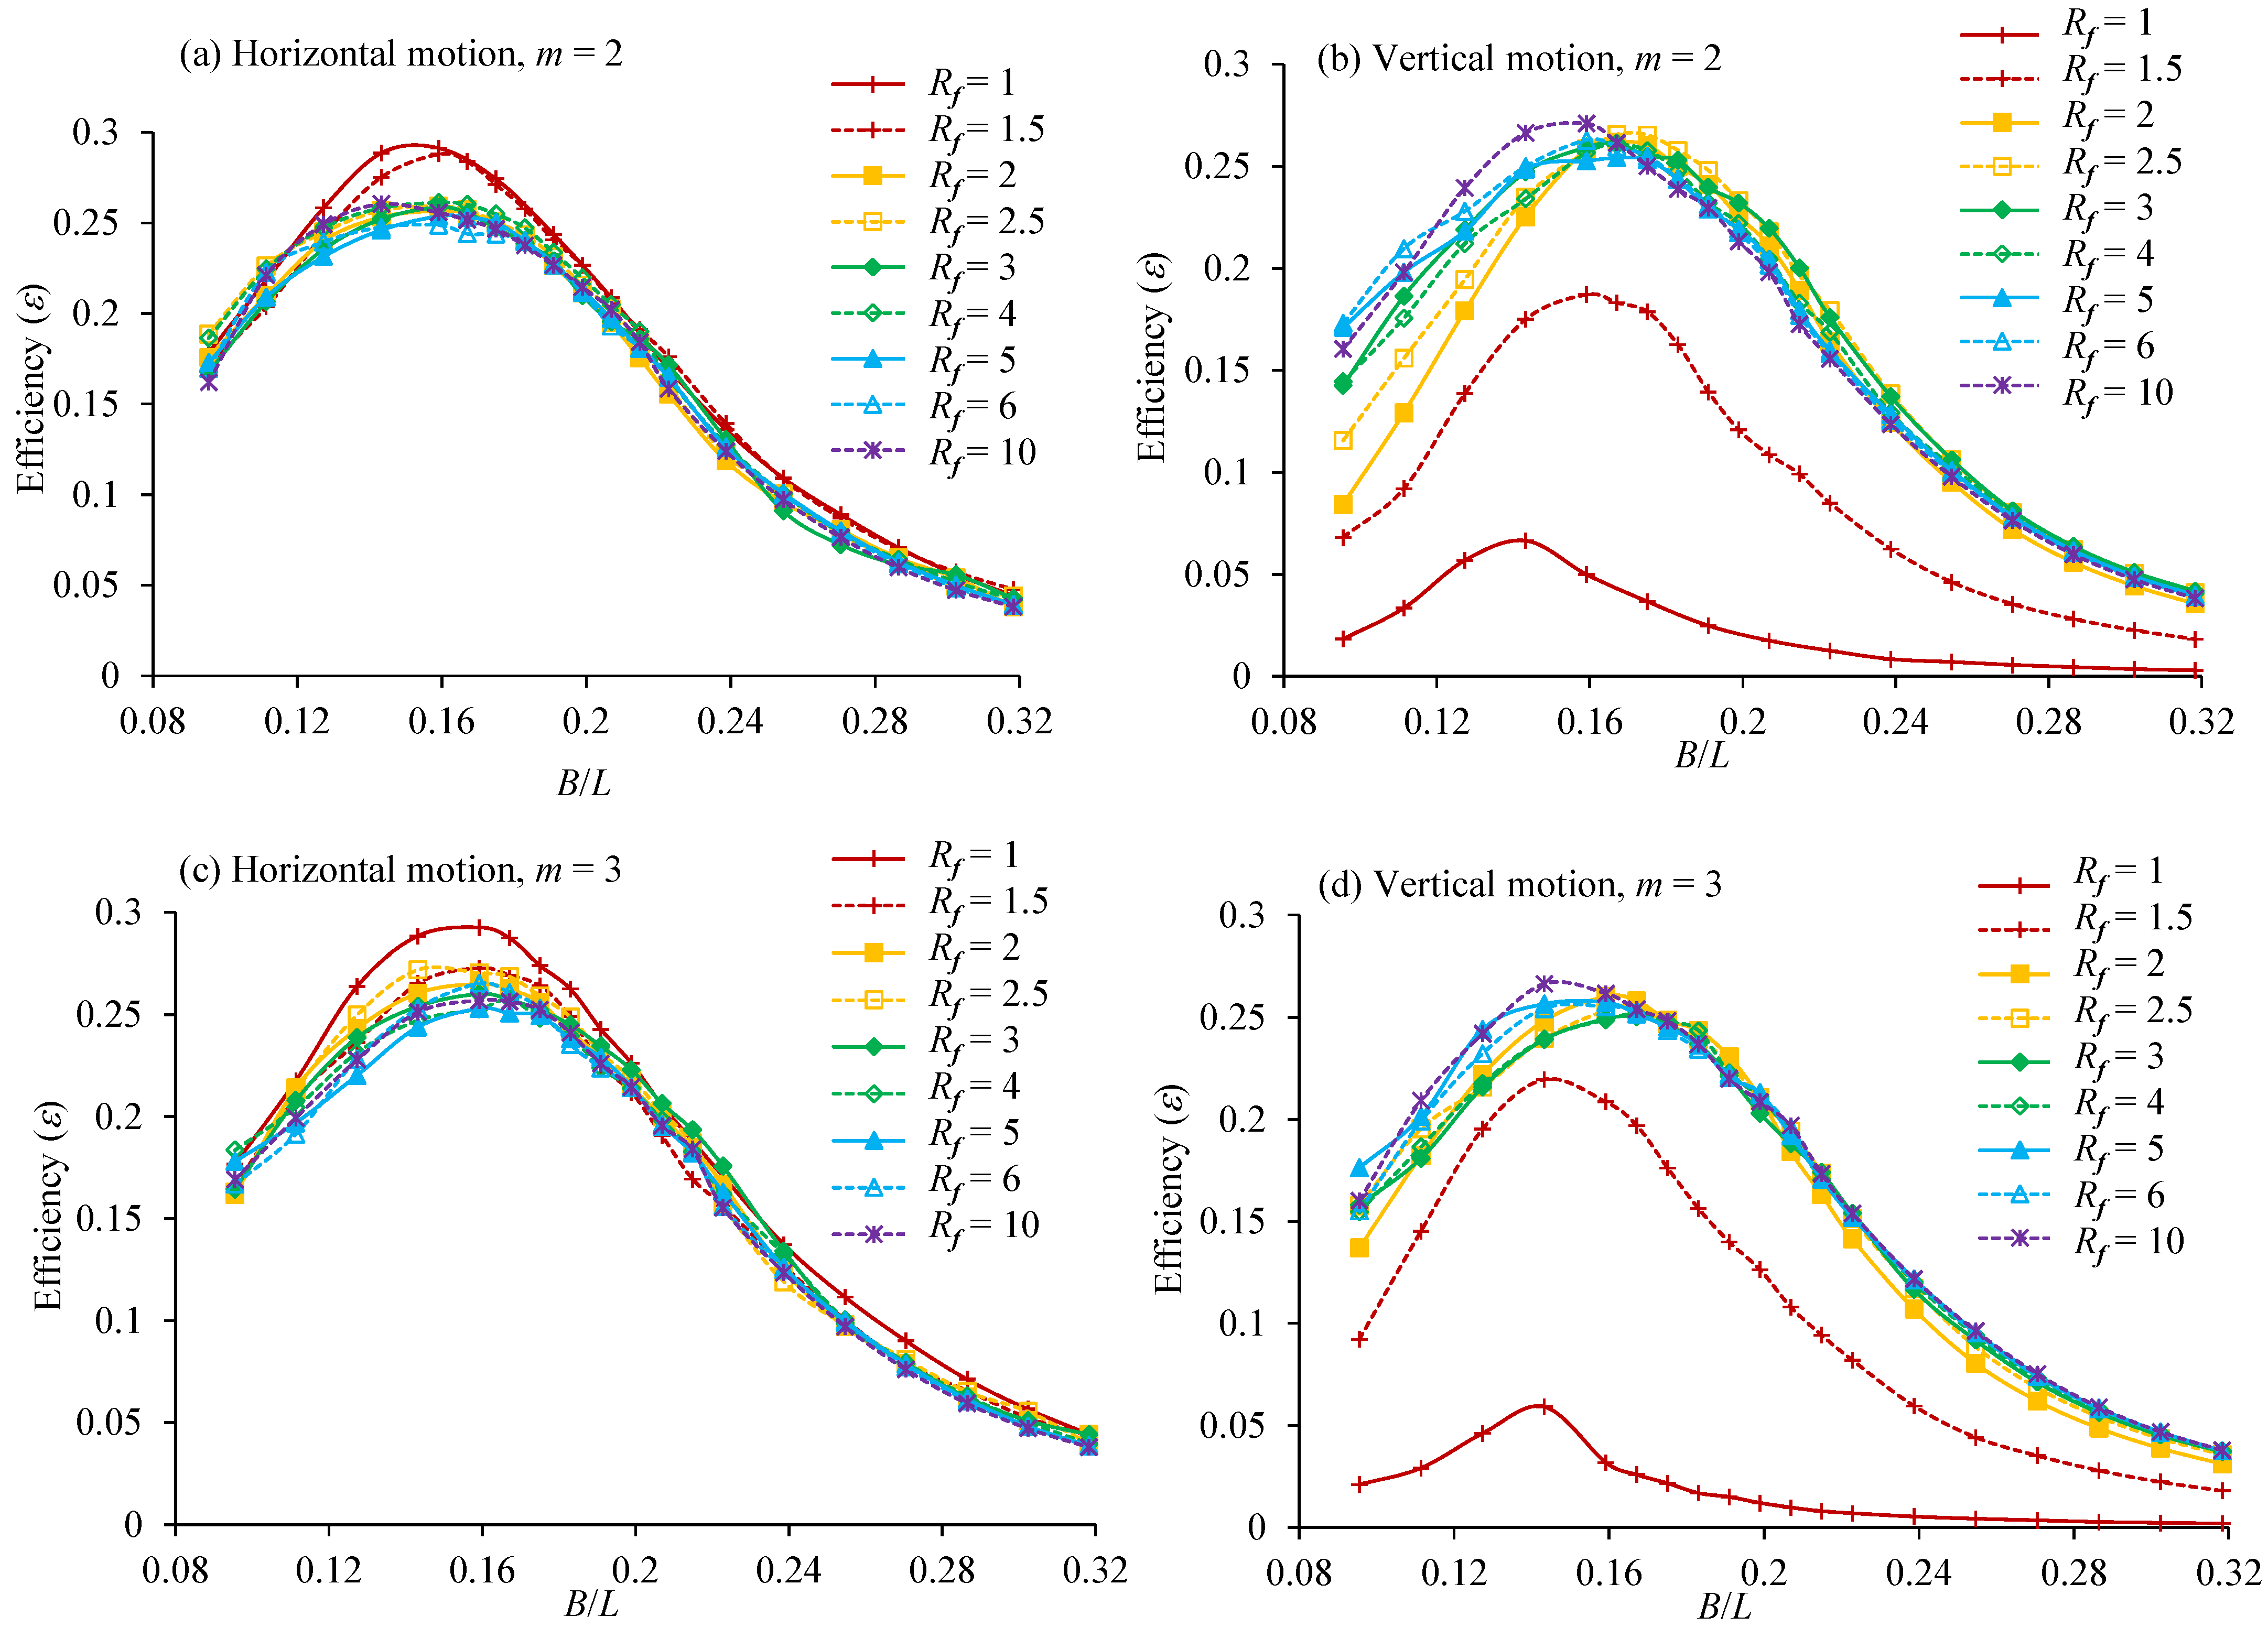
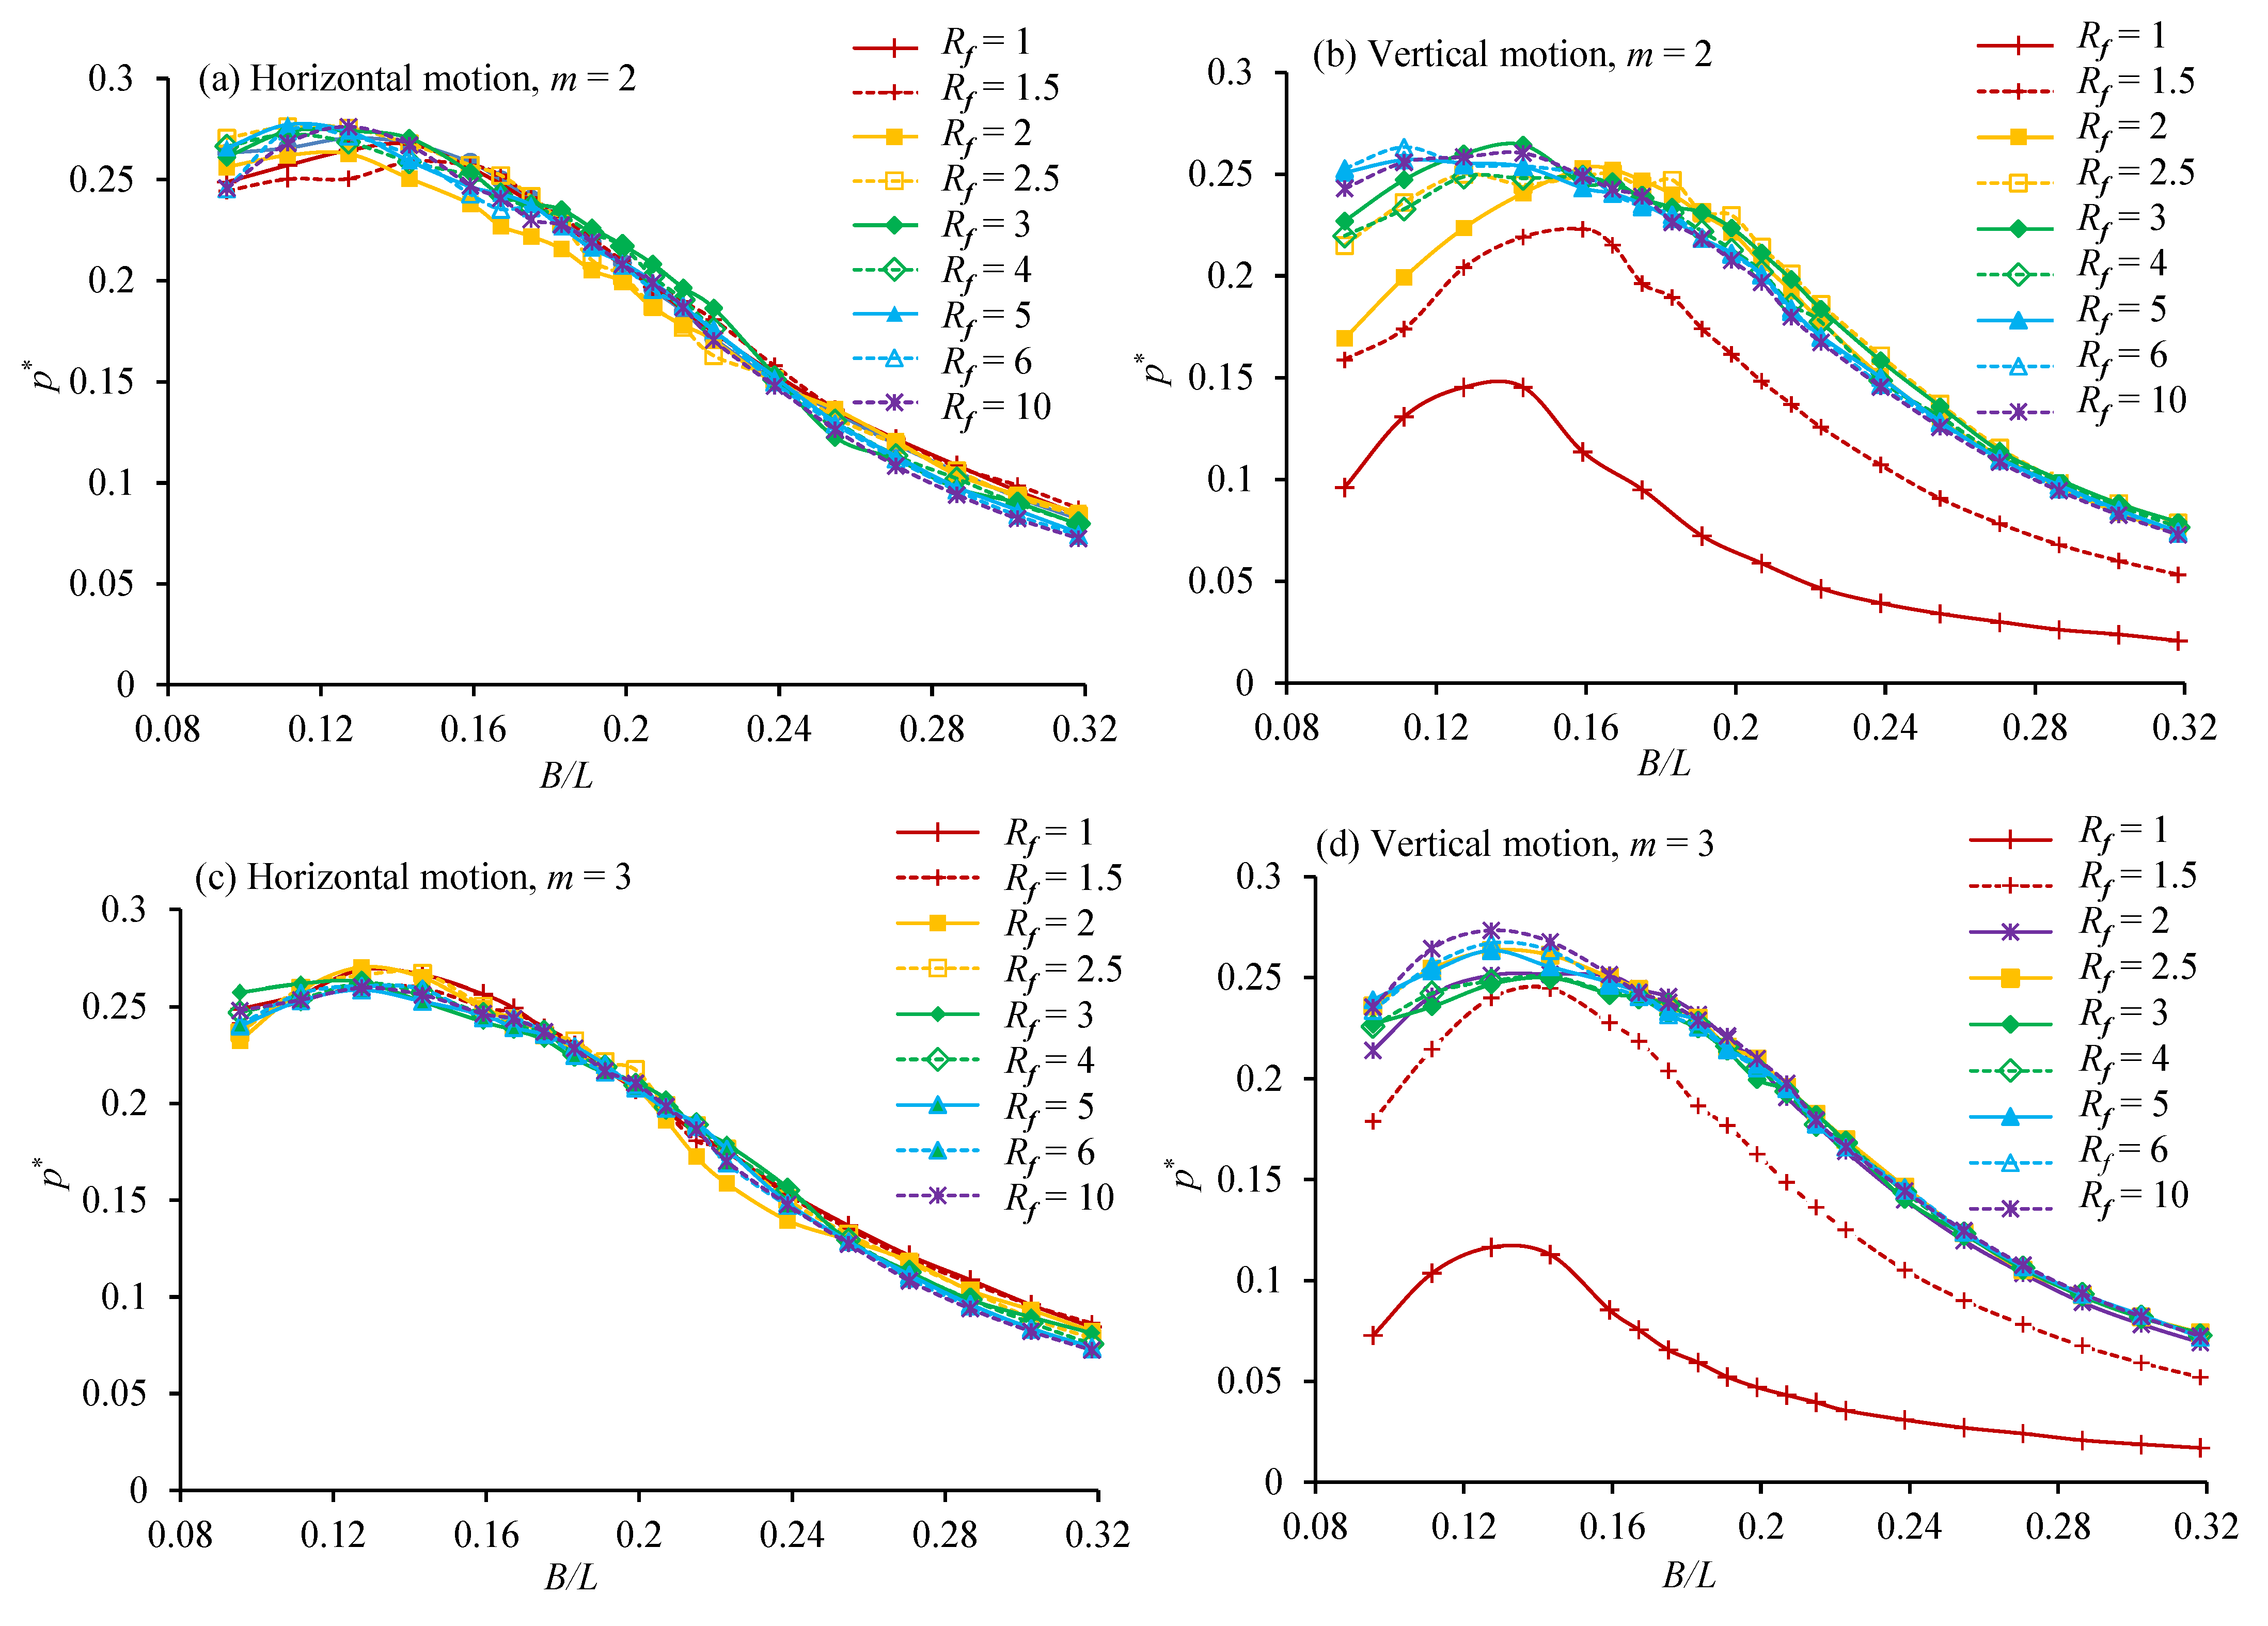
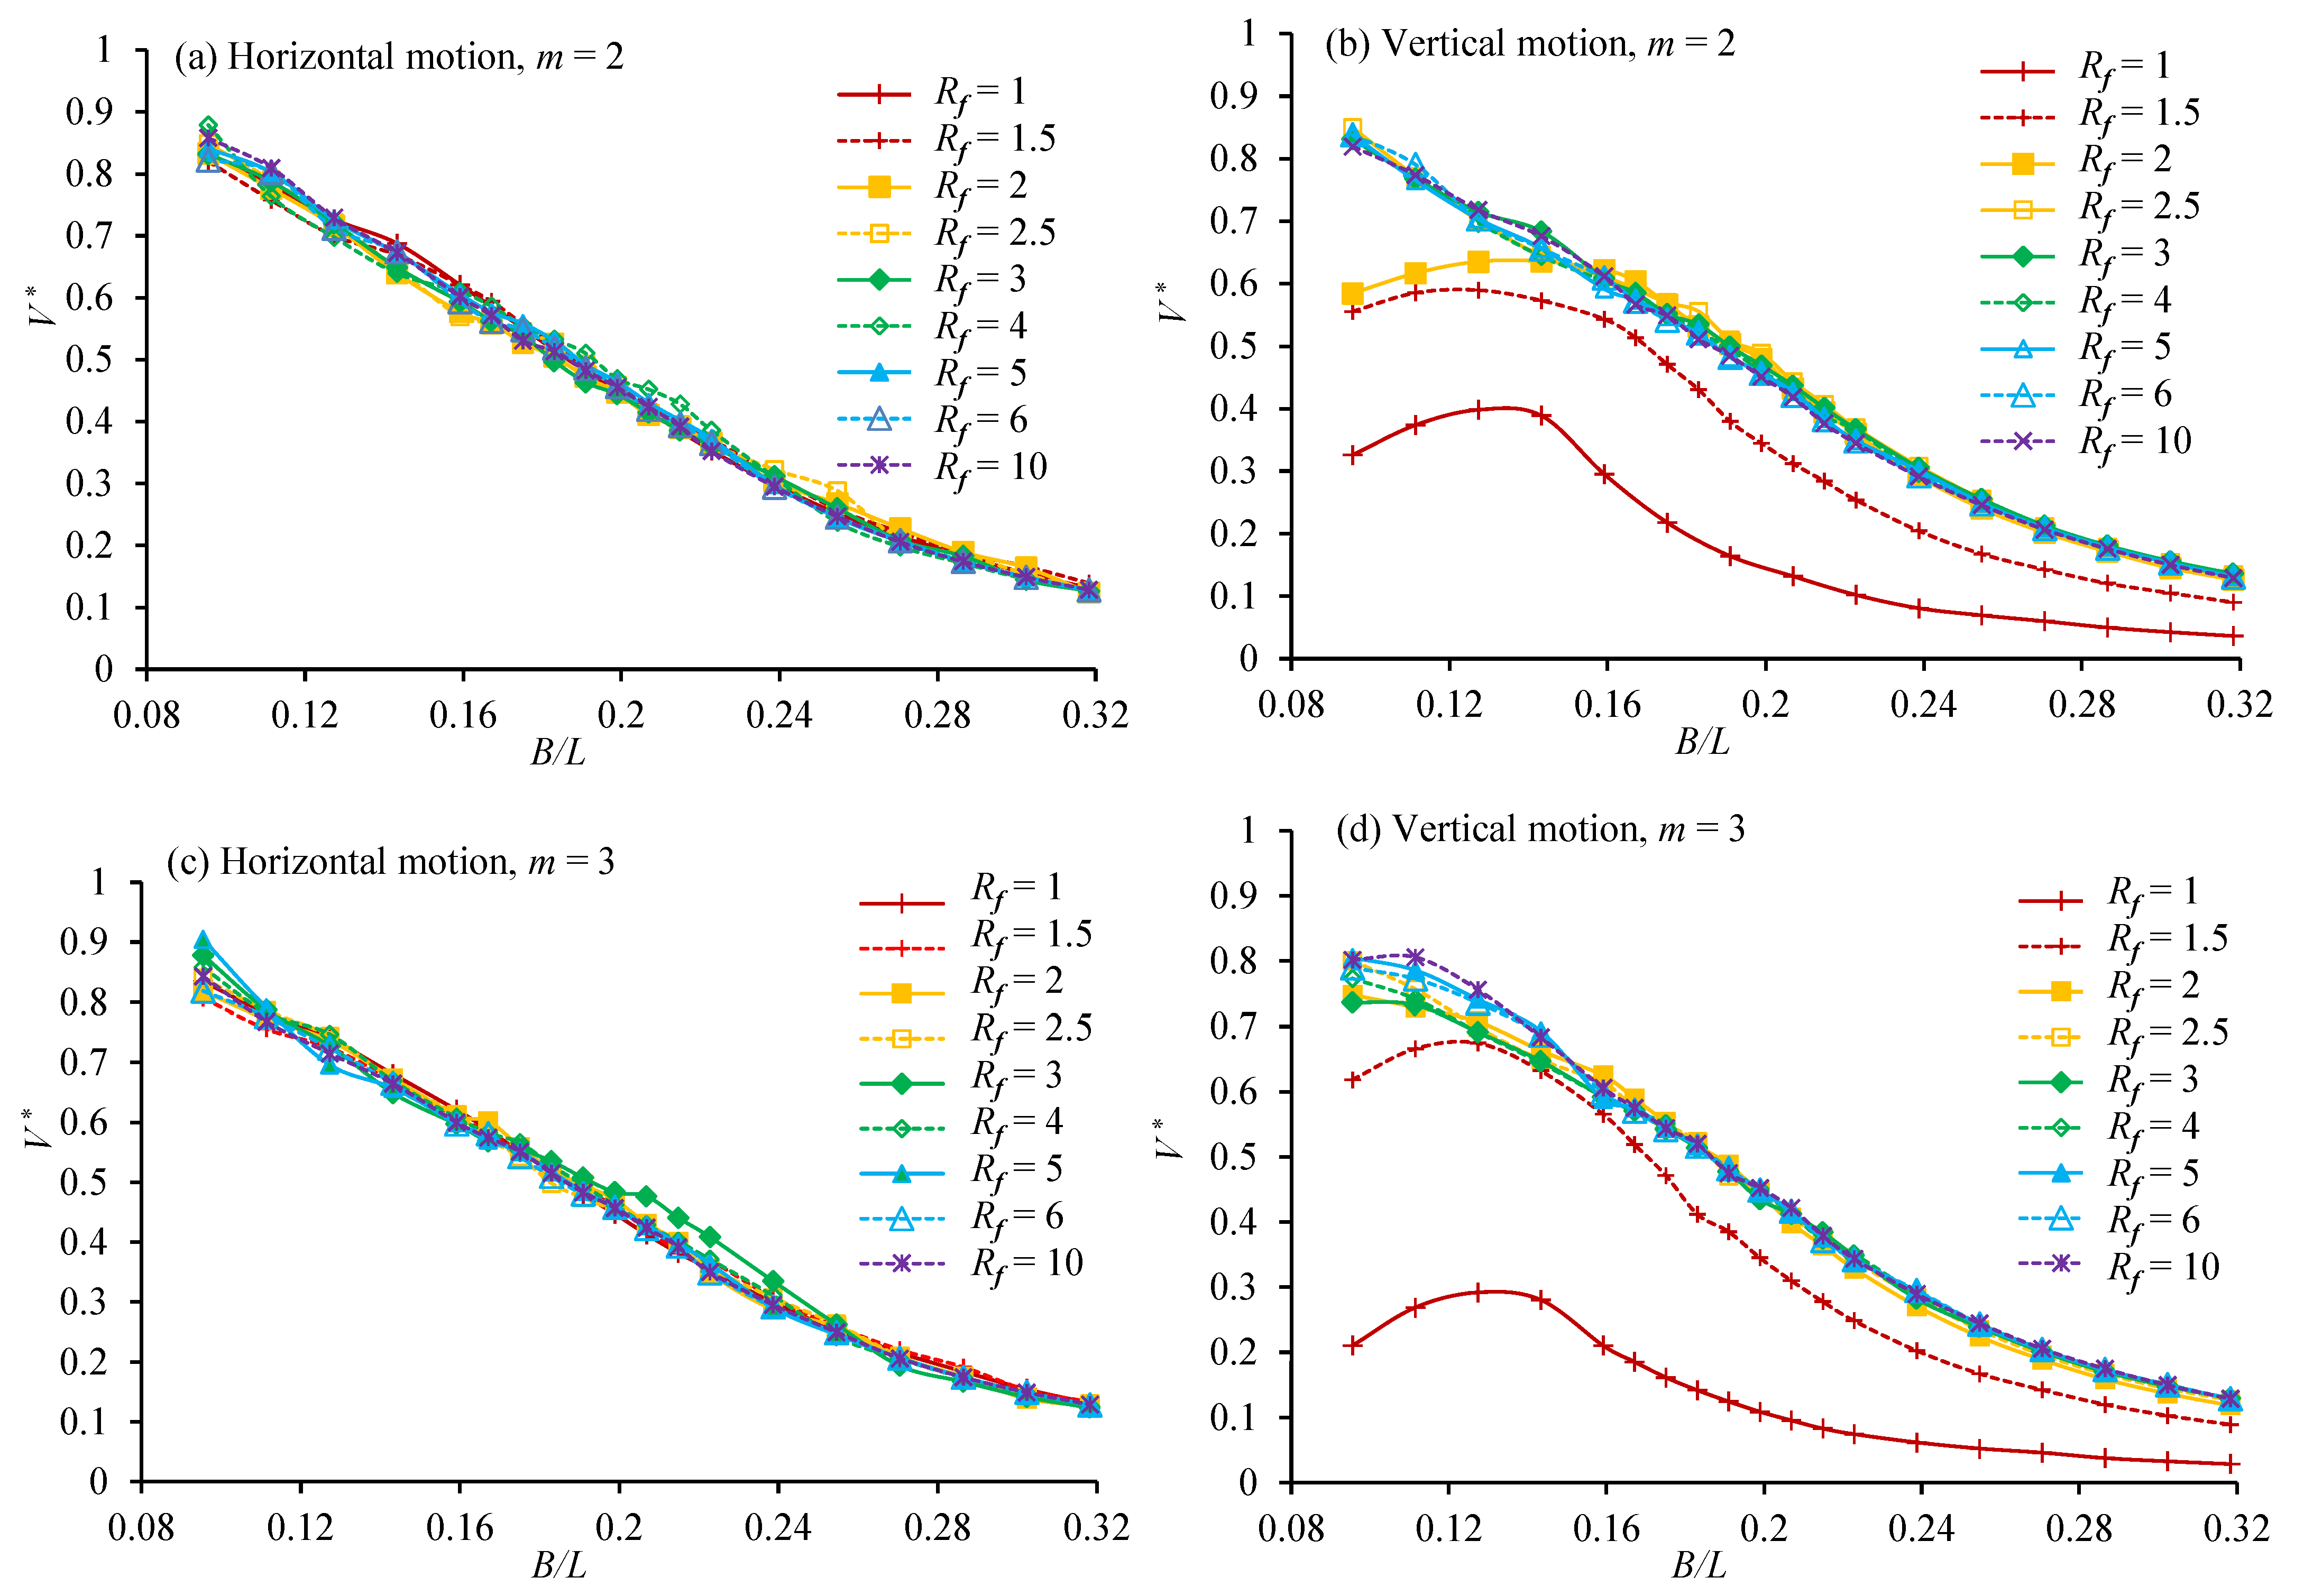
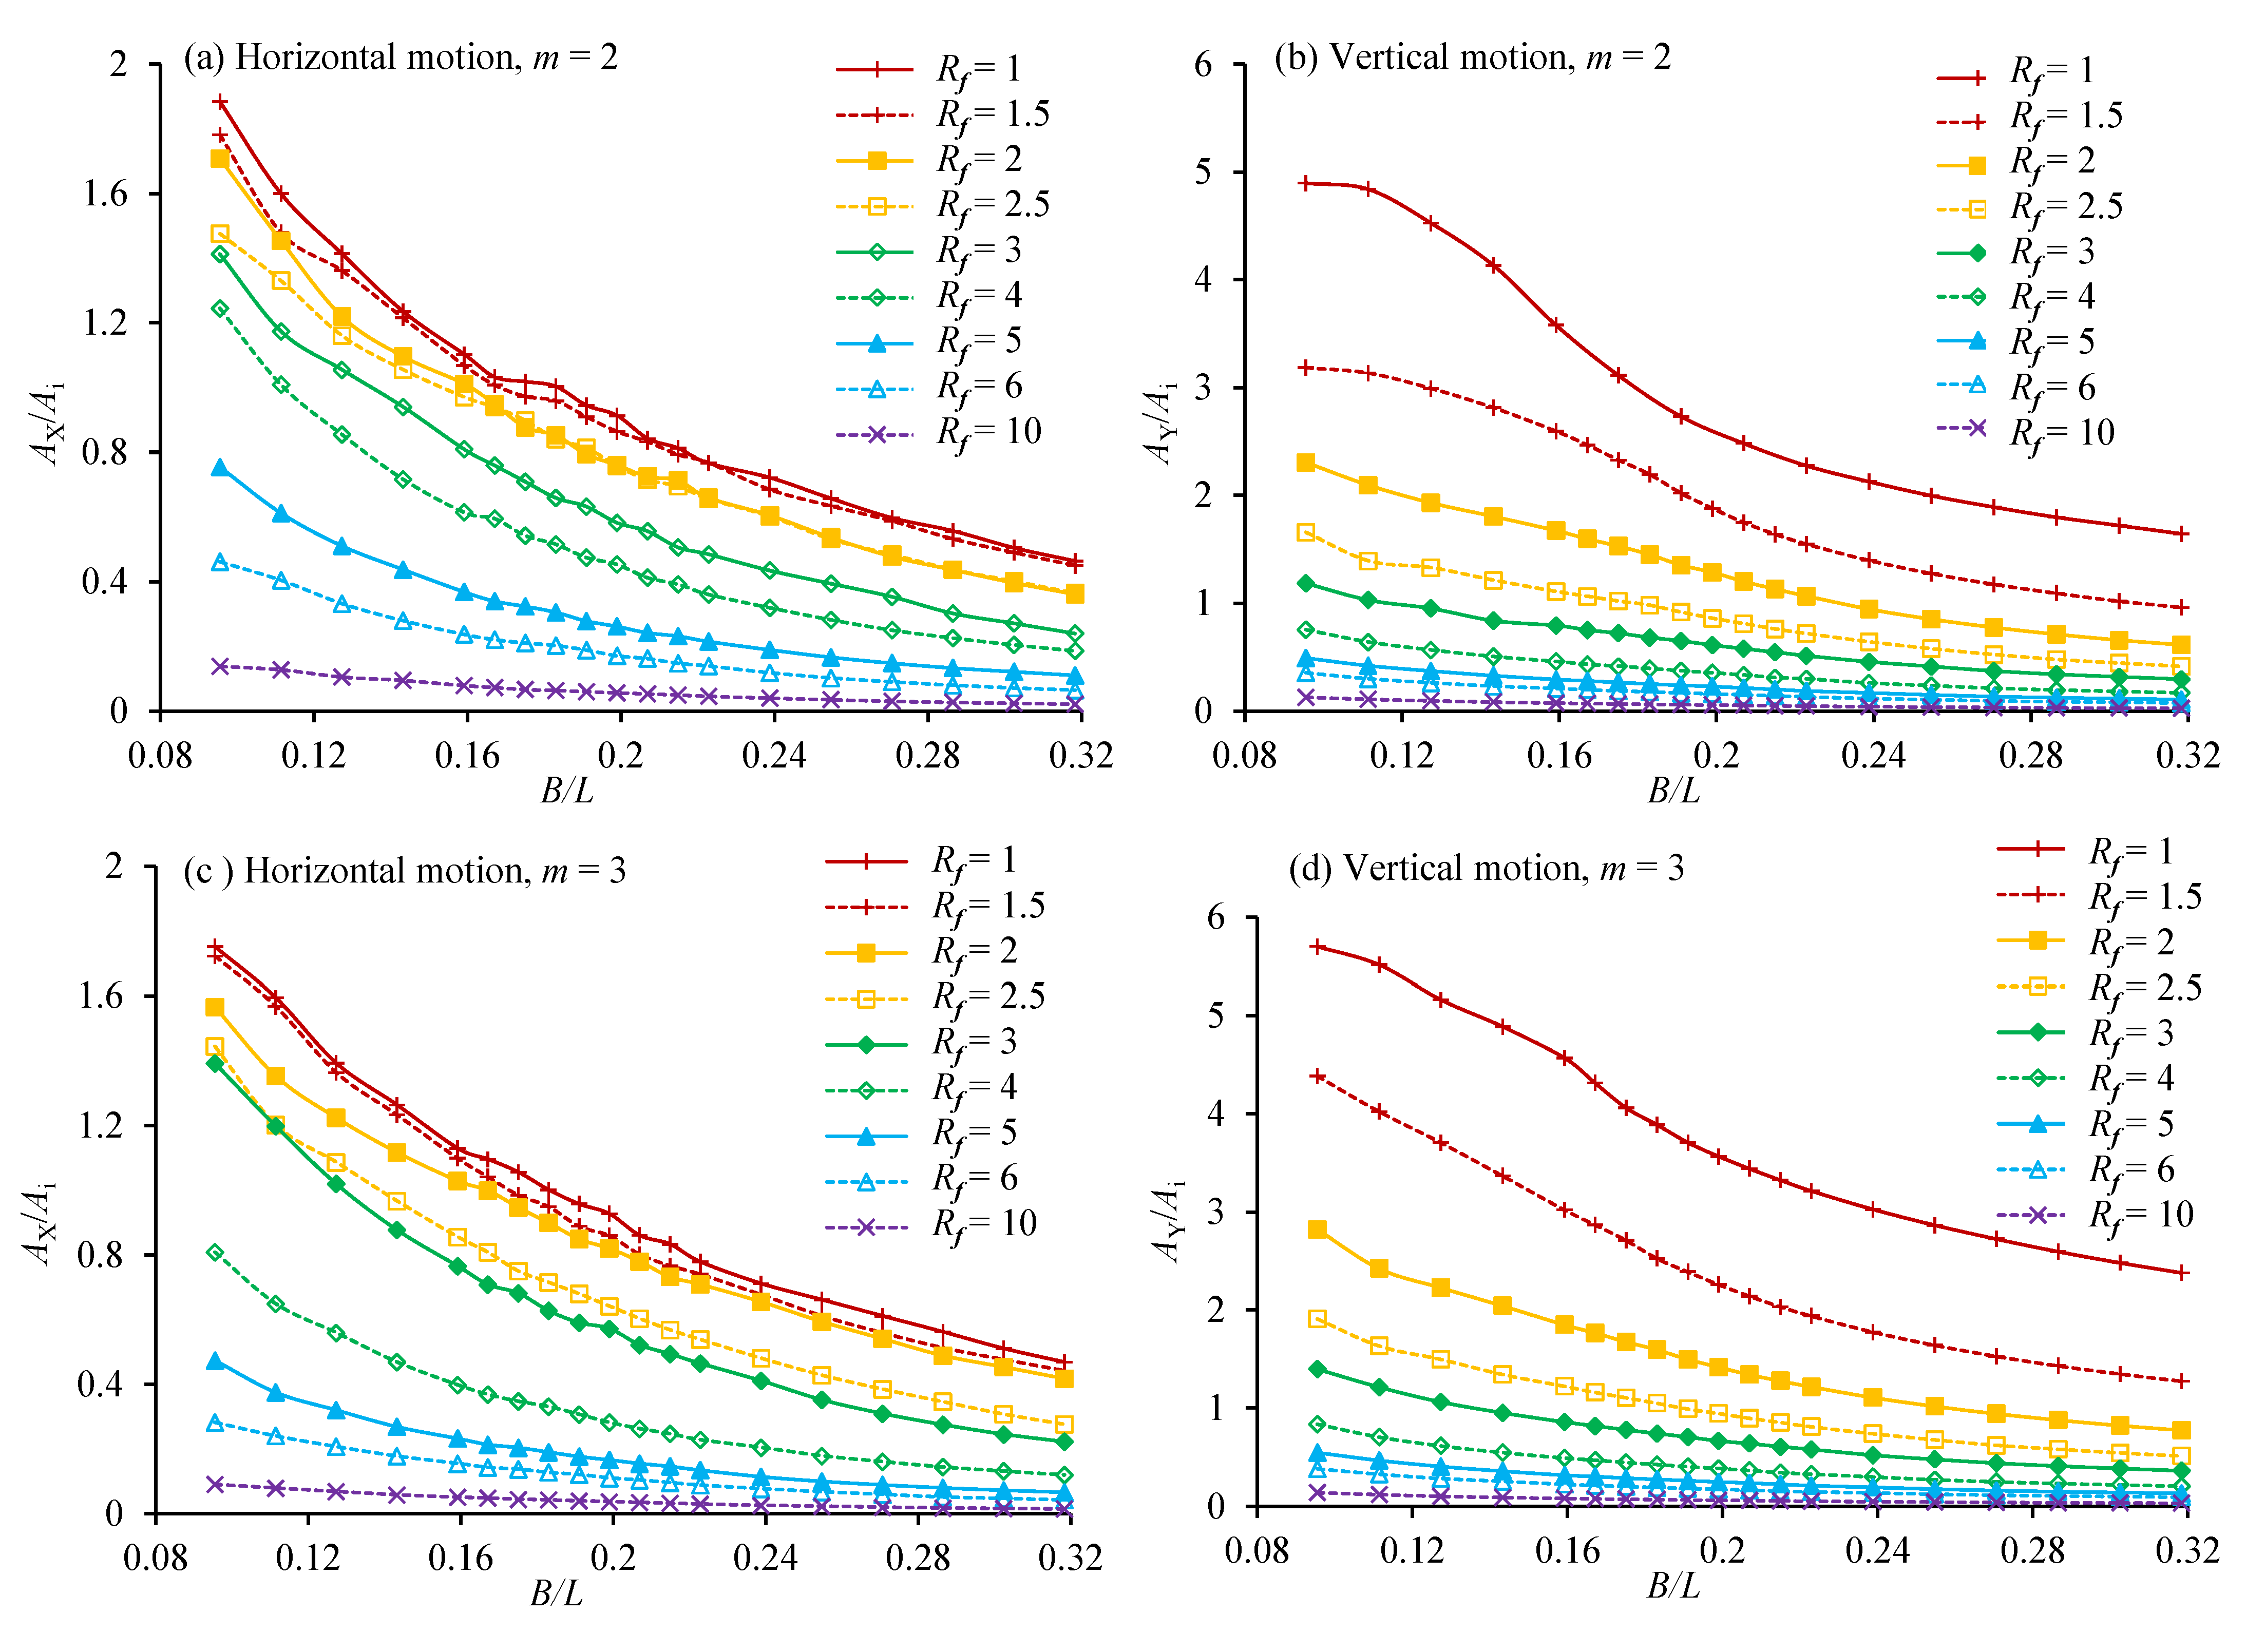
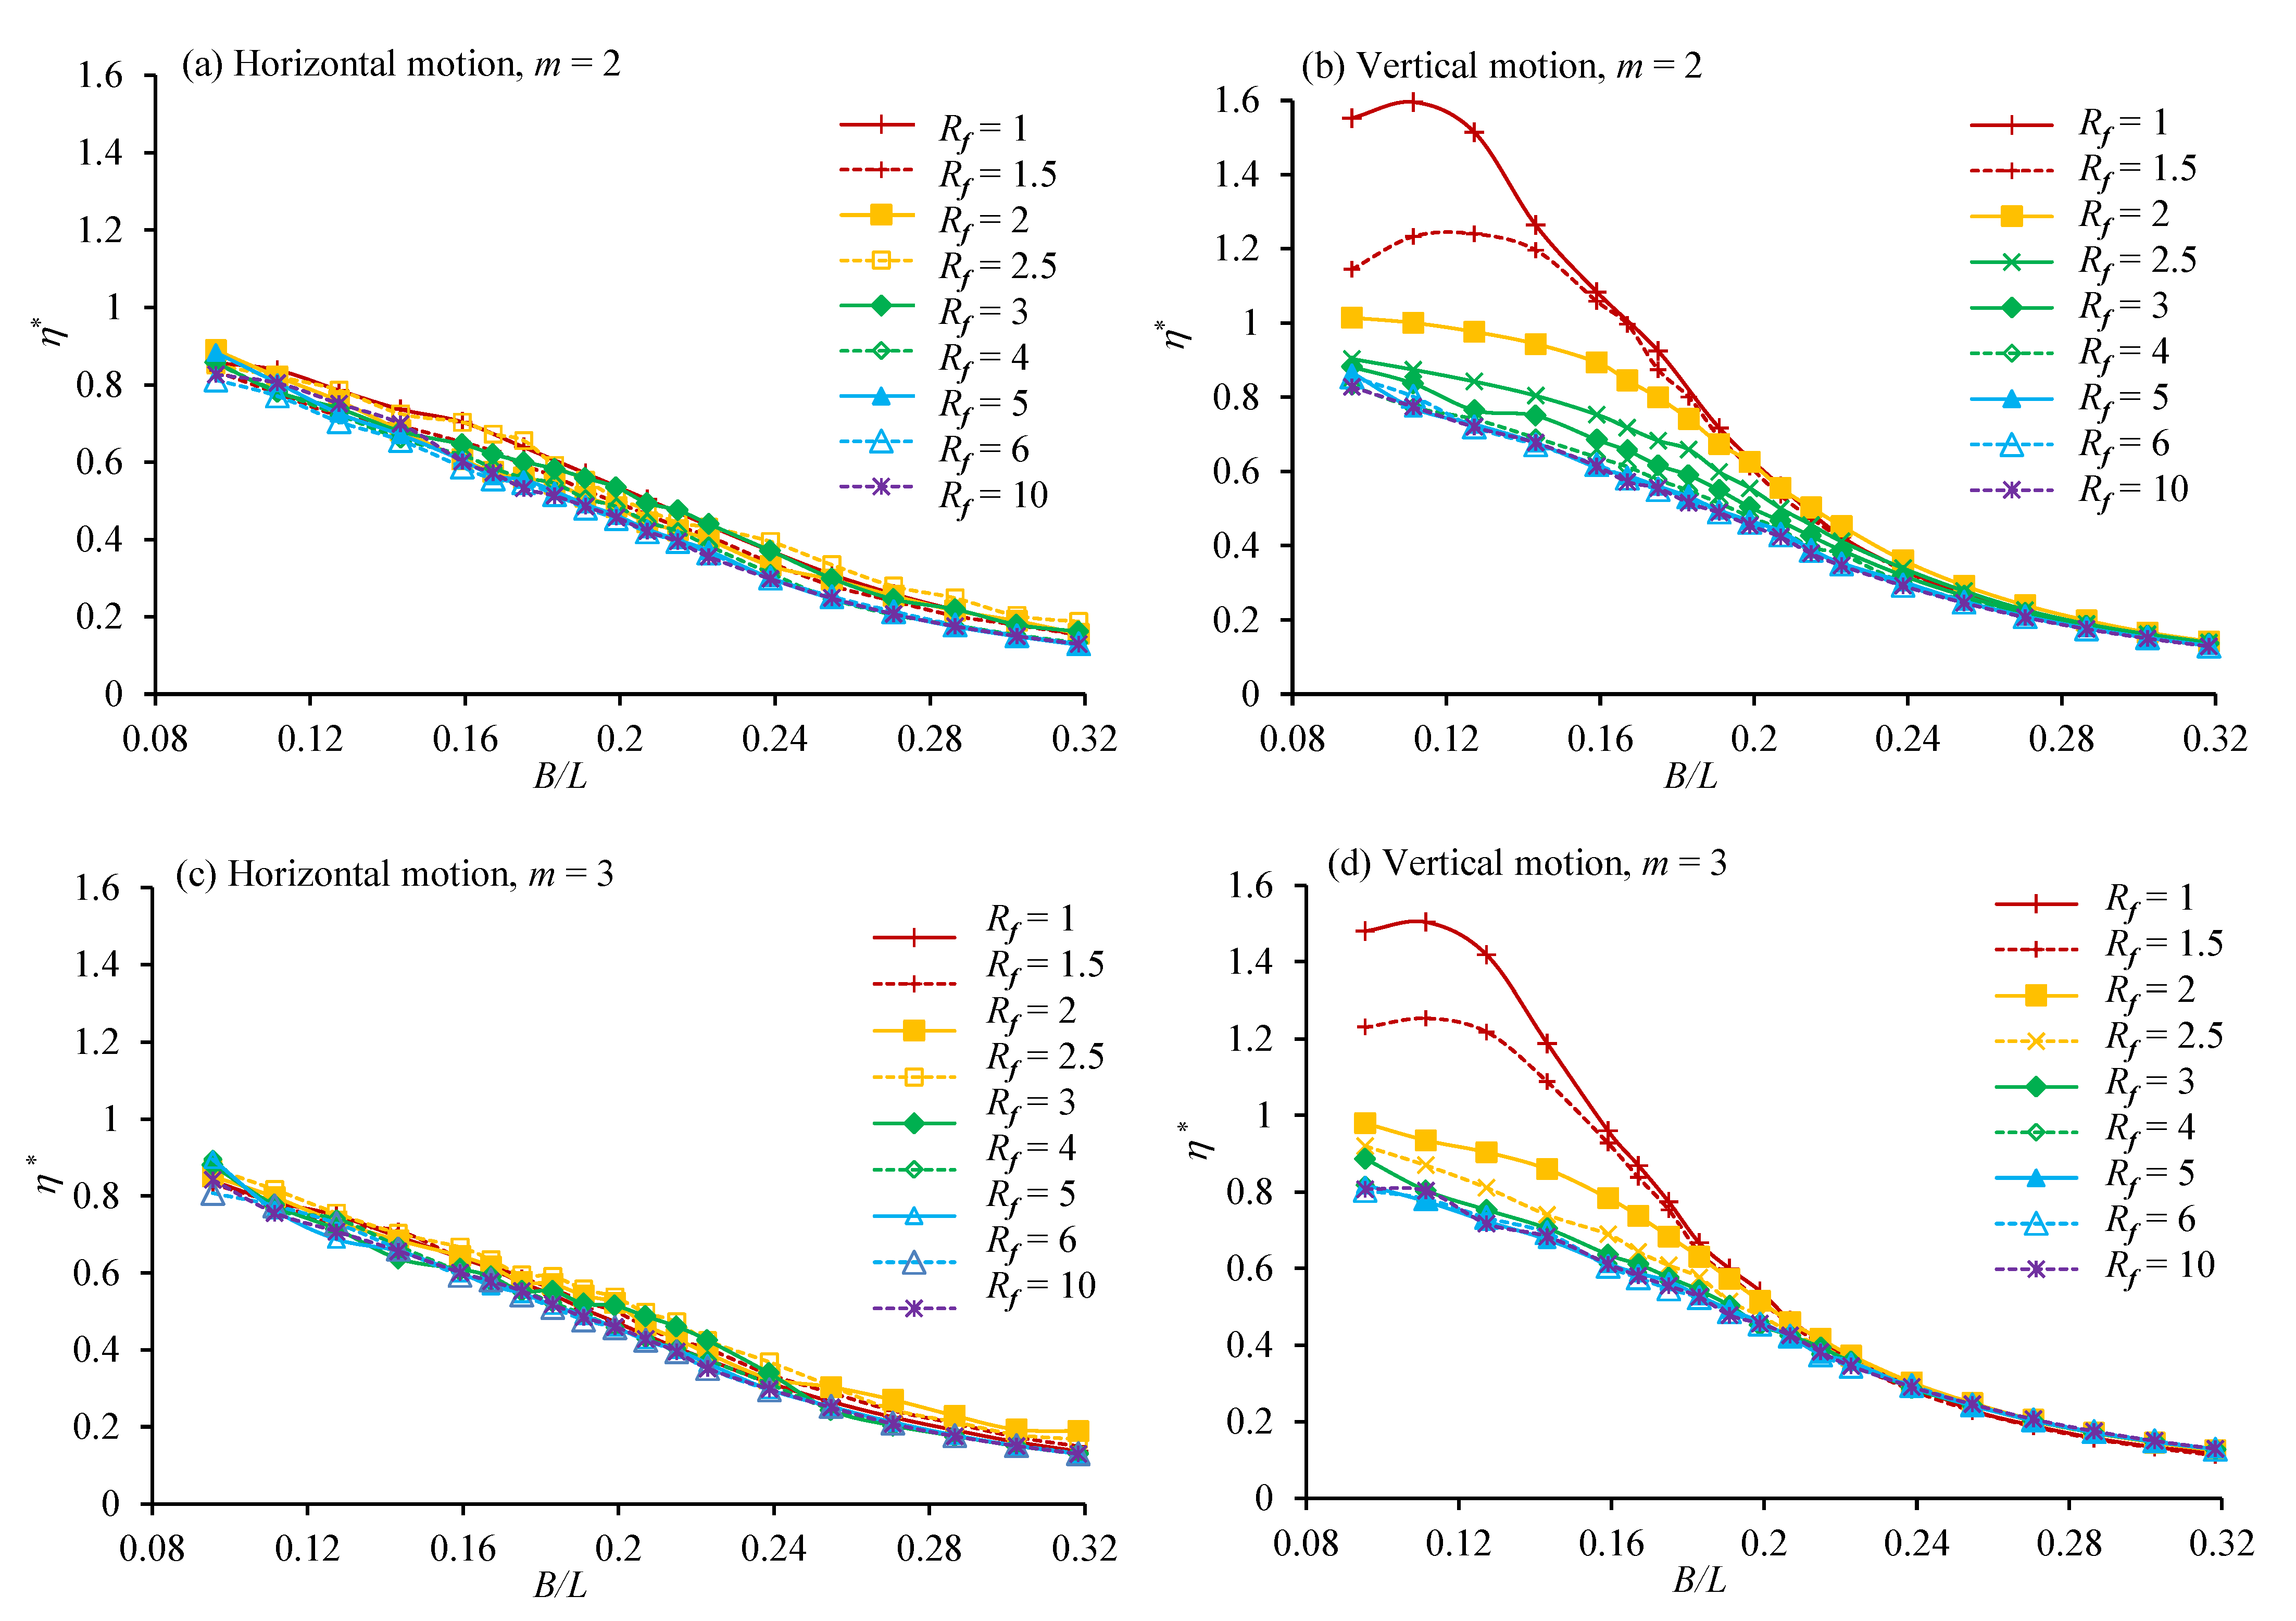
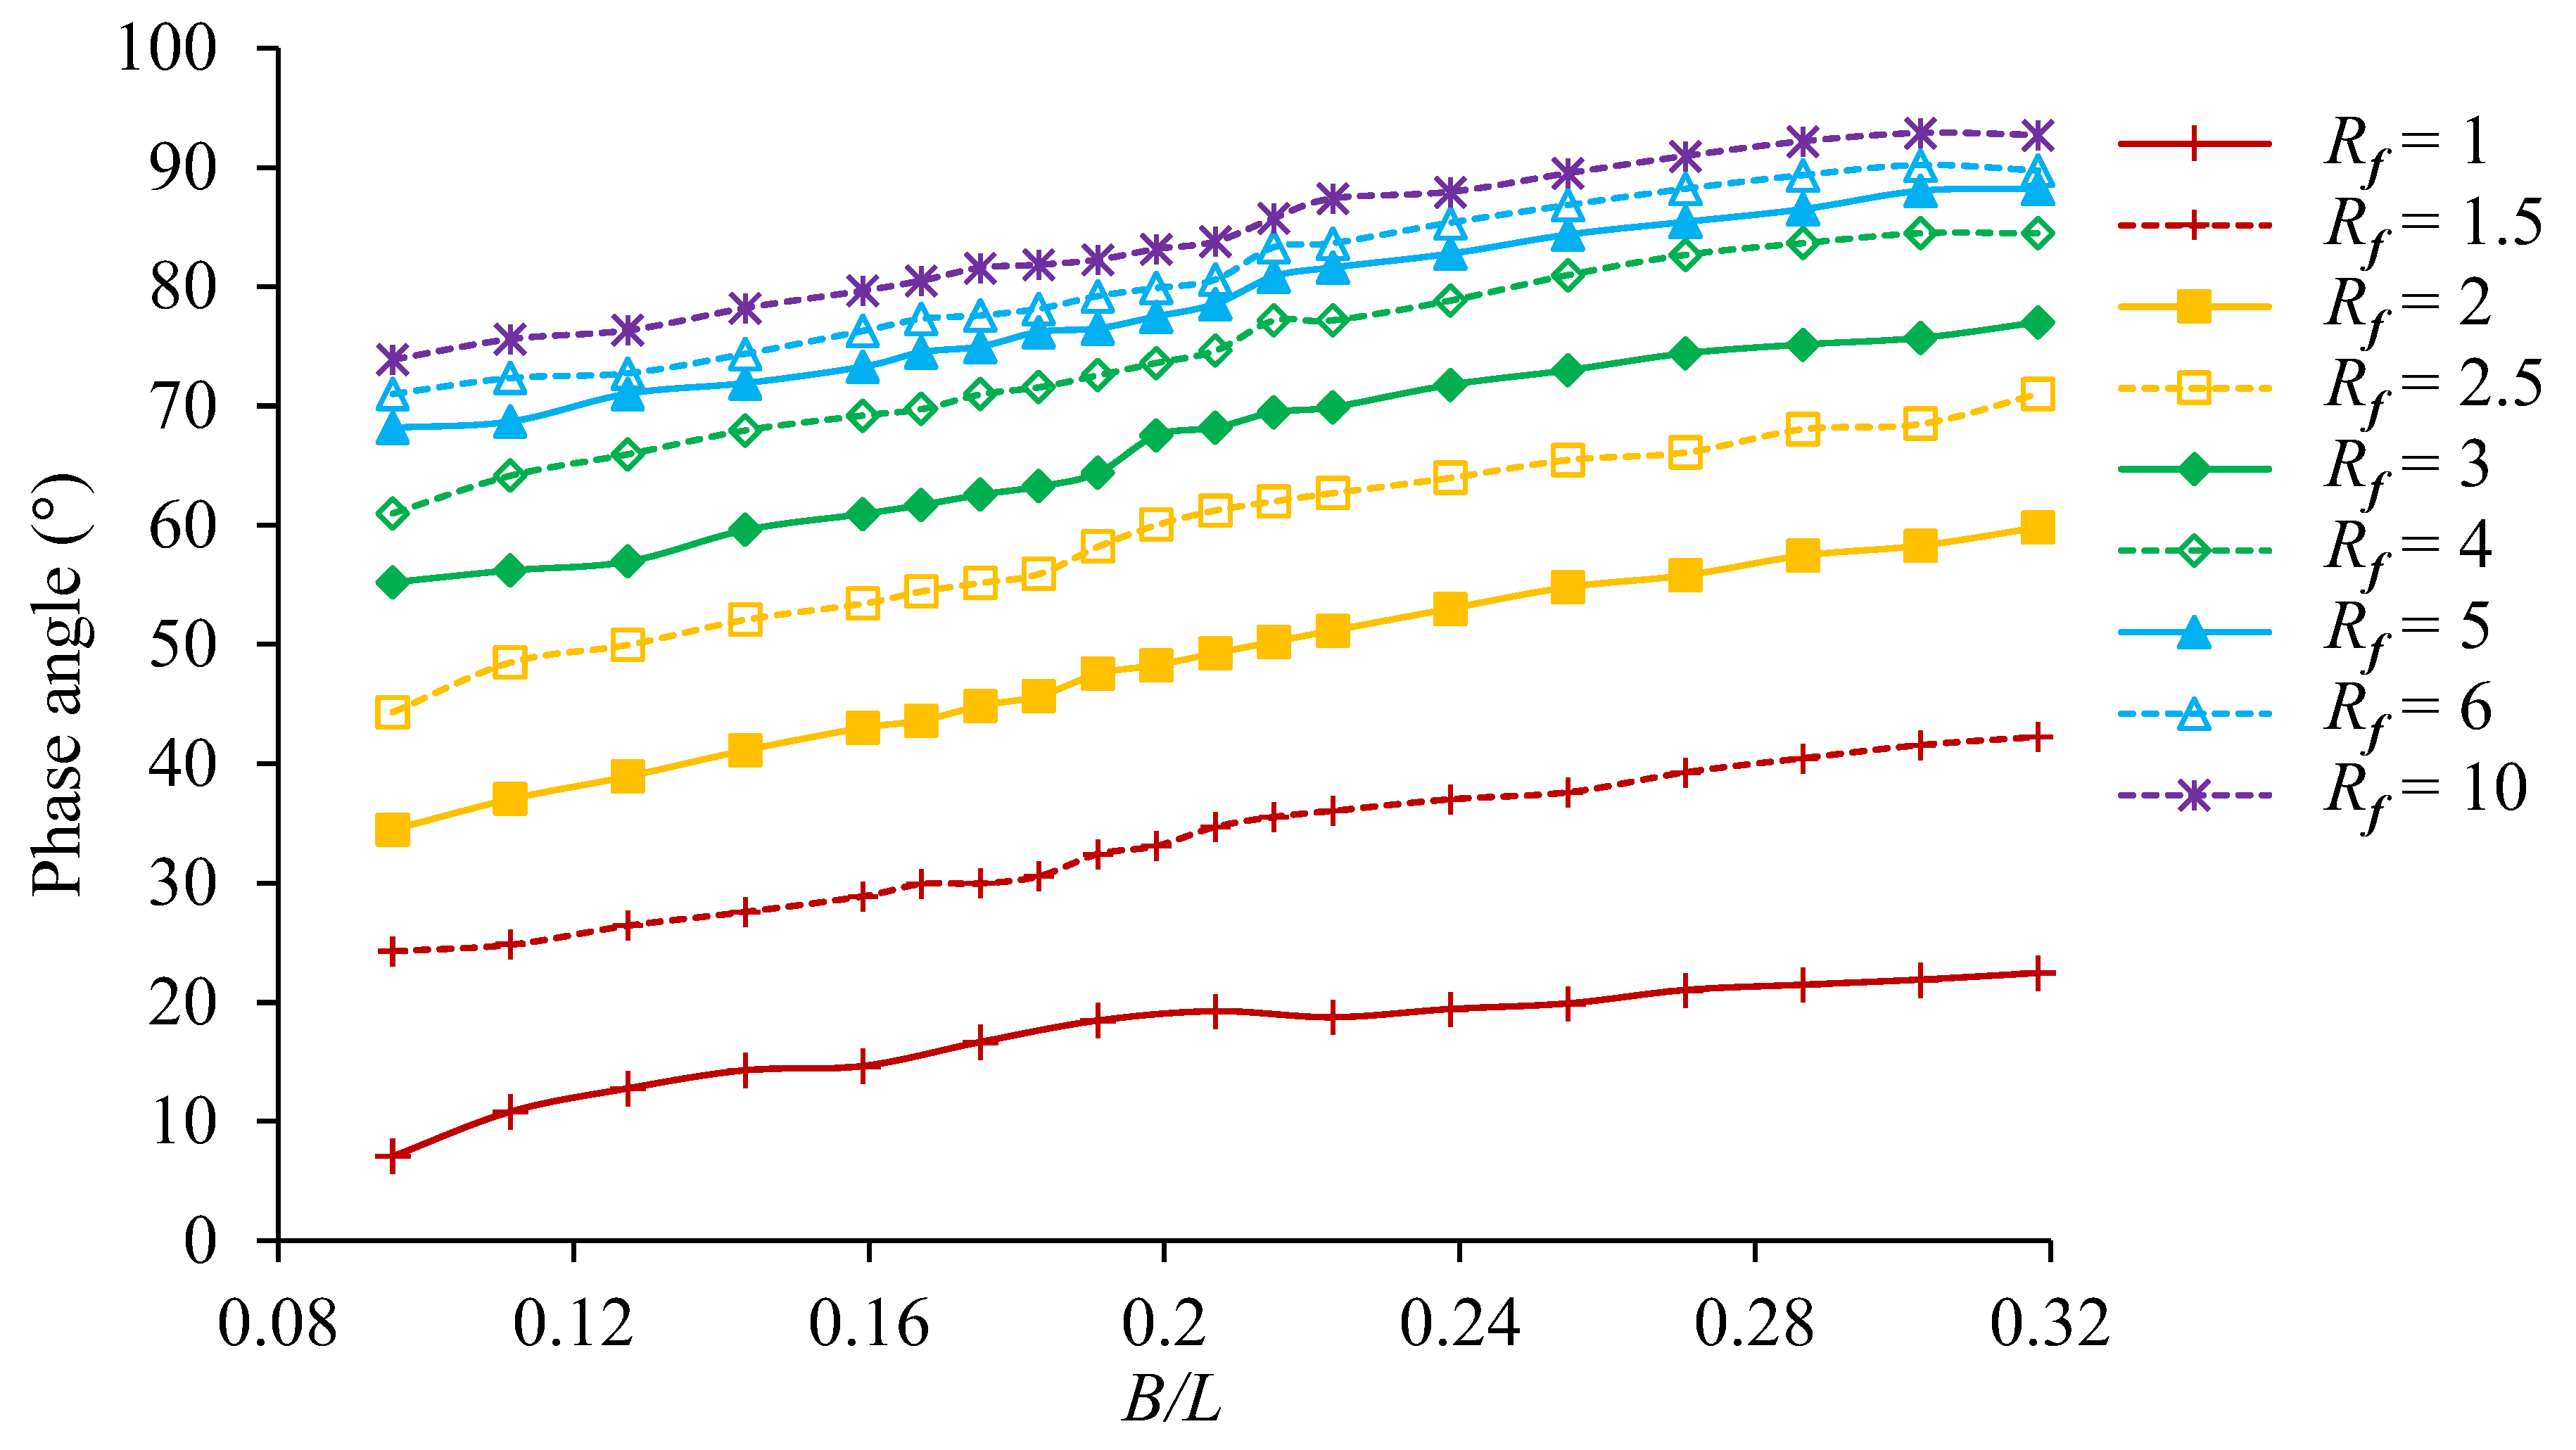
  • It was found that the frequency ratio affects the OWC with the vertical motion much more than that the OWC with the horizontal motion. The maximum efficiencies for the vertical motion and horizontal motion OWCs occur at the largest and smallest frequency ratios, respectively. At m = 2, the maximum hydraulic efficiency of horizontal motion was 0.291, found at B/L = 0.159 and R f   = 1 and that of vertical motion was 0.270, found at B/L = 0.159 and R f = 10.
  • The strong vertical motion of the water and OWC at small frequency ratios in the vertical motion case does not create a lot of energy, because the phase difference between the water surface motion and the OWC motion is very small, creating a very small relative motion between them.
  • A mounting system’s natural frequency must be sufficiently high to provide high efficiency if the OWC oscillates vertically. However, when the OWC oscillates horizontally, the effect of its natural frequency is very weak.
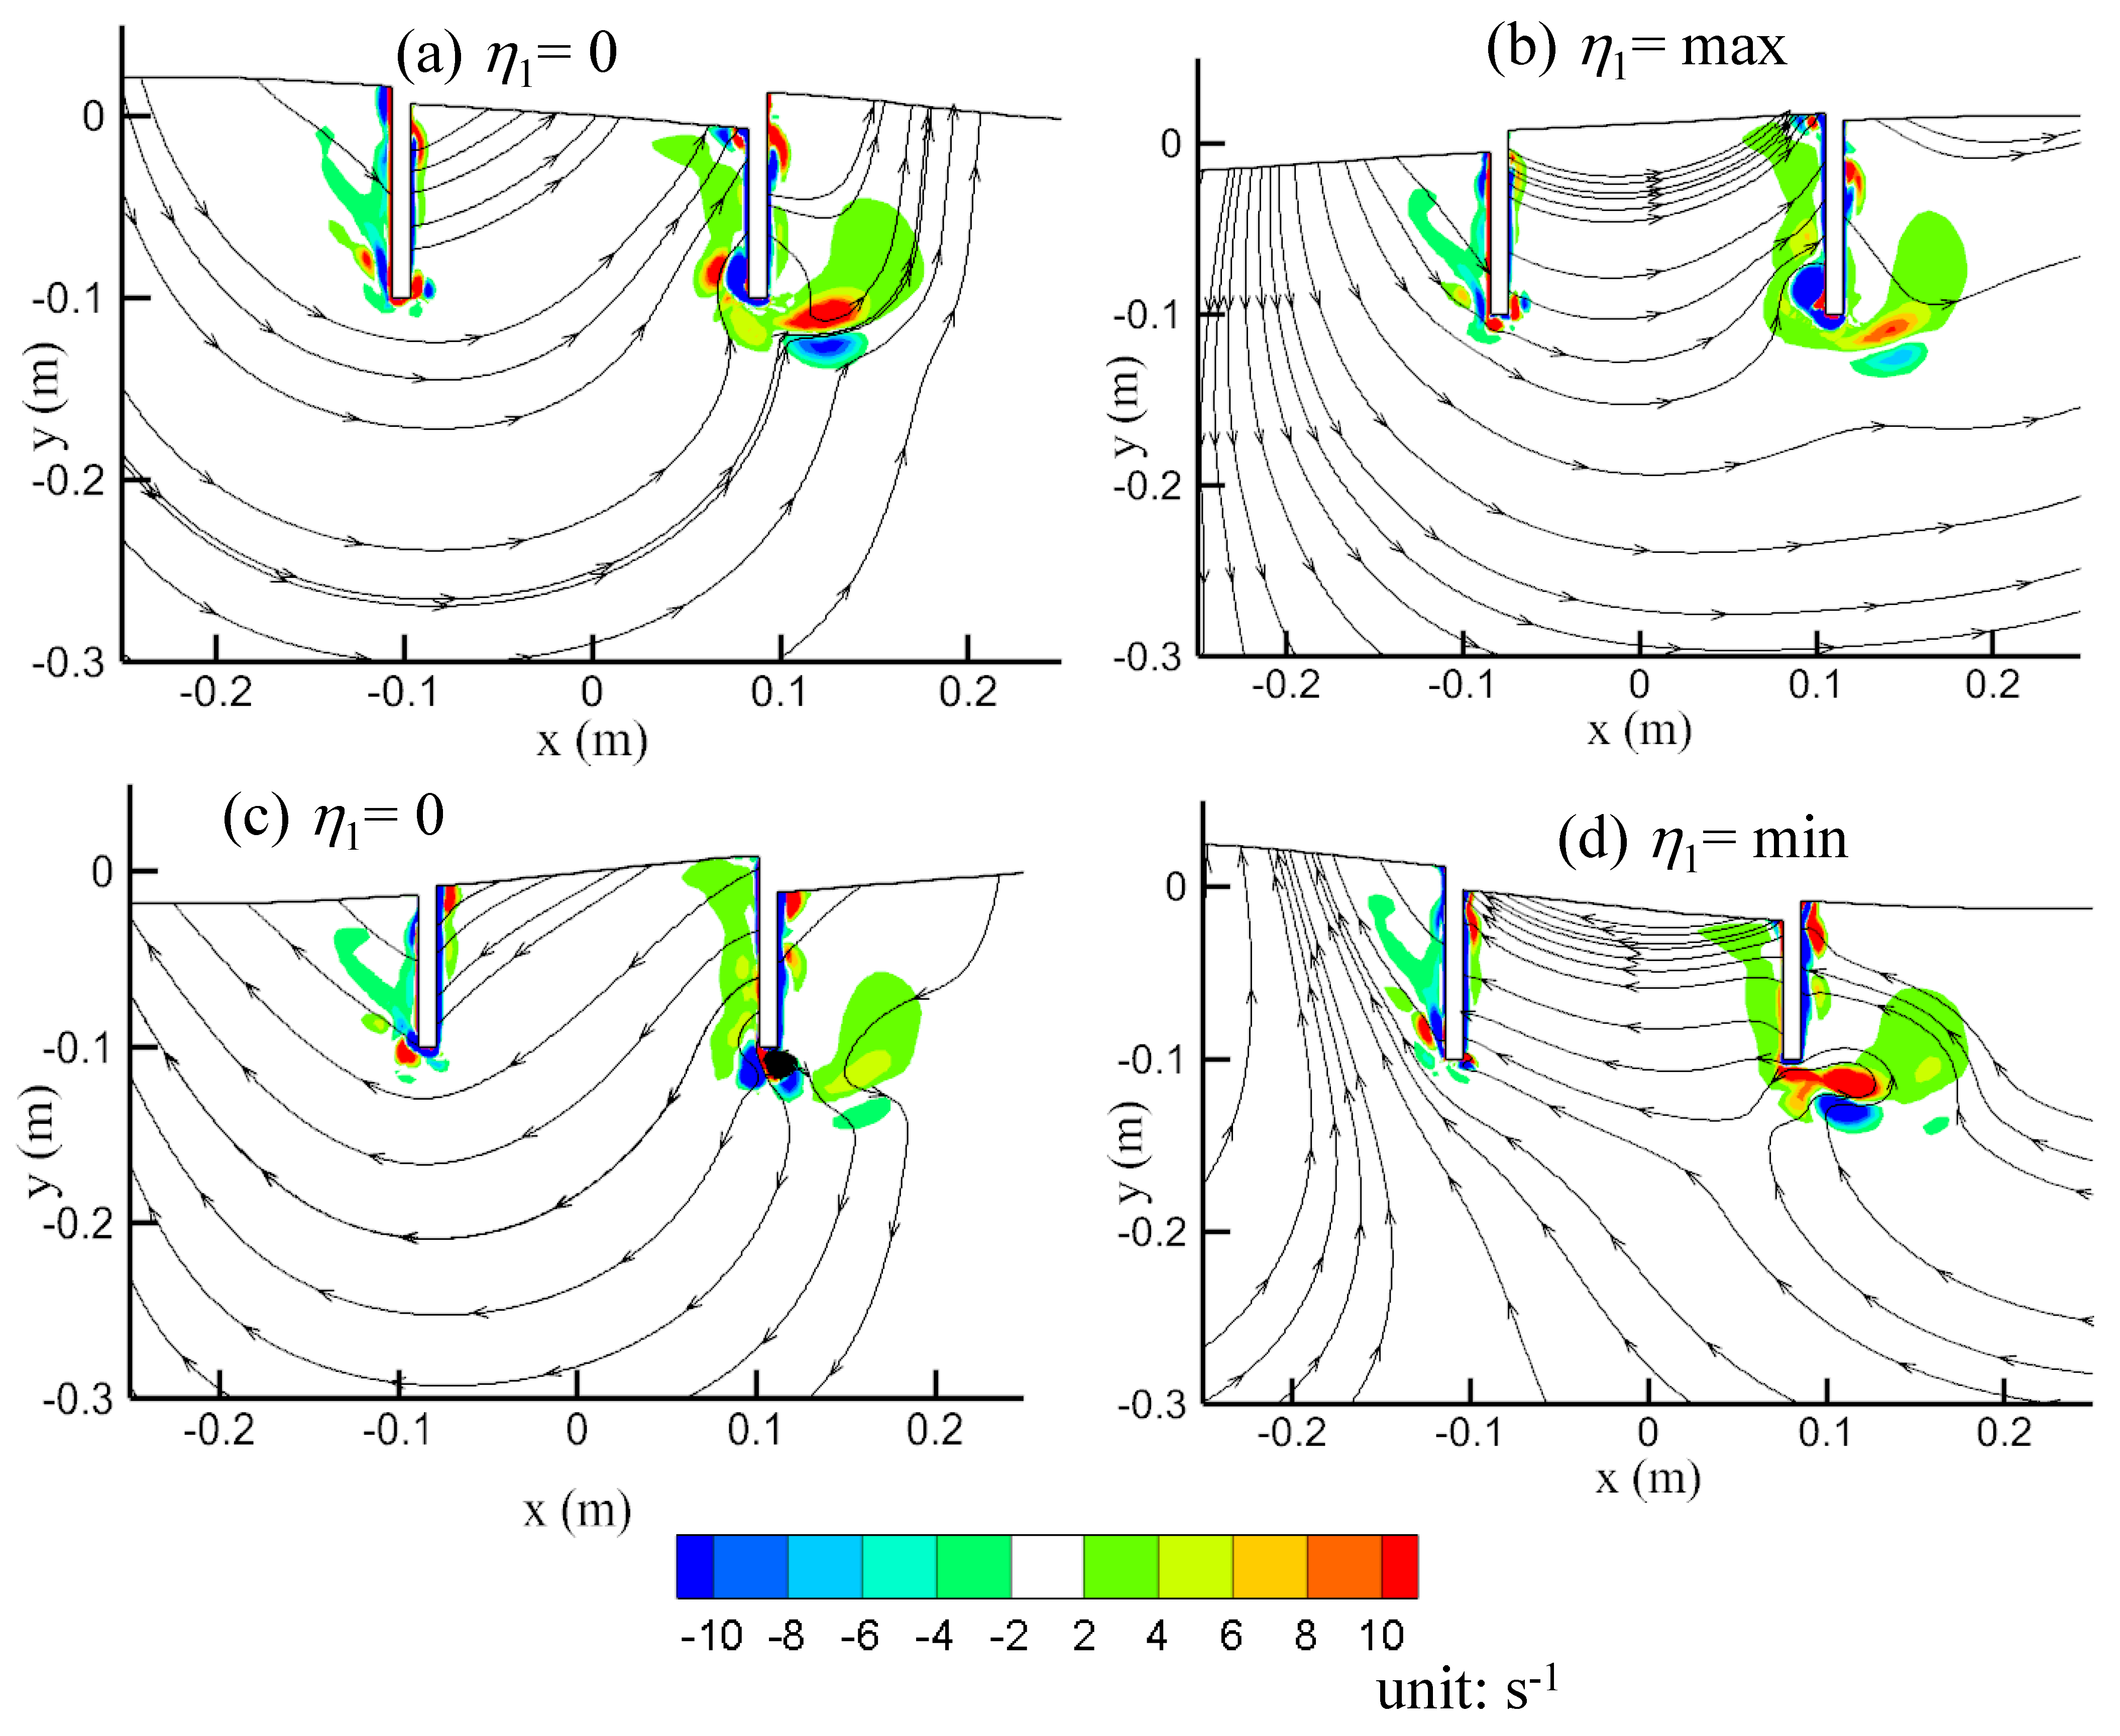
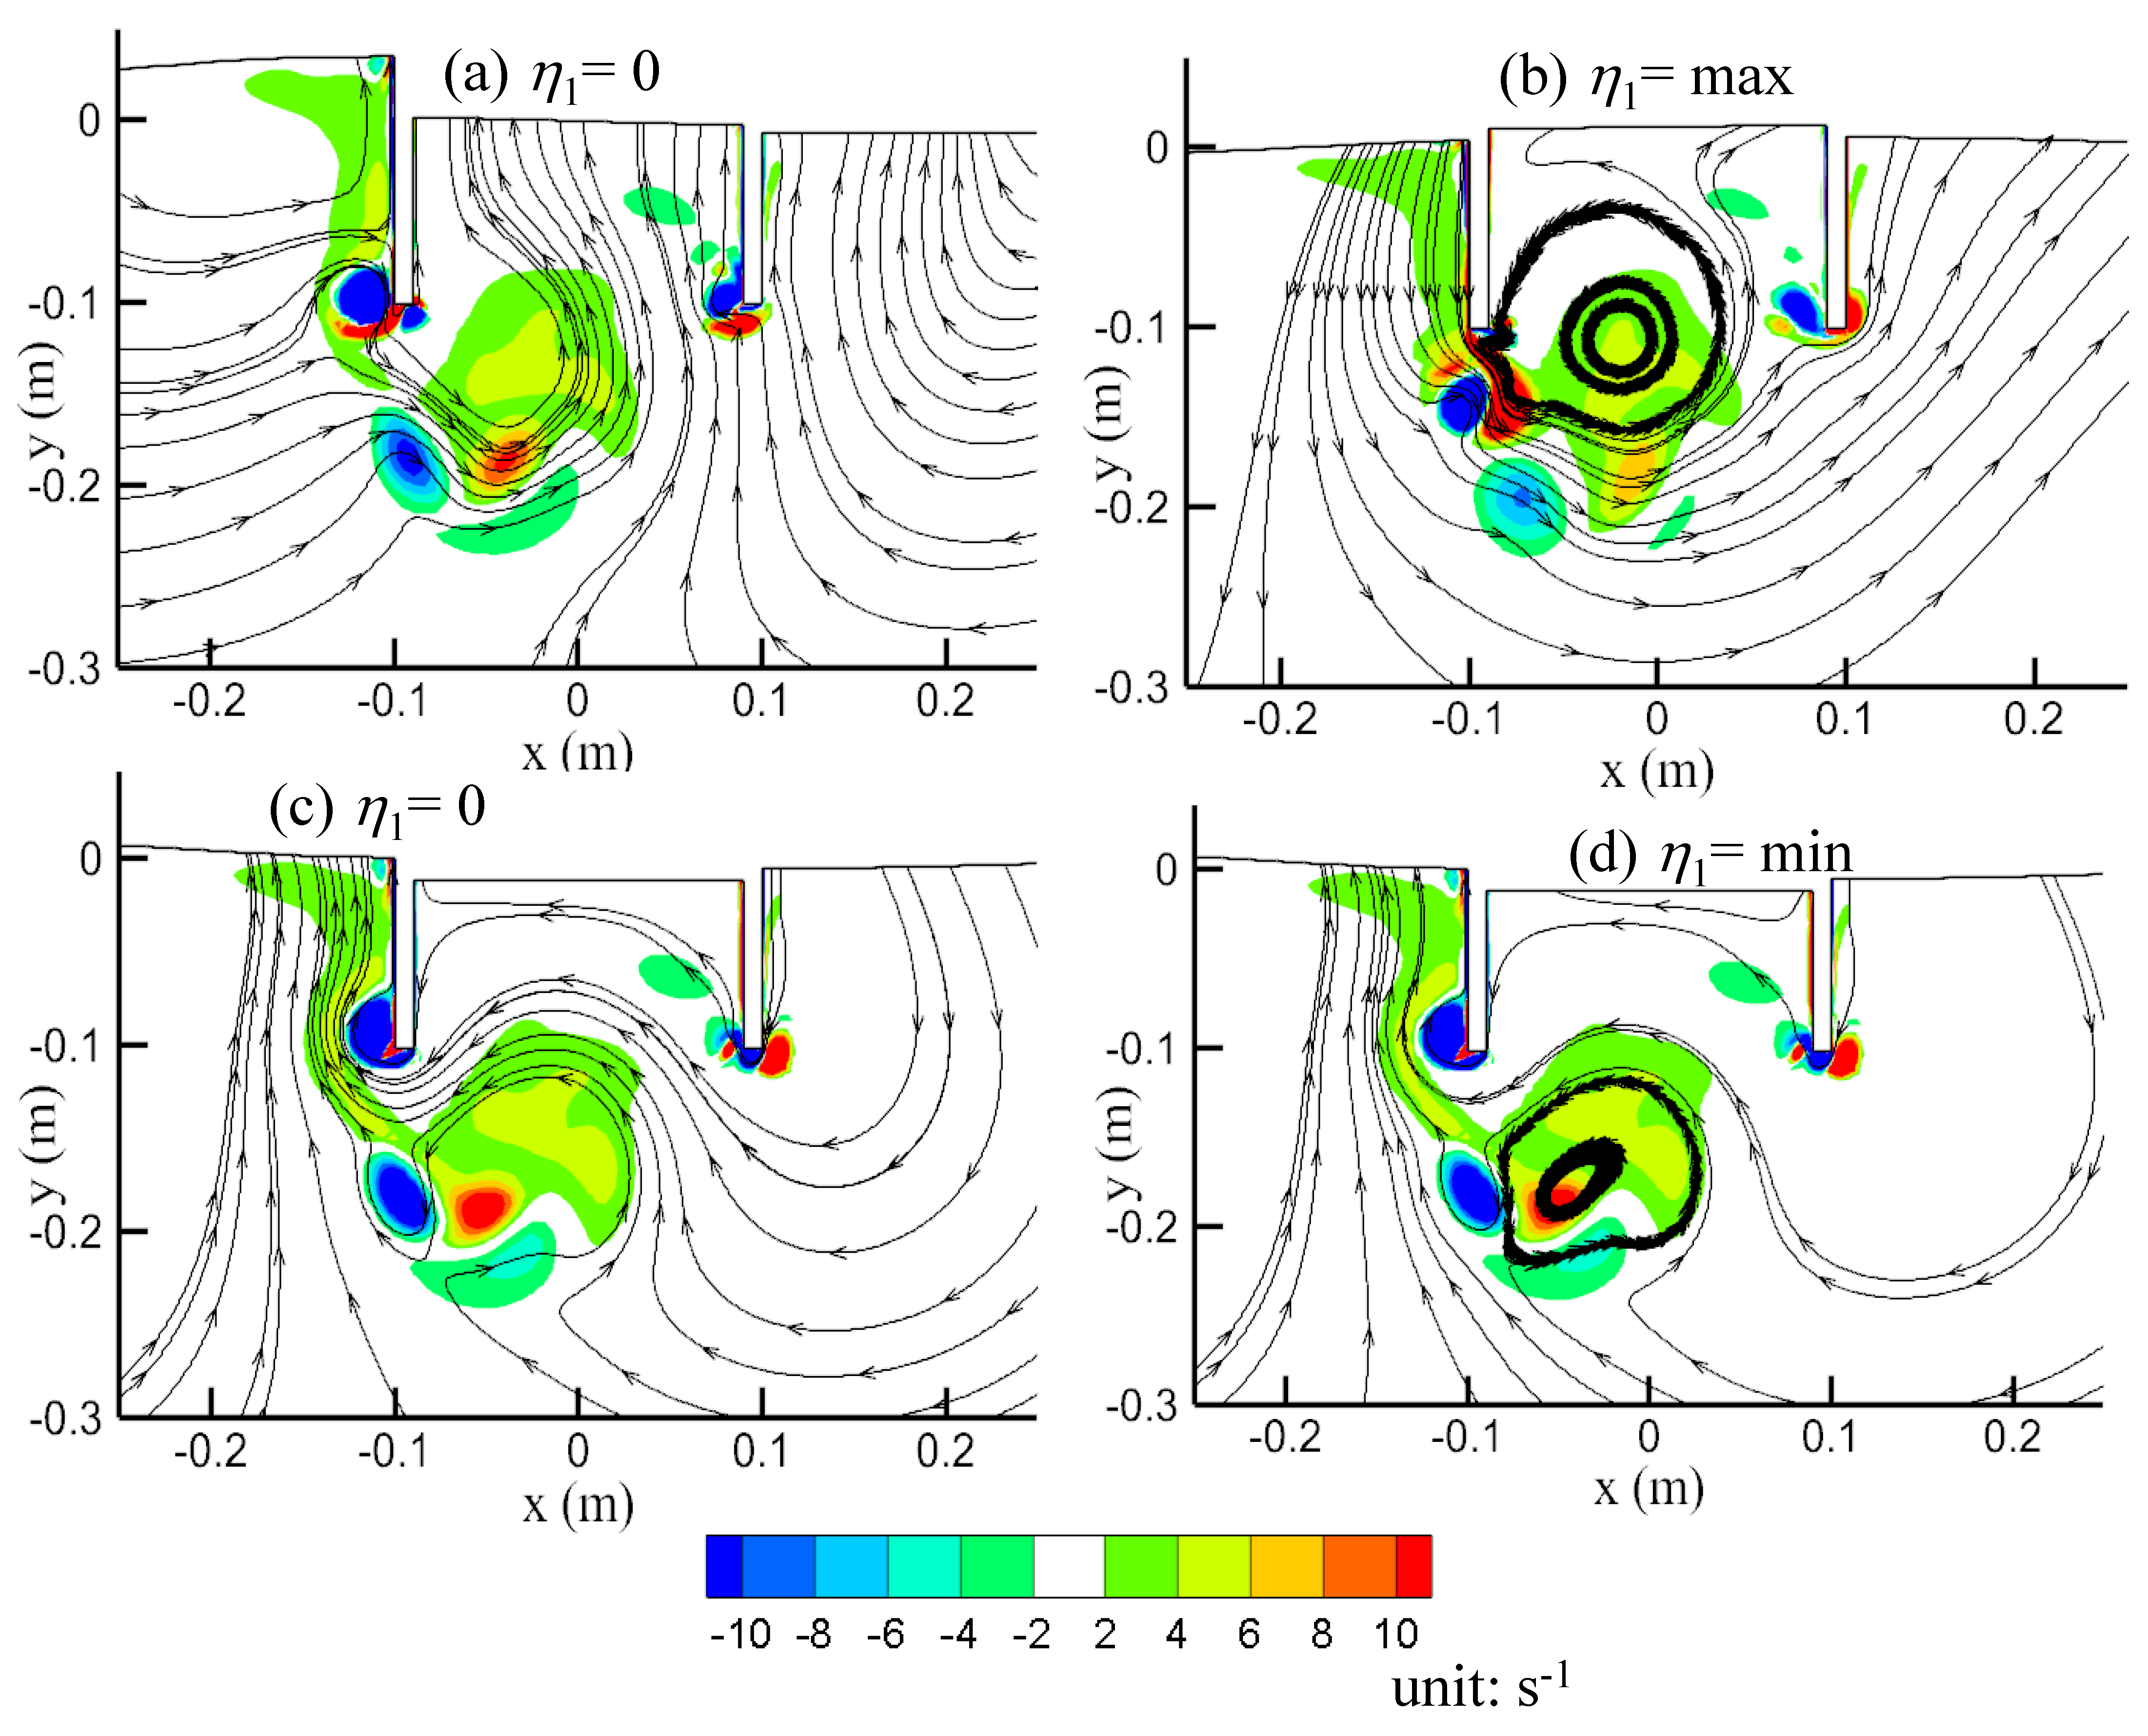
  • When water flows in and out of the OWC chamber, a pair of vortices with opposing directions are created near the bottom end of each OWC wall. The vortices for a horizontal motion OWC with the maximum energy occurring at R f = 1 are weaker than the vortices for a vertical motion OWC with the maximum energy occurring at R f = 10.

Author Contributions

Conceptualization, M.R.M. and M.Z; methodology, M.Z. and M.R.M.; software, M.Z; validation, M.R.M.; investigation, M.R.M. and M.Z.; writing—original draft preparation, M.R.M. and M.Z; writing—review and editing, H.W, V.D. and P.H.; supervision, M.Z and H.W. All authors have read and agreed to the published version of the manuscript.

Funding

This research received no external funding.

Institutional Review Board Statement

Not applicable.

Informed Consent Statement

Not applicable.

Data Availability Statement

Data is contained within the article.

Acknowledgments

The numerical simulations were conducted on the supercomputer Gadi supported by NCI—National Computational Infrastructure of Australia through Adapter Scheme.

Conflicts of Interest

The authors declare no conflict of interest.

References

  1. Liu, Y.; Li, Y.; He, F.; Wang, H. Comparison study of tidal stream and wave energy technology development between China and some Western Countries. Renew. Sustain. Energy Rev. 2017, 76, 701–716. [Google Scholar] [CrossRef]
  2. Leonard, M.D.; Michaelides, E.E.; Michaelides, D.N. Energy storage needs for the substitution of fossil fuel power plants with renewables. Renew. Energy 2020, 145, 951–962. [Google Scholar] [CrossRef]
  3. Ozkop, E.; Altas, I.H. Control, power and electrical components in wave energy conversion systems: A review of the technologies. Renew. Sustain. Energy Rev. 2017, 67, 106–115. [Google Scholar] [CrossRef]
  4. Carballo, R.; Iglesias, G. Wave farm impact based on realistic wave-WEC interaction. Energy 2013, 51, 216–229. [Google Scholar] [CrossRef]
  5. Sheng, W. Wave energy conversion and hydrodynamics modelling technologies: A review. Renew. Sustain. Energy Rev. 2019, 109, 482–498. [Google Scholar] [CrossRef]
  6. Drew, B.; Plummer, A.R.; Sahinkaya, M.N. A review of wave energy converter technology. Proc. Inst. Mech. Eng. Part A J. Power Energy 2009, 223, 887–902. [Google Scholar] [CrossRef] [Green Version]
  7. Evans, D. Wave-power absorption by systems of oscillating surface pressure distributions. J. Fluid Mech. 1982, 114, 481–499. [Google Scholar] [CrossRef]
  8. Sarmento, A.; Gato, L.; Falcao, A.d.O. Turbine-controlled wave energy absorption by oscillating water column devices. Ocean Eng. 1990, 17, 481–497. [Google Scholar] [CrossRef]
  9. Martins-Rivas, H.; Mei, C.C. Wave power extraction from an oscillating water column along a straight coast. Ocean Eng. 2009, 36, 426–433. [Google Scholar] [CrossRef]
  10. Antonio, F.d.O. Wave energy utilization: A review of the technologies. Renew. Sustain. Energy Rev. 2010, 14, 899–918. [Google Scholar]
  11. Liu, C. A tunable resonant oscillating water column wave energy converter. Ocean Eng. 2016, 116, 82–89. [Google Scholar] [CrossRef]
  12. Mahnamfar, F.; Altunkaynak, A. Comparison of numerical and experimental analyses for optimizing the geometry of OWC systems. Ocean Eng. 2017, 130, 10–24. [Google Scholar] [CrossRef]
  13. Falcão, A.F.; Henriques, J.C. Oscillating-water-column wave energy converters and air turbines: A review. Renew. Energy 2016, 85, 1391–1424. [Google Scholar] [CrossRef]
  14. Henriques, J.C.C.; Gomes, R.P.F.; Gato, L.M.C.; Falcão, A.F.O.; Robles, E.; Ceballos, S. Testing and control of a power take-off system for an oscillating-water-column wave energy converter. Renew. Energy 2016, 85, 714–724. [Google Scholar] [CrossRef]
  15. Yusop, Z.M.; Ibrahim, M.Z.; Jusoh, M.A.; Albani, A.; Rahman, S.J.A. Wave-Activated-Body Energy Converters Technologies: A Review. J. Adv. Res. Fluid Mech. Therm. Sci. 2020, 76, 76–104. [Google Scholar] [CrossRef]
  16. Poullikkas, A. Technology prospects of wave power systems. Electron. J. Energy Environ. 2014, 2, 47–69. [Google Scholar]
  17. Medina Rodríguez, A.A.; Posada Vanegas, G.; Silva Casarín, R.; Mendoza Baldwin, E.G.; Vega Serratos, B.E.; Puc Cutz, F.E.; Mangas Che, E.A. Experimental Investigation of the Hydrodynamic Performance of Land-Fixed Nearshore and Onshore Oscillating Water Column Systems with a Thick Front Wall. Energies 2022, 15, 2364. [Google Scholar] [CrossRef]
  18. Ning, D.-Z.; Wang, R.-Q.; Zou, Q.-P.; Teng, B. An experimental investigation of hydrodynamics of a fixed OWC Wave Energy Converter. Appl. Energy 2016, 168, 636–648. [Google Scholar] [CrossRef]
  19. Deng, Z.; Wang, L.; Zhao, X.; Wang, P. Wave power extraction by a nearshore oscillating water column converter with a surging lip-wall. Renew. Energy 2020, 146, 662–674. [Google Scholar] [CrossRef]
  20. Wang, C.; Zhang, Y.; Deng, Z. Semi-analytical study on the wave power extraction of a bottom-seated oscillating water column device with a pitching front lip-wall. J. Fluids Struct. 2021, 105, 103350. [Google Scholar] [CrossRef]
  21. Mavrakos, S.A.; Konispoliatis, D.N. Hydrodynamics of a free floating vertical axisymmetric oscillating water column device. J. Appl. Math. 2012, 2012, 142850. [Google Scholar] [CrossRef] [Green Version]
  22. Pols, A.; Gubesch, E.; Abdussamie, N.; Penesis, I.; Chin, C. Mooring analysis of a floating OWC wave energy converter. J. Mar. Sci. Eng. 2021, 9, 228. [Google Scholar] [CrossRef]
  23. Wu, M.; Stratigaki, V.; Troch, P.; Altomare, C.; Verbrugghe, T.; Crespo, A.; Cappietti, L.; Hall, M.; Gómez-Gesteira, M. Experimental Study of a Moored Floating Oscillating Water Column Wave-Energy Converter and of a Moored Cubic Box. Energies 2019, 12, 1834. [Google Scholar] [CrossRef] [Green Version]
  24. Zhou, Y.; Ning, D.; Liang, D.; Cai, S. Nonlinear hydrodynamic analysis of an offshore oscillating water column wave energy converter. Renew. Sustain. Energy Rev. 2021, 145, 111086. [Google Scholar] [CrossRef]
  25. Mia, M.R.; Zhao, M.; Wu, H.; Palmer, H. Numerical simulation of a stationary offshore multi-chamber OWC wave energy converter. Ocean Eng. 2022, 265, 112546. [Google Scholar] [CrossRef]
  26. Kamath, A.; Bihs, H.; Arntsen, Ø.A. Numerical investigations of the hydrodynamics of an oscillating water column device. Ocean Eng. 2015, 102, 40–50. [Google Scholar] [CrossRef] [Green Version]
  27. Vyzikas, T.; Deshoulières, S.; Giroux, O.; Barton, M.; Greaves, D. Numerical study of fixed Oscillating Water Column with RANS-type two-phase CFD model. Renew. Energy 2017, 102, 294–305. [Google Scholar] [CrossRef] [Green Version]
  28. Ning, D.-Z.; Ke, S.; Mayon, R.; Zhang, C. Numerical investigation on hydrodynamic performance of an OWC wave energy device in the stepped bottom. Front. Energy Res. 2019, 7, 152–163. [Google Scholar] [CrossRef] [Green Version]
  29. Rapaka, E.V.; Natarajan, R.; Neelamani, S. Experimental investigation on the dynamic response of a moored wave energy device under regular sea waves. Ocean Eng. 2004, 31, 725–743. [Google Scholar] [CrossRef]
  30. Sphaier, S.; Torres, F.; Masetti, I.; Costa, A.; Levi, C. Monocolumn behavior in waves: Experimental analysis. Ocean Eng. 2007, 34, 1724–1733. [Google Scholar] [CrossRef]
  31. Sheng, W.; Lewis, A.; Alcorn, R. Numerical Studies on Hydrodynamics of a Floating Oscillating Water Column. In Proceedings of the ASME 2011 30th International Conference on Ocean, Offshore and Arctic Engineering, Rotterdam, The Netherlands, 19–24 June 2011; pp. 275–282. [Google Scholar]
  32. He, F.; Huang, Z. Hydrodynamic performance of pile-supported OWC-type structures as breakwaters: An experimental study. Ocean Eng. 2014, 88, 618–626. [Google Scholar] [CrossRef]
  33. Xu, S.; Rezanejad, K.; Gadelho, J.; Wang, S.; Soares, C.G. Experimental investigation on a dual chamber floating oscillating water column moored by flexible mooring systems. Ocean Eng. 2020, 216, 108083. [Google Scholar] [CrossRef]
  34. Luo, Y.; Wang, Z.; Peng, G.; Xiao, Y.; Zhai, L.; Liu, X.; Zhang, Q. Numerical simulation of a heave-only floating OWC (oscillating water column) device. Energy 2014, 76, 799–806. [Google Scholar] [CrossRef]
  35. Elhanafi, A.; Macfarlane, G.; Fleming, A.; Leong, Z. Experimental and numerical investigations on the hydrodynamic performance of a floating–moored oscillating water column wave energy converter. Appl. Energy 2017, 205, 369–390. [Google Scholar] [CrossRef]
  36. Hong, D.-C.; Hong, S.; Hong, S. Numerical study of the motions and drift force of a floating OWC device. Ocean Eng. 2004, 31, 139–164. [Google Scholar] [CrossRef]
  37. Toyota, K.; Nagata, S.; Imai, Y.; Setoguchi, T. Research for evaluating performance of OWC-type wave energy converter ‘Backward Bent Duct Buoy’. In Proceedings of the 8th European Wave and Tidal Energy Conference, Uppsala, Sweden, 7–11 September 2009; pp. 901–913. [Google Scholar]
  38. Gubesch, E.; Abdussamie, N.; Penesis, I.; Chin, C. Effects of mooring configurations on the hydrodynamic performance of a floating offshore oscillating water column wave energy converter. Renew. Sustain. Energy Rev. 2022, 166, 112643. [Google Scholar] [CrossRef]
  39. Rezanejad, K.; Gadelho, J.F.M.; Xu, S.; Guedes Soares, C. Experimental investigation on the hydrodynamic performance of a new type floating Oscillating Water Column device with dual-chambers. Ocean Eng. 2021, 234, 109307. [Google Scholar] [CrossRef]
  40. Gadelho, J.F.M.; Rezanejad, K.; Xu, S.; Hinostroza, M.; Guedes Soares, C. Experimental study on the motions of a dual chamber floating oscillating water column device. Renew. Energy 2021, 170, 1257–1274. [Google Scholar] [CrossRef]
  41. Howey, B.; Collins, K.M.; Hann, M.; Iglesias, G.; Gomes, R.P.F.; Henriques, J.C.C.; Gato, L.M.C.; Greaves, D. Compact floating wave energy converter arrays: Inter-device mooring connectivity and performance. Appl. Ocean Res. 2021, 115, 102820. [Google Scholar] [CrossRef]
  42. Xu, S.; Rezanejad, K.; Gadelho, J.; Soares, C.G. Influence of the power take-off damping of a dual chamber floating oscillating water column on the mooring fatigue damage. Ocean Eng. 2022, 249, 110832. [Google Scholar] [CrossRef]
  43. Konispoliatis, D.; Mavrakos, A.; Mavrakos, S. Efficiency of an oscillating water column device for several mooring systems. In Developments in Renewable Energies Offshore; CRC Press: Boca Raton, FL, USA, 2020; pp. 666–673. [Google Scholar]
  44. Brito-Melo, A.; Gato, L.; Sarmento, A. Analysis of Wells turbine design parameters by numerical simulation of the OWC performance. Ocean Eng. 2002, 29, 1463–1477. [Google Scholar] [CrossRef]
  45. Shehata, A.S.; Xiao, Q.; Saqr, K.M.; Alexander, D. Wells turbine for wave energy conversion: A review. Int. J. Energy Res. 2017, 41, 6–38. [Google Scholar] [CrossRef]
  46. Mia, M.R.; Zhao, M.; Wu, H.; Munir, A. Numerical investigation of scaling effect in two-dimensional oscillating water column wave energy devices for harvesting wave energy. Renew. Energy 2021, 178, 1381–1397. [Google Scholar] [CrossRef]
  47. Liu, M.M.; Lu, L.; Teng, B.; Zhao, M.; Tang, G.Q. Numerical modeling of local scour and forces for submarine pipeline under surface waves. Coast. Eng. 2016, 116, 275–288. [Google Scholar] [CrossRef]
  48. Zhao, M.; Teng, B.; Tan, L. A finite element solution of wave forces on submerged horizontal circular cylinders. China Ocean Eng. 2004, 18, 335–346. [Google Scholar]
  49. Geng, B.; Zhao, M. A three-dimensional arbitrary Lagrangian-Eulerian Petrov-Galerkin finite element model for fully nonlinear free-surface waves. Ocean Eng. 2014, 91, 389–398. [Google Scholar] [CrossRef]
  50. Menter, F.R. Two-equation eddy-viscosity turbulence models for engineering applications. AIAA J. 1994, 32, 1598–1605. [Google Scholar] [CrossRef] [Green Version]
  51. Larsen, B.E.; Fuhrman, D.R. On the over-production of turbulence beneath surface waves in Reynolds-averaged Navier–Stokes models. J. Fluid Mech. 2018, 853, 419–460. [Google Scholar] [CrossRef] [Green Version]
  52. Mia, M.R.; Zhao, M.; Wu, H.; Munir, A. Numerical investigation of offshore oscillating water column devices. Renew. Energy 2022, 191, 380–393. [Google Scholar] [CrossRef]
  53. Josset, C.; Clément, A. A time-domain numerical simulator for oscillating water column wave power plants. Renew. Energy 2007, 32, 1379–1402. [Google Scholar] [CrossRef]
  54. Zhao, M.; Cheng, L.; Teng, B.; Dong, G. Hydrodynamic forces on dual cylinders of different diameters in steady currents. J. Fluids Struct. 2007, 23, 59–83. [Google Scholar] [CrossRef]
  55. Raghunathan, S. The Wells air turbine for wave energy conversion. Prog. Aerosp. Sci. 1995, 31, 335–386. [Google Scholar] [CrossRef]
  56. Raghunathan, S.; Setoguchi, T.; Kaneko, K. The effect of inlet conditions on the performance of Wells turbine. J. Energy Resour. Technol. -Trans. ASME 1989, 111, 37–42. [Google Scholar] [CrossRef]
  57. Filianoti, P.G.; Gurnari, L.; Torresi, M.; Camporeale, S.M. CFD analysis of the energy conversion process in a fixed oscillating water column (OWC) device with a Wells turbine. Energy Procedia 2018, 148, 1026–1033. [Google Scholar] [CrossRef]
  58. Wiener, G.F.; Teixeira, P.R.; Didier, E. Numerical Evaluation of Optimal Sizes of Wells Turbine and Chamber of a Cluster of Oscillating Water Columns Integrated into a Breakwater on the Southern Brazilian Coast. J. Waterw. Port Coast. Ocean Eng. 2022, 148, 04022009. [Google Scholar] [CrossRef]
  59. Ning, D.-Z.; Wang, R.-Q.; Chen, L.-F.; Sun, K. Experimental investigation of a land-based dual-chamber OWC wave energy converter. Renew. Sustain. Energy Rev. 2019, 105, 48–60. [Google Scholar] [CrossRef]
  60. Wang, R.-Q.; Ning, D.-Z.; Zhang, C.-W.; Zou, Q.-P.; Liu, Z. Nonlinear and viscous effects on the hydrodynamic performance of a fixed OWC wave energy converter. Coast. Eng. 2018, 131, 42–50. [Google Scholar] [CrossRef]
  61. López, I.; Pereiras, B.; Castro, F.; Iglesias, G. Optimisation of turbine-induced damping for an OWC wave energy converter using a RANS–VOF numerical model. Appl. Energy 2014, 127, 105–114. [Google Scholar] [CrossRef]
  62. Luo, Y.; Nader, J.-R.; Cooper, P.; Zhu, S.-P. Nonlinear 2D analysis of the efficiency of fixed oscillating water column wave energy converters. Renew. Energy 2014, 64, 255–265. [Google Scholar] [CrossRef]
  63. Iturrioz, A.; Guanche, R.; Armesto, J.; Alves, M.; Vidal, C.; Losada, I. Time-domain modeling of a fixed detached oscillating water column towards a floating multi-chamber device. Ocean Eng. 2014, 76, 65–74. [Google Scholar] [CrossRef]
  64. Wang, R.-Q.; Ning, D.-Z. Dynamic analysis of wave action on an OWC wave energy converter under the influence of viscosity. Renew. Energy 2020, 150, 578–588. [Google Scholar] [CrossRef]
Figure 1. Schematic diagram of a two-dimensional wave tank developed to simulate the hydrodynamic performance of (a) sway-only floating (b) heave-only floating OWC in a wave flume; (c) computational mesh near the OWC.
Jmse 10 01551 g001aJmse 10 01551 g001b
Figure 2. Effects of the turbine coefficient for fixed OWC device at (d/h = 0.25) on efficiency with B/L for different turbine coefficient.
Jmse 10 01551 g002
Figure 3. Variation of the floating OWC device efficiency ε with B / L under nine different frequency ratios ( R f ) at d/h= 0.25, Kt = 3000 Pa·m−3·s.
Jmse 10 01551 g003
Figure 4. Variation of the amplitude of air pressures oscillatory of the floating OWC chamber with B / L for Kt = 3000 Pa·m−3·s and various frequency ratios at d/h = 0.25.
Jmse 10 01551 g004
Figure 5. Variation of the amplitude of oscillatory air volume of the floating OWC chamber with B / L for Kt = 3000 Pa·m−3·s and various frequency ratios at d/h = 0.25.
Jmse 10 01551 g005
Figure 6. Variation of the amplitude of the oscillatory horizontal and vertical motion of the floating OWC chamber for Kt = 3000 Pa·m−3·s and d/h = 0.25.
Jmse 10 01551 g006
Figure 7. Variation of the amplitude of the waver surface elevation of the floating OWC chamber B / L for Kt = 3000 Pa·m−3·s and d/h = 0.25.
Jmse 10 01551 g007
Figure 8. The phase between the floating OWC displacement and surface elevation at the centre of the OWC for Kt = 3000 Pa·m−3·s and vertical motion at m = 2.
Jmse 10 01551 g008
Figure 9. Flow near the OWC represented by streamlines and vorticity contours at horizontal motion, m = 2, B/L = 0.159.
Jmse 10 01551 g009
Figure 10. Flow near the OWC represented by streamlines and vorticity contours at vertical motion, m = 2, B/L = 0.159.
Jmse 10 01551 g010
Publisher’s Note: MDPI stays neutral with regard to jurisdictional claims in published maps and institutional affiliations.

