
Field Campaign on Pressure on the Crown Wall at the Outer Port of Punta Langosteira Breakwater
 , , , and
Abstract
:1. Introduction
2. Methods
3. Description of the Case Study
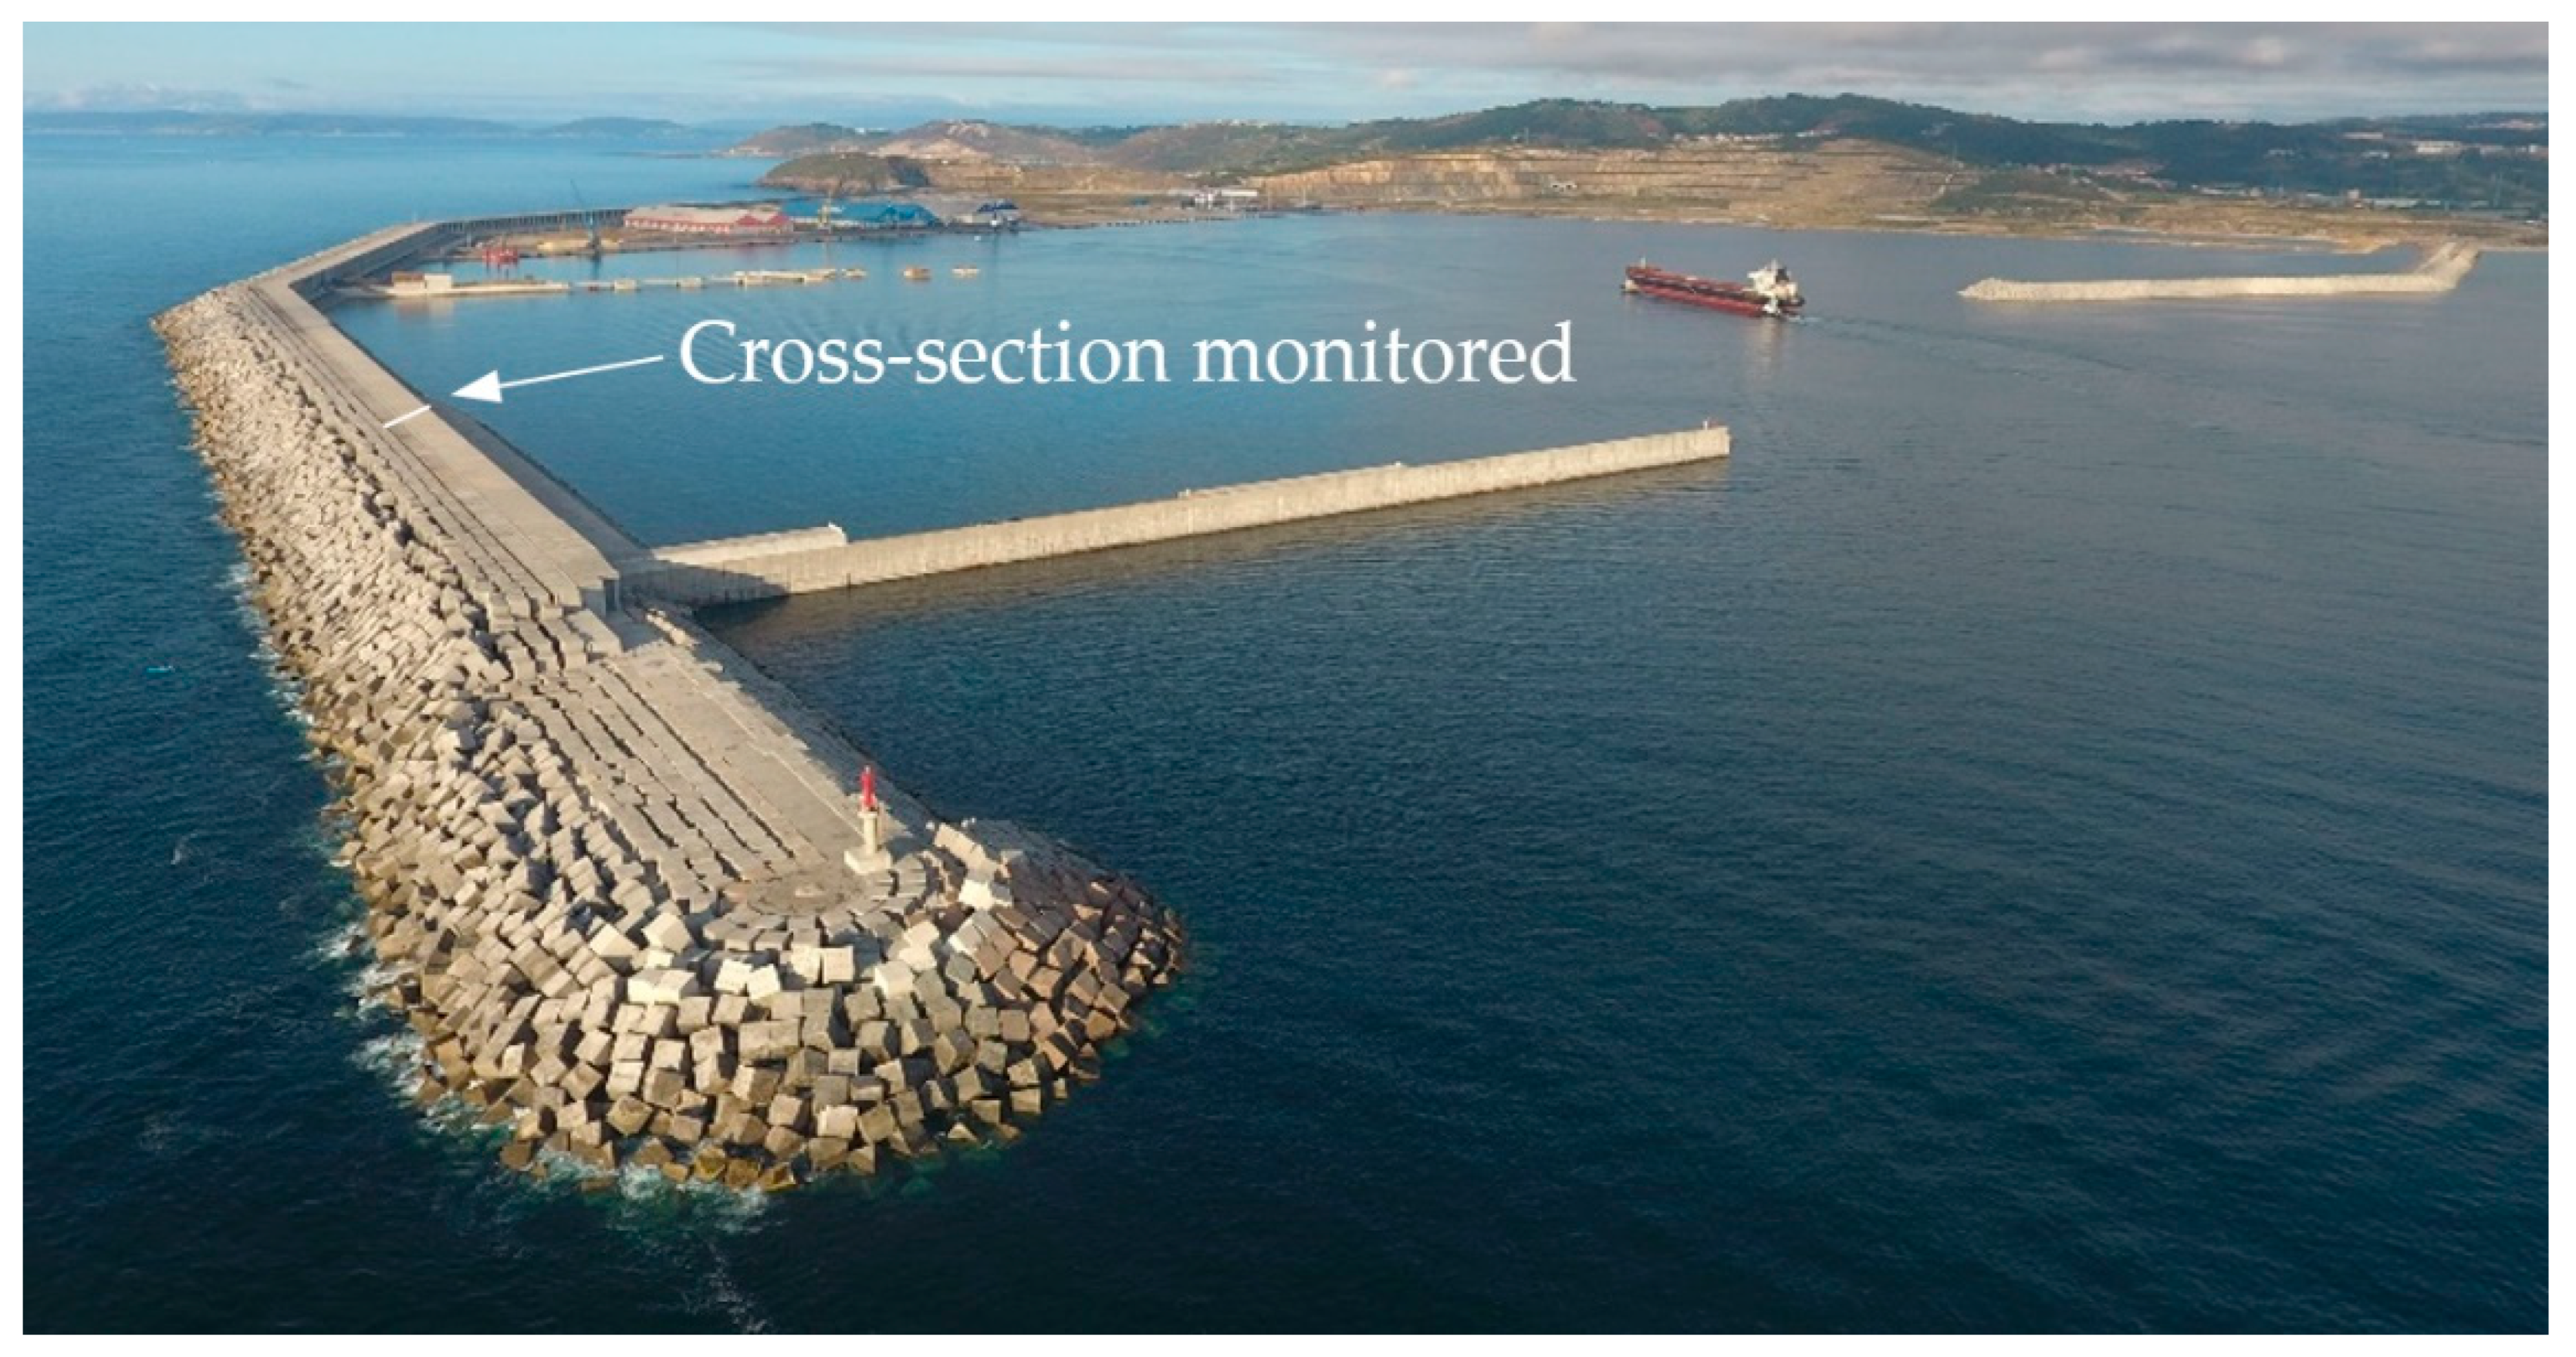
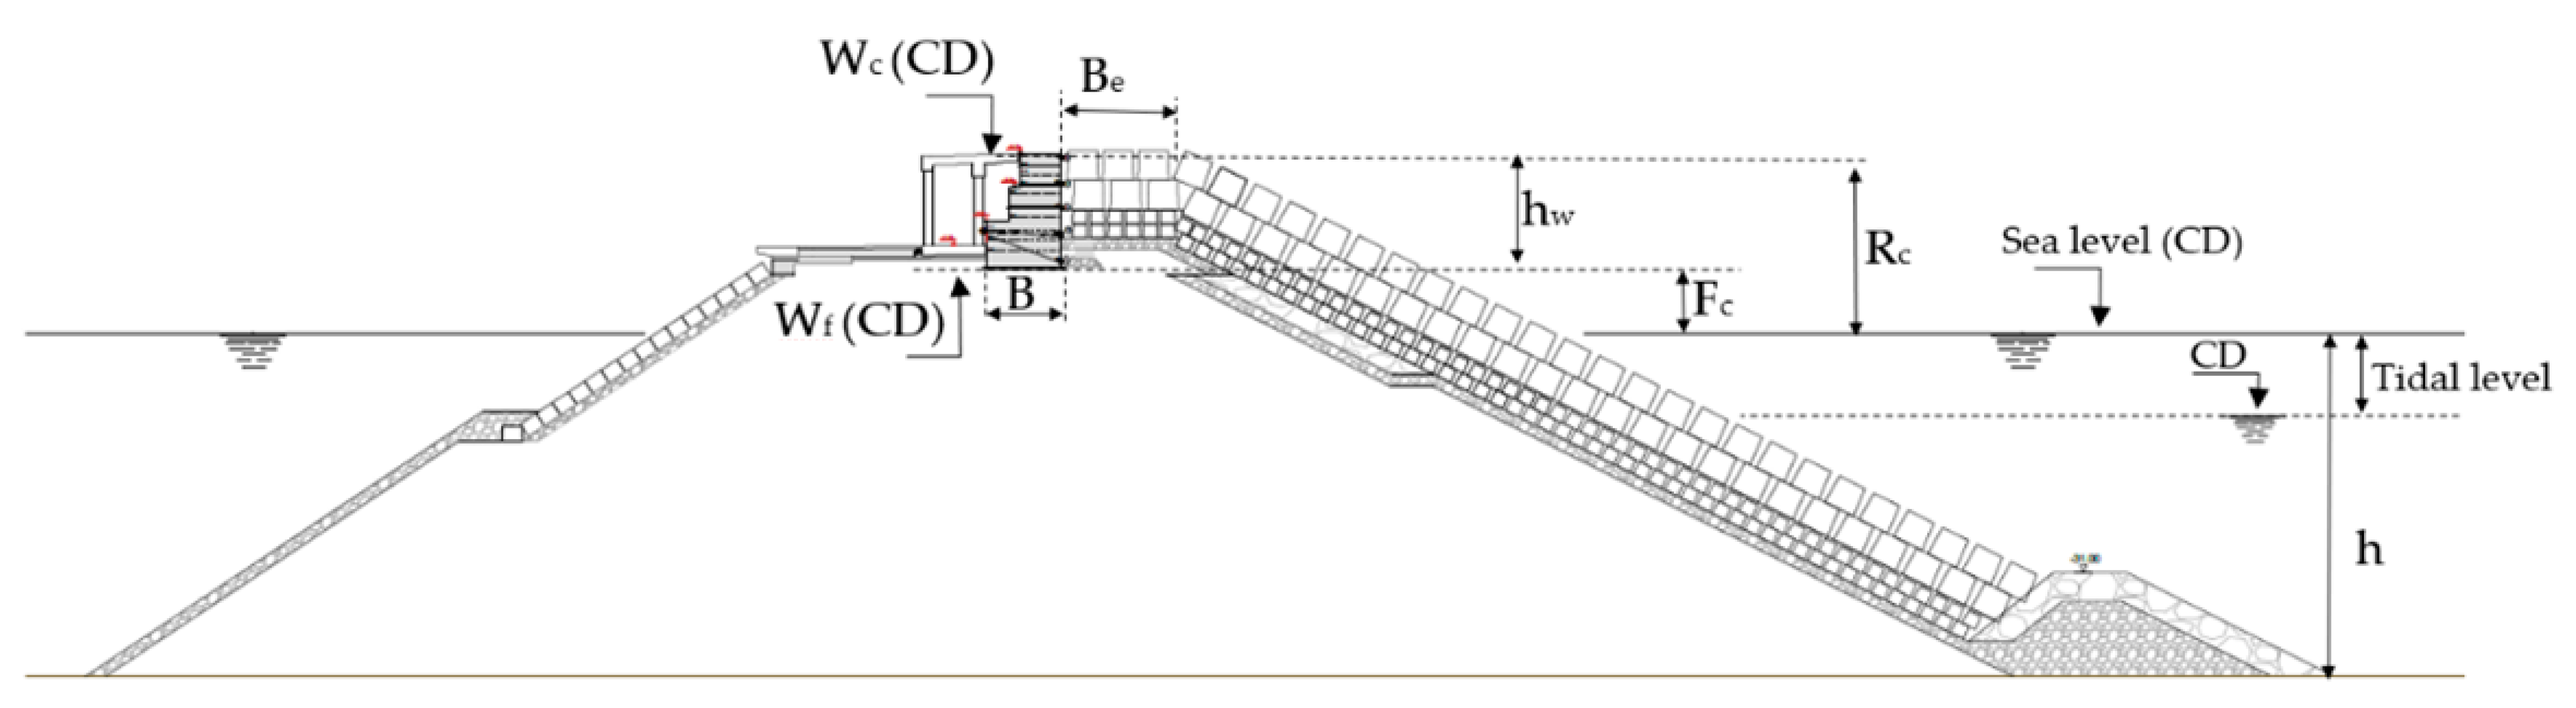
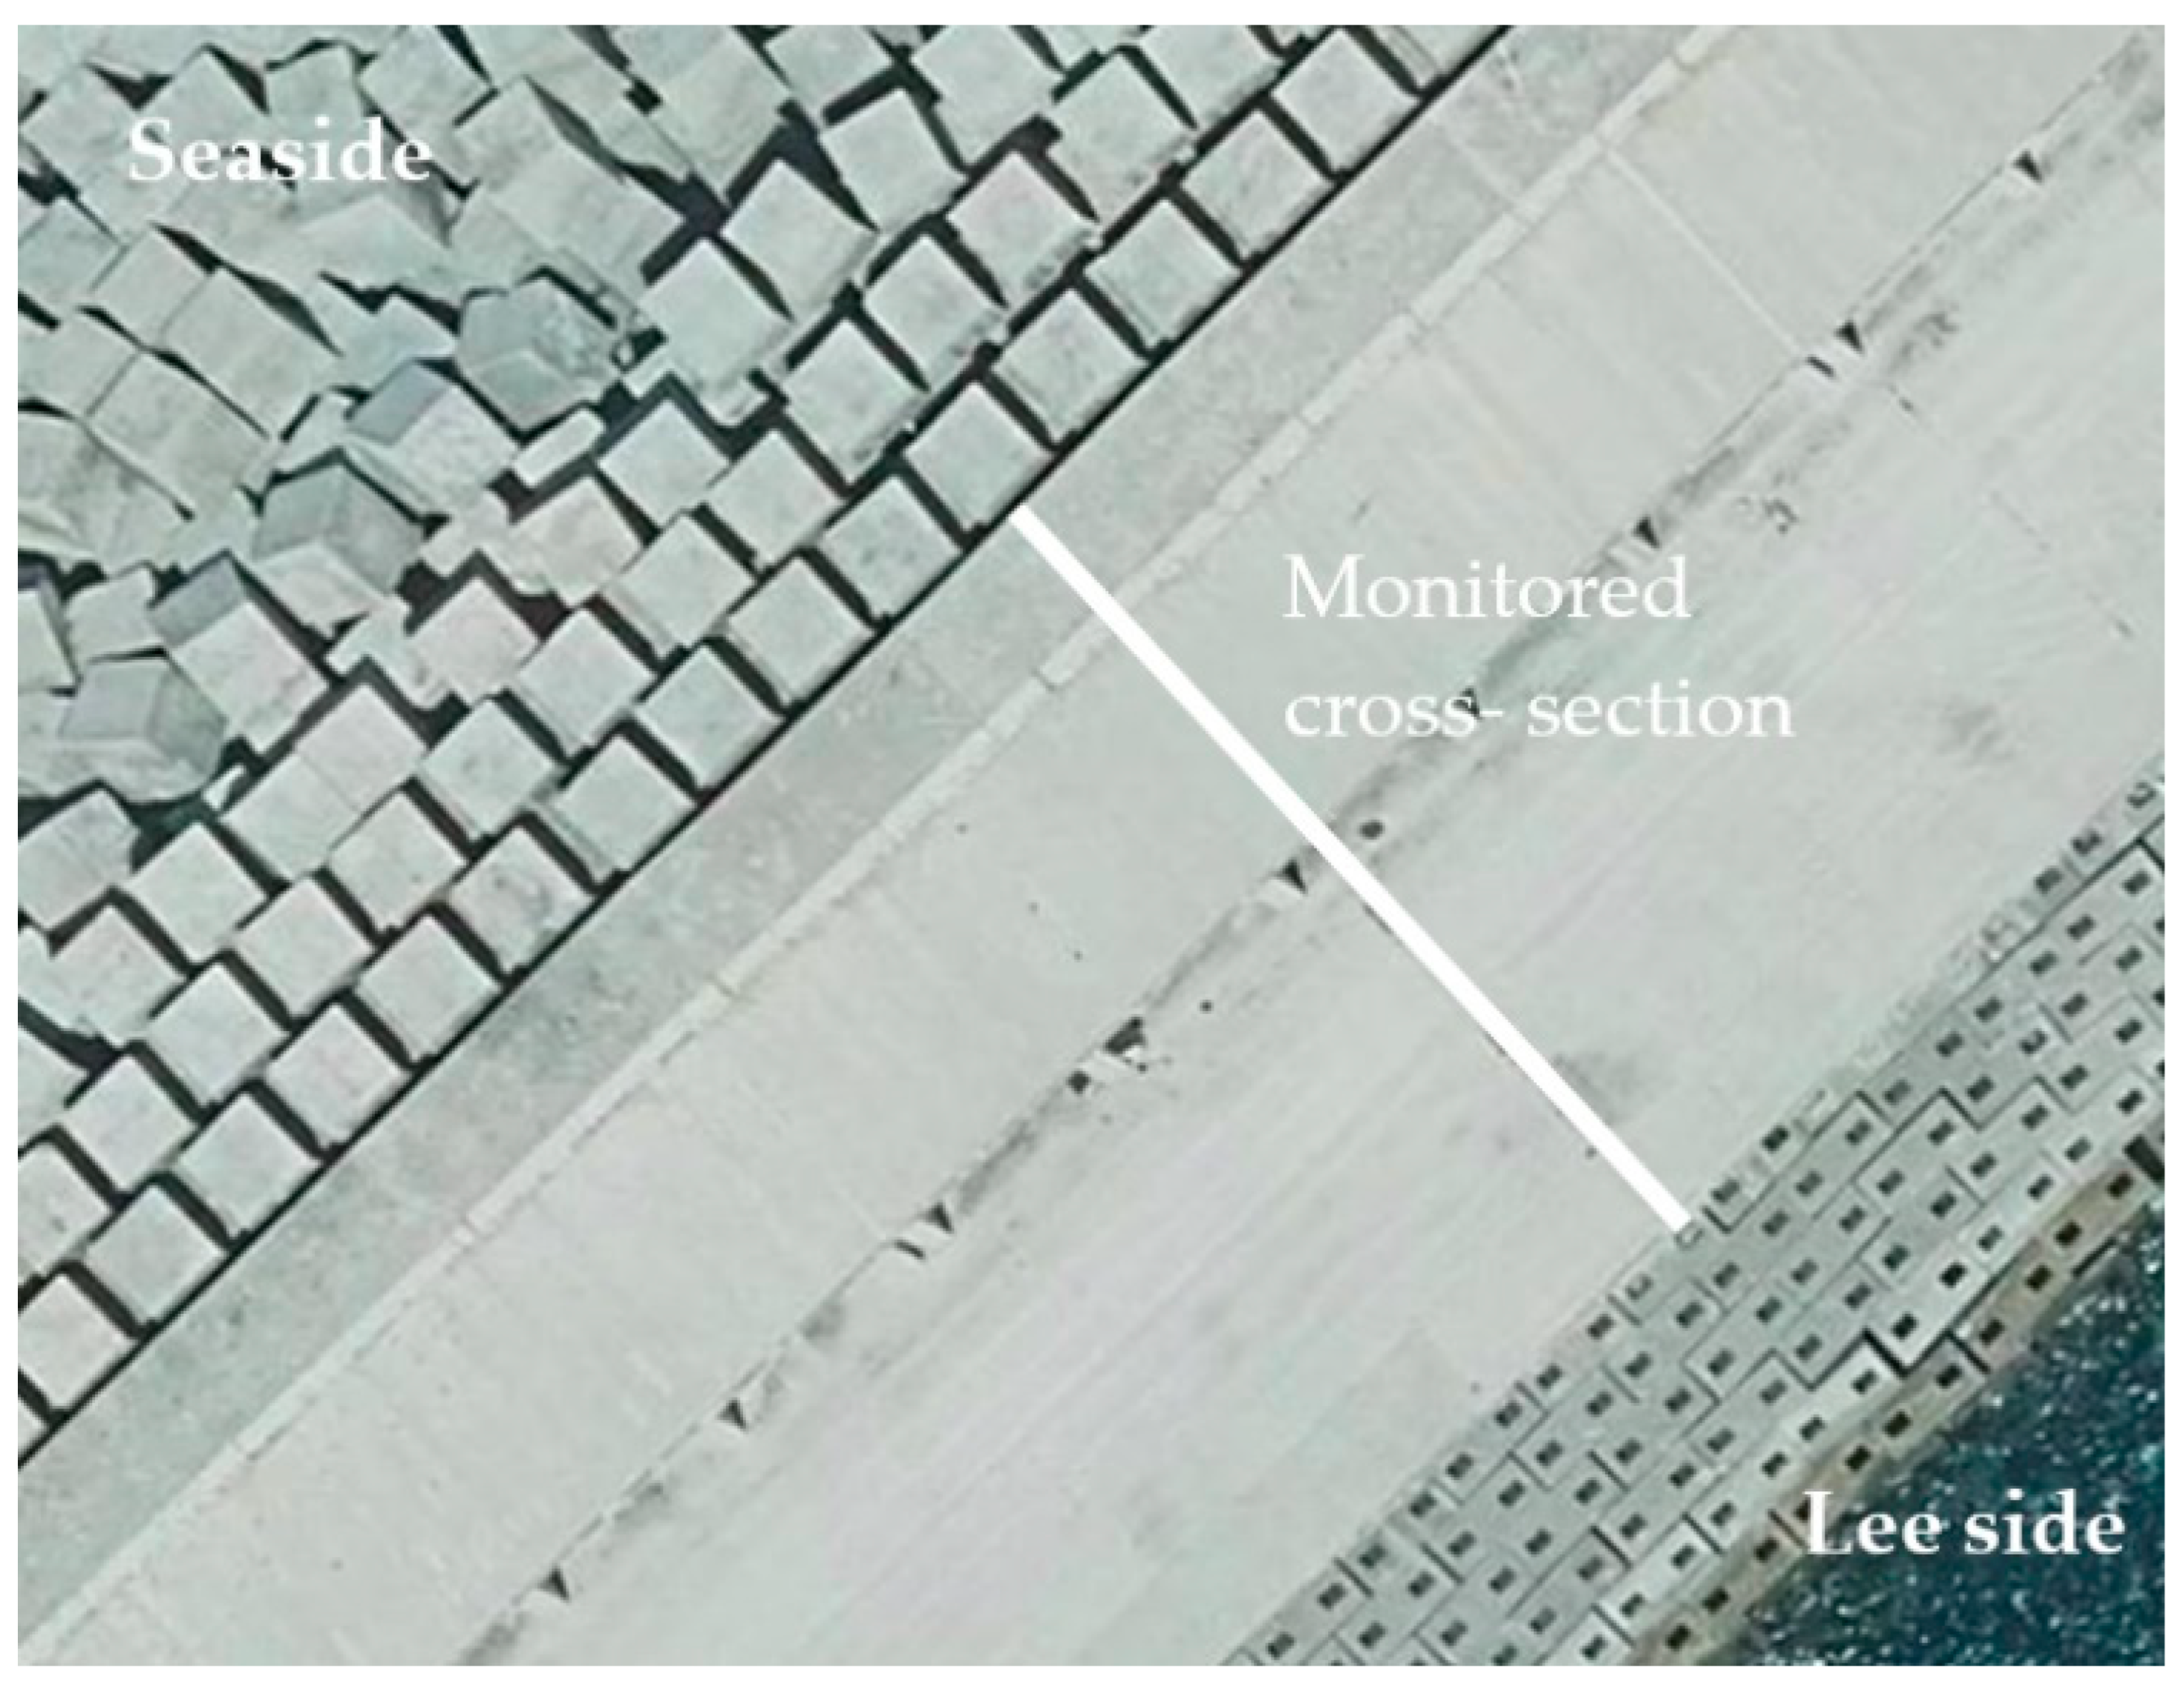
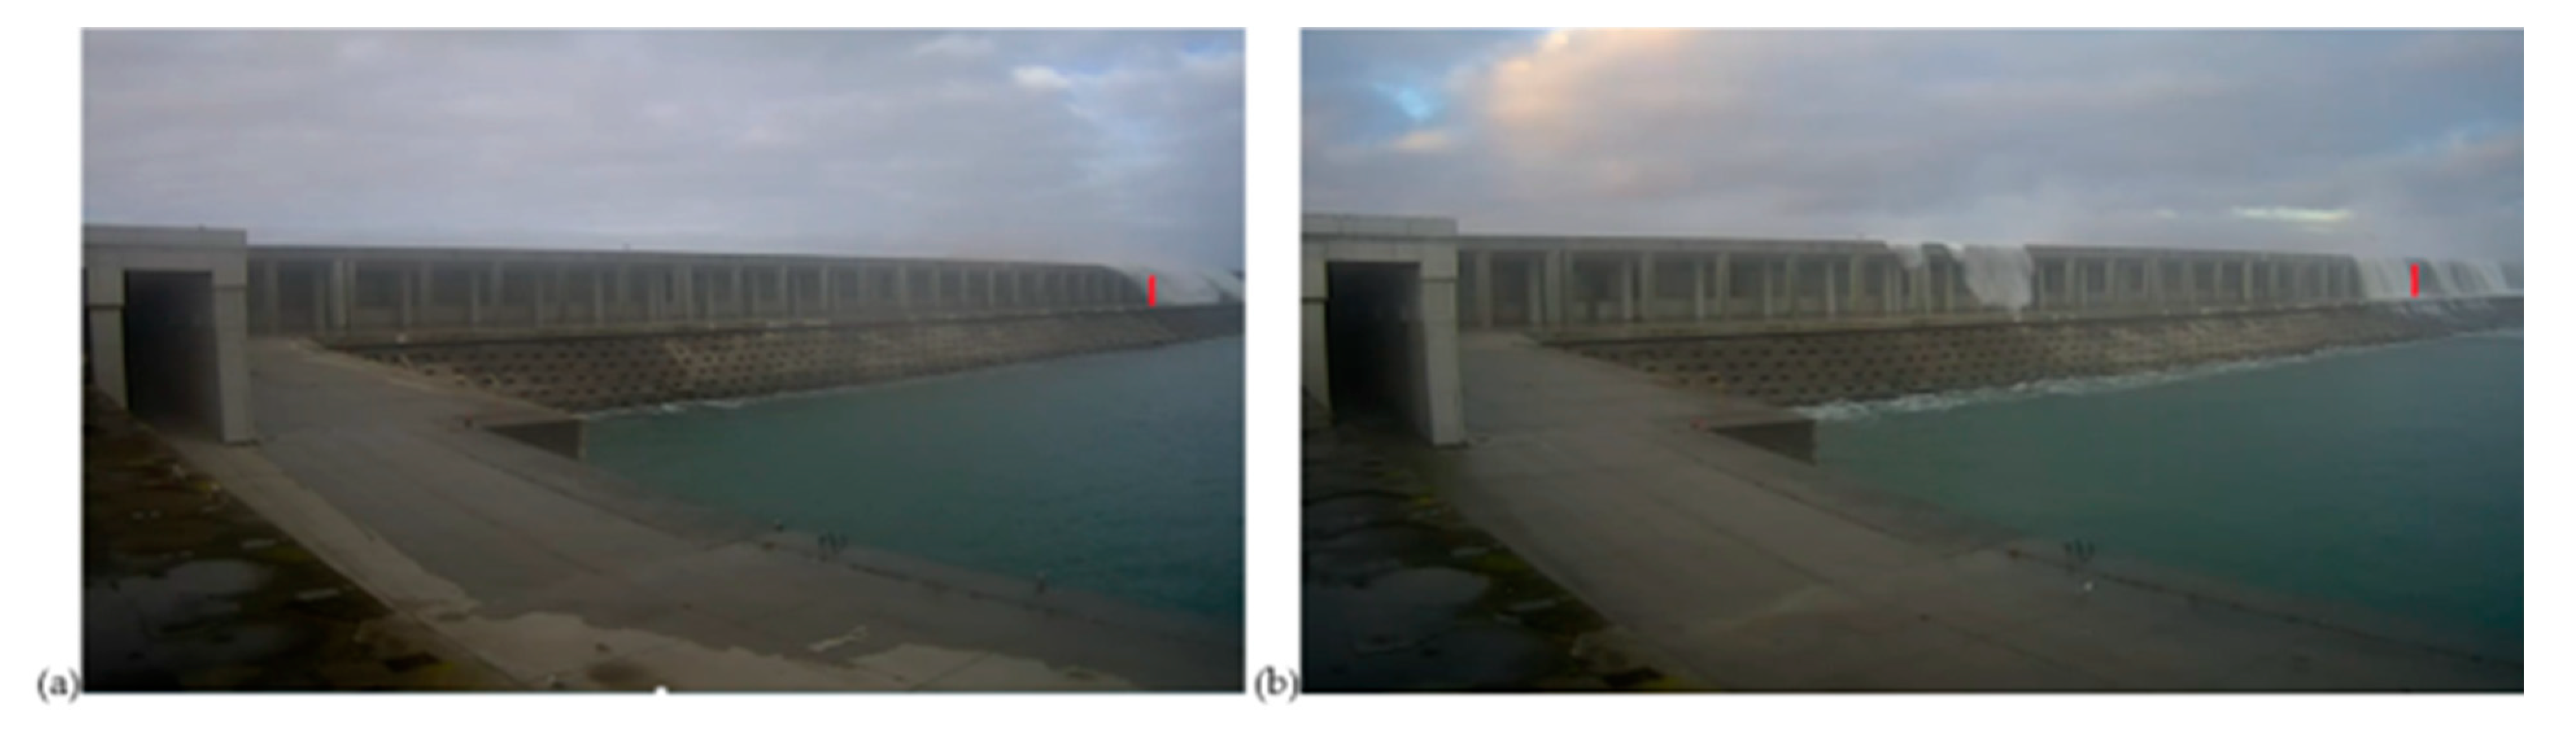
3.1. Rubble Mound Breakwater Description
3.2. Storm Events Analyzed
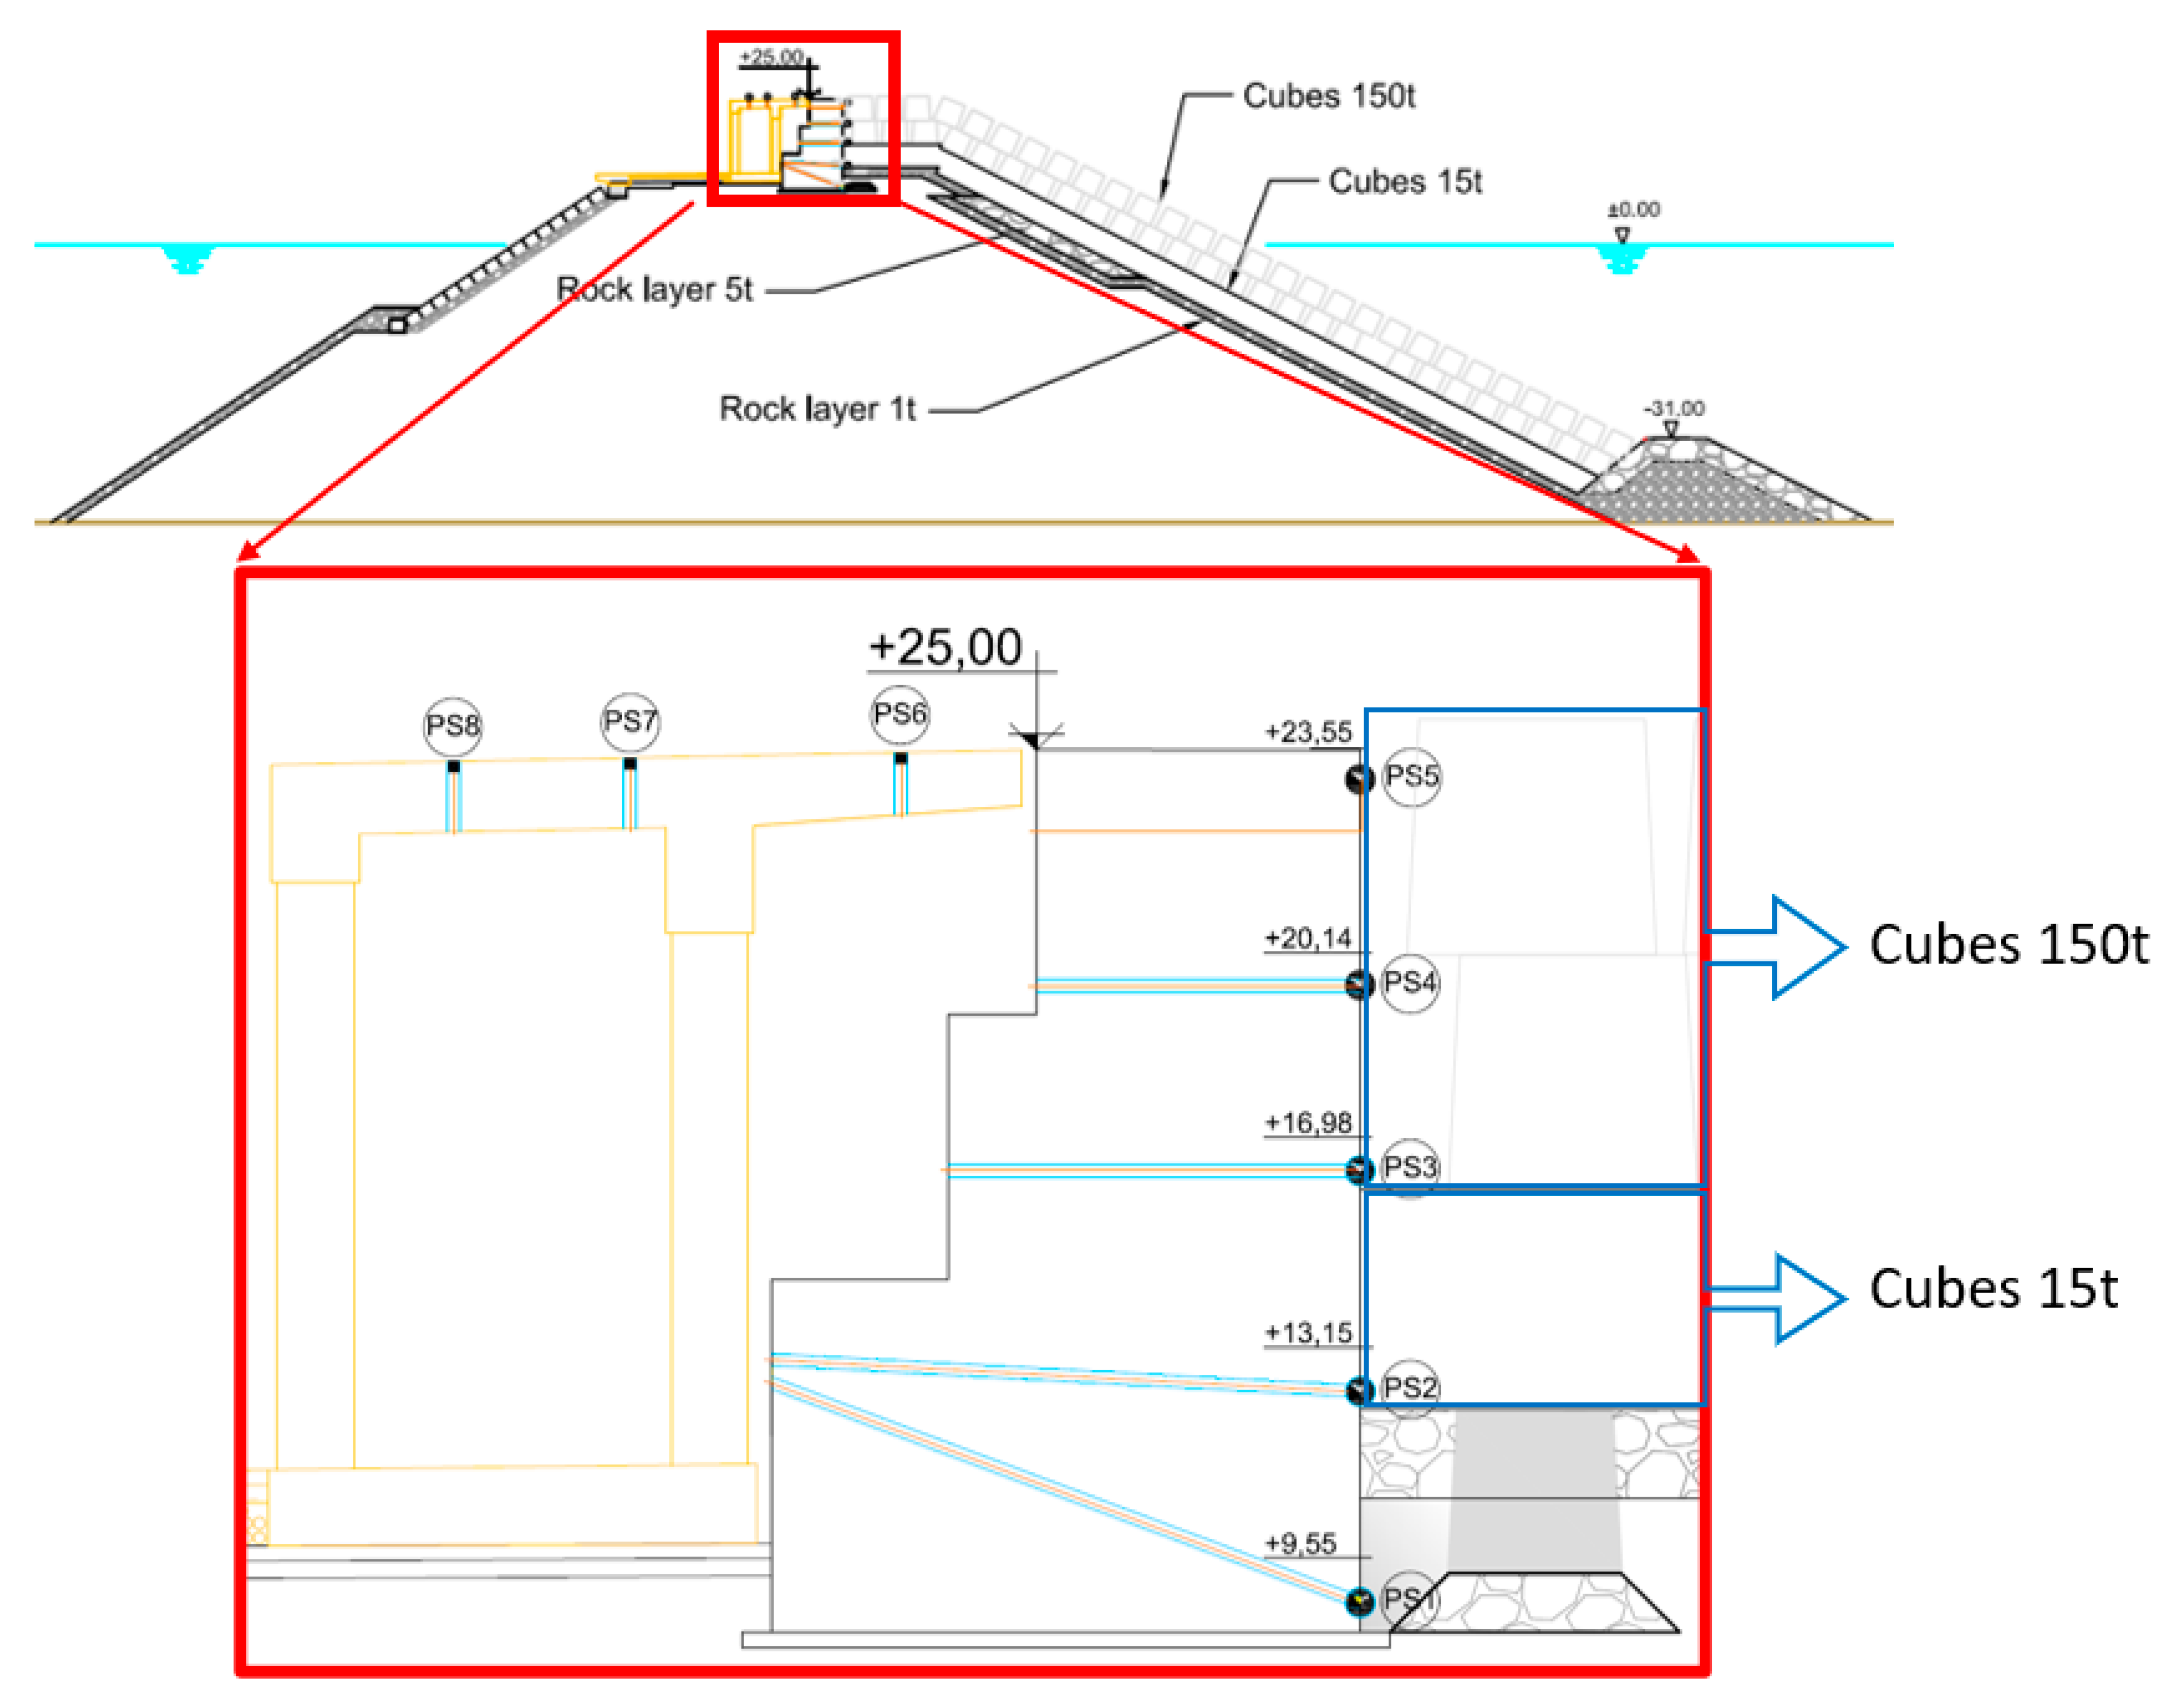
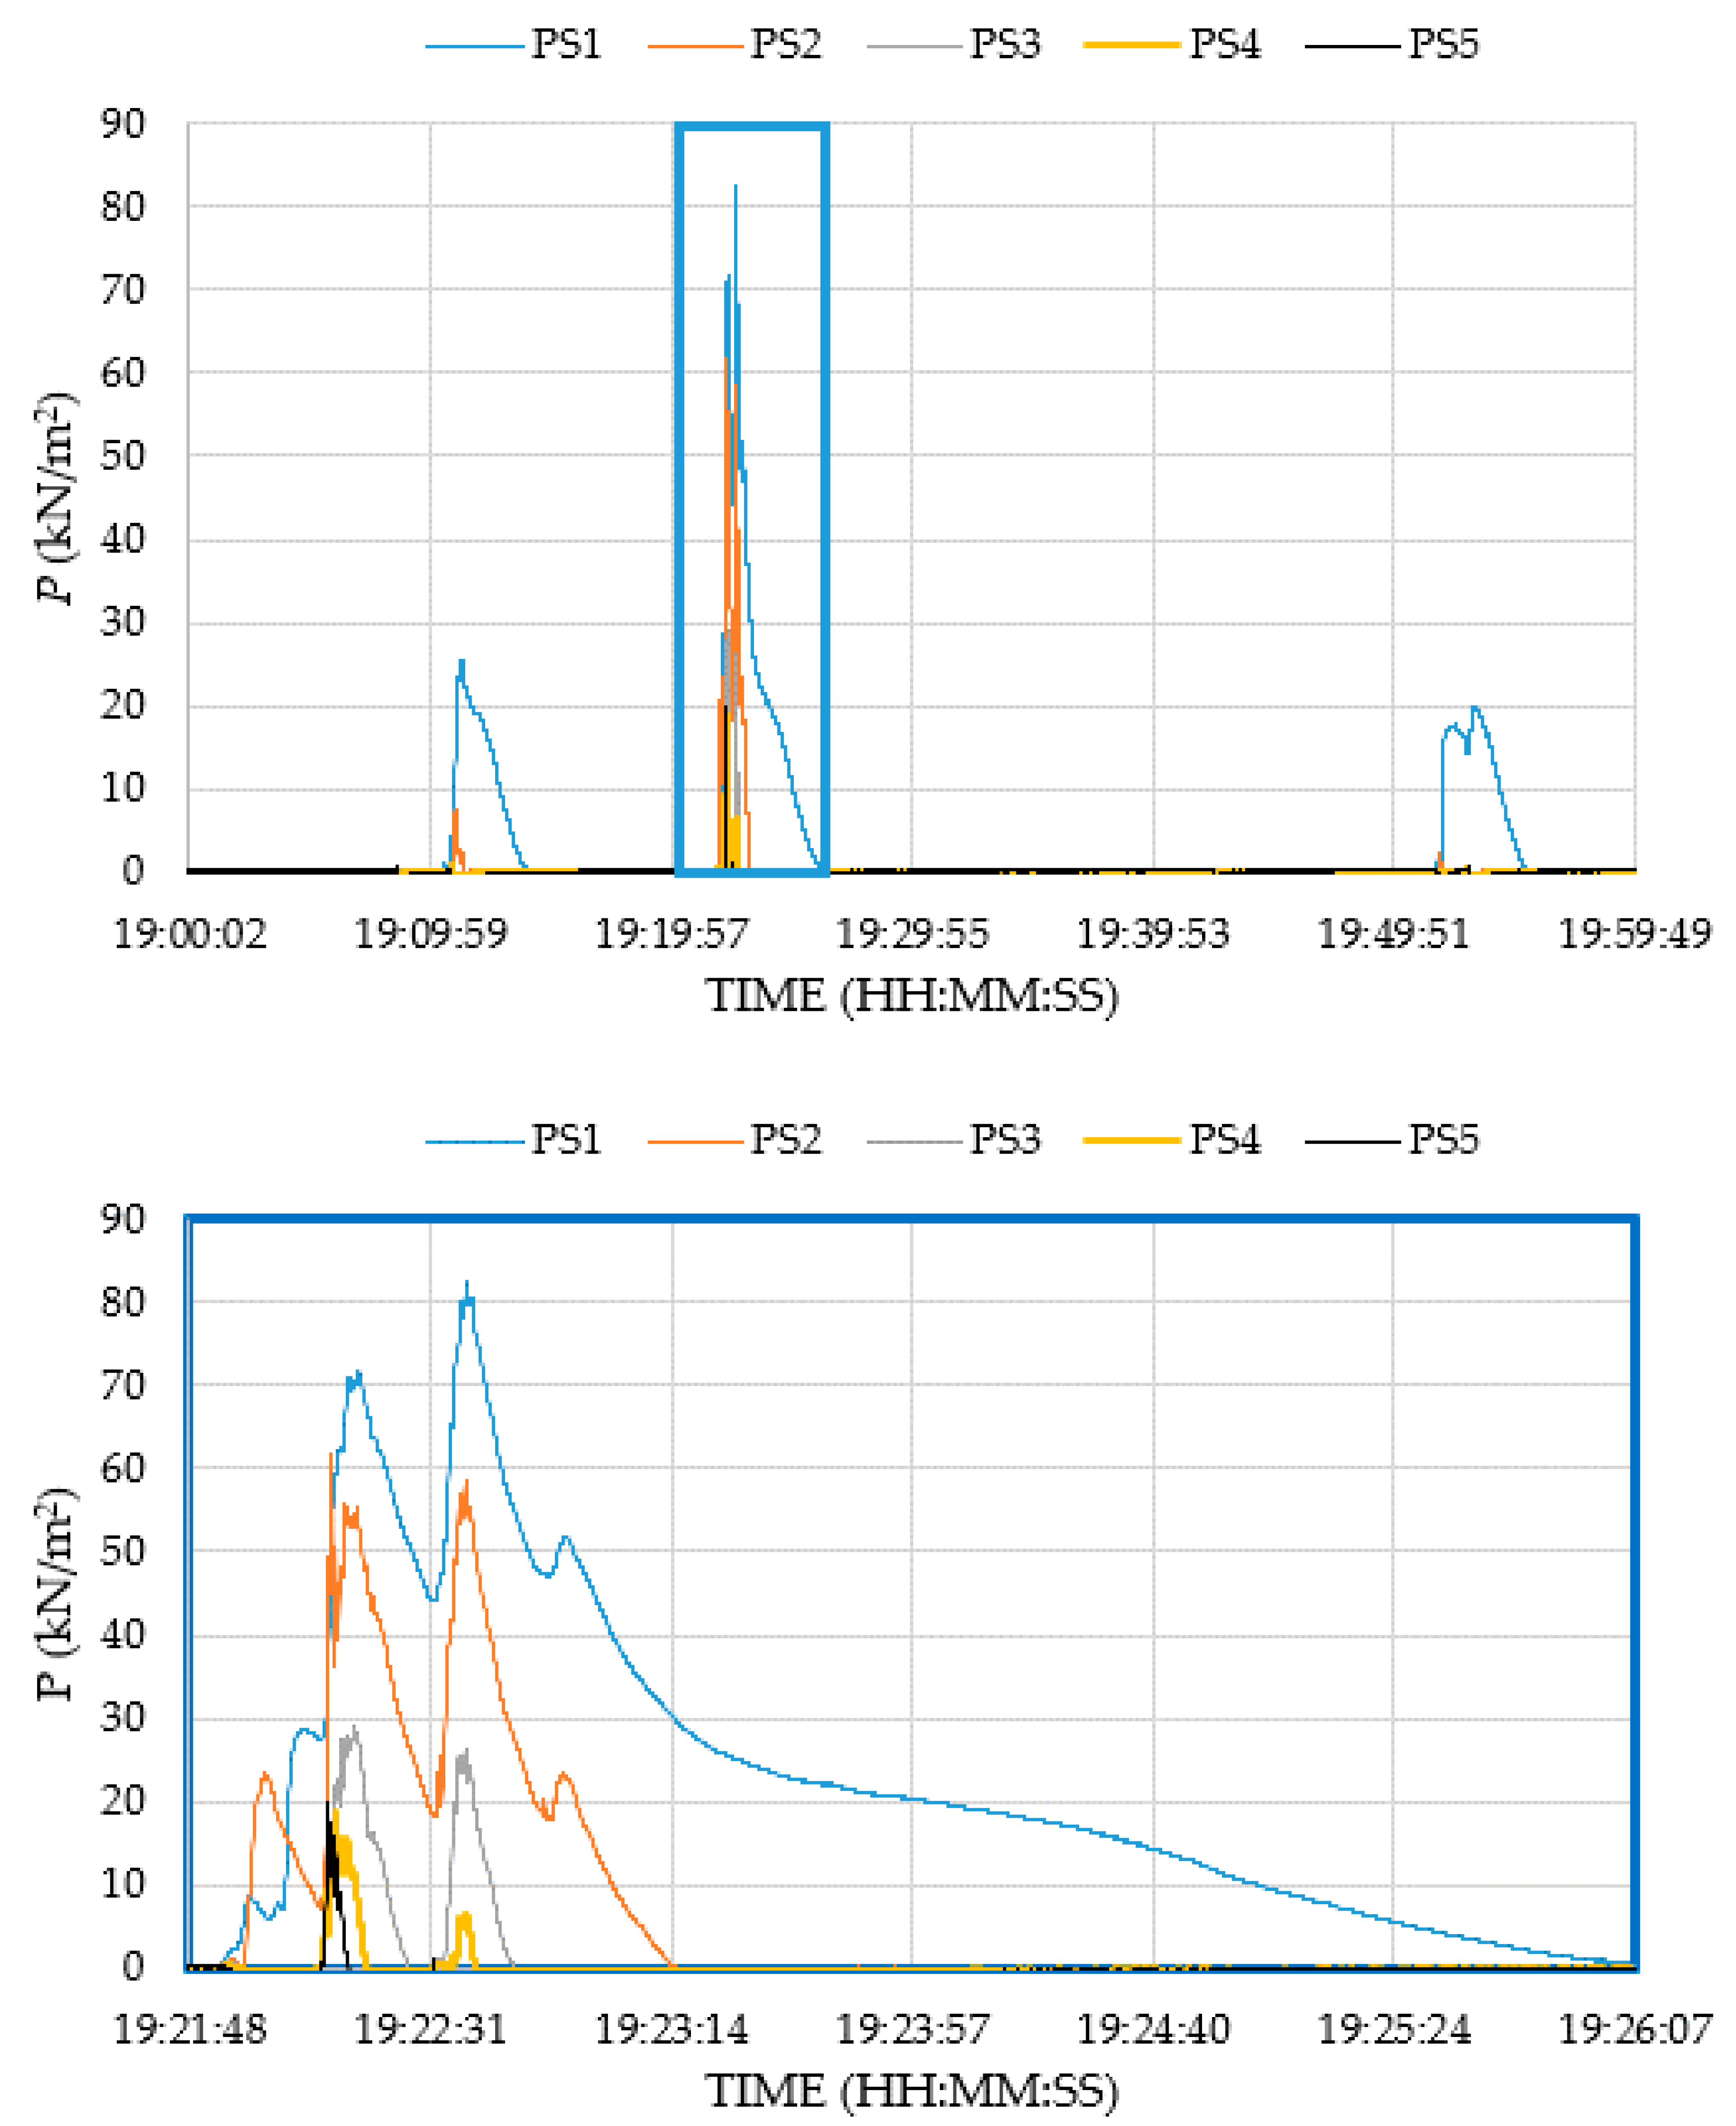
3.3. Presure Measured on the Crown Wall Front Wall
4. Results
4.1. Equation Application
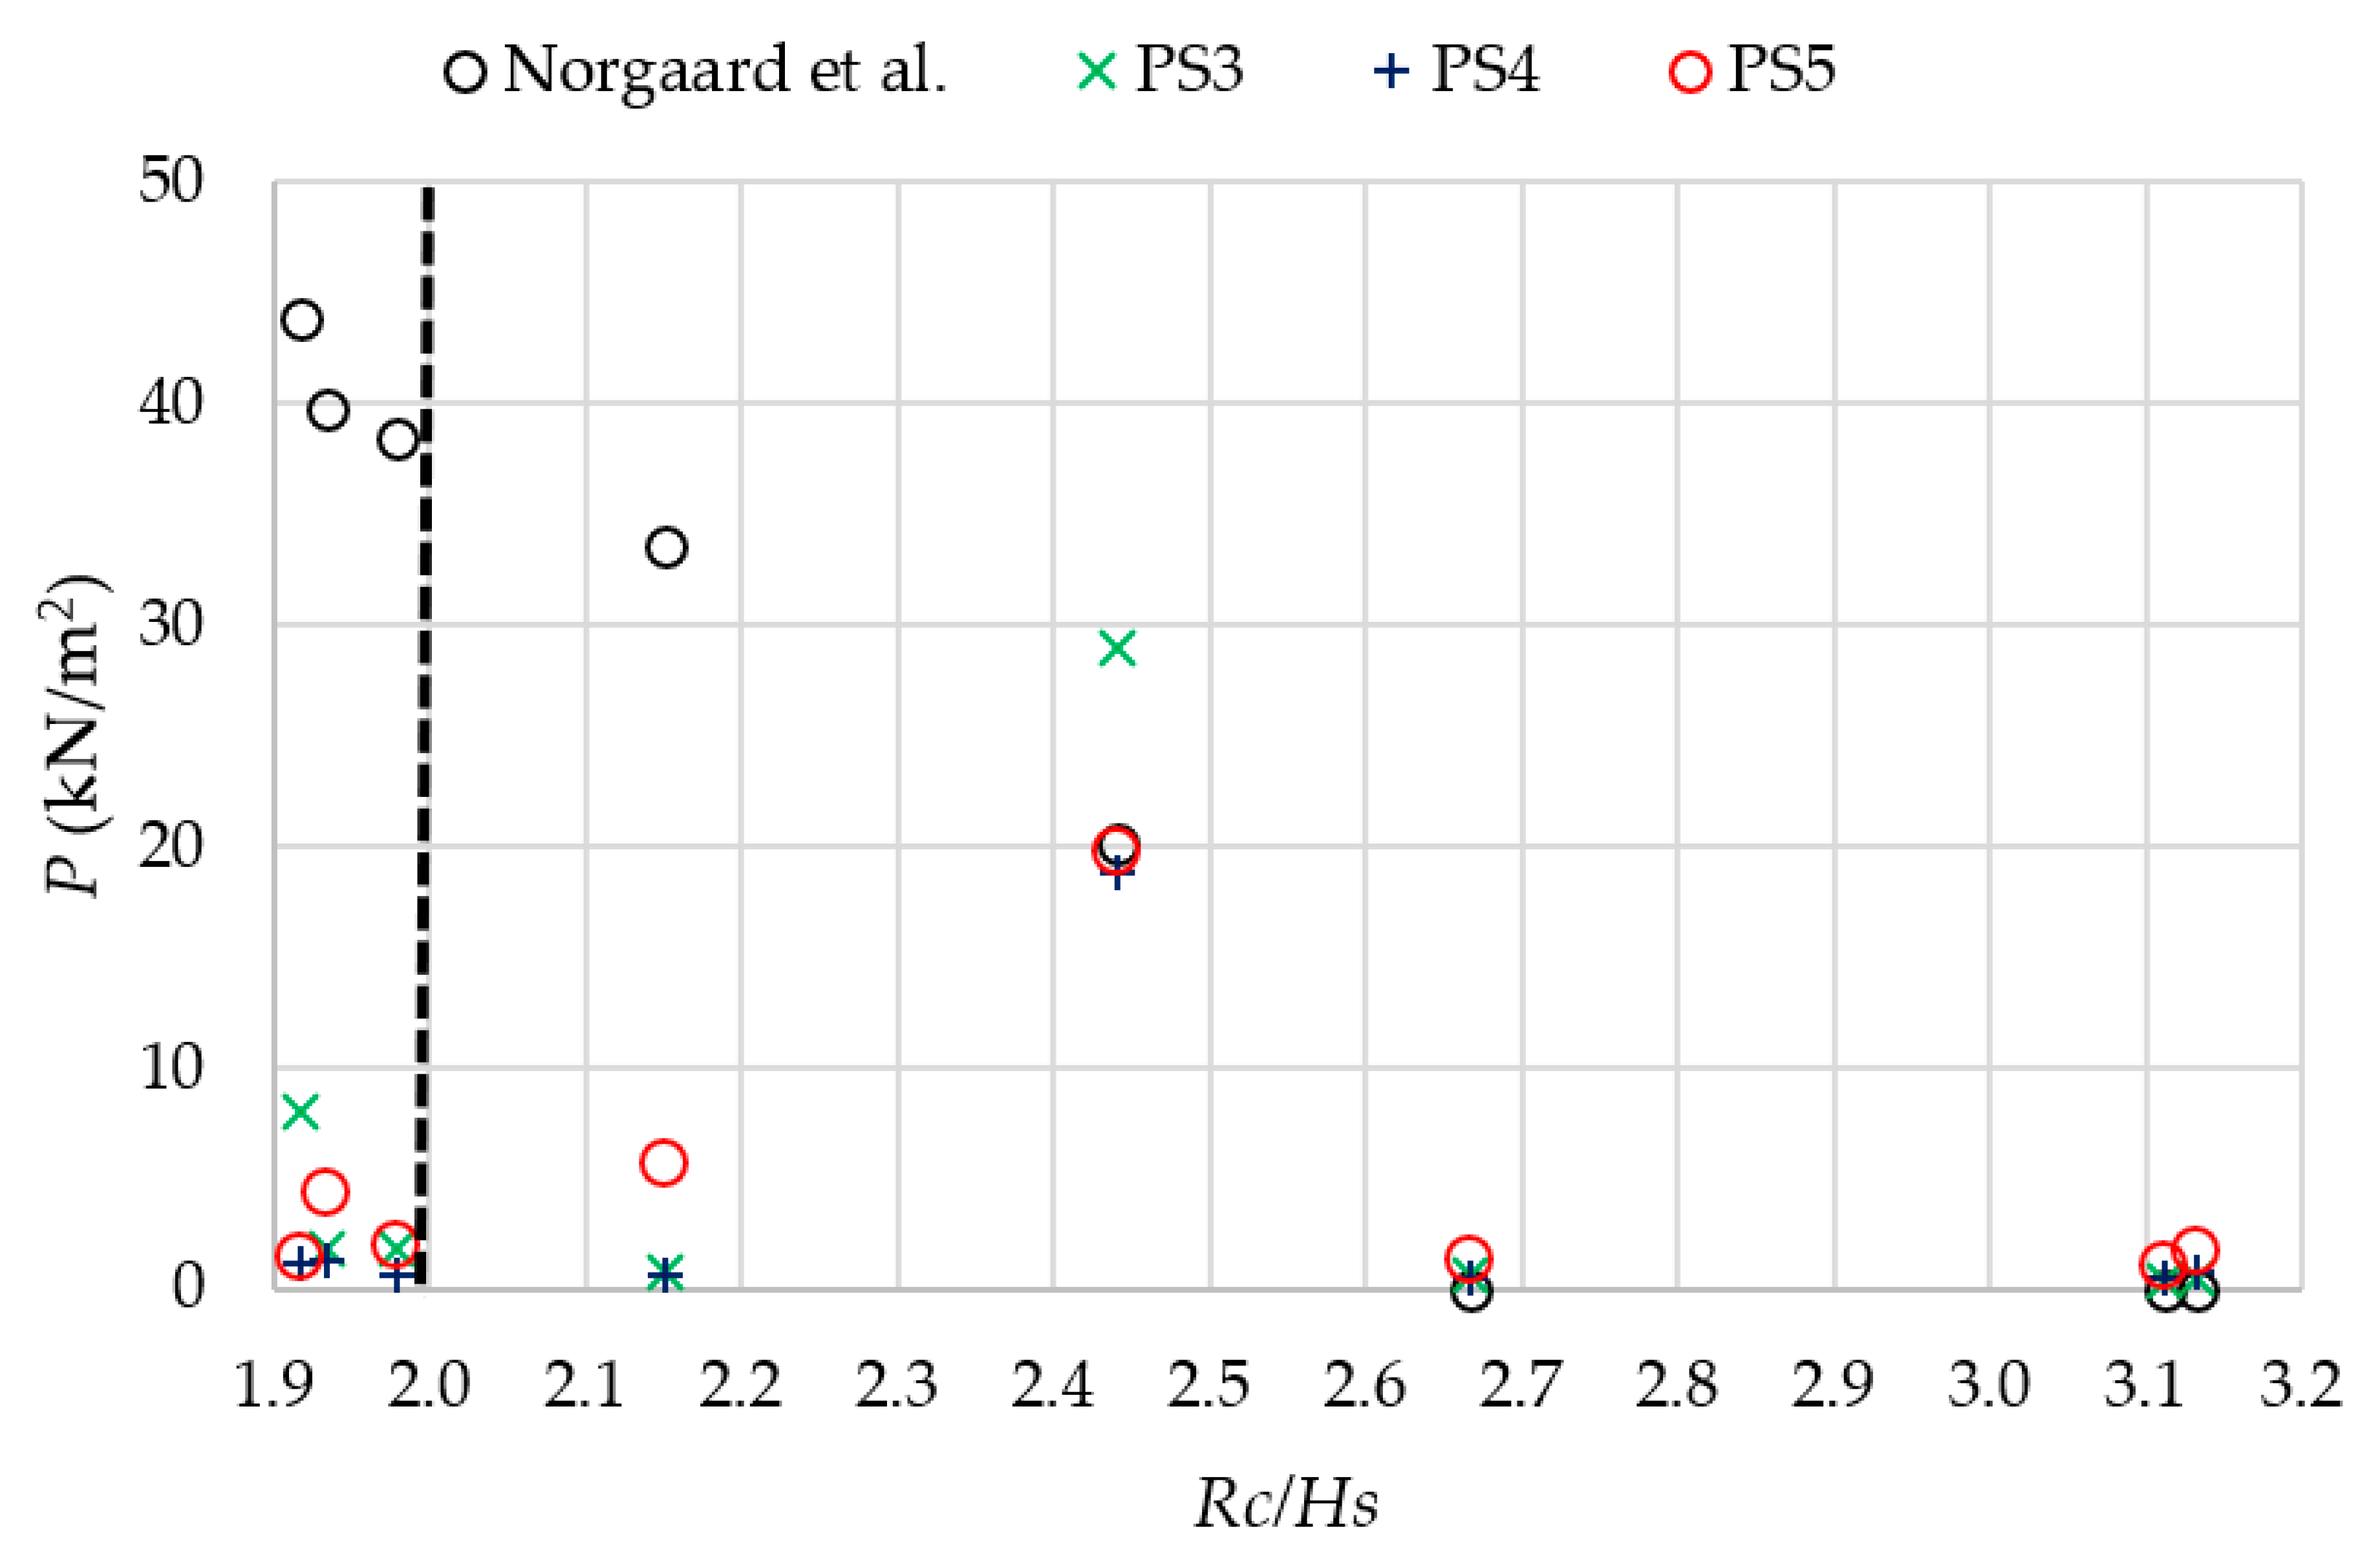
4.2. Comparison of Pressure Data Measured and Estimated by Formulas
5. Conclusions
Author Contributions
Funding
Institutional Review Board Statement
Informed Consent Statement
Data Availability Statement
Acknowledgments
Conflicts of Interest
References
- Li, J.; Cheng, J.; Liu, S. An experimental study on the hydrodynamic performance of the twin vertical baffles underflow breakwater. Ocean Eng. 2022, 256, 111566. [Google Scholar] [CrossRef]
- Mahmoudof, S.M.; Eyhavand-Koohzadi, A.; Bagheri, M. Field study of wave reflection from permeable rubble mound breakwater of Chabahar Port. Appl. Ocean Res. 2021, 114, 102786. [Google Scholar] [CrossRef]
- Berenguer, J.M.; Baonza, A. On the design of crown walls of rubble mound breakwaters. In Proceedings of the 31st PIANC Congress, Estoril, Portugal, 14–18 May 2006; pp. 608–624. [Google Scholar]
- Lacasa, M.C.; Esteban, M.D.; López-Gutiérrez, J.S.; Negro, V.; Zang, Z. Feasibility study of the installation of wave energy converters in existing breakwaters in the north of Spain. Appl. Sci. 2019, 9, 5225. [Google Scholar] [CrossRef]
- Han, X.; Jiang, Y.; Dong, S. Wave forces on crown wall of rubble mound breakwater under swell waves. Ocean Eng. 2022, 259, 111911. [Google Scholar] [CrossRef]
- Negro, V.; Martín-Antón, M.; del Campo, J.M.; López-Gutiérrez, J.S.; Esteban, M.D. Crown walls in mass and reinforced concrete: The way to aesthetics in maritime works. In Coasts, Marine Structures and Breakwaters 2017: Realising the Potential; ICE Publishing: London, UK, 2018. [Google Scholar]
- Martín-Antón, M.; Negro, V.; del Campo, J.M.; López-Gutiérrez, J.S.; Esteban, M.D. The Impact of Public Works in Spain: Natural, constructed and destroyed landscape. J. Constr. 2017, 16, 82–91. [Google Scholar]
- Iribarren, R.; Nogales, C. Obras Marítimas; Dossat Ed: Madrid, Spain, 1964. [Google Scholar]
- Jensen, O.J. A Monograph on Rubble Mound Breakwaters; Danish Hydraulic Institute: Hørsholm, Denmark, 1984. [Google Scholar]
- Bradbury, A.P.; Allsop, N.W.H.; Stephens, R.V. Hydraulic Performance of Breakwater Crown Walls; Report SR146; HR Wallingford: Wallingford, UK, 1988. [Google Scholar]
- Günbak, A.R.; Gökçe, T. Wave screen stability of rubble-mound breakwaters. In Proceedings of the International Symposium of Maritime Structures in the Mediterranean Sea, Athens, Greece, 22–25 November 1984; pp. 2.99–2.112. [Google Scholar]
- Martín, F.L.; Losada, M.A.; Medina, R. Wave loads on rubble mound breakwater crown walls. Coast. Eng. 1999, 37, 149–174. [Google Scholar] [CrossRef]
- Pedersen, J. Wave Forces and Overtopping on Crown Walls of Rubble Mound Breakwaters: An Experimental Study. Ph.D. Thesis, Aalborg University, Aalborg, Denmark, 1996. [Google Scholar]
- Pedersen, J.; Burcharth, H.F. Wave force on crown walls. In Proceedings of the 23rd International Conference on Coastal Engineering, ASCE, Venice, Italy, 4–9 October 1992; pp. 1489–1502. [Google Scholar]
- Nørgaard, J.Q.H.; Andersen, T.L.; Burcharth, H.F. Wave loads on rubble mound breakwater crown walls in deep and shallow water wave conditions. Coast. Eng. 2013, 80, 137–147. [Google Scholar] [CrossRef]
- Negro, V.; López-Gutiérrez, J.S.; Polvorinos Flors, J.I. Comparative study of breakwater crown wall—Calculation methods. Proc. Inst. Civ. Eng. Marit. Eng. 2013, 166, 25–41. [Google Scholar]
- Molines, J.; Herrera, M.P.; Medina, J.R. Estimation of wave forces on crown walls based on wave overtopping rates. Coast. Eng. 2018, 132, 50–62. [Google Scholar] [CrossRef]
- CIRIA/CUR/CETMEF. Physical processes and design tools: Crown walls. In The Rock Manual: The Use of Rock in Hydraulic Engineering, 2nd ed.; CIRIA: London, UK, 2007. [Google Scholar]
- United States Army Corps of Engineers (USACE). Coastal Engineering Manual; USACE: Washington, DC, USA, 2008.
- Losada, M.A. Recent developments in the design of mound breakwaters. In Handbook of Coast and Ocean Eng; Gulf Publishing: Houston, TX, USA, 1990; pp. 939–1050. [Google Scholar]
- Pereira, F.; Neves, M.G.; López-Gutiérrez, J.-S.; Esteban, M.D.; Negro, V. Comparison of Existing Equations for the Design of Crown Walls: Application to the Case Study of Ericeira Breakwater (Portugal). J. Mar. Sci. Eng. 2021, 9, 285. [Google Scholar] [CrossRef]
- Webpage of Intergovernmental Panel on Climate Change (IPCC). Available online: www.ipcc.ch (accessed on 3 January 2021).
- Diez, J.J.; Esteban, M.D.; Paz, R.; López-Gutiérrez, J.S.; Negro, V.; Monnot, J.V. Urban coastal flooding and climate change. J. Coast. Res. 2011, 64, 205–209. [Google Scholar]
- Negro, V.; López-Gutiérrez, J.S.; Esteban, M.D.; del Campo, J.M.; Luengo, J. Action strategy for studying marine and coastal works with climate change on the horizon. J. Coast. Res. 2018, 85, 506–510. [Google Scholar] [CrossRef]
- Negro, V.; López-Gutiérrez, J.S.; Esteban, M.D.; Matutano, C. An analysis of recent changes in Spanish Coastal Law. J. Coast. Res. 2014, 70, 448–453. [Google Scholar] [CrossRef]
- Díaz-Sánchez, R.; López-Gutiérrez, J.S.; Lechuga, A.; Negro, V.; Esteban, M.D. Direct estimation wave setup as a medium level in swash. J. Coast. Res. 2013, 65, 201–206. [Google Scholar] [CrossRef]
- Sande, J.; Peña, E.; Maciñeira, E.; Figuero, A. 3D physical modelling for checking Level III probabilistic design in breakwaters: A case study in Punta Langosteira Port, Spain. Coast. Eng. J. 2019, 61, 460–471. [Google Scholar] [CrossRef]
- Webpage of Port of A Coruña. Available online: http://www.puertocoruna.com/es (accessed on 29 July 2022).


| Parameter | Value |
|---|---|
| Be | 24.05 m (CD) |
| h | 45.8 m |
| hw | 6.0 m |
| B | 10.0 m |
| Wc | 24.0 m (CD) |
| Wf | 9.05 m |
| Storm Event | Hs (m) | Hmax (m) | Tp (s) | Dir (oN) | Tidal Level (m) |
|---|---|---|---|---|---|
| a | 10.78 | 14.80 | 19.20 | 329.00 | 2.66 |
| b | 9.69 | 13.81 | 20.00 | 327.00 | 3.16 |
| c | 10.65 | 14.86 | 18.90 | 327.00 | 3.40 |
| d | 10.78 | 13.98 | 19.70 | 327.00 | 3.33 |
| e | 8.45 | 12.49 | 15.40 | 334.00 | 1.46 |
| f | 7.21 | 10.58 | 14.30 | 332.00 | 1.41 |
| g | 7.09 | 9.87 | 14.30 | 330.00 | 1.94 |
| h | 9.40 | 14.10 | 20.00 | 319.00 | 1.06 |
| Time (h:min:s) | PS1 (kN/m2) | PS2 (kN/m2) | PS3 (kN/m2) | PS4 (kN/m2) | PS5 (kN/m2) |
|---|---|---|---|---|---|
| 19:22:12 | 35.38 | 39.89 | 12.67 | 7.49 | 19.80 |
| 19:22:14 | 58.87 | 36.04 | 20.98 | 18.86 | 15.75 |
| 19:22:17 | 70.40 | 53.75 | 29.00 | 10.71 | −1.57 |
| 19:22:13 | 52.66 | 61.64 | 15.71 | 12.47 | 16.84 |
| 19:22:37 | 82.59 | 57.12 | 25.98 | 6.61 | −1.76 |
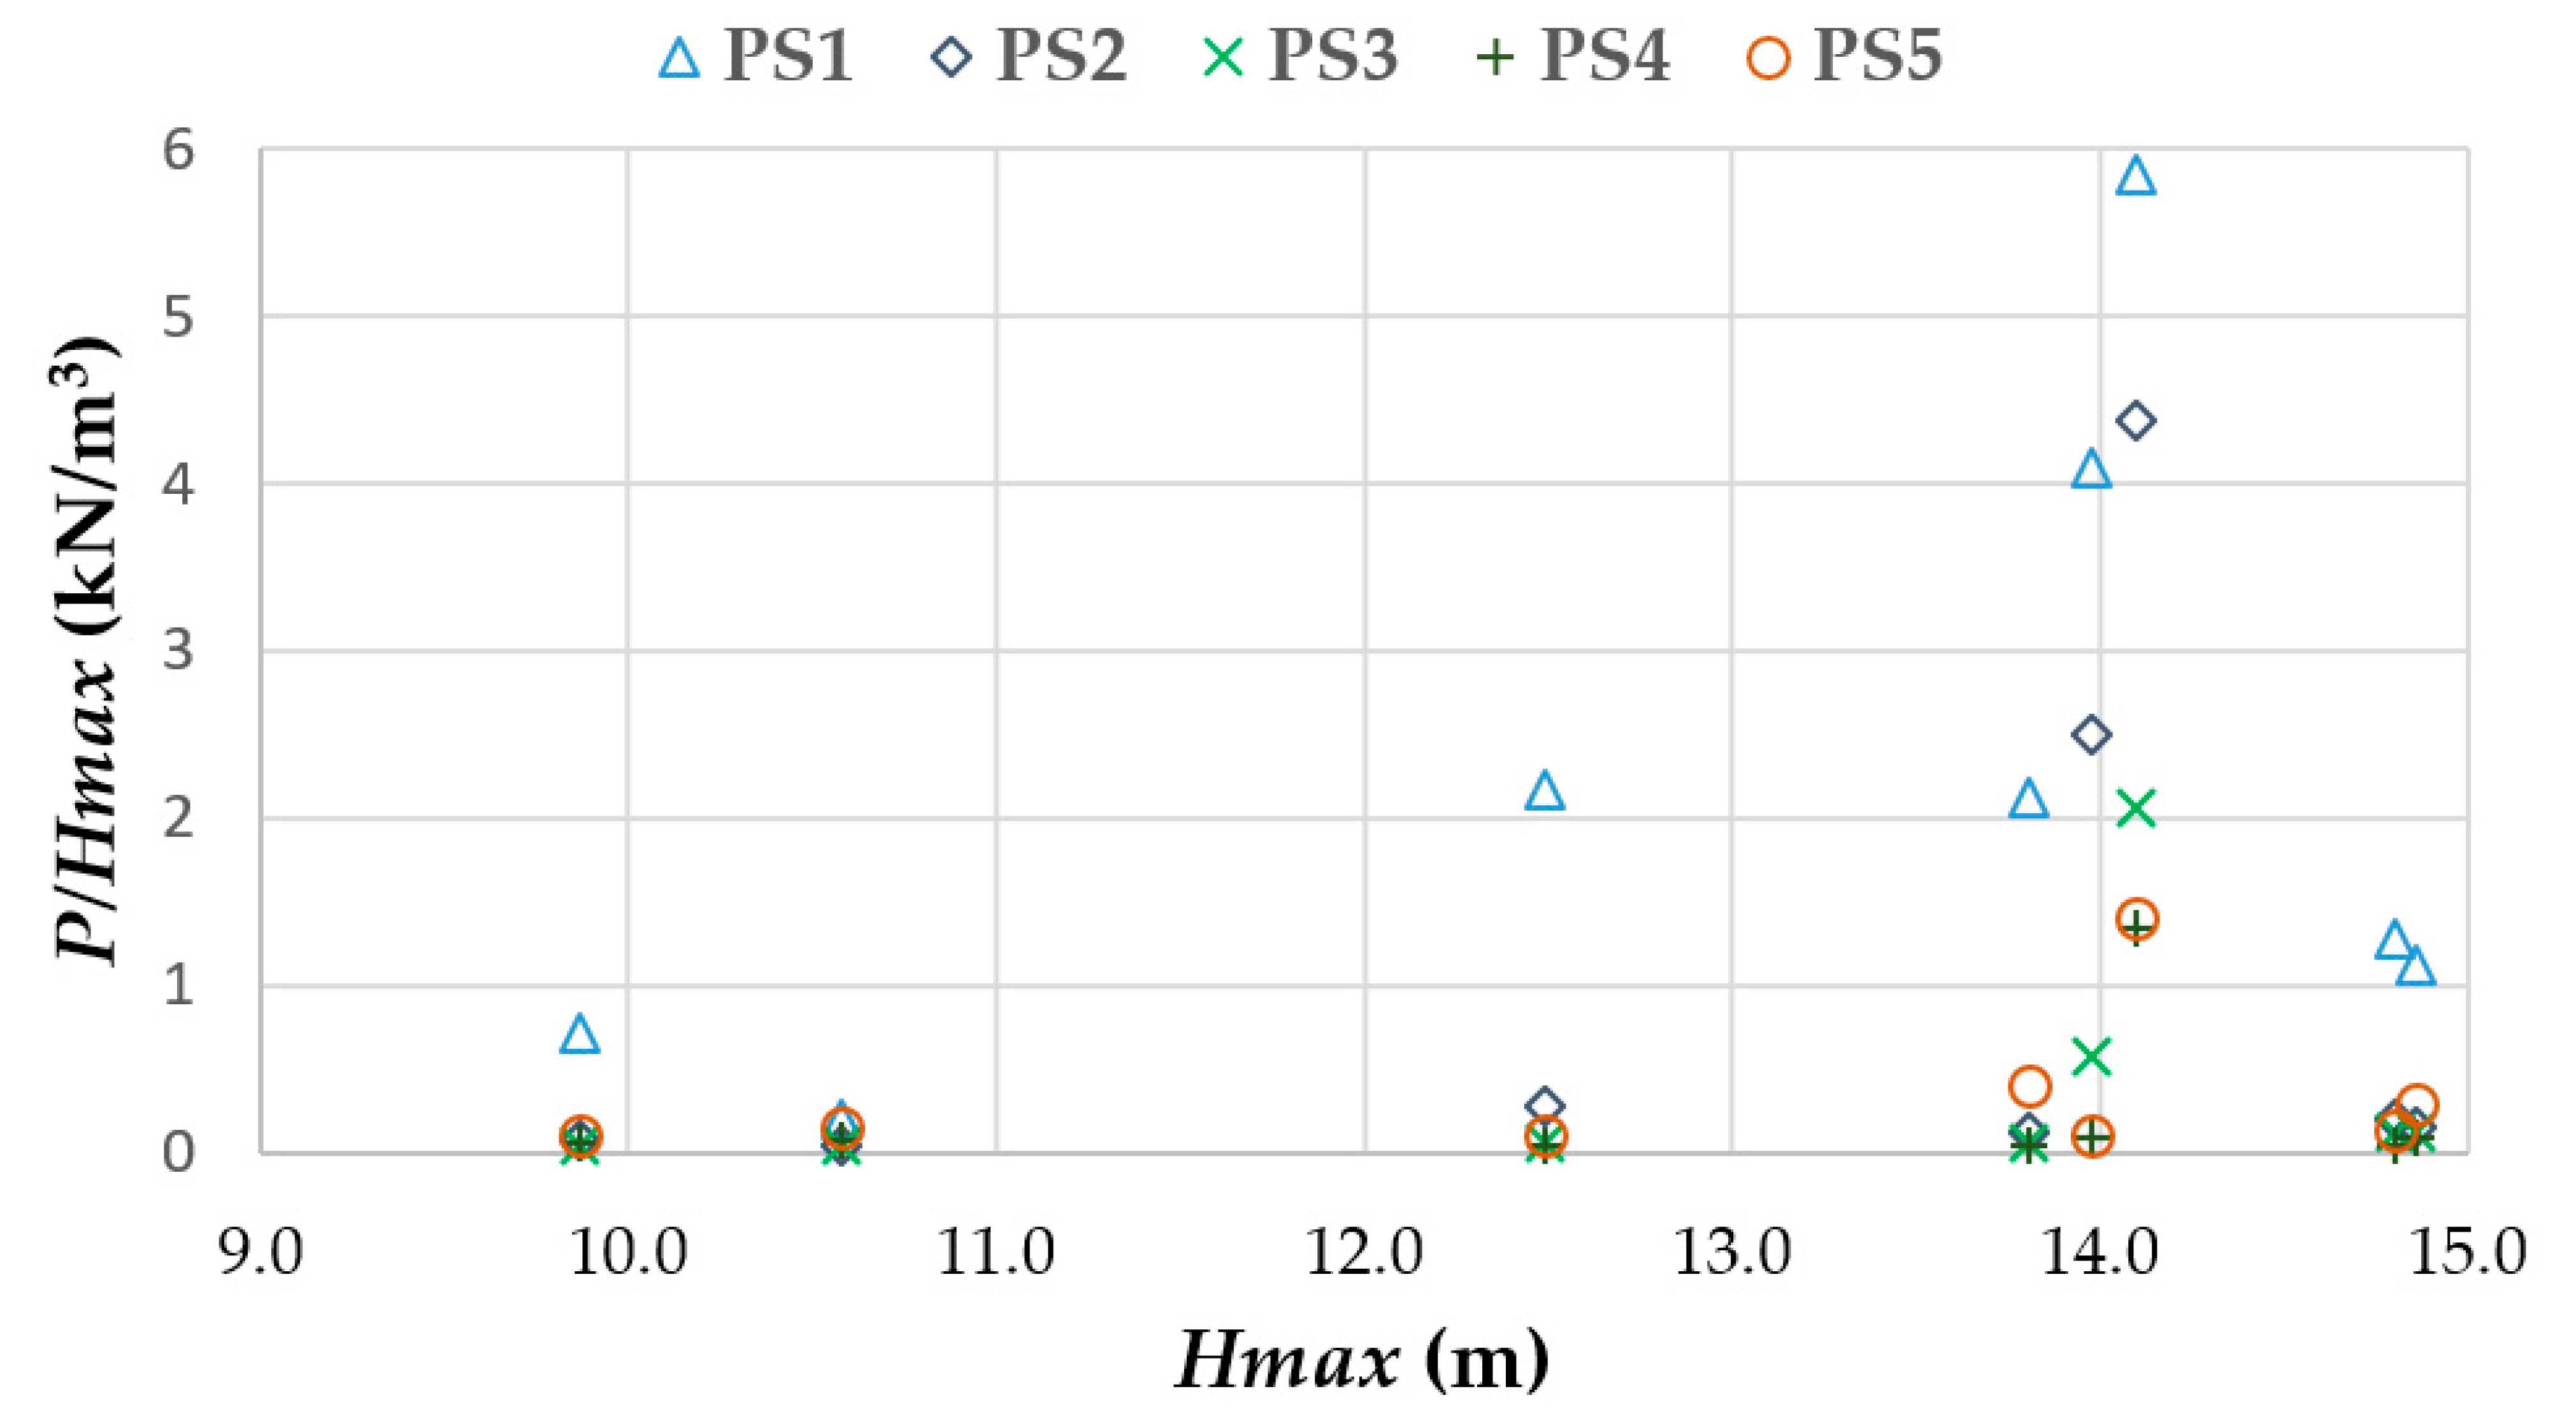
| Storm Event | P/Hmax (kN/m3) at | ||||
|---|---|---|---|---|---|
| PS1 | PS2 | PS3 | PS4 | PS5 | |
| a | 1.28 | 0.20 | 0.12 | 0.04 | 0.14 |
| b | 2.12 | 0.11 | 0.06 | 0.04 | 0.40 |
| c | 1.13 | 0.15 | 0.12 | 0.09 | 0.29 |
| d | 4.09 | 2.50 | 0.58 | 0.08 | 0.10 |
| e | 2.17 | 0.28 | 0.06 | 0.04 | 0.10 |
| f | 0.20 | 0.05 | 0.05 | 0.07 | 0.15 |
| g | 0.72 | 0.08 | 0.04 | 0.05 | 0.10 |
| h | 5.86 | 4.37 | 2.06 | 1.34 | 1.40 |
| Storm Event | Rc/Hs (m) | PNorgaard et al. (kN/m2) | Maximum Pressure (kN/m2) at | ||
|---|---|---|---|---|---|
| PS3 | PS4 | PS5 | |||
| a | 1.98 | 38.51 | 1.83 | 0.59 | 1.99 |
| b | 2.15 | 33.53 | 0.78 | 0.57 | 5.58 |
| c | 1.93 | 39.80 | 1.82 | 1.26 | 4.31 |
| d | 1.92 | 43.88 | 8.06 | 1.18 | 1.44 |
| e | 2.67 | 0.00 | 0.69 | 0.49 | 1.24 |
| f | 3.13 | 0.00 | 0.48 | 0.69 | 1.62 |
| g | 3.11 | 0.00 | 0.40 | 0.48 | 0.97 |
| h | 2.44 | 20.08 | 29.00 | 18.85 | 19.80 |
Publisher’s Note: MDPI stays neutral with regard to jurisdictional claims in published maps and institutional affiliations. |
© 2022 by the authors. Licensee MDPI, Basel, Switzerland. This article is an open access article distributed under the terms and conditions of the Creative Commons Attribution (CC BY) license (https://creativecommons.org/licenses/by/4.0/).
Share and Cite
Sande, J.; Neves, M.G.; López-Gutiérrez, J.-S.; Esteban, M.D.; Figuero, A.; Negro, V. Field Campaign on Pressure on the Crown Wall at the Outer Port of Punta Langosteira Breakwater. J. Mar. Sci. Eng. 2022, 10, 1377. https://doi.org/10.3390/jmse10101377
Sande J, Neves MG, López-Gutiérrez J-S, Esteban MD, Figuero A, Negro V. Field Campaign on Pressure on the Crown Wall at the Outer Port of Punta Langosteira Breakwater. Journal of Marine Science and Engineering. 2022; 10(10):1377. https://doi.org/10.3390/jmse10101377
Chicago/Turabian StyleSande, José, Maria Graça Neves, José-Santos López-Gutiérrez, M. Dolores Esteban, Andrés Figuero, and Vicente Negro. 2022. "Field Campaign on Pressure on the Crown Wall at the Outer Port of Punta Langosteira Breakwater" Journal of Marine Science and Engineering 10, no. 10: 1377. https://doi.org/10.3390/jmse10101377